Cities with the Highest Percentage of Population Employed in Real Estate, Rental & Leasing in Pennsylvania
RELATED REPORTS & OPTIONS
Real Estate, Rental & Leasing
Pennsylvania
Compare Cities
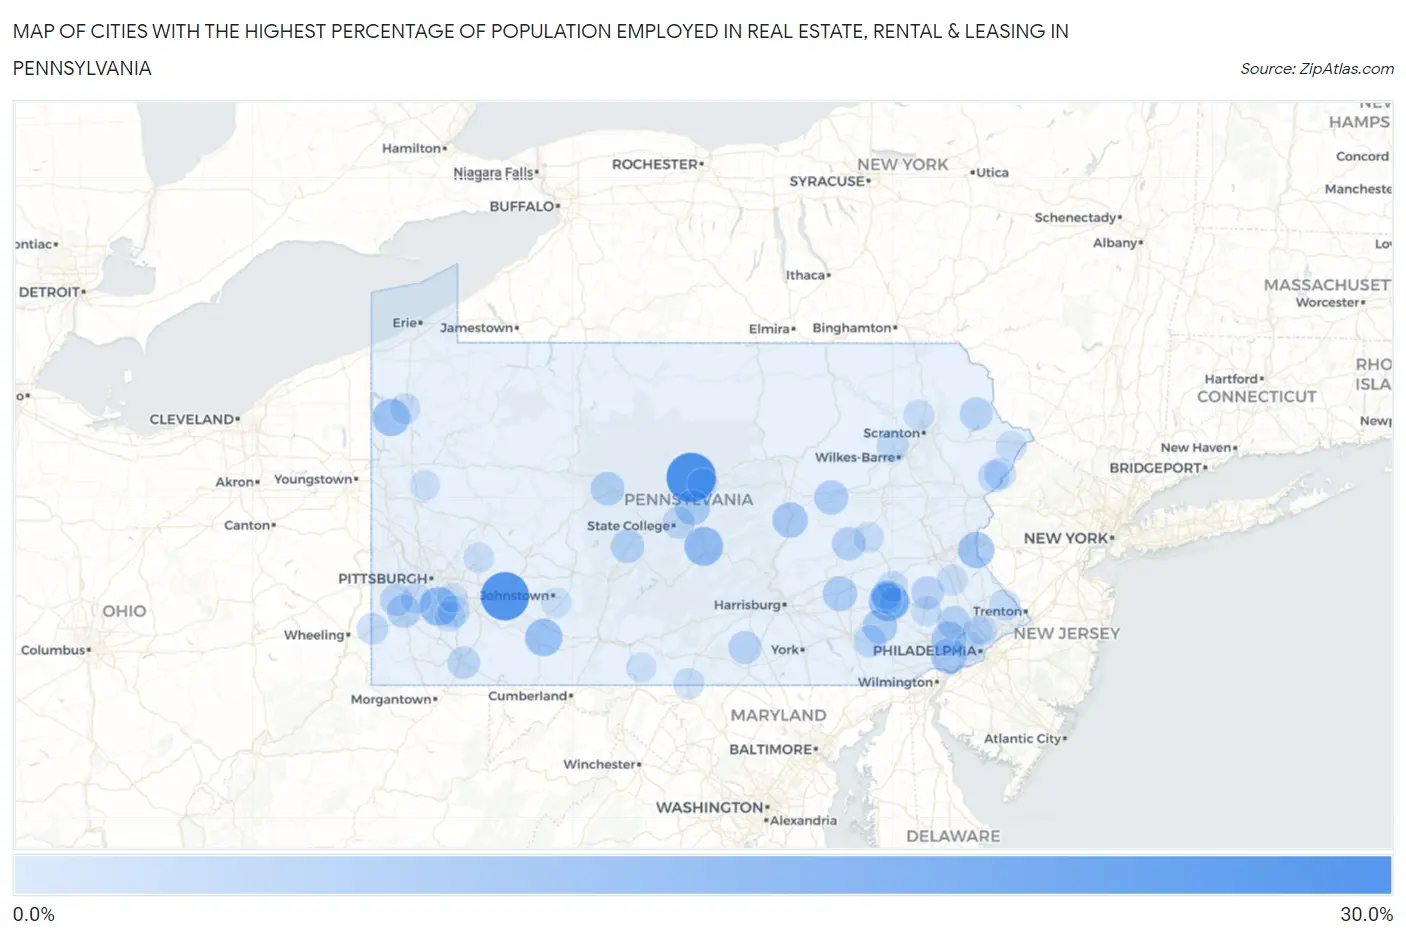
Map of Cities with the Highest Percentage of Population Employed in Real Estate, Rental & Leasing in Pennsylvania
0.0%
30.0%
Cities with the Highest Percentage of Population Employed in Real Estate, Rental & Leasing in Pennsylvania
| City | % Employed | vs State | vs National | |
| 1. | Monument | 27.3% | 1.5%(+25.8)#1 | 1.9%(+25.4)#85 |
| 2. | Bradenville | 25.8% | 1.5%(+24.3)#2 | 1.9%(+23.9)#101 |
| 3. | Pennwyn | 15.5% | 1.5%(+14.0)#3 | 1.9%(+13.6)#235 |
| 4. | Lumber City | 14.3% | 1.5%(+12.8)#4 | 1.9%(+12.4)#268 |
| 5. | Elrama | 14.3% | 1.5%(+12.8)#5 | 1.9%(+12.4)#269 |
| 6. | Yarnell | 13.4% | 1.5%(+11.9)#6 | 1.9%(+11.5)#297 |
| 7. | Henrietta | 12.6% | 1.5%(+11.1)#7 | 1.9%(+10.7)#340 |
| 8. | Friedens | 12.6% | 1.5%(+11.1)#8 | 1.9%(+10.7)#341 |
| 9. | Atlantic | 12.5% | 1.5%(+11.0)#9 | 1.9%(+10.6)#346 |
| 10. | Raubsville | 11.5% | 1.5%(+10.0)#10 | 1.9%(+9.61)#411 |
| 11. | Lima | 10.6% | 1.5%(+9.09)#11 | 1.9%(+8.69)#479 |
| 12. | Sylvan Hills | 10.4% | 1.5%(+8.87)#12 | 1.9%(+8.47)#495 |
| 13. | Hummels Wharf | 10.2% | 1.5%(+8.71)#13 | 1.9%(+8.31)#513 |
| 14. | Zion | 10.1% | 1.5%(+8.63)#14 | 1.9%(+8.23)#519 |
| 15. | Donegal Borough | 10.0% | 1.5%(+8.51)#15 | 1.9%(+8.11)#535 |
| 16. | Homewood Borough | 9.8% | 1.5%(+8.26)#16 | 1.9%(+7.86)#564 |
| 17. | Berwyn | 9.7% | 1.5%(+8.16)#17 | 1.9%(+7.76)#574 |
| 18. | Blue Ball | 9.4% | 1.5%(+7.95)#18 | 1.9%(+7.55)#595 |
| 19. | Hebron | 9.3% | 1.5%(+7.84)#19 | 1.9%(+7.44)#603 |
| 20. | New Morgan Borough | 9.1% | 1.5%(+7.60)#20 | 1.9%(+7.20)#642 |
| 21. | Rupert | 8.9% | 1.5%(+7.42)#21 | 1.9%(+7.02)#660 |
| 22. | Bradford Woods Borough | 8.7% | 1.5%(+7.20)#22 | 1.9%(+6.80)#691 |
| 23. | Plymptonville | 8.5% | 1.5%(+7.04)#23 | 1.9%(+6.64)#717 |
| 24. | Meadowlands | 8.2% | 1.5%(+6.69)#24 | 1.9%(+6.29)#787 |
| 25. | Grazierville | 8.2% | 1.5%(+6.66)#25 | 1.9%(+6.26)#792 |
| 26. | Branchdale | 8.1% | 1.5%(+6.59)#26 | 1.9%(+6.19)#810 |
| 27. | Trooper | 7.8% | 1.5%(+6.35)#27 | 1.9%(+5.96)#852 |
| 28. | Aspers | 7.8% | 1.5%(+6.31)#28 | 1.9%(+5.91)#859 |
| 29. | White Mills | 7.6% | 1.5%(+6.10)#29 | 1.9%(+5.70)#903 |
| 30. | Hickory | 7.3% | 1.5%(+5.79)#30 | 1.9%(+5.39)#972 |
| 31. | New Berlinville | 7.2% | 1.5%(+5.71)#31 | 1.9%(+5.31)#991 |
| 32. | Mount Gretna Borough | 7.0% | 1.5%(+5.55)#32 | 1.9%(+5.15)#1,032 |
| 33. | Hopwood | 7.0% | 1.5%(+5.50)#33 | 1.9%(+5.11)#1,049 |
| 34. | Gordonville | 7.0% | 1.5%(+5.50)#34 | 1.9%(+5.10)#1,050 |
| 35. | Oakland Cdp Cambria County | 6.8% | 1.5%(+5.35)#35 | 1.9%(+4.95)#1,088 |
| 36. | Lemont | 6.7% | 1.5%(+5.20)#36 | 1.9%(+4.80)#1,113 |
| 37. | Collinsburg | 6.6% | 1.5%(+5.14)#37 | 1.9%(+4.74)#1,139 |
| 38. | Ben Avon Heights Borough | 6.4% | 1.5%(+4.90)#38 | 1.9%(+4.50)#1,217 |
| 39. | Shavertown | 6.2% | 1.5%(+4.76)#39 | 1.9%(+4.36)#1,263 |
| 40. | Wellsboro Borough | 6.2% | 1.5%(+4.73)#40 | 1.9%(+4.33)#1,284 |
| 41. | Saw Creek | 6.2% | 1.5%(+4.71)#41 | 1.9%(+4.31)#1,296 |
| 42. | West Reading Borough | 6.2% | 1.5%(+4.69)#42 | 1.9%(+4.29)#1,306 |
| 43. | Pine Ridge | 6.2% | 1.5%(+4.69)#43 | 1.9%(+4.29)#1,307 |
| 44. | Green Tree Borough | 6.1% | 1.5%(+4.65)#44 | 1.9%(+4.25)#1,320 |
| 45. | Delmont Borough | 6.0% | 1.5%(+4.55)#45 | 1.9%(+4.15)#1,355 |
| 46. | West Alexander | 6.0% | 1.5%(+4.51)#46 | 1.9%(+4.11)#1,374 |
| 47. | Middletown Borough | 6.0% | 1.5%(+4.47)#47 | 1.9%(+4.07)#1,395 |
| 48. | Palo Alto Borough | 6.0% | 1.5%(+4.46)#48 | 1.9%(+4.07)#1,396 |
| 49. | New Buffalo Borough | 5.8% | 1.5%(+4.28)#49 | 1.9%(+3.88)#1,472 |
| 50. | Newell Borough | 5.8% | 1.5%(+4.27)#50 | 1.9%(+3.87)#1,474 |
| 51. | Elco Borough | 5.7% | 1.5%(+4.22)#51 | 1.9%(+3.82)#1,494 |
| 52. | Midland Borough | 5.7% | 1.5%(+4.20)#52 | 1.9%(+3.80)#1,500 |
| 53. | Lincoln Borough | 5.7% | 1.5%(+4.18)#53 | 1.9%(+3.78)#1,511 |
| 54. | Lincoln Park | 5.6% | 1.5%(+4.10)#54 | 1.9%(+3.70)#1,548 |
| 55. | State Line | 5.5% | 1.5%(+4.02)#55 | 1.9%(+3.62)#1,582 |
| 56. | Bala Cynwyd | 5.5% | 1.5%(+3.99)#56 | 1.9%(+3.59)#1,603 |
| 57. | Muhlenberg Park | 5.3% | 1.5%(+3.84)#57 | 1.9%(+3.44)#1,676 |
| 58. | Flying Hills | 5.3% | 1.5%(+3.79)#58 | 1.9%(+3.39)#1,702 |
| 59. | Verona Borough | 5.3% | 1.5%(+3.79)#59 | 1.9%(+3.39)#1,703 |
| 60. | Newtown Grant | 5.3% | 1.5%(+3.77)#60 | 1.9%(+3.37)#1,705 |
| 61. | Lawrence | 5.2% | 1.5%(+3.75)#61 | 1.9%(+3.35)#1,719 |
| 62. | Waverly | 5.2% | 1.5%(+3.70)#62 | 1.9%(+3.30)#1,753 |
| 63. | Montrose Manor | 5.2% | 1.5%(+3.69)#63 | 1.9%(+3.29)#1,760 |
| 64. | Geneva | 5.2% | 1.5%(+3.68)#64 | 1.9%(+3.28)#1,767 |
| 65. | Pocono Woodland Lakes | 5.1% | 1.5%(+3.63)#65 | 1.9%(+3.23)#1,793 |
| 66. | Mill Hall Borough | 5.1% | 1.5%(+3.59)#66 | 1.9%(+3.20)#1,808 |
| 67. | Dublin Borough | 5.0% | 1.5%(+3.53)#67 | 1.9%(+3.13)#1,844 |
| 68. | Blanchard | 5.0% | 1.5%(+3.53)#68 | 1.9%(+3.13)#1,847 |
| 69. | Kenilworth | 5.0% | 1.5%(+3.52)#69 | 1.9%(+3.12)#1,853 |
| 70. | Cumbola | 5.0% | 1.5%(+3.51)#70 | 1.9%(+3.11)#1,860 |
| 71. | Malvern Borough | 5.0% | 1.5%(+3.49)#71 | 1.9%(+3.09)#1,869 |
| 72. | Fellsburg | 5.0% | 1.5%(+3.48)#72 | 1.9%(+3.08)#1,876 |
| 73. | Milford Square | 4.9% | 1.5%(+3.45)#73 | 1.9%(+3.05)#1,899 |
| 74. | Lenhartsville Borough | 4.9% | 1.5%(+3.39)#74 | 1.9%(+2.99)#1,939 |
| 75. | Oklahoma | 4.8% | 1.5%(+3.30)#75 | 1.9%(+2.90)#1,997 |
| 76. | Yoe Borough | 4.8% | 1.5%(+3.27)#76 | 1.9%(+2.87)#2,008 |
| 77. | Dilworthtown | 4.7% | 1.5%(+3.24)#77 | 1.9%(+2.84)#2,040 |
| 78. | Port Clinton Borough | 4.7% | 1.5%(+3.24)#78 | 1.9%(+2.84)#2,042 |
| 79. | Pennsbury Village Borough | 4.7% | 1.5%(+3.22)#79 | 1.9%(+2.82)#2,052 |
| 80. | White Haven Borough | 4.6% | 1.5%(+3.14)#80 | 1.9%(+2.74)#2,112 |
| 81. | Wyndmoor | 4.6% | 1.5%(+3.09)#81 | 1.9%(+2.69)#2,151 |
| 82. | Blawnox Borough | 4.6% | 1.5%(+3.08)#82 | 1.9%(+2.68)#2,157 |
| 83. | Penn Wynne | 4.5% | 1.5%(+3.05)#83 | 1.9%(+2.65)#2,171 |
| 84. | Sayre Borough | 4.5% | 1.5%(+3.03)#84 | 1.9%(+2.63)#2,188 |
| 85. | Belmont | 4.5% | 1.5%(+2.98)#85 | 1.9%(+2.59)#2,225 |
| 86. | Bell Acres Borough | 4.4% | 1.5%(+2.94)#86 | 1.9%(+2.54)#2,262 |
| 87. | Sewickley Hills Borough | 4.4% | 1.5%(+2.94)#87 | 1.9%(+2.54)#2,267 |
| 88. | Needmore | 4.4% | 1.5%(+2.92)#88 | 1.9%(+2.52)#2,278 |
| 89. | Patterson Heights Borough | 4.4% | 1.5%(+2.90)#89 | 1.9%(+2.50)#2,294 |
| 90. | Enon Valley Borough | 4.4% | 1.5%(+2.89)#90 | 1.9%(+2.49)#2,304 |
| 91. | Greenock | 4.4% | 1.5%(+2.87)#91 | 1.9%(+2.47)#2,315 |
| 92. | Braddock Hills Borough | 4.3% | 1.5%(+2.86)#92 | 1.9%(+2.46)#2,327 |
| 93. | Pleasantville Borough Bedford County | 4.3% | 1.5%(+2.86)#93 | 1.9%(+2.46)#2,336 |
| 94. | Slippery Rock University | 4.3% | 1.5%(+2.84)#94 | 1.9%(+2.44)#2,345 |
| 95. | Myerstown Borough | 4.3% | 1.5%(+2.80)#95 | 1.9%(+2.41)#2,365 |
| 96. | St. Davids | 4.3% | 1.5%(+2.80)#96 | 1.9%(+2.40)#2,366 |
| 97. | Coudersport Borough | 4.3% | 1.5%(+2.76)#97 | 1.9%(+2.36)#2,393 |
| 98. | West Lawn | 4.3% | 1.5%(+2.76)#98 | 1.9%(+2.36)#2,394 |
| 99. | Oreminea | 4.3% | 1.5%(+2.76)#99 | 1.9%(+2.36)#2,399 |
| 100. | Wyncote | 4.2% | 1.5%(+2.76)#100 | 1.9%(+2.36)#2,403 |
Common Questions
What are the Top 10 Cities with the Highest Percentage of Population Employed in Real Estate, Rental & Leasing in Pennsylvania?
Top 10 Cities with the Highest Percentage of Population Employed in Real Estate, Rental & Leasing in Pennsylvania are:
#1
27.3%
#2
25.8%
#3
15.5%
#4
14.3%
#5
14.3%
#6
12.6%
#7
12.5%
#8
11.5%
#9
10.6%
#10
10.2%
What city has the Highest Percentage of Population Employed in Real Estate, Rental & Leasing in Pennsylvania?
Monument has the Highest Percentage of Population Employed in Real Estate, Rental & Leasing in Pennsylvania with 27.3%.
What is the Percentage of Population Employed in Real Estate, Rental & Leasing in the State of Pennsylvania?
Percentage of Population Employed in Real Estate, Rental & Leasing in Pennsylvania is 1.5%.
What is the Percentage of Population Employed in Real Estate, Rental & Leasing in the United States?
Percentage of Population Employed in Real Estate, Rental & Leasing in the United States is 1.9%.