Woodland, AL Map & Demographics
Woodland Map
Woodland Overview
$33,216
PER CAPITA INCOME
$158,283
AVG FAMILY INCOME
$157,907
AVG HOUSEHOLD INCOME
81.6%
WAGE / INCOME GAP [ % ]
18.4¢/ $1
WAGE / INCOME GAP [ $ ]
0.27
INEQUALITY / GINI INDEX
568
TOTAL POPULATION
254
MALE POPULATION
314
FEMALE POPULATION
80.89
MALES / 100 FEMALES
123.62
FEMALES / 100 MALES
35.0
MEDIAN AGE
4.2
AVG FAMILY SIZE
3.7
AVG HOUSEHOLD SIZE
247
LABOR FORCE [ PEOPLE ]
52.8%
PERCENT IN LABOR FORCE
2.8%
UNEMPLOYMENT RATE
Woodland Zip Codes
Woodland Area Codes
Income in Woodland
Income Overview in Woodland
Per Capita Income in Woodland is $33,216, while median incomes of families and households are $158,283 and $157,907 respectively.
| Characteristic | Number | Measure |
| Per Capita Income | 568 | $33,216 |
| Median Family Income | 128 | $158,283 |
| Mean Family Income | 128 | $136,041 |
| Median Household Income | 153 | $157,907 |
| Mean Household Income | 153 | $119,290 |
| Income Deficit | 128 | $0 |
| Wage / Income Gap (%) | 568 | 81.63% |
| Wage / Income Gap ($) | 568 | 18.37¢ per $1 |
| Gini / Inequality Index | 568 | 0.27 |
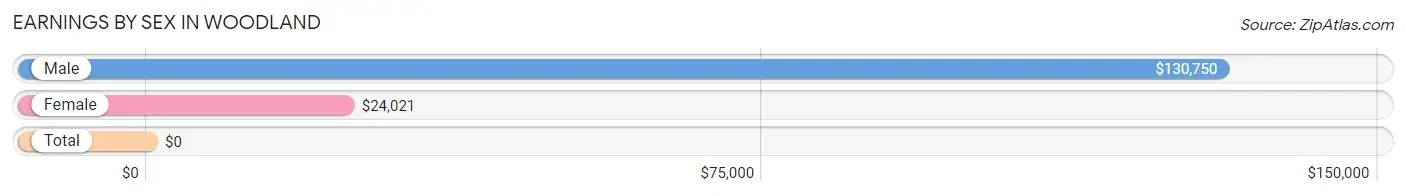
Earnings by Sex in Woodland
| Sex | Number | Average Earnings |
| Male | 119 (48.8%) | $130,750 |
| Female | 125 (51.2%) | $24,021 |
| Total | 244 (100.0%) | $0 |
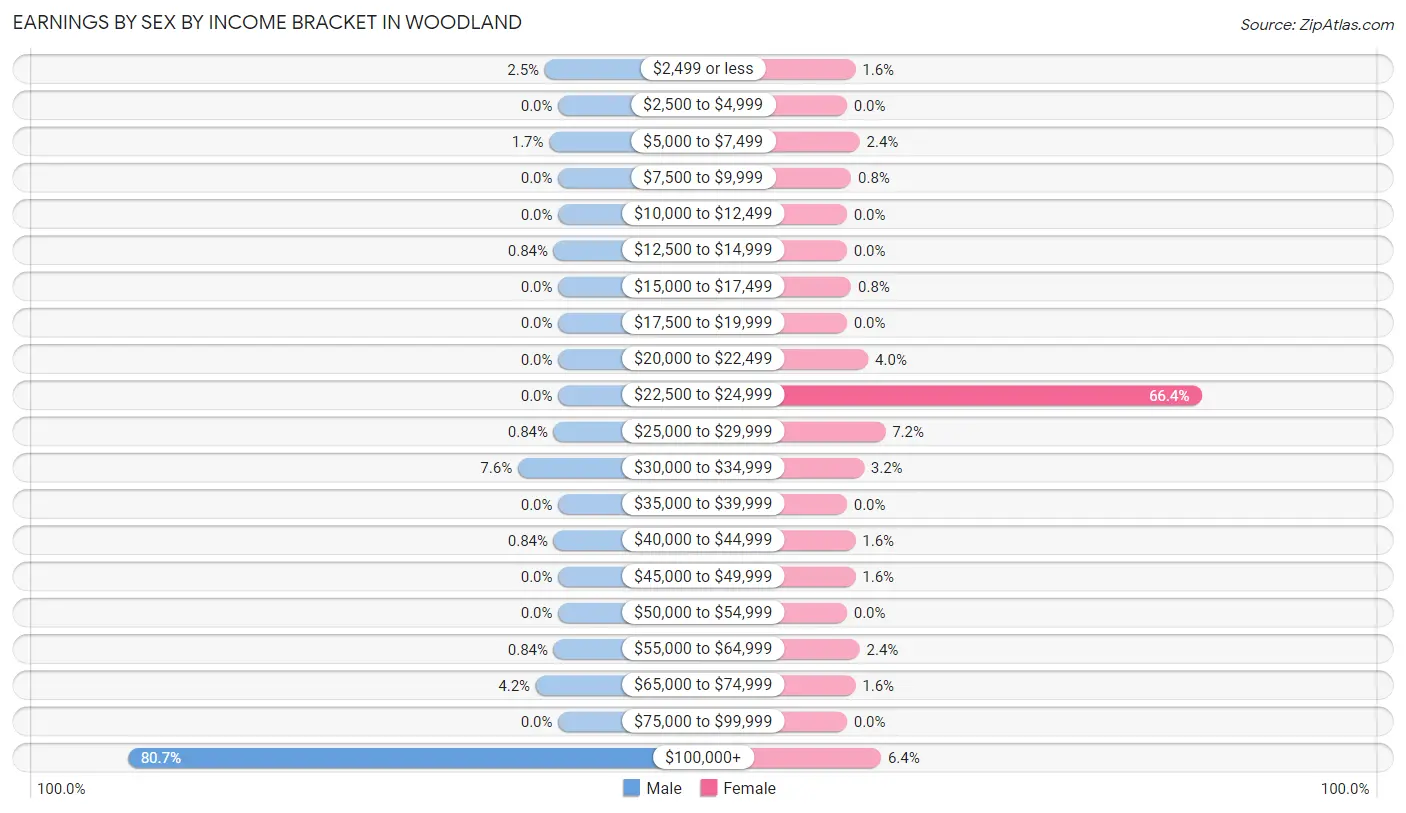
Earnings by Sex by Income Bracket in Woodland
The most common earnings brackets in Woodland are $100,000+ for men (96 | 80.7%) and $22,500 to $24,999 for women (83 | 66.4%).
| Income | Male | Female |
| $2,499 or less | 3 (2.5%) | 2 (1.6%) |
| $2,500 to $4,999 | 0 (0.0%) | 0 (0.0%) |
| $5,000 to $7,499 | 2 (1.7%) | 3 (2.4%) |
| $7,500 to $9,999 | 0 (0.0%) | 1 (0.8%) |
| $10,000 to $12,499 | 0 (0.0%) | 0 (0.0%) |
| $12,500 to $14,999 | 1 (0.8%) | 0 (0.0%) |
| $15,000 to $17,499 | 0 (0.0%) | 1 (0.8%) |
| $17,500 to $19,999 | 0 (0.0%) | 0 (0.0%) |
| $20,000 to $22,499 | 0 (0.0%) | 5 (4.0%) |
| $22,500 to $24,999 | 0 (0.0%) | 83 (66.4%) |
| $25,000 to $29,999 | 1 (0.8%) | 9 (7.2%) |
| $30,000 to $34,999 | 9 (7.6%) | 4 (3.2%) |
| $35,000 to $39,999 | 0 (0.0%) | 0 (0.0%) |
| $40,000 to $44,999 | 1 (0.8%) | 2 (1.6%) |
| $45,000 to $49,999 | 0 (0.0%) | 2 (1.6%) |
| $50,000 to $54,999 | 0 (0.0%) | 0 (0.0%) |
| $55,000 to $64,999 | 1 (0.8%) | 3 (2.4%) |
| $65,000 to $74,999 | 5 (4.2%) | 2 (1.6%) |
| $75,000 to $99,999 | 0 (0.0%) | 0 (0.0%) |
| $100,000+ | 96 (80.7%) | 8 (6.4%) |
| Total | 119 (100.0%) | 125 (100.0%) |
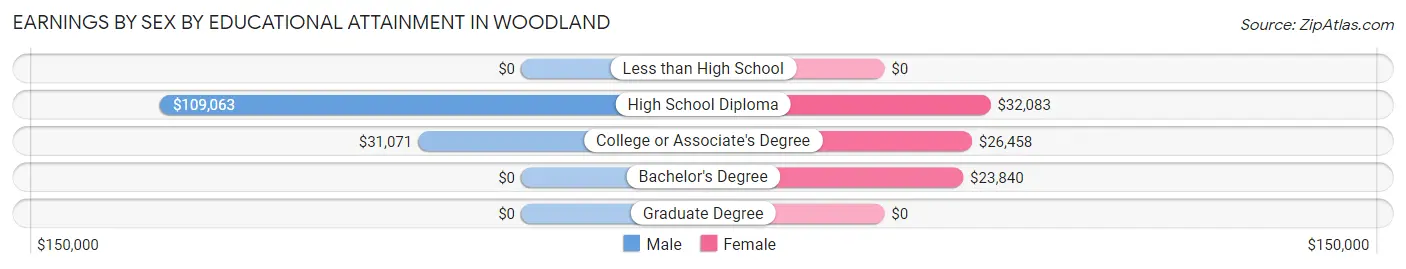
Earnings by Sex by Educational Attainment in Woodland
Average earnings in Woodland are $130,750 for men and $24,021 for women, a difference of 81.6%. Men with an educational attainment of high school diploma enjoy the highest average annual earnings of $109,063, while those with college or associate's degree education earn the least with $31,071. Women with an educational attainment of high school diploma earn the most with the average annual earnings of $32,083, while those with bachelor's degree education have the smallest earnings of $23,840.
| Educational Attainment | Male Income | Female Income |
| Less than High School | - | - |
| High School Diploma | $109,063 | $32,083 |
| College or Associate's Degree | $31,071 | $26,458 |
| Bachelor's Degree | - | - |
| Graduate Degree | - | - |
| Total | $130,750 | $24,021 |
Family Income in Woodland
Family Income Brackets in Woodland
According to the Woodland family income data, there are 84 families falling into the $150,000 to $199,999 income range, which is the most common income bracket and makes up 65.6% of all families.
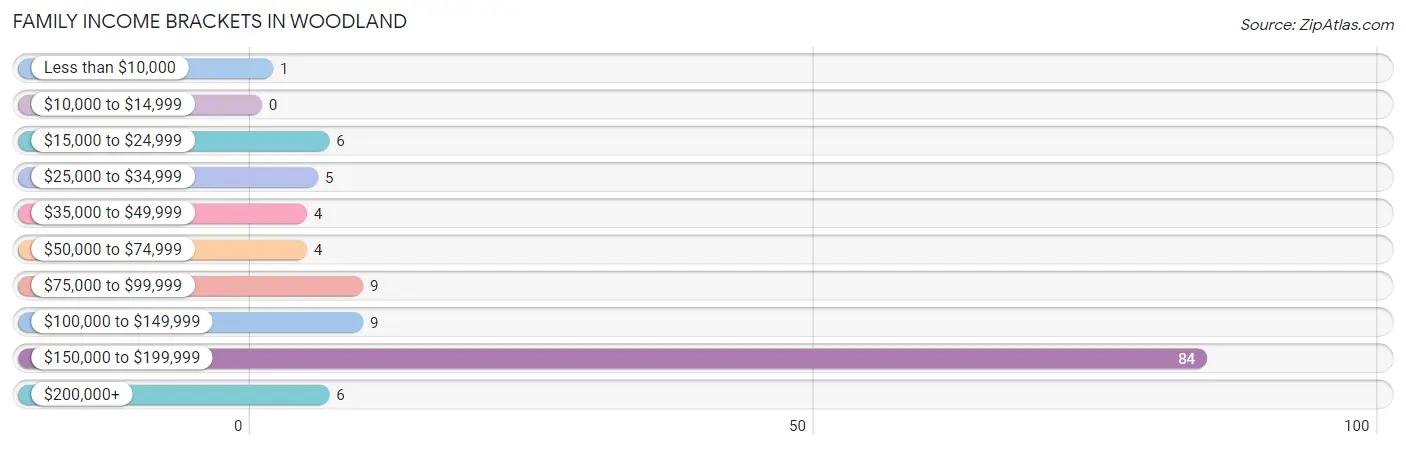
| Income Bracket | # Families | % Families |
| Less than $10,000 | 1 | 0.8% |
| $10,000 to $14,999 | 0 | 0.0% |
| $15,000 to $24,999 | 6 | 4.7% |
| $25,000 to $34,999 | 5 | 3.9% |
| $35,000 to $49,999 | 4 | 3.1% |
| $50,000 to $74,999 | 4 | 3.1% |
| $75,000 to $99,999 | 9 | 7.0% |
| $100,000 to $149,999 | 9 | 7.0% |
| $150,000 to $199,999 | 84 | 65.6% |
| $200,000+ | 6 | 4.7% |
Family Income by Famaliy Size in Woodland
4-person families (92 | 71.9%) account for the highest median family income in Woodland with $158,614 per family, while 3-person families (3 | 2.3%) have the highest median income of $49,583 per family member.
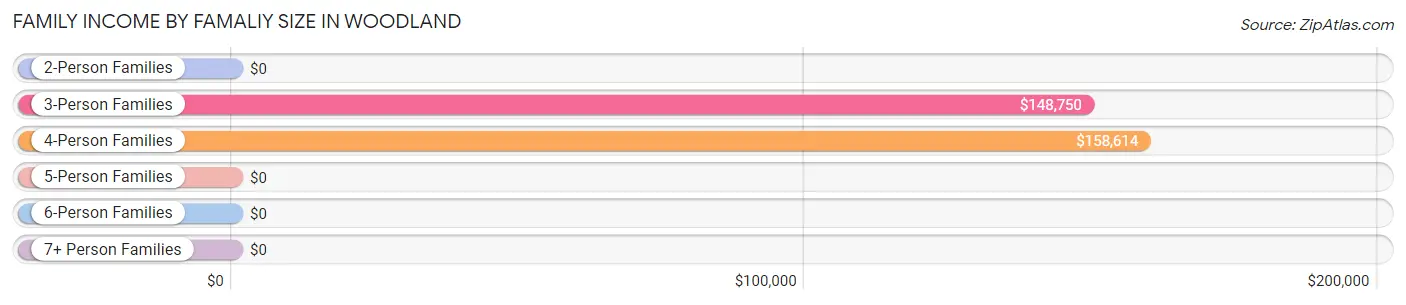
| Income Bracket | # Families | Median Income |
| 2-Person Families | 33 (25.8%) | $0 |
| 3-Person Families | 3 (2.3%) | $148,750 |
| 4-Person Families | 92 (71.9%) | $158,614 |
| 5-Person Families | 0 (0.0%) | $0 |
| 6-Person Families | 0 (0.0%) | $0 |
| 7+ Person Families | 0 (0.0%) | $0 |
| Total | 128 (100.0%) | $158,283 |
Family Income by Number of Earners in Woodland
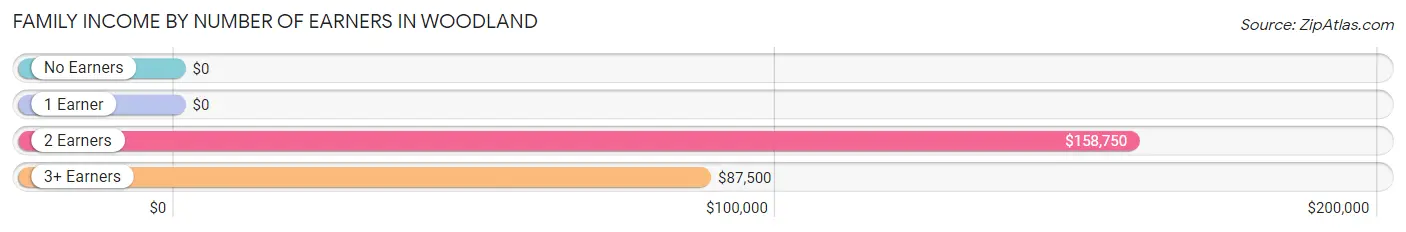
| Number of Earners | # Families | Median Income |
| No Earners | 14 (10.9%) | $0 |
| 1 Earner | 13 (10.2%) | $0 |
| 2 Earners | 95 (74.2%) | $158,750 |
| 3+ Earners | 6 (4.7%) | $87,500 |
| Total | 128 (100.0%) | $158,283 |
Household Income in Woodland
Household Income Brackets in Woodland
With 84 households falling in the category, the $150,000 to $199,999 income range is the most frequent in Woodland, accounting for 54.9% of all households.
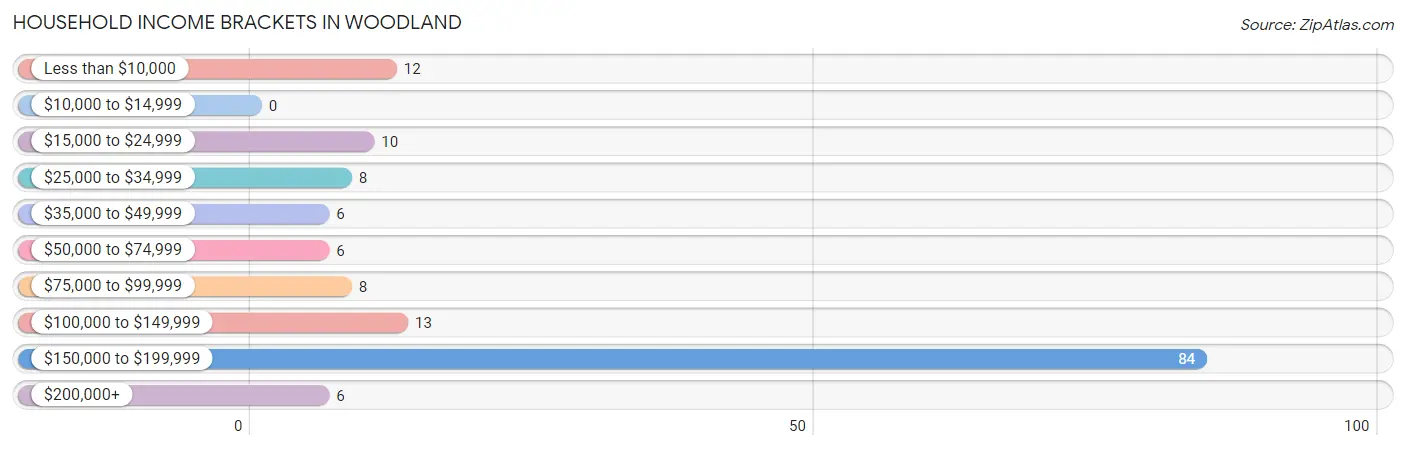
| Income Bracket | # Households | % Households |
| Less than $10,000 | 12 | 7.8% |
| $10,000 to $14,999 | 0 | 0.0% |
| $15,000 to $24,999 | 10 | 6.5% |
| $25,000 to $34,999 | 8 | 5.2% |
| $35,000 to $49,999 | 6 | 3.9% |
| $50,000 to $74,999 | 6 | 3.9% |
| $75,000 to $99,999 | 8 | 5.2% |
| $100,000 to $149,999 | 13 | 8.5% |
| $150,000 to $199,999 | 84 | 54.9% |
| $200,000+ | 6 | 3.9% |
Household Income by Householder Age in Woodland
The median household income in Woodland is $157,907, with the highest median household income of $158,554 found in the 45 to 64 years age bracket for the primary householder. A total of 110 households (71.9%) fall into this category. Meanwhile, the 15 to 24 years age bracket for the primary householder has the lowest median household income of $0, with 3 households (2.0%) in this group.
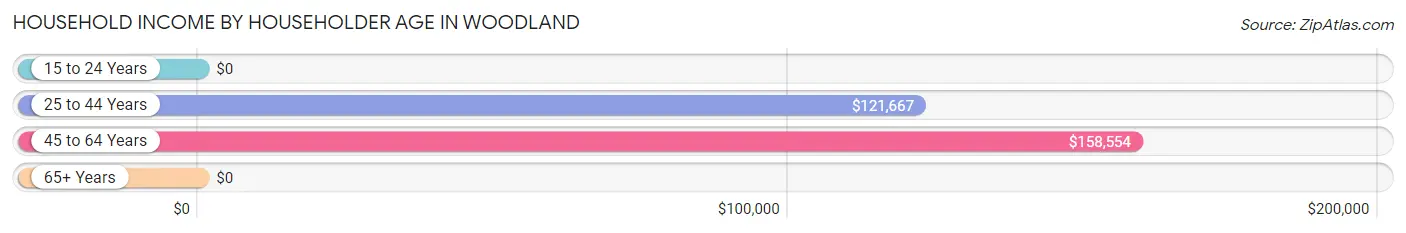
| Income Bracket | # Households | Median Income |
| 15 to 24 Years | 3 (2.0%) | $0 |
| 25 to 44 Years | 10 (6.5%) | $121,667 |
| 45 to 64 Years | 110 (71.9%) | $158,554 |
| 65+ Years | 30 (19.6%) | $0 |
| Total | 153 (100.0%) | $157,907 |
Poverty in Woodland
Income Below Poverty by Sex and Age in Woodland
With 7.5% poverty level for males and 6.4% for females among the residents of Woodland, 55 to 64 year old males and 6 to 11 year old females are the most vulnerable to poverty, with 8 males (57.1%) and 1 females (100.0%) in their respective age groups living below the poverty level.
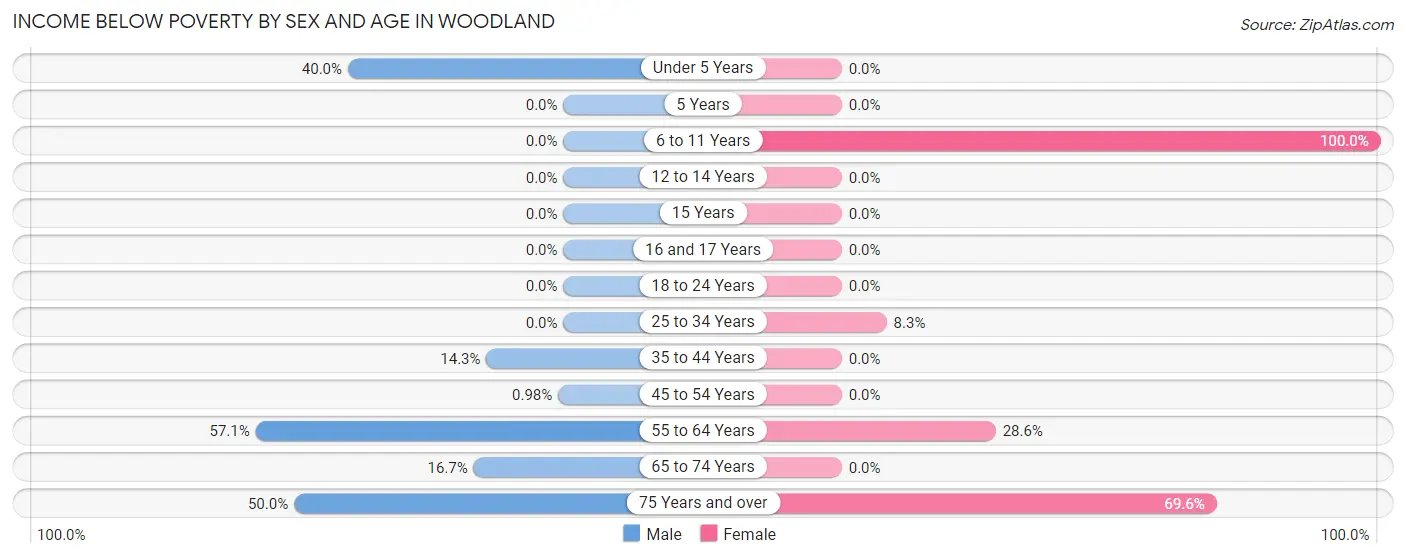
| Age Bracket | Male | Female |
| Under 5 Years | 2 (40.0%) | 0 (0.0%) |
| 5 Years | 0 (0.0%) | 0 (0.0%) |
| 6 to 11 Years | 0 (0.0%) | 1 (100.0%) |
| 12 to 14 Years | 0 (0.0%) | 0 (0.0%) |
| 15 Years | 0 (0.0%) | 0 (0.0%) |
| 16 and 17 Years | 0 (0.0%) | 0 (0.0%) |
| 18 to 24 Years | 0 (0.0%) | 0 (0.0%) |
| 25 to 34 Years | 0 (0.0%) | 1 (8.3%) |
| 35 to 44 Years | 1 (14.3%) | 0 (0.0%) |
| 45 to 54 Years | 1 (1.0%) | 0 (0.0%) |
| 55 to 64 Years | 8 (57.1%) | 2 (28.6%) |
| 65 to 74 Years | 1 (16.7%) | 0 (0.0%) |
| 75 Years and over | 6 (50.0%) | 16 (69.6%) |
| Total | 19 (7.5%) | 20 (6.4%) |
Income Above Poverty by Sex and Age in Woodland
According to the poverty statistics in Woodland, males aged 6 to 11 years and females aged 5 years are the age groups that are most secure financially, with 100.0% of males and 100.0% of females in these age groups living above the poverty line.
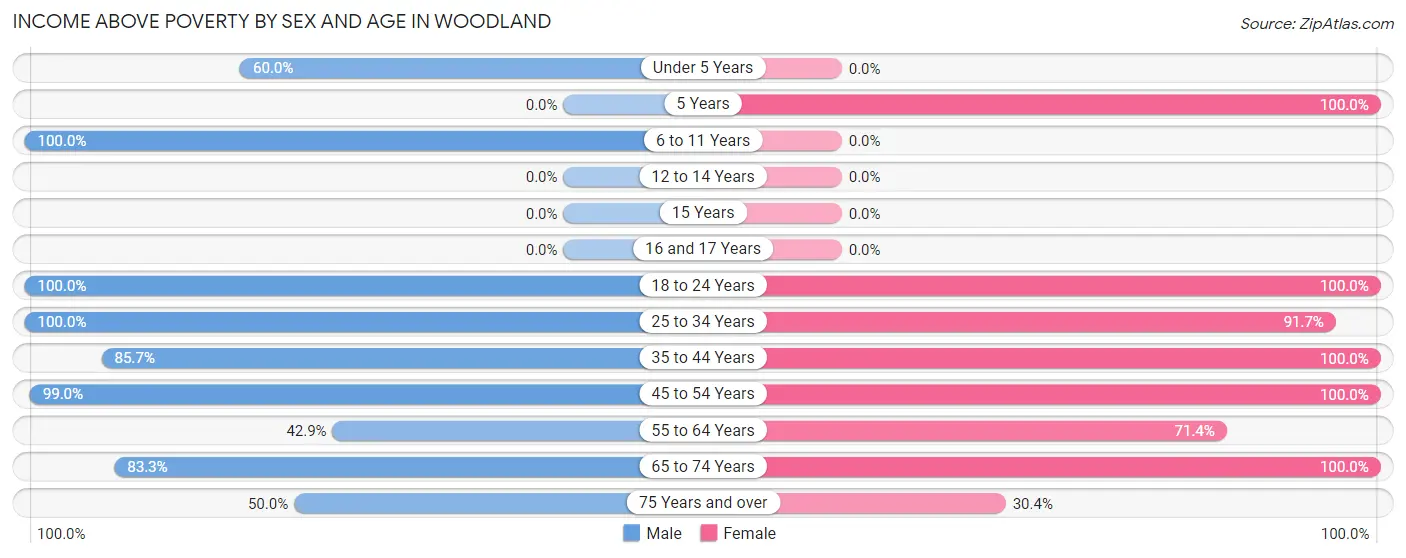
| Age Bracket | Male | Female |
| Under 5 Years | 3 (60.0%) | 0 (0.0%) |
| 5 Years | 0 (0.0%) | 4 (100.0%) |
| 6 to 11 Years | 90 (100.0%) | 0 (0.0%) |
| 12 to 14 Years | 0 (0.0%) | 0 (0.0%) |
| 15 Years | 0 (0.0%) | 0 (0.0%) |
| 16 and 17 Years | 0 (0.0%) | 0 (0.0%) |
| 18 to 24 Years | 10 (100.0%) | 154 (100.0%) |
| 25 to 34 Years | 8 (100.0%) | 11 (91.7%) |
| 35 to 44 Years | 6 (85.7%) | 4 (100.0%) |
| 45 to 54 Years | 101 (99.0%) | 104 (100.0%) |
| 55 to 64 Years | 6 (42.9%) | 5 (71.4%) |
| 65 to 74 Years | 5 (83.3%) | 5 (100.0%) |
| 75 Years and over | 6 (50.0%) | 7 (30.4%) |
| Total | 235 (92.5%) | 294 (93.6%) |
Income Below Poverty Among Married-Couple Families in Woodland
The poverty statistics for married-couple families in Woodland show that 6.0% or 7 of the total 117 families live below the poverty line. Families with no children have the highest poverty rate of 20.7%, comprising of 6 families. On the other hand, families with 1 or 2 children have the lowest poverty rate of 1.1%, which includes 1 families.
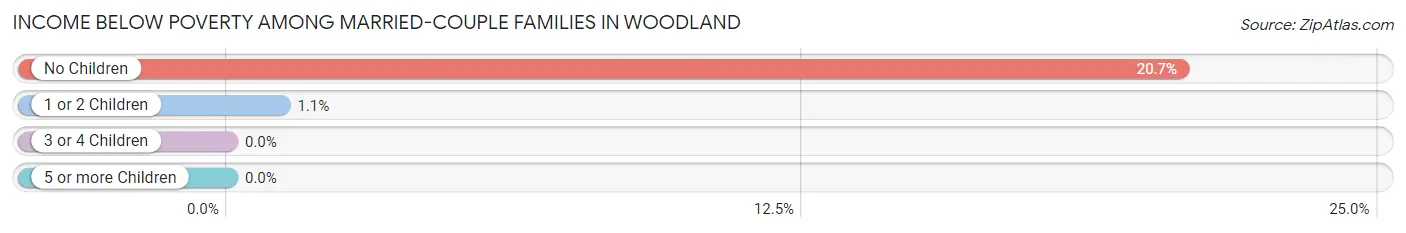
| Children | Above Poverty | Below Poverty |
| No Children | 23 (79.3%) | 6 (20.7%) |
| 1 or 2 Children | 87 (98.9%) | 1 (1.1%) |
| 3 or 4 Children | 0 (0.0%) | 0 (0.0%) |
| 5 or more Children | 0 (0.0%) | 0 (0.0%) |
| Total | 110 (94.0%) | 7 (6.0%) |
Income Below Poverty Among Single-Parent Households in Woodland
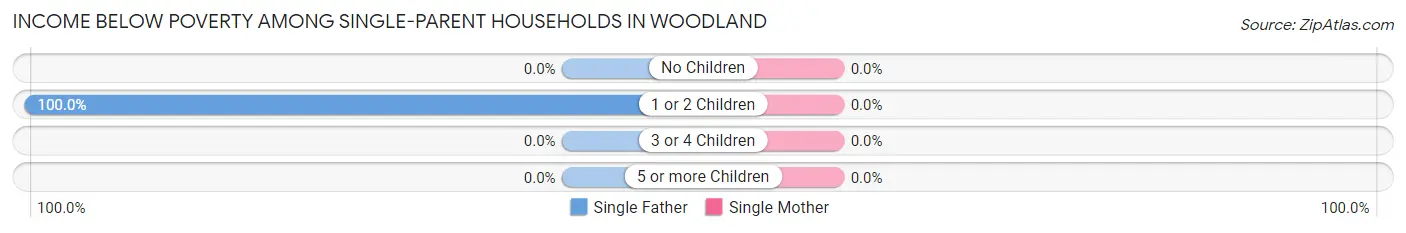
| Children | Single Father | Single Mother |
| No Children | 0 (0.0%) | 0 (0.0%) |
| 1 or 2 Children | 1 (100.0%) | 0 (0.0%) |
| 3 or 4 Children | 0 (0.0%) | 0 (0.0%) |
| 5 or more Children | 0 (0.0%) | 0 (0.0%) |
| Total | 1 (25.0%) | 0 (0.0%) |
Income Below Poverty Among Married-Couple vs Single-Parent Households in Woodland
The poverty data for Woodland shows that 7 of the married-couple family households (6.0%) and 1 of the single-parent households (9.1%) are living below the poverty level. Within the married-couple family households, those with no children have the highest poverty rate, with 6 households (20.7%) falling below the poverty line. Among the single-parent households, those with 1 or 2 children have the highest poverty rate, with 1 household (33.3%) living below poverty.
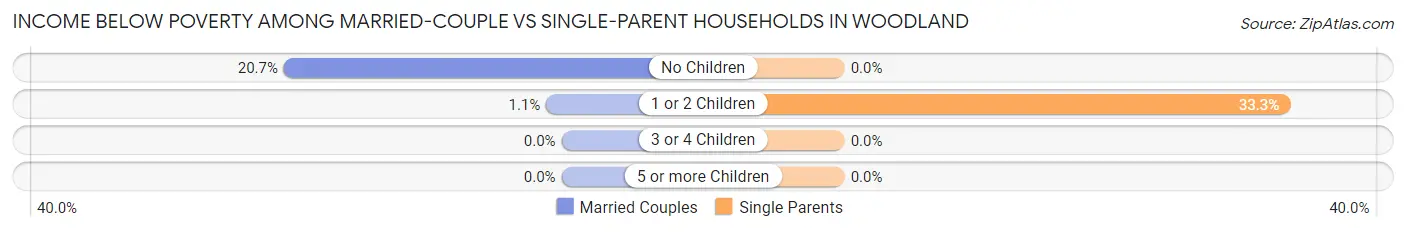
| Children | Married-Couple Families | Single-Parent Households |
| No Children | 6 (20.7%) | 0 (0.0%) |
| 1 or 2 Children | 1 (1.1%) | 1 (33.3%) |
| 3 or 4 Children | 0 (0.0%) | 0 (0.0%) |
| 5 or more Children | 0 (0.0%) | 0 (0.0%) |
| Total | 7 (6.0%) | 1 (9.1%) |
Race in Woodland
The most populous races in Woodland are White / Caucasian (544 | 95.8%), Black / African American (23 | 4.1%), and Two or more Races (1 | 0.2%).
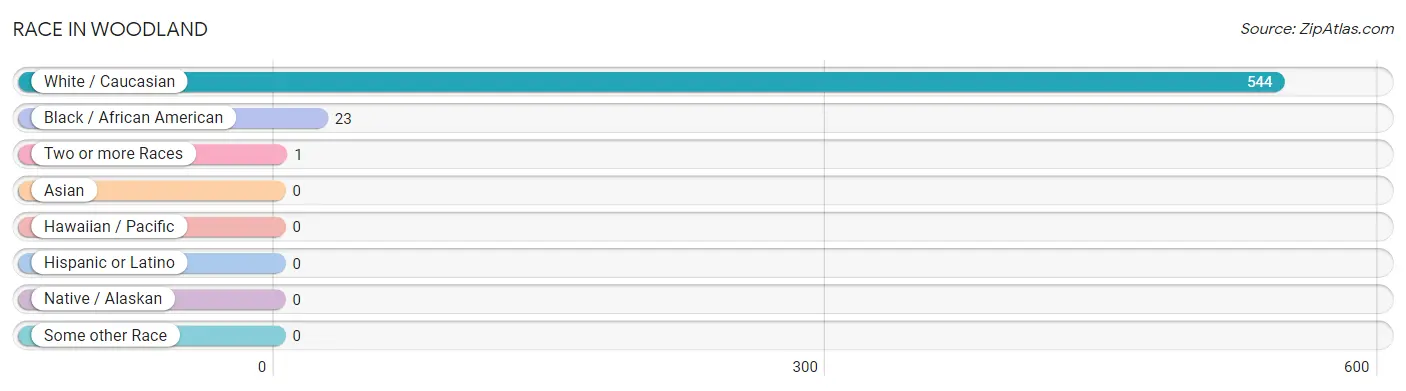
| Race | # Population | % Population |
| Asian | 0 | 0.0% |
| Black / African American | 23 | 4.1% |
| Hawaiian / Pacific | 0 | 0.0% |
| Hispanic or Latino | 0 | 0.0% |
| Native / Alaskan | 0 | 0.0% |
| White / Caucasian | 544 | 95.8% |
| Two or more Races | 1 | 0.2% |
| Some other Race | 0 | 0.0% |
| Total | 568 | 100.0% |
Ancestry in Woodland
The most populous ancestries reported in Woodland are American (420 | 73.9%), European (17 | 3.0%), English (16 | 2.8%), German (2 | 0.4%), and Irish (2 | 0.4%), together accounting for 80.4% of all Woodland residents.
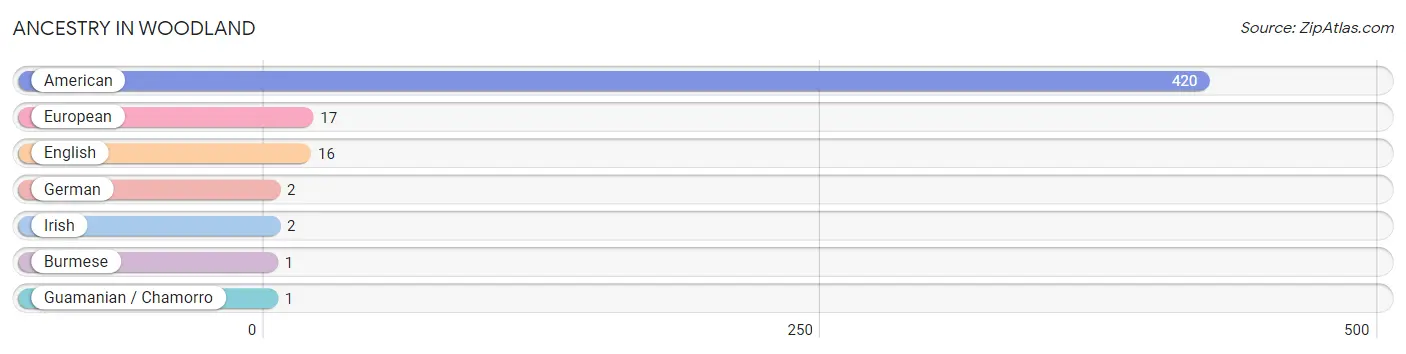
| Ancestry | # Population | % Population |
| American | 420 | 73.9% |
| Burmese | 1 | 0.2% |
| English | 16 | 2.8% |
| European | 17 | 3.0% |
| German | 2 | 0.4% |
| Guamanian / Chamorro | 1 | 0.2% |
| Irish | 2 | 0.4% | View All 7 Rows |
Immigrants in Woodland

| Immigration Origin | # Population | % Population | View All 0 Rows |
Sex and Age in Woodland
Sex and Age in Woodland
The most populous age groups in Woodland are 45 to 49 Years (94 | 37.0%) for men and 20 to 24 Years (153 | 48.7%) for women.
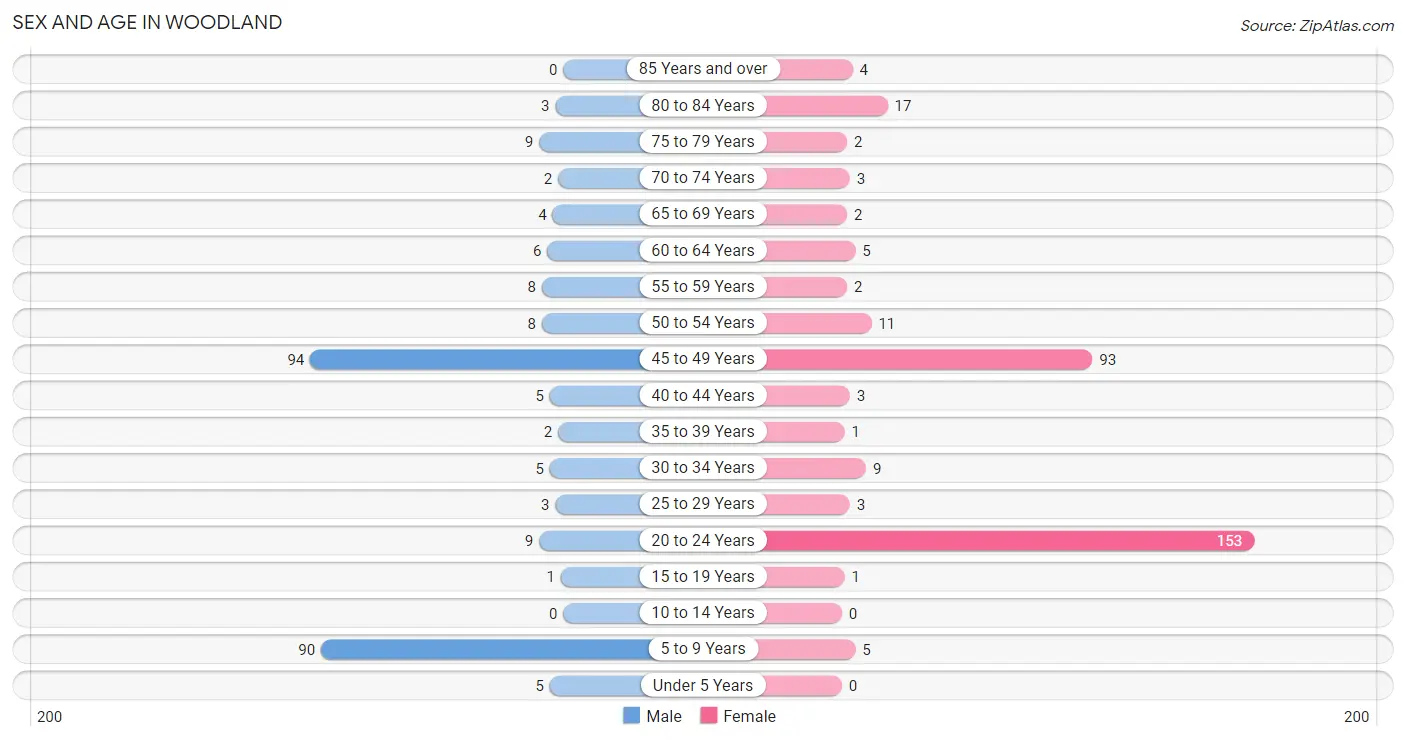
| Age Bracket | Male | Female |
| Under 5 Years | 5 (2.0%) | 0 (0.0%) |
| 5 to 9 Years | 90 (35.4%) | 5 (1.6%) |
| 10 to 14 Years | 0 (0.0%) | 0 (0.0%) |
| 15 to 19 Years | 1 (0.4%) | 1 (0.3%) |
| 20 to 24 Years | 9 (3.5%) | 153 (48.7%) |
| 25 to 29 Years | 3 (1.2%) | 3 (1.0%) |
| 30 to 34 Years | 5 (2.0%) | 9 (2.9%) |
| 35 to 39 Years | 2 (0.8%) | 1 (0.3%) |
| 40 to 44 Years | 5 (2.0%) | 3 (1.0%) |
| 45 to 49 Years | 94 (37.0%) | 93 (29.6%) |
| 50 to 54 Years | 8 (3.2%) | 11 (3.5%) |
| 55 to 59 Years | 8 (3.2%) | 2 (0.6%) |
| 60 to 64 Years | 6 (2.4%) | 5 (1.6%) |
| 65 to 69 Years | 4 (1.6%) | 2 (0.6%) |
| 70 to 74 Years | 2 (0.8%) | 3 (1.0%) |
| 75 to 79 Years | 9 (3.5%) | 2 (0.6%) |
| 80 to 84 Years | 3 (1.2%) | 17 (5.4%) |
| 85 Years and over | 0 (0.0%) | 4 (1.3%) |
| Total | 254 (100.0%) | 314 (100.0%) |
Families and Households in Woodland
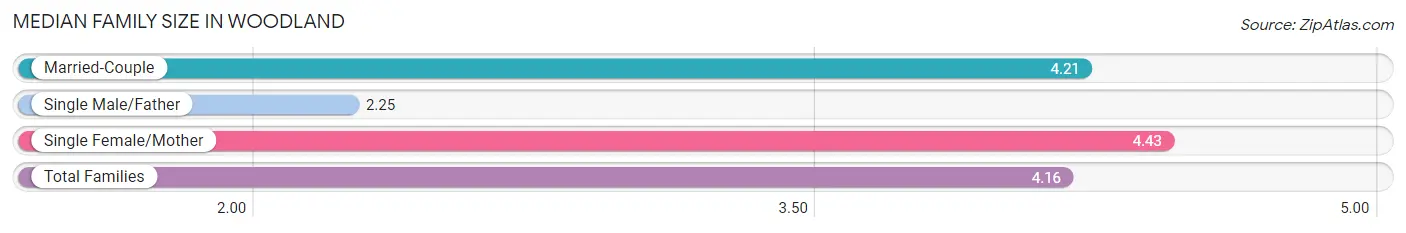
Median Family Size in Woodland
The median family size in Woodland is 4.16 persons per family, with single female/mother families (7 | 5.5%) accounting for the largest median family size of 4.43 persons per family. On the other hand, single male/father families (4 | 3.1%) represent the smallest median family size with 2.25 persons per family.
| Family Type | # Families | Family Size |
| Married-Couple | 117 (91.4%) | 4.21 |
| Single Male/Father | 4 (3.1%) | 2.25 |
| Single Female/Mother | 7 (5.5%) | 4.43 |
| Total Families | 128 (100.0%) | 4.16 |
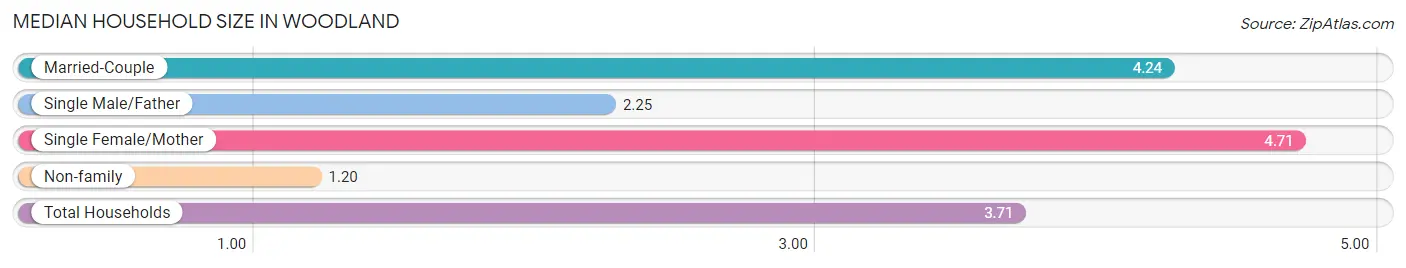
Median Household Size in Woodland
The median household size in Woodland is 3.71 persons per household, with single female/mother households (7 | 4.6%) accounting for the largest median household size of 4.71 persons per household. non-family households (25 | 16.3%) represent the smallest median household size with 1.20 persons per household.
| Household Type | # Households | Household Size |
| Married-Couple | 117 (76.5%) | 4.24 |
| Single Male/Father | 4 (2.6%) | 2.25 |
| Single Female/Mother | 7 (4.6%) | 4.71 |
| Non-family | 25 (16.3%) | 1.20 |
| Total Households | 153 (100.0%) | 3.71 |
Household Size by Marriage Status in Woodland
Out of a total of 153 households in Woodland, 128 (83.7%) are family households, while 25 (16.3%) are nonfamily households. The most numerous type of family households are 4-person households, comprising 89, and the most common type of nonfamily households are 1-person households, comprising 21.
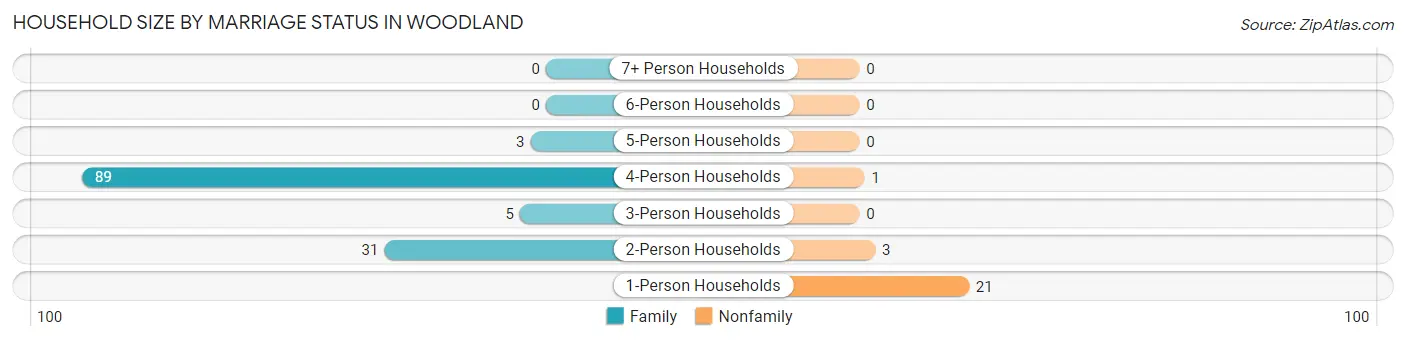
| Household Size | Family Households | Nonfamily Households |
| 1-Person Households | - | 21 (13.7%) |
| 2-Person Households | 31 (20.3%) | 3 (2.0%) |
| 3-Person Households | 5 (3.3%) | 0 (0.0%) |
| 4-Person Households | 89 (58.2%) | 1 (0.6%) |
| 5-Person Households | 3 (2.0%) | 0 (0.0%) |
| 6-Person Households | 0 (0.0%) | 0 (0.0%) |
| 7+ Person Households | 0 (0.0%) | 0 (0.0%) |
| Total | 128 (83.7%) | 25 (16.3%) |
Female Fertility in Woodland
Fertility by Age in Woodland
Average fertility rate in Woodland is 11.0 births per 1,000 women. Women in the age bracket of 20 to 34 years have the highest fertility rate with 18.0 births per 1,000 women. Women in the age bracket of 20 to 34 years acount for 100.0% of all women with births.
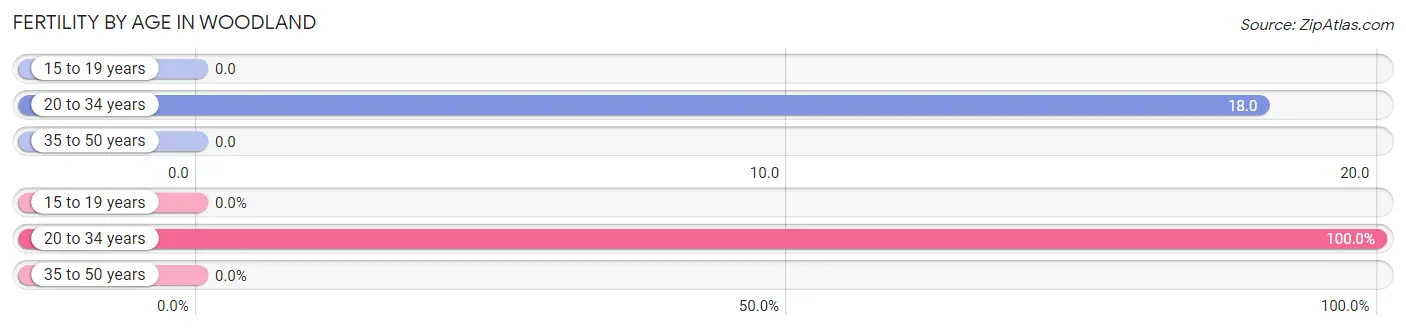
| Age Bracket | Women with Births | Births / 1,000 Women |
| 15 to 19 years | 0 (0.0%) | 0.0 |
| 20 to 34 years | 3 (100.0%) | 18.0 |
| 35 to 50 years | 0 (0.0%) | 0.0 |
| Total | 3 (100.0%) | 11.0 |
Fertility by Age by Marriage Status in Woodland
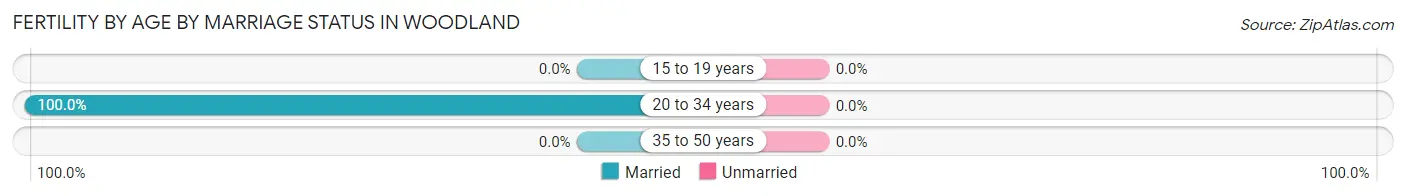
| Age Bracket | Married | Unmarried |
| 15 to 19 years | 0 (0.0%) | 0 (0.0%) |
| 20 to 34 years | 3 (100.0%) | 0 (0.0%) |
| 35 to 50 years | 0 (0.0%) | 0 (0.0%) |
| Total | 3 (100.0%) | 0 (0.0%) |
Fertility by Education in Woodland
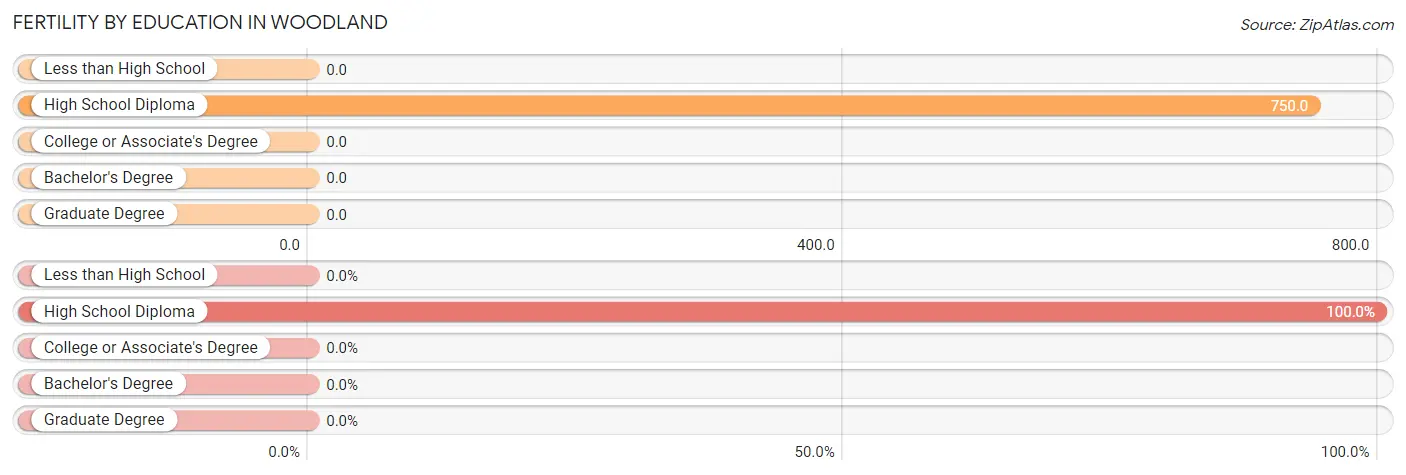
| Educational Attainment | Women with Births | Births / 1,000 Women |
| Less than High School | 0 (0.0%) | 0.0 |
| High School Diploma | 3 (100.0%) | 750.0 |
| College or Associate's Degree | 0 (0.0%) | 0.0 |
| Bachelor's Degree | 0 (0.0%) | 0.0 |
| Graduate Degree | 0 (0.0%) | 0.0 |
| Total | 3 (100.0%) | 11.0 |
Fertility by Education by Marriage Status in Woodland
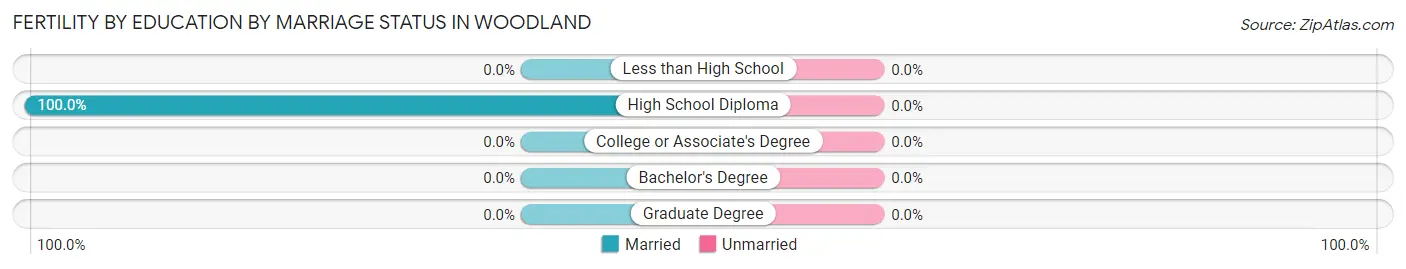
| Educational Attainment | Married | Unmarried |
| Less than High School | 0 (0.0%) | 0 (0.0%) |
| High School Diploma | 3 (100.0%) | 0 (0.0%) |
| College or Associate's Degree | 0 (0.0%) | 0 (0.0%) |
| Bachelor's Degree | 0 (0.0%) | 0 (0.0%) |
| Graduate Degree | 0 (0.0%) | 0 (0.0%) |
| Total | 3 (100.0%) | 0 (0.0%) |
Employment Characteristics in Woodland
Employment by Class of Employer in Woodland
Among the 240 employed individuals in Woodland, private company employees (217 | 90.4%), local government employees (13 | 5.4%), and state government employees (8 | 3.3%) make up the most common classes of employment.
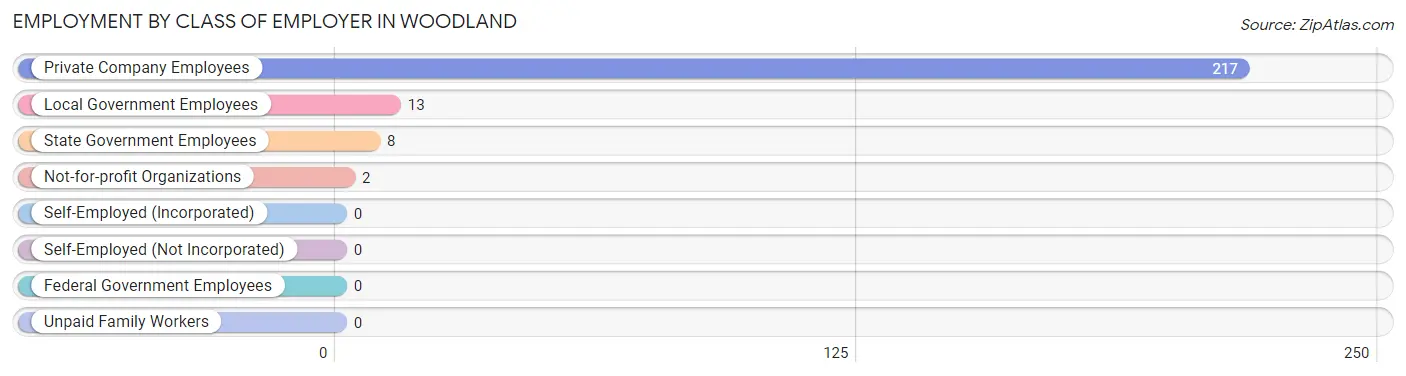
| Employer Class | # Employees | % Employees |
| Private Company Employees | 217 | 90.4% |
| Self-Employed (Incorporated) | 0 | 0.0% |
| Self-Employed (Not Incorporated) | 0 | 0.0% |
| Not-for-profit Organizations | 2 | 0.8% |
| Local Government Employees | 13 | 5.4% |
| State Government Employees | 8 | 3.3% |
| Federal Government Employees | 0 | 0.0% |
| Unpaid Family Workers | 0 | 0.0% |
| Total | 240 | 100.0% |
Employment Status by Age in Woodland
According to the labor force statistics for Woodland, out of the total population over 16 years of age (468), 52.8% or 247 individuals are in the labor force, with 2.8% or 7 of them unemployed. The age group with the highest labor force participation rate is 16 to 19 years, with 100.0% or 2 individuals in the labor force. Within the labor force, the 16 to 19 years age range has the highest percentage of unemployed individuals, with 50.0% or 1 of them being unemployed.
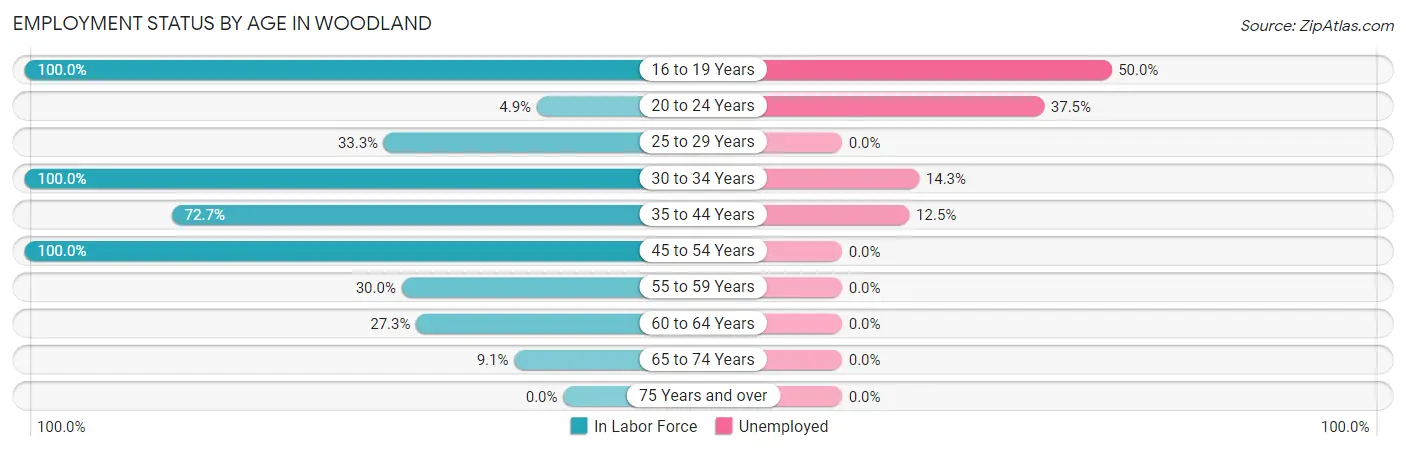
| Age Bracket | In Labor Force | Unemployed |
| 16 to 19 Years | 2 (100.0%) | 1 (50.0%) |
| 20 to 24 Years | 8 (4.9%) | 3 (37.5%) |
| 25 to 29 Years | 2 (33.3%) | 0 (0.0%) |
| 30 to 34 Years | 14 (100.0%) | 2 (14.3%) |
| 35 to 44 Years | 8 (72.7%) | 1 (12.5%) |
| 45 to 54 Years | 206 (100.0%) | 0 (0.0%) |
| 55 to 59 Years | 3 (30.0%) | 0 (0.0%) |
| 60 to 64 Years | 3 (27.3%) | 0 (0.0%) |
| 65 to 74 Years | 1 (9.1%) | 0 (0.0%) |
| 75 Years and over | 0 (0.0%) | 0 (0.0%) |
| Total | 247 (52.8%) | 7 (2.8%) |
Employment Status by Educational Attainment in Woodland
According to labor force statistics for Woodland, 91.5% of individuals (236) out of the total population between 25 and 64 years of age (258) are in the labor force, with 1.3% or 3 of them being unemployed. The group with the highest labor force participation rate are those with the educational attainment of bachelor's degree or higher, with 98.9% or 185 individuals in the labor force. Within the labor force, individuals with college / associate degree education have the highest percentage of unemployment, with 10.7% or 3 of them being unemployed.
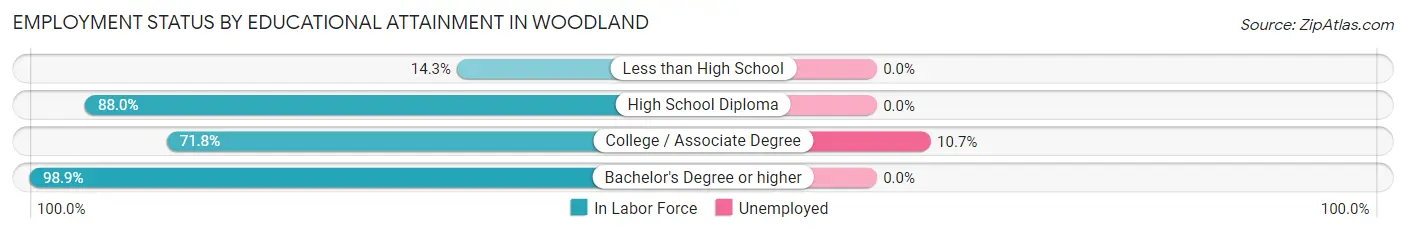
| Educational Attainment | In Labor Force | Unemployed |
| Less than High School | 1 (14.3%) | 0 (0.0%) |
| High School Diploma | 22 (88.0%) | 0 (0.0%) |
| College / Associate Degree | 28 (71.8%) | 4 (10.7%) |
| Bachelor's Degree or higher | 185 (98.9%) | 0 (0.0%) |
| Total | 236 (91.5%) | 3 (1.3%) |
Employment Occupations by Sex in Woodland
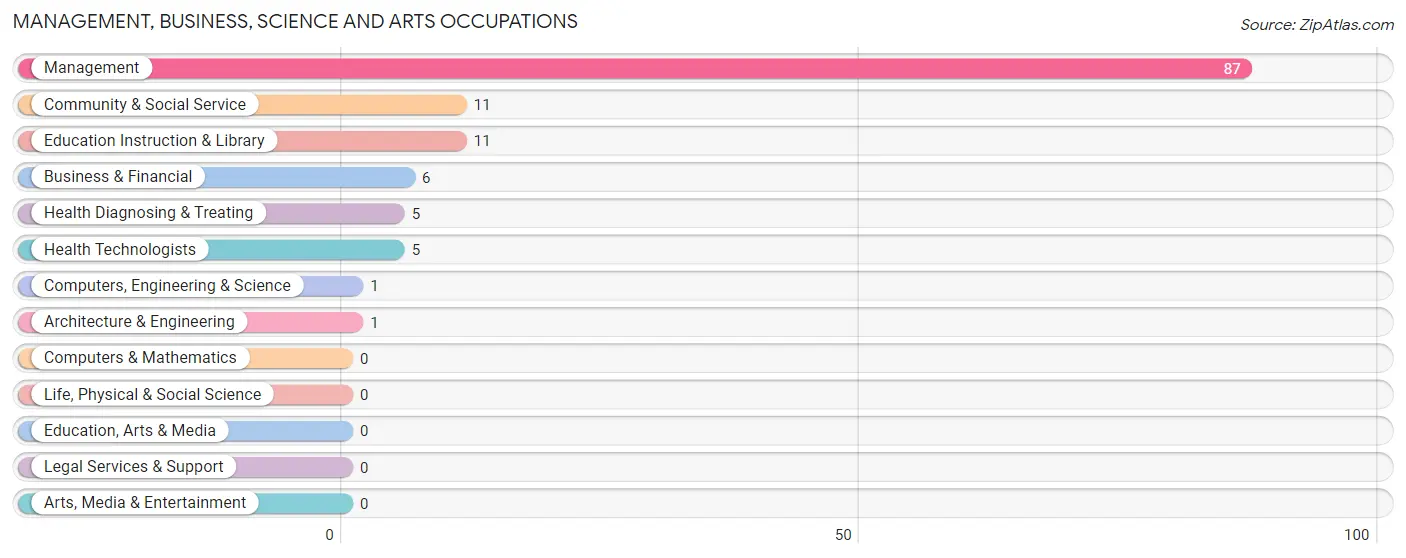
Management, Business, Science and Arts Occupations
The most common Management, Business, Science and Arts occupations in Woodland are Management (87 | 36.2%), Community & Social Service (11 | 4.6%), Education Instruction & Library (11 | 4.6%), Business & Financial (6 | 2.5%), and Health Diagnosing & Treating (5 | 2.1%).
Management, Business, Science and Arts Occupations by Sex
Within the Management, Business, Science and Arts occupations in Woodland, the most male-oriented occupations are Computers, Engineering & Science (100.0%), Architecture & Engineering (100.0%), and Management (98.9%), while the most female-oriented occupations are Business & Financial (100.0%), Community & Social Service (100.0%), and Education Instruction & Library (100.0%).
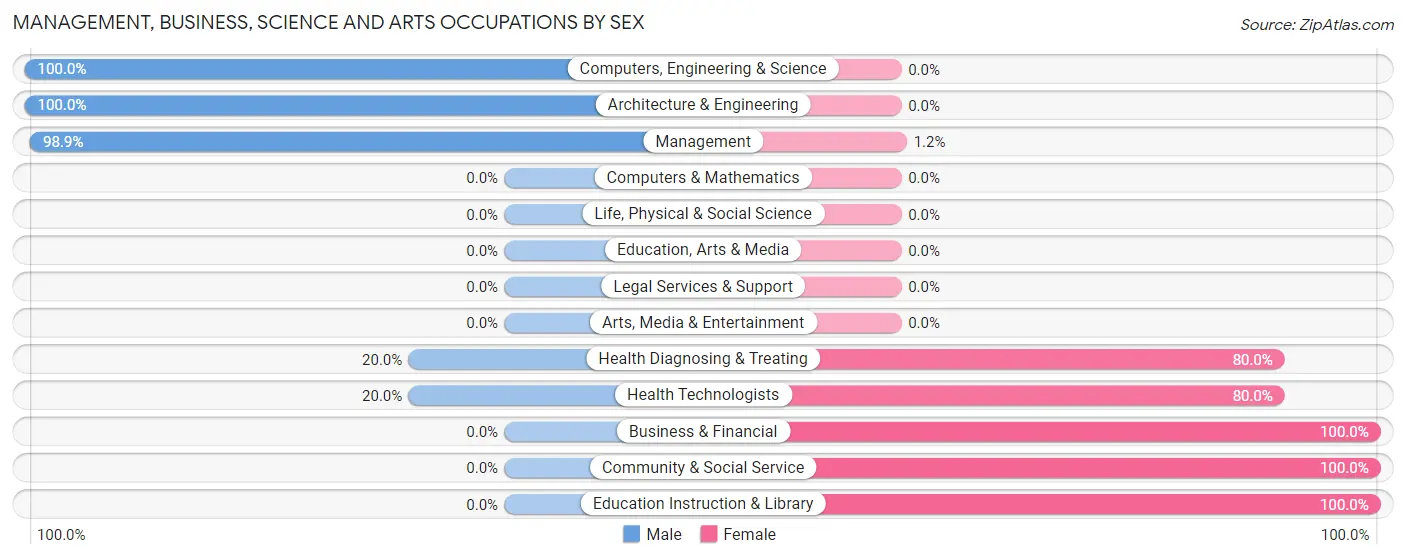
| Occupation | Male | Female |
| Management | 86 (98.9%) | 1 (1.1%) |
| Business & Financial | 0 (0.0%) | 6 (100.0%) |
| Computers, Engineering & Science | 1 (100.0%) | 0 (0.0%) |
| Computers & Mathematics | 0 (0.0%) | 0 (0.0%) |
| Architecture & Engineering | 1 (100.0%) | 0 (0.0%) |
| Life, Physical & Social Science | 0 (0.0%) | 0 (0.0%) |
| Community & Social Service | 0 (0.0%) | 11 (100.0%) |
| Education, Arts & Media | 0 (0.0%) | 0 (0.0%) |
| Legal Services & Support | 0 (0.0%) | 0 (0.0%) |
| Education Instruction & Library | 0 (0.0%) | 11 (100.0%) |
| Arts, Media & Entertainment | 0 (0.0%) | 0 (0.0%) |
| Health Diagnosing & Treating | 1 (20.0%) | 4 (80.0%) |
| Health Technologists | 1 (20.0%) | 4 (80.0%) |
| Total (Category) | 88 (80.0%) | 22 (20.0%) |
| Total (Overall) | 116 (48.3%) | 124 (51.7%) |
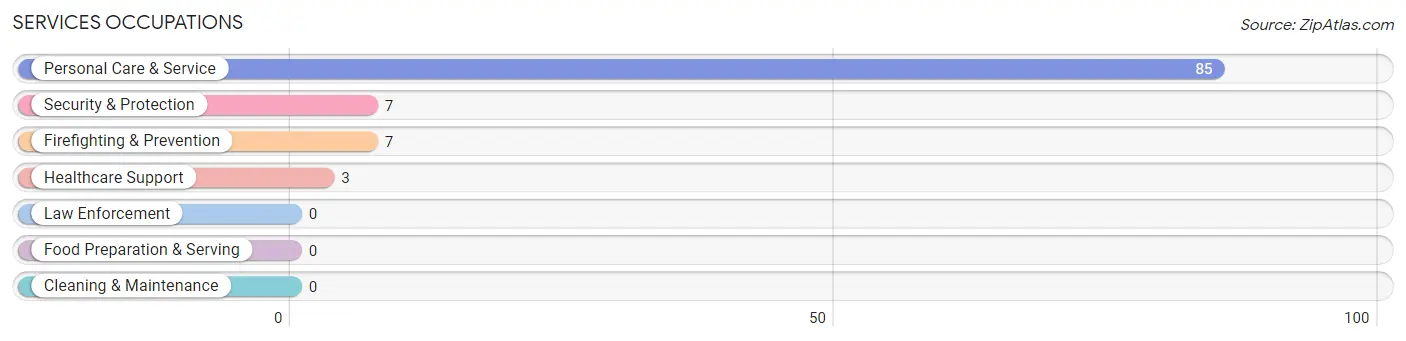
Services Occupations
The most common Services occupations in Woodland are Personal Care & Service (85 | 35.4%), Security & Protection (7 | 2.9%), Firefighting & Prevention (7 | 2.9%), and Healthcare Support (3 | 1.3%).
Services Occupations by Sex
Within the Services occupations in Woodland, the most male-oriented occupations are Security & Protection (100.0%), and Firefighting & Prevention (100.0%), while the most female-oriented occupations are Healthcare Support (100.0%), and Personal Care & Service (100.0%).
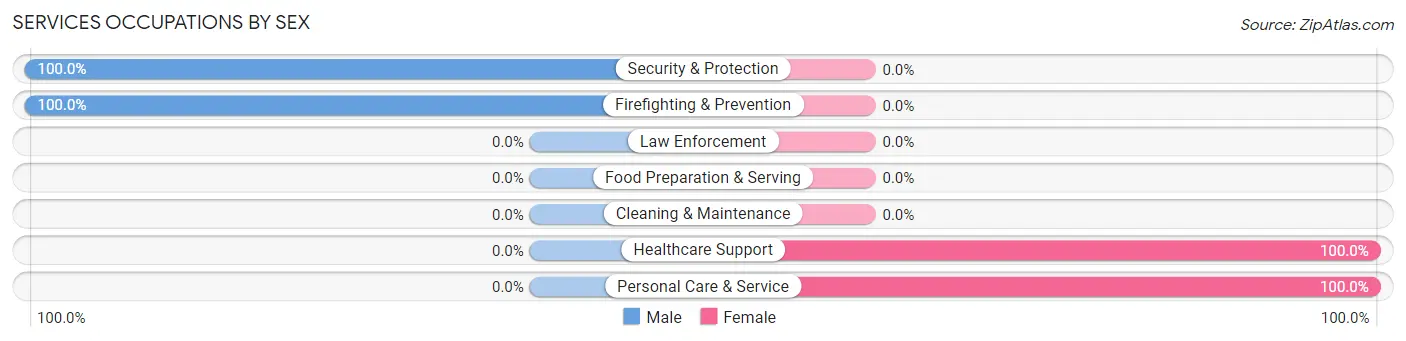
| Occupation | Male | Female |
| Healthcare Support | 0 (0.0%) | 3 (100.0%) |
| Security & Protection | 7 (100.0%) | 0 (0.0%) |
| Firefighting & Prevention | 7 (100.0%) | 0 (0.0%) |
| Law Enforcement | 0 (0.0%) | 0 (0.0%) |
| Food Preparation & Serving | 0 (0.0%) | 0 (0.0%) |
| Cleaning & Maintenance | 0 (0.0%) | 0 (0.0%) |
| Personal Care & Service | 0 (0.0%) | 85 (100.0%) |
| Total (Category) | 7 (7.4%) | 88 (92.6%) |
| Total (Overall) | 116 (48.3%) | 124 (51.7%) |
Sales and Office Occupations
The most common Sales and Office occupations in Woodland are Sales & Related (12 | 5.0%), and Office & Administration (8 | 3.3%).
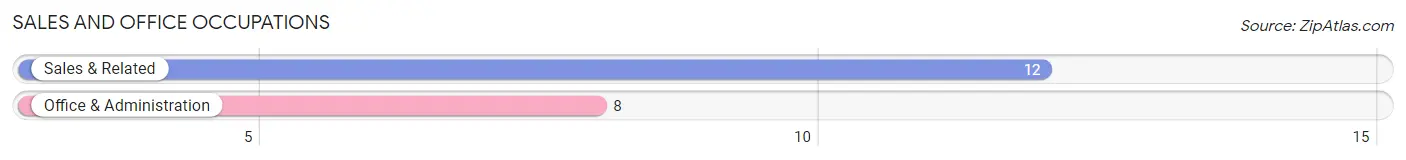
Sales and Office Occupations by Sex
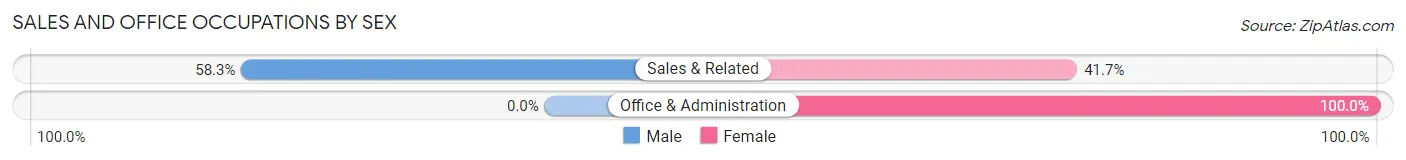
| Occupation | Male | Female |
| Sales & Related | 7 (58.3%) | 5 (41.7%) |
| Office & Administration | 0 (0.0%) | 8 (100.0%) |
| Total (Category) | 7 (35.0%) | 13 (65.0%) |
| Total (Overall) | 116 (48.3%) | 124 (51.7%) |
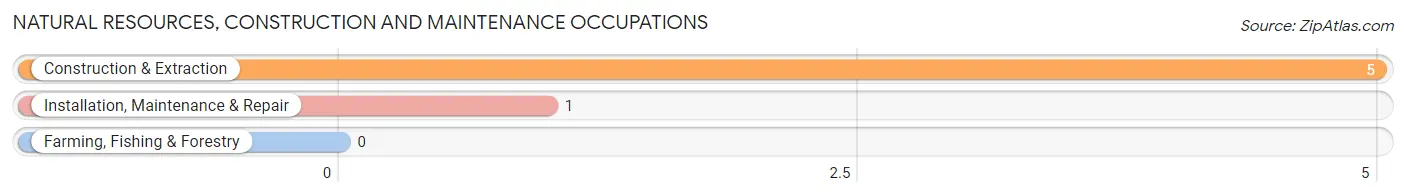
Natural Resources, Construction and Maintenance Occupations
The most common Natural Resources, Construction and Maintenance occupations in Woodland are Construction & Extraction (5 | 2.1%), and Installation, Maintenance & Repair (1 | 0.4%).
Natural Resources, Construction and Maintenance Occupations by Sex
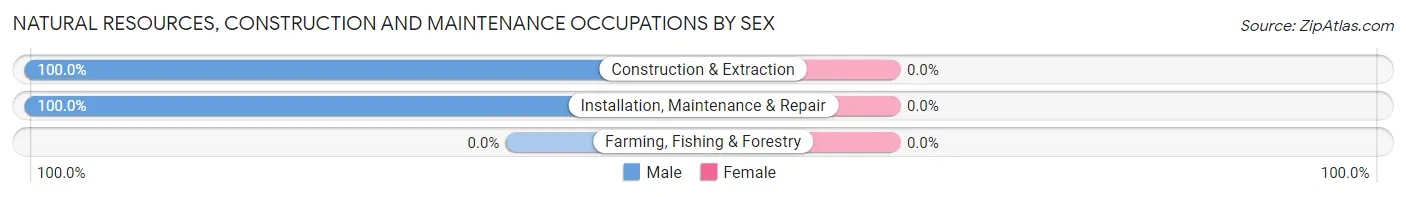
| Occupation | Male | Female |
| Farming, Fishing & Forestry | 0 (0.0%) | 0 (0.0%) |
| Construction & Extraction | 5 (100.0%) | 0 (0.0%) |
| Installation, Maintenance & Repair | 1 (100.0%) | 0 (0.0%) |
| Total (Category) | 6 (100.0%) | 0 (0.0%) |
| Total (Overall) | 116 (48.3%) | 124 (51.7%) |
Production, Transportation and Moving Occupations
The most common Production, Transportation and Moving occupations in Woodland are Production (7 | 2.9%), Transportation (1 | 0.4%), and Material Moving (1 | 0.4%).
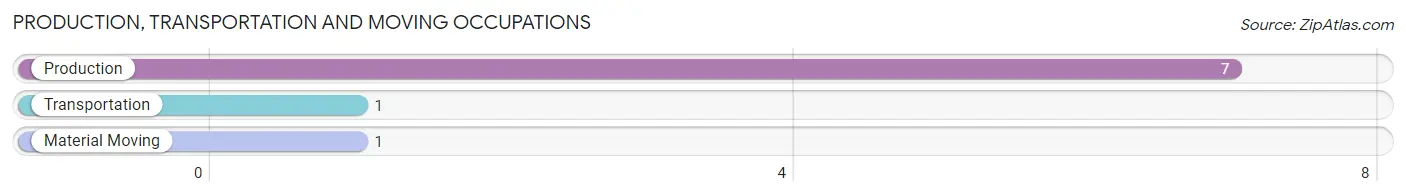
Production, Transportation and Moving Occupations by Sex
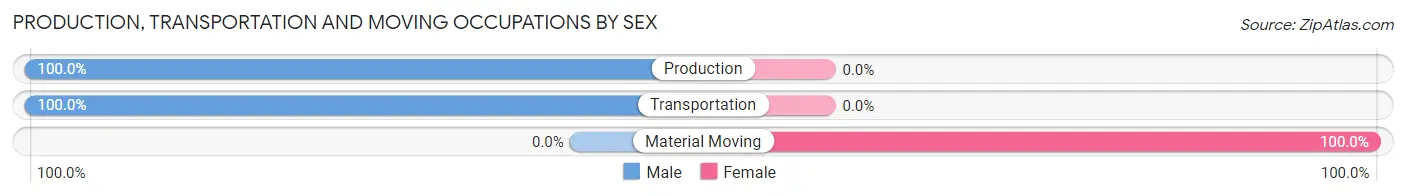
| Occupation | Male | Female |
| Production | 7 (100.0%) | 0 (0.0%) |
| Transportation | 1 (100.0%) | 0 (0.0%) |
| Material Moving | 0 (0.0%) | 1 (100.0%) |
| Total (Category) | 8 (88.9%) | 1 (11.1%) |
| Total (Overall) | 116 (48.3%) | 124 (51.7%) |
Employment Industries by Sex in Woodland
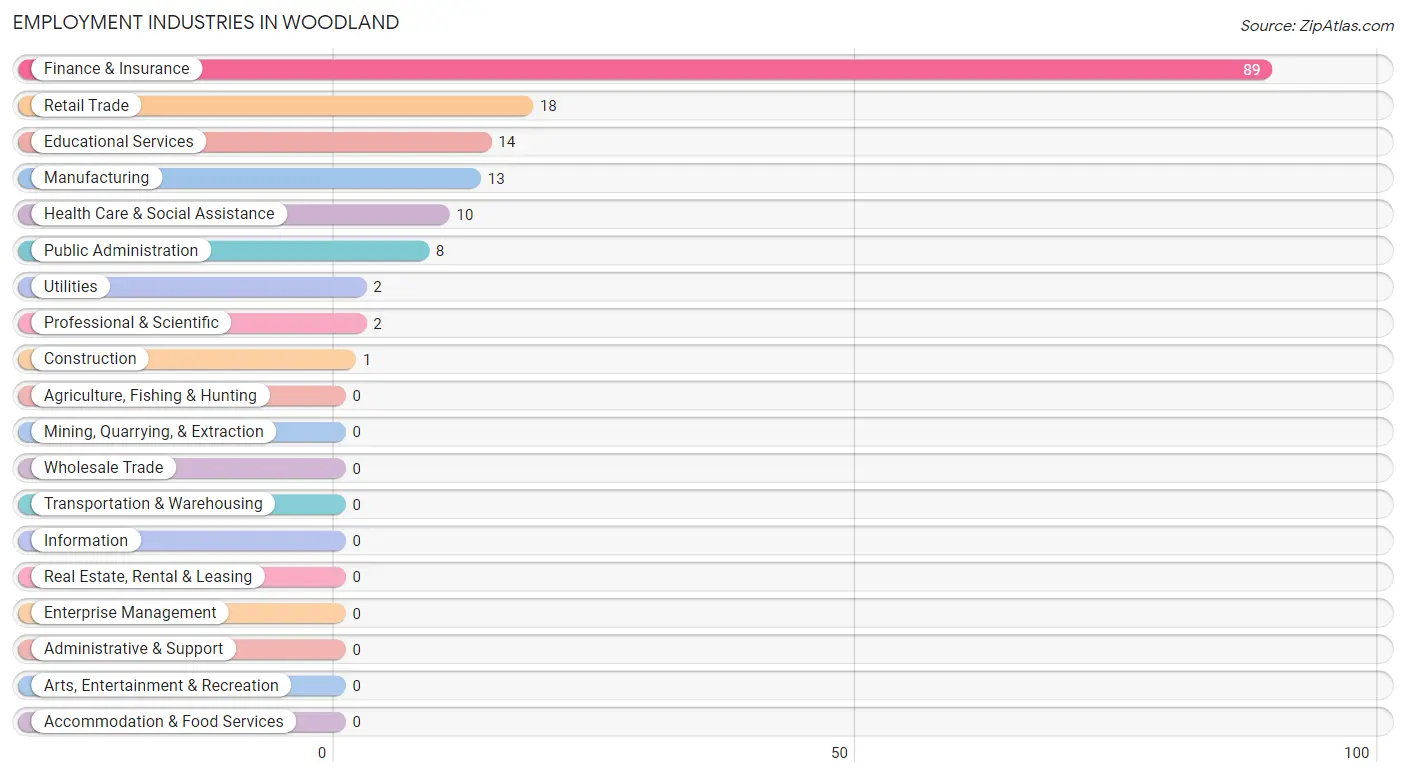
Employment Industries in Woodland
The major employment industries in Woodland include Finance & Insurance (89 | 37.1%), Retail Trade (18 | 7.5%), Educational Services (14 | 5.8%), Manufacturing (13 | 5.4%), and Health Care & Social Assistance (10 | 4.2%).
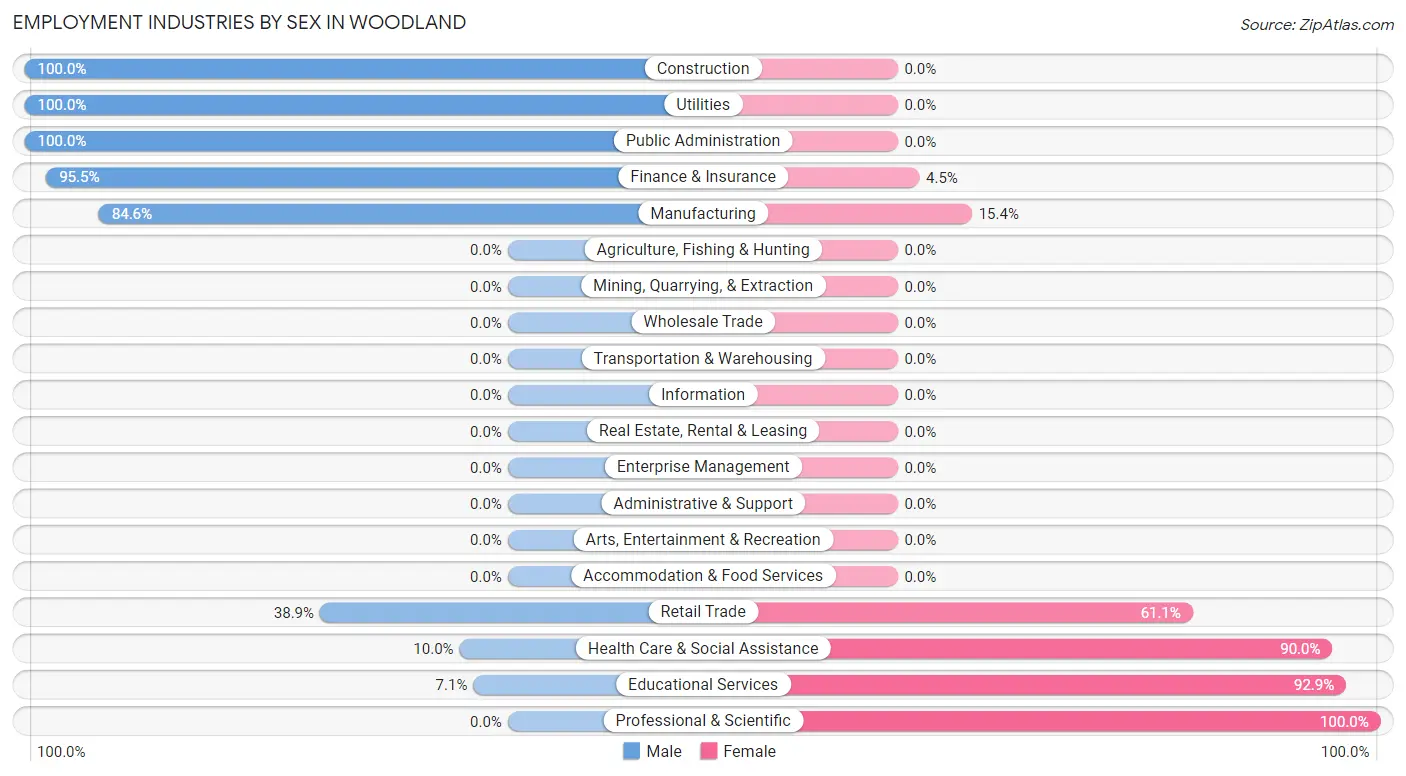
Employment Industries by Sex in Woodland
The Woodland industries that see more men than women are Construction (100.0%), Utilities (100.0%), and Public Administration (100.0%), whereas the industries that tend to have a higher number of women are Professional & Scientific (100.0%), Educational Services (92.9%), and Health Care & Social Assistance (90.0%).
| Industry | Male | Female |
| Agriculture, Fishing & Hunting | 0 (0.0%) | 0 (0.0%) |
| Mining, Quarrying, & Extraction | 0 (0.0%) | 0 (0.0%) |
| Construction | 1 (100.0%) | 0 (0.0%) |
| Manufacturing | 11 (84.6%) | 2 (15.4%) |
| Wholesale Trade | 0 (0.0%) | 0 (0.0%) |
| Retail Trade | 7 (38.9%) | 11 (61.1%) |
| Transportation & Warehousing | 0 (0.0%) | 0 (0.0%) |
| Utilities | 2 (100.0%) | 0 (0.0%) |
| Information | 0 (0.0%) | 0 (0.0%) |
| Finance & Insurance | 85 (95.5%) | 4 (4.5%) |
| Real Estate, Rental & Leasing | 0 (0.0%) | 0 (0.0%) |
| Professional & Scientific | 0 (0.0%) | 2 (100.0%) |
| Enterprise Management | 0 (0.0%) | 0 (0.0%) |
| Administrative & Support | 0 (0.0%) | 0 (0.0%) |
| Educational Services | 1 (7.1%) | 13 (92.9%) |
| Health Care & Social Assistance | 1 (10.0%) | 9 (90.0%) |
| Arts, Entertainment & Recreation | 0 (0.0%) | 0 (0.0%) |
| Accommodation & Food Services | 0 (0.0%) | 0 (0.0%) |
| Public Administration | 8 (100.0%) | 0 (0.0%) |
| Total | 116 (48.3%) | 124 (51.7%) |
Education in Woodland
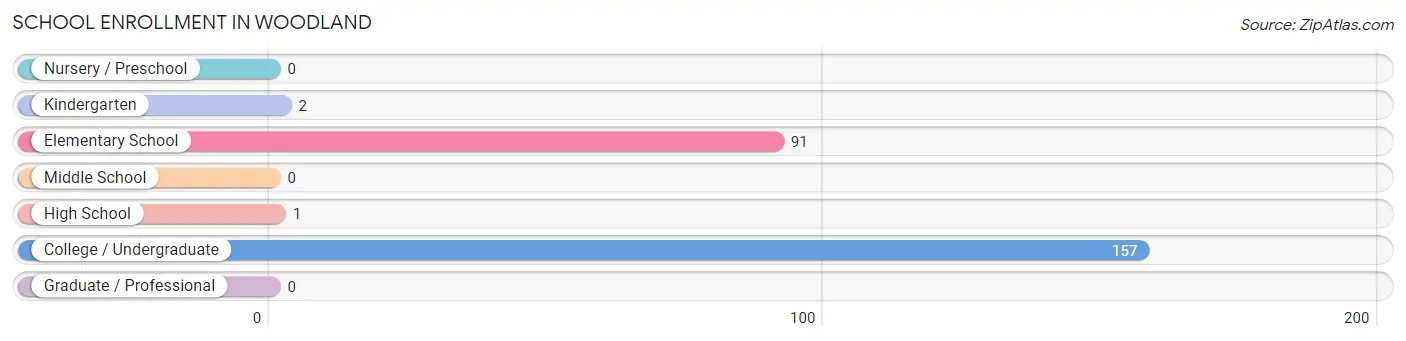
School Enrollment in Woodland
The most common levels of schooling among the 251 students in Woodland are college / undergraduate (157 | 62.5%), elementary school (91 | 36.2%), and kindergarten (2 | 0.8%).
| School Level | # Students | % Students |
| Nursery / Preschool | 0 | 0.0% |
| Kindergarten | 2 | 0.8% |
| Elementary School | 91 | 36.2% |
| Middle School | 0 | 0.0% |
| High School | 1 | 0.4% |
| College / Undergraduate | 157 | 62.5% |
| Graduate / Professional | 0 | 0.0% |
| Total | 251 | 100.0% |
School Enrollment by Age by Funding Source in Woodland
Out of a total of 251 students who are enrolled in schools in Woodland, 6 (2.4%) attend a private institution, while the remaining 245 (97.6%) are enrolled in public schools. The age group of 20 to 24 year olds has the highest likelihood of being enrolled in private schools, with 6 (3.8% in the age bracket) enrolled. Conversely, the age group of 5 to 9 year old has the lowest likelihood of being enrolled in a private school, with 93 (100.0% in the age bracket) attending a public institution.
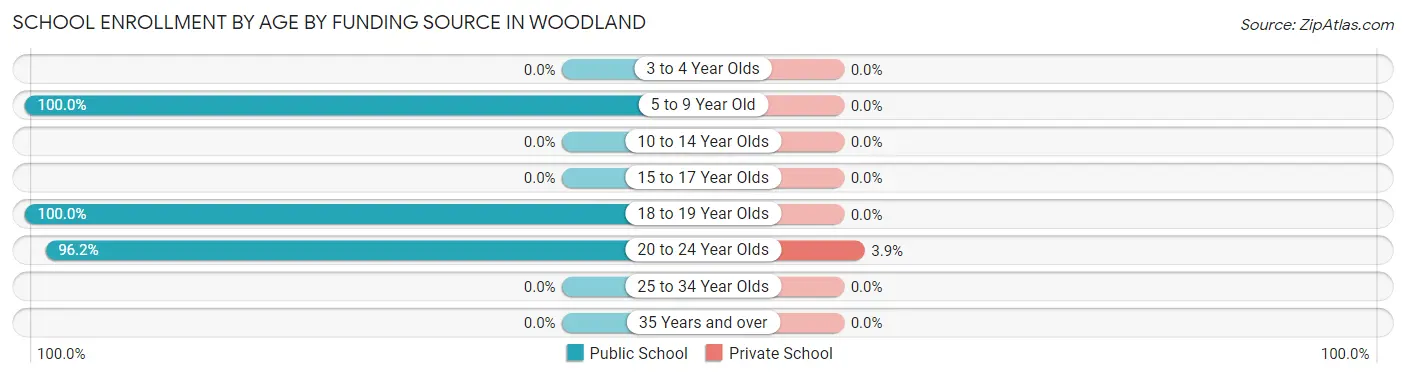
| Age Bracket | Public School | Private School |
| 3 to 4 Year Olds | 0 (0.0%) | 0 (0.0%) |
| 5 to 9 Year Old | 93 (100.0%) | 0 (0.0%) |
| 10 to 14 Year Olds | 0 (0.0%) | 0 (0.0%) |
| 15 to 17 Year Olds | 0 (0.0%) | 0 (0.0%) |
| 18 to 19 Year Olds | 2 (100.0%) | 0 (0.0%) |
| 20 to 24 Year Olds | 150 (96.2%) | 6 (3.8%) |
| 25 to 34 Year Olds | 0 (0.0%) | 0 (0.0%) |
| 35 Years and over | 0 (0.0%) | 0 (0.0%) |
| Total | 245 (97.6%) | 6 (2.4%) |
Educational Attainment by Field of Study in Woodland
Business (176 | 91.2%), education (15 | 7.8%), and bio, nature & agricultural (2 | 1.0%) are the most common fields of study among 193 individuals in Woodland who have obtained a bachelor's degree or higher.
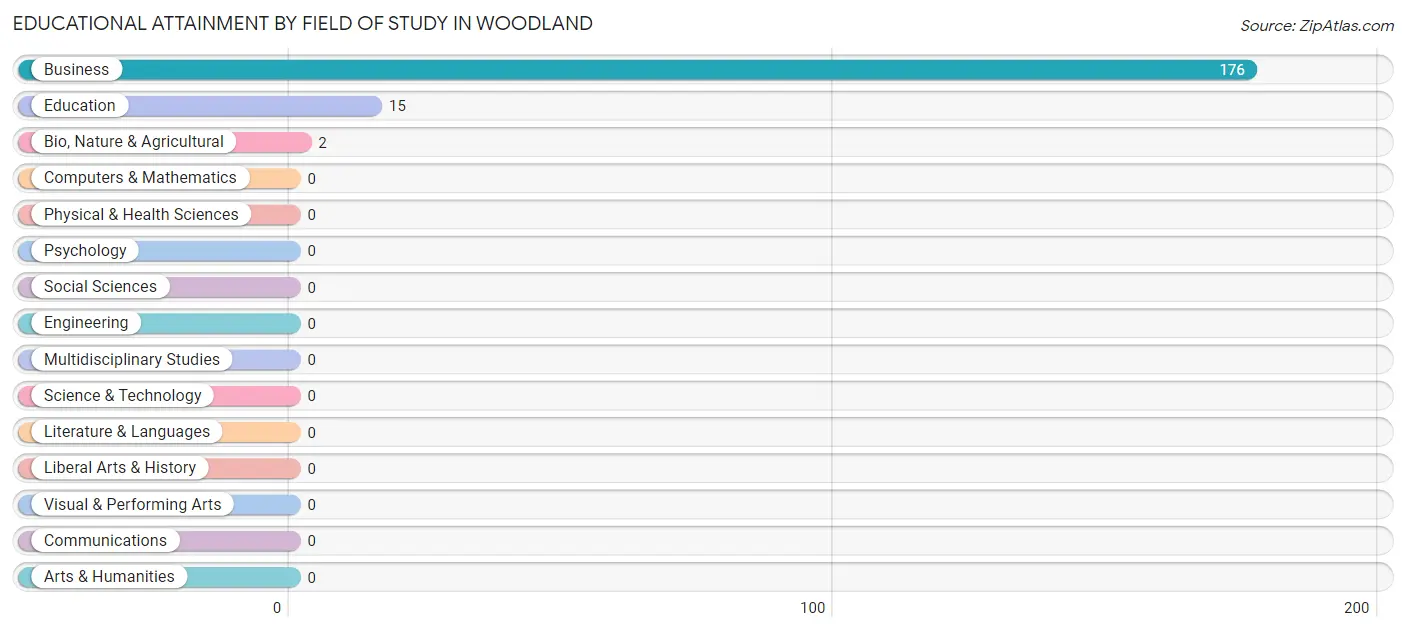
| Field of Study | # Graduates | % Graduates |
| Computers & Mathematics | 0 | 0.0% |
| Bio, Nature & Agricultural | 2 | 1.0% |
| Physical & Health Sciences | 0 | 0.0% |
| Psychology | 0 | 0.0% |
| Social Sciences | 0 | 0.0% |
| Engineering | 0 | 0.0% |
| Multidisciplinary Studies | 0 | 0.0% |
| Science & Technology | 0 | 0.0% |
| Business | 176 | 91.2% |
| Education | 15 | 7.8% |
| Literature & Languages | 0 | 0.0% |
| Liberal Arts & History | 0 | 0.0% |
| Visual & Performing Arts | 0 | 0.0% |
| Communications | 0 | 0.0% |
| Arts & Humanities | 0 | 0.0% |
| Total | 193 | 100.0% |
Transportation & Commute in Woodland
Vehicle Availability by Sex in Woodland
The most prevalent vehicle ownership categories in Woodland are males with 4 vehicles (92, accounting for 79.3%) and females with 4 vehicles (91, making up 74.2%).
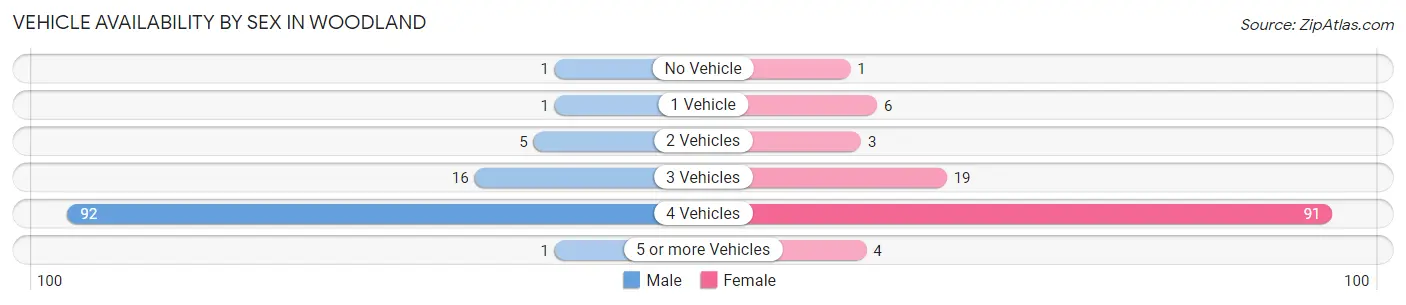
| Vehicles Available | Male | Female |
| No Vehicle | 1 (0.9%) | 1 (0.8%) |
| 1 Vehicle | 1 (0.9%) | 6 (4.8%) |
| 2 Vehicles | 5 (4.3%) | 3 (2.4%) |
| 3 Vehicles | 16 (13.8%) | 19 (15.3%) |
| 4 Vehicles | 92 (79.3%) | 91 (73.4%) |
| 5 or more Vehicles | 1 (0.9%) | 4 (3.2%) |
| Total | 116 (100.0%) | 124 (100.0%) |
Commute Time in Woodland
The most frequently occuring commute durations in Woodland are 45 to 59 minutes (89 commuters, 37.4%), 20 to 24 minutes (87 commuters, 36.5%), and less than 5 minutes (17 commuters, 7.1%).
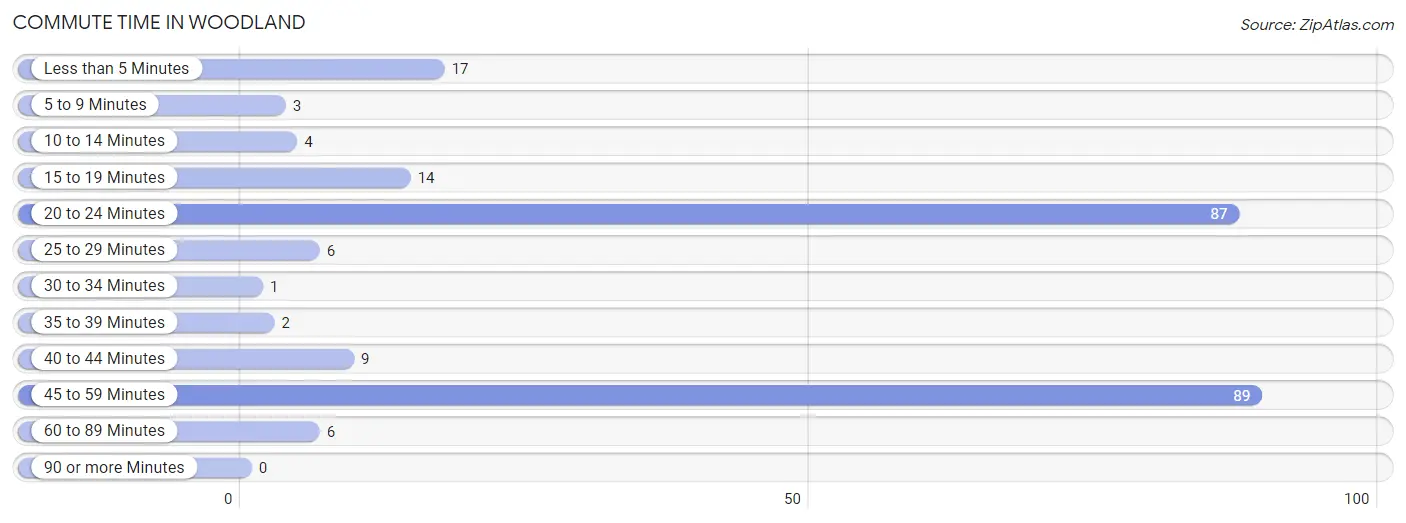
| Commute Time | # Commuters | % Commuters |
| Less than 5 Minutes | 17 | 7.1% |
| 5 to 9 Minutes | 3 | 1.3% |
| 10 to 14 Minutes | 4 | 1.7% |
| 15 to 19 Minutes | 14 | 5.9% |
| 20 to 24 Minutes | 87 | 36.5% |
| 25 to 29 Minutes | 6 | 2.5% |
| 30 to 34 Minutes | 1 | 0.4% |
| 35 to 39 Minutes | 2 | 0.8% |
| 40 to 44 Minutes | 9 | 3.8% |
| 45 to 59 Minutes | 89 | 37.4% |
| 60 to 89 Minutes | 6 | 2.5% |
| 90 or more Minutes | 0 | 0.0% |
Commute Time by Sex in Woodland
The most common commute times in Woodland are 20 to 24 minutes (85 commuters, 73.3%) for males and 45 to 59 minutes (87 commuters, 71.3%) for females.
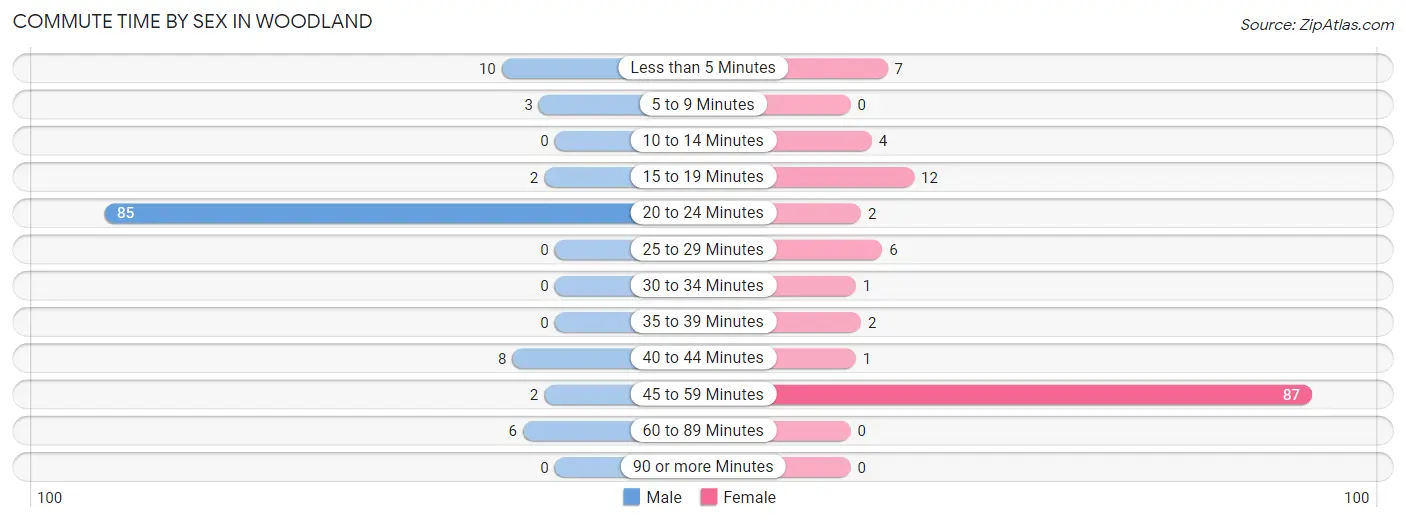
| Commute Time | Male | Female |
| Less than 5 Minutes | 10 (8.6%) | 7 (5.7%) |
| 5 to 9 Minutes | 3 (2.6%) | 0 (0.0%) |
| 10 to 14 Minutes | 0 (0.0%) | 4 (3.3%) |
| 15 to 19 Minutes | 2 (1.7%) | 12 (9.8%) |
| 20 to 24 Minutes | 85 (73.3%) | 2 (1.6%) |
| 25 to 29 Minutes | 0 (0.0%) | 6 (4.9%) |
| 30 to 34 Minutes | 0 (0.0%) | 1 (0.8%) |
| 35 to 39 Minutes | 0 (0.0%) | 2 (1.6%) |
| 40 to 44 Minutes | 8 (6.9%) | 1 (0.8%) |
| 45 to 59 Minutes | 2 (1.7%) | 87 (71.3%) |
| 60 to 89 Minutes | 6 (5.2%) | 0 (0.0%) |
| 90 or more Minutes | 0 (0.0%) | 0 (0.0%) |
Time of Departure to Work by Sex in Woodland
The most frequent times of departure to work in Woodland are 7:30 AM to 7:59 AM (90, 77.6%) for males and 5:00 AM to 5:29 AM (83, 68.0%) for females.
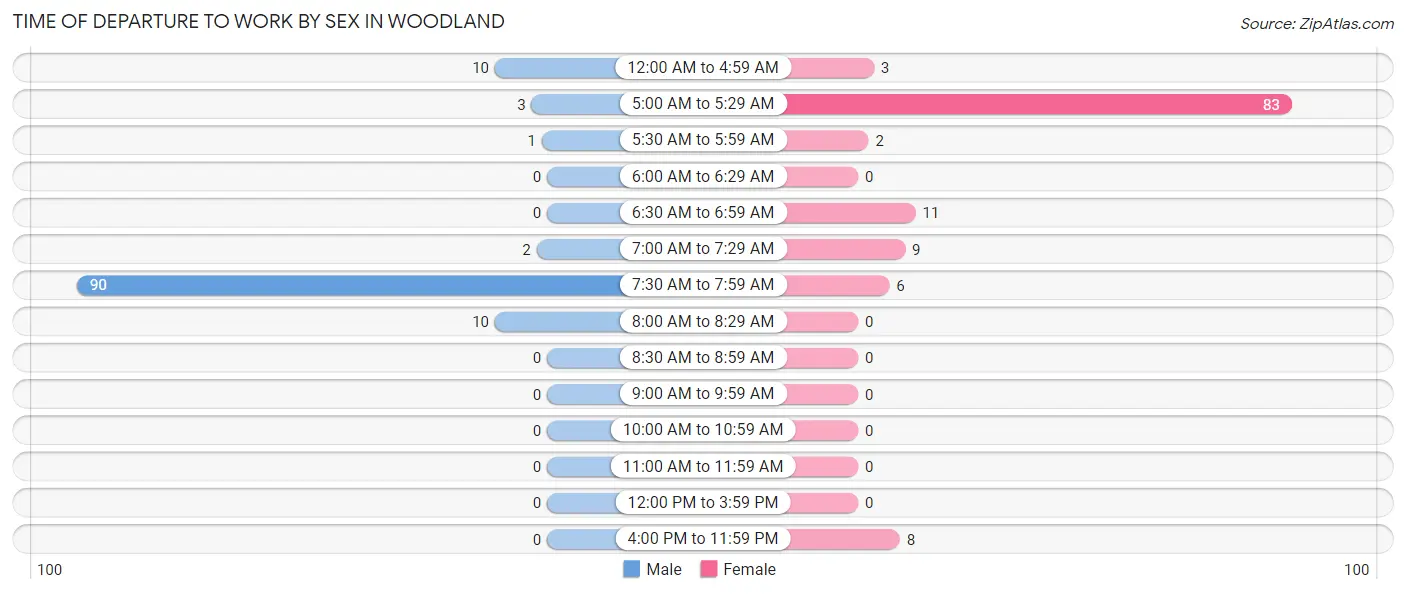
| Time of Departure | Male | Female |
| 12:00 AM to 4:59 AM | 10 (8.6%) | 3 (2.5%) |
| 5:00 AM to 5:29 AM | 3 (2.6%) | 83 (68.0%) |
| 5:30 AM to 5:59 AM | 1 (0.9%) | 2 (1.6%) |
| 6:00 AM to 6:29 AM | 0 (0.0%) | 0 (0.0%) |
| 6:30 AM to 6:59 AM | 0 (0.0%) | 11 (9.0%) |
| 7:00 AM to 7:29 AM | 2 (1.7%) | 9 (7.4%) |
| 7:30 AM to 7:59 AM | 90 (77.6%) | 6 (4.9%) |
| 8:00 AM to 8:29 AM | 10 (8.6%) | 0 (0.0%) |
| 8:30 AM to 8:59 AM | 0 (0.0%) | 0 (0.0%) |
| 9:00 AM to 9:59 AM | 0 (0.0%) | 0 (0.0%) |
| 10:00 AM to 10:59 AM | 0 (0.0%) | 0 (0.0%) |
| 11:00 AM to 11:59 AM | 0 (0.0%) | 0 (0.0%) |
| 12:00 PM to 3:59 PM | 0 (0.0%) | 0 (0.0%) |
| 4:00 PM to 11:59 PM | 0 (0.0%) | 8 (6.6%) |
| Total | 116 (100.0%) | 122 (100.0%) |
Housing Occupancy in Woodland
Occupancy by Ownership in Woodland
Of the total 153 dwellings in Woodland, owner-occupied units account for 143 (93.5%), while renter-occupied units make up 10 (6.5%).
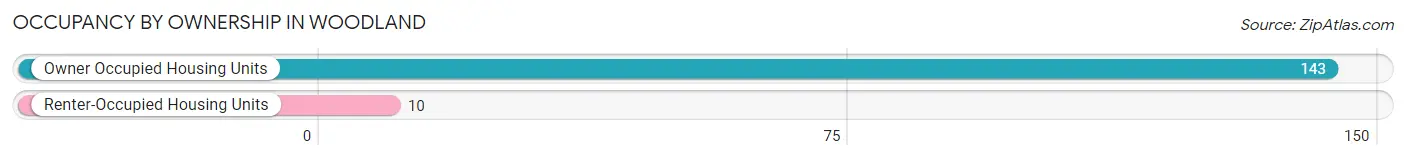
| Occupancy | # Housing Units | % Housing Units |
| Owner Occupied Housing Units | 143 | 93.5% |
| Renter-Occupied Housing Units | 10 | 6.5% |
| Total Occupied Housing Units | 153 | 100.0% |
Occupancy by Household Size in Woodland
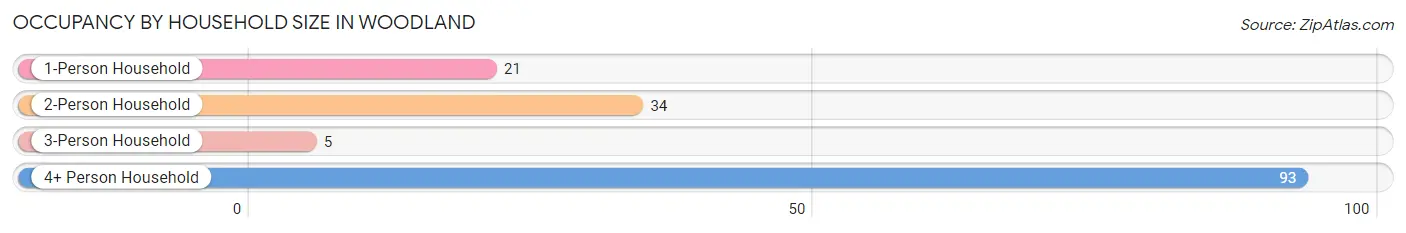
| Household Size | # Housing Units | % Housing Units |
| 1-Person Household | 21 | 13.7% |
| 2-Person Household | 34 | 22.2% |
| 3-Person Household | 5 | 3.3% |
| 4+ Person Household | 93 | 60.8% |
| Total Housing Units | 153 | 100.0% |
Occupancy by Ownership by Household Size in Woodland
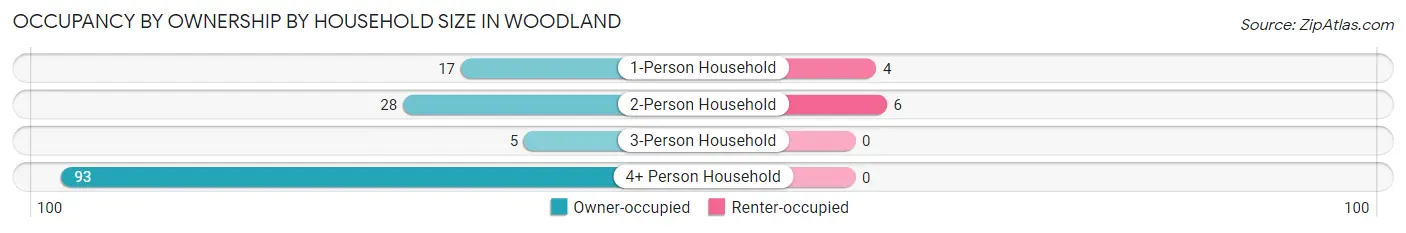
| Household Size | Owner-occupied | Renter-occupied |
| 1-Person Household | 17 (80.9%) | 4 (19.1%) |
| 2-Person Household | 28 (82.4%) | 6 (17.6%) |
| 3-Person Household | 5 (100.0%) | 0 (0.0%) |
| 4+ Person Household | 93 (100.0%) | 0 (0.0%) |
| Total Housing Units | 143 (93.5%) | 10 (6.5%) |
Occupancy by Educational Attainment in Woodland
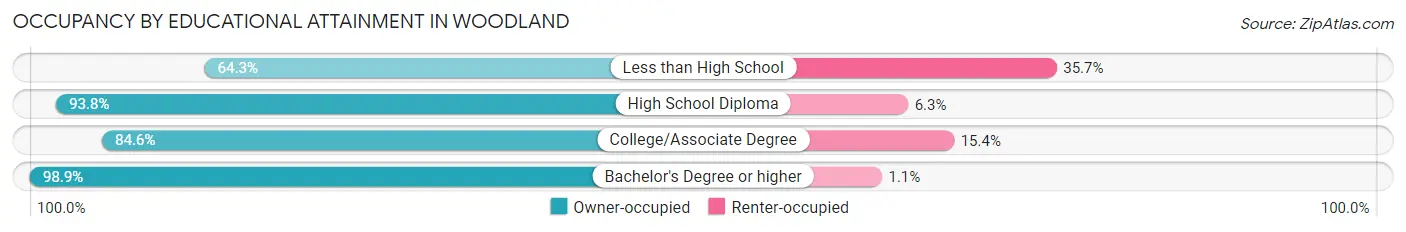
| Household Size | Owner-occupied | Renter-occupied |
| Less than High School | 9 (64.3%) | 5 (35.7%) |
| High School Diploma | 30 (93.8%) | 2 (6.2%) |
| College/Associate Degree | 11 (84.6%) | 2 (15.4%) |
| Bachelor's Degree or higher | 93 (98.9%) | 1 (1.1%) |
Occupancy by Age of Householder in Woodland
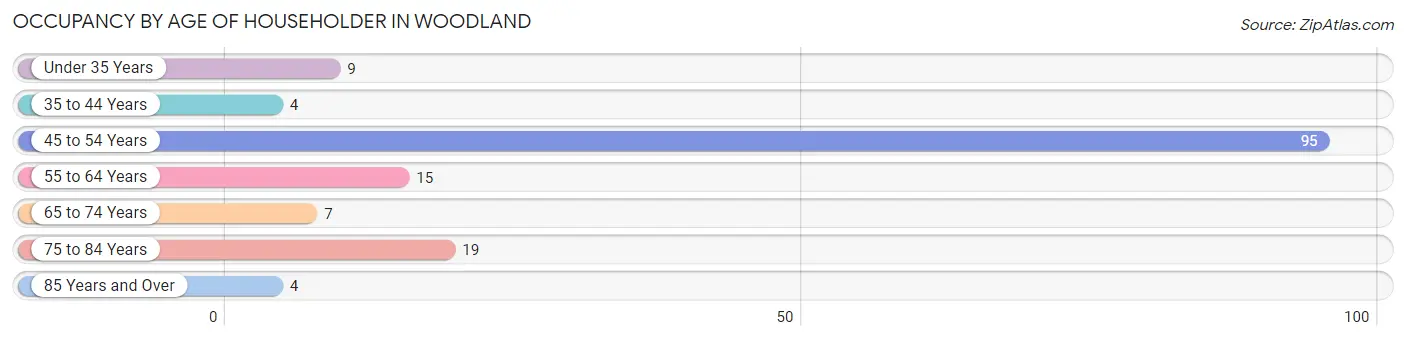
| Age Bracket | # Households | % Households |
| Under 35 Years | 9 | 5.9% |
| 35 to 44 Years | 4 | 2.6% |
| 45 to 54 Years | 95 | 62.1% |
| 55 to 64 Years | 15 | 9.8% |
| 65 to 74 Years | 7 | 4.6% |
| 75 to 84 Years | 19 | 12.4% |
| 85 Years and Over | 4 | 2.6% |
| Total | 153 | 100.0% |
Housing Finances in Woodland
Median Income by Occupancy in Woodland
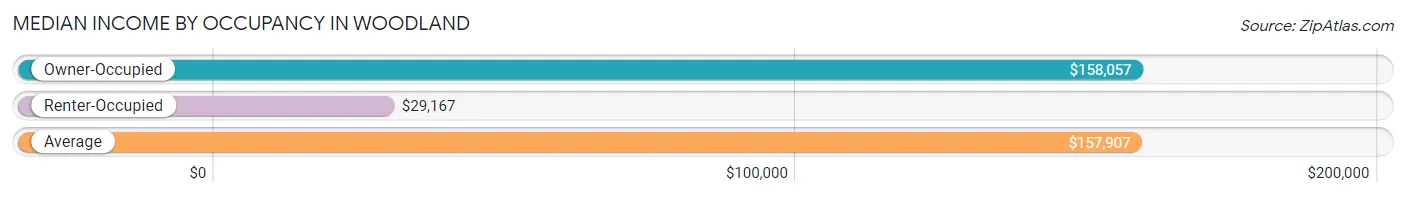
| Occupancy Type | # Households | Median Income |
| Owner-Occupied | 143 (93.5%) | $158,057 |
| Renter-Occupied | 10 (6.5%) | $29,167 |
| Average | 153 (100.0%) | $157,907 |
Occupancy by Householder Income Bracket in Woodland
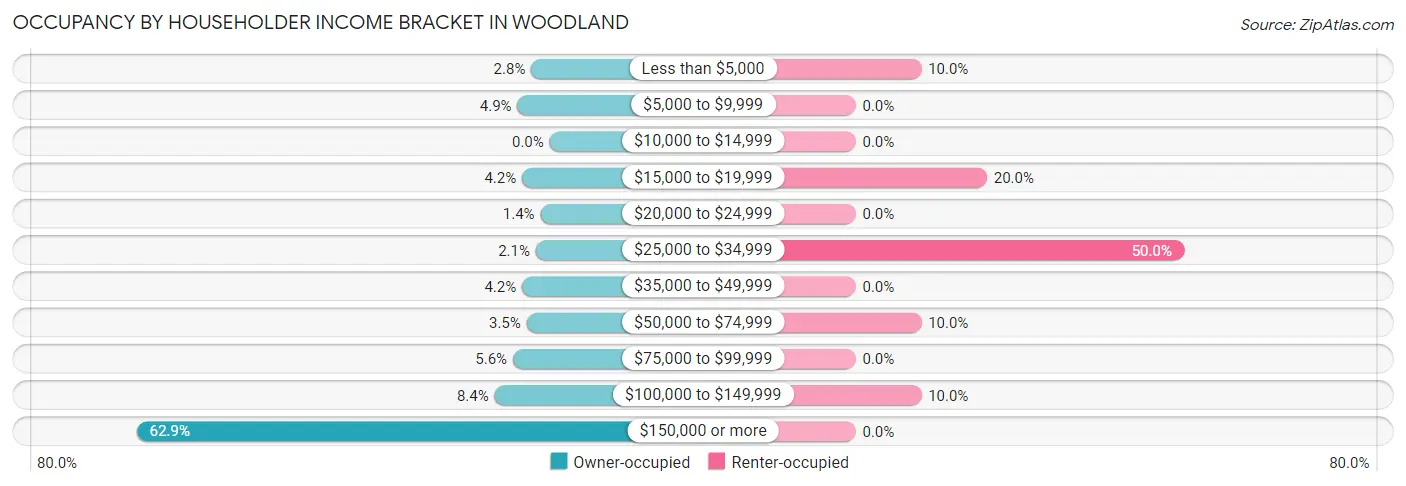
| Income Bracket | Owner-occupied | Renter-occupied |
| Less than $5,000 | 4 (2.8%) | 1 (10.0%) |
| $5,000 to $9,999 | 7 (4.9%) | 0 (0.0%) |
| $10,000 to $14,999 | 0 (0.0%) | 0 (0.0%) |
| $15,000 to $19,999 | 6 (4.2%) | 2 (20.0%) |
| $20,000 to $24,999 | 2 (1.4%) | 0 (0.0%) |
| $25,000 to $34,999 | 3 (2.1%) | 5 (50.0%) |
| $35,000 to $49,999 | 6 (4.2%) | 0 (0.0%) |
| $50,000 to $74,999 | 5 (3.5%) | 1 (10.0%) |
| $75,000 to $99,999 | 8 (5.6%) | 0 (0.0%) |
| $100,000 to $149,999 | 12 (8.4%) | 1 (10.0%) |
| $150,000 or more | 90 (62.9%) | 0 (0.0%) |
| Total | 143 (100.0%) | 10 (100.0%) |
Monthly Housing Cost Tiers in Woodland
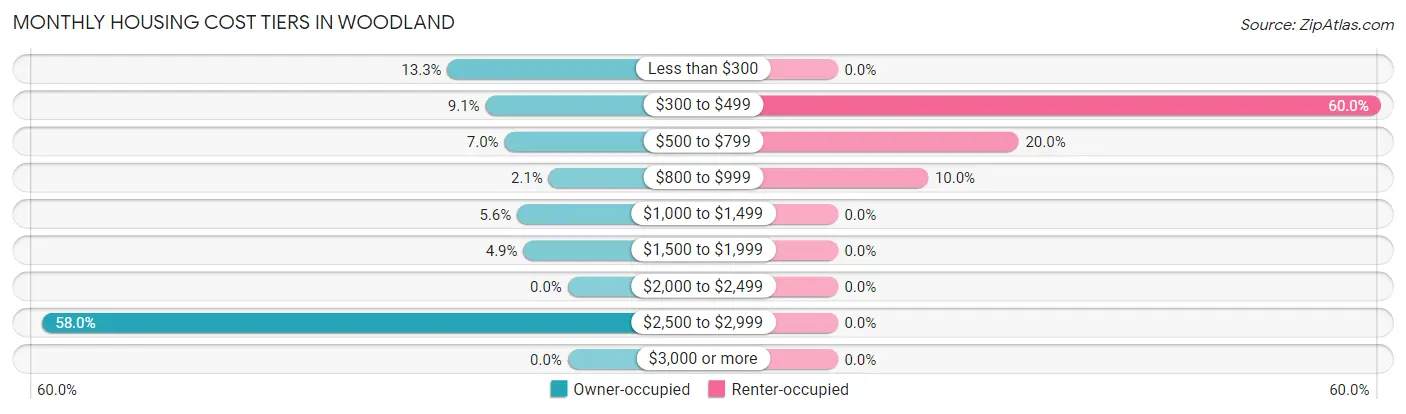
| Monthly Cost | Owner-occupied | Renter-occupied |
| Less than $300 | 19 (13.3%) | 0 (0.0%) |
| $300 to $499 | 13 (9.1%) | 6 (60.0%) |
| $500 to $799 | 10 (7.0%) | 2 (20.0%) |
| $800 to $999 | 3 (2.1%) | 1 (10.0%) |
| $1,000 to $1,499 | 8 (5.6%) | 0 (0.0%) |
| $1,500 to $1,999 | 7 (4.9%) | 0 (0.0%) |
| $2,000 to $2,499 | 0 (0.0%) | 0 (0.0%) |
| $2,500 to $2,999 | 83 (58.0%) | 0 (0.0%) |
| $3,000 or more | 0 (0.0%) | 0 (0.0%) |
| Total | 143 (100.0%) | 10 (100.0%) |
Physical Housing Characteristics in Woodland
Housing Structures in Woodland
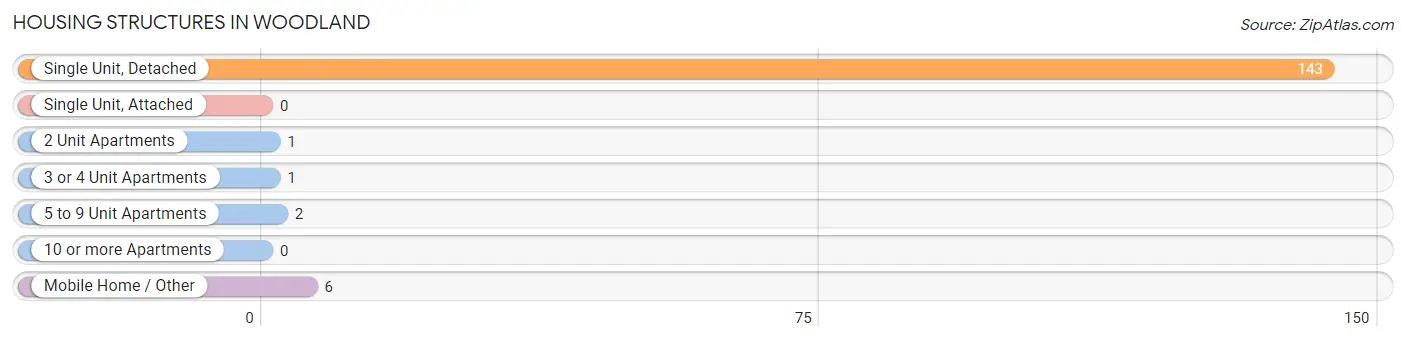
| Structure Type | # Housing Units | % Housing Units |
| Single Unit, Detached | 143 | 93.5% |
| Single Unit, Attached | 0 | 0.0% |
| 2 Unit Apartments | 1 | 0.6% |
| 3 or 4 Unit Apartments | 1 | 0.6% |
| 5 to 9 Unit Apartments | 2 | 1.3% |
| 10 or more Apartments | 0 | 0.0% |
| Mobile Home / Other | 6 | 3.9% |
| Total | 153 | 100.0% |
Housing Structures by Occupancy in Woodland
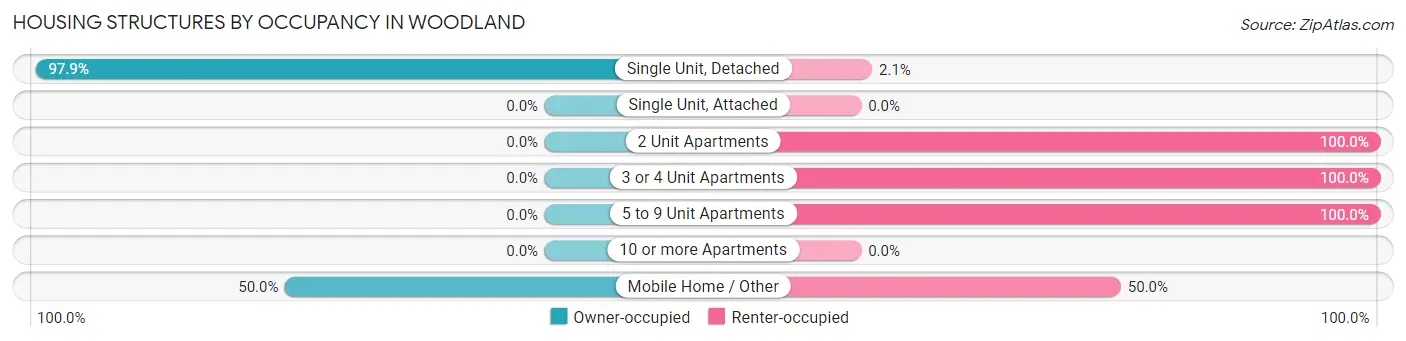
| Structure Type | Owner-occupied | Renter-occupied |
| Single Unit, Detached | 140 (97.9%) | 3 (2.1%) |
| Single Unit, Attached | 0 (0.0%) | 0 (0.0%) |
| 2 Unit Apartments | 0 (0.0%) | 1 (100.0%) |
| 3 or 4 Unit Apartments | 0 (0.0%) | 1 (100.0%) |
| 5 to 9 Unit Apartments | 0 (0.0%) | 2 (100.0%) |
| 10 or more Apartments | 0 (0.0%) | 0 (0.0%) |
| Mobile Home / Other | 3 (50.0%) | 3 (50.0%) |
| Total | 143 (93.5%) | 10 (6.5%) |
Housing Structures by Number of Rooms in Woodland
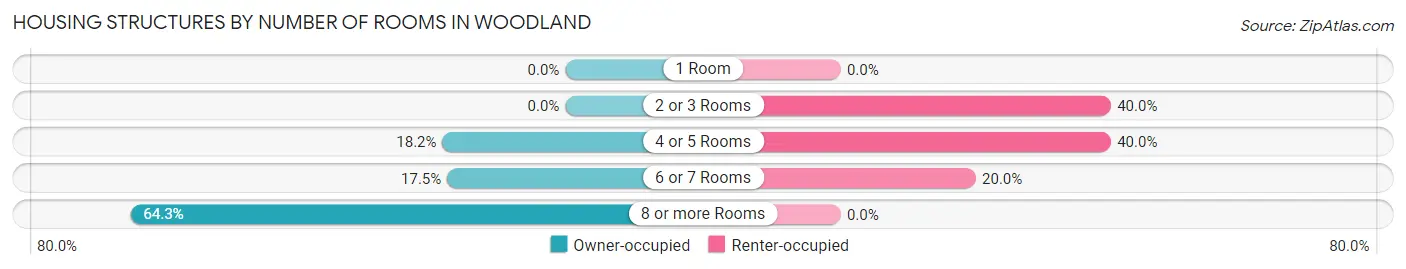
| Number of Rooms | Owner-occupied | Renter-occupied |
| 1 Room | 0 (0.0%) | 0 (0.0%) |
| 2 or 3 Rooms | 0 (0.0%) | 4 (40.0%) |
| 4 or 5 Rooms | 26 (18.2%) | 4 (40.0%) |
| 6 or 7 Rooms | 25 (17.5%) | 2 (20.0%) |
| 8 or more Rooms | 92 (64.3%) | 0 (0.0%) |
| Total | 143 (100.0%) | 10 (100.0%) |
Housing Structure by Heating Type in Woodland
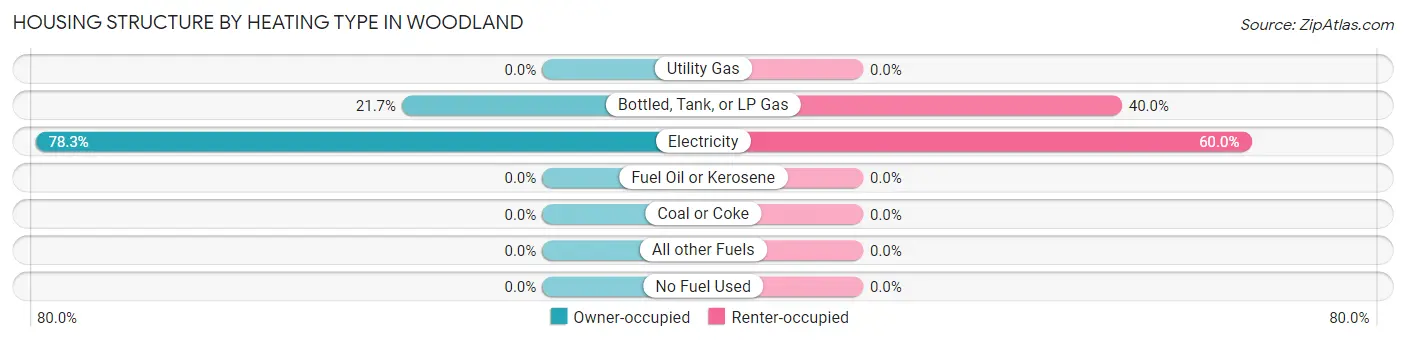
| Heating Type | Owner-occupied | Renter-occupied |
| Utility Gas | 0 (0.0%) | 0 (0.0%) |
| Bottled, Tank, or LP Gas | 31 (21.7%) | 4 (40.0%) |
| Electricity | 112 (78.3%) | 6 (60.0%) |
| Fuel Oil or Kerosene | 0 (0.0%) | 0 (0.0%) |
| Coal or Coke | 0 (0.0%) | 0 (0.0%) |
| All other Fuels | 0 (0.0%) | 0 (0.0%) |
| No Fuel Used | 0 (0.0%) | 0 (0.0%) |
| Total | 143 (100.0%) | 10 (100.0%) |
Household Vehicle Usage in Woodland
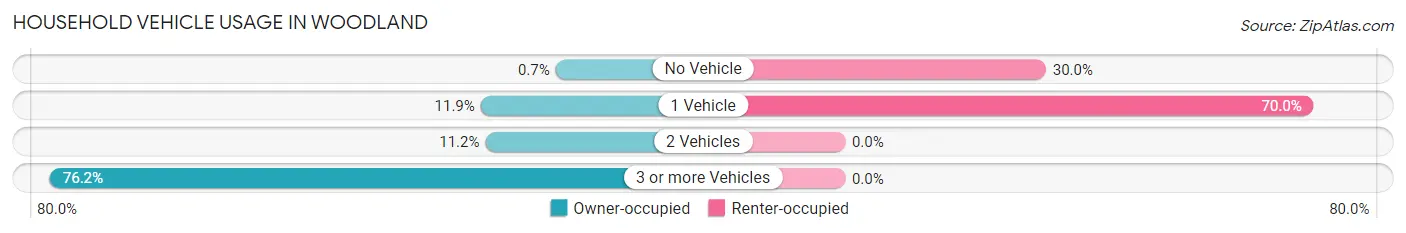
| Vehicles per Household | Owner-occupied | Renter-occupied |
| No Vehicle | 1 (0.7%) | 3 (30.0%) |
| 1 Vehicle | 17 (11.9%) | 7 (70.0%) |
| 2 Vehicles | 16 (11.2%) | 0 (0.0%) |
| 3 or more Vehicles | 109 (76.2%) | 0 (0.0%) |
| Total | 143 (100.0%) | 10 (100.0%) |
Real Estate & Mortgages in Woodland
Real Estate and Mortgage Overview in Woodland
| Characteristic | Without Mortgage | With Mortgage |
| Housing Units | 41 | 102 |
| Median Property Value | $124,000 | $438,600 |
| Median Household Income | - | - |
| Monthly Housing Costs | $338 | $0 |
| Real Estate Taxes | $638 | $0 |
Property Value by Mortgage Status in Woodland
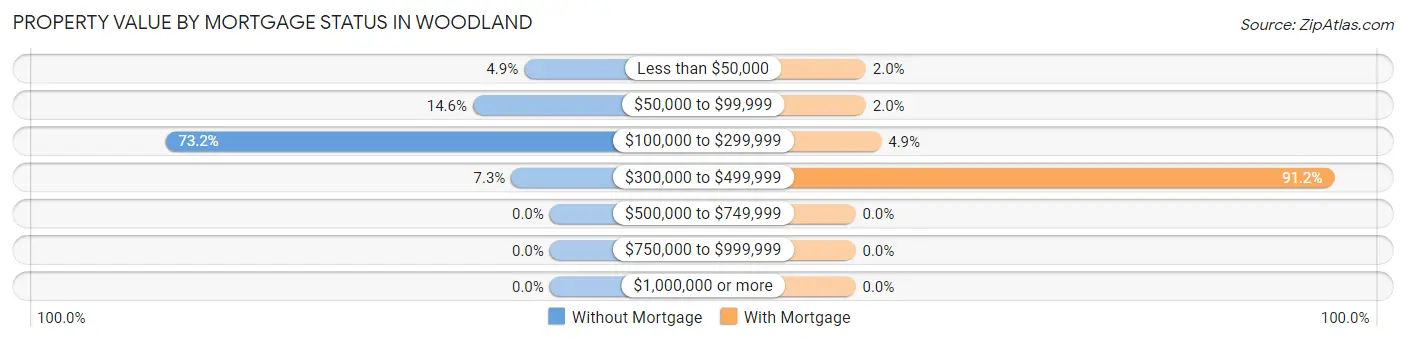
| Property Value | Without Mortgage | With Mortgage |
| Less than $50,000 | 2 (4.9%) | 2 (2.0%) |
| $50,000 to $99,999 | 6 (14.6%) | 2 (2.0%) |
| $100,000 to $299,999 | 30 (73.2%) | 5 (4.9%) |
| $300,000 to $499,999 | 3 (7.3%) | 93 (91.2%) |
| $500,000 to $749,999 | 0 (0.0%) | 0 (0.0%) |
| $750,000 to $999,999 | 0 (0.0%) | 0 (0.0%) |
| $1,000,000 or more | 0 (0.0%) | 0 (0.0%) |
| Total | 41 (100.0%) | 102 (100.0%) |
Household Income by Mortgage Status in Woodland
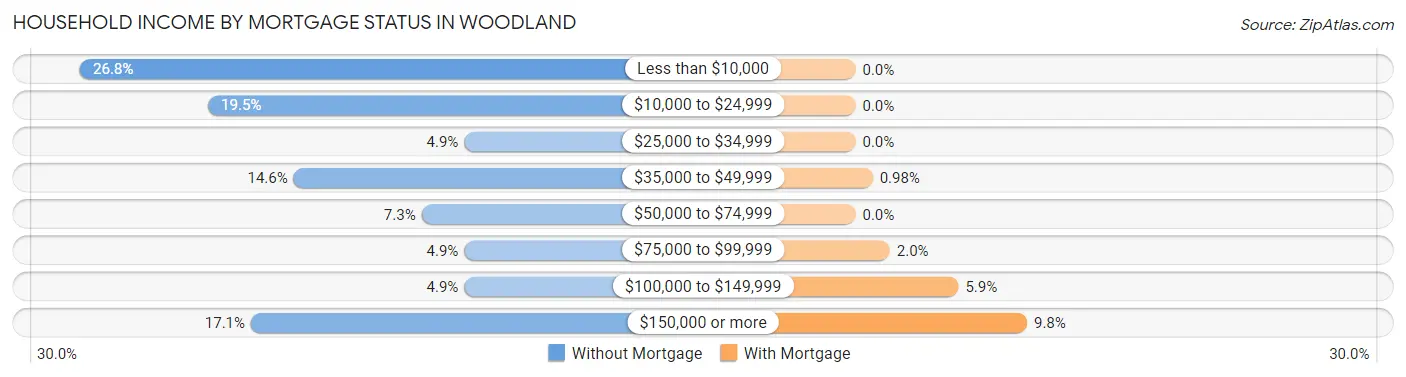
| Household Income | Without Mortgage | With Mortgage |
| Less than $10,000 | 11 (26.8%) | 0 (0.0%) |
| $10,000 to $24,999 | 8 (19.5%) | 0 (0.0%) |
| $25,000 to $34,999 | 2 (4.9%) | 0 (0.0%) |
| $35,000 to $49,999 | 6 (14.6%) | 1 (1.0%) |
| $50,000 to $74,999 | 3 (7.3%) | 0 (0.0%) |
| $75,000 to $99,999 | 2 (4.9%) | 2 (2.0%) |
| $100,000 to $149,999 | 2 (4.9%) | 6 (5.9%) |
| $150,000 or more | 7 (17.1%) | 10 (9.8%) |
| Total | 41 (100.0%) | 102 (100.0%) |
Property Value to Household Income Ratio in Woodland
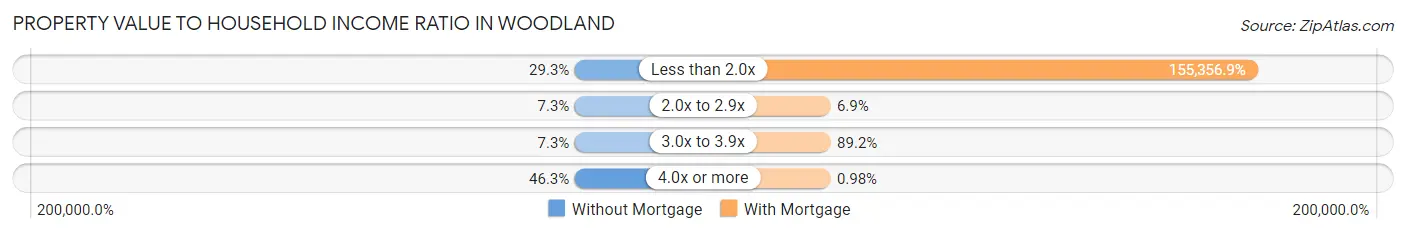
| Value-to-Income Ratio | Without Mortgage | With Mortgage |
| Less than 2.0x | 12 (29.3%) | 158,464 (155,356.9%) |
| 2.0x to 2.9x | 3 (7.3%) | 7 (6.9%) |
| 3.0x to 3.9x | 3 (7.3%) | 91 (89.2%) |
| 4.0x or more | 19 (46.3%) | 1 (1.0%) |
| Total | 41 (100.0%) | 102 (100.0%) |
Real Estate Taxes by Mortgage Status in Woodland
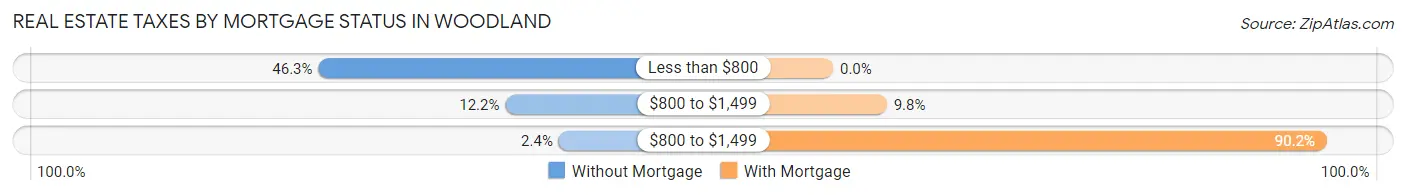
| Property Taxes | Without Mortgage | With Mortgage |
| Less than $800 | 19 (46.3%) | 0 (0.0%) |
| $800 to $1,499 | 5 (12.2%) | 10 (9.8%) |
| $800 to $1,499 | 1 (2.4%) | 92 (90.2%) |
| Total | 41 (100.0%) | 102 (100.0%) |
Health & Disability in Woodland
Health Insurance Coverage by Age in Woodland
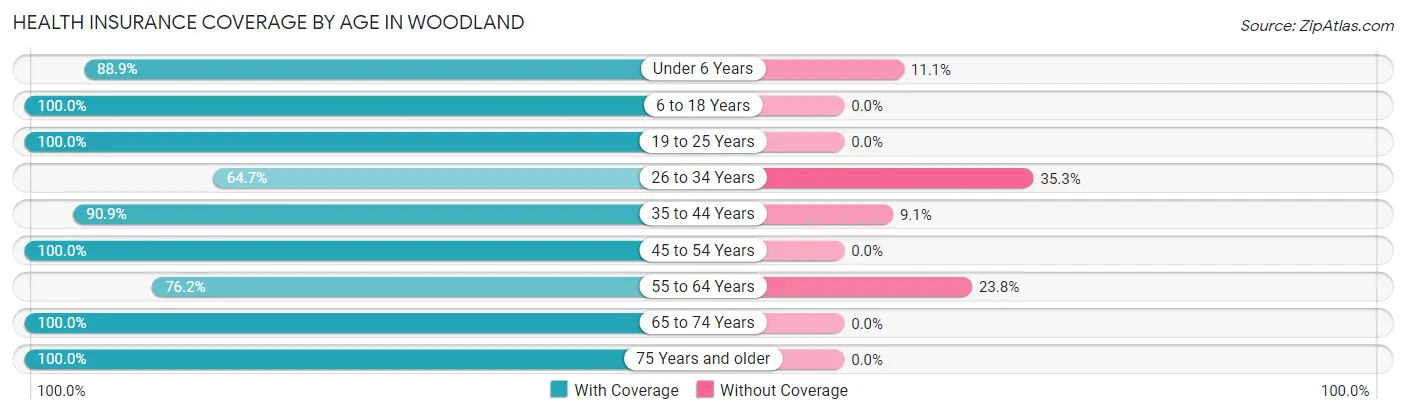
| Age Bracket | With Coverage | Without Coverage |
| Under 6 Years | 8 (88.9%) | 1 (11.1%) |
| 6 to 18 Years | 92 (100.0%) | 0 (0.0%) |
| 19 to 25 Years | 166 (100.0%) | 0 (0.0%) |
| 26 to 34 Years | 11 (64.7%) | 6 (35.3%) |
| 35 to 44 Years | 10 (90.9%) | 1 (9.1%) |
| 45 to 54 Years | 206 (100.0%) | 0 (0.0%) |
| 55 to 64 Years | 16 (76.2%) | 5 (23.8%) |
| 65 to 74 Years | 11 (100.0%) | 0 (0.0%) |
| 75 Years and older | 35 (100.0%) | 0 (0.0%) |
| Total | 555 (97.7%) | 13 (2.3%) |
Health Insurance Coverage by Citizenship Status in Woodland
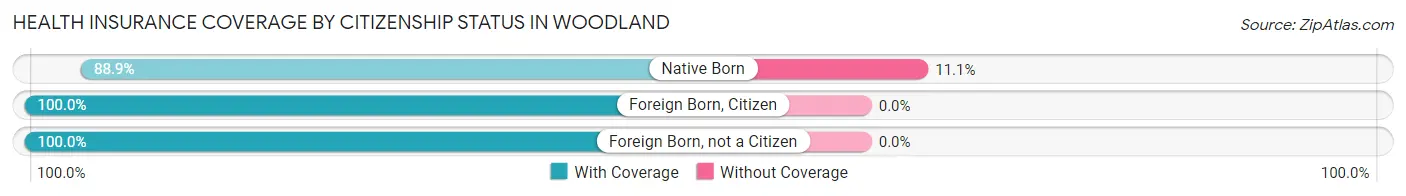
| Citizenship Status | With Coverage | Without Coverage |
| Native Born | 8 (88.9%) | 1 (11.1%) |
| Foreign Born, Citizen | 92 (100.0%) | 0 (0.0%) |
| Foreign Born, not a Citizen | 166 (100.0%) | 0 (0.0%) |
Health Insurance Coverage by Household Income in Woodland
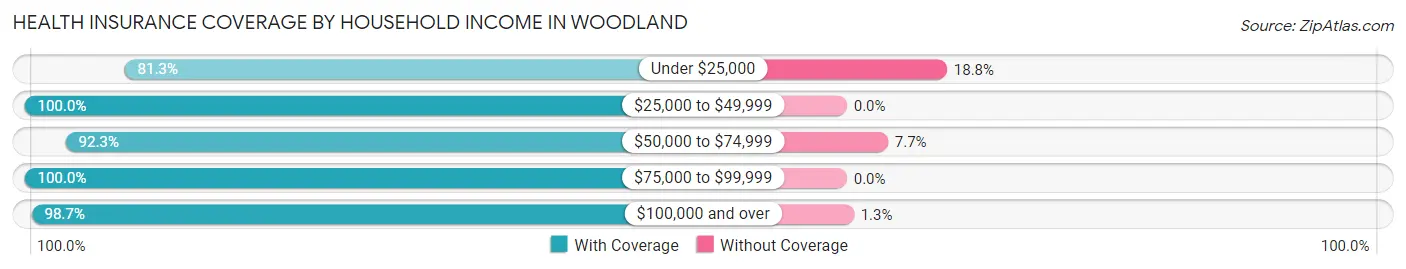
| Household Income | With Coverage | Without Coverage |
| Under $25,000 | 26 (81.2%) | 6 (18.8%) |
| $25,000 to $49,999 | 25 (100.0%) | 0 (0.0%) |
| $50,000 to $74,999 | 12 (92.3%) | 1 (7.7%) |
| $75,000 to $99,999 | 35 (100.0%) | 0 (0.0%) |
| $100,000 and over | 457 (98.7%) | 6 (1.3%) |
Public vs Private Health Insurance Coverage by Age in Woodland
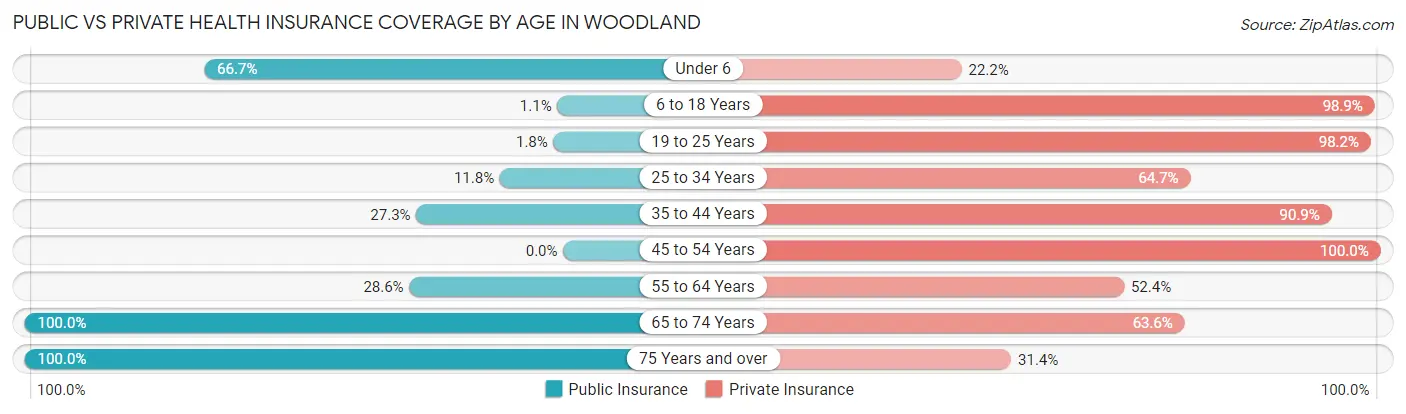
| Age Bracket | Public Insurance | Private Insurance |
| Under 6 | 6 (66.7%) | 2 (22.2%) |
| 6 to 18 Years | 1 (1.1%) | 91 (98.9%) |
| 19 to 25 Years | 3 (1.8%) | 163 (98.2%) |
| 25 to 34 Years | 2 (11.8%) | 11 (64.7%) |
| 35 to 44 Years | 3 (27.3%) | 10 (90.9%) |
| 45 to 54 Years | 0 (0.0%) | 206 (100.0%) |
| 55 to 64 Years | 6 (28.6%) | 11 (52.4%) |
| 65 to 74 Years | 11 (100.0%) | 7 (63.6%) |
| 75 Years and over | 35 (100.0%) | 11 (31.4%) |
| Total | 67 (11.8%) | 512 (90.1%) |
Disability Status by Sex by Age in Woodland
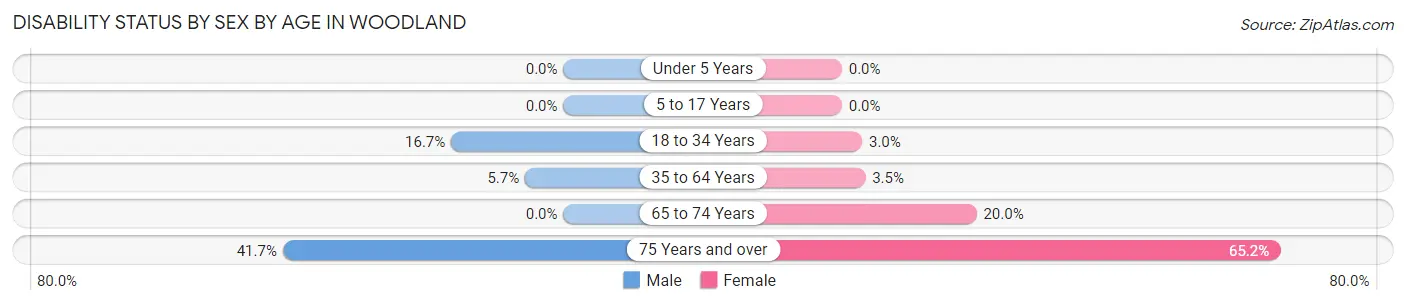
| Age Bracket | Male | Female |
| Under 5 Years | 0 (0.0%) | 0 (0.0%) |
| 5 to 17 Years | 0 (0.0%) | 0 (0.0%) |
| 18 to 34 Years | 3 (16.7%) | 5 (3.0%) |
| 35 to 64 Years | 7 (5.7%) | 4 (3.5%) |
| 65 to 74 Years | 0 (0.0%) | 1 (20.0%) |
| 75 Years and over | 5 (41.7%) | 15 (65.2%) |
Disability Class by Sex by Age in Woodland
Disability Class: Hearing Difficulty
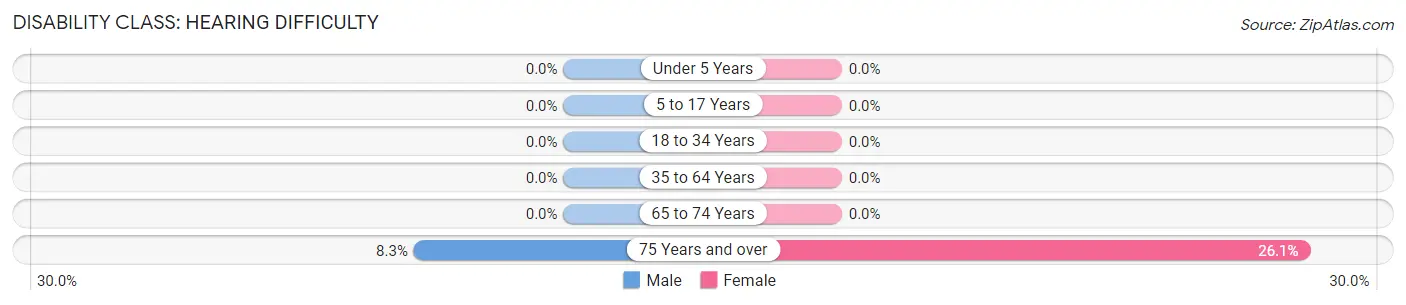
| Age Bracket | Male | Female |
| Under 5 Years | 0 (0.0%) | 0 (0.0%) |
| 5 to 17 Years | 0 (0.0%) | 0 (0.0%) |
| 18 to 34 Years | 0 (0.0%) | 0 (0.0%) |
| 35 to 64 Years | 0 (0.0%) | 0 (0.0%) |
| 65 to 74 Years | 0 (0.0%) | 0 (0.0%) |
| 75 Years and over | 1 (8.3%) | 6 (26.1%) |
Disability Class: Vision Difficulty
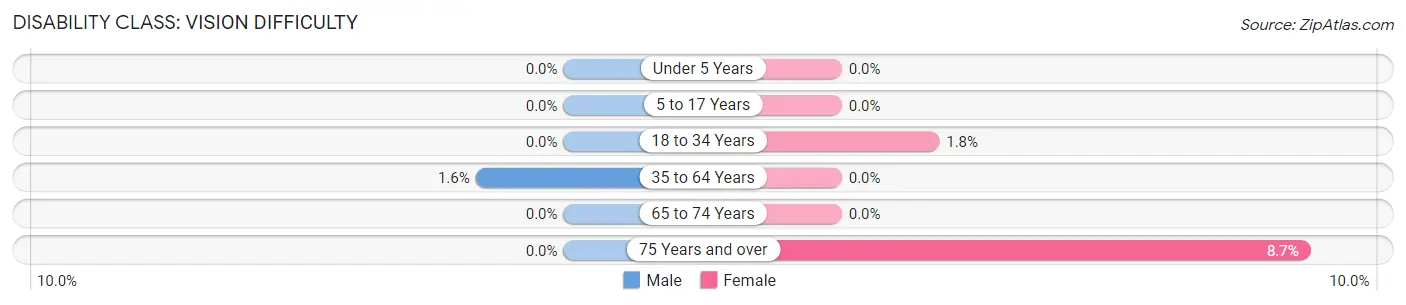
| Age Bracket | Male | Female |
| Under 5 Years | 0 (0.0%) | 0 (0.0%) |
| 5 to 17 Years | 0 (0.0%) | 0 (0.0%) |
| 18 to 34 Years | 0 (0.0%) | 3 (1.8%) |
| 35 to 64 Years | 2 (1.6%) | 0 (0.0%) |
| 65 to 74 Years | 0 (0.0%) | 0 (0.0%) |
| 75 Years and over | 0 (0.0%) | 2 (8.7%) |
Disability Class: Cognitive Difficulty
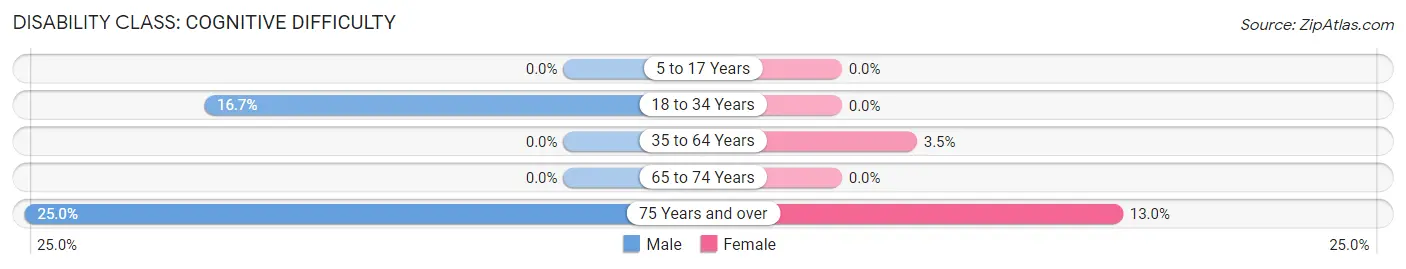
| Age Bracket | Male | Female |
| 5 to 17 Years | 0 (0.0%) | 0 (0.0%) |
| 18 to 34 Years | 3 (16.7%) | 0 (0.0%) |
| 35 to 64 Years | 0 (0.0%) | 4 (3.5%) |
| 65 to 74 Years | 0 (0.0%) | 0 (0.0%) |
| 75 Years and over | 3 (25.0%) | 3 (13.0%) |
Disability Class: Ambulatory Difficulty
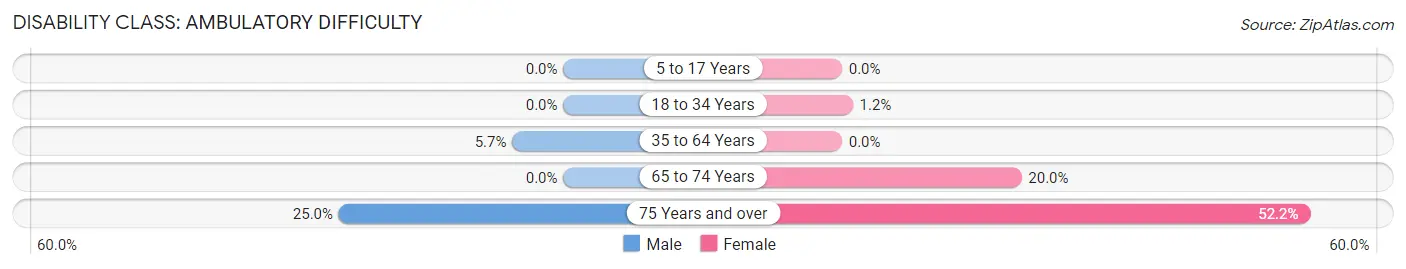
| Age Bracket | Male | Female |
| 5 to 17 Years | 0 (0.0%) | 0 (0.0%) |
| 18 to 34 Years | 0 (0.0%) | 2 (1.2%) |
| 35 to 64 Years | 7 (5.7%) | 0 (0.0%) |
| 65 to 74 Years | 0 (0.0%) | 1 (20.0%) |
| 75 Years and over | 3 (25.0%) | 12 (52.2%) |
Disability Class: Self-Care Difficulty
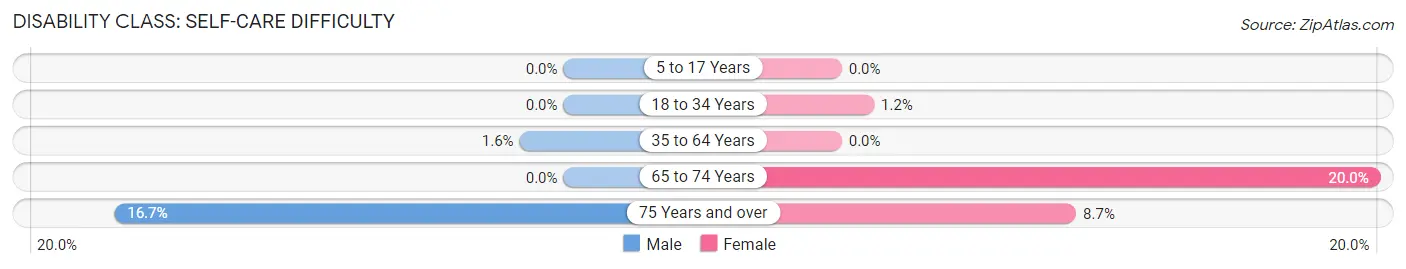
| Age Bracket | Male | Female |
| 5 to 17 Years | 0 (0.0%) | 0 (0.0%) |
| 18 to 34 Years | 0 (0.0%) | 2 (1.2%) |
| 35 to 64 Years | 2 (1.6%) | 0 (0.0%) |
| 65 to 74 Years | 0 (0.0%) | 1 (20.0%) |
| 75 Years and over | 2 (16.7%) | 2 (8.7%) |
Technology Access in Woodland
Computing Device Access in Woodland
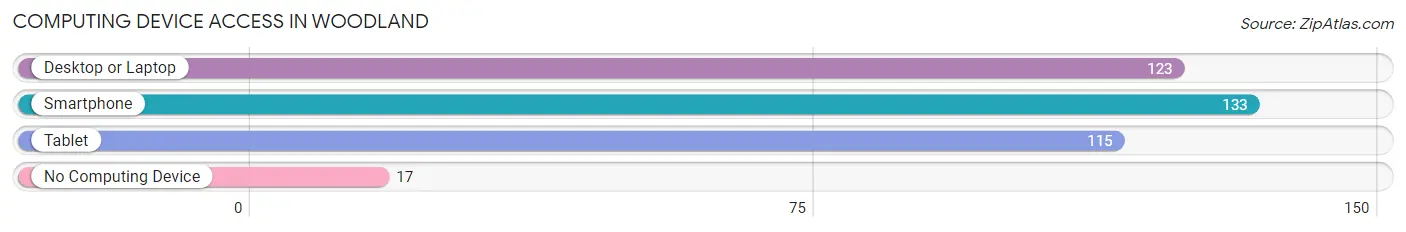
| Device Type | # Households | % Households |
| Desktop or Laptop | 123 | 80.4% |
| Smartphone | 133 | 86.9% |
| Tablet | 115 | 75.2% |
| No Computing Device | 17 | 11.1% |
| Total | 153 | 100.0% |
Internet Access in Woodland
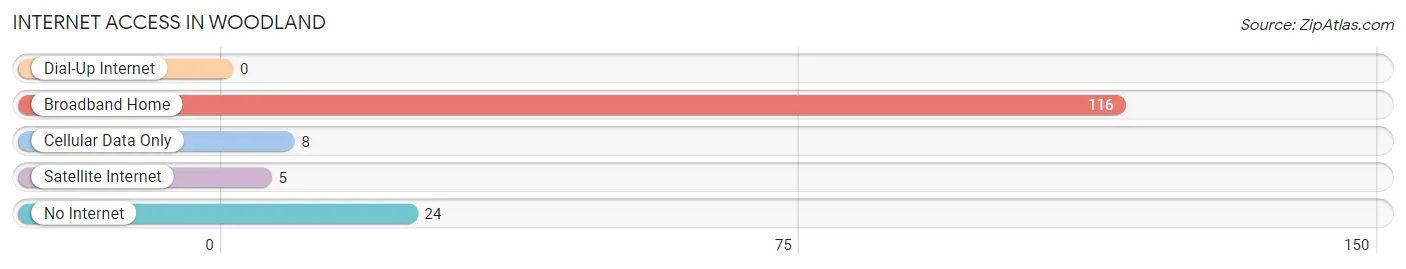
| Internet Type | # Households | % Households |
| Dial-Up Internet | 0 | 0.0% |
| Broadband Home | 116 | 75.8% |
| Cellular Data Only | 8 | 5.2% |
| Satellite Internet | 5 | 3.3% |
| No Internet | 24 | 15.7% |
| Total | 153 | 100.0% |
Woodland Summary
Woodland, Alabama is a small town located in the northwest corner of the state, in the foothills of the Appalachian Mountains. It is part of the Jackson County area and is situated along the banks of the Tombigbee River. The town was founded in 1819 and has a population of approximately 1,000 people.
Geography
Woodland is located in the northwest corner of Alabama, in the foothills of the Appalachian Mountains. It is situated along the banks of the Tombigbee River, which is a major tributary of the Mobile River. The town is surrounded by rolling hills and forests, and is located about 30 miles from the Tennessee border. The climate in Woodland is mild, with temperatures ranging from the mid-50s in the winter to the mid-80s in the summer.
Economy
Woodland’s economy is largely based on agriculture and forestry. The town is home to several farms, which produce a variety of crops, including corn, soybeans, cotton, and hay. The town also has several sawmills and lumber companies, which provide jobs for many of the town’s residents. In addition, there are several small businesses in the area, including restaurants, convenience stores, and gas stations.
Demographics
As of the 2010 census, Woodland had a population of 1,000 people. The racial makeup of the town was 97.2% White, 0.7% African American, 0.3% Native American, 0.2% Asian, and 1.6% from other races. The median household income was $30,000, and the median age was 40.
History
Woodland was founded in 1819 by settlers from Tennessee and Georgia. The town was originally known as “Woodland Station”, and was a stop on the stagecoach line between Nashville and Mobile. The town was officially incorporated in 1837, and the name was changed to Woodland. In the late 19th century, the town was a major center for the timber industry, and several sawmills and lumber companies were established in the area. In the early 20th century, the town began to decline, as the timber industry moved away and the population began to decline. However, in recent years, the town has seen a resurgence, as new businesses have moved into the area and the population has begun to grow again.
Common Questions
What is Per Capita Income in Woodland?
Per Capita income in Woodland is $33,216.
What is the Median Family Income in Woodland?
Median Family Income in Woodland is $158,283.
What is the Median Household income in Woodland?
Median Household Income in Woodland is $157,907.
What is Income or Wage Gap in Woodland?
Income or Wage Gap in Woodland is 81.6%.
Women in Woodland earn 18.4 cents for every dollar earned by a man.
What is Inequality or Gini Index in Woodland?
Inequality or Gini Index in Woodland is 0.27.
What is the Total Population of Woodland?
Total Population of Woodland is 568.
What is the Total Male Population of Woodland?
Total Male Population of Woodland is 254.
What is the Total Female Population of Woodland?
Total Female Population of Woodland is 314.
What is the Ratio of Males per 100 Females in Woodland?
There are 80.89 Males per 100 Females in Woodland.
What is the Ratio of Females per 100 Males in Woodland?
There are 123.62 Females per 100 Males in Woodland.
What is the Median Population Age in Woodland?
Median Population Age in Woodland is 35.0 Years.
What is the Average Family Size in Woodland
Average Family Size in Woodland is 4.2 People.
What is the Average Household Size in Woodland
Average Household Size in Woodland is 3.7 People.
How Large is the Labor Force in Woodland?
There are 247 People in the Labor Forcein in Woodland.
What is the Percentage of People in the Labor Force in Woodland?
52.8% of People are in the Labor Force in Woodland.
What is the Unemployment Rate in Woodland?
Unemployment Rate in Woodland is 2.8%.