Raleigh, FL Map & Demographics
Raleigh Map
Raleigh Overview
$18,429
PER CAPITA INCOME
$65,536
AVG FAMILY INCOME
$58,438
AVG HOUSEHOLD INCOME
38.8%
WAGE / INCOME GAP [ % ]
61.2¢/ $1
WAGE / INCOME GAP [ $ ]
0.30
INEQUALITY / GINI INDEX
838
TOTAL POPULATION
376
MALE POPULATION
462
FEMALE POPULATION
81.39
MALES / 100 FEMALES
122.87
FEMALES / 100 MALES
34.7
MEDIAN AGE
3.0
AVG FAMILY SIZE
2.6
AVG HOUSEHOLD SIZE
204
LABOR FORCE [ PEOPLE ]
36.0%
PERCENT IN LABOR FORCE
Income in Raleigh
Income Overview in Raleigh
Per Capita Income in Raleigh is $18,429, while median incomes of families and households are $65,536 and $58,438 respectively.
| Characteristic | Number | Measure |
| Per Capita Income | 838 | $18,429 |
| Median Family Income | 246 | $65,536 |
| Mean Family Income | 246 | $58,134 |
| Median Household Income | 321 | $58,438 |
| Mean Household Income | 321 | $50,470 |
| Income Deficit | 246 | $0 |
| Wage / Income Gap (%) | 838 | 38.80% |
| Wage / Income Gap ($) | 838 | 61.20¢ per $1 |
| Gini / Inequality Index | 838 | 0.30 |
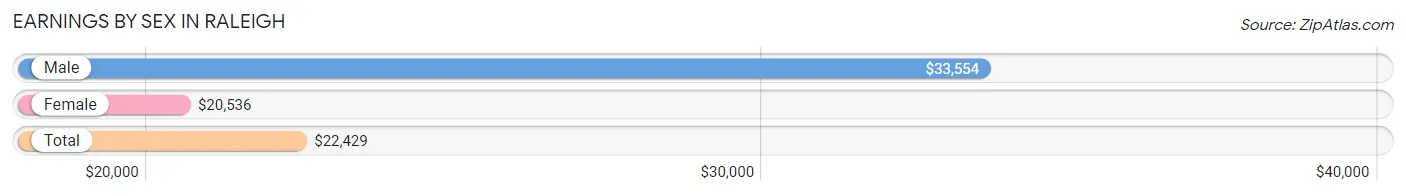
Earnings by Sex in Raleigh
Average Earnings in Raleigh are $22,429, $33,554 for men and $20,536 for women, a difference of 38.8%.
| Sex | Number | Average Earnings |
| Male | 85 (41.7%) | $33,554 |
| Female | 119 (58.3%) | $20,536 |
| Total | 204 (100.0%) | $22,429 |
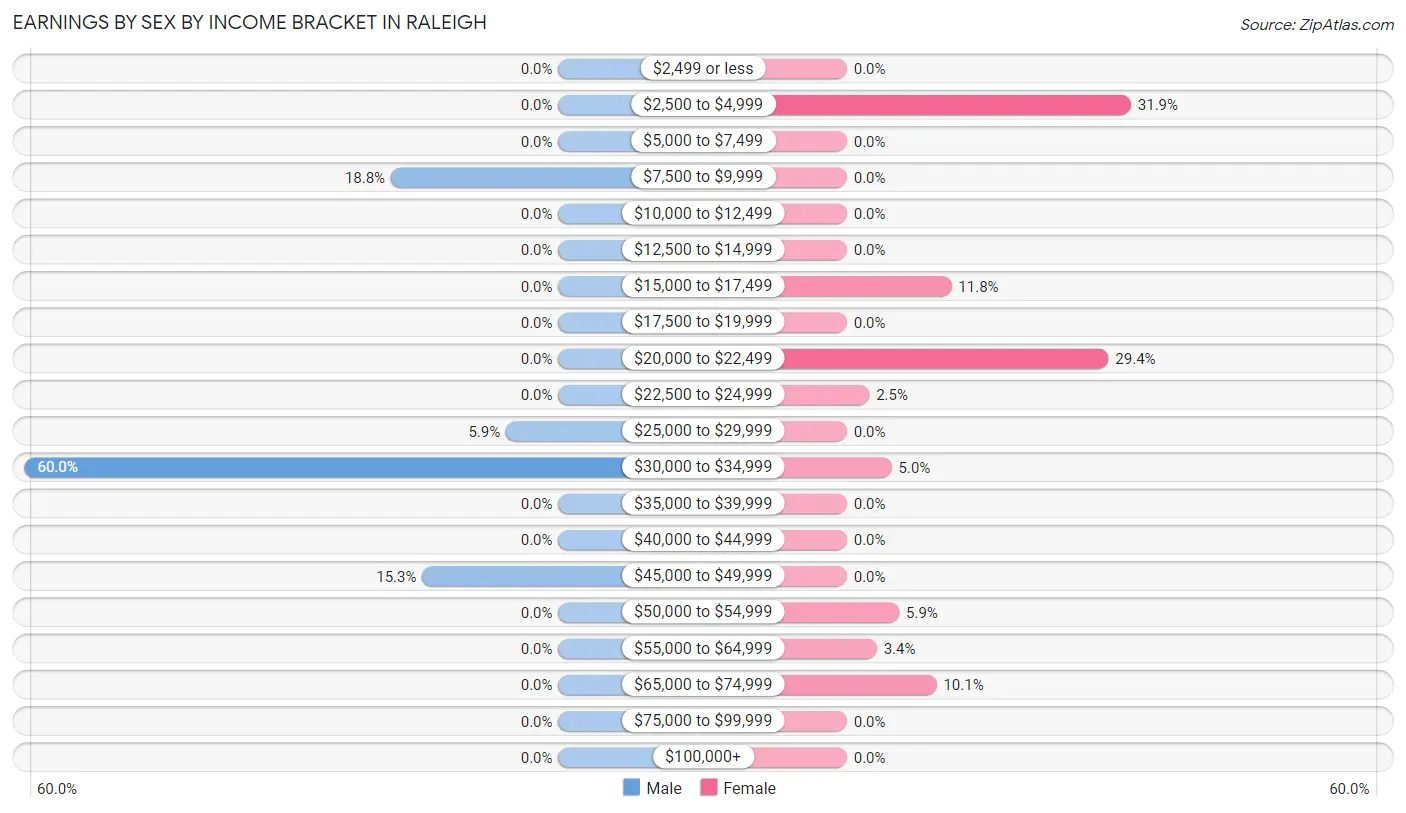
Earnings by Sex by Income Bracket in Raleigh
The most common earnings brackets in Raleigh are $30,000 to $34,999 for men (51 | 60.0%) and $2,500 to $4,999 for women (38 | 31.9%).
| Income | Male | Female |
| $2,499 or less | 0 (0.0%) | 0 (0.0%) |
| $2,500 to $4,999 | 0 (0.0%) | 38 (31.9%) |
| $5,000 to $7,499 | 0 (0.0%) | 0 (0.0%) |
| $7,500 to $9,999 | 16 (18.8%) | 0 (0.0%) |
| $10,000 to $12,499 | 0 (0.0%) | 0 (0.0%) |
| $12,500 to $14,999 | 0 (0.0%) | 0 (0.0%) |
| $15,000 to $17,499 | 0 (0.0%) | 14 (11.8%) |
| $17,500 to $19,999 | 0 (0.0%) | 0 (0.0%) |
| $20,000 to $22,499 | 0 (0.0%) | 35 (29.4%) |
| $22,500 to $24,999 | 0 (0.0%) | 3 (2.5%) |
| $25,000 to $29,999 | 5 (5.9%) | 0 (0.0%) |
| $30,000 to $34,999 | 51 (60.0%) | 6 (5.0%) |
| $35,000 to $39,999 | 0 (0.0%) | 0 (0.0%) |
| $40,000 to $44,999 | 0 (0.0%) | 0 (0.0%) |
| $45,000 to $49,999 | 13 (15.3%) | 0 (0.0%) |
| $50,000 to $54,999 | 0 (0.0%) | 7 (5.9%) |
| $55,000 to $64,999 | 0 (0.0%) | 4 (3.4%) |
| $65,000 to $74,999 | 0 (0.0%) | 12 (10.1%) |
| $75,000 to $99,999 | 0 (0.0%) | 0 (0.0%) |
| $100,000+ | 0 (0.0%) | 0 (0.0%) |
| Total | 85 (100.0%) | 119 (100.0%) |
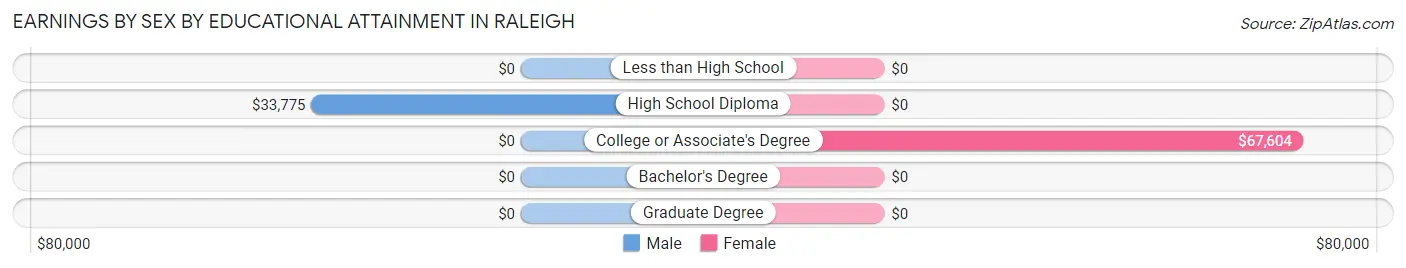
Earnings by Sex by Educational Attainment in Raleigh
Average earnings in Raleigh are $33,946 for men and $21,036 for women, a difference of 38.0%. Men with an educational attainment of high school diploma enjoy the highest average annual earnings of $33,775, while those with high school diploma education earn the least with $33,775. Women with an educational attainment of college or associate's degree earn the most with the average annual earnings of $67,604, while those with college or associate's degree education have the smallest earnings of $67,604.
| Educational Attainment | Male Income | Female Income |
| Less than High School | - | - |
| High School Diploma | $33,775 | $0 |
| College or Associate's Degree | - | - |
| Bachelor's Degree | - | - |
| Graduate Degree | - | - |
| Total | $33,946 | $21,036 |
Family Income in Raleigh
Family Income Brackets in Raleigh
According to the Raleigh family income data, there are 131 families falling into the $50,000 to $74,999 income range, which is the most common income bracket and makes up 53.2% of all families.
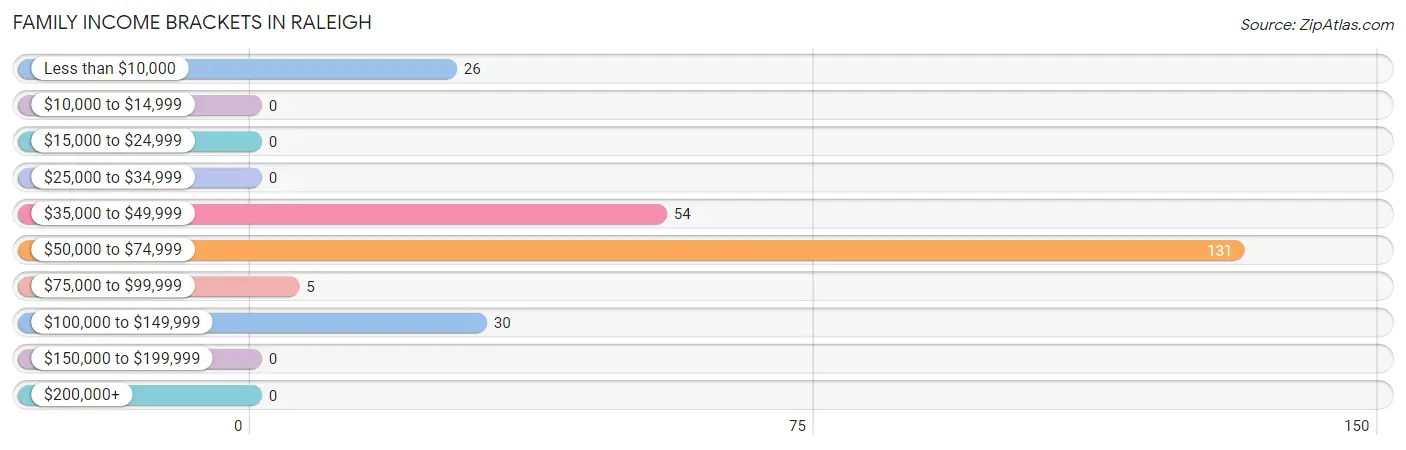
| Income Bracket | # Families | % Families |
| Less than $10,000 | 26 | 10.6% |
| $10,000 to $14,999 | 0 | 0.0% |
| $15,000 to $24,999 | 0 | 0.0% |
| $25,000 to $34,999 | 0 | 0.0% |
| $35,000 to $49,999 | 54 | 22.0% |
| $50,000 to $74,999 | 131 | 53.3% |
| $75,000 to $99,999 | 5 | 2.0% |
| $100,000 to $149,999 | 30 | 12.2% |
| $150,000 to $199,999 | 0 | 0.0% |
| $200,000+ | 0 | 0.0% |
Family Income by Famaliy Size in Raleigh
2-person families (158 | 64.2%) account for the highest median family income in Raleigh with $66,272 per family, while 2-person families (158 | 64.2%) have the highest median income of $33,136 per family member.
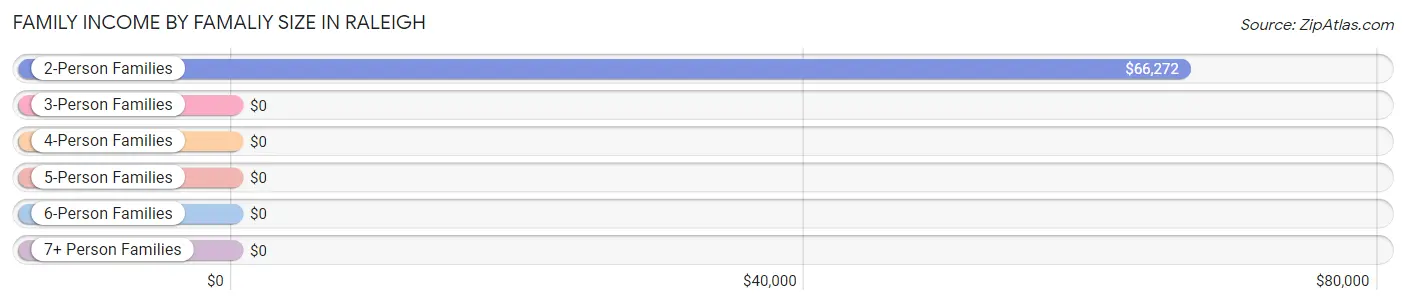
| Income Bracket | # Families | Median Income |
| 2-Person Families | 158 (64.2%) | $66,272 |
| 3-Person Families | 12 (4.9%) | $0 |
| 4-Person Families | 17 (6.9%) | $0 |
| 5-Person Families | 19 (7.7%) | $0 |
| 6-Person Families | 0 (0.0%) | $0 |
| 7+ Person Families | 40 (16.3%) | $0 |
| Total | 246 (100.0%) | $65,536 |
Family Income by Number of Earners in Raleigh
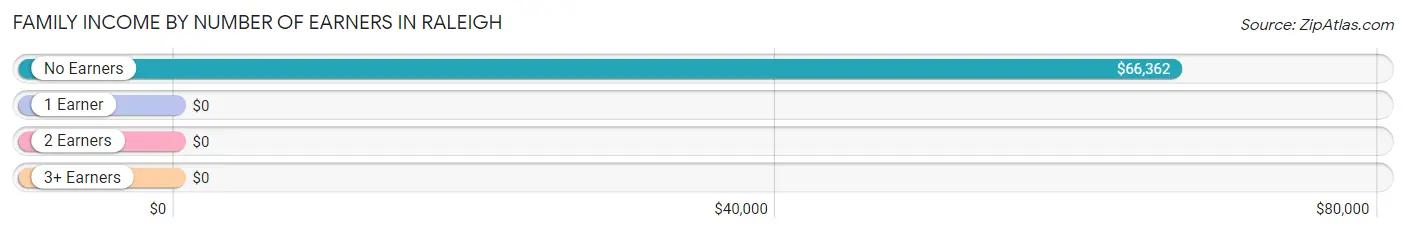
| Number of Earners | # Families | Median Income |
| No Earners | 150 (61.0%) | $66,362 |
| 1 Earner | 40 (16.3%) | $0 |
| 2 Earners | 56 (22.8%) | $0 |
| 3+ Earners | 0 (0.0%) | $0 |
| Total | 246 (100.0%) | $65,536 |
Household Income in Raleigh
Household Income Brackets in Raleigh
With 142 households falling in the category, the $50,000 to $74,999 income range is the most frequent in Raleigh, accounting for 44.2% of all households.
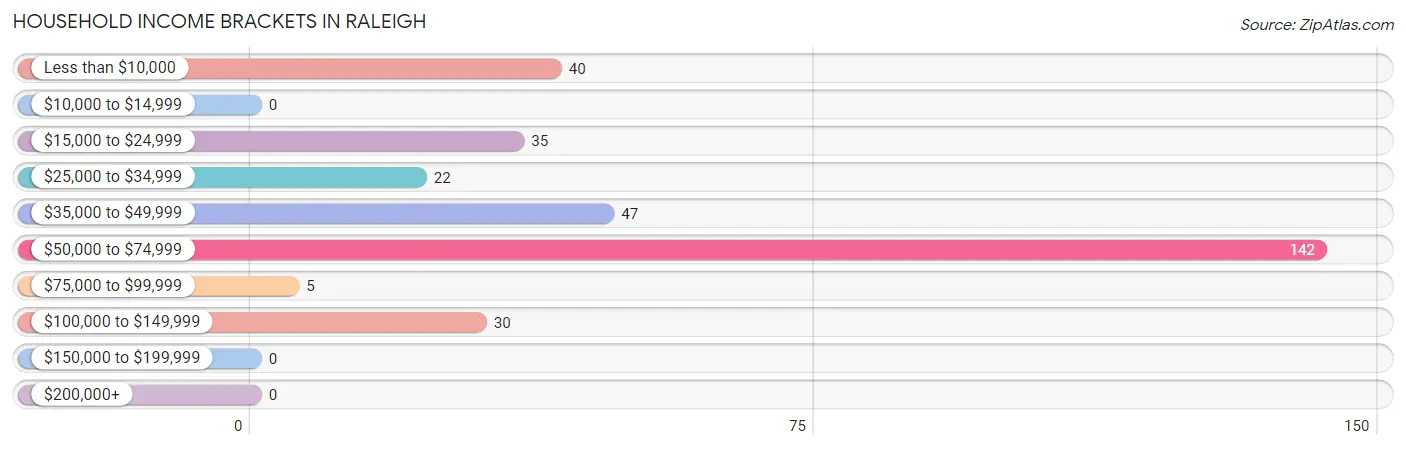
| Income Bracket | # Households | % Households |
| Less than $10,000 | 40 | 12.5% |
| $10,000 to $14,999 | 0 | 0.0% |
| $15,000 to $24,999 | 35 | 10.9% |
| $25,000 to $34,999 | 22 | 6.9% |
| $35,000 to $49,999 | 47 | 14.6% |
| $50,000 to $74,999 | 142 | 44.2% |
| $75,000 to $99,999 | 5 | 1.6% |
| $100,000 to $149,999 | 30 | 9.3% |
| $150,000 to $199,999 | 0 | 0.0% |
| $200,000+ | 0 | 0.0% |
Household Income by Householder Age in Raleigh
The median household income in Raleigh is $58,438, with the highest median household income of $66,038 found in the 65+ years age bracket for the primary householder. A total of 179 households (55.8%) fall into this category.
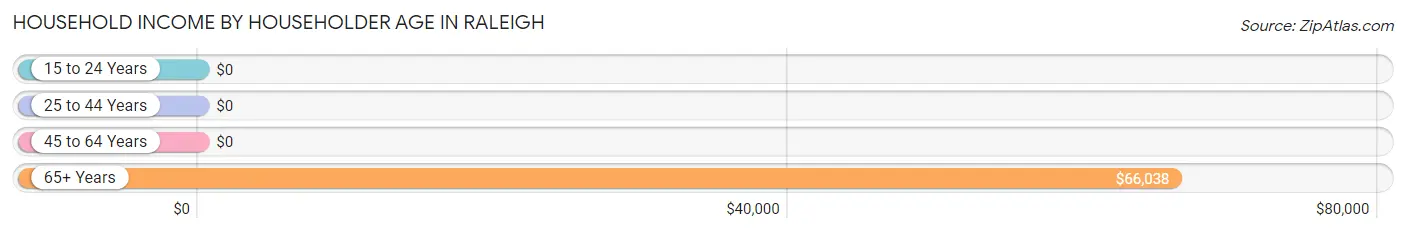
| Income Bracket | # Households | Median Income |
| 15 to 24 Years | 0 (0.0%) | $0 |
| 25 to 44 Years | 110 (34.3%) | $0 |
| 45 to 64 Years | 32 (10.0%) | $0 |
| 65+ Years | 179 (55.8%) | $66,038 |
| Total | 321 (100.0%) | $58,438 |
Poverty in Raleigh
Income Below Poverty by Sex and Age in Raleigh
With 38.6% poverty level for males and 50.2% for females among the residents of Raleigh, under 5 year old males and under 5 year old females are the most vulnerable to poverty, with 45 males (100.0%) and 39 females (90.7%) in their respective age groups living below the poverty level.
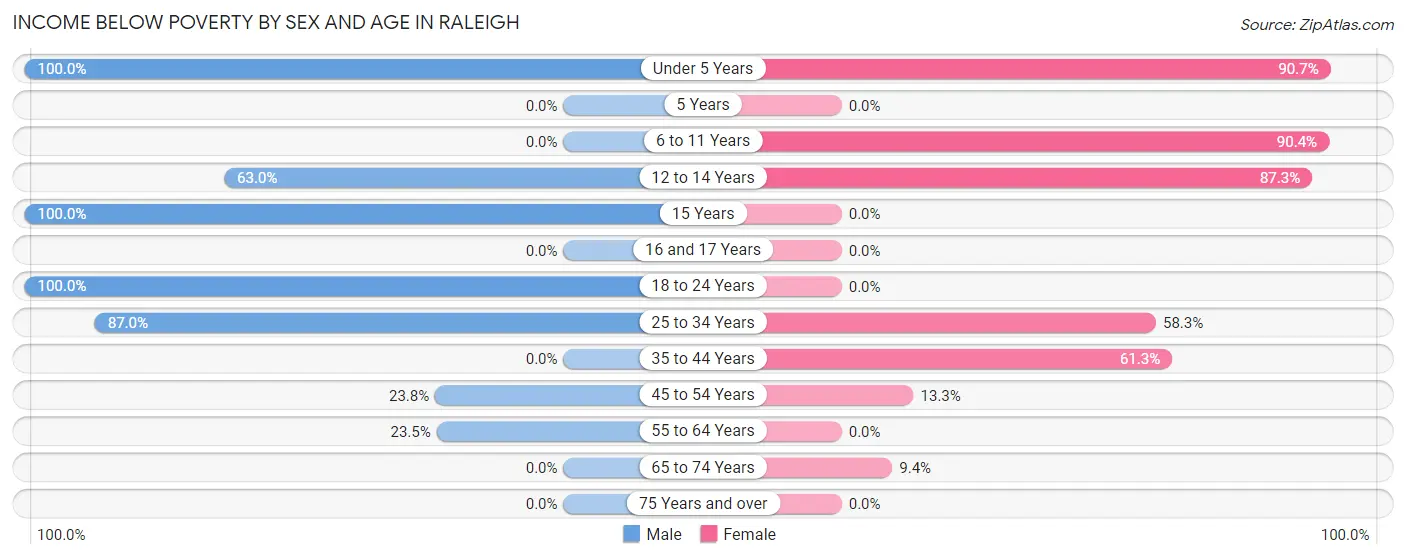
| Age Bracket | Male | Female |
| Under 5 Years | 45 (100.0%) | 39 (90.7%) |
| 5 Years | 0 (0.0%) | 0 (0.0%) |
| 6 to 11 Years | 0 (0.0%) | 66 (90.4%) |
| 12 to 14 Years | 17 (63.0%) | 48 (87.3%) |
| 15 Years | 18 (100.0%) | 0 (0.0%) |
| 16 and 17 Years | 0 (0.0%) | 0 (0.0%) |
| 18 to 24 Years | 16 (100.0%) | 0 (0.0%) |
| 25 to 34 Years | 40 (87.0%) | 49 (58.3%) |
| 35 to 44 Years | 0 (0.0%) | 19 (61.3%) |
| 45 to 54 Years | 5 (23.8%) | 2 (13.3%) |
| 55 to 64 Years | 4 (23.5%) | 0 (0.0%) |
| 65 to 74 Years | 0 (0.0%) | 9 (9.4%) |
| 75 Years and over | 0 (0.0%) | 0 (0.0%) |
| Total | 145 (38.6%) | 232 (50.2%) |
Income Above Poverty by Sex and Age in Raleigh
According to the poverty statistics in Raleigh, males aged 6 to 11 years and females aged 18 to 24 years are the age groups that are most secure financially, with 100.0% of males and 100.0% of females in these age groups living above the poverty line.
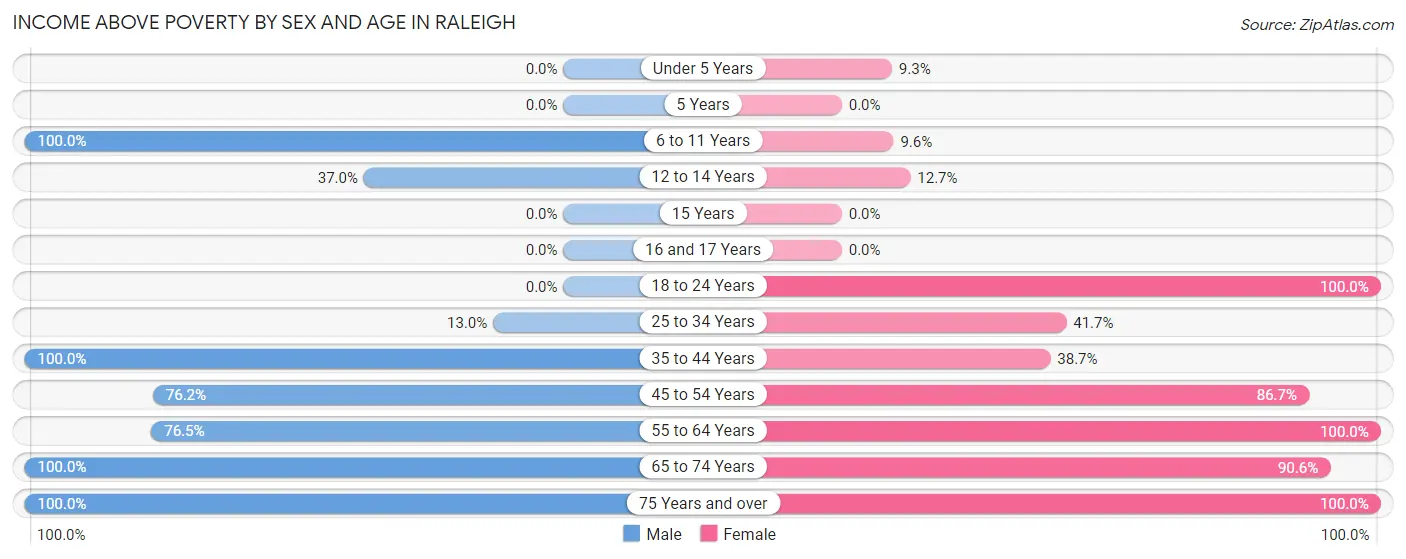
| Age Bracket | Male | Female |
| Under 5 Years | 0 (0.0%) | 4 (9.3%) |
| 5 Years | 0 (0.0%) | 0 (0.0%) |
| 6 to 11 Years | 10 (100.0%) | 7 (9.6%) |
| 12 to 14 Years | 10 (37.0%) | 7 (12.7%) |
| 15 Years | 0 (0.0%) | 0 (0.0%) |
| 16 and 17 Years | 0 (0.0%) | 0 (0.0%) |
| 18 to 24 Years | 0 (0.0%) | 14 (100.0%) |
| 25 to 34 Years | 6 (13.0%) | 35 (41.7%) |
| 35 to 44 Years | 7 (100.0%) | 12 (38.7%) |
| 45 to 54 Years | 16 (76.2%) | 13 (86.7%) |
| 55 to 64 Years | 13 (76.5%) | 14 (100.0%) |
| 65 to 74 Years | 31 (100.0%) | 87 (90.6%) |
| 75 Years and over | 138 (100.0%) | 37 (100.0%) |
| Total | 231 (61.4%) | 230 (49.8%) |
Income Below Poverty Among Married-Couple Families in Raleigh
The poverty statistics for married-couple families in Raleigh show that 21.4% or 44 of the total 206 families live below the poverty line. Families with 5 or more children have the highest poverty rate of 100.0%, comprising of 40 families. On the other hand, families with 1 or 2 children have the lowest poverty rate of 0.0%, which includes 0 families.
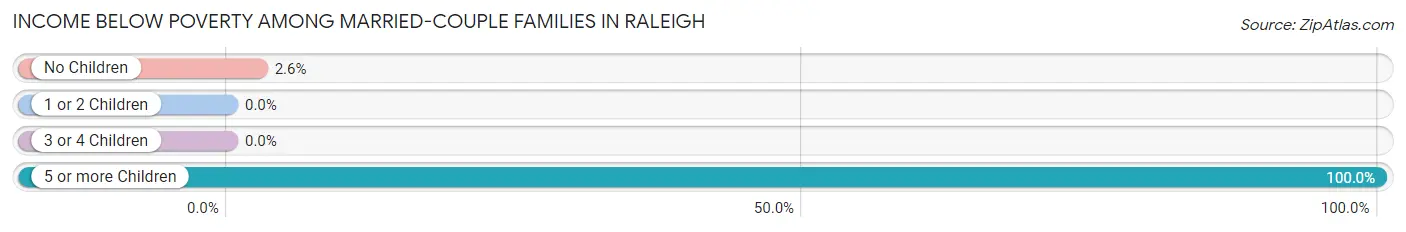
| Children | Above Poverty | Below Poverty |
| No Children | 151 (97.4%) | 4 (2.6%) |
| 1 or 2 Children | 11 (100.0%) | 0 (0.0%) |
| 3 or 4 Children | 0 (0.0%) | 0 (0.0%) |
| 5 or more Children | 0 (0.0%) | 40 (100.0%) |
| Total | 162 (78.6%) | 44 (21.4%) |
Income Below Poverty Among Single-Parent Households in Raleigh
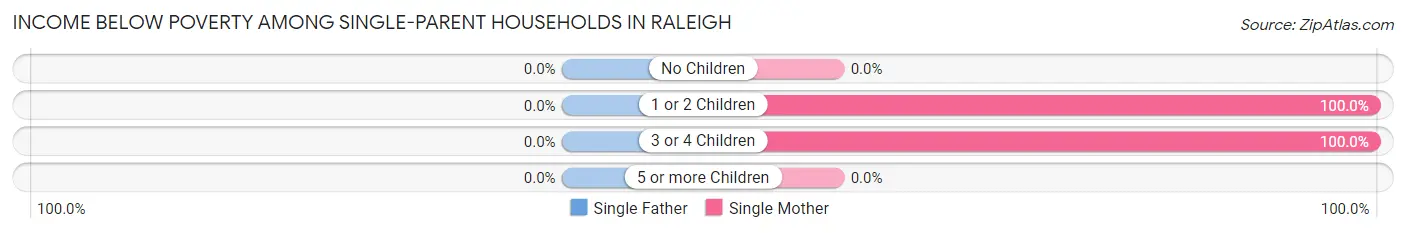
| Children | Single Father | Single Mother |
| No Children | 0 (0.0%) | 0 (0.0%) |
| 1 or 2 Children | 0 (0.0%) | 3 (100.0%) |
| 3 or 4 Children | 0 (0.0%) | 19 (100.0%) |
| 5 or more Children | 0 (0.0%) | 0 (0.0%) |
| Total | 0 (0.0%) | 22 (81.5%) |
Income Below Poverty Among Married-Couple vs Single-Parent Households in Raleigh
The poverty data for Raleigh shows that 44 of the married-couple family households (21.4%) and 22 of the single-parent households (55.0%) are living below the poverty level. Within the married-couple family households, those with 5 or more children have the highest poverty rate, with 40 households (100.0%) falling below the poverty line. Among the single-parent households, those with 3 or 4 children have the highest poverty rate, with 19 household (100.0%) living below poverty.
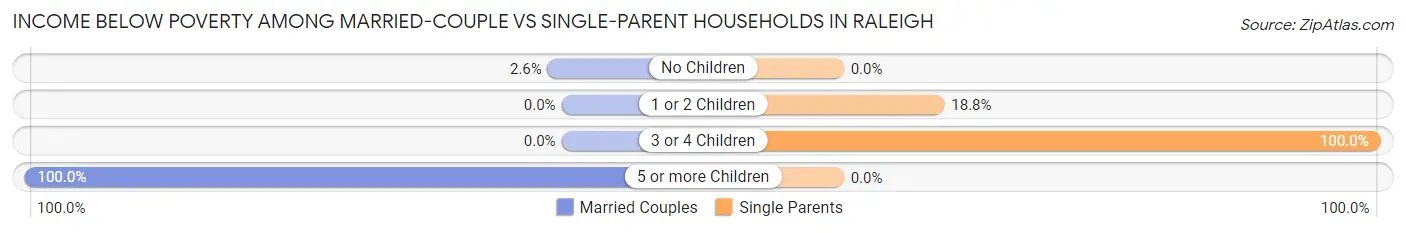
| Children | Married-Couple Families | Single-Parent Households |
| No Children | 4 (2.6%) | 0 (0.0%) |
| 1 or 2 Children | 0 (0.0%) | 3 (18.8%) |
| 3 or 4 Children | 0 (0.0%) | 19 (100.0%) |
| 5 or more Children | 40 (100.0%) | 0 (0.0%) |
| Total | 44 (21.4%) | 22 (55.0%) |
Race in Raleigh
The most populous races in Raleigh are White / Caucasian (576 | 68.7%), Black / African American (219 | 26.1%), and Hispanic or Latino (26 | 3.1%).
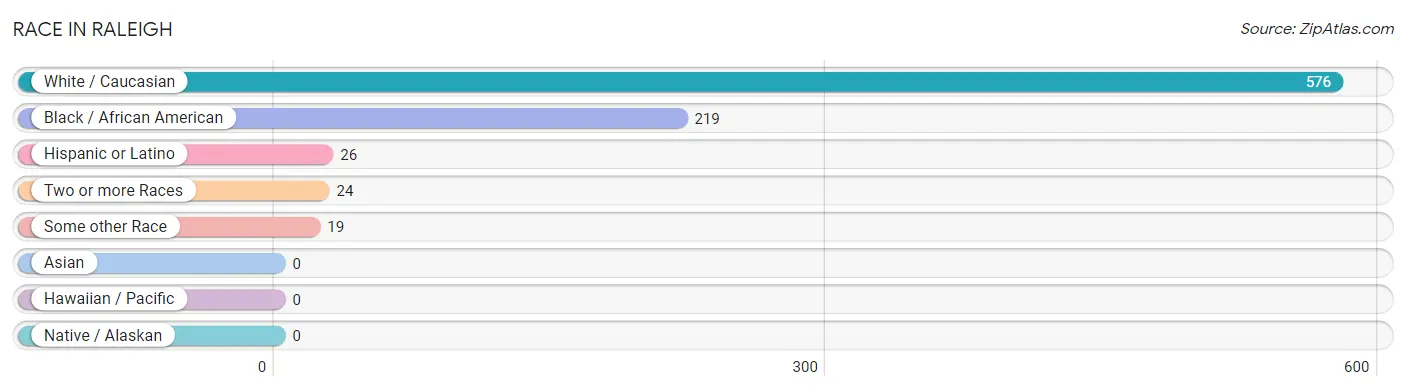
| Race | # Population | % Population |
| Asian | 0 | 0.0% |
| Black / African American | 219 | 26.1% |
| Hawaiian / Pacific | 0 | 0.0% |
| Hispanic or Latino | 26 | 3.1% |
| Native / Alaskan | 0 | 0.0% |
| White / Caucasian | 576 | 68.7% |
| Two or more Races | 24 | 2.9% |
| Some other Race | 19 | 2.3% |
| Total | 838 | 100.0% |
Ancestry in Raleigh
The most populous ancestries reported in Raleigh are English (46 | 5.5%), Mexican (20 | 2.4%), Belizean (11 | 1.3%), Irish (11 | 1.3%), and Italian (11 | 1.3%), together accounting for 11.8% of all Raleigh residents.
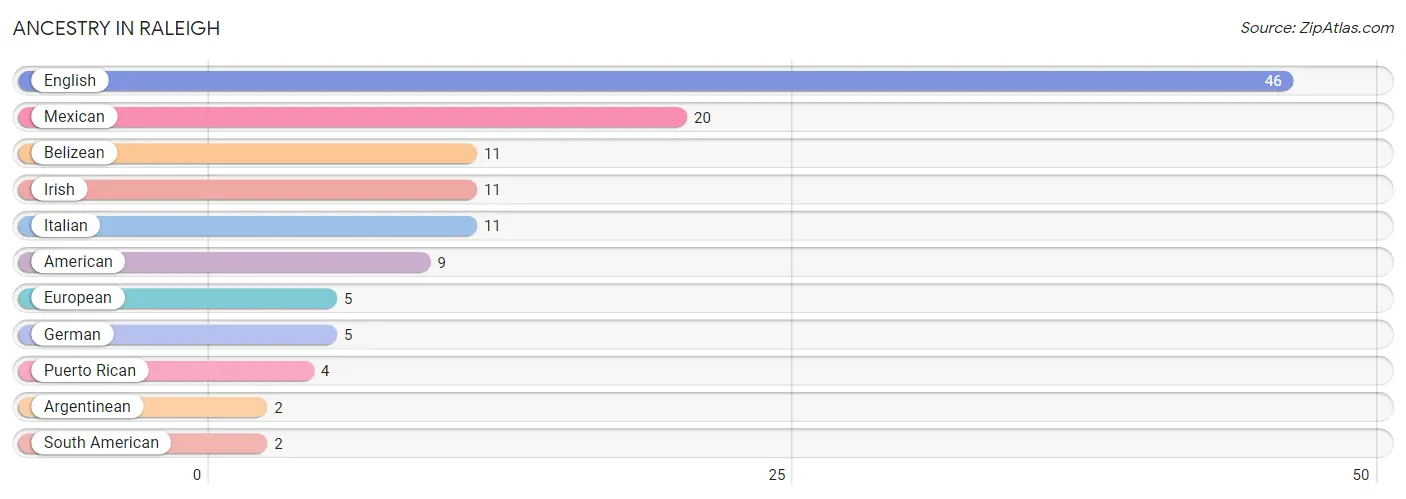
| Ancestry | # Population | % Population |
| American | 9 | 1.1% |
| Argentinean | 2 | 0.2% |
| Belizean | 11 | 1.3% |
| English | 46 | 5.5% |
| European | 5 | 0.6% |
| German | 5 | 0.6% |
| Irish | 11 | 1.3% |
| Italian | 11 | 1.3% |
| Mexican | 20 | 2.4% |
| Puerto Rican | 4 | 0.5% |
| South American | 2 | 0.2% | View All 11 Rows |
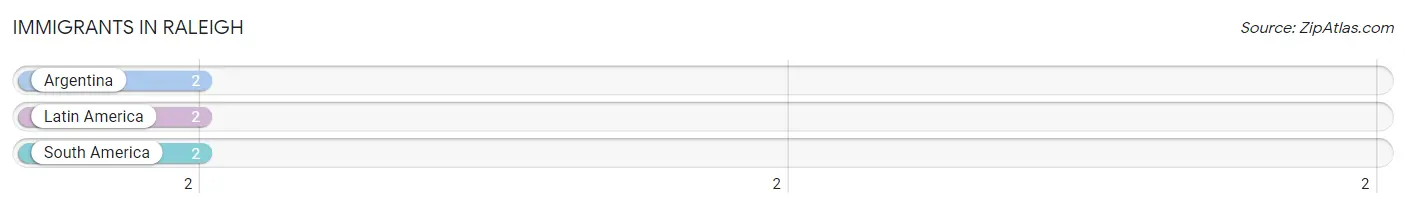
Immigrants in Raleigh
The most numerous immigrant groups reported in Raleigh came from Argentina (2 | 0.2%), Latin America (2 | 0.2%), and South America (2 | 0.2%), together accounting for 0.7% of all Raleigh residents.
| Immigration Origin | # Population | % Population |
| Argentina | 2 | 0.2% |
| Latin America | 2 | 0.2% |
| South America | 2 | 0.2% | View All 3 Rows |
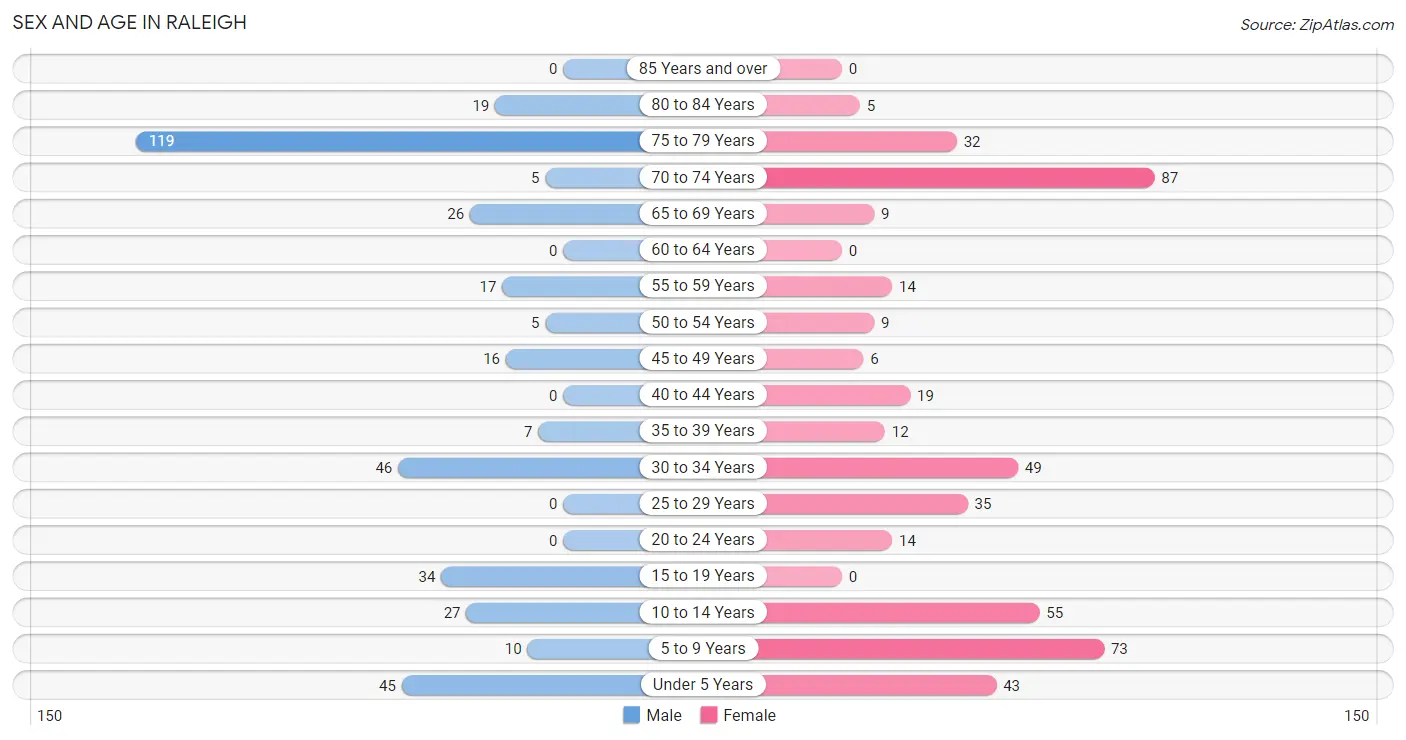
Sex and Age in Raleigh
Sex and Age in Raleigh
The most populous age groups in Raleigh are 75 to 79 Years (119 | 31.7%) for men and 70 to 74 Years (87 | 18.8%) for women.
| Age Bracket | Male | Female |
| Under 5 Years | 45 (12.0%) | 43 (9.3%) |
| 5 to 9 Years | 10 (2.7%) | 73 (15.8%) |
| 10 to 14 Years | 27 (7.2%) | 55 (11.9%) |
| 15 to 19 Years | 34 (9.0%) | 0 (0.0%) |
| 20 to 24 Years | 0 (0.0%) | 14 (3.0%) |
| 25 to 29 Years | 0 (0.0%) | 35 (7.6%) |
| 30 to 34 Years | 46 (12.2%) | 49 (10.6%) |
| 35 to 39 Years | 7 (1.9%) | 12 (2.6%) |
| 40 to 44 Years | 0 (0.0%) | 19 (4.1%) |
| 45 to 49 Years | 16 (4.3%) | 6 (1.3%) |
| 50 to 54 Years | 5 (1.3%) | 9 (1.9%) |
| 55 to 59 Years | 17 (4.5%) | 14 (3.0%) |
| 60 to 64 Years | 0 (0.0%) | 0 (0.0%) |
| 65 to 69 Years | 26 (6.9%) | 9 (1.9%) |
| 70 to 74 Years | 5 (1.3%) | 87 (18.8%) |
| 75 to 79 Years | 119 (31.7%) | 32 (6.9%) |
| 80 to 84 Years | 19 (5.1%) | 5 (1.1%) |
| 85 Years and over | 0 (0.0%) | 0 (0.0%) |
| Total | 376 (100.0%) | 462 (100.0%) |
Families and Households in Raleigh
Median Family Size in Raleigh
The median family size in Raleigh is 3.01 persons per family, with single female/mother families (27 | 11.0%) accounting for the largest median family size of 4.04 persons per family. On the other hand, married-couple families (206 | 83.7%) represent the smallest median family size with 2.84 persons per family.
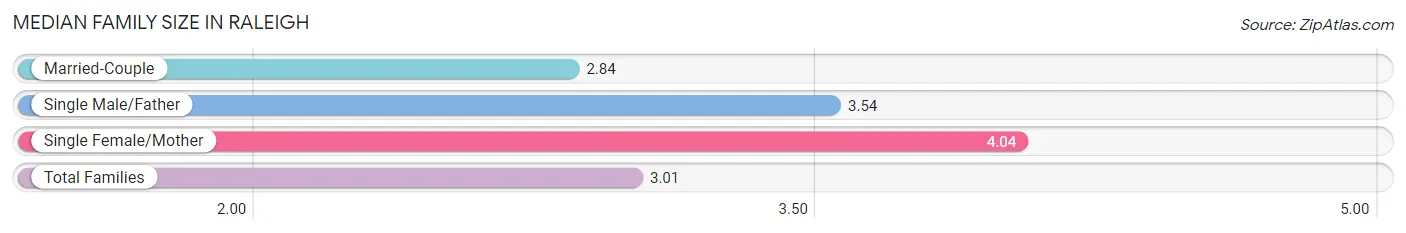
| Family Type | # Families | Family Size |
| Married-Couple | 206 (83.7%) | 2.84 |
| Single Male/Father | 13 (5.3%) | 3.54 |
| Single Female/Mother | 27 (11.0%) | 4.04 |
| Total Families | 246 (100.0%) | 3.01 |
Median Household Size in Raleigh
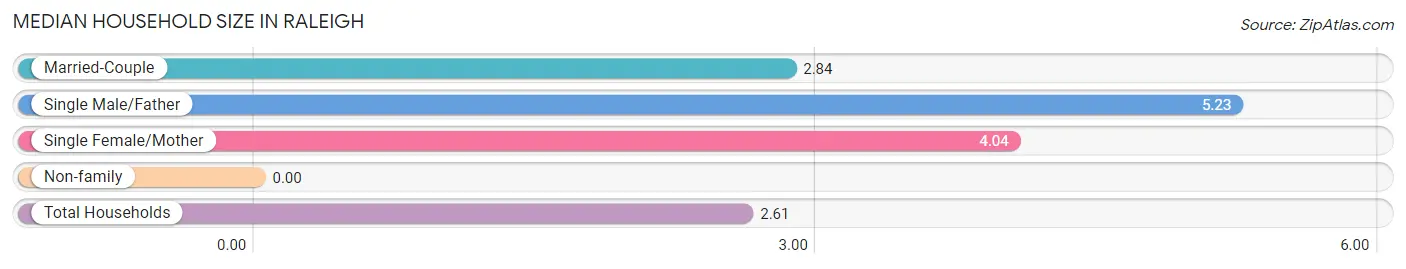
| Household Type | # Households | Household Size |
| Married-Couple | 206 (64.2%) | 2.84 |
| Single Male/Father | 13 (4.1%) | 5.23 |
| Single Female/Mother | 27 (8.4%) | 4.04 |
| Non-family | 75 (23.4%) | - |
| Total Households | 321 (100.0%) | 2.61 |
Household Size by Marriage Status in Raleigh
Out of a total of 321 households in Raleigh, 246 (76.6%) are family households, while 75 (23.4%) are nonfamily households. The most numerous type of family households are 2-person households, comprising 158, and the most common type of nonfamily households are 1-person households, comprising 75.
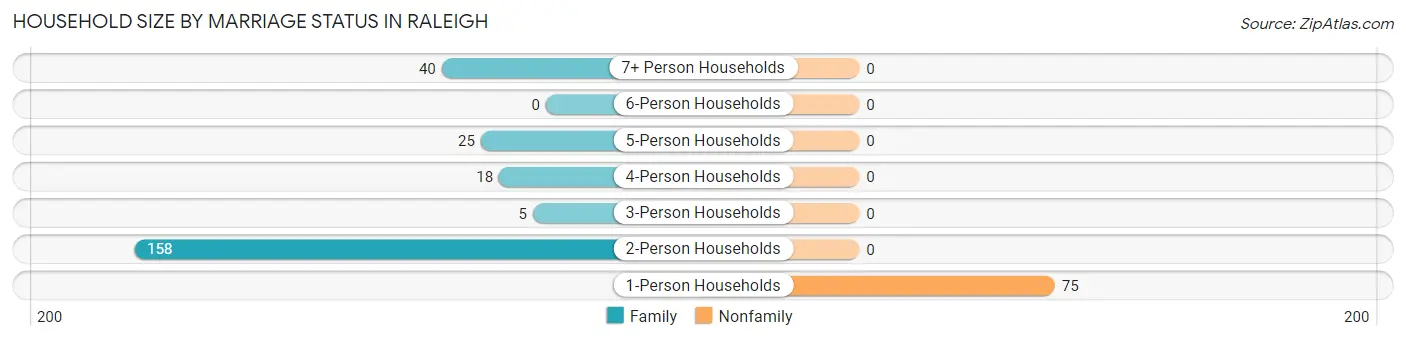
| Household Size | Family Households | Nonfamily Households |
| 1-Person Households | - | 75 (23.4%) |
| 2-Person Households | 158 (49.2%) | 0 (0.0%) |
| 3-Person Households | 5 (1.6%) | 0 (0.0%) |
| 4-Person Households | 18 (5.6%) | 0 (0.0%) |
| 5-Person Households | 25 (7.8%) | 0 (0.0%) |
| 6-Person Households | 0 (0.0%) | 0 (0.0%) |
| 7+ Person Households | 40 (12.5%) | 0 (0.0%) |
| Total | 246 (76.6%) | 75 (23.4%) |
Female Fertility in Raleigh
Fertility by Age in Raleigh
Average fertility rate in Raleigh is 285.0 births per 1,000 women. Women in the age bracket of 20 to 34 years have the highest fertility rate with 418.0 births per 1,000 women. Women in the age bracket of 20 to 34 years acount for 100.0% of all women with births.
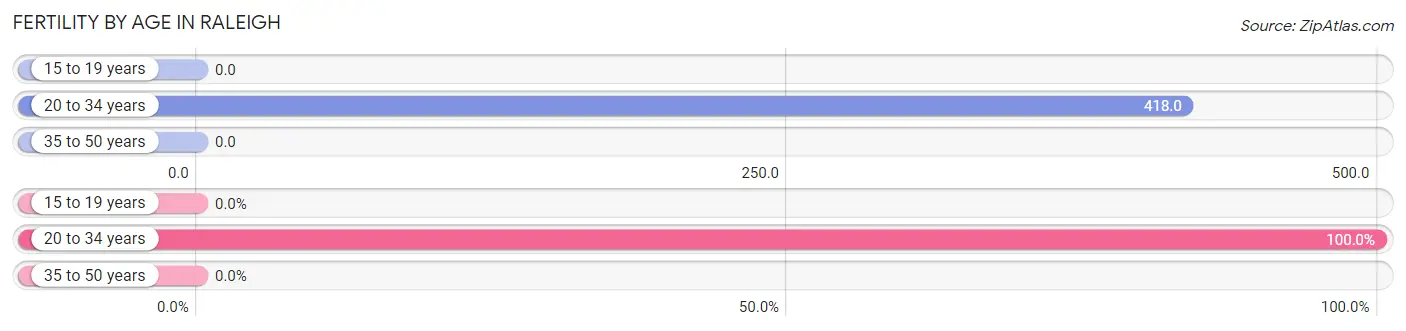
| Age Bracket | Women with Births | Births / 1,000 Women |
| 15 to 19 years | 0 (0.0%) | 0.0 |
| 20 to 34 years | 41 (100.0%) | 418.0 |
| 35 to 50 years | 0 (0.0%) | 0.0 |
| Total | 41 (100.0%) | 285.0 |
Fertility by Age by Marriage Status in Raleigh
92.7% of women with births (41) in Raleigh are married. The highest percentage of unmarried women with births falls into 20 to 34 years age bracket with 7.3% of them unmarried at the time of birth, while the lowest percentage of unmarried women with births belong to 20 to 34 years age bracket with 7.3% of them unmarried.
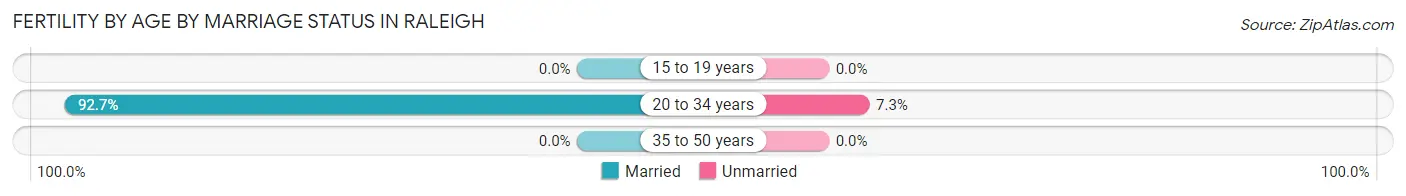
| Age Bracket | Married | Unmarried |
| 15 to 19 years | 0 (0.0%) | 0 (0.0%) |
| 20 to 34 years | 38 (92.7%) | 3 (7.3%) |
| 35 to 50 years | 0 (0.0%) | 0 (0.0%) |
| Total | 38 (92.7%) | 3 (7.3%) |
Fertility by Education in Raleigh
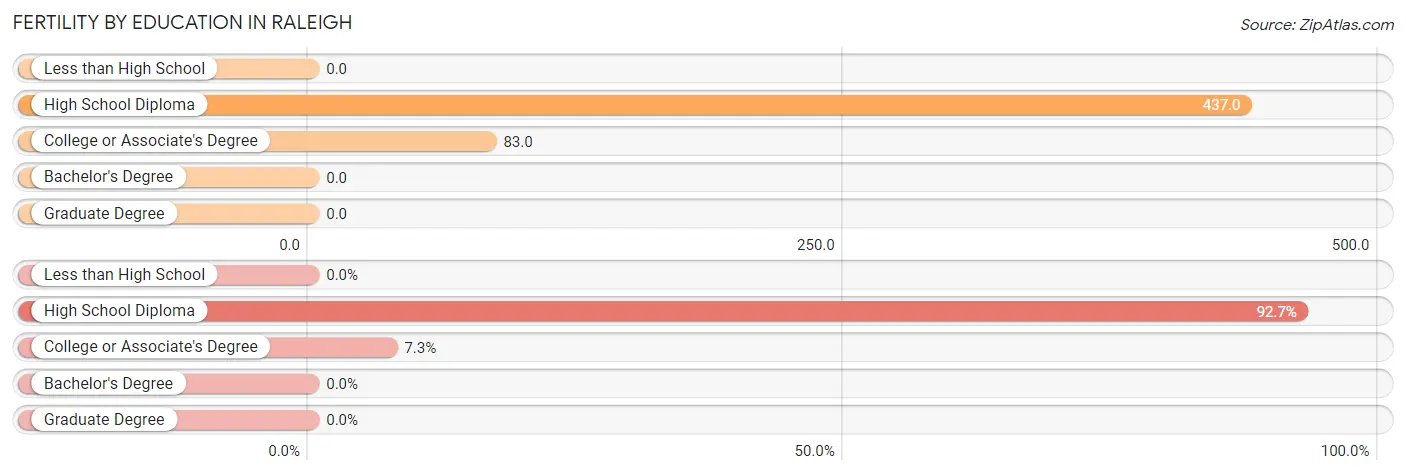
| Educational Attainment | Women with Births | Births / 1,000 Women |
| Less than High School | 0 (0.0%) | 0.0 |
| High School Diploma | 38 (92.7%) | 437.0 |
| College or Associate's Degree | 3 (7.3%) | 83.0 |
| Bachelor's Degree | 0 (0.0%) | 0.0 |
| Graduate Degree | 0 (0.0%) | 0.0 |
| Total | 41 (100.0%) | 285.0 |
Fertility by Education by Marriage Status in Raleigh
7.3% of women with births in Raleigh are unmarried. Women with the educational attainment of high school diploma are most likely to be married with 100.0% of them married at childbirth, while women with the educational attainment of college or associate's degree are least likely to be married with 100.0% of them unmarried at childbirth.
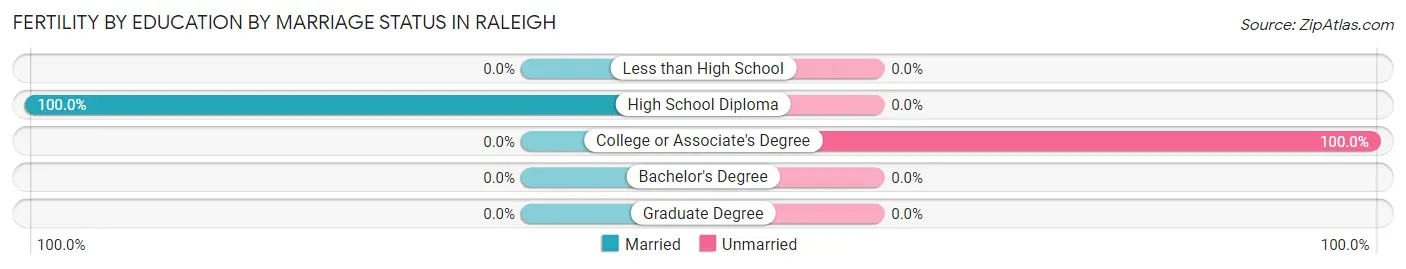
| Educational Attainment | Married | Unmarried |
| Less than High School | 0 (0.0%) | 0 (0.0%) |
| High School Diploma | 38 (100.0%) | 0 (0.0%) |
| College or Associate's Degree | 0 (0.0%) | 3 (100.0%) |
| Bachelor's Degree | 0 (0.0%) | 0 (0.0%) |
| Graduate Degree | 0 (0.0%) | 0 (0.0%) |
| Total | 38 (92.7%) | 3 (7.3%) |
Employment Characteristics in Raleigh
Employment by Class of Employer in Raleigh
Among the 204 employed individuals in Raleigh, private company employees (75 | 36.8%), not-for-profit organizations (41 | 20.1%), and self-employed (incorporated) (40 | 19.6%) make up the most common classes of employment.
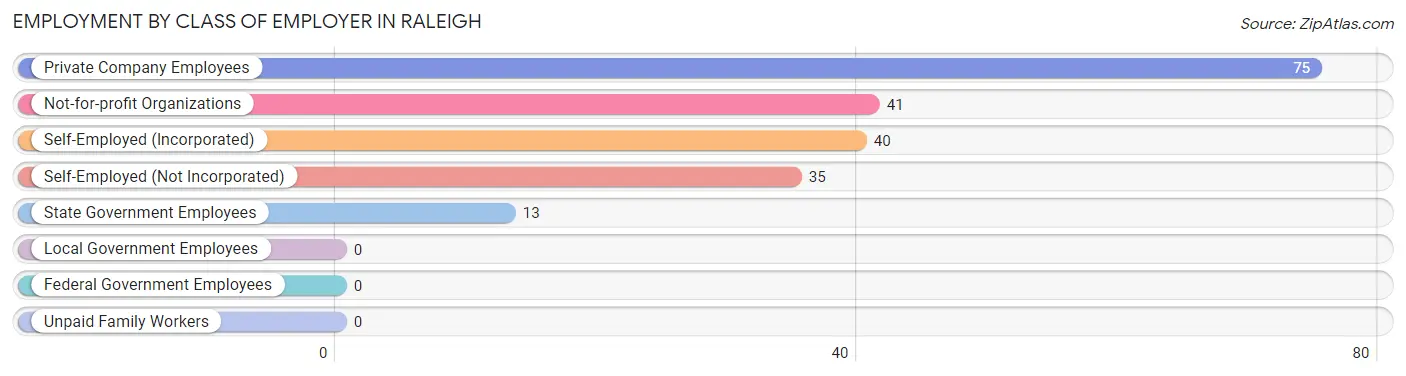
| Employer Class | # Employees | % Employees |
| Private Company Employees | 75 | 36.8% |
| Self-Employed (Incorporated) | 40 | 19.6% |
| Self-Employed (Not Incorporated) | 35 | 17.2% |
| Not-for-profit Organizations | 41 | 20.1% |
| Local Government Employees | 0 | 0.0% |
| State Government Employees | 13 | 6.4% |
| Federal Government Employees | 0 | 0.0% |
| Unpaid Family Workers | 0 | 0.0% |
| Total | 204 | 100.0% |
Employment Status by Age in Raleigh
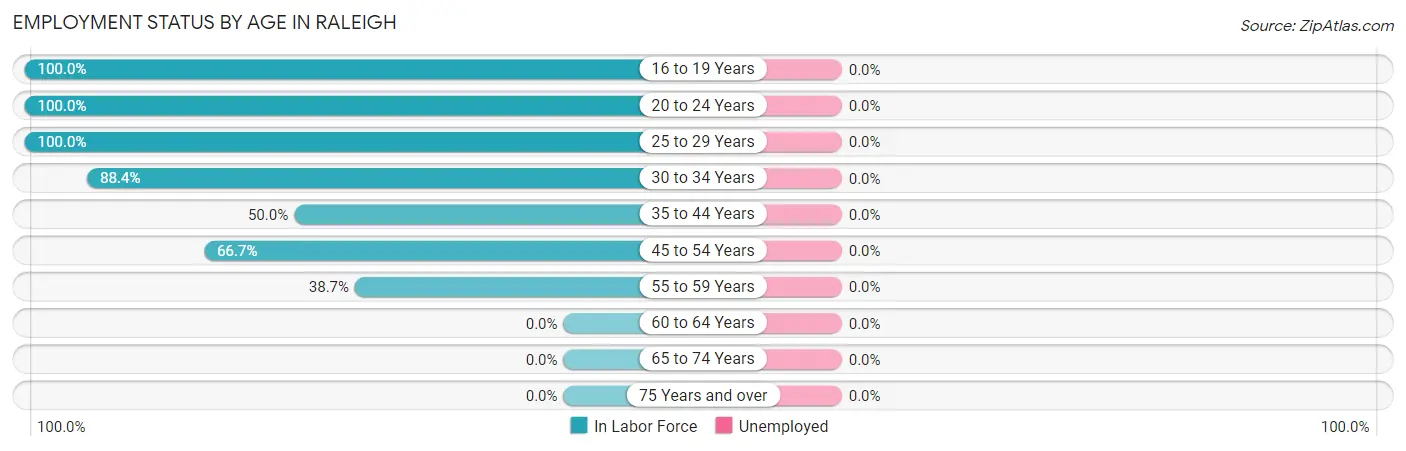
| Age Bracket | In Labor Force | Unemployed |
| 16 to 19 Years | 16 (100.0%) | 0 (0.0%) |
| 20 to 24 Years | 14 (100.0%) | 0 (0.0%) |
| 25 to 29 Years | 35 (100.0%) | 0 (0.0%) |
| 30 to 34 Years | 84 (88.4%) | 0 (0.0%) |
| 35 to 44 Years | 19 (50.0%) | 0 (0.0%) |
| 45 to 54 Years | 24 (66.7%) | 0 (0.0%) |
| 55 to 59 Years | 12 (38.7%) | 0 (0.0%) |
| 60 to 64 Years | 0 (0.0%) | 0 (0.0%) |
| 65 to 74 Years | 0 (0.0%) | 0 (0.0%) |
| 75 Years and over | 0 (0.0%) | 0 (0.0%) |
| Total | 204 (36.0%) | 0 (0.0%) |
Employment Status by Educational Attainment in Raleigh
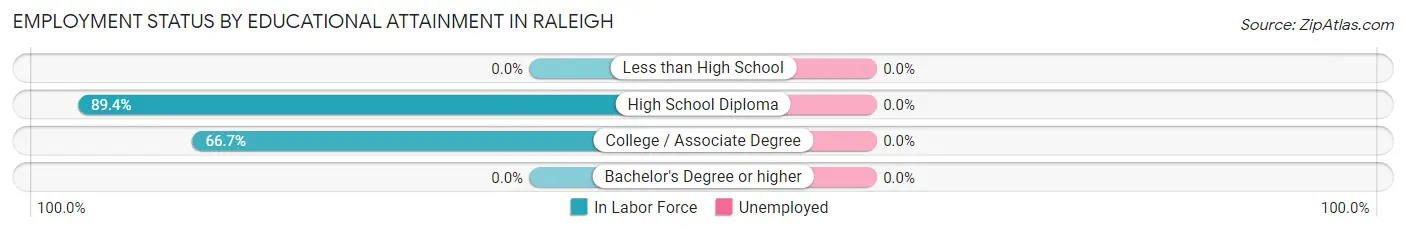
| Educational Attainment | In Labor Force | Unemployed |
| Less than High School | 0 (0.0%) | 0 (0.0%) |
| High School Diploma | 144 (89.4%) | 0 (0.0%) |
| College / Associate Degree | 30 (66.7%) | 0 (0.0%) |
| Bachelor's Degree or higher | 0 (0.0%) | 0 (0.0%) |
| Total | 174 (74.0%) | 0 (0.0%) |
Employment Occupations by Sex in Raleigh
Management, Business, Science and Arts Occupations
The most common Management, Business, Science and Arts occupations in Raleigh are Health Diagnosing & Treating (16 | 7.8%), and Health Technologists (12 | 5.9%).
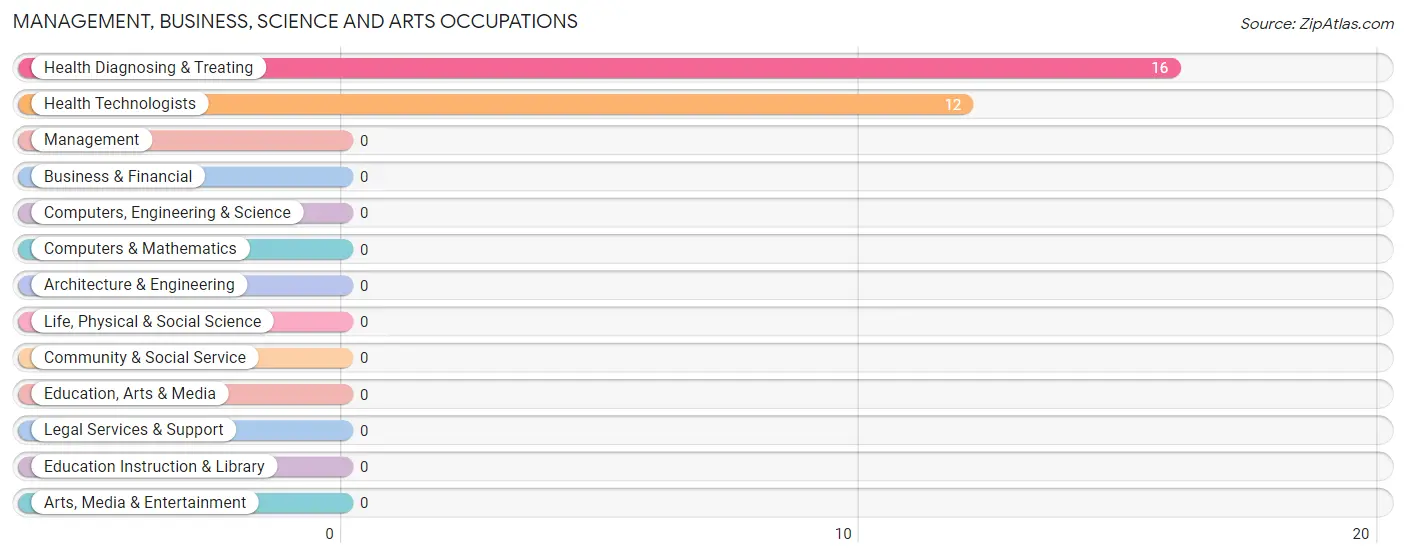
Management, Business, Science and Arts Occupations by Sex
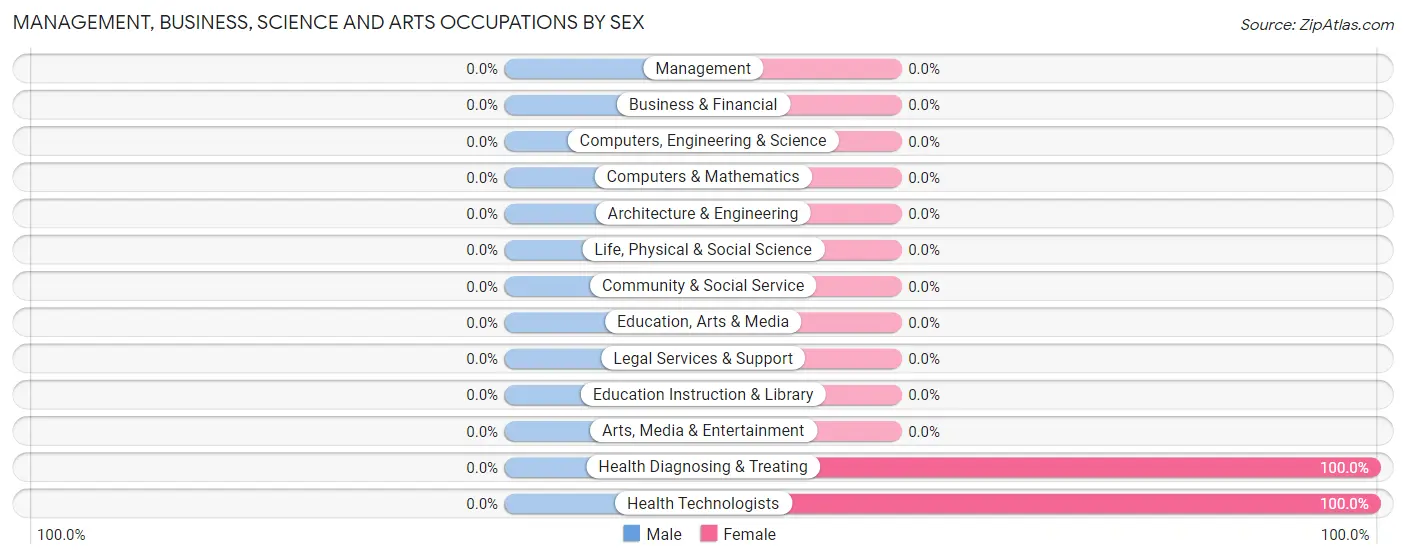
| Occupation | Male | Female |
| Management | 0 (0.0%) | 0 (0.0%) |
| Business & Financial | 0 (0.0%) | 0 (0.0%) |
| Computers, Engineering & Science | 0 (0.0%) | 0 (0.0%) |
| Computers & Mathematics | 0 (0.0%) | 0 (0.0%) |
| Architecture & Engineering | 0 (0.0%) | 0 (0.0%) |
| Life, Physical & Social Science | 0 (0.0%) | 0 (0.0%) |
| Community & Social Service | 0 (0.0%) | 0 (0.0%) |
| Education, Arts & Media | 0 (0.0%) | 0 (0.0%) |
| Legal Services & Support | 0 (0.0%) | 0 (0.0%) |
| Education Instruction & Library | 0 (0.0%) | 0 (0.0%) |
| Arts, Media & Entertainment | 0 (0.0%) | 0 (0.0%) |
| Health Diagnosing & Treating | 0 (0.0%) | 16 (100.0%) |
| Health Technologists | 0 (0.0%) | 12 (100.0%) |
| Total (Category) | 0 (0.0%) | 16 (100.0%) |
| Total (Overall) | 85 (41.7%) | 119 (58.3%) |
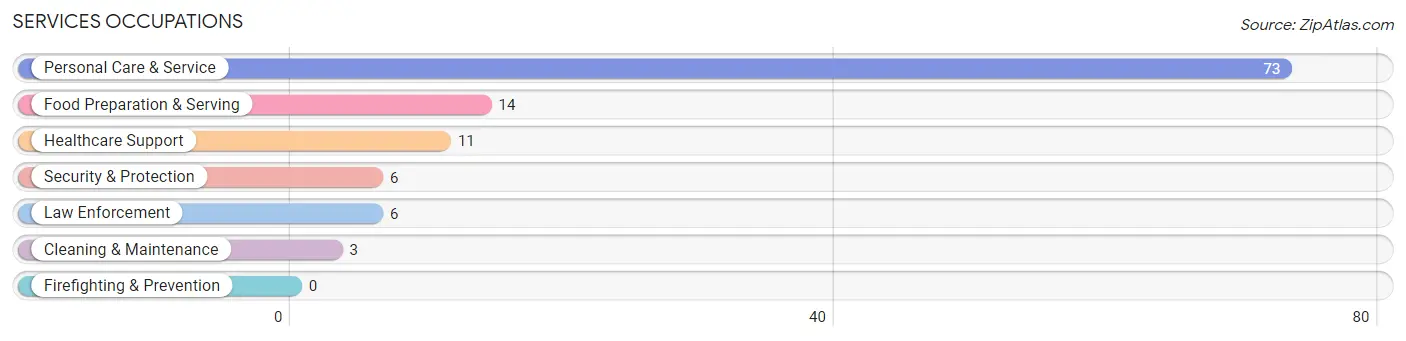
Services Occupations
The most common Services occupations in Raleigh are Personal Care & Service (73 | 35.8%), Food Preparation & Serving (14 | 6.9%), Healthcare Support (11 | 5.4%), Security & Protection (6 | 2.9%), and Law Enforcement (6 | 2.9%).
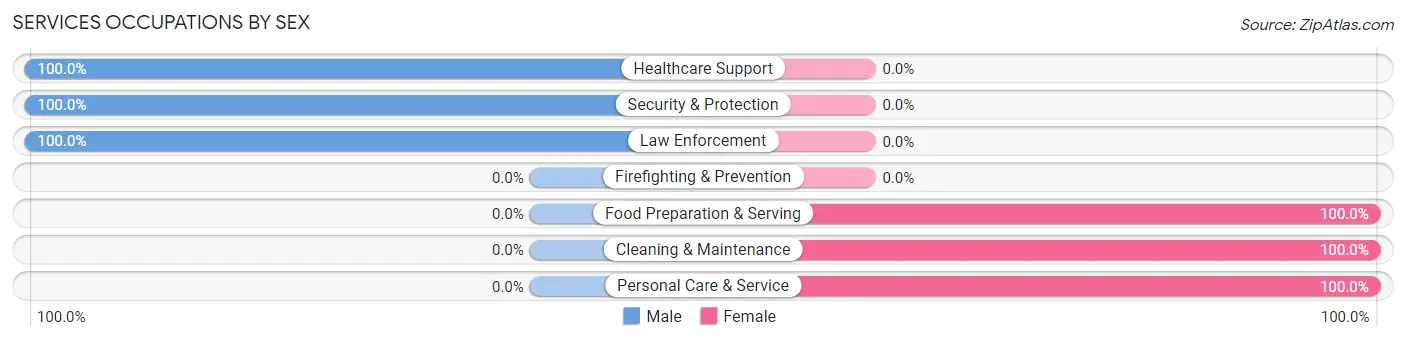
Services Occupations by Sex
Within the Services occupations in Raleigh, the most male-oriented occupations are Healthcare Support (100.0%), Security & Protection (100.0%), and Law Enforcement (100.0%), while the most female-oriented occupations are Food Preparation & Serving (100.0%), Cleaning & Maintenance (100.0%), and Personal Care & Service (100.0%).
| Occupation | Male | Female |
| Healthcare Support | 11 (100.0%) | 0 (0.0%) |
| Security & Protection | 6 (100.0%) | 0 (0.0%) |
| Firefighting & Prevention | 0 (0.0%) | 0 (0.0%) |
| Law Enforcement | 6 (100.0%) | 0 (0.0%) |
| Food Preparation & Serving | 0 (0.0%) | 14 (100.0%) |
| Cleaning & Maintenance | 0 (0.0%) | 3 (100.0%) |
| Personal Care & Service | 0 (0.0%) | 73 (100.0%) |
| Total (Category) | 17 (15.9%) | 90 (84.1%) |
| Total (Overall) | 85 (41.7%) | 119 (58.3%) |
Sales and Office Occupations
The most common Sales and Office occupations in Raleigh are Sales & Related (40 | 19.6%), and Office & Administration (7 | 3.4%).
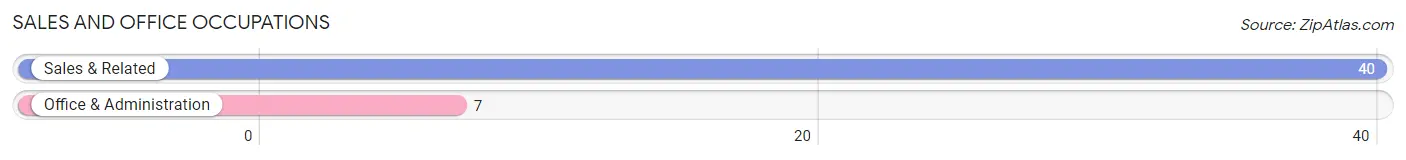
Sales and Office Occupations by Sex
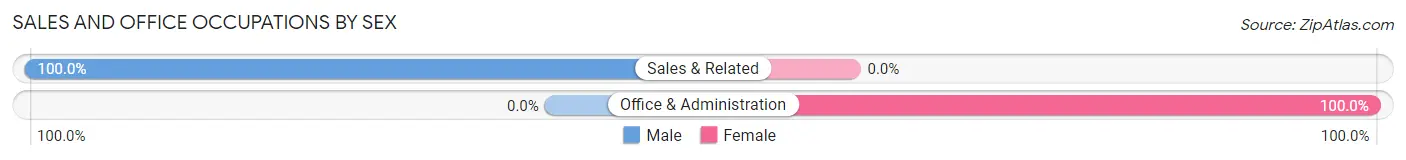
| Occupation | Male | Female |
| Sales & Related | 40 (100.0%) | 0 (0.0%) |
| Office & Administration | 0 (0.0%) | 7 (100.0%) |
| Total (Category) | 40 (85.1%) | 7 (14.9%) |
| Total (Overall) | 85 (41.7%) | 119 (58.3%) |
Natural Resources, Construction and Maintenance Occupations
The most common Natural Resources, Construction and Maintenance occupations in Raleigh are Installation, Maintenance & Repair (16 | 7.8%), and Construction & Extraction (7 | 3.4%).
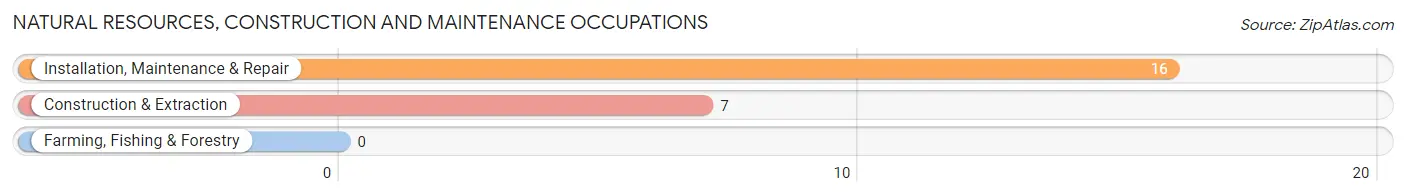
Natural Resources, Construction and Maintenance Occupations by Sex
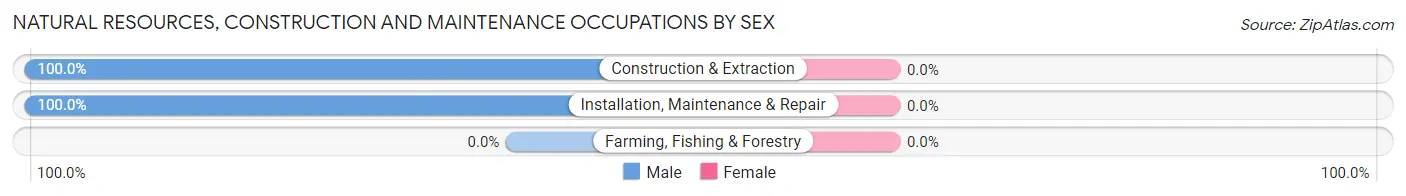
| Occupation | Male | Female |
| Farming, Fishing & Forestry | 0 (0.0%) | 0 (0.0%) |
| Construction & Extraction | 7 (100.0%) | 0 (0.0%) |
| Installation, Maintenance & Repair | 16 (100.0%) | 0 (0.0%) |
| Total (Category) | 23 (100.0%) | 0 (0.0%) |
| Total (Overall) | 85 (41.7%) | 119 (58.3%) |
Production, Transportation and Moving Occupations
The most common Production, Transportation and Moving occupations in Raleigh are Material Moving (6 | 2.9%), and Production (5 | 2.5%).
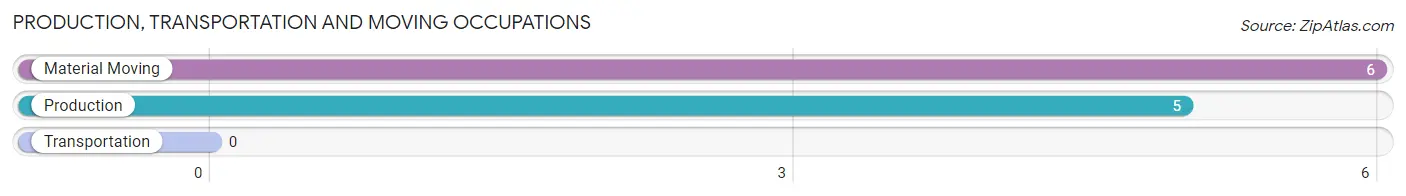
Production, Transportation and Moving Occupations by Sex
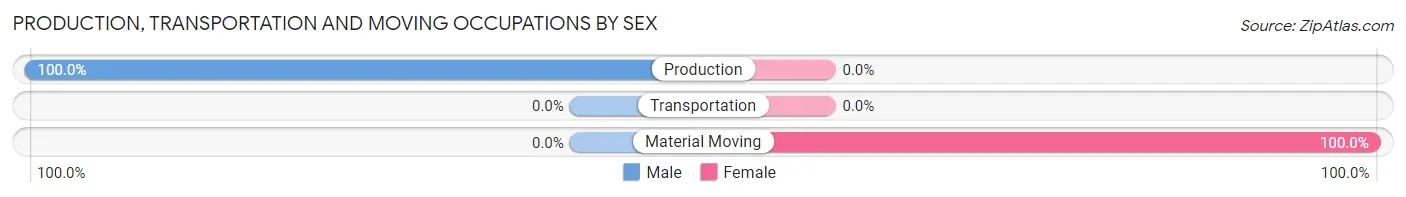
| Occupation | Male | Female |
| Production | 5 (100.0%) | 0 (0.0%) |
| Transportation | 0 (0.0%) | 0 (0.0%) |
| Material Moving | 0 (0.0%) | 6 (100.0%) |
| Total (Category) | 5 (45.5%) | 6 (54.5%) |
| Total (Overall) | 85 (41.7%) | 119 (58.3%) |
Employment Industries by Sex in Raleigh
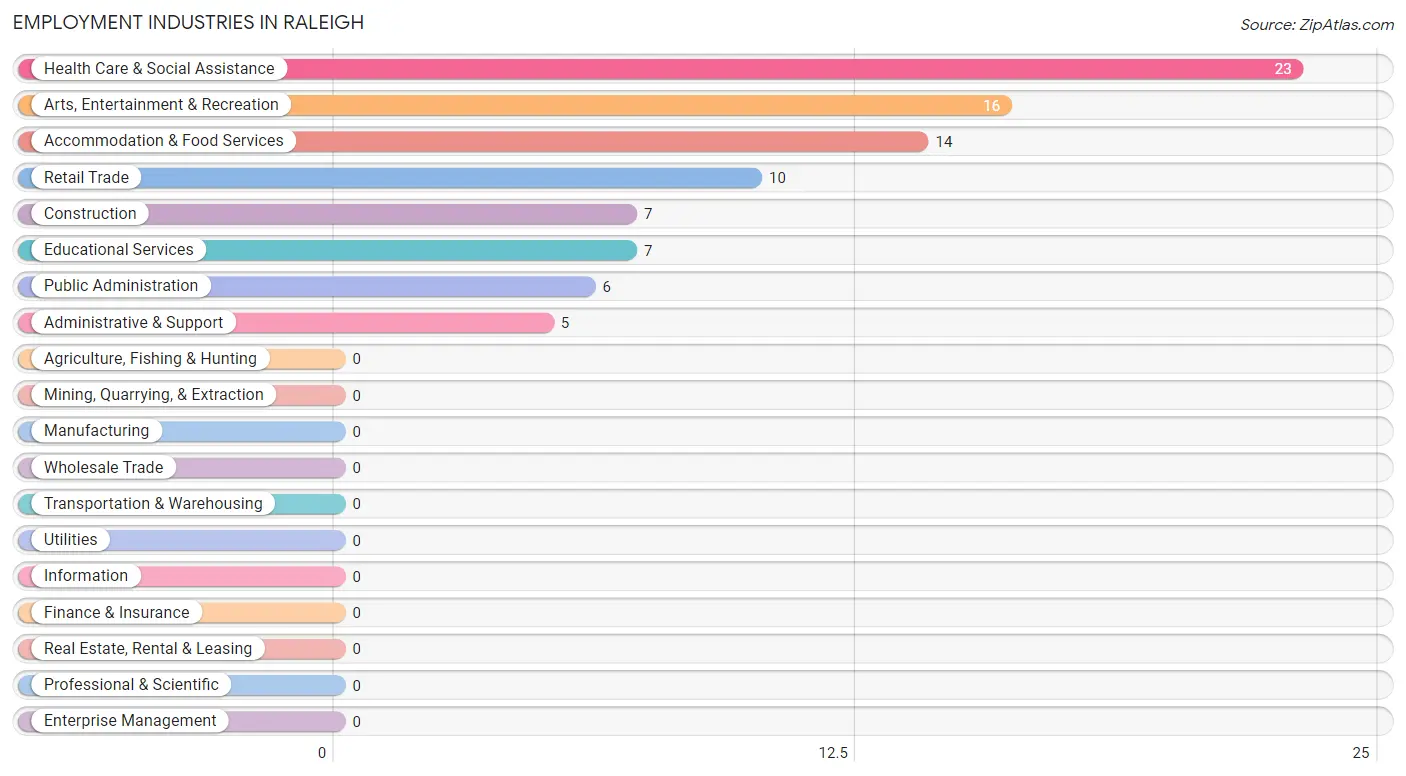
Employment Industries in Raleigh
The major employment industries in Raleigh include Health Care & Social Assistance (23 | 11.3%), Arts, Entertainment & Recreation (16 | 7.8%), Accommodation & Food Services (14 | 6.9%), Retail Trade (10 | 4.9%), and Construction (7 | 3.4%).
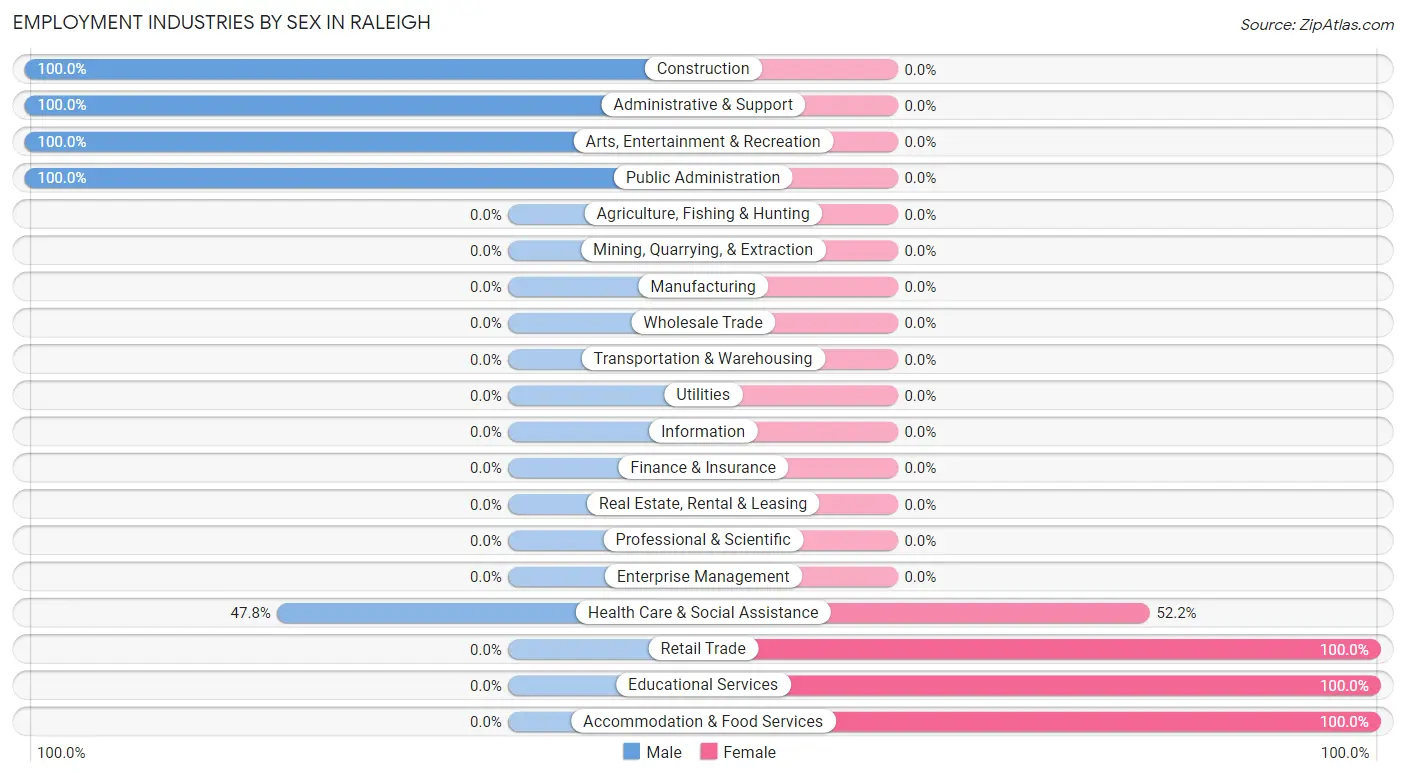
Employment Industries by Sex in Raleigh
The Raleigh industries that see more men than women are Construction (100.0%), Administrative & Support (100.0%), and Arts, Entertainment & Recreation (100.0%), whereas the industries that tend to have a higher number of women are Retail Trade (100.0%), Educational Services (100.0%), and Accommodation & Food Services (100.0%).
| Industry | Male | Female |
| Agriculture, Fishing & Hunting | 0 (0.0%) | 0 (0.0%) |
| Mining, Quarrying, & Extraction | 0 (0.0%) | 0 (0.0%) |
| Construction | 7 (100.0%) | 0 (0.0%) |
| Manufacturing | 0 (0.0%) | 0 (0.0%) |
| Wholesale Trade | 0 (0.0%) | 0 (0.0%) |
| Retail Trade | 0 (0.0%) | 10 (100.0%) |
| Transportation & Warehousing | 0 (0.0%) | 0 (0.0%) |
| Utilities | 0 (0.0%) | 0 (0.0%) |
| Information | 0 (0.0%) | 0 (0.0%) |
| Finance & Insurance | 0 (0.0%) | 0 (0.0%) |
| Real Estate, Rental & Leasing | 0 (0.0%) | 0 (0.0%) |
| Professional & Scientific | 0 (0.0%) | 0 (0.0%) |
| Enterprise Management | 0 (0.0%) | 0 (0.0%) |
| Administrative & Support | 5 (100.0%) | 0 (0.0%) |
| Educational Services | 0 (0.0%) | 7 (100.0%) |
| Health Care & Social Assistance | 11 (47.8%) | 12 (52.2%) |
| Arts, Entertainment & Recreation | 16 (100.0%) | 0 (0.0%) |
| Accommodation & Food Services | 0 (0.0%) | 14 (100.0%) |
| Public Administration | 6 (100.0%) | 0 (0.0%) |
| Total | 85 (41.7%) | 119 (58.3%) |
Education in Raleigh
School Enrollment in Raleigh
The most common levels of schooling among the 216 students in Raleigh are elementary school (83 | 38.4%), middle school (82 | 38.0%), and college / undergraduate (33 | 15.3%).
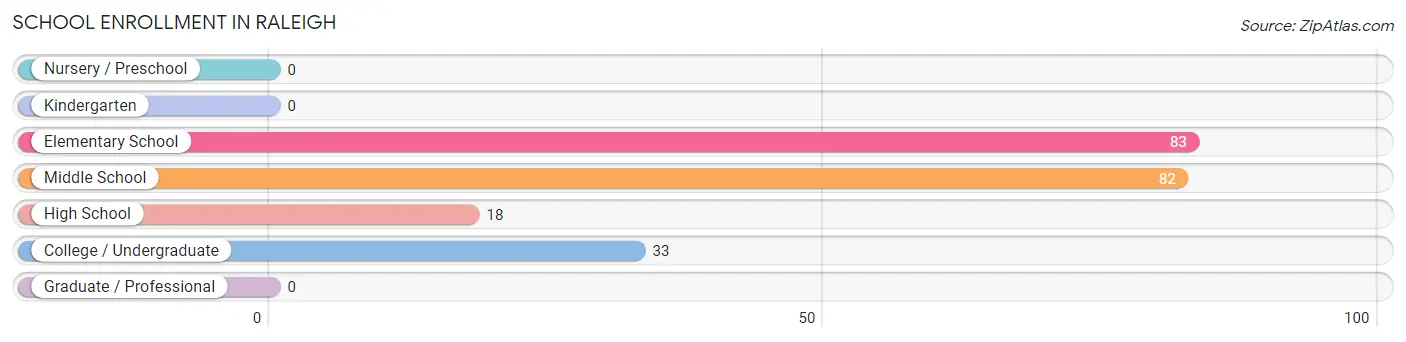
| School Level | # Students | % Students |
| Nursery / Preschool | 0 | 0.0% |
| Kindergarten | 0 | 0.0% |
| Elementary School | 83 | 38.4% |
| Middle School | 82 | 38.0% |
| High School | 18 | 8.3% |
| College / Undergraduate | 33 | 15.3% |
| Graduate / Professional | 0 | 0.0% |
| Total | 216 | 100.0% |
School Enrollment by Age by Funding Source in Raleigh
Out of a total of 216 students who are enrolled in schools in Raleigh, 18 (8.3%) attend a private institution, while the remaining 198 (91.7%) are enrolled in public schools. The age group of 15 to 17 year olds has the highest likelihood of being enrolled in private schools, with 18 (100.0% in the age bracket) enrolled. Conversely, the age group of 5 to 9 year old has the lowest likelihood of being enrolled in a private school, with 83 (100.0% in the age bracket) attending a public institution.
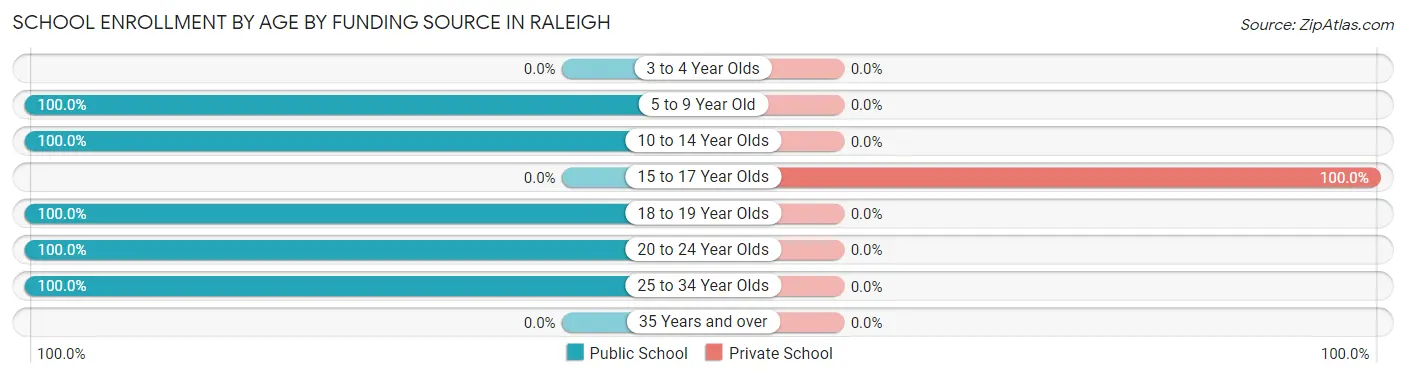
| Age Bracket | Public School | Private School |
| 3 to 4 Year Olds | 0 (0.0%) | 0 (0.0%) |
| 5 to 9 Year Old | 83 (100.0%) | 0 (0.0%) |
| 10 to 14 Year Olds | 82 (100.0%) | 0 (0.0%) |
| 15 to 17 Year Olds | 0 (0.0%) | 18 (100.0%) |
| 18 to 19 Year Olds | 16 (100.0%) | 0 (0.0%) |
| 20 to 24 Year Olds | 14 (100.0%) | 0 (0.0%) |
| 25 to 34 Year Olds | 3 (100.0%) | 0 (0.0%) |
| 35 Years and over | 0 (0.0%) | 0 (0.0%) |
| Total | 198 (91.7%) | 18 (8.3%) |
Educational Attainment by Field of Study in Raleigh
Psychology (83 | 59.7%), education (29 | 20.9%), social sciences (19 | 13.7%), and business (8 | 5.8%) are the most common fields of study among 139 individuals in Raleigh who have obtained a bachelor's degree or higher.
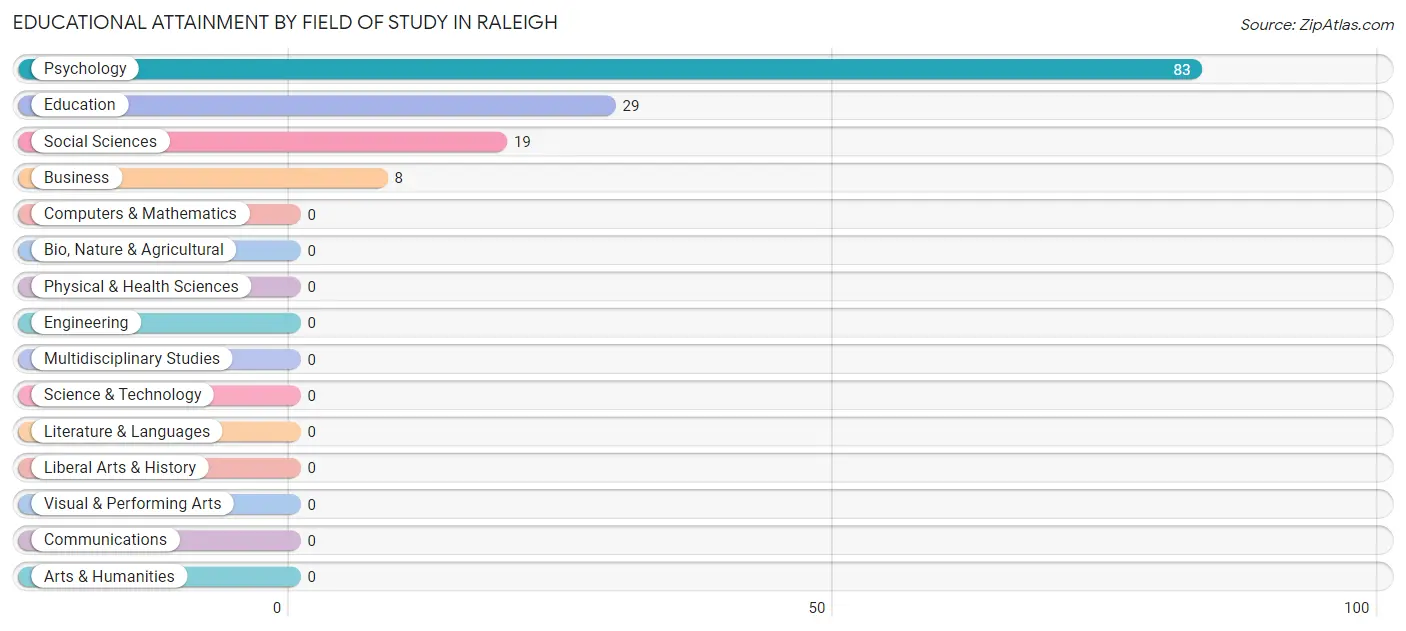
| Field of Study | # Graduates | % Graduates |
| Computers & Mathematics | 0 | 0.0% |
| Bio, Nature & Agricultural | 0 | 0.0% |
| Physical & Health Sciences | 0 | 0.0% |
| Psychology | 83 | 59.7% |
| Social Sciences | 19 | 13.7% |
| Engineering | 0 | 0.0% |
| Multidisciplinary Studies | 0 | 0.0% |
| Science & Technology | 0 | 0.0% |
| Business | 8 | 5.8% |
| Education | 29 | 20.9% |
| Literature & Languages | 0 | 0.0% |
| Liberal Arts & History | 0 | 0.0% |
| Visual & Performing Arts | 0 | 0.0% |
| Communications | 0 | 0.0% |
| Arts & Humanities | 0 | 0.0% |
| Total | 139 | 100.0% |
Transportation & Commute in Raleigh
Vehicle Availability by Sex in Raleigh
The most prevalent vehicle ownership categories in Raleigh are males with 5 or more vehicles (40, accounting for 47.1%) and females with 5 or more vehicles (38, making up 33.6%).
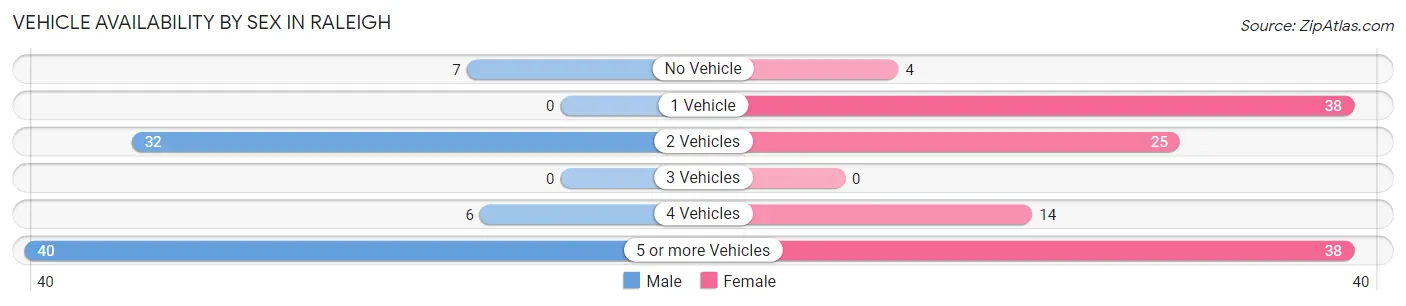
| Vehicles Available | Male | Female |
| No Vehicle | 7 (8.2%) | 4 (3.4%) |
| 1 Vehicle | 0 (0.0%) | 38 (31.9%) |
| 2 Vehicles | 32 (37.7%) | 25 (21.0%) |
| 3 Vehicles | 0 (0.0%) | 0 (0.0%) |
| 4 Vehicles | 6 (7.1%) | 14 (11.8%) |
| 5 or more Vehicles | 40 (47.1%) | 38 (31.9%) |
| Total | 85 (100.0%) | 119 (100.0%) |
Commute Time in Raleigh
The most frequently occuring commute durations in Raleigh are 30 to 34 minutes (69 commuters, 43.1%), 10 to 14 minutes (41 commuters, 25.6%), and 25 to 29 minutes (23 commuters, 14.4%).
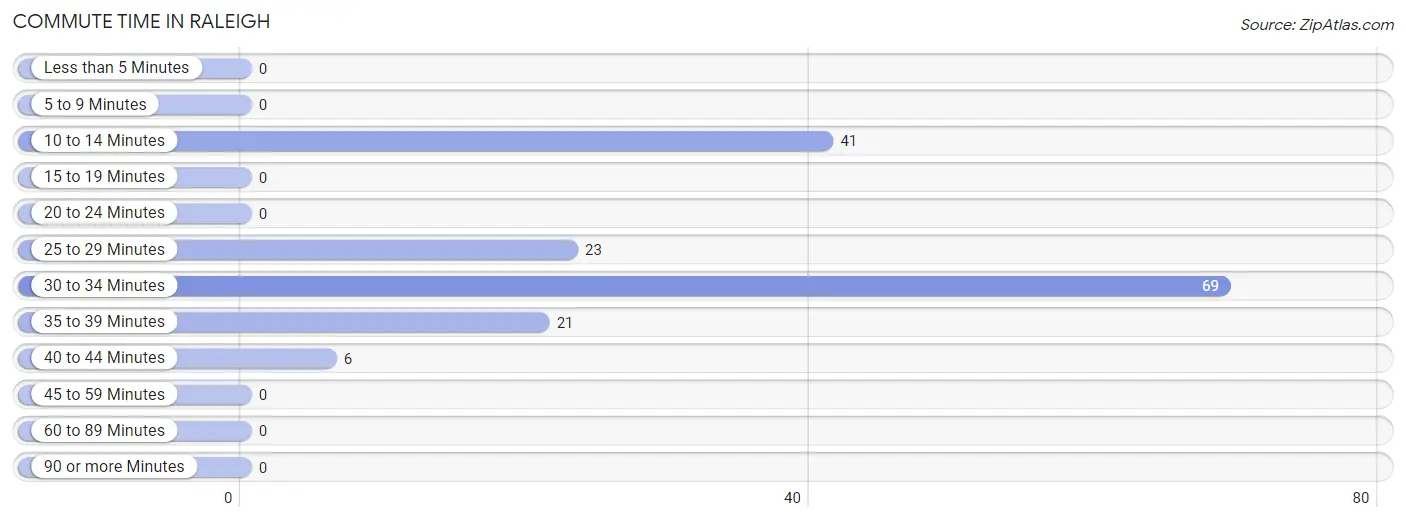
| Commute Time | # Commuters | % Commuters |
| Less than 5 Minutes | 0 | 0.0% |
| 5 to 9 Minutes | 0 | 0.0% |
| 10 to 14 Minutes | 41 | 25.6% |
| 15 to 19 Minutes | 0 | 0.0% |
| 20 to 24 Minutes | 0 | 0.0% |
| 25 to 29 Minutes | 23 | 14.4% |
| 30 to 34 Minutes | 69 | 43.1% |
| 35 to 39 Minutes | 21 | 13.1% |
| 40 to 44 Minutes | 6 | 3.7% |
| 45 to 59 Minutes | 0 | 0.0% |
| 60 to 89 Minutes | 0 | 0.0% |
| 90 or more Minutes | 0 | 0.0% |
Commute Time by Sex in Raleigh
The most common commute times in Raleigh are 35 to 39 minutes (21 commuters, 46.7%) for males and 30 to 34 minutes (56 commuters, 48.7%) for females.
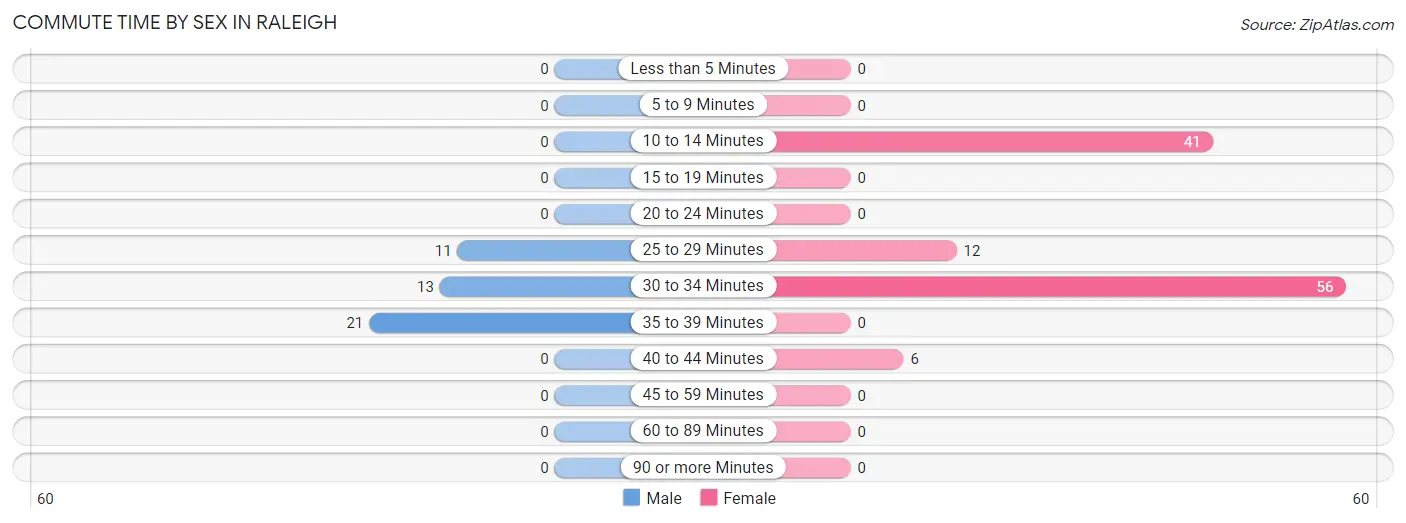
| Commute Time | Male | Female |
| Less than 5 Minutes | 0 (0.0%) | 0 (0.0%) |
| 5 to 9 Minutes | 0 (0.0%) | 0 (0.0%) |
| 10 to 14 Minutes | 0 (0.0%) | 41 (35.6%) |
| 15 to 19 Minutes | 0 (0.0%) | 0 (0.0%) |
| 20 to 24 Minutes | 0 (0.0%) | 0 (0.0%) |
| 25 to 29 Minutes | 11 (24.4%) | 12 (10.4%) |
| 30 to 34 Minutes | 13 (28.9%) | 56 (48.7%) |
| 35 to 39 Minutes | 21 (46.7%) | 0 (0.0%) |
| 40 to 44 Minutes | 0 (0.0%) | 6 (5.2%) |
| 45 to 59 Minutes | 0 (0.0%) | 0 (0.0%) |
| 60 to 89 Minutes | 0 (0.0%) | 0 (0.0%) |
| 90 or more Minutes | 0 (0.0%) | 0 (0.0%) |
Time of Departure to Work by Sex in Raleigh
The most frequent times of departure to work in Raleigh are 8:00 AM to 8:29 AM (16, 35.6%) for males and 8:00 AM to 8:29 AM (49, 42.6%) for females.
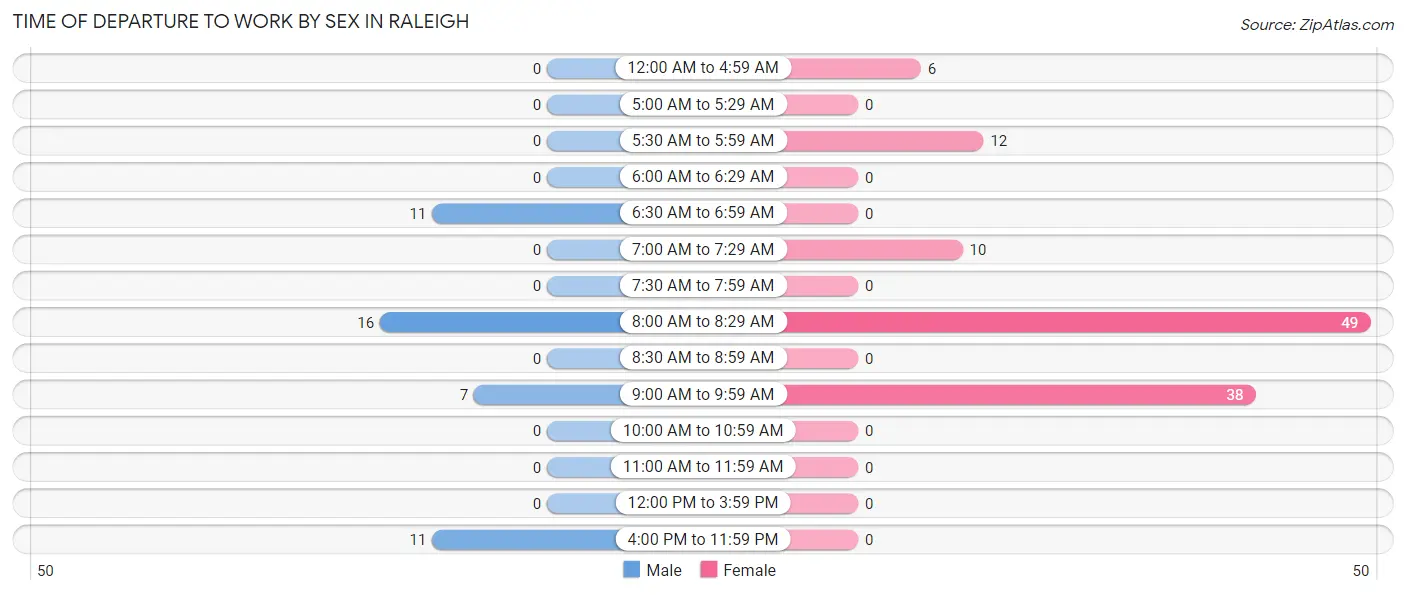
| Time of Departure | Male | Female |
| 12:00 AM to 4:59 AM | 0 (0.0%) | 6 (5.2%) |
| 5:00 AM to 5:29 AM | 0 (0.0%) | 0 (0.0%) |
| 5:30 AM to 5:59 AM | 0 (0.0%) | 12 (10.4%) |
| 6:00 AM to 6:29 AM | 0 (0.0%) | 0 (0.0%) |
| 6:30 AM to 6:59 AM | 11 (24.4%) | 0 (0.0%) |
| 7:00 AM to 7:29 AM | 0 (0.0%) | 10 (8.7%) |
| 7:30 AM to 7:59 AM | 0 (0.0%) | 0 (0.0%) |
| 8:00 AM to 8:29 AM | 16 (35.6%) | 49 (42.6%) |
| 8:30 AM to 8:59 AM | 0 (0.0%) | 0 (0.0%) |
| 9:00 AM to 9:59 AM | 7 (15.6%) | 38 (33.0%) |
| 10:00 AM to 10:59 AM | 0 (0.0%) | 0 (0.0%) |
| 11:00 AM to 11:59 AM | 0 (0.0%) | 0 (0.0%) |
| 12:00 PM to 3:59 PM | 0 (0.0%) | 0 (0.0%) |
| 4:00 PM to 11:59 PM | 11 (24.4%) | 0 (0.0%) |
| Total | 45 (100.0%) | 115 (100.0%) |
Housing Occupancy in Raleigh
Occupancy by Ownership in Raleigh
Of the total 321 dwellings in Raleigh, owner-occupied units account for 276 (86.0%), while renter-occupied units make up 45 (14.0%).
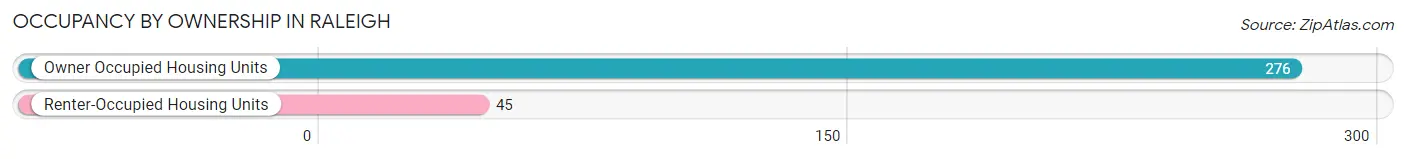
| Occupancy | # Housing Units | % Housing Units |
| Owner Occupied Housing Units | 276 | 86.0% |
| Renter-Occupied Housing Units | 45 | 14.0% |
| Total Occupied Housing Units | 321 | 100.0% |
Occupancy by Household Size in Raleigh
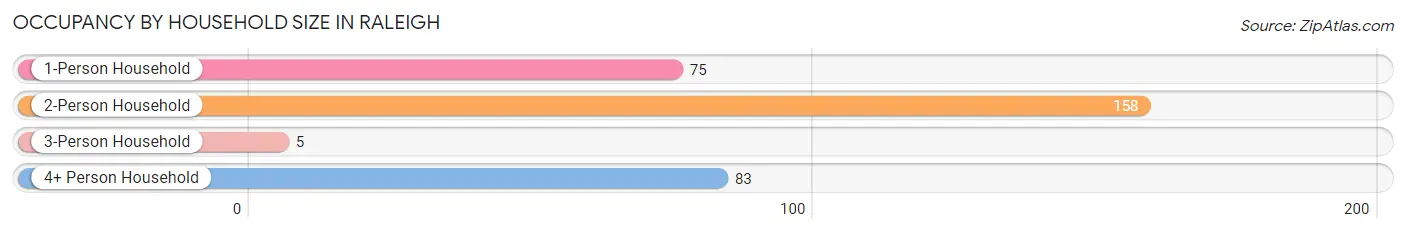
| Household Size | # Housing Units | % Housing Units |
| 1-Person Household | 75 | 23.4% |
| 2-Person Household | 158 | 49.2% |
| 3-Person Household | 5 | 1.6% |
| 4+ Person Household | 83 | 25.9% |
| Total Housing Units | 321 | 100.0% |
Occupancy by Ownership by Household Size in Raleigh
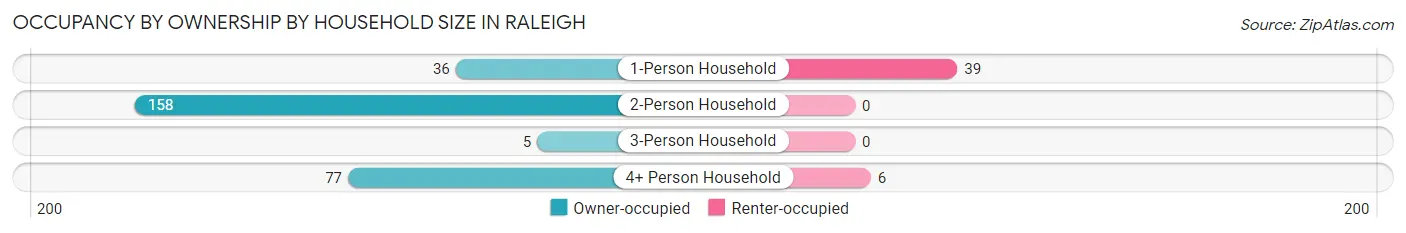
| Household Size | Owner-occupied | Renter-occupied |
| 1-Person Household | 36 (48.0%) | 39 (52.0%) |
| 2-Person Household | 158 (100.0%) | 0 (0.0%) |
| 3-Person Household | 5 (100.0%) | 0 (0.0%) |
| 4+ Person Household | 77 (92.8%) | 6 (7.2%) |
| Total Housing Units | 276 (86.0%) | 45 (14.0%) |
Occupancy by Educational Attainment in Raleigh
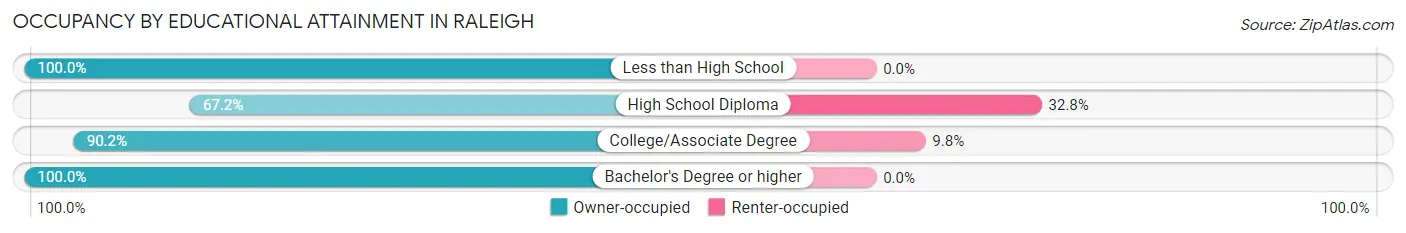
| Household Size | Owner-occupied | Renter-occupied |
| Less than High School | 136 (100.0%) | 0 (0.0%) |
| High School Diploma | 84 (67.2%) | 41 (32.8%) |
| College/Associate Degree | 37 (90.2%) | 4 (9.8%) |
| Bachelor's Degree or higher | 19 (100.0%) | 0 (0.0%) |
Occupancy by Age of Householder in Raleigh
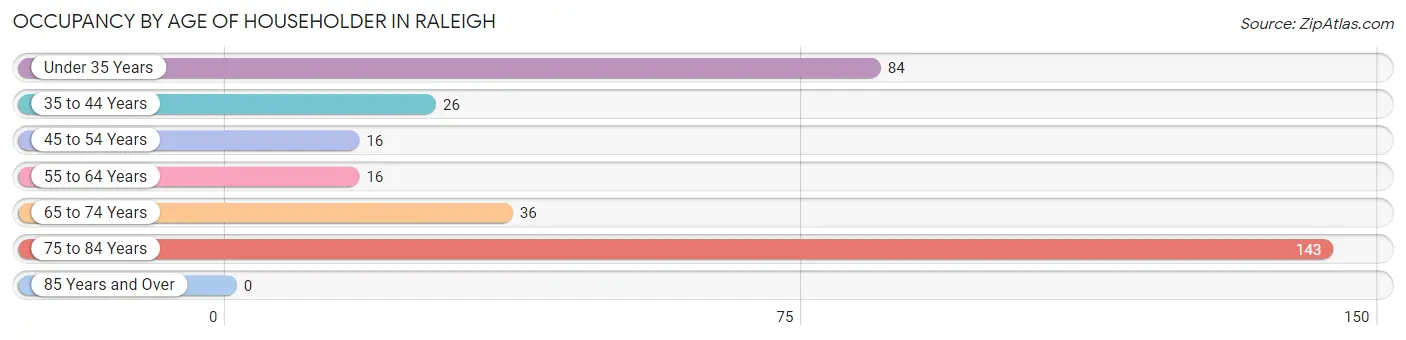
| Age Bracket | # Households | % Households |
| Under 35 Years | 84 | 26.2% |
| 35 to 44 Years | 26 | 8.1% |
| 45 to 54 Years | 16 | 5.0% |
| 55 to 64 Years | 16 | 5.0% |
| 65 to 74 Years | 36 | 11.2% |
| 75 to 84 Years | 143 | 44.6% |
| 85 Years and Over | 0 | 0.0% |
| Total | 321 | 100.0% |
Housing Finances in Raleigh
Median Income by Occupancy in Raleigh
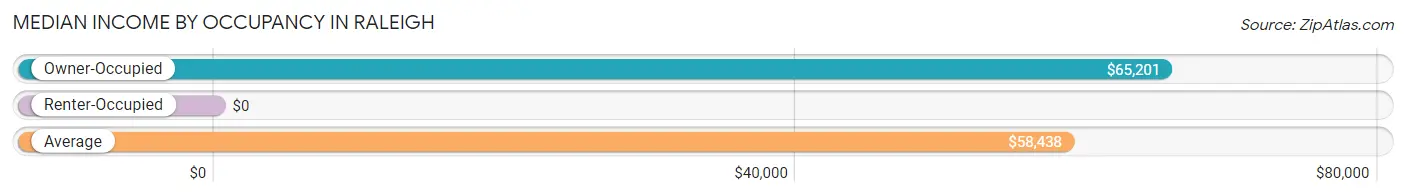
| Occupancy Type | # Households | Median Income |
| Owner-Occupied | 276 (86.0%) | $65,201 |
| Renter-Occupied | 45 (14.0%) | $0 |
| Average | 321 (100.0%) | $58,438 |
Occupancy by Householder Income Bracket in Raleigh
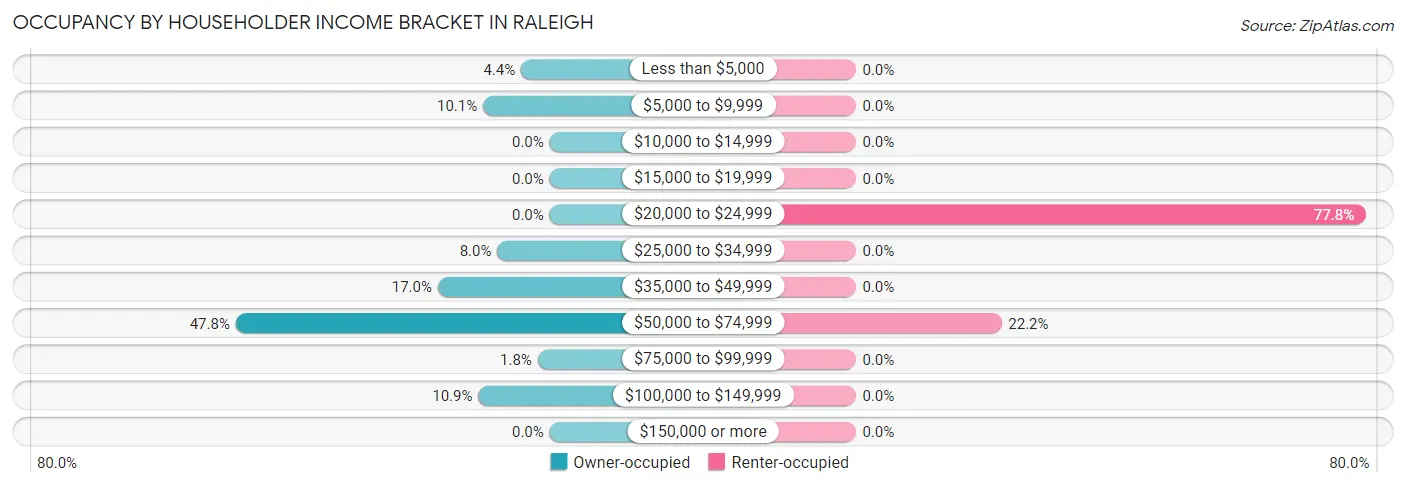
| Income Bracket | Owner-occupied | Renter-occupied |
| Less than $5,000 | 12 (4.3%) | 0 (0.0%) |
| $5,000 to $9,999 | 28 (10.1%) | 0 (0.0%) |
| $10,000 to $14,999 | 0 (0.0%) | 0 (0.0%) |
| $15,000 to $19,999 | 0 (0.0%) | 0 (0.0%) |
| $20,000 to $24,999 | 0 (0.0%) | 35 (77.8%) |
| $25,000 to $34,999 | 22 (8.0%) | 0 (0.0%) |
| $35,000 to $49,999 | 47 (17.0%) | 0 (0.0%) |
| $50,000 to $74,999 | 132 (47.8%) | 10 (22.2%) |
| $75,000 to $99,999 | 5 (1.8%) | 0 (0.0%) |
| $100,000 to $149,999 | 30 (10.9%) | 0 (0.0%) |
| $150,000 or more | 0 (0.0%) | 0 (0.0%) |
| Total | 276 (100.0%) | 45 (100.0%) |
Monthly Housing Cost Tiers in Raleigh
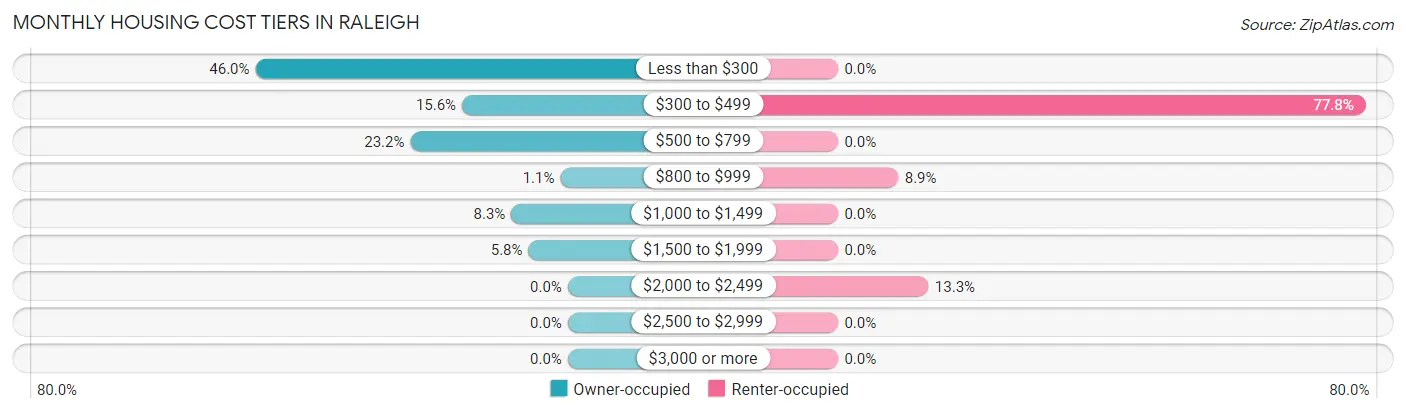
| Monthly Cost | Owner-occupied | Renter-occupied |
| Less than $300 | 127 (46.0%) | 0 (0.0%) |
| $300 to $499 | 43 (15.6%) | 35 (77.8%) |
| $500 to $799 | 64 (23.2%) | 0 (0.0%) |
| $800 to $999 | 3 (1.1%) | 4 (8.9%) |
| $1,000 to $1,499 | 23 (8.3%) | 0 (0.0%) |
| $1,500 to $1,999 | 16 (5.8%) | 0 (0.0%) |
| $2,000 to $2,499 | 0 (0.0%) | 6 (13.3%) |
| $2,500 to $2,999 | 0 (0.0%) | 0 (0.0%) |
| $3,000 or more | 0 (0.0%) | 0 (0.0%) |
| Total | 276 (100.0%) | 45 (100.0%) |
Physical Housing Characteristics in Raleigh
Housing Structures in Raleigh
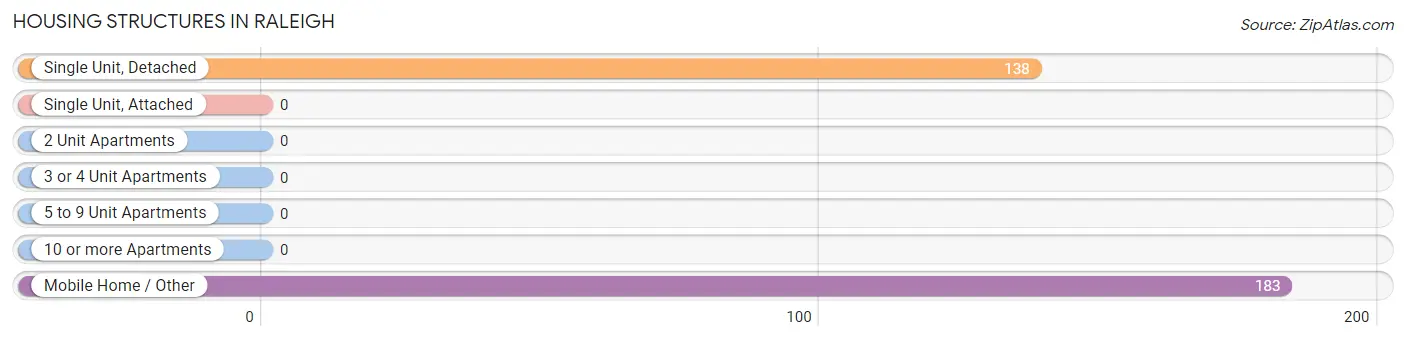
| Structure Type | # Housing Units | % Housing Units |
| Single Unit, Detached | 138 | 43.0% |
| Single Unit, Attached | 0 | 0.0% |
| 2 Unit Apartments | 0 | 0.0% |
| 3 or 4 Unit Apartments | 0 | 0.0% |
| 5 to 9 Unit Apartments | 0 | 0.0% |
| 10 or more Apartments | 0 | 0.0% |
| Mobile Home / Other | 183 | 57.0% |
| Total | 321 | 100.0% |
Housing Structures by Occupancy in Raleigh
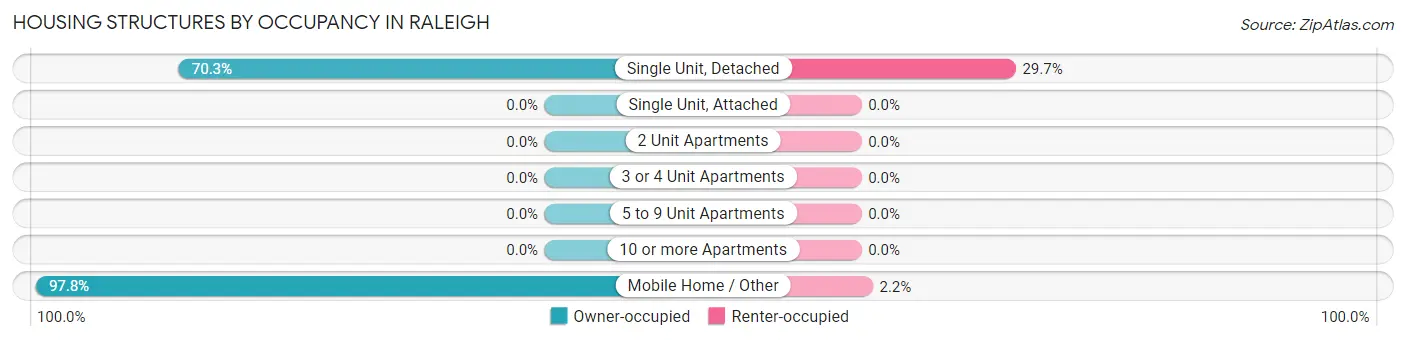
| Structure Type | Owner-occupied | Renter-occupied |
| Single Unit, Detached | 97 (70.3%) | 41 (29.7%) |
| Single Unit, Attached | 0 (0.0%) | 0 (0.0%) |
| 2 Unit Apartments | 0 (0.0%) | 0 (0.0%) |
| 3 or 4 Unit Apartments | 0 (0.0%) | 0 (0.0%) |
| 5 to 9 Unit Apartments | 0 (0.0%) | 0 (0.0%) |
| 10 or more Apartments | 0 (0.0%) | 0 (0.0%) |
| Mobile Home / Other | 179 (97.8%) | 4 (2.2%) |
| Total | 276 (86.0%) | 45 (14.0%) |
Housing Structures by Number of Rooms in Raleigh
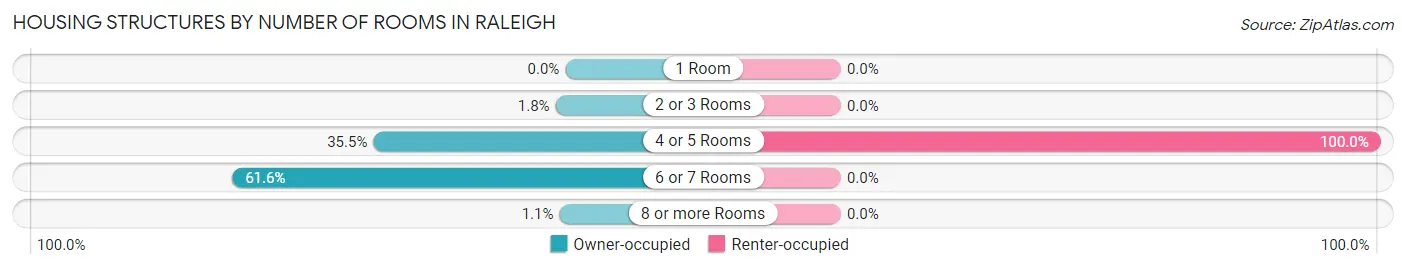
| Number of Rooms | Owner-occupied | Renter-occupied |
| 1 Room | 0 (0.0%) | 0 (0.0%) |
| 2 or 3 Rooms | 5 (1.8%) | 0 (0.0%) |
| 4 or 5 Rooms | 98 (35.5%) | 45 (100.0%) |
| 6 or 7 Rooms | 170 (61.6%) | 0 (0.0%) |
| 8 or more Rooms | 3 (1.1%) | 0 (0.0%) |
| Total | 276 (100.0%) | 45 (100.0%) |
Housing Structure by Heating Type in Raleigh
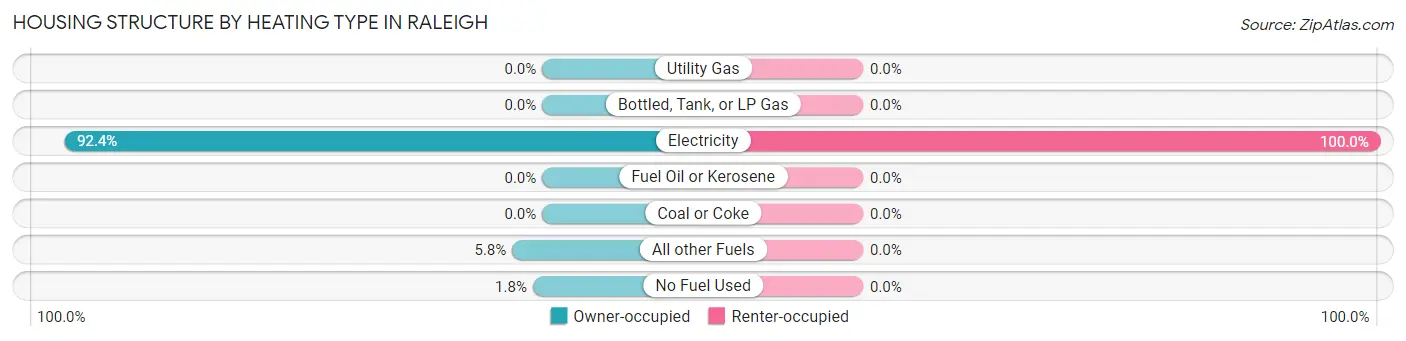
| Heating Type | Owner-occupied | Renter-occupied |
| Utility Gas | 0 (0.0%) | 0 (0.0%) |
| Bottled, Tank, or LP Gas | 0 (0.0%) | 0 (0.0%) |
| Electricity | 255 (92.4%) | 45 (100.0%) |
| Fuel Oil or Kerosene | 0 (0.0%) | 0 (0.0%) |
| Coal or Coke | 0 (0.0%) | 0 (0.0%) |
| All other Fuels | 16 (5.8%) | 0 (0.0%) |
| No Fuel Used | 5 (1.8%) | 0 (0.0%) |
| Total | 276 (100.0%) | 45 (100.0%) |
Household Vehicle Usage in Raleigh
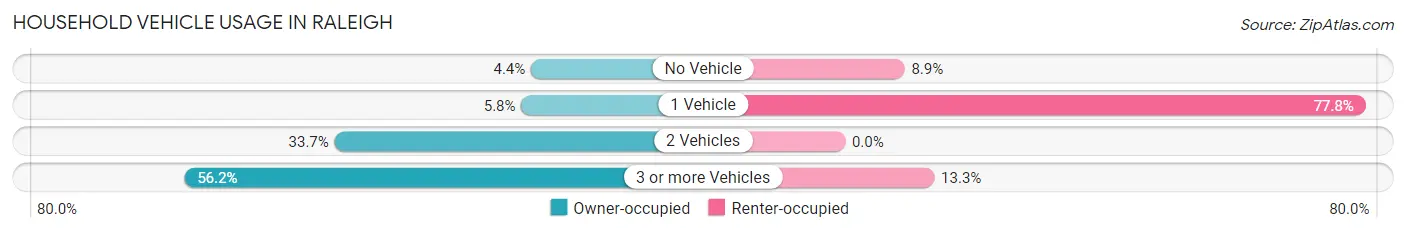
| Vehicles per Household | Owner-occupied | Renter-occupied |
| No Vehicle | 12 (4.3%) | 4 (8.9%) |
| 1 Vehicle | 16 (5.8%) | 35 (77.8%) |
| 2 Vehicles | 93 (33.7%) | 0 (0.0%) |
| 3 or more Vehicles | 155 (56.2%) | 6 (13.3%) |
| Total | 276 (100.0%) | 45 (100.0%) |
Real Estate & Mortgages in Raleigh
Real Estate and Mortgage Overview in Raleigh
| Characteristic | Without Mortgage | With Mortgage |
| Housing Units | 229 | 47 |
| Median Property Value | - | - |
| Median Household Income | $65,480 | $0 |
| Monthly Housing Costs | $295 | $0 |
| Real Estate Taxes | - | - |
Property Value by Mortgage Status in Raleigh
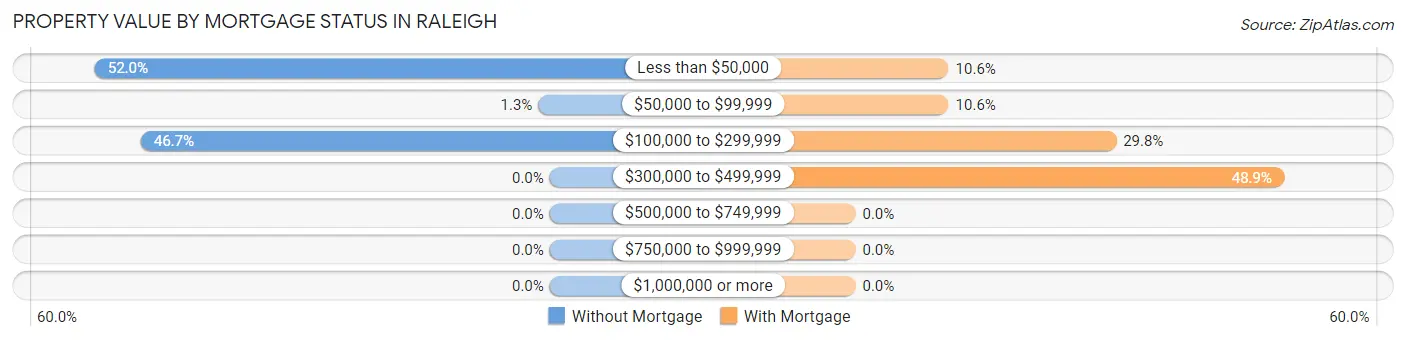
| Property Value | Without Mortgage | With Mortgage |
| Less than $50,000 | 119 (52.0%) | 5 (10.6%) |
| $50,000 to $99,999 | 3 (1.3%) | 5 (10.6%) |
| $100,000 to $299,999 | 107 (46.7%) | 14 (29.8%) |
| $300,000 to $499,999 | 0 (0.0%) | 23 (48.9%) |
| $500,000 to $749,999 | 0 (0.0%) | 0 (0.0%) |
| $750,000 to $999,999 | 0 (0.0%) | 0 (0.0%) |
| $1,000,000 or more | 0 (0.0%) | 0 (0.0%) |
| Total | 229 (100.0%) | 47 (100.0%) |
Household Income by Mortgage Status in Raleigh
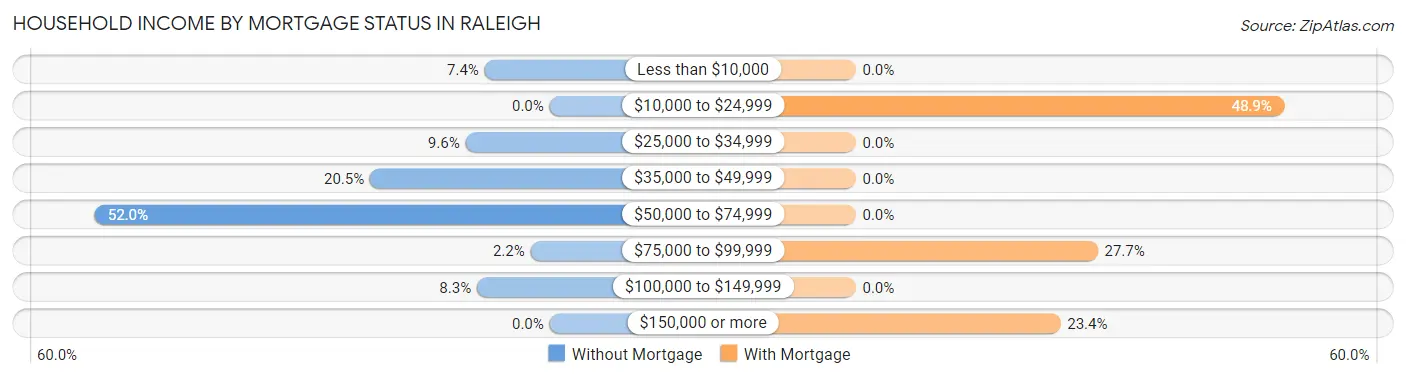
| Household Income | Without Mortgage | With Mortgage |
| Less than $10,000 | 17 (7.4%) | 0 (0.0%) |
| $10,000 to $24,999 | 0 (0.0%) | 23 (48.9%) |
| $25,000 to $34,999 | 22 (9.6%) | 0 (0.0%) |
| $35,000 to $49,999 | 47 (20.5%) | 0 (0.0%) |
| $50,000 to $74,999 | 119 (52.0%) | 0 (0.0%) |
| $75,000 to $99,999 | 5 (2.2%) | 13 (27.7%) |
| $100,000 to $149,999 | 19 (8.3%) | 0 (0.0%) |
| $150,000 or more | 0 (0.0%) | 11 (23.4%) |
| Total | 229 (100.0%) | 47 (100.0%) |
Property Value to Household Income Ratio in Raleigh
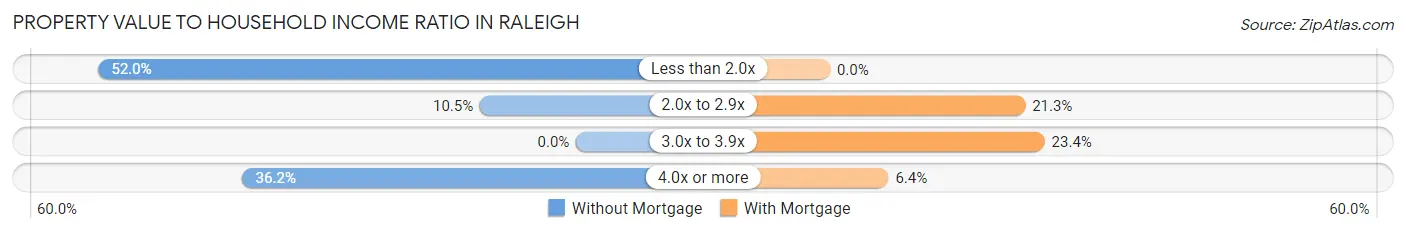
| Value-to-Income Ratio | Without Mortgage | With Mortgage |
| Less than 2.0x | 119 (52.0%) | 0 (0.0%) |
| 2.0x to 2.9x | 24 (10.5%) | 10 (21.3%) |
| 3.0x to 3.9x | 0 (0.0%) | 11 (23.4%) |
| 4.0x or more | 83 (36.2%) | 3 (6.4%) |
| Total | 229 (100.0%) | 47 (100.0%) |
Real Estate Taxes by Mortgage Status in Raleigh
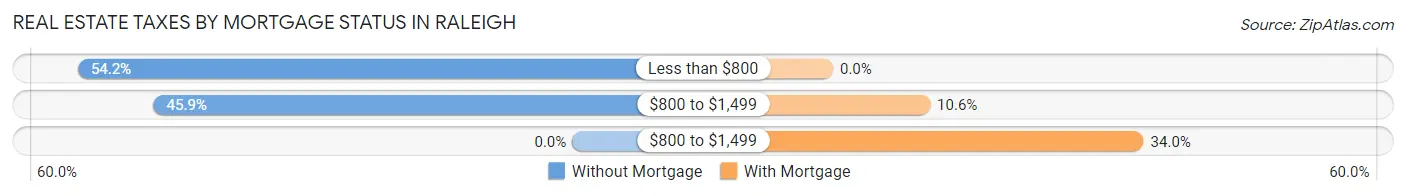
| Property Taxes | Without Mortgage | With Mortgage |
| Less than $800 | 124 (54.1%) | 0 (0.0%) |
| $800 to $1,499 | 105 (45.9%) | 5 (10.6%) |
| $800 to $1,499 | 0 (0.0%) | 16 (34.0%) |
| Total | 229 (100.0%) | 47 (100.0%) |
Health & Disability in Raleigh
Health Insurance Coverage by Age in Raleigh
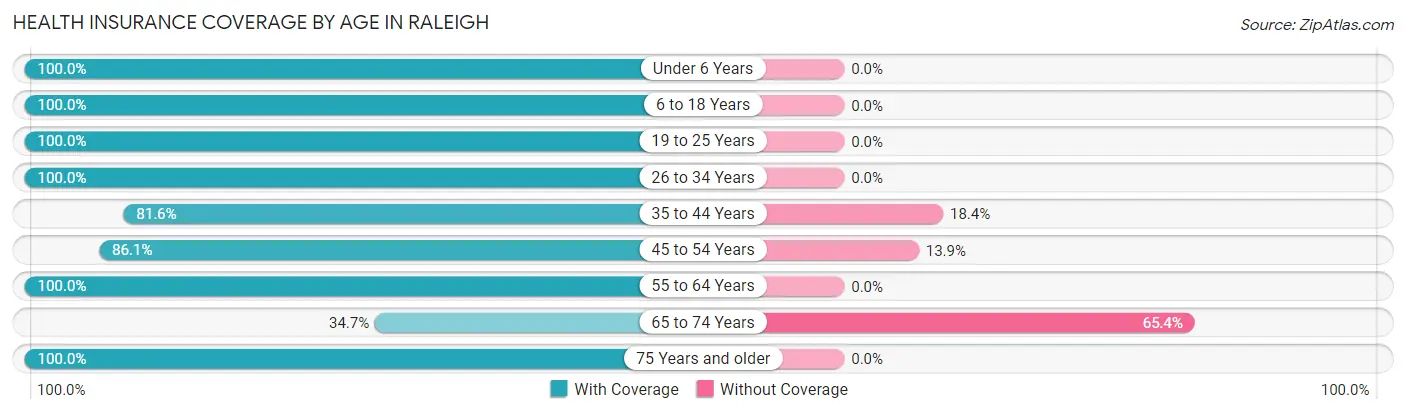
| Age Bracket | With Coverage | Without Coverage |
| Under 6 Years | 88 (100.0%) | 0 (0.0%) |
| 6 to 18 Years | 199 (100.0%) | 0 (0.0%) |
| 19 to 25 Years | 14 (100.0%) | 0 (0.0%) |
| 26 to 34 Years | 130 (100.0%) | 0 (0.0%) |
| 35 to 44 Years | 31 (81.6%) | 7 (18.4%) |
| 45 to 54 Years | 31 (86.1%) | 5 (13.9%) |
| 55 to 64 Years | 31 (100.0%) | 0 (0.0%) |
| 65 to 74 Years | 44 (34.6%) | 83 (65.3%) |
| 75 Years and older | 175 (100.0%) | 0 (0.0%) |
| Total | 743 (88.7%) | 95 (11.3%) |
Health Insurance Coverage by Citizenship Status in Raleigh
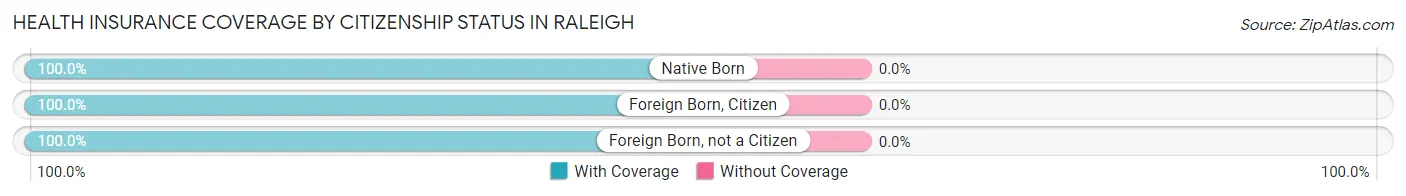
| Citizenship Status | With Coverage | Without Coverage |
| Native Born | 88 (100.0%) | 0 (0.0%) |
| Foreign Born, Citizen | 199 (100.0%) | 0 (0.0%) |
| Foreign Born, not a Citizen | 14 (100.0%) | 0 (0.0%) |
Health Insurance Coverage by Household Income in Raleigh
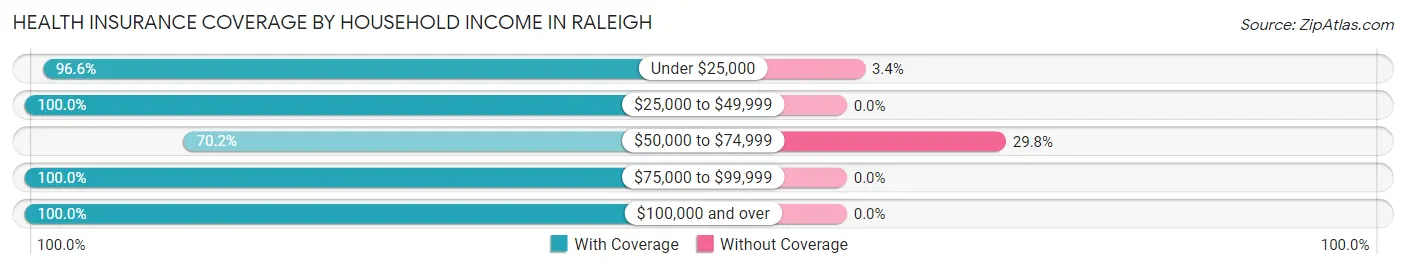
| Household Income | With Coverage | Without Coverage |
| Under $25,000 | 142 (96.6%) | 5 (3.4%) |
| $25,000 to $49,999 | 291 (100.0%) | 0 (0.0%) |
| $50,000 to $74,999 | 212 (70.2%) | 90 (29.8%) |
| $75,000 to $99,999 | 9 (100.0%) | 0 (0.0%) |
| $100,000 and over | 89 (100.0%) | 0 (0.0%) |
Public vs Private Health Insurance Coverage by Age in Raleigh
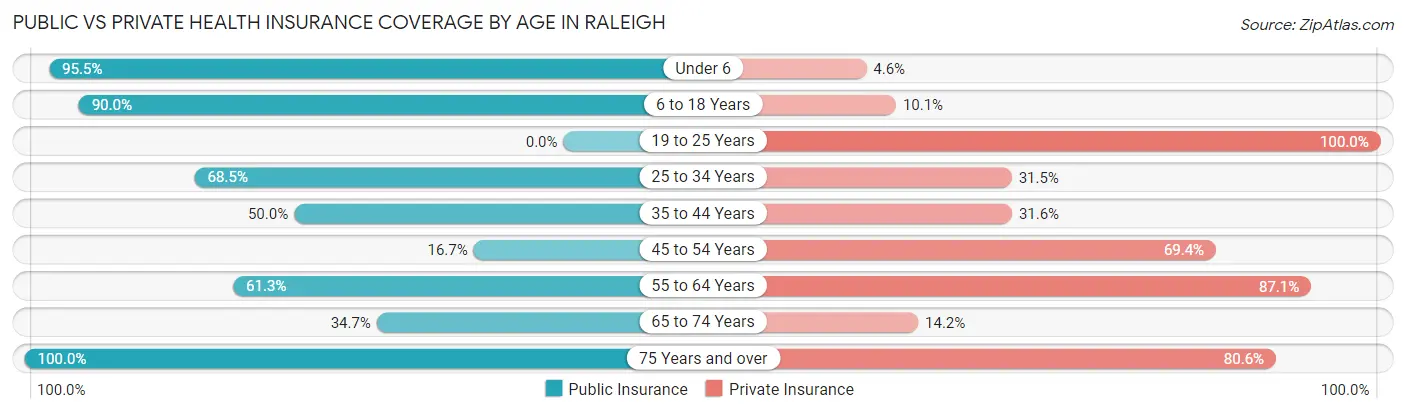
| Age Bracket | Public Insurance | Private Insurance |
| Under 6 | 84 (95.5%) | 4 (4.5%) |
| 6 to 18 Years | 179 (89.9%) | 20 (10.1%) |
| 19 to 25 Years | 0 (0.0%) | 14 (100.0%) |
| 25 to 34 Years | 89 (68.5%) | 41 (31.5%) |
| 35 to 44 Years | 19 (50.0%) | 12 (31.6%) |
| 45 to 54 Years | 6 (16.7%) | 25 (69.4%) |
| 55 to 64 Years | 19 (61.3%) | 27 (87.1%) |
| 65 to 74 Years | 44 (34.6%) | 18 (14.2%) |
| 75 Years and over | 175 (100.0%) | 141 (80.6%) |
| Total | 615 (73.4%) | 302 (36.0%) |
Disability Status by Sex by Age in Raleigh
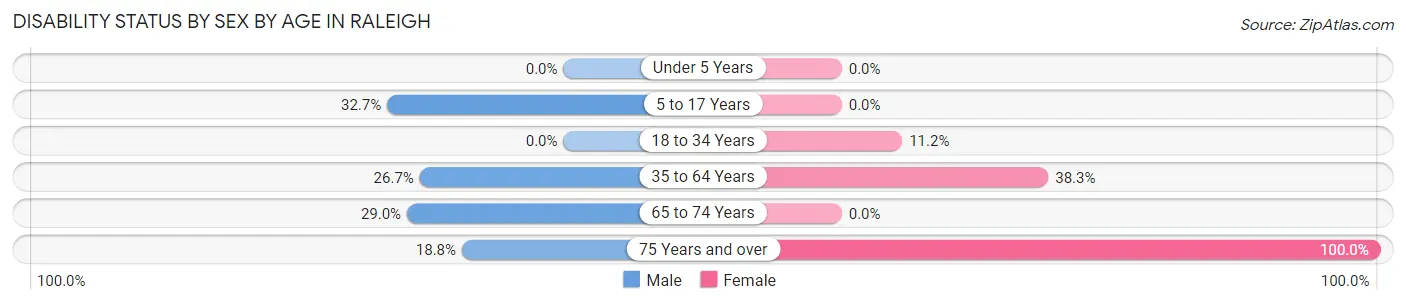
| Age Bracket | Male | Female |
| Under 5 Years | 0 (0.0%) | 0 (0.0%) |
| 5 to 17 Years | 18 (32.7%) | 0 (0.0%) |
| 18 to 34 Years | 0 (0.0%) | 11 (11.2%) |
| 35 to 64 Years | 12 (26.7%) | 23 (38.3%) |
| 65 to 74 Years | 9 (29.0%) | 0 (0.0%) |
| 75 Years and over | 26 (18.8%) | 37 (100.0%) |
Disability Class by Sex by Age in Raleigh
Disability Class: Hearing Difficulty
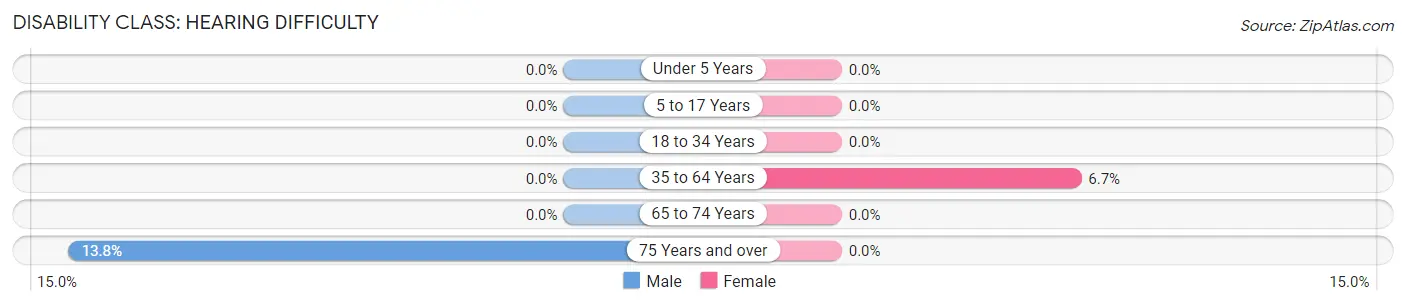
| Age Bracket | Male | Female |
| Under 5 Years | 0 (0.0%) | 0 (0.0%) |
| 5 to 17 Years | 0 (0.0%) | 0 (0.0%) |
| 18 to 34 Years | 0 (0.0%) | 0 (0.0%) |
| 35 to 64 Years | 0 (0.0%) | 4 (6.7%) |
| 65 to 74 Years | 0 (0.0%) | 0 (0.0%) |
| 75 Years and over | 19 (13.8%) | 0 (0.0%) |
Disability Class: Vision Difficulty
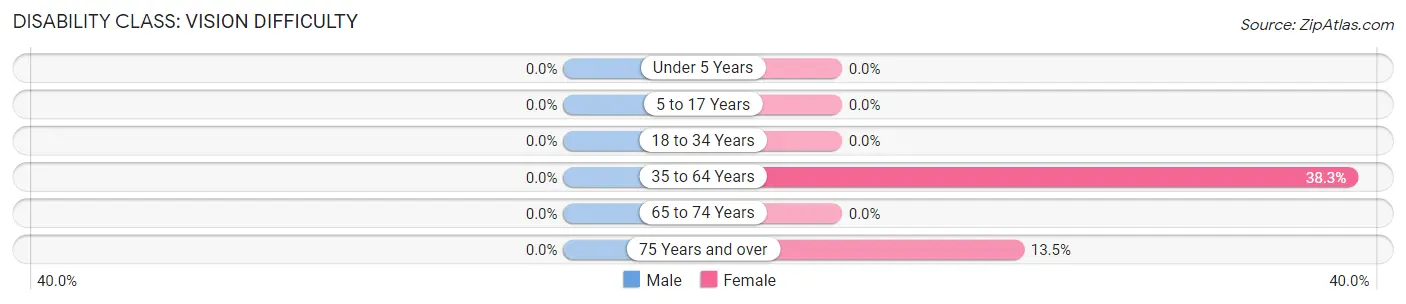
| Age Bracket | Male | Female |
| Under 5 Years | 0 (0.0%) | 0 (0.0%) |
| 5 to 17 Years | 0 (0.0%) | 0 (0.0%) |
| 18 to 34 Years | 0 (0.0%) | 0 (0.0%) |
| 35 to 64 Years | 0 (0.0%) | 23 (38.3%) |
| 65 to 74 Years | 0 (0.0%) | 0 (0.0%) |
| 75 Years and over | 0 (0.0%) | 5 (13.5%) |
Disability Class: Cognitive Difficulty
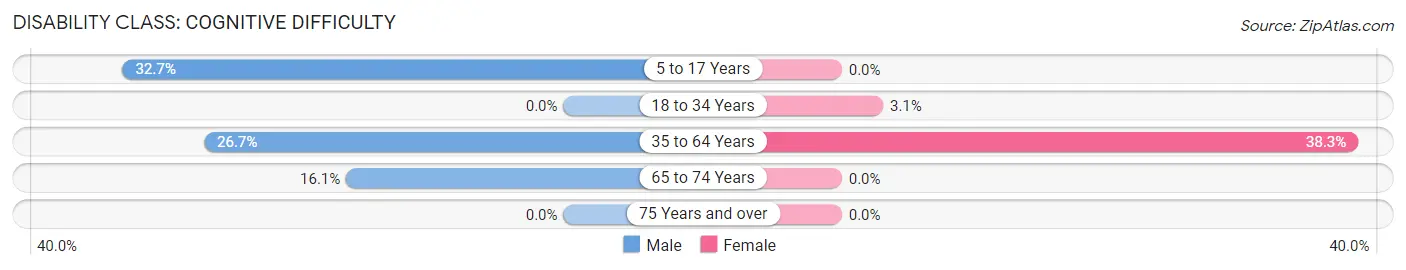
| Age Bracket | Male | Female |
| 5 to 17 Years | 18 (32.7%) | 0 (0.0%) |
| 18 to 34 Years | 0 (0.0%) | 3 (3.1%) |
| 35 to 64 Years | 12 (26.7%) | 23 (38.3%) |
| 65 to 74 Years | 5 (16.1%) | 0 (0.0%) |
| 75 Years and over | 0 (0.0%) | 0 (0.0%) |
Disability Class: Ambulatory Difficulty
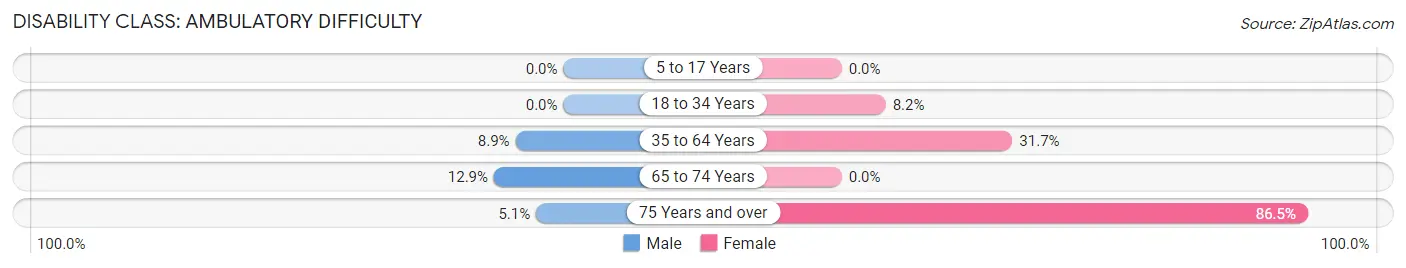
| Age Bracket | Male | Female |
| 5 to 17 Years | 0 (0.0%) | 0 (0.0%) |
| 18 to 34 Years | 0 (0.0%) | 8 (8.2%) |
| 35 to 64 Years | 4 (8.9%) | 19 (31.7%) |
| 65 to 74 Years | 4 (12.9%) | 0 (0.0%) |
| 75 Years and over | 7 (5.1%) | 32 (86.5%) |
Disability Class: Self-Care Difficulty
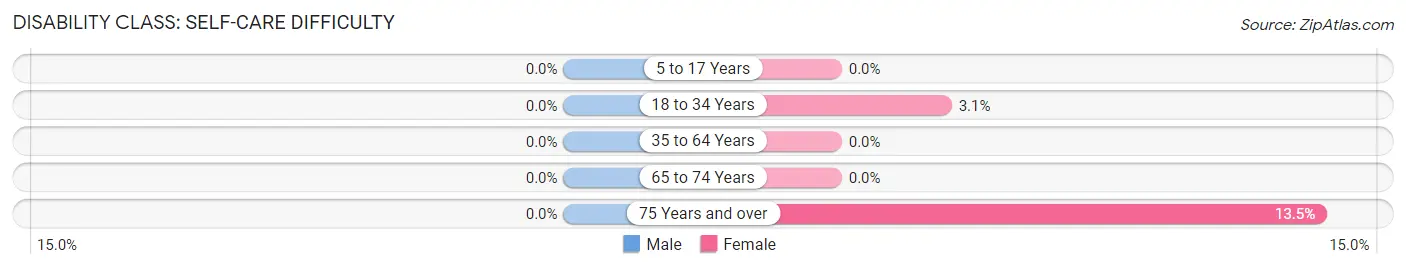
| Age Bracket | Male | Female |
| 5 to 17 Years | 0 (0.0%) | 0 (0.0%) |
| 18 to 34 Years | 0 (0.0%) | 3 (3.1%) |
| 35 to 64 Years | 0 (0.0%) | 0 (0.0%) |
| 65 to 74 Years | 0 (0.0%) | 0 (0.0%) |
| 75 Years and over | 0 (0.0%) | 5 (13.5%) |
Technology Access in Raleigh
Computing Device Access in Raleigh
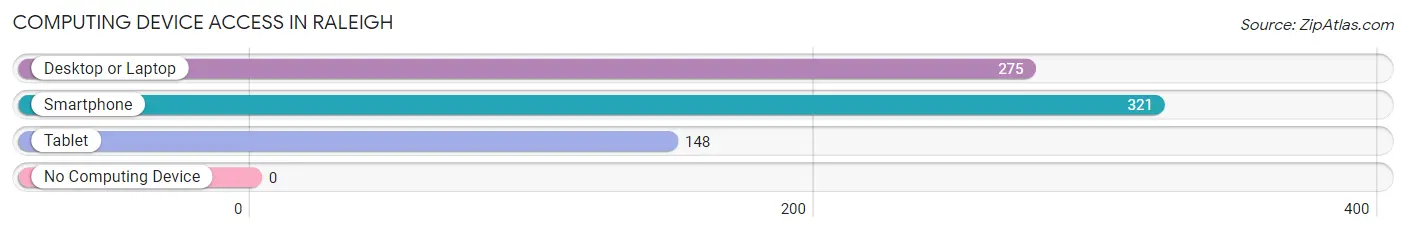
| Device Type | # Households | % Households |
| Desktop or Laptop | 275 | 85.7% |
| Smartphone | 321 | 100.0% |
| Tablet | 148 | 46.1% |
| No Computing Device | 0 | 0.0% |
| Total | 321 | 100.0% |
Internet Access in Raleigh
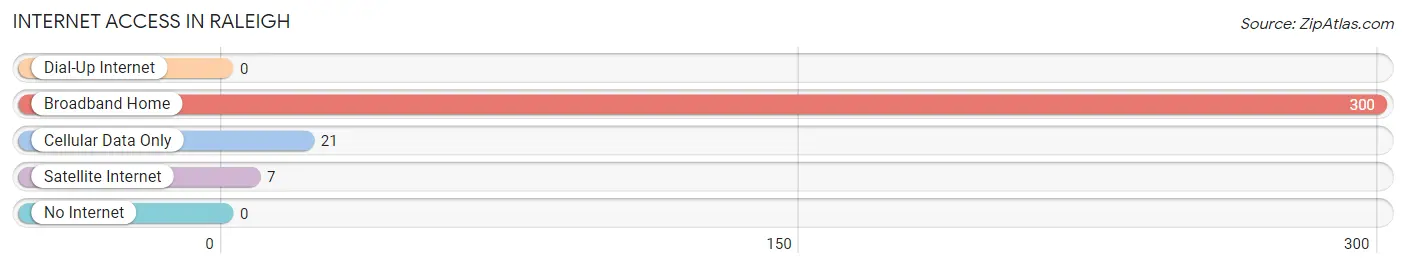
| Internet Type | # Households | % Households |
| Dial-Up Internet | 0 | 0.0% |
| Broadband Home | 300 | 93.5% |
| Cellular Data Only | 21 | 6.5% |
| Satellite Internet | 7 | 2.2% |
| No Internet | 0 | 0.0% |
| Total | 321 | 100.0% |
Raleigh Summary
Raleigh is a small town located in the panhandle of Florida, in the county of Washington. It is situated on the banks of the Choctawhatchee River, and is part of the larger Fort Walton Beach-Crestview-Destin Metropolitan Statistical Area. The town has a population of just over 1,000 people, and is known for its rural charm and small-town atmosphere.
History
Raleigh was first settled in the early 1800s by a group of settlers from Georgia. The town was originally known as “Raleigh’s Crossroads”, and was named after the nearby town of Raleigh, Georgia. The town was officially incorporated in 1887, and was named after the nearby town of Raleigh, Georgia.
In the early 1900s, Raleigh was a thriving agricultural community, with cotton, corn, and peanuts being the main crops. The town also had a thriving lumber industry, and was home to several sawmills. In the 1920s, the town began to experience a decline in population, as many of the residents moved away to larger cities in search of better job opportunities.
Geography
Raleigh is located in the panhandle of Florida, in the county of Washington. It is situated on the banks of the Choctawhatchee River, and is part of the larger Fort Walton Beach-Crestview-Destin Metropolitan Statistical Area. The town has a total area of 1.2 square miles, all of which is land.
The town is located in a humid subtropical climate zone, and experiences hot, humid summers and mild winters. The average temperature in the summer is around 90 degrees Fahrenheit, and the average temperature in the winter is around 50 degrees Fahrenheit.
Economy
Raleigh’s economy is largely based on agriculture and tourism. The town is home to several farms, which produce cotton, corn, peanuts, and other crops. The town is also home to several tourist attractions, such as the Choctawhatchee River, which is popular for fishing and boating.
The town is also home to several small businesses, such as restaurants, shops, and other services. The town is also home to several manufacturing companies, which produce a variety of products, such as furniture, clothing, and other items.
Demographics
As of the 2010 census, Raleigh had a population of 1,072 people. The racial makeup of the town was 94.3% White, 2.2% African American, 0.3% Native American, 0.7% Asian, 0.1% Pacific Islander, 0.7% from other races, and 1.7% from two or more races. Hispanic or Latino of any race were 2.2% of the population.
The median income for a household in the town was $31,250, and the median income for a family was $37,500. The per capita income for the town was $17,845. About 15.2% of families and 17.7% of the population were below the poverty line, including 25.2% of those under age 18 and 8.3% of those age 65 or over.
Common Questions
What is Per Capita Income in Raleigh?
Per Capita income in Raleigh is $18,429.
What is the Median Family Income in Raleigh?
Median Family Income in Raleigh is $65,536.
What is the Median Household income in Raleigh?
Median Household Income in Raleigh is $58,438.
What is Income or Wage Gap in Raleigh?
Income or Wage Gap in Raleigh is 38.8%.
Women in Raleigh earn 61.2 cents for every dollar earned by a man.
What is Inequality or Gini Index in Raleigh?
Inequality or Gini Index in Raleigh is 0.30.
What is the Total Population of Raleigh?
Total Population of Raleigh is 838.
What is the Total Male Population of Raleigh?
Total Male Population of Raleigh is 376.
What is the Total Female Population of Raleigh?
Total Female Population of Raleigh is 462.
What is the Ratio of Males per 100 Females in Raleigh?
There are 81.39 Males per 100 Females in Raleigh.
What is the Ratio of Females per 100 Males in Raleigh?
There are 122.87 Females per 100 Males in Raleigh.
What is the Median Population Age in Raleigh?
Median Population Age in Raleigh is 34.7 Years.
What is the Average Family Size in Raleigh
Average Family Size in Raleigh is 3.0 People.
What is the Average Household Size in Raleigh
Average Household Size in Raleigh is 2.6 People.
How Large is the Labor Force in Raleigh?
There are 204 People in the Labor Forcein in Raleigh.
What is the Percentage of People in the Labor Force in Raleigh?
36.0% of People are in the Labor Force in Raleigh.