Darling, MS Map & Demographics
Darling Map
Darling Overview
$13,608
PER CAPITA INCOME
$55,524
AVG FAMILY INCOME
0.32
INEQUALITY / GINI INDEX
157
TOTAL POPULATION
63
MALE POPULATION
94
FEMALE POPULATION
67.02
MALES / 100 FEMALES
149.21
FEMALES / 100 MALES
25.6
MEDIAN AGE
2.2
AVG FAMILY SIZE
1.7
AVG HOUSEHOLD SIZE
51
LABOR FORCE [ PEOPLE ]
36.4%
PERCENT IN LABOR FORCE
Darling Zip Codes
Darling Area Codes
Income in Darling
Income Overview in Darling
| Characteristic | Number | Measure |
| Per Capita Income | 157 | $13,608 |
| Median Family Income | 57 | $55,524 |
| Mean Family Income | 57 | $43,539 |
| Median Household Income | 91 | $0 |
| Mean Household Income | 91 | $32,425 |
| Income Deficit | 57 | $0 |
| Wage / Income Gap (%) | 157 | 0.00% |
| Wage / Income Gap ($) | 157 | 100.00¢ per $1 |
| Gini / Inequality Index | 157 | 0.32 |
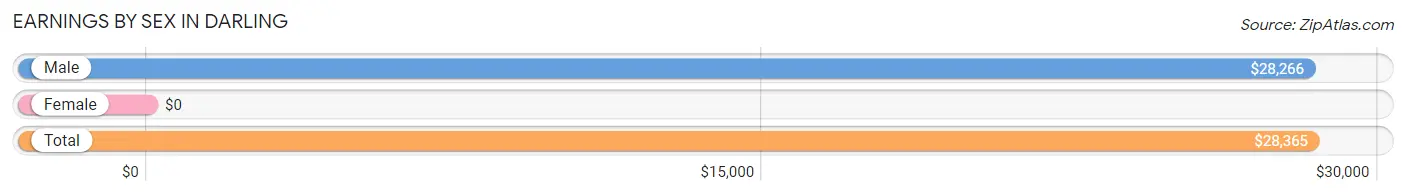
Earnings by Sex in Darling
| Sex | Number | Average Earnings |
| Male | 43 (84.3%) | $28,266 |
| Female | 8 (15.7%) | $0 |
| Total | 51 (100.0%) | $28,365 |
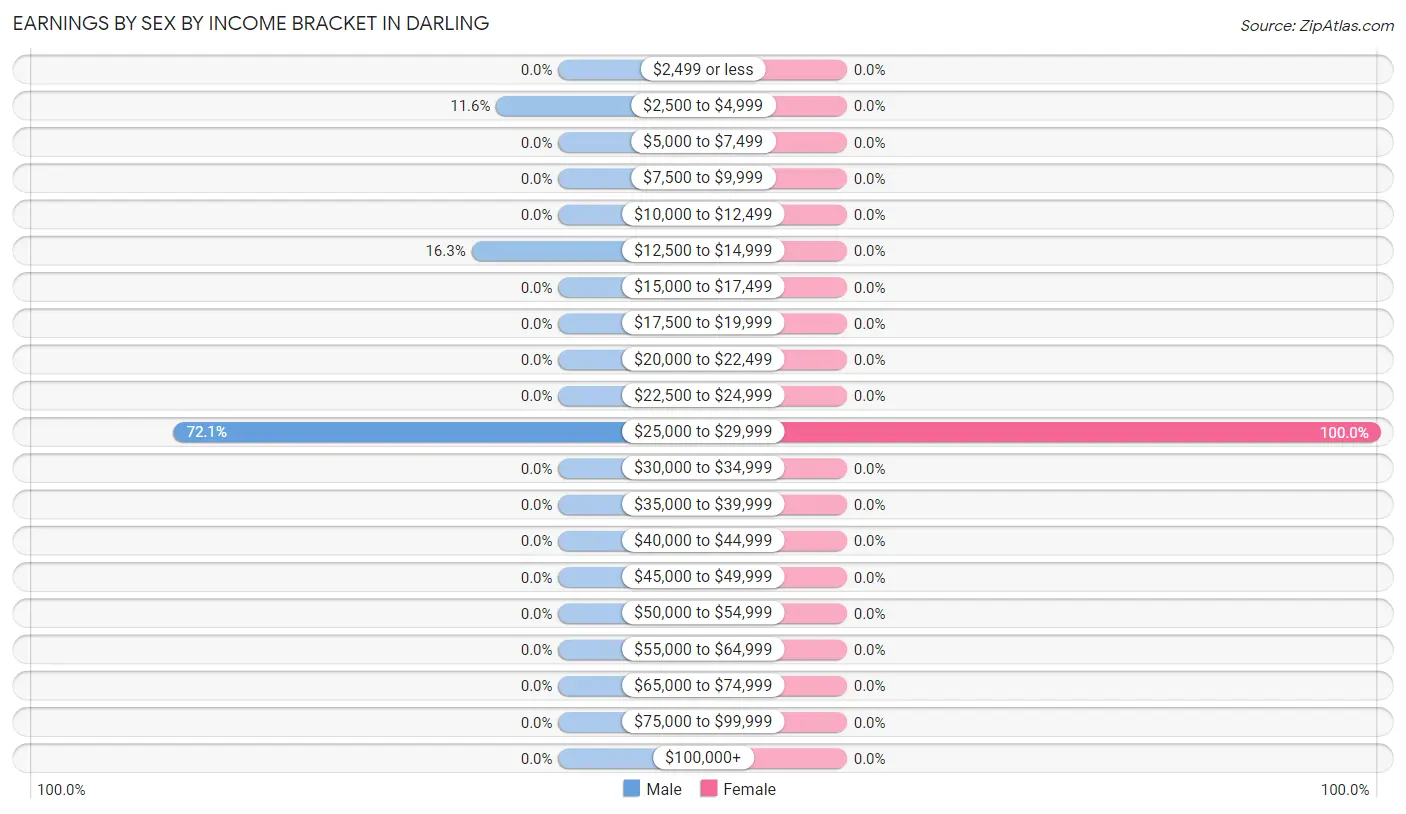
Earnings by Sex by Income Bracket in Darling
The most common earnings brackets in Darling are $25,000 to $29,999 for men (31 | 72.1%) and $25,000 to $29,999 for women (8 | 100.0%).
| Income | Male | Female |
| $2,499 or less | 0 (0.0%) | 0 (0.0%) |
| $2,500 to $4,999 | 5 (11.6%) | 0 (0.0%) |
| $5,000 to $7,499 | 0 (0.0%) | 0 (0.0%) |
| $7,500 to $9,999 | 0 (0.0%) | 0 (0.0%) |
| $10,000 to $12,499 | 0 (0.0%) | 0 (0.0%) |
| $12,500 to $14,999 | 7 (16.3%) | 0 (0.0%) |
| $15,000 to $17,499 | 0 (0.0%) | 0 (0.0%) |
| $17,500 to $19,999 | 0 (0.0%) | 0 (0.0%) |
| $20,000 to $22,499 | 0 (0.0%) | 0 (0.0%) |
| $22,500 to $24,999 | 0 (0.0%) | 0 (0.0%) |
| $25,000 to $29,999 | 31 (72.1%) | 8 (100.0%) |
| $30,000 to $34,999 | 0 (0.0%) | 0 (0.0%) |
| $35,000 to $39,999 | 0 (0.0%) | 0 (0.0%) |
| $40,000 to $44,999 | 0 (0.0%) | 0 (0.0%) |
| $45,000 to $49,999 | 0 (0.0%) | 0 (0.0%) |
| $50,000 to $54,999 | 0 (0.0%) | 0 (0.0%) |
| $55,000 to $64,999 | 0 (0.0%) | 0 (0.0%) |
| $65,000 to $74,999 | 0 (0.0%) | 0 (0.0%) |
| $75,000 to $99,999 | 0 (0.0%) | 0 (0.0%) |
| $100,000+ | 0 (0.0%) | 0 (0.0%) |
| Total | 43 (100.0%) | 8 (100.0%) |
Earnings by Sex by Educational Attainment in Darling
| Educational Attainment | Male Income | Female Income |
| Less than High School | - | - |
| High School Diploma | - | - |
| College or Associate's Degree | - | - |
| Bachelor's Degree | - | - |
| Graduate Degree | - | - |
| Total | - | - |
Family Income in Darling
Family Income Brackets in Darling
According to the Darling family income data, there are 35 families falling into the $50,000 to $74,999 income range, which is the most common income bracket and makes up 61.4% of all families.
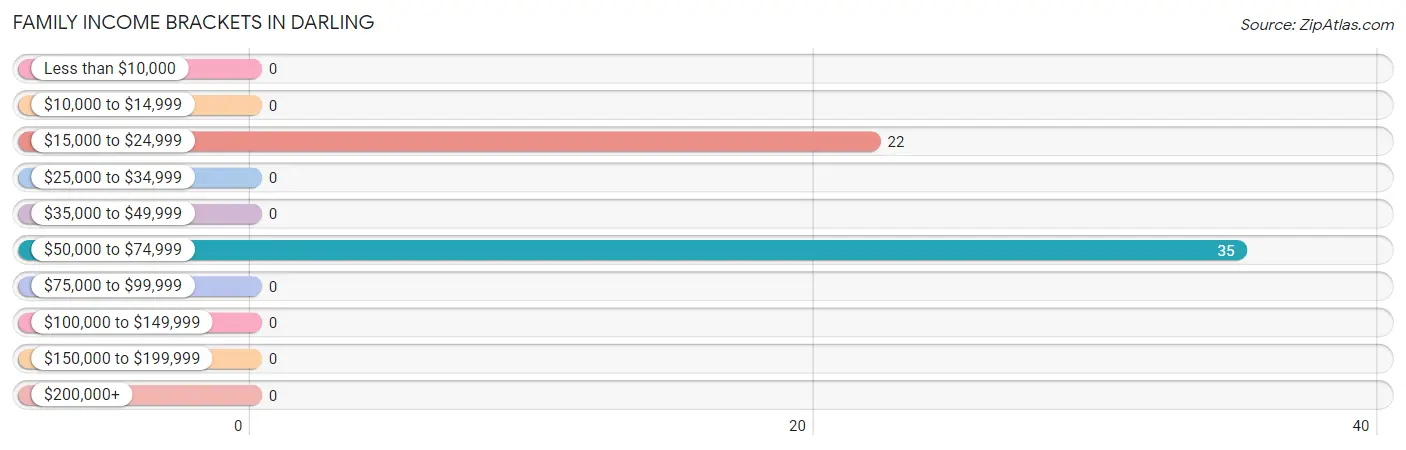
| Income Bracket | # Families | % Families |
| Less than $10,000 | 0 | 0.0% |
| $10,000 to $14,999 | 0 | 0.0% |
| $15,000 to $24,999 | 22 | 38.6% |
| $25,000 to $34,999 | 0 | 0.0% |
| $35,000 to $49,999 | 0 | 0.0% |
| $50,000 to $74,999 | 35 | 61.4% |
| $75,000 to $99,999 | 0 | 0.0% |
| $100,000 to $149,999 | 0 | 0.0% |
| $150,000 to $199,999 | 0 | 0.0% |
| $200,000+ | 0 | 0.0% |
Family Income by Famaliy Size in Darling
| Income Bracket | # Families | Median Income |
| 2-Person Families | 4 (7.0%) | $0 |
| 3-Person Families | 22 (38.6%) | $0 |
| 4-Person Families | 31 (54.4%) | $0 |
| 5-Person Families | 0 (0.0%) | $0 |
| 6-Person Families | 0 (0.0%) | $0 |
| 7+ Person Families | 0 (0.0%) | $0 |
| Total | 57 (100.0%) | $55,524 |
Family Income by Number of Earners in Darling
| Number of Earners | # Families | Median Income |
| No Earners | 26 (45.6%) | $0 |
| 1 Earner | 0 (0.0%) | $0 |
| 2 Earners | 31 (54.4%) | $0 |
| 3+ Earners | 0 (0.0%) | $0 |
| Total | 57 (100.0%) | $55,524 |
Household Income in Darling
Household Income Brackets in Darling
With 35 households falling in the category, the $50,000 to $74,999 income range is the most frequent in Darling, accounting for 38.5% of all households.
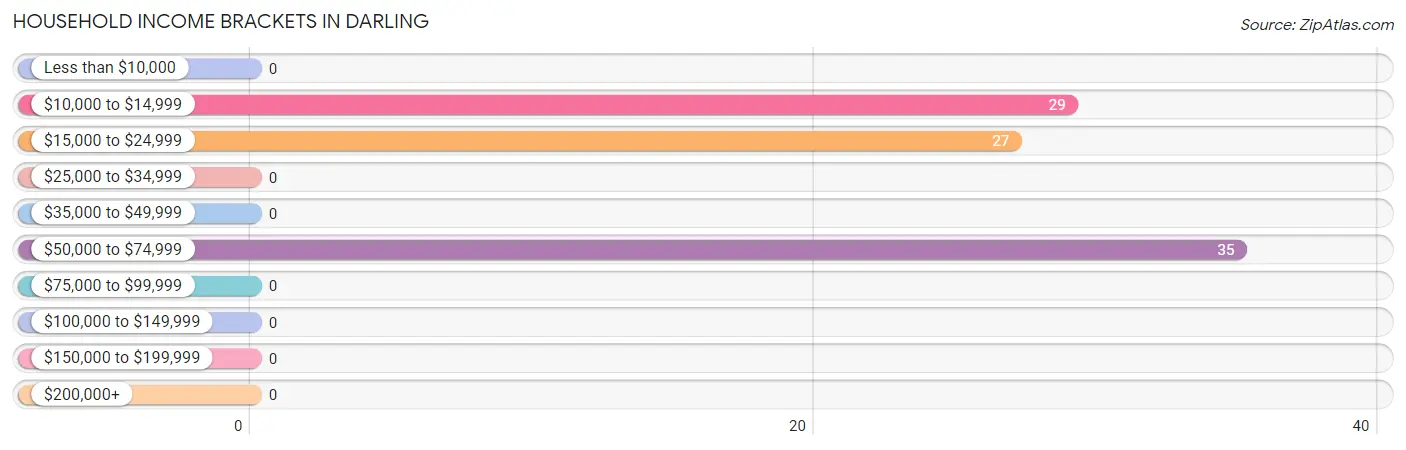
| Income Bracket | # Households | % Households |
| Less than $10,000 | 0 | 0.0% |
| $10,000 to $14,999 | 29 | 31.9% |
| $15,000 to $24,999 | 27 | 29.7% |
| $25,000 to $34,999 | 0 | 0.0% |
| $35,000 to $49,999 | 0 | 0.0% |
| $50,000 to $74,999 | 35 | 38.5% |
| $75,000 to $99,999 | 0 | 0.0% |
| $100,000 to $149,999 | 0 | 0.0% |
| $150,000 to $199,999 | 0 | 0.0% |
| $200,000+ | 0 | 0.0% |
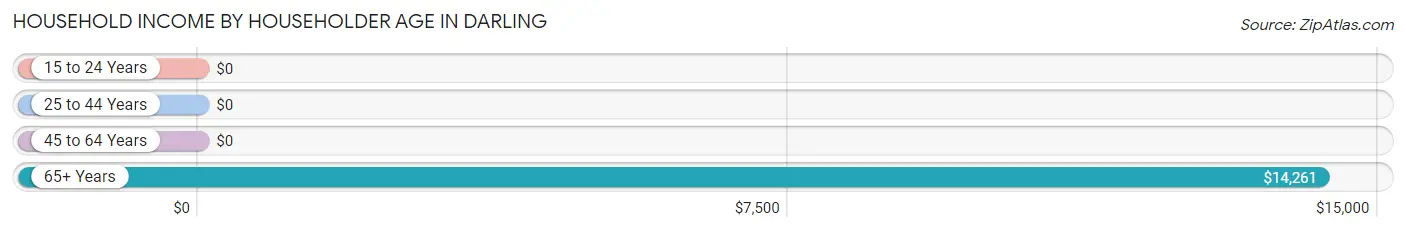
Household Income by Householder Age in Darling
The median household income in Darling is $0, with the highest median household income of $14,261 found in the 65+ years age bracket for the primary householder. A total of 31 households (34.1%) fall into this category. Meanwhile, the 15 to 24 years age bracket for the primary householder has the lowest median household income of $0, with 31 households (34.1%) in this group.
| Income Bracket | # Households | Median Income |
| 15 to 24 Years | 31 (34.1%) | $0 |
| 25 to 44 Years | 22 (24.2%) | $0 |
| 45 to 64 Years | 7 (7.7%) | $0 |
| 65+ Years | 31 (34.1%) | $14,261 |
| Total | 91 (100.0%) | $0 |
Poverty in Darling
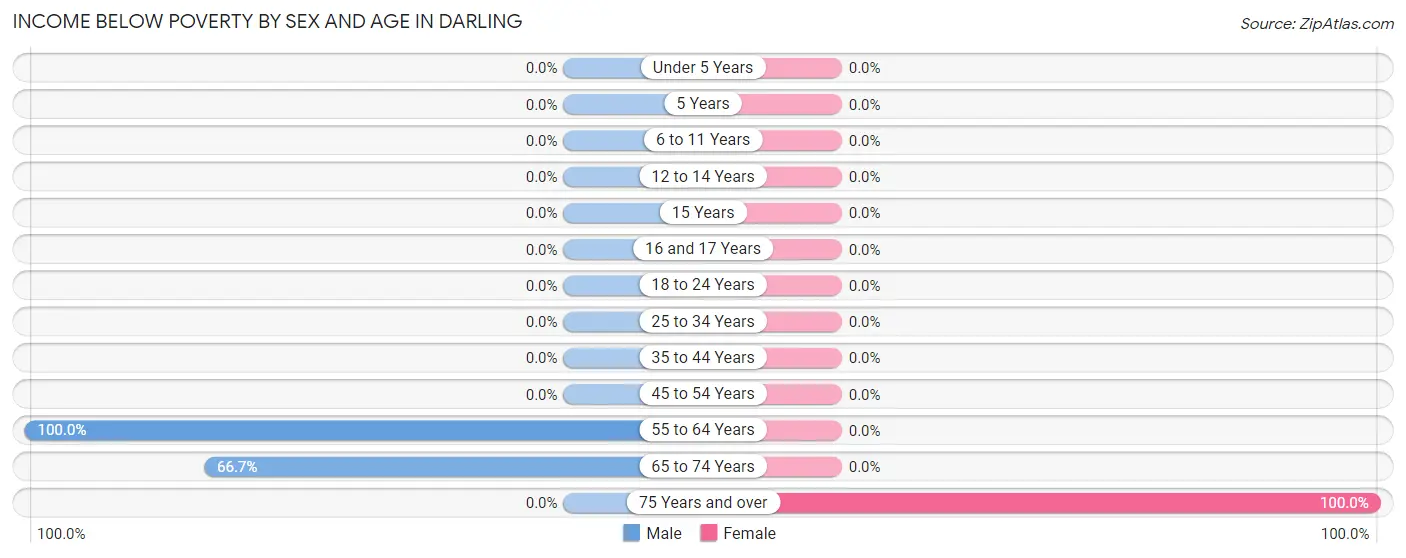
Income Below Poverty by Sex and Age in Darling
With 27.0% poverty level for males and 12.8% for females among the residents of Darling, 55 to 64 year old males and 75 year old and over females are the most vulnerable to poverty, with 7 males (100.0%) and 12 females (100.0%) in their respective age groups living below the poverty level.
| Age Bracket | Male | Female |
| Under 5 Years | 0 (0.0%) | 0 (0.0%) |
| 5 Years | 0 (0.0%) | 0 (0.0%) |
| 6 to 11 Years | 0 (0.0%) | 0 (0.0%) |
| 12 to 14 Years | 0 (0.0%) | 0 (0.0%) |
| 15 Years | 0 (0.0%) | 0 (0.0%) |
| 16 and 17 Years | 0 (0.0%) | 0 (0.0%) |
| 18 to 24 Years | 0 (0.0%) | 0 (0.0%) |
| 25 to 34 Years | 0 (0.0%) | 0 (0.0%) |
| 35 to 44 Years | 0 (0.0%) | 0 (0.0%) |
| 45 to 54 Years | 0 (0.0%) | 0 (0.0%) |
| 55 to 64 Years | 7 (100.0%) | 0 (0.0%) |
| 65 to 74 Years | 10 (66.7%) | 0 (0.0%) |
| 75 Years and over | 0 (0.0%) | 12 (100.0%) |
| Total | 17 (27.0%) | 12 (12.8%) |
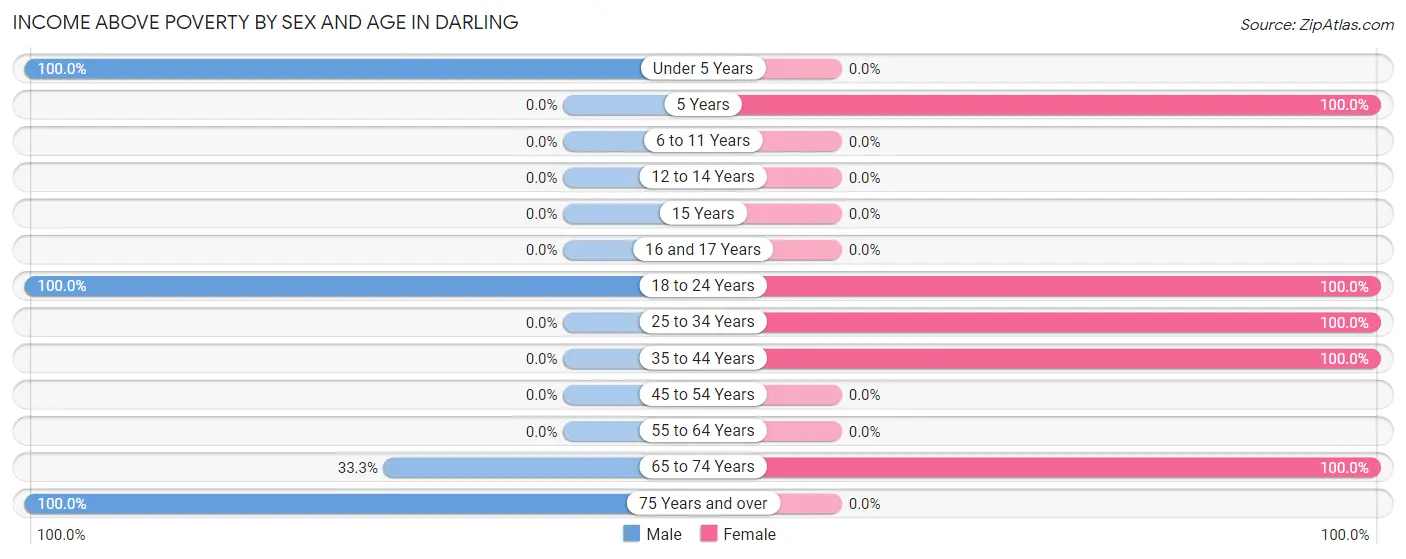
Income Above Poverty by Sex and Age in Darling
According to the poverty statistics in Darling, males aged under 5 years and females aged 5 years are the age groups that are most secure financially, with 100.0% of males and 100.0% of females in these age groups living above the poverty line.
| Age Bracket | Male | Female |
| Under 5 Years | 6 (100.0%) | 0 (0.0%) |
| 5 Years | 0 (0.0%) | 11 (100.0%) |
| 6 to 11 Years | 0 (0.0%) | 0 (0.0%) |
| 12 to 14 Years | 0 (0.0%) | 0 (0.0%) |
| 15 Years | 0 (0.0%) | 0 (0.0%) |
| 16 and 17 Years | 0 (0.0%) | 0 (0.0%) |
| 18 to 24 Years | 31 (100.0%) | 25 (100.0%) |
| 25 to 34 Years | 0 (0.0%) | 18 (100.0%) |
| 35 to 44 Years | 0 (0.0%) | 22 (100.0%) |
| 45 to 54 Years | 0 (0.0%) | 0 (0.0%) |
| 55 to 64 Years | 0 (0.0%) | 0 (0.0%) |
| 65 to 74 Years | 5 (33.3%) | 6 (100.0%) |
| 75 Years and over | 4 (100.0%) | 0 (0.0%) |
| Total | 46 (73.0%) | 82 (87.2%) |
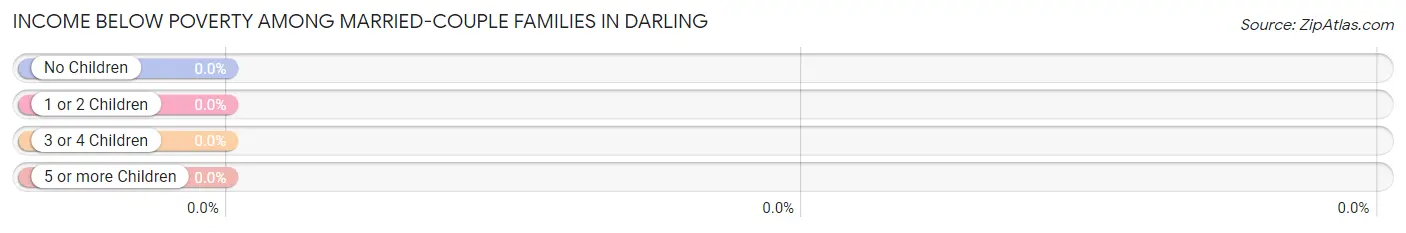
Income Below Poverty Among Married-Couple Families in Darling
| Children | Above Poverty | Below Poverty |
| No Children | 4 (100.0%) | 0 (0.0%) |
| 1 or 2 Children | 31 (100.0%) | 0 (0.0%) |
| 3 or 4 Children | 0 (0.0%) | 0 (0.0%) |
| 5 or more Children | 0 (0.0%) | 0 (0.0%) |
| Total | 35 (100.0%) | 0 (0.0%) |
Income Below Poverty Among Single-Parent Households in Darling
| Children | Single Father | Single Mother |
| No Children | 0 (0.0%) | 0 (0.0%) |
| 1 or 2 Children | 0 (0.0%) | 0 (0.0%) |
| 3 or 4 Children | 0 (0.0%) | 0 (0.0%) |
| 5 or more Children | 0 (0.0%) | 0 (0.0%) |
| Total | 0 (0.0%) | 0 (0.0%) |
Income Below Poverty Among Married-Couple vs Single-Parent Households in Darling
| Children | Married-Couple Families | Single-Parent Households |
| No Children | 0 (0.0%) | 0 (0.0%) |
| 1 or 2 Children | 0 (0.0%) | 0 (0.0%) |
| 3 or 4 Children | 0 (0.0%) | 0 (0.0%) |
| 5 or more Children | 0 (0.0%) | 0 (0.0%) |
| Total | 0 (0.0%) | 0 (0.0%) |
Race in Darling
The most populous races in Darling are Black / African American (142 | 90.4%), and White / Caucasian (15 | 9.6%).
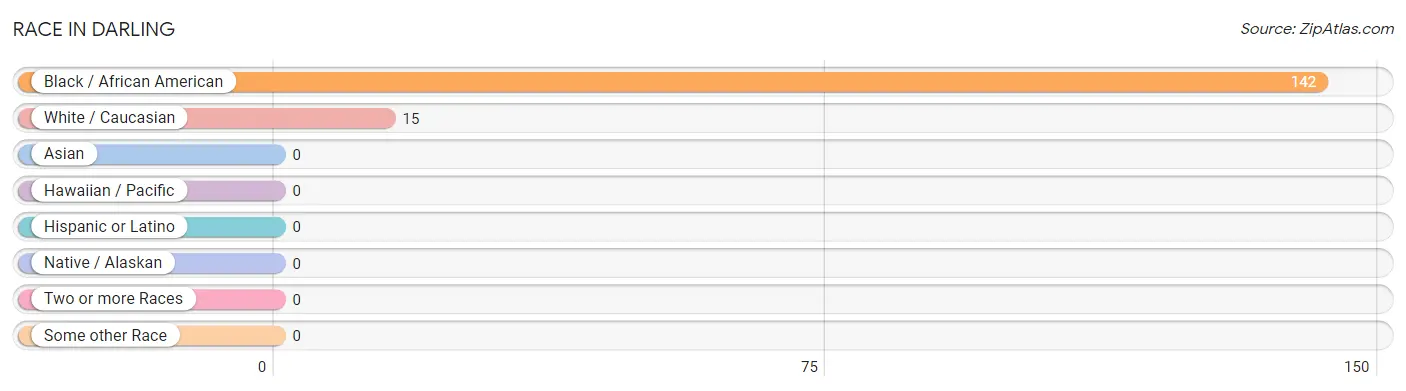
| Race | # Population | % Population |
| Asian | 0 | 0.0% |
| Black / African American | 142 | 90.4% |
| Hawaiian / Pacific | 0 | 0.0% |
| Hispanic or Latino | 0 | 0.0% |
| Native / Alaskan | 0 | 0.0% |
| White / Caucasian | 15 | 9.6% |
| Two or more Races | 0 | 0.0% |
| Some other Race | 0 | 0.0% |
| Total | 157 | 100.0% |
Ancestry in Darling
The most populous ancestries reported in Darling are , and American (10 | 6.4%), together accounting for 6.4% of all Darling residents.

| Ancestry | # Population | % Population |
| American | 10 | 6.4% | View All 1 Rows |
Immigrants in Darling

| Immigration Origin | # Population | % Population | View All 0 Rows |
Sex and Age in Darling
Sex and Age in Darling
The most populous age groups in Darling are 20 to 24 Years (31 | 49.2%) for men and 20 to 24 Years (25 | 26.6%) for women.
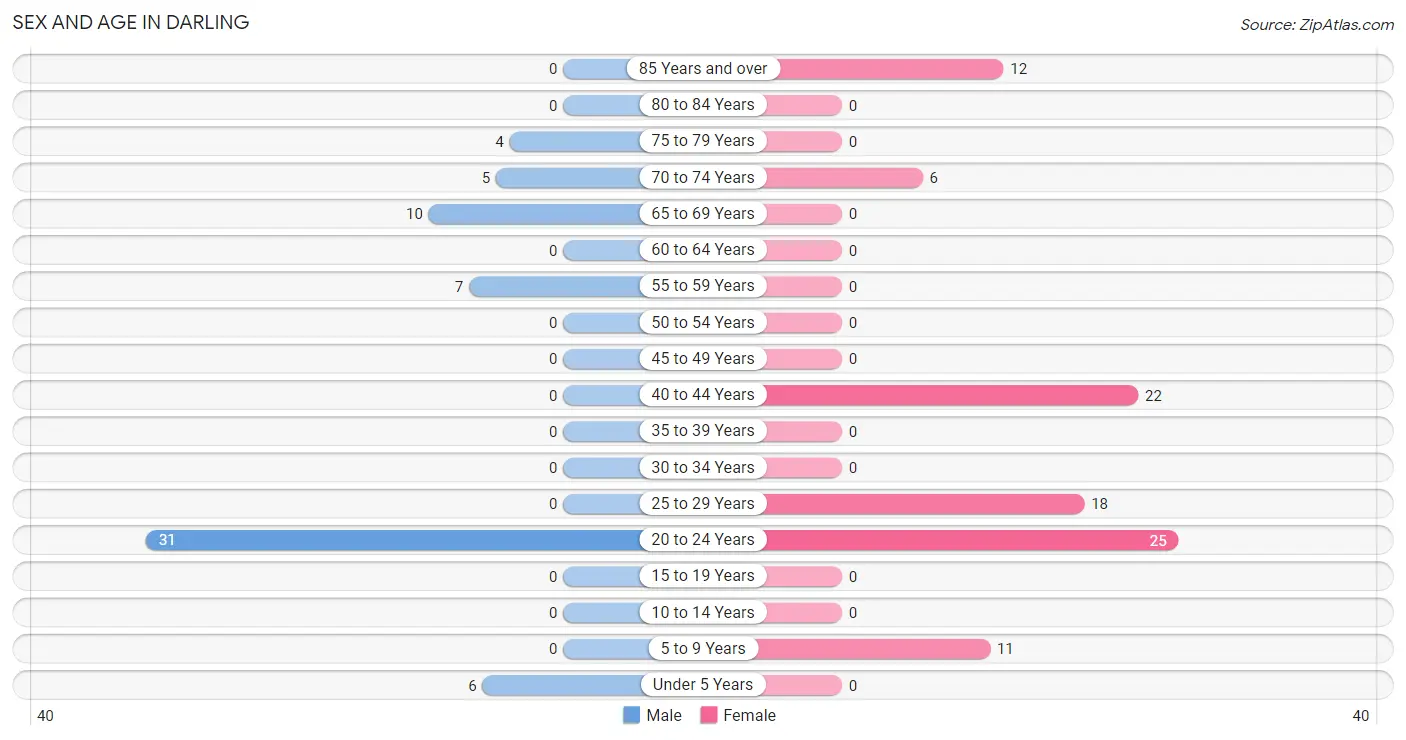
| Age Bracket | Male | Female |
| Under 5 Years | 6 (9.5%) | 0 (0.0%) |
| 5 to 9 Years | 0 (0.0%) | 11 (11.7%) |
| 10 to 14 Years | 0 (0.0%) | 0 (0.0%) |
| 15 to 19 Years | 0 (0.0%) | 0 (0.0%) |
| 20 to 24 Years | 31 (49.2%) | 25 (26.6%) |
| 25 to 29 Years | 0 (0.0%) | 18 (19.2%) |
| 30 to 34 Years | 0 (0.0%) | 0 (0.0%) |
| 35 to 39 Years | 0 (0.0%) | 0 (0.0%) |
| 40 to 44 Years | 0 (0.0%) | 22 (23.4%) |
| 45 to 49 Years | 0 (0.0%) | 0 (0.0%) |
| 50 to 54 Years | 0 (0.0%) | 0 (0.0%) |
| 55 to 59 Years | 7 (11.1%) | 0 (0.0%) |
| 60 to 64 Years | 0 (0.0%) | 0 (0.0%) |
| 65 to 69 Years | 10 (15.9%) | 0 (0.0%) |
| 70 to 74 Years | 5 (7.9%) | 6 (6.4%) |
| 75 to 79 Years | 4 (6.4%) | 0 (0.0%) |
| 80 to 84 Years | 0 (0.0%) | 0 (0.0%) |
| 85 Years and over | 0 (0.0%) | 12 (12.8%) |
| Total | 63 (100.0%) | 94 (100.0%) |
Families and Households in Darling
Median Family Size in Darling
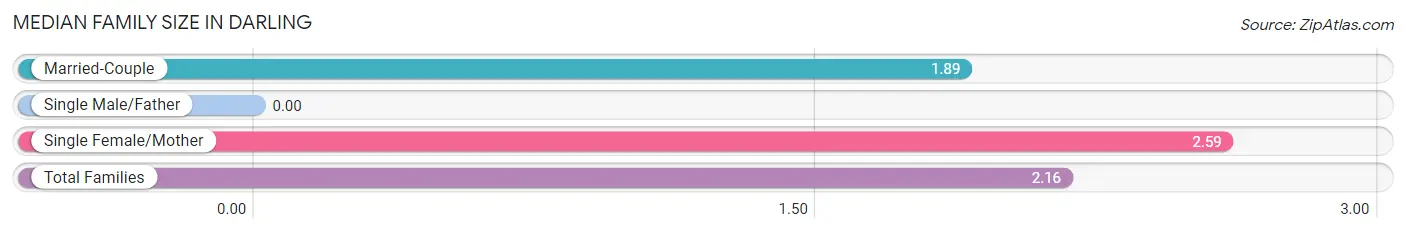
| Family Type | # Families | Family Size |
| Married-Couple | 35 (61.4%) | 1.89 |
| Single Male/Father | 0 (0.0%) | - |
| Single Female/Mother | 22 (38.6%) | 2.59 |
| Total Families | 57 (100.0%) | 2.16 |
Median Household Size in Darling
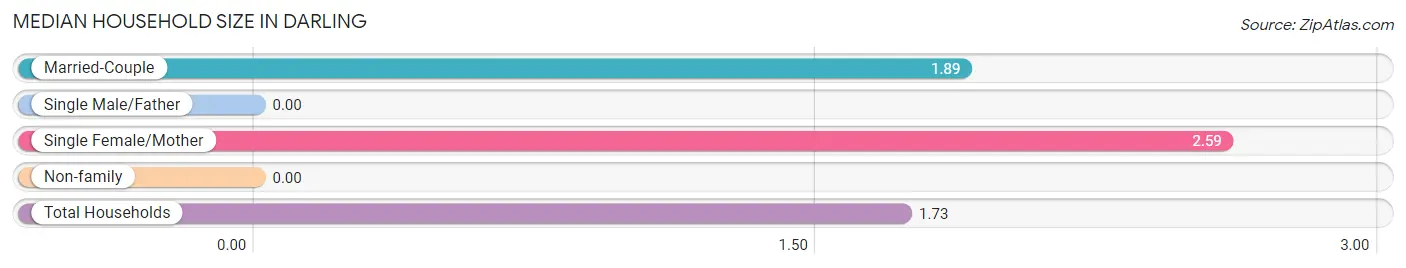
| Household Type | # Households | Household Size |
| Married-Couple | 35 (38.5%) | 1.89 |
| Single Male/Father | 0 (0.0%) | - |
| Single Female/Mother | 22 (24.2%) | 2.59 |
| Non-family | 34 (37.4%) | - |
| Total Households | 91 (100.0%) | 1.73 |
Household Size by Marriage Status in Darling
Out of a total of 91 households in Darling, 57 (62.6%) are family households, while 34 (37.4%) are nonfamily households. The most numerous type of family households are 4-person households, comprising 31, and the most common type of nonfamily households are 1-person households, comprising 34.
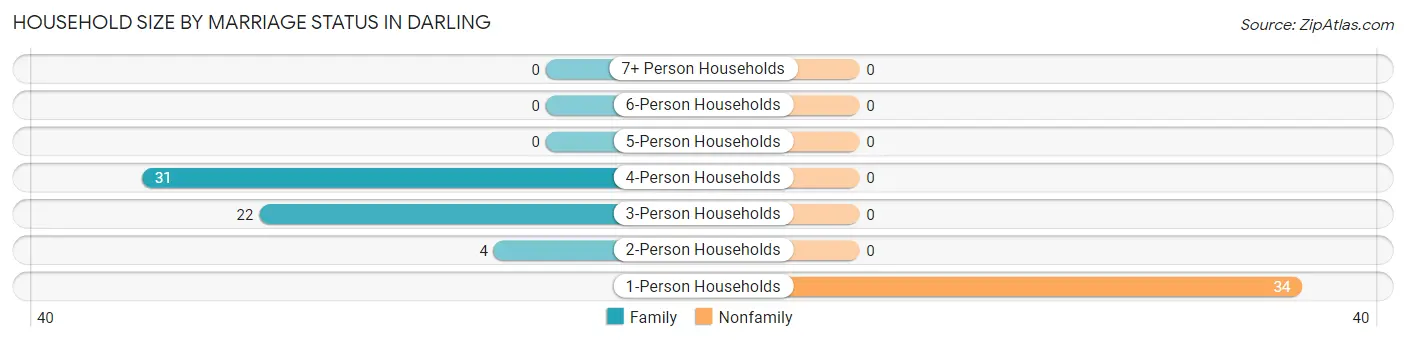
| Household Size | Family Households | Nonfamily Households |
| 1-Person Households | - | 34 (37.4%) |
| 2-Person Households | 4 (4.4%) | 0 (0.0%) |
| 3-Person Households | 22 (24.2%) | 0 (0.0%) |
| 4-Person Households | 31 (34.1%) | 0 (0.0%) |
| 5-Person Households | 0 (0.0%) | 0 (0.0%) |
| 6-Person Households | 0 (0.0%) | 0 (0.0%) |
| 7+ Person Households | 0 (0.0%) | 0 (0.0%) |
| Total | 57 (62.6%) | 34 (37.4%) |
Female Fertility in Darling
Fertility by Age in Darling
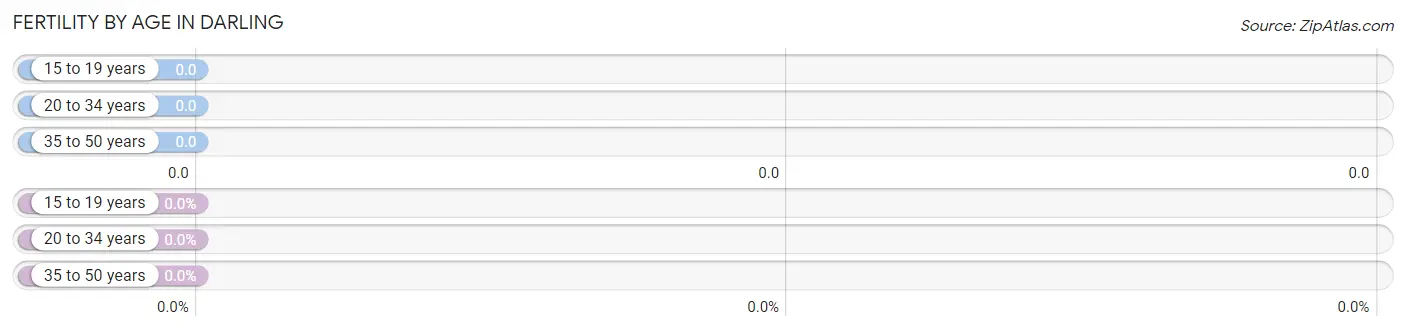
| Age Bracket | Women with Births | Births / 1,000 Women |
| 15 to 19 years | 0 (0.0%) | 0.0 |
| 20 to 34 years | 0 (0.0%) | 0.0 |
| 35 to 50 years | 0 (0.0%) | 0.0 |
| Total | 0 (0.0%) | 0.0 |
Fertility by Age by Marriage Status in Darling
| Age Bracket | Married | Unmarried |
| 15 to 19 years | 0 (0.0%) | 0 (0.0%) |
| 20 to 34 years | 0 (0.0%) | 0 (0.0%) |
| 35 to 50 years | 0 (0.0%) | 0 (0.0%) |
| Total | 0 (0.0%) | 0 (0.0%) |
Fertility by Education in Darling
| Educational Attainment | Women with Births | Births / 1,000 Women |
| Less than High School | 0 (0.0%) | 0.0 |
| High School Diploma | 0 (0.0%) | 0.0 |
| College or Associate's Degree | 0 (0.0%) | 0.0 |
| Bachelor's Degree | 0 (0.0%) | 0.0 |
| Graduate Degree | 0 (0.0%) | 0.0 |
| Total | 0 (0.0%) | 0.0 |
Fertility by Education by Marriage Status in Darling
| Educational Attainment | Married | Unmarried |
| Less than High School | 0 (0.0%) | 0 (0.0%) |
| High School Diploma | 0 (0.0%) | 0 (0.0%) |
| College or Associate's Degree | 0 (0.0%) | 0 (0.0%) |
| Bachelor's Degree | 0 (0.0%) | 0 (0.0%) |
| Graduate Degree | 0 (0.0%) | 0 (0.0%) |
| Total | 0 (0.0%) | 0 (0.0%) |
Employment Characteristics in Darling
Employment by Class of Employer in Darling
Among the 51 employed individuals in Darling, local government employees (36 | 70.6%), private company employees (8 | 15.7%), and self-employed (not incorporated) (7 | 13.7%) make up the most common classes of employment.
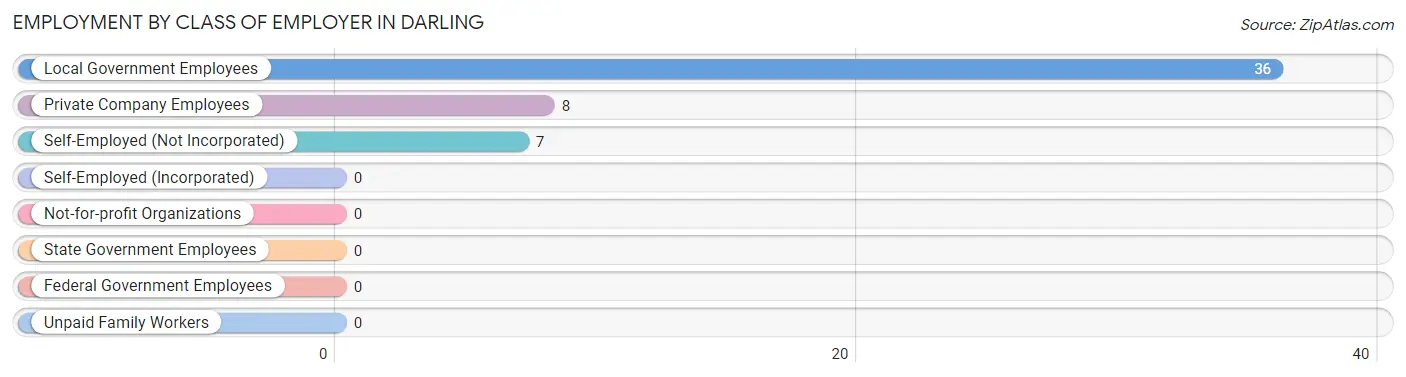
| Employer Class | # Employees | % Employees |
| Private Company Employees | 8 | 15.7% |
| Self-Employed (Incorporated) | 0 | 0.0% |
| Self-Employed (Not Incorporated) | 7 | 13.7% |
| Not-for-profit Organizations | 0 | 0.0% |
| Local Government Employees | 36 | 70.6% |
| State Government Employees | 0 | 0.0% |
| Federal Government Employees | 0 | 0.0% |
| Unpaid Family Workers | 0 | 0.0% |
| Total | 51 | 100.0% |
Employment Status by Age in Darling
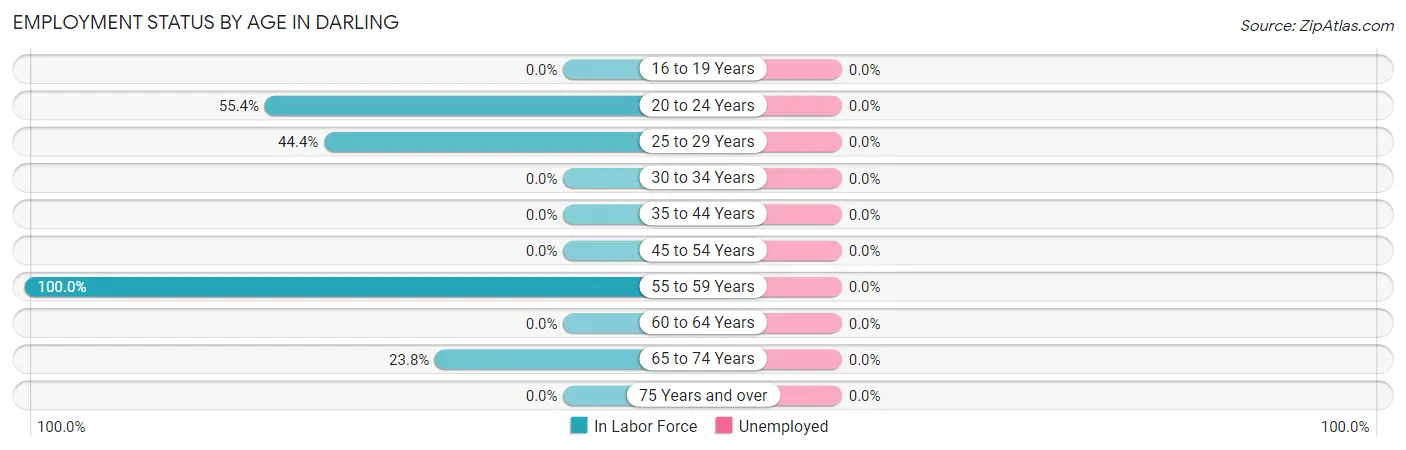
| Age Bracket | In Labor Force | Unemployed |
| 16 to 19 Years | 0 (0.0%) | 0 (0.0%) |
| 20 to 24 Years | 31 (55.4%) | 0 (0.0%) |
| 25 to 29 Years | 8 (44.4%) | 0 (0.0%) |
| 30 to 34 Years | 0 (0.0%) | 0 (0.0%) |
| 35 to 44 Years | 0 (0.0%) | 0 (0.0%) |
| 45 to 54 Years | 0 (0.0%) | 0 (0.0%) |
| 55 to 59 Years | 7 (100.0%) | 0 (0.0%) |
| 60 to 64 Years | 0 (0.0%) | 0 (0.0%) |
| 65 to 74 Years | 5 (23.8%) | 0 (0.0%) |
| 75 Years and over | 0 (0.0%) | 0 (0.0%) |
| Total | 51 (36.4%) | 0 (0.0%) |
Employment Status by Educational Attainment in Darling
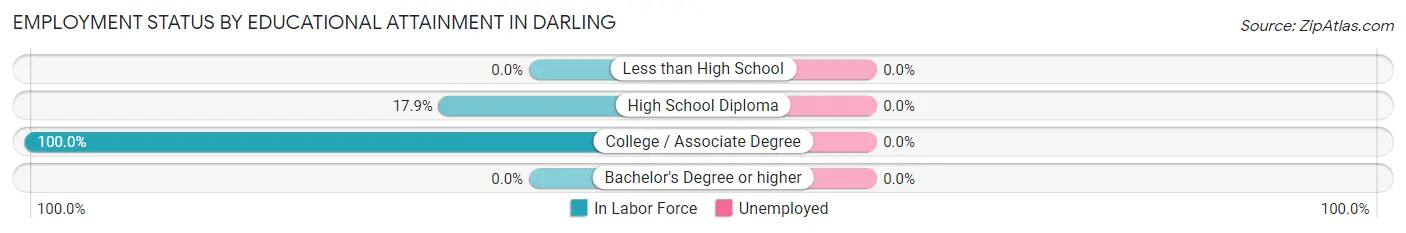
| Educational Attainment | In Labor Force | Unemployed |
| Less than High School | 0 (0.0%) | 0 (0.0%) |
| High School Diploma | 7 (17.9%) | 0 (0.0%) |
| College / Associate Degree | 8 (100.0%) | 0 (0.0%) |
| Bachelor's Degree or higher | 0 (0.0%) | 0 (0.0%) |
| Total | 15 (31.9%) | 0 (0.0%) |
Employment Occupations by Sex in Darling
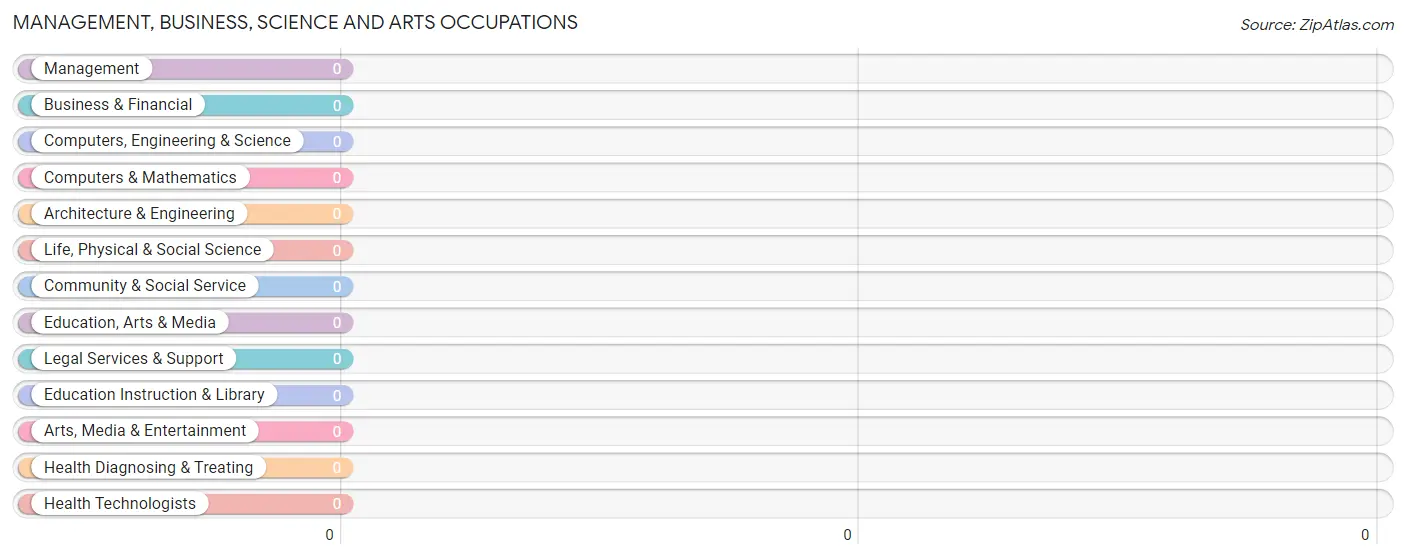
Management, Business, Science and Arts Occupations
Management, Business, Science and Arts Occupations by Sex
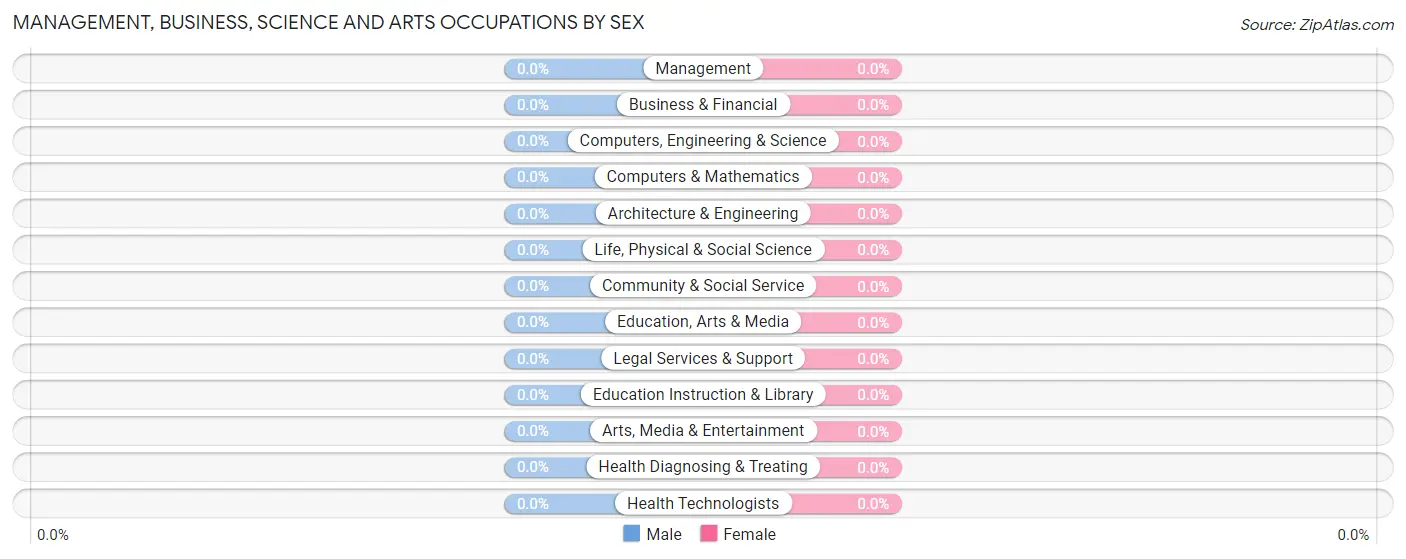
| Occupation | Male | Female |
| Management | 0 (0.0%) | 0 (0.0%) |
| Business & Financial | 0 (0.0%) | 0 (0.0%) |
| Computers, Engineering & Science | 0 (0.0%) | 0 (0.0%) |
| Computers & Mathematics | 0 (0.0%) | 0 (0.0%) |
| Architecture & Engineering | 0 (0.0%) | 0 (0.0%) |
| Life, Physical & Social Science | 0 (0.0%) | 0 (0.0%) |
| Community & Social Service | 0 (0.0%) | 0 (0.0%) |
| Education, Arts & Media | 0 (0.0%) | 0 (0.0%) |
| Legal Services & Support | 0 (0.0%) | 0 (0.0%) |
| Education Instruction & Library | 0 (0.0%) | 0 (0.0%) |
| Arts, Media & Entertainment | 0 (0.0%) | 0 (0.0%) |
| Health Diagnosing & Treating | 0 (0.0%) | 0 (0.0%) |
| Health Technologists | 0 (0.0%) | 0 (0.0%) |
| Total (Category) | 0 (0.0%) | 0 (0.0%) |
| Total (Overall) | 43 (84.3%) | 8 (15.7%) |
Services Occupations
The most common Services occupations in Darling are , and Cleaning & Maintenance (31 | 60.8%).
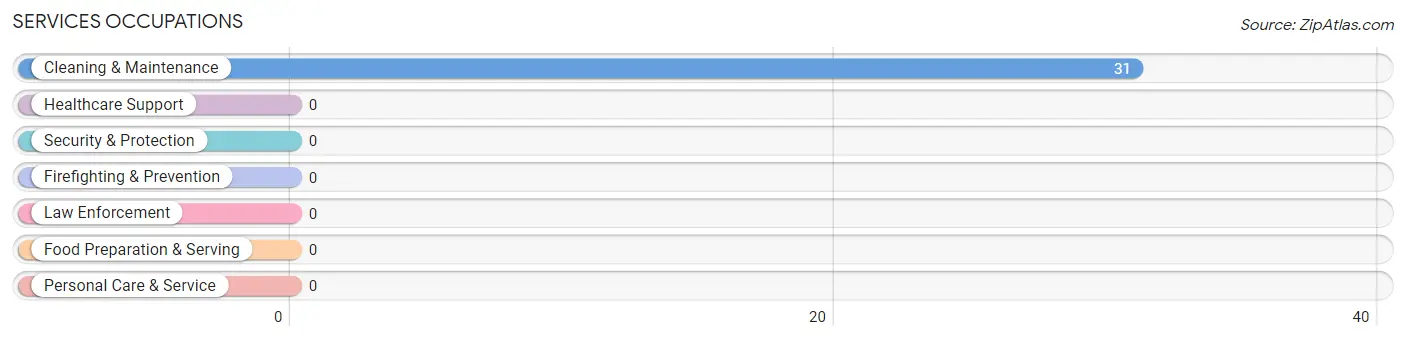
Services Occupations by Sex
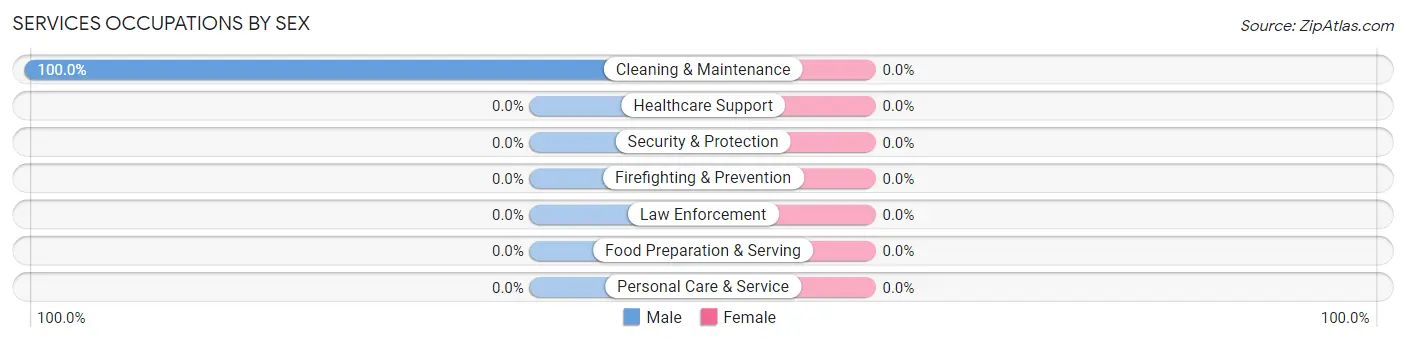
| Occupation | Male | Female |
| Healthcare Support | 0 (0.0%) | 0 (0.0%) |
| Security & Protection | 0 (0.0%) | 0 (0.0%) |
| Firefighting & Prevention | 0 (0.0%) | 0 (0.0%) |
| Law Enforcement | 0 (0.0%) | 0 (0.0%) |
| Food Preparation & Serving | 0 (0.0%) | 0 (0.0%) |
| Cleaning & Maintenance | 31 (100.0%) | 0 (0.0%) |
| Personal Care & Service | 0 (0.0%) | 0 (0.0%) |
| Total (Category) | 31 (100.0%) | 0 (0.0%) |
| Total (Overall) | 43 (84.3%) | 8 (15.7%) |
Sales and Office Occupations
The most common Sales and Office occupations in Darling are , and Sales & Related (8 | 15.7%).
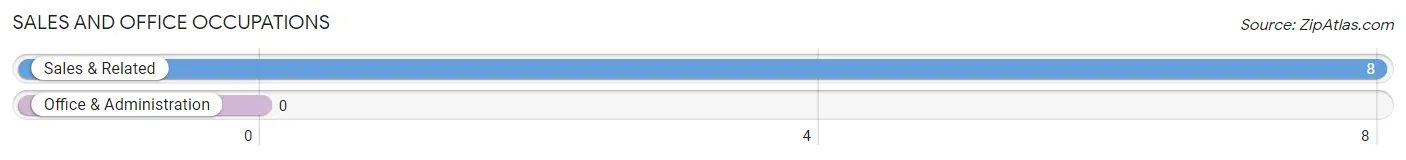
Sales and Office Occupations by Sex
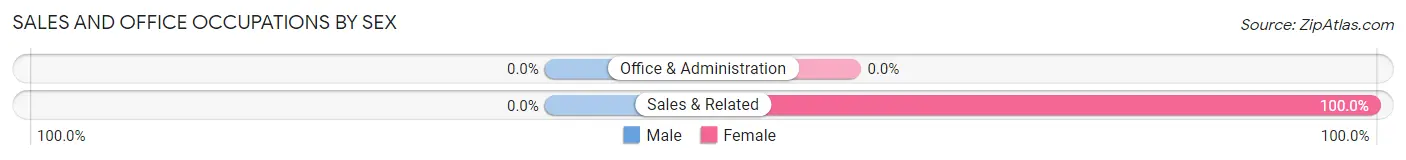
| Occupation | Male | Female |
| Sales & Related | 0 (0.0%) | 8 (100.0%) |
| Office & Administration | 0 (0.0%) | 0 (0.0%) |
| Total (Category) | 0 (0.0%) | 8 (100.0%) |
| Total (Overall) | 43 (84.3%) | 8 (15.7%) |
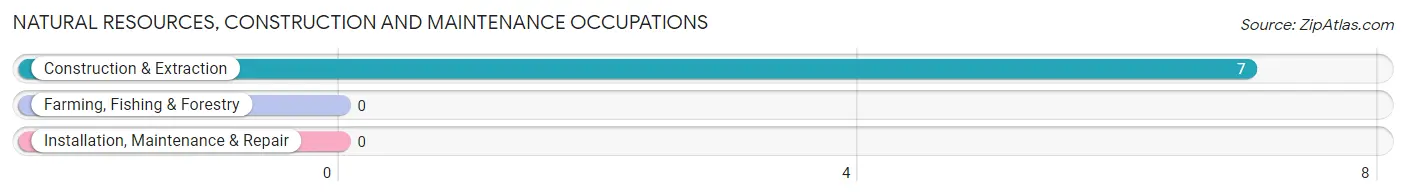
Natural Resources, Construction and Maintenance Occupations
The most common Natural Resources, Construction and Maintenance occupations in Darling are , and Construction & Extraction (7 | 13.7%).
Natural Resources, Construction and Maintenance Occupations by Sex
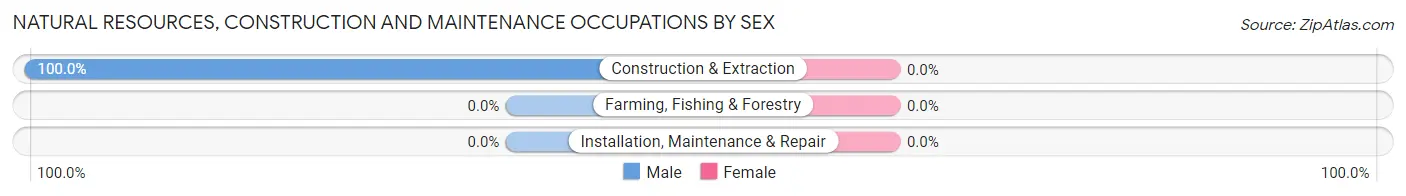
| Occupation | Male | Female |
| Farming, Fishing & Forestry | 0 (0.0%) | 0 (0.0%) |
| Construction & Extraction | 7 (100.0%) | 0 (0.0%) |
| Installation, Maintenance & Repair | 0 (0.0%) | 0 (0.0%) |
| Total (Category) | 7 (100.0%) | 0 (0.0%) |
| Total (Overall) | 43 (84.3%) | 8 (15.7%) |
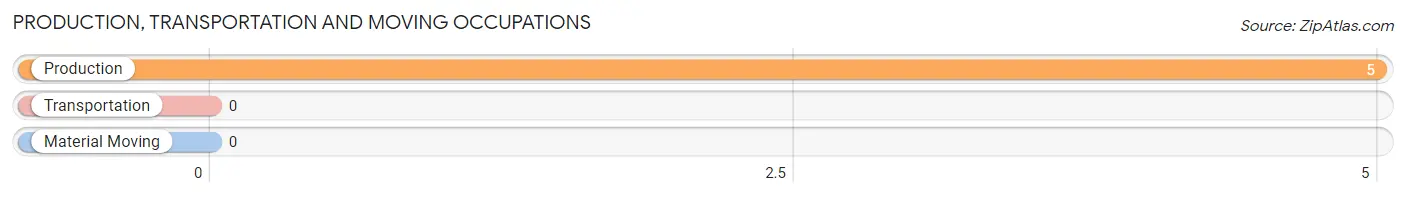
Production, Transportation and Moving Occupations
The most common Production, Transportation and Moving occupations in Darling are , and Production (5 | 9.8%).
Production, Transportation and Moving Occupations by Sex
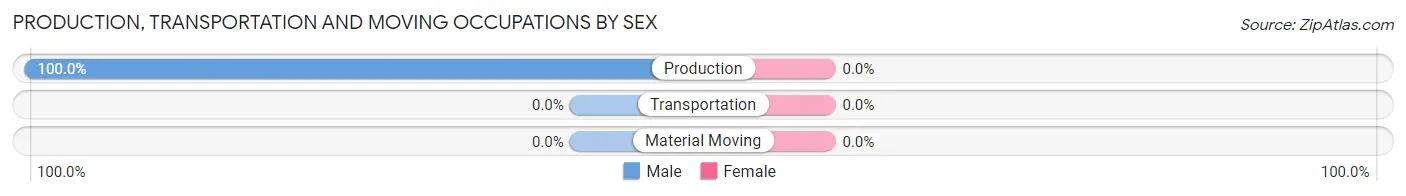
| Occupation | Male | Female |
| Production | 5 (100.0%) | 0 (0.0%) |
| Transportation | 0 (0.0%) | 0 (0.0%) |
| Material Moving | 0 (0.0%) | 0 (0.0%) |
| Total (Category) | 5 (100.0%) | 0 (0.0%) |
| Total (Overall) | 43 (84.3%) | 8 (15.7%) |
Employment Industries by Sex in Darling
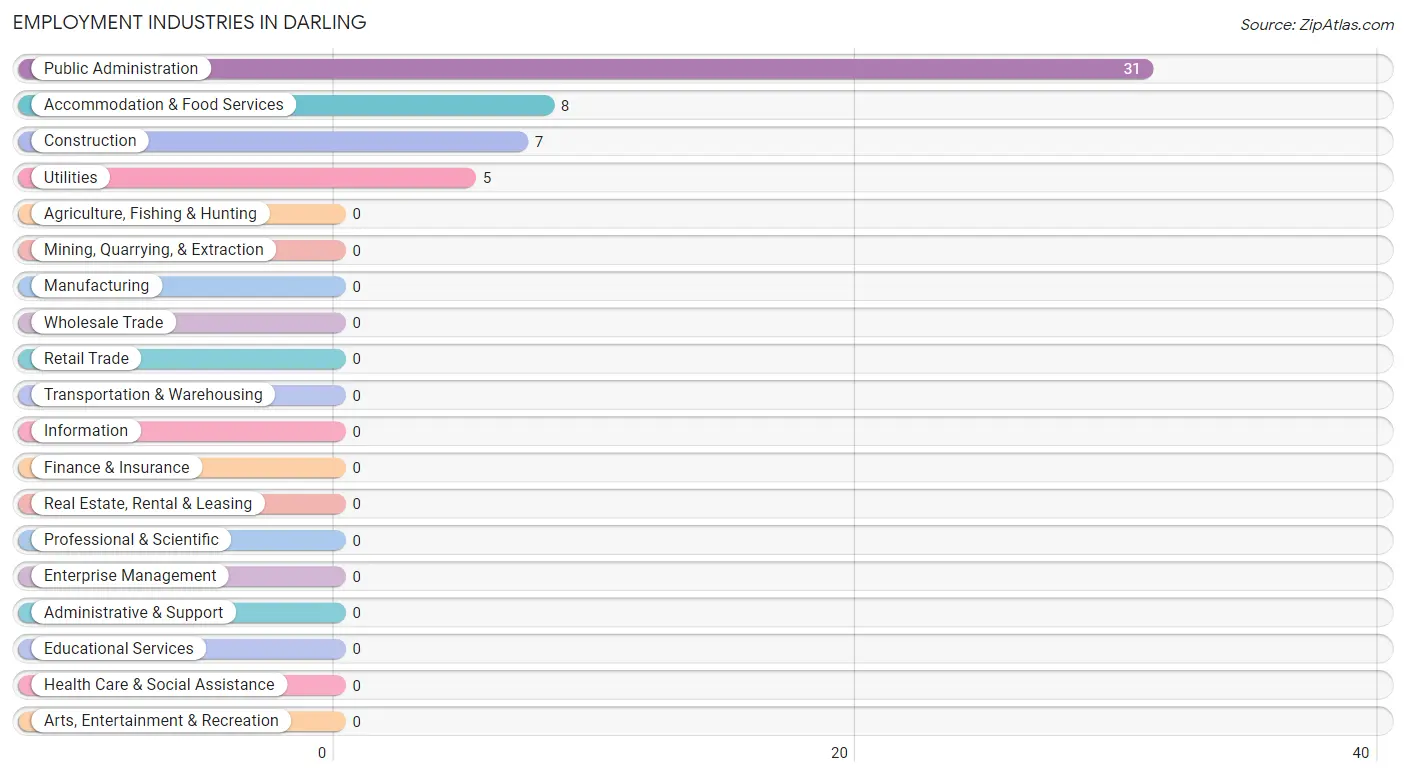
Employment Industries in Darling
The major employment industries in Darling include Public Administration (31 | 60.8%), Accommodation & Food Services (8 | 15.7%), Construction (7 | 13.7%), and Utilities (5 | 9.8%).
Employment Industries by Sex in Darling
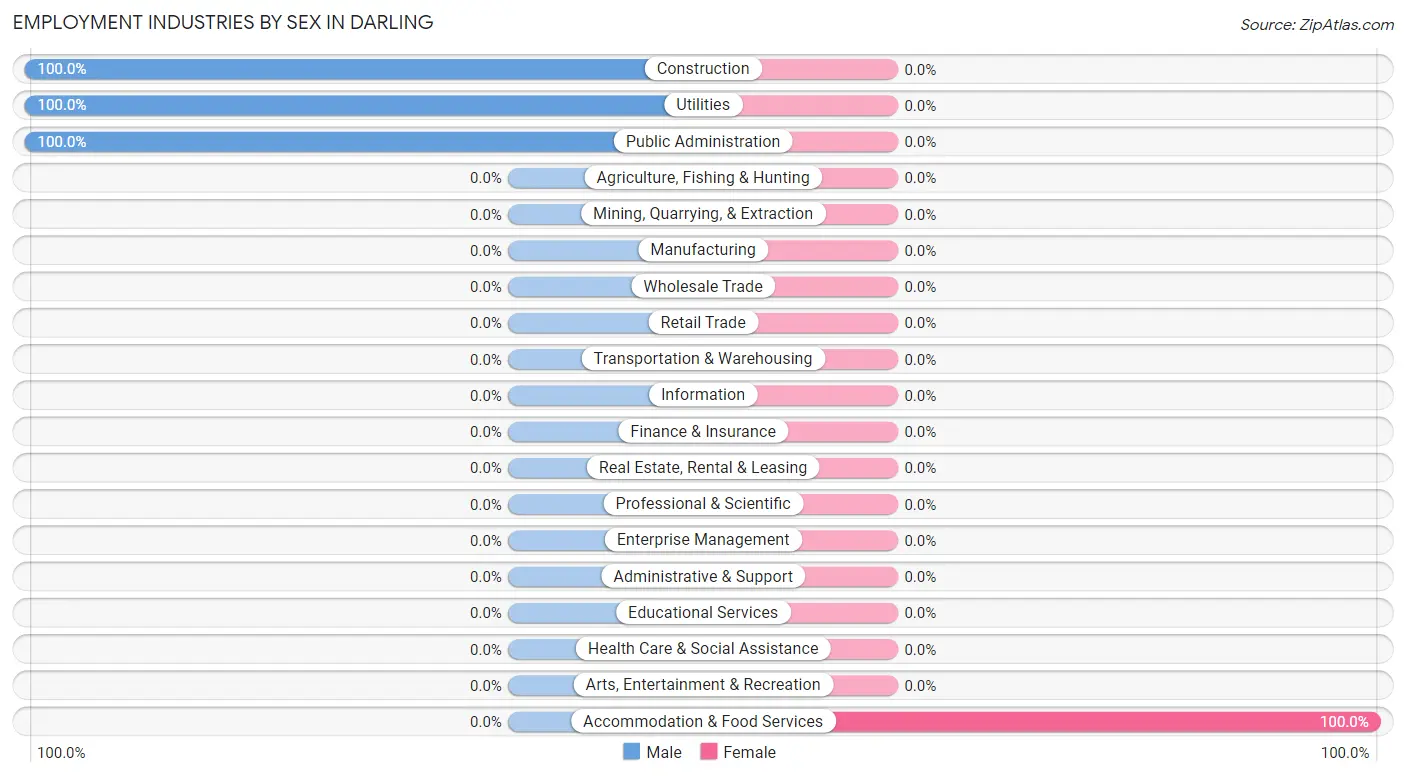
| Industry | Male | Female |
| Agriculture, Fishing & Hunting | 0 (0.0%) | 0 (0.0%) |
| Mining, Quarrying, & Extraction | 0 (0.0%) | 0 (0.0%) |
| Construction | 7 (100.0%) | 0 (0.0%) |
| Manufacturing | 0 (0.0%) | 0 (0.0%) |
| Wholesale Trade | 0 (0.0%) | 0 (0.0%) |
| Retail Trade | 0 (0.0%) | 0 (0.0%) |
| Transportation & Warehousing | 0 (0.0%) | 0 (0.0%) |
| Utilities | 5 (100.0%) | 0 (0.0%) |
| Information | 0 (0.0%) | 0 (0.0%) |
| Finance & Insurance | 0 (0.0%) | 0 (0.0%) |
| Real Estate, Rental & Leasing | 0 (0.0%) | 0 (0.0%) |
| Professional & Scientific | 0 (0.0%) | 0 (0.0%) |
| Enterprise Management | 0 (0.0%) | 0 (0.0%) |
| Administrative & Support | 0 (0.0%) | 0 (0.0%) |
| Educational Services | 0 (0.0%) | 0 (0.0%) |
| Health Care & Social Assistance | 0 (0.0%) | 0 (0.0%) |
| Arts, Entertainment & Recreation | 0 (0.0%) | 0 (0.0%) |
| Accommodation & Food Services | 0 (0.0%) | 8 (100.0%) |
| Public Administration | 31 (100.0%) | 0 (0.0%) |
| Total | 43 (84.3%) | 8 (15.7%) |
Education in Darling
School Enrollment in Darling
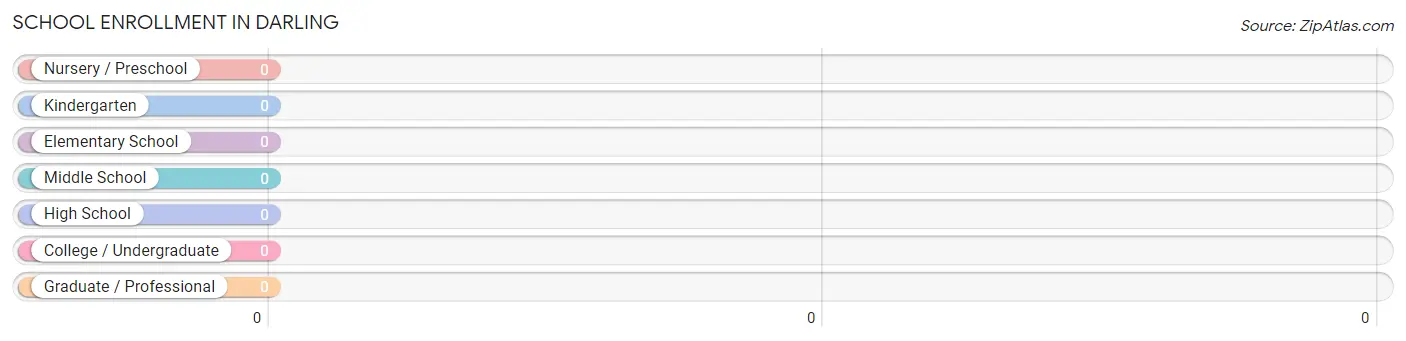
| School Level | # Students | % Students |
| Nursery / Preschool | 0 | 0.0% |
| Kindergarten | 0 | 0.0% |
| Elementary School | 0 | 0.0% |
| Middle School | 0 | 0.0% |
| High School | 0 | 0.0% |
| College / Undergraduate | 0 | 0.0% |
| Graduate / Professional | 0 | 0.0% |
| Total | 0 | 0.0% |
School Enrollment by Age by Funding Source in Darling
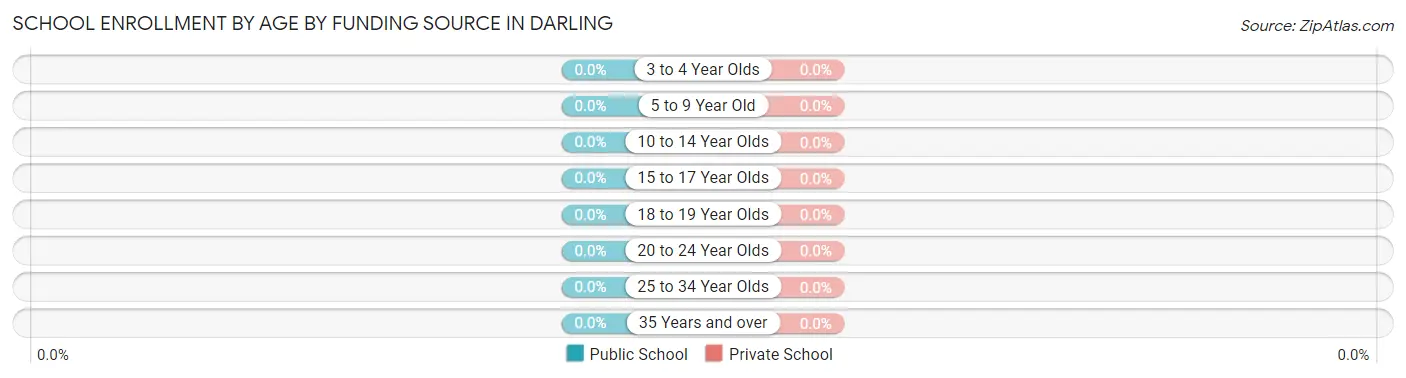
| Age Bracket | Public School | Private School |
| 3 to 4 Year Olds | 0 (0.0%) | 0 (0.0%) |
| 5 to 9 Year Old | 0 (0.0%) | 0 (0.0%) |
| 10 to 14 Year Olds | 0 (0.0%) | 0 (0.0%) |
| 15 to 17 Year Olds | 0 (0.0%) | 0 (0.0%) |
| 18 to 19 Year Olds | 0 (0.0%) | 0 (0.0%) |
| 20 to 24 Year Olds | 0 (0.0%) | 0 (0.0%) |
| 25 to 34 Year Olds | 0 (0.0%) | 0 (0.0%) |
| 35 Years and over | 0 (0.0%) | 0 (0.0%) |
| Total | 0 (0.0%) | 0 (0.0%) |
Educational Attainment by Field of Study in Darling
| Field of Study | # Graduates | % Graduates |
| Computers & Mathematics | 0 | 0.0% |
| Bio, Nature & Agricultural | 0 | 0.0% |
| Physical & Health Sciences | 0 | 0.0% |
| Psychology | 0 | 0.0% |
| Social Sciences | 0 | 0.0% |
| Engineering | 0 | 0.0% |
| Multidisciplinary Studies | 0 | 0.0% |
| Science & Technology | 0 | 0.0% |
| Business | 0 | 0.0% |
| Education | 0 | 0.0% |
| Literature & Languages | 0 | 0.0% |
| Liberal Arts & History | 0 | 0.0% |
| Visual & Performing Arts | 0 | 0.0% |
| Communications | 0 | 0.0% |
| Arts & Humanities | 0 | 0.0% |
| Total | 0 | 0.0% |
Transportation & Commute in Darling
Vehicle Availability by Sex in Darling
The most prevalent vehicle ownership categories in Darling are males with 1 vehicle (43, accounting for 100.0%) and females with 1 vehicle (8, making up 537.5%).
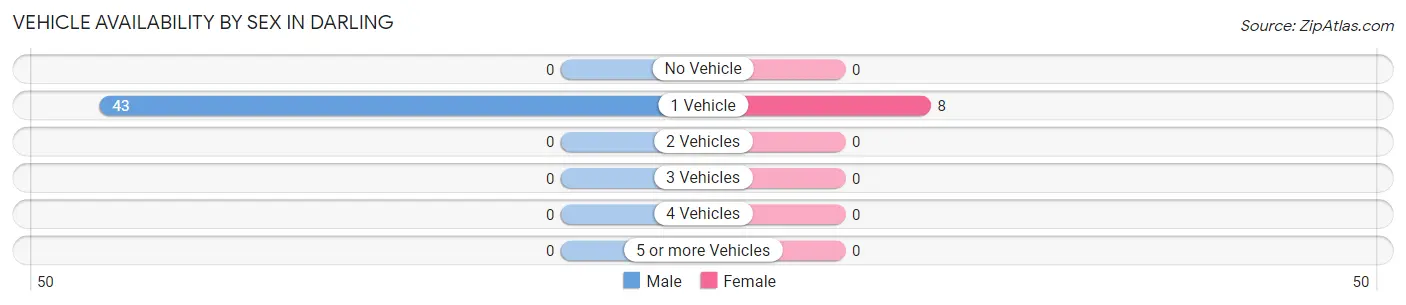
| Vehicles Available | Male | Female |
| No Vehicle | 0 (0.0%) | 0 (0.0%) |
| 1 Vehicle | 43 (100.0%) | 8 (100.0%) |
| 2 Vehicles | 0 (0.0%) | 0 (0.0%) |
| 3 Vehicles | 0 (0.0%) | 0 (0.0%) |
| 4 Vehicles | 0 (0.0%) | 0 (0.0%) |
| 5 or more Vehicles | 0 (0.0%) | 0 (0.0%) |
| Total | 43 (100.0%) | 8 (100.0%) |
Commute Time in Darling
The most frequently occuring commute durations in Darling are 40 to 44 minutes (39 commuters, 88.6%), 10 to 14 minutes (5 commuters, 11.4%), and less than 5 minutes (0 commuters, 0.0%).
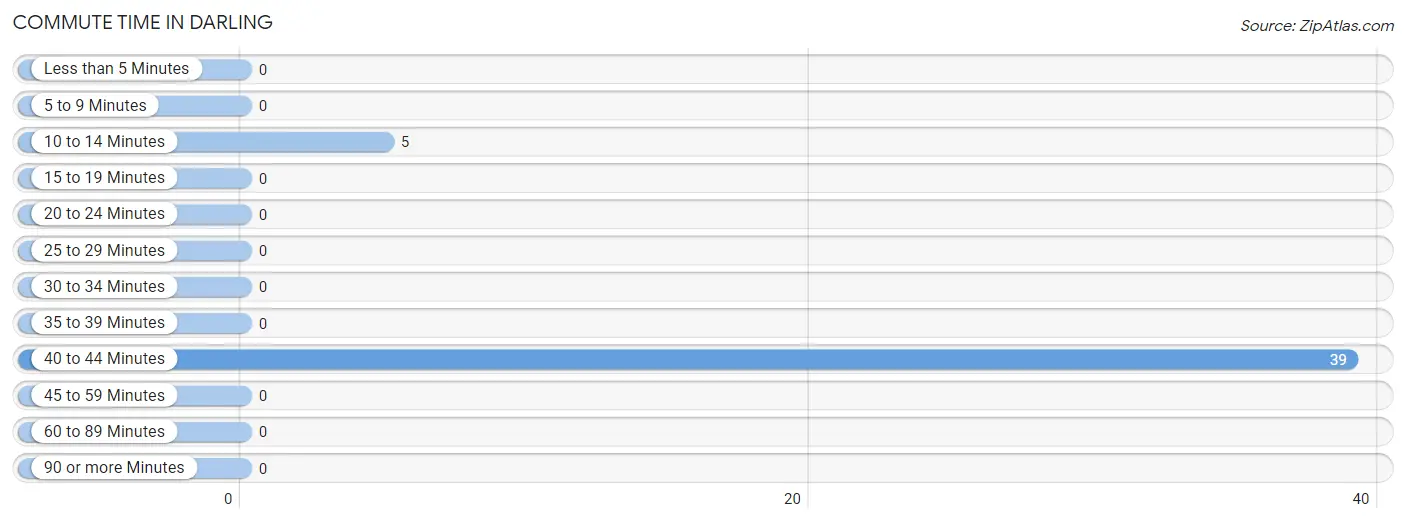
| Commute Time | # Commuters | % Commuters |
| Less than 5 Minutes | 0 | 0.0% |
| 5 to 9 Minutes | 0 | 0.0% |
| 10 to 14 Minutes | 5 | 11.4% |
| 15 to 19 Minutes | 0 | 0.0% |
| 20 to 24 Minutes | 0 | 0.0% |
| 25 to 29 Minutes | 0 | 0.0% |
| 30 to 34 Minutes | 0 | 0.0% |
| 35 to 39 Minutes | 0 | 0.0% |
| 40 to 44 Minutes | 39 | 88.6% |
| 45 to 59 Minutes | 0 | 0.0% |
| 60 to 89 Minutes | 0 | 0.0% |
| 90 or more Minutes | 0 | 0.0% |
Commute Time by Sex in Darling
The most common commute times in Darling are 40 to 44 minutes (31 commuters, 86.1%) for males and 40 to 44 minutes (8 commuters, 100.0%) for females.
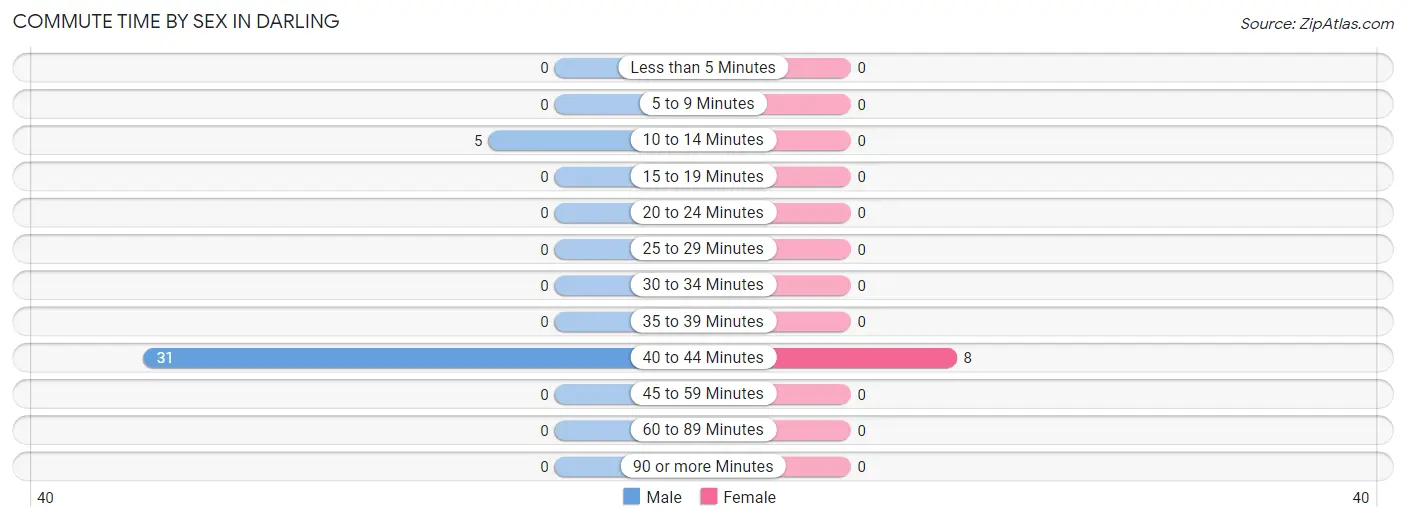
| Commute Time | Male | Female |
| Less than 5 Minutes | 0 (0.0%) | 0 (0.0%) |
| 5 to 9 Minutes | 0 (0.0%) | 0 (0.0%) |
| 10 to 14 Minutes | 5 (13.9%) | 0 (0.0%) |
| 15 to 19 Minutes | 0 (0.0%) | 0 (0.0%) |
| 20 to 24 Minutes | 0 (0.0%) | 0 (0.0%) |
| 25 to 29 Minutes | 0 (0.0%) | 0 (0.0%) |
| 30 to 34 Minutes | 0 (0.0%) | 0 (0.0%) |
| 35 to 39 Minutes | 0 (0.0%) | 0 (0.0%) |
| 40 to 44 Minutes | 31 (86.1%) | 8 (100.0%) |
| 45 to 59 Minutes | 0 (0.0%) | 0 (0.0%) |
| 60 to 89 Minutes | 0 (0.0%) | 0 (0.0%) |
| 90 or more Minutes | 0 (0.0%) | 0 (0.0%) |
Time of Departure to Work by Sex in Darling
The most frequent times of departure to work in Darling are 6:00 AM to 6:29 AM (31, 86.1%) for males and 9:00 AM to 9:59 AM (8, 100.0%) for females.
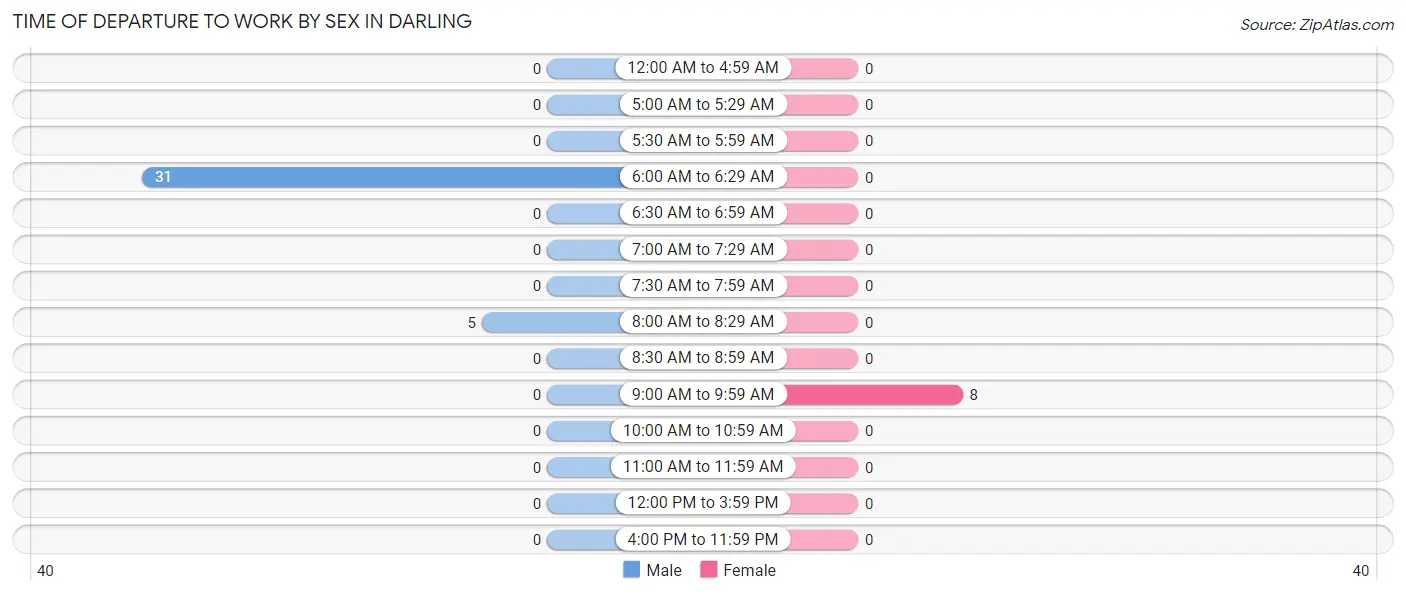
| Time of Departure | Male | Female |
| 12:00 AM to 4:59 AM | 0 (0.0%) | 0 (0.0%) |
| 5:00 AM to 5:29 AM | 0 (0.0%) | 0 (0.0%) |
| 5:30 AM to 5:59 AM | 0 (0.0%) | 0 (0.0%) |
| 6:00 AM to 6:29 AM | 31 (86.1%) | 0 (0.0%) |
| 6:30 AM to 6:59 AM | 0 (0.0%) | 0 (0.0%) |
| 7:00 AM to 7:29 AM | 0 (0.0%) | 0 (0.0%) |
| 7:30 AM to 7:59 AM | 0 (0.0%) | 0 (0.0%) |
| 8:00 AM to 8:29 AM | 5 (13.9%) | 0 (0.0%) |
| 8:30 AM to 8:59 AM | 0 (0.0%) | 0 (0.0%) |
| 9:00 AM to 9:59 AM | 0 (0.0%) | 8 (100.0%) |
| 10:00 AM to 10:59 AM | 0 (0.0%) | 0 (0.0%) |
| 11:00 AM to 11:59 AM | 0 (0.0%) | 0 (0.0%) |
| 12:00 PM to 3:59 PM | 0 (0.0%) | 0 (0.0%) |
| 4:00 PM to 11:59 PM | 0 (0.0%) | 0 (0.0%) |
| Total | 36 (100.0%) | 8 (100.0%) |
Housing Occupancy in Darling
Occupancy by Ownership in Darling
Of the total 91 dwellings in Darling, owner-occupied units account for 46 (50.5%), while renter-occupied units make up 45 (49.4%).
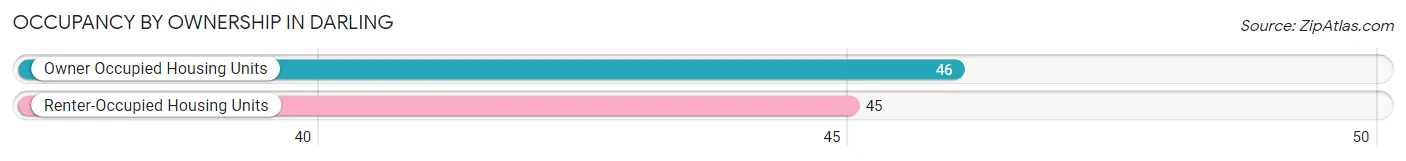
| Occupancy | # Housing Units | % Housing Units |
| Owner Occupied Housing Units | 46 | 50.5% |
| Renter-Occupied Housing Units | 45 | 49.4% |
| Total Occupied Housing Units | 91 | 100.0% |
Occupancy by Household Size in Darling
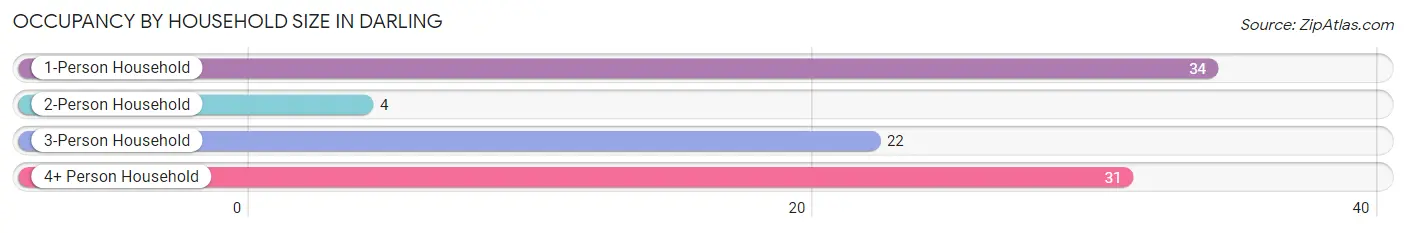
| Household Size | # Housing Units | % Housing Units |
| 1-Person Household | 34 | 37.4% |
| 2-Person Household | 4 | 4.4% |
| 3-Person Household | 22 | 24.2% |
| 4+ Person Household | 31 | 34.1% |
| Total Housing Units | 91 | 100.0% |
Occupancy by Ownership by Household Size in Darling
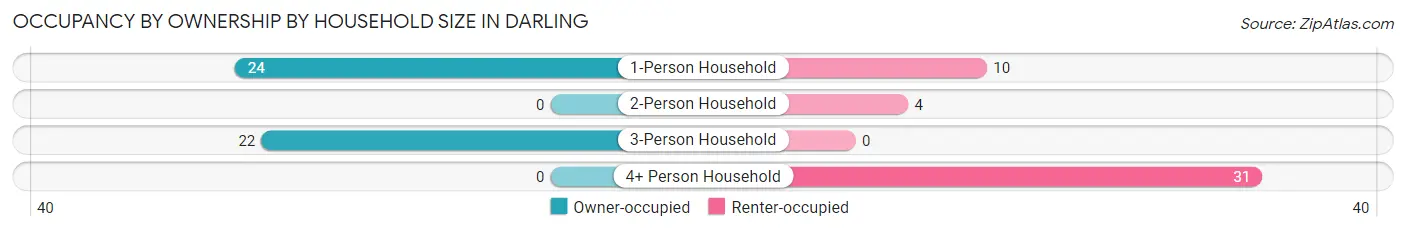
| Household Size | Owner-occupied | Renter-occupied |
| 1-Person Household | 24 (70.6%) | 10 (29.4%) |
| 2-Person Household | 0 (0.0%) | 4 (100.0%) |
| 3-Person Household | 22 (100.0%) | 0 (0.0%) |
| 4+ Person Household | 0 (0.0%) | 31 (100.0%) |
| Total Housing Units | 46 (50.5%) | 45 (49.4%) |
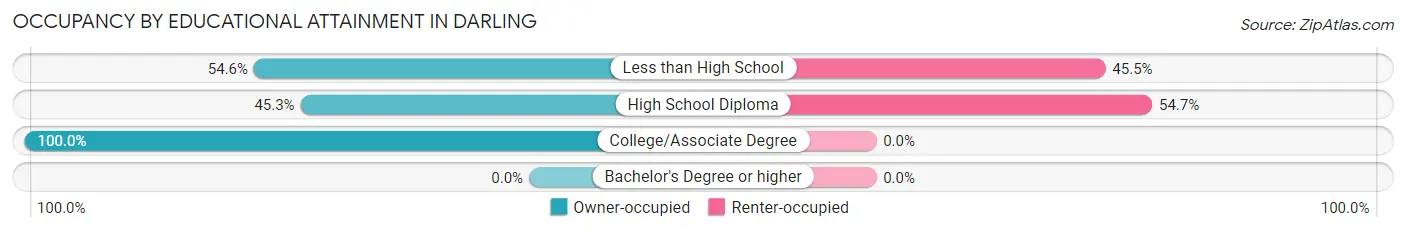
Occupancy by Educational Attainment in Darling
| Household Size | Owner-occupied | Renter-occupied |
| Less than High School | 12 (54.5%) | 10 (45.5%) |
| High School Diploma | 29 (45.3%) | 35 (54.7%) |
| College/Associate Degree | 5 (100.0%) | 0 (0.0%) |
| Bachelor's Degree or higher | 0 (0.0%) | 0 (0.0%) |
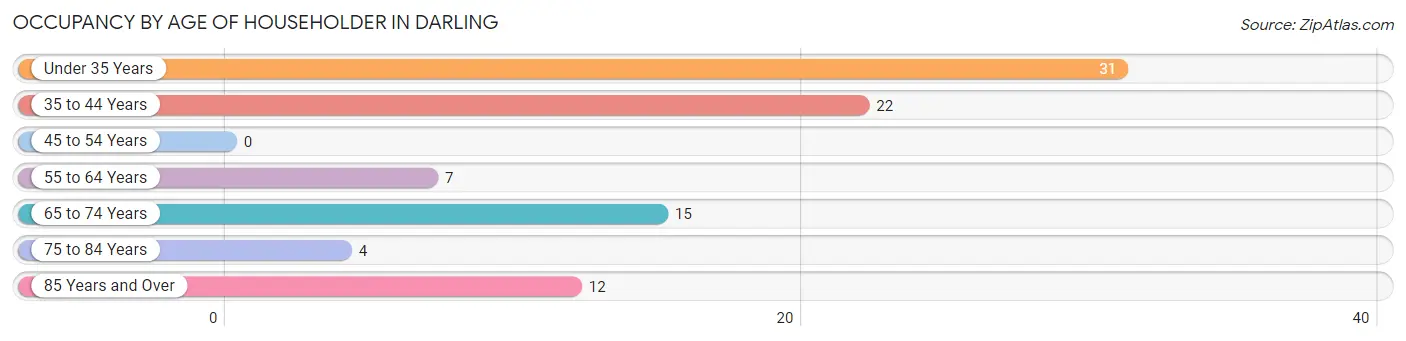
Occupancy by Age of Householder in Darling
| Age Bracket | # Households | % Households |
| Under 35 Years | 31 | 34.1% |
| 35 to 44 Years | 22 | 24.2% |
| 45 to 54 Years | 0 | 0.0% |
| 55 to 64 Years | 7 | 7.7% |
| 65 to 74 Years | 15 | 16.5% |
| 75 to 84 Years | 4 | 4.4% |
| 85 Years and Over | 12 | 13.2% |
| Total | 91 | 100.0% |
Housing Finances in Darling
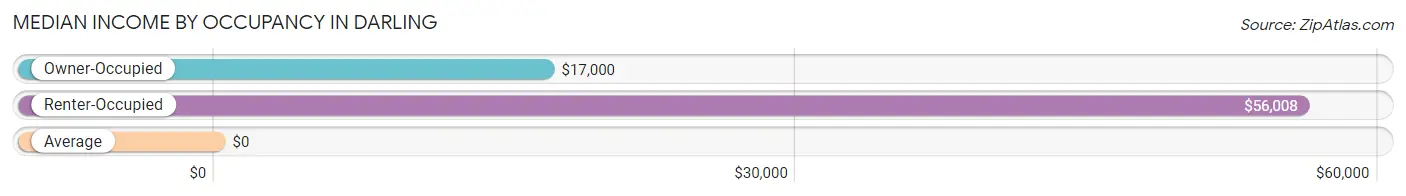
Median Income by Occupancy in Darling
| Occupancy Type | # Households | Median Income |
| Owner-Occupied | 46 (50.5%) | $17,000 |
| Renter-Occupied | 45 (49.4%) | $56,008 |
| Average | 91 (100.0%) | $0 |
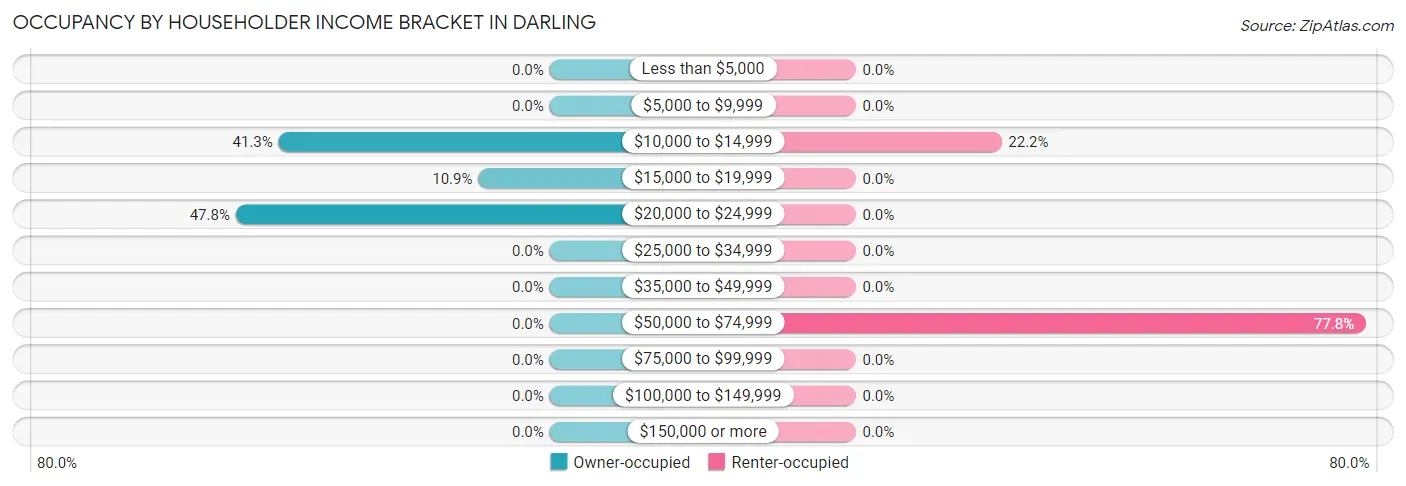
Occupancy by Householder Income Bracket in Darling
| Income Bracket | Owner-occupied | Renter-occupied |
| Less than $5,000 | 0 (0.0%) | 0 (0.0%) |
| $5,000 to $9,999 | 0 (0.0%) | 0 (0.0%) |
| $10,000 to $14,999 | 19 (41.3%) | 10 (22.2%) |
| $15,000 to $19,999 | 5 (10.9%) | 0 (0.0%) |
| $20,000 to $24,999 | 22 (47.8%) | 0 (0.0%) |
| $25,000 to $34,999 | 0 (0.0%) | 0 (0.0%) |
| $35,000 to $49,999 | 0 (0.0%) | 0 (0.0%) |
| $50,000 to $74,999 | 0 (0.0%) | 35 (77.8%) |
| $75,000 to $99,999 | 0 (0.0%) | 0 (0.0%) |
| $100,000 to $149,999 | 0 (0.0%) | 0 (0.0%) |
| $150,000 or more | 0 (0.0%) | 0 (0.0%) |
| Total | 46 (100.0%) | 45 (100.0%) |
Monthly Housing Cost Tiers in Darling
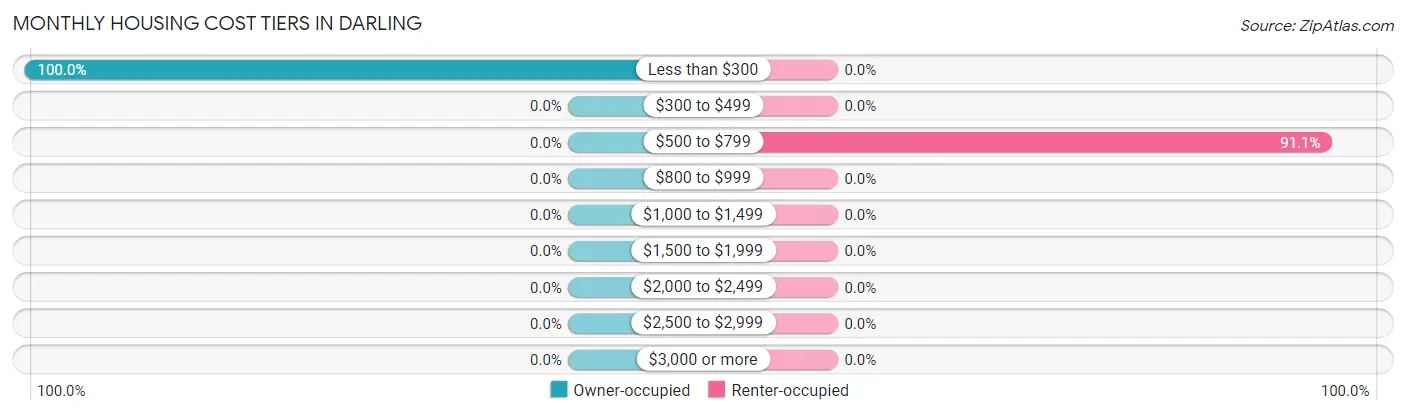
| Monthly Cost | Owner-occupied | Renter-occupied |
| Less than $300 | 46 (100.0%) | 0 (0.0%) |
| $300 to $499 | 0 (0.0%) | 0 (0.0%) |
| $500 to $799 | 0 (0.0%) | 41 (91.1%) |
| $800 to $999 | 0 (0.0%) | 0 (0.0%) |
| $1,000 to $1,499 | 0 (0.0%) | 0 (0.0%) |
| $1,500 to $1,999 | 0 (0.0%) | 0 (0.0%) |
| $2,000 to $2,499 | 0 (0.0%) | 0 (0.0%) |
| $2,500 to $2,999 | 0 (0.0%) | 0 (0.0%) |
| $3,000 or more | 0 (0.0%) | 0 (0.0%) |
| Total | 46 (100.0%) | 45 (100.0%) |
Physical Housing Characteristics in Darling
Housing Structures in Darling
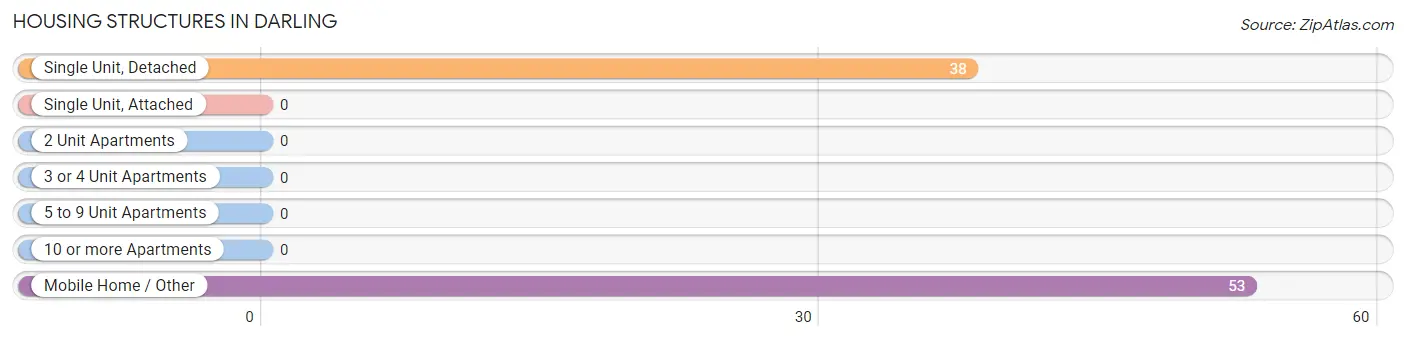
| Structure Type | # Housing Units | % Housing Units |
| Single Unit, Detached | 38 | 41.8% |
| Single Unit, Attached | 0 | 0.0% |
| 2 Unit Apartments | 0 | 0.0% |
| 3 or 4 Unit Apartments | 0 | 0.0% |
| 5 to 9 Unit Apartments | 0 | 0.0% |
| 10 or more Apartments | 0 | 0.0% |
| Mobile Home / Other | 53 | 58.2% |
| Total | 91 | 100.0% |
Housing Structures by Occupancy in Darling
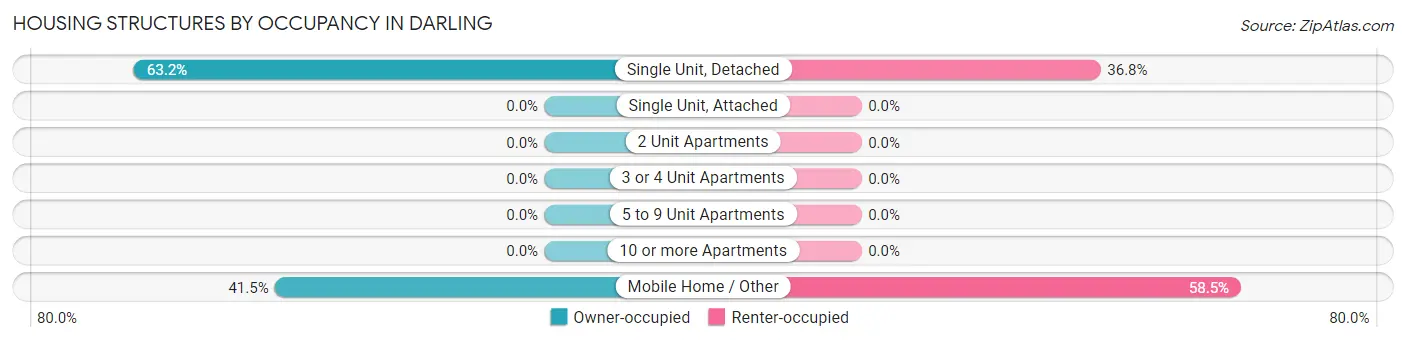
| Structure Type | Owner-occupied | Renter-occupied |
| Single Unit, Detached | 24 (63.2%) | 14 (36.8%) |
| Single Unit, Attached | 0 (0.0%) | 0 (0.0%) |
| 2 Unit Apartments | 0 (0.0%) | 0 (0.0%) |
| 3 or 4 Unit Apartments | 0 (0.0%) | 0 (0.0%) |
| 5 to 9 Unit Apartments | 0 (0.0%) | 0 (0.0%) |
| 10 or more Apartments | 0 (0.0%) | 0 (0.0%) |
| Mobile Home / Other | 22 (41.5%) | 31 (58.5%) |
| Total | 46 (50.5%) | 45 (49.4%) |
Housing Structures by Number of Rooms in Darling
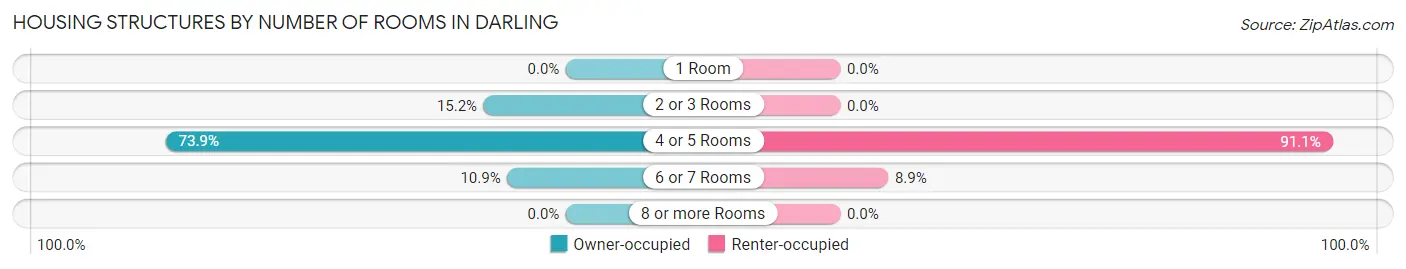
| Number of Rooms | Owner-occupied | Renter-occupied |
| 1 Room | 0 (0.0%) | 0 (0.0%) |
| 2 or 3 Rooms | 7 (15.2%) | 0 (0.0%) |
| 4 or 5 Rooms | 34 (73.9%) | 41 (91.1%) |
| 6 or 7 Rooms | 5 (10.9%) | 4 (8.9%) |
| 8 or more Rooms | 0 (0.0%) | 0 (0.0%) |
| Total | 46 (100.0%) | 45 (100.0%) |
Housing Structure by Heating Type in Darling
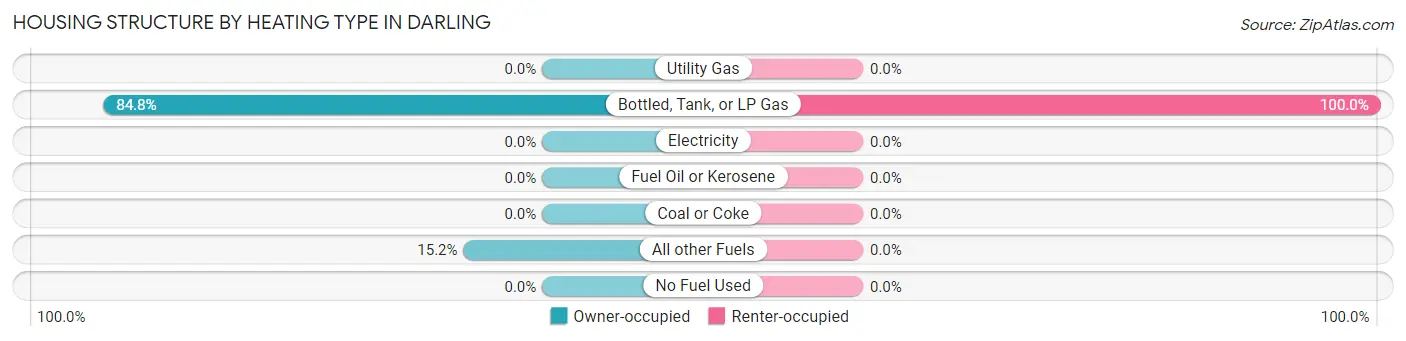
| Heating Type | Owner-occupied | Renter-occupied |
| Utility Gas | 0 (0.0%) | 0 (0.0%) |
| Bottled, Tank, or LP Gas | 39 (84.8%) | 45 (100.0%) |
| Electricity | 0 (0.0%) | 0 (0.0%) |
| Fuel Oil or Kerosene | 0 (0.0%) | 0 (0.0%) |
| Coal or Coke | 0 (0.0%) | 0 (0.0%) |
| All other Fuels | 7 (15.2%) | 0 (0.0%) |
| No Fuel Used | 0 (0.0%) | 0 (0.0%) |
| Total | 46 (100.0%) | 45 (100.0%) |
Household Vehicle Usage in Darling
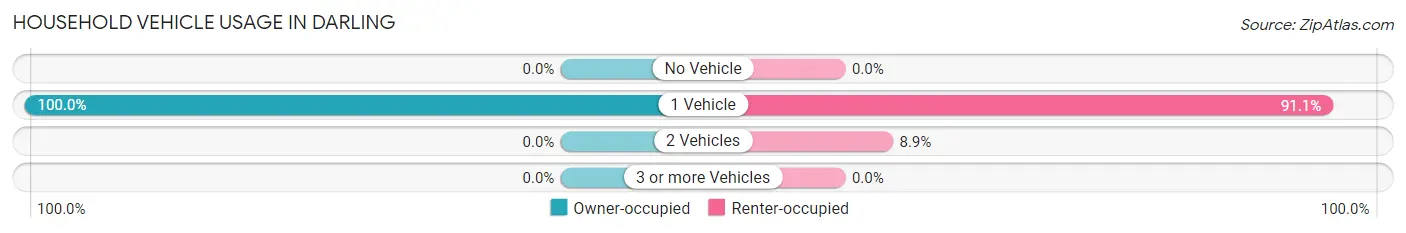
| Vehicles per Household | Owner-occupied | Renter-occupied |
| No Vehicle | 0 (0.0%) | 0 (0.0%) |
| 1 Vehicle | 46 (100.0%) | 41 (91.1%) |
| 2 Vehicles | 0 (0.0%) | 4 (8.9%) |
| 3 or more Vehicles | 0 (0.0%) | 0 (0.0%) |
| Total | 46 (100.0%) | 45 (100.0%) |
Real Estate & Mortgages in Darling
Real Estate and Mortgage Overview in Darling
| Characteristic | Without Mortgage | With Mortgage |
| Housing Units | 46 | 0 |
| Median Property Value | $27,500 | $0 |
| Median Household Income | $17,000 | $0 |
| Monthly Housing Costs | $247 | $0 |
| Real Estate Taxes | - | - |
Property Value by Mortgage Status in Darling
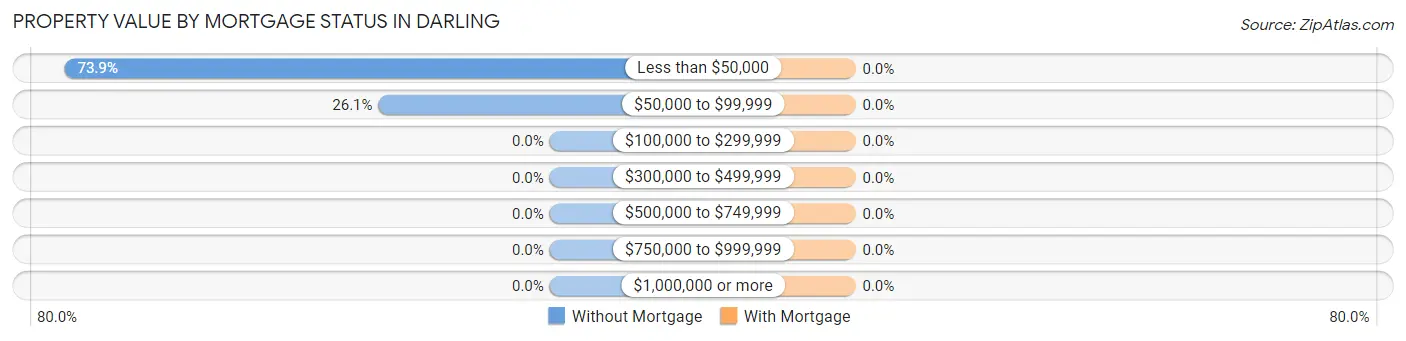
| Property Value | Without Mortgage | With Mortgage |
| Less than $50,000 | 34 (73.9%) | 0 (0.0%) |
| $50,000 to $99,999 | 12 (26.1%) | 0 (0.0%) |
| $100,000 to $299,999 | 0 (0.0%) | 0 (0.0%) |
| $300,000 to $499,999 | 0 (0.0%) | 0 (0.0%) |
| $500,000 to $749,999 | 0 (0.0%) | 0 (0.0%) |
| $750,000 to $999,999 | 0 (0.0%) | 0 (0.0%) |
| $1,000,000 or more | 0 (0.0%) | 0 (0.0%) |
| Total | 46 (100.0%) | 0 (0.0%) |
Household Income by Mortgage Status in Darling
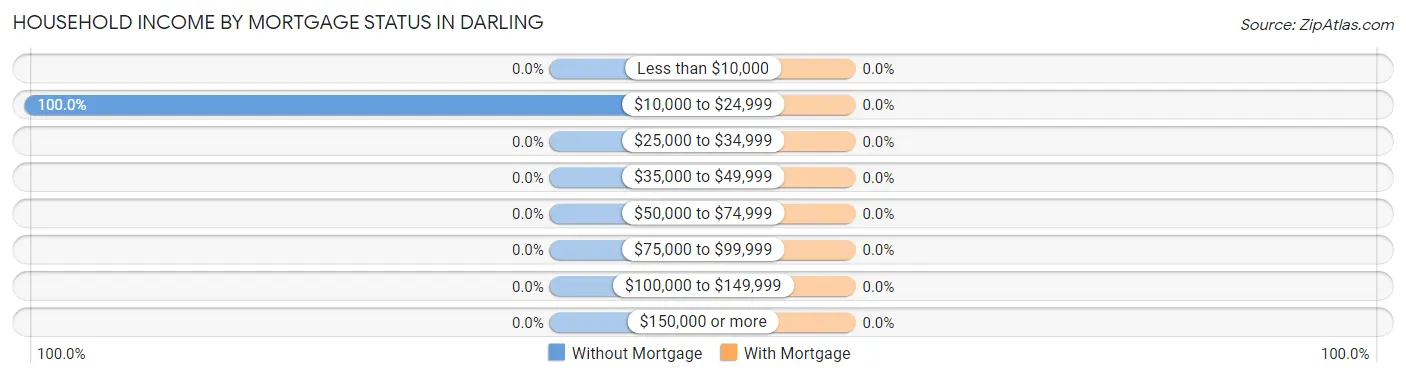
| Household Income | Without Mortgage | With Mortgage |
| Less than $10,000 | 0 (0.0%) | 0 (0.0%) |
| $10,000 to $24,999 | 46 (100.0%) | 0 (0.0%) |
| $25,000 to $34,999 | 0 (0.0%) | 0 (0.0%) |
| $35,000 to $49,999 | 0 (0.0%) | 0 (0.0%) |
| $50,000 to $74,999 | 0 (0.0%) | 0 (0.0%) |
| $75,000 to $99,999 | 0 (0.0%) | 0 (0.0%) |
| $100,000 to $149,999 | 0 (0.0%) | 0 (0.0%) |
| $150,000 or more | 0 (0.0%) | 0 (0.0%) |
| Total | 46 (100.0%) | 0 (0.0%) |
Property Value to Household Income Ratio in Darling
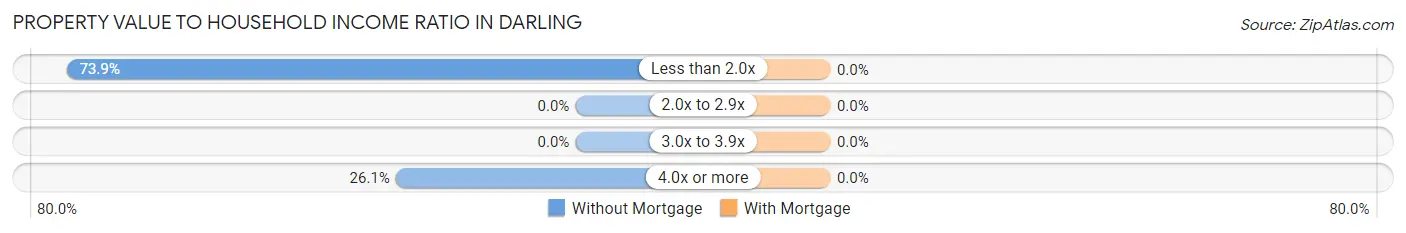
| Value-to-Income Ratio | Without Mortgage | With Mortgage |
| Less than 2.0x | 34 (73.9%) | 0 (0.0%) |
| 2.0x to 2.9x | 0 (0.0%) | 0 (0.0%) |
| 3.0x to 3.9x | 0 (0.0%) | 0 (0.0%) |
| 4.0x or more | 12 (26.1%) | 0 (0.0%) |
| Total | 46 (100.0%) | 0 (0.0%) |
Real Estate Taxes by Mortgage Status in Darling
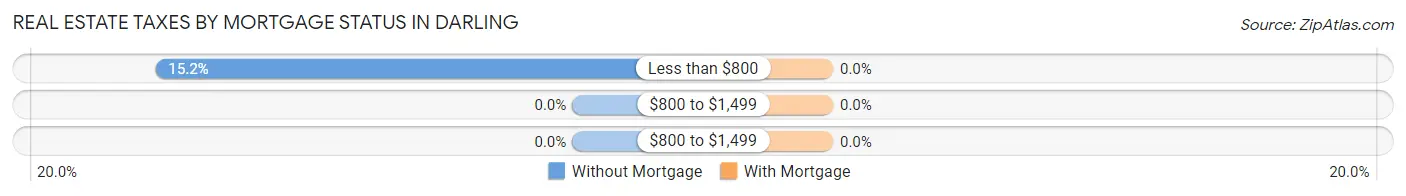
| Property Taxes | Without Mortgage | With Mortgage |
| Less than $800 | 7 (15.2%) | 0 (0.0%) |
| $800 to $1,499 | 0 (0.0%) | 0 (0.0%) |
| $800 to $1,499 | 0 (0.0%) | 0 (0.0%) |
| Total | 46 (100.0%) | 0 (0.0%) |
Health & Disability in Darling
Health Insurance Coverage by Age in Darling
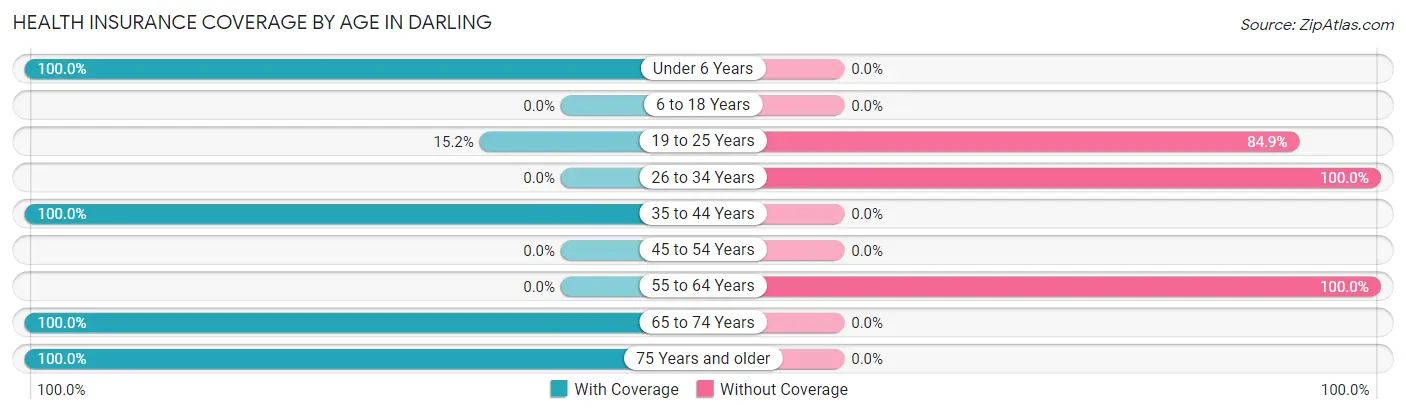
| Age Bracket | With Coverage | Without Coverage |
| Under 6 Years | 17 (100.0%) | 0 (0.0%) |
| 6 to 18 Years | 0 (0.0%) | 0 (0.0%) |
| 19 to 25 Years | 10 (15.1%) | 56 (84.9%) |
| 26 to 34 Years | 0 (0.0%) | 8 (100.0%) |
| 35 to 44 Years | 22 (100.0%) | 0 (0.0%) |
| 45 to 54 Years | 0 (0.0%) | 0 (0.0%) |
| 55 to 64 Years | 0 (0.0%) | 7 (100.0%) |
| 65 to 74 Years | 21 (100.0%) | 0 (0.0%) |
| 75 Years and older | 16 (100.0%) | 0 (0.0%) |
| Total | 86 (54.8%) | 71 (45.2%) |
Health Insurance Coverage by Citizenship Status in Darling
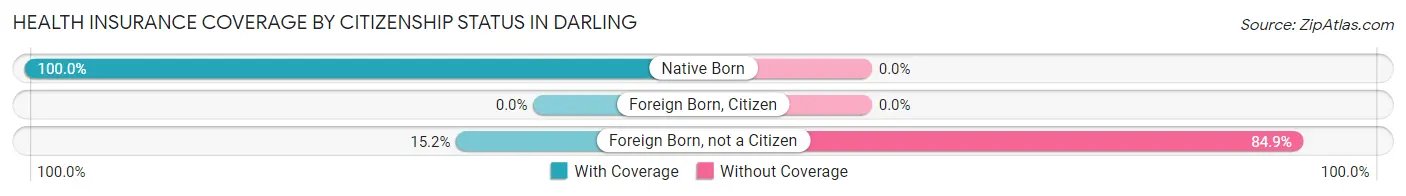
| Citizenship Status | With Coverage | Without Coverage |
| Native Born | 17 (100.0%) | 0 (0.0%) |
| Foreign Born, Citizen | 0 (0.0%) | 0 (0.0%) |
| Foreign Born, not a Citizen | 10 (15.1%) | 56 (84.9%) |
Health Insurance Coverage by Household Income in Darling
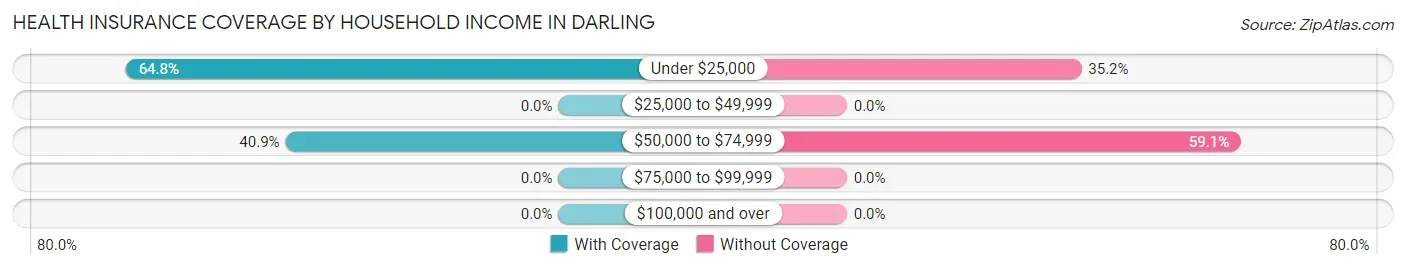
| Household Income | With Coverage | Without Coverage |
| Under $25,000 | 59 (64.8%) | 32 (35.2%) |
| $25,000 to $49,999 | 0 (0.0%) | 0 (0.0%) |
| $50,000 to $74,999 | 27 (40.9%) | 39 (59.1%) |
| $75,000 to $99,999 | 0 (0.0%) | 0 (0.0%) |
| $100,000 and over | 0 (0.0%) | 0 (0.0%) |
Public vs Private Health Insurance Coverage by Age in Darling
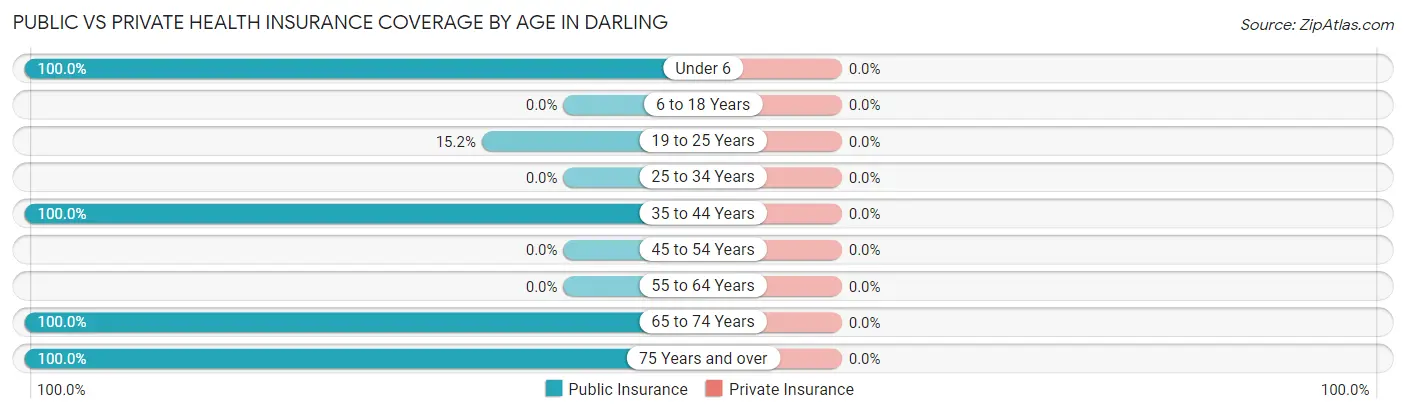
| Age Bracket | Public Insurance | Private Insurance |
| Under 6 | 17 (100.0%) | 0 (0.0%) |
| 6 to 18 Years | 0 (0.0%) | 0 (0.0%) |
| 19 to 25 Years | 10 (15.1%) | 0 (0.0%) |
| 25 to 34 Years | 0 (0.0%) | 0 (0.0%) |
| 35 to 44 Years | 22 (100.0%) | 0 (0.0%) |
| 45 to 54 Years | 0 (0.0%) | 0 (0.0%) |
| 55 to 64 Years | 0 (0.0%) | 0 (0.0%) |
| 65 to 74 Years | 21 (100.0%) | 0 (0.0%) |
| 75 Years and over | 16 (100.0%) | 0 (0.0%) |
| Total | 86 (54.8%) | 0 (0.0%) |
Disability Status by Sex by Age in Darling
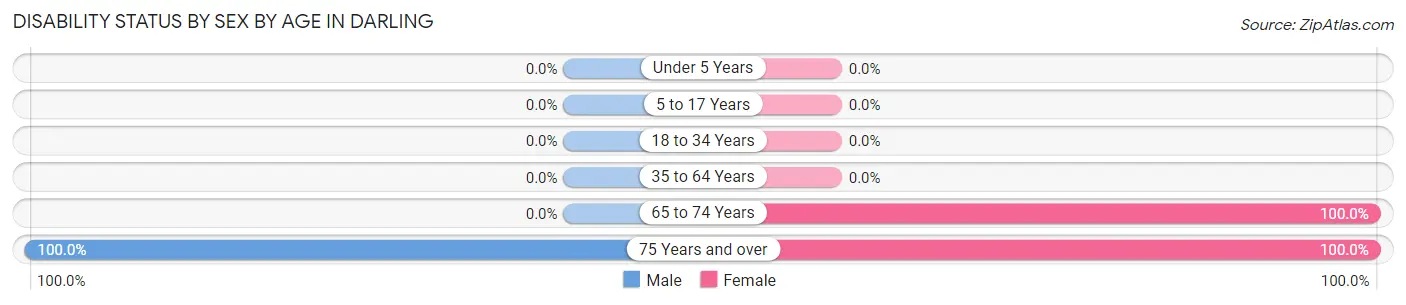
| Age Bracket | Male | Female |
| Under 5 Years | 0 (0.0%) | 0 (0.0%) |
| 5 to 17 Years | 0 (0.0%) | 0 (0.0%) |
| 18 to 34 Years | 0 (0.0%) | 0 (0.0%) |
| 35 to 64 Years | 0 (0.0%) | 0 (0.0%) |
| 65 to 74 Years | 0 (0.0%) | 6 (100.0%) |
| 75 Years and over | 4 (100.0%) | 12 (100.0%) |
Disability Class by Sex by Age in Darling
Disability Class: Hearing Difficulty
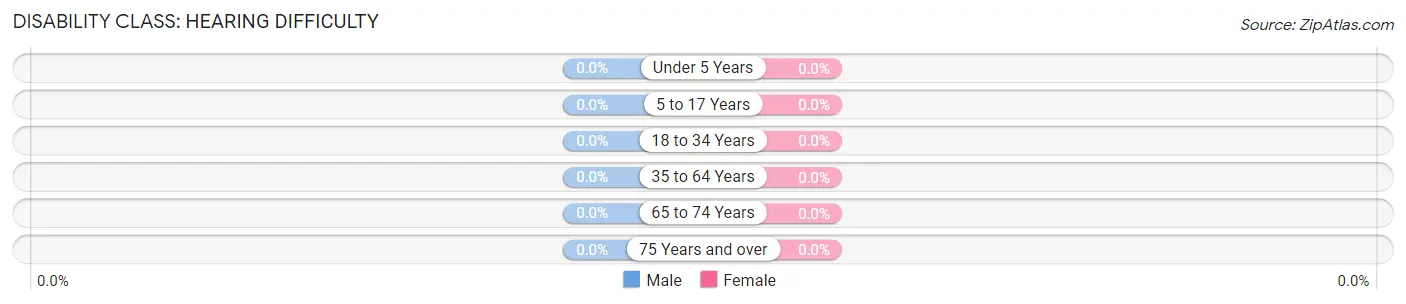
| Age Bracket | Male | Female |
| Under 5 Years | 0 (0.0%) | 0 (0.0%) |
| 5 to 17 Years | 0 (0.0%) | 0 (0.0%) |
| 18 to 34 Years | 0 (0.0%) | 0 (0.0%) |
| 35 to 64 Years | 0 (0.0%) | 0 (0.0%) |
| 65 to 74 Years | 0 (0.0%) | 0 (0.0%) |
| 75 Years and over | 0 (0.0%) | 0 (0.0%) |
Disability Class: Vision Difficulty
| Age Bracket | Male | Female |
| Under 5 Years | 0 (0.0%) | 0 (0.0%) |
| 5 to 17 Years | 0 (0.0%) | 0 (0.0%) |
| 18 to 34 Years | 0 (0.0%) | 0 (0.0%) |
| 35 to 64 Years | 0 (0.0%) | 0 (0.0%) |
| 65 to 74 Years | 0 (0.0%) | 0 (0.0%) |
| 75 Years and over | 0 (0.0%) | 0 (0.0%) |
Disability Class: Cognitive Difficulty
| Age Bracket | Male | Female |
| 5 to 17 Years | 0 (0.0%) | 0 (0.0%) |
| 18 to 34 Years | 0 (0.0%) | 0 (0.0%) |
| 35 to 64 Years | 0 (0.0%) | 0 (0.0%) |
| 65 to 74 Years | 0 (0.0%) | 0 (0.0%) |
| 75 Years and over | 0 (0.0%) | 0 (0.0%) |
Disability Class: Ambulatory Difficulty
| Age Bracket | Male | Female |
| 5 to 17 Years | 0 (0.0%) | 0 (0.0%) |
| 18 to 34 Years | 0 (0.0%) | 0 (0.0%) |
| 35 to 64 Years | 0 (0.0%) | 0 (0.0%) |
| 65 to 74 Years | 0 (0.0%) | 6 (100.0%) |
| 75 Years and over | 4 (100.0%) | 0 (0.0%) |
Disability Class: Self-Care Difficulty
| Age Bracket | Male | Female |
| 5 to 17 Years | 0 (0.0%) | 0 (0.0%) |
| 18 to 34 Years | 0 (0.0%) | 0 (0.0%) |
| 35 to 64 Years | 0 (0.0%) | 0 (0.0%) |
| 65 to 74 Years | 0 (0.0%) | 0 (0.0%) |
| 75 Years and over | 0 (0.0%) | 0 (0.0%) |
Technology Access in Darling
Computing Device Access in Darling
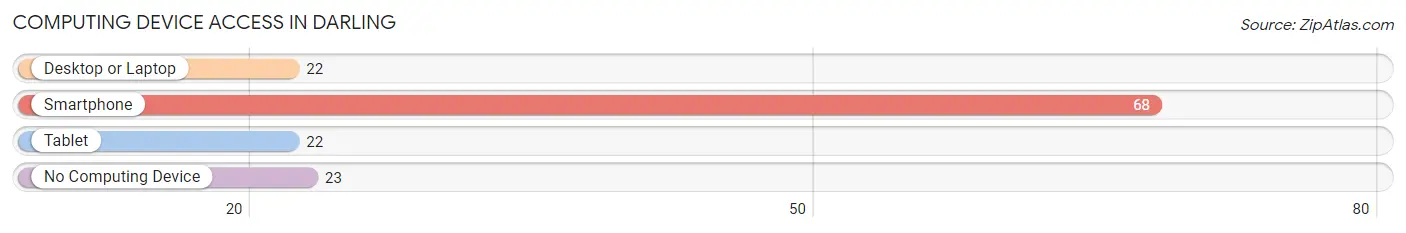
| Device Type | # Households | % Households |
| Desktop or Laptop | 22 | 24.2% |
| Smartphone | 68 | 74.7% |
| Tablet | 22 | 24.2% |
| No Computing Device | 23 | 25.3% |
| Total | 91 | 100.0% |
Internet Access in Darling
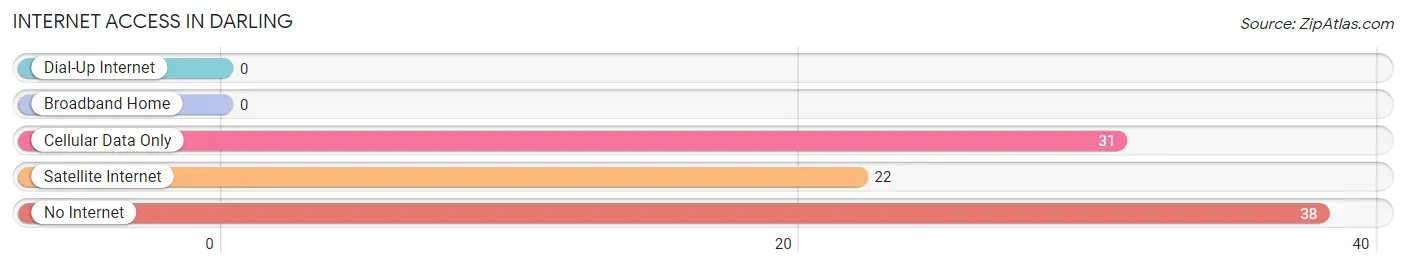
| Internet Type | # Households | % Households |
| Dial-Up Internet | 0 | 0.0% |
| Broadband Home | 0 | 0.0% |
| Cellular Data Only | 31 | 34.1% |
| Satellite Internet | 22 | 24.2% |
| No Internet | 38 | 41.8% |
| Total | 91 | 100.0% |
Darling Summary
MS History
Mississippi is a state located in the southeastern region of the United States. It is bordered by Tennessee to the north, Alabama to the east, the Gulf of Mexico to the south, and Louisiana and Arkansas to the west. Mississippi has a rich and diverse history, with its earliest inhabitants being Native American tribes such as the Choctaw, Chickasaw, and Natchez. The first Europeans to explore the area were the Spanish, who arrived in the 16th century. The French then established a colony in the area in the 17th century, and the British took control of the region in the 18th century.
Mississippi became part of the United States in 1798, and was admitted as the 20th state in 1817. During the 19th century, Mississippi was a slave state, and the state was a major battleground during the Civil War. After the war, Mississippi was the first state to ratify the 13th Amendment, which abolished slavery.
In the late 19th and early 20th centuries, Mississippi was a major center of the civil rights movement. The state was the site of the 1964 Freedom Summer, when civil rights activists from around the country came to Mississippi to register African-American voters and challenge segregation. In the late 20th century, Mississippi was the site of the first successful civil rights lawsuit, which resulted in the desegregation of the state’s public schools.
MS Geography
Mississippi is located in the southeastern region of the United States. It is bordered by Tennessee to the north, Alabama to the east, the Gulf of Mexico to the south, and Louisiana and Arkansas to the west. Mississippi is the 32nd largest state in the country, with an area of 48,430 square miles.
The state is divided into three distinct geographic regions. The Gulf Coastal Plain is located in the southern part of the state, and is characterized by flat, low-lying land. The Piedmont Plateau is located in the central part of the state, and is characterized by rolling hills and valleys. The Appalachian Mountains are located in the northern part of the state, and are characterized by steep, rugged terrain.
The Mississippi River is the state’s most important waterway, and is the second longest river in the United States. Other major rivers in the state include the Yazoo, Big Black, and Pearl Rivers. The state also has numerous lakes, including Ross Barnett Reservoir, Sardis Lake, and Grenada Lake.
MS Economy
Mississippi’s economy is largely based on agriculture, manufacturing, and services. The state’s agricultural sector is the largest in the country, and is responsible for producing a variety of crops, including cotton, soybeans, corn, and rice. The state’s manufacturing sector is also important, and is responsible for producing a variety of products, including furniture, chemicals, and textiles. The state’s service sector is also important, and is responsible for providing a variety of services, including healthcare, education, and tourism.
The state’s economy has been growing in recent years, and the unemployment rate has been steadily declining. The state’s GDP was estimated to be $112.3 billion in 2018, and the median household income was estimated to be $44,758 in 2018.
MS Demographics
As of 2019, Mississippi had an estimated population of 2,976,149. The state’s population is largely composed of African Americans, who make up 38.3% of the population. Whites make up 57.2% of the population, and Hispanics make up 2.5% of the population.
The state’s largest city is Jackson, which has an estimated population of 173,514. Other major cities in the state include Gulfport, Southaven, Hattiesburg, and Biloxi. The state’s capital is Jackson.
Mississippi is a largely rural state, with only about one-third of the population living in urban areas. The state’s median age is 37.2, and the state’s population is growing at a rate of 0.6% per year.
Common Questions
What is Per Capita Income in Darling?
Per Capita income in Darling is $13,608.
What is the Median Family Income in Darling?
Median Family Income in Darling is $55,524.
What is Inequality or Gini Index in Darling?
Inequality or Gini Index in Darling is 0.32.
What is the Total Population of Darling?
Total Population of Darling is 157.
What is the Total Male Population of Darling?
Total Male Population of Darling is 63.
What is the Total Female Population of Darling?
Total Female Population of Darling is 94.
What is the Ratio of Males per 100 Females in Darling?
There are 67.02 Males per 100 Females in Darling.
What is the Ratio of Females per 100 Males in Darling?
There are 149.21 Females per 100 Males in Darling.
What is the Median Population Age in Darling?
Median Population Age in Darling is 25.6 Years.
What is the Average Family Size in Darling
Average Family Size in Darling is 2.2 People.
What is the Average Household Size in Darling
Average Household Size in Darling is 1.7 People.
How Large is the Labor Force in Darling?
There are 51 People in the Labor Forcein in Darling.
What is the Percentage of People in the Labor Force in Darling?
36.4% of People are in the Labor Force in Darling.