States with the Highest Percentage of Population Employed in Cleaning & Maintenance
RELATED REPORTS & OPTIONS
Cleaning & Maintenance
United States
Compare States
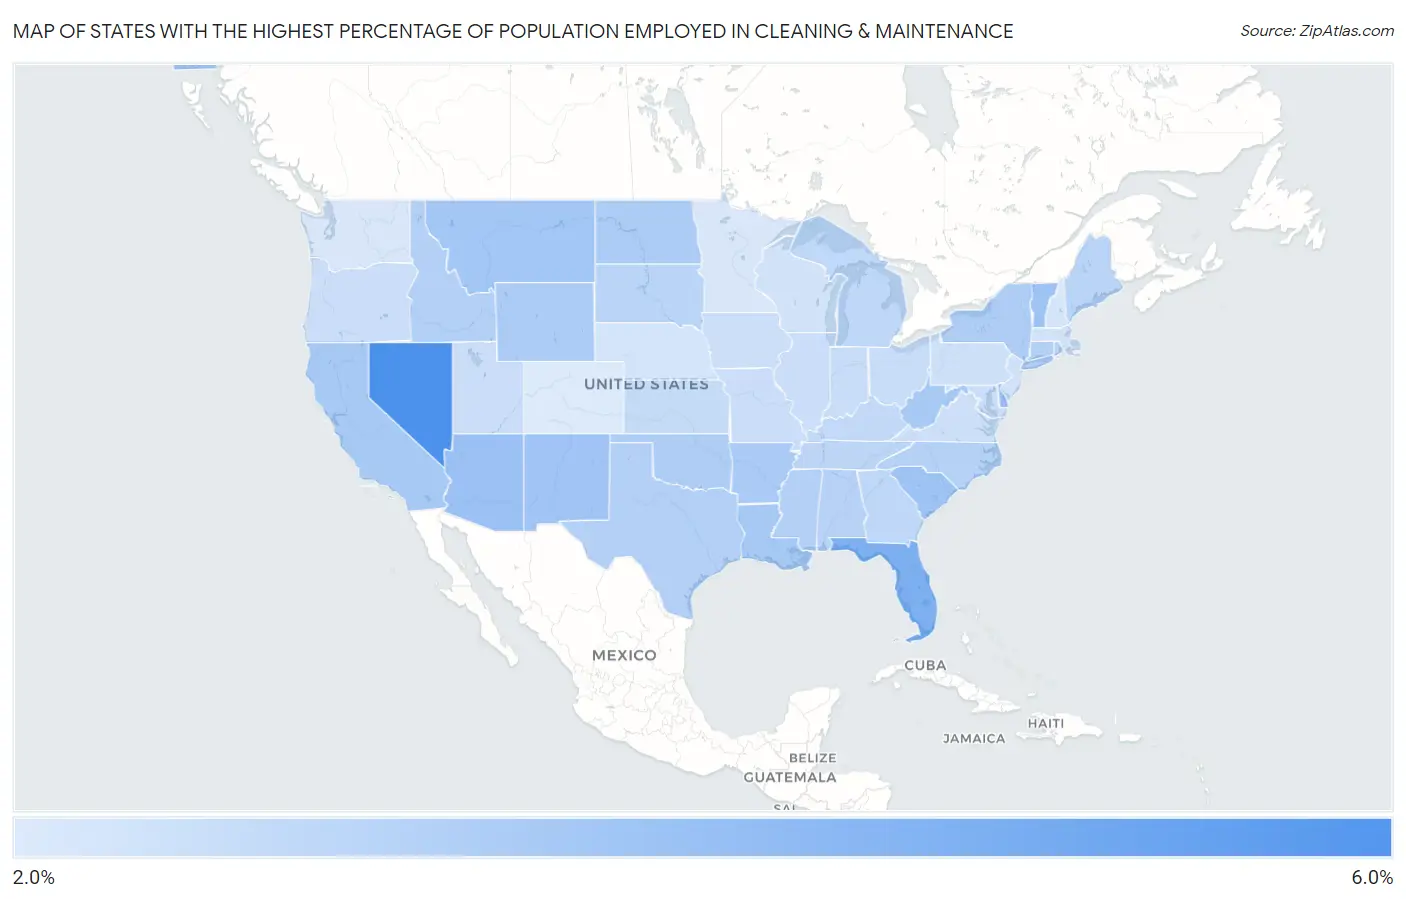
Map of States with the Highest Percentage of Population Employed in Cleaning & Maintenance
2.0%
6.0%
States with the Highest Percentage of Population Employed in Cleaning & Maintenance in the United States
| State | % Employed | vs State Median | vs National | |
| 1. | Hawaii | 5.3% | 3.4% (+1.83) | 3.5%(+1.79) |
| 2. | Nevada | 5.2% | 3.4% (+1.74) | 3.5%(+1.70) |
| 3. | Florida | 4.4% | 3.4% (+0.966) | 3.5%(+0.929) |
| 4. | Delaware | 4.0% | 3.4% (+0.562) | 3.5%(+0.524) |
| 5. | Arizona | 3.9% | 3.4% (+0.474) | 3.5%(+0.436) |
| 6. | Vermont | 3.9% | 3.4% (+0.435) | 3.5%(+0.398) |
| 7. | South Carolina | 3.9% | 3.4% (+0.424) | 3.5%(+0.386) |
| 8. | New Mexico | 3.9% | 3.4% (+0.413) | 3.5%(+0.375) |
| 9. | Montana | 3.8% | 3.4% (+0.348) | 3.5%(+0.311) |
| 10. | West Virginia | 3.7% | 3.4% (+0.291) | 3.5%(+0.253) |
| 11. | Louisiana | 3.7% | 3.4% (+0.282) | 3.5%(+0.244) |
| 12. | California | 3.7% | 3.4% (+0.273) | 3.5%(+0.235) |
| 13. | Alaska | 3.7% | 3.4% (+0.256) | 3.5%(+0.218) |
| 14. | Arkansas | 3.7% | 3.4% (+0.245) | 3.5%(+0.207) |
| 15. | Wyoming | 3.7% | 3.4% (+0.224) | 3.5%(+0.186) |
| 16. | North Dakota | 3.6% | 3.4% (+0.201) | 3.5%(+0.164) |
| 17. | Oklahoma | 3.6% | 3.4% (+0.190) | 3.5%(+0.152) |
| 18. | New York | 3.6% | 3.4% (+0.173) | 3.5%(+0.136) |
| 19. | Texas | 3.6% | 3.4% (+0.118) | 3.5%(+0.080) |
| 20. | Mississippi | 3.6% | 3.4% (+0.114) | 3.5%(+0.076) |
| 21. | Idaho | 3.5% | 3.4% (+0.102) | 3.5%(+0.064) |
| 22. | Connecticut | 3.5% | 3.4% (+0.096) | 3.5%(+0.058) |
| 23. | North Carolina | 3.5% | 3.4% (+0.052) | 3.5%(+0.015) |
| 24. | Alabama | 3.5% | 3.4% (+0.027) | 3.5%(-0.011) |
| 25. | Maine | 3.5% | 3.4% (+0.006) | 3.5%(-0.032) |
| 26. | South Dakota | 3.4% | 3.4% (-0.006) | 3.5%(-0.043) |
| 27. | Rhode Island | 3.4% | 3.4% (-0.023) | 3.5%(-0.061) |
| 28. | Tennessee | 3.4% | 3.4% (-0.045) | 3.5%(-0.082) |
| 29. | Michigan | 3.4% | 3.4% (-0.065) | 3.5%(-0.103) |
| 30. | Georgia | 3.4% | 3.4% (-0.087) | 3.5%(-0.125) |
| 31. | Kentucky | 3.3% | 3.4% (-0.133) | 3.5%(-0.171) |
| 32. | Kansas | 3.3% | 3.4% (-0.184) | 3.5%(-0.222) |
| 33. | Indiana | 3.2% | 3.4% (-0.213) | 3.5%(-0.251) |
| 34. | Ohio | 3.2% | 3.4% (-0.230) | 3.5%(-0.268) |
| 35. | Maryland | 3.2% | 3.4% (-0.250) | 3.5%(-0.287) |
| 36. | Illinois | 3.2% | 3.4% (-0.250) | 3.5%(-0.288) |
| 37. | Utah | 3.2% | 3.4% (-0.262) | 3.5%(-0.300) |
| 38. | Oregon | 3.2% | 3.4% (-0.268) | 3.5%(-0.306) |
| 39. | Missouri | 3.2% | 3.4% (-0.268) | 3.5%(-0.306) |
| 40. | Iowa | 3.1% | 3.4% (-0.302) | 3.5%(-0.339) |
| 41. | Virginia | 3.1% | 3.4% (-0.315) | 3.5%(-0.353) |
| 42. | Pennsylvania | 3.1% | 3.4% (-0.339) | 3.5%(-0.377) |
| 43. | Massachusetts | 3.1% | 3.4% (-0.362) | 3.5%(-0.400) |
| 44. | Wisconsin | 3.1% | 3.4% (-0.373) | 3.5%(-0.410) |
| 45. | New Jersey | 3.1% | 3.4% (-0.379) | 3.5%(-0.417) |
| 46. | Nebraska | 3.0% | 3.4% (-0.409) | 3.5%(-0.446) |
| 47. | New Hampshire | 3.0% | 3.4% (-0.438) | 3.5%(-0.476) |
| 48. | Washington | 3.0% | 3.4% (-0.462) | 3.5%(-0.500) |
| 49. | Minnesota | 3.0% | 3.4% (-0.477) | 3.5%(-0.515) |
| 50. | Colorado | 2.9% | 3.4% (-0.552) | 3.5%(-0.589) |
1
Common Questions
What are the Top 10 States with the Highest Percentage of Population Employed in Cleaning & Maintenance in the United States?
Top 10 States with the Highest Percentage of Population Employed in Cleaning & Maintenance in the United States are:
#1
5.3%
#2
5.2%
#3
4.4%
#4
4.0%
#5
3.9%
#6
3.9%
#7
3.9%
#8
3.9%
#9
3.8%
#10
3.7%
What state has the Highest Percentage of Population Employed in Cleaning & Maintenance in the United States?
Hawaii has the Highest Percentage of Population Employed in Cleaning & Maintenance in the United States with 5.3%.
What is the Percentage of Population Employed in Cleaning & Maintenance in the United States?
Percentage of Population Employed in Cleaning & Maintenance in the United States is 3.5%.