Echo, UT Map & Demographics
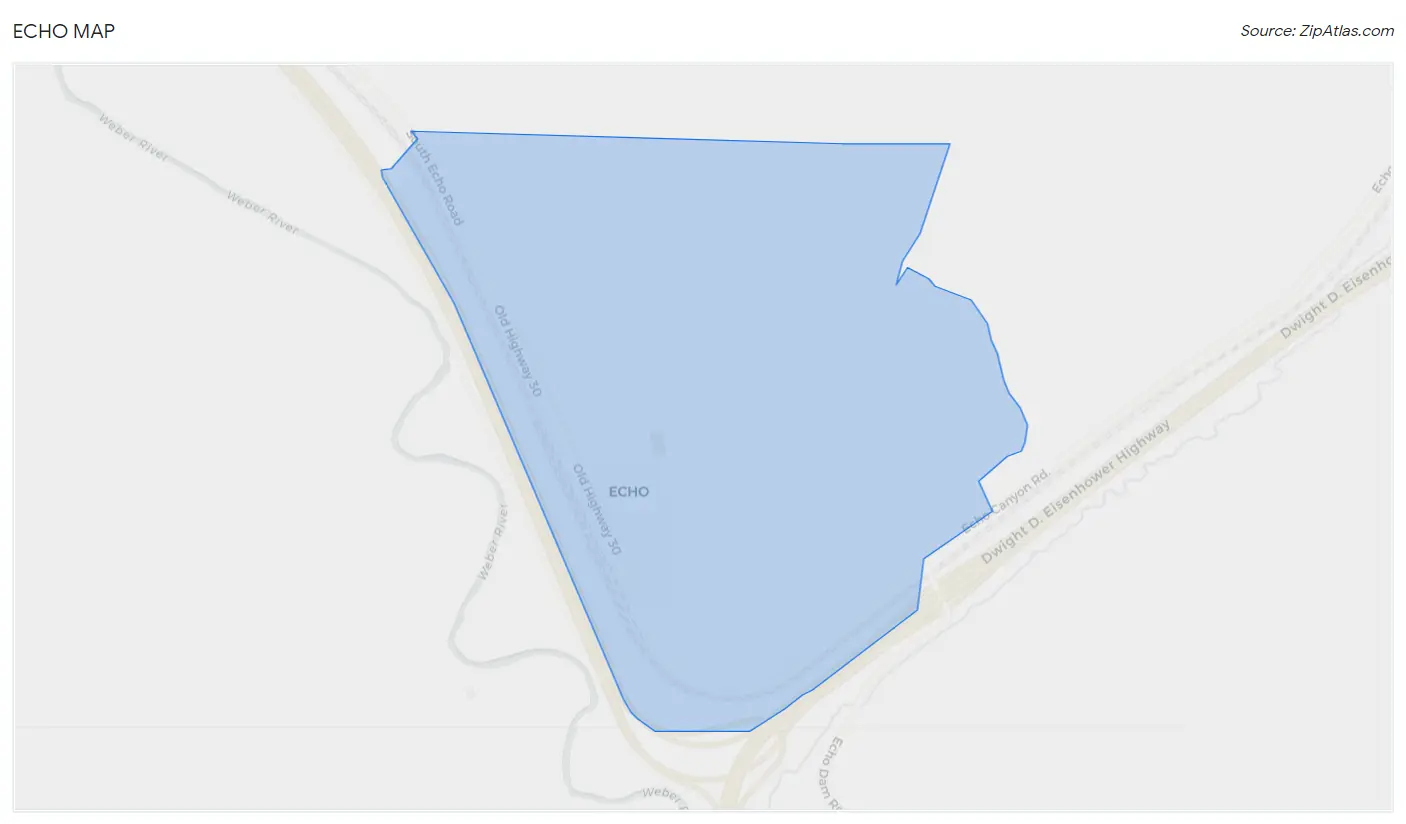
Echo Map
Echo Overview
$26,577
PER CAPITA INCOME
$91,429
AVG FAMILY INCOME
$90,714
AVG HOUSEHOLD INCOME
0.28
INEQUALITY / GINI INDEX
79
TOTAL POPULATION
47
MALE POPULATION
32
FEMALE POPULATION
146.88
MALES / 100 FEMALES
68.09
FEMALES / 100 MALES
41.4
MEDIAN AGE
4.2
AVG FAMILY SIZE
3.6
AVG HOUSEHOLD SIZE
54
LABOR FORCE [ PEOPLE ]
68.4%
PERCENT IN LABOR FORCE
27.8%
UNEMPLOYMENT RATE
Echo Zip Codes
Echo Area Codes
Income in Echo
Income Overview in Echo
Per Capita Income in Echo is $26,577, while median incomes of families and households are $91,429 and $90,714 respectively.
| Characteristic | Number | Measure |
| Per Capita Income | 79 | $26,577 |
| Median Family Income | 18 | $91,429 |
| Mean Family Income | 18 | $104,072 |
| Median Household Income | 22 | $90,714 |
| Mean Household Income | 22 | $86,795 |
| Income Deficit | 18 | $0 |
| Wage / Income Gap (%) | 79 | 0.00% |
| Wage / Income Gap ($) | 79 | 100.00¢ per $1 |
| Gini / Inequality Index | 79 | 0.28 |
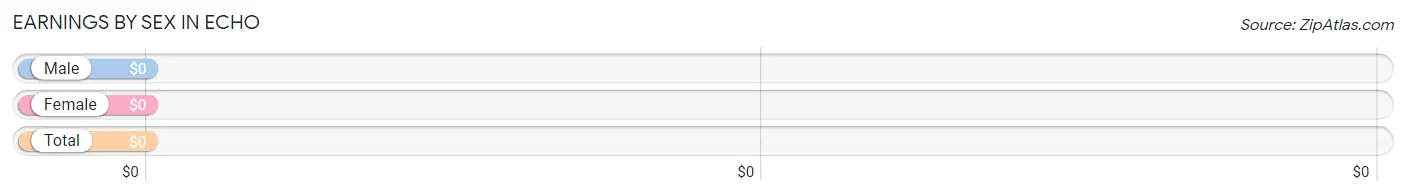
Earnings by Sex in Echo
| Sex | Number | Average Earnings |
| Male | 40 (74.1%) | $0 |
| Female | 14 (25.9%) | $0 |
| Total | 54 (100.0%) | $0 |
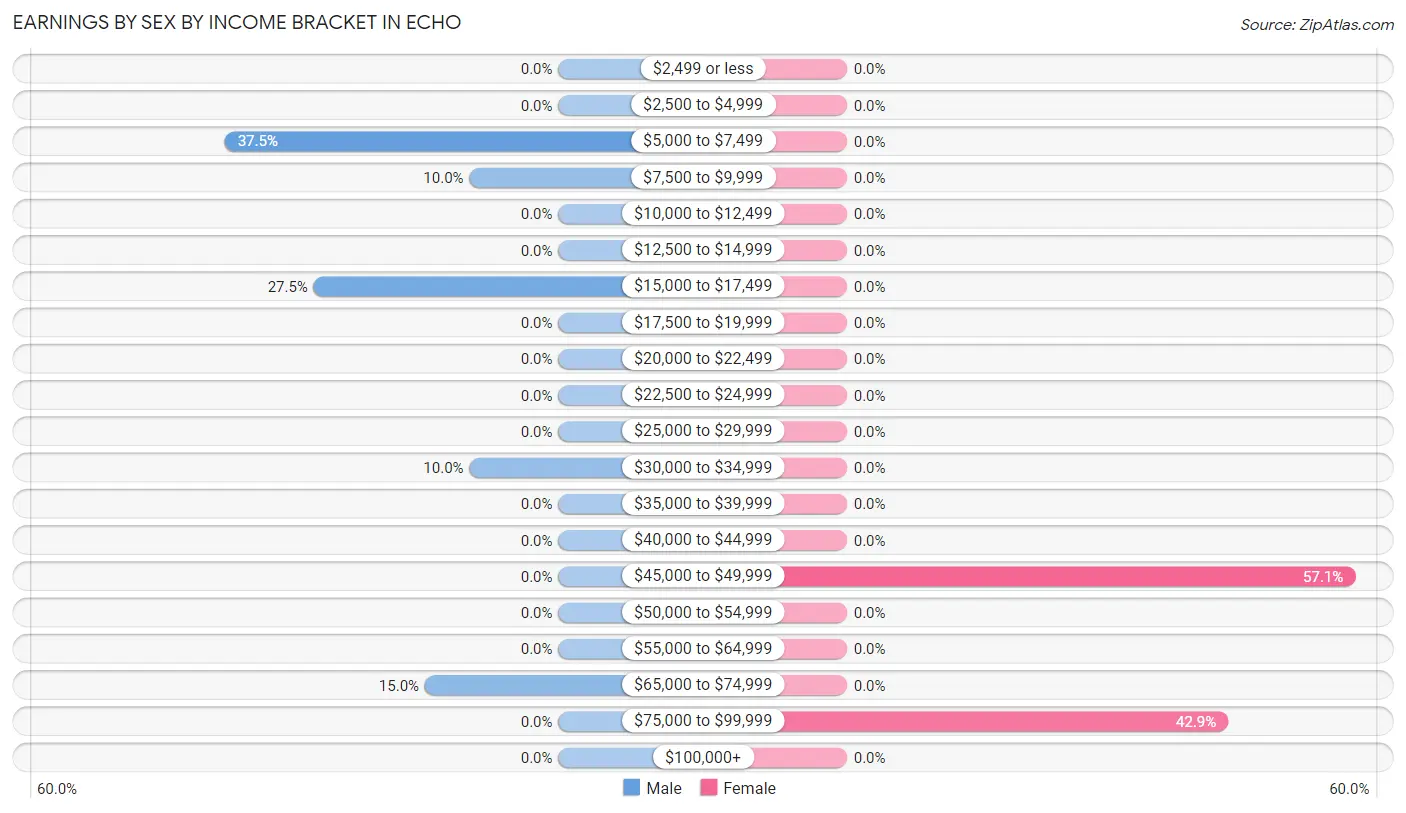
Earnings by Sex by Income Bracket in Echo
The most common earnings brackets in Echo are $5,000 to $7,499 for men (15 | 37.5%) and $45,000 to $49,999 for women (8 | 57.1%).
| Income | Male | Female |
| $2,499 or less | 0 (0.0%) | 0 (0.0%) |
| $2,500 to $4,999 | 0 (0.0%) | 0 (0.0%) |
| $5,000 to $7,499 | 15 (37.5%) | 0 (0.0%) |
| $7,500 to $9,999 | 4 (10.0%) | 0 (0.0%) |
| $10,000 to $12,499 | 0 (0.0%) | 0 (0.0%) |
| $12,500 to $14,999 | 0 (0.0%) | 0 (0.0%) |
| $15,000 to $17,499 | 11 (27.5%) | 0 (0.0%) |
| $17,500 to $19,999 | 0 (0.0%) | 0 (0.0%) |
| $20,000 to $22,499 | 0 (0.0%) | 0 (0.0%) |
| $22,500 to $24,999 | 0 (0.0%) | 0 (0.0%) |
| $25,000 to $29,999 | 0 (0.0%) | 0 (0.0%) |
| $30,000 to $34,999 | 4 (10.0%) | 0 (0.0%) |
| $35,000 to $39,999 | 0 (0.0%) | 0 (0.0%) |
| $40,000 to $44,999 | 0 (0.0%) | 0 (0.0%) |
| $45,000 to $49,999 | 0 (0.0%) | 8 (57.1%) |
| $50,000 to $54,999 | 0 (0.0%) | 0 (0.0%) |
| $55,000 to $64,999 | 0 (0.0%) | 0 (0.0%) |
| $65,000 to $74,999 | 6 (15.0%) | 0 (0.0%) |
| $75,000 to $99,999 | 0 (0.0%) | 6 (42.9%) |
| $100,000+ | 0 (0.0%) | 0 (0.0%) |
| Total | 40 (100.0%) | 14 (100.0%) |
Earnings by Sex by Educational Attainment in Echo
| Educational Attainment | Male Income | Female Income |
| Less than High School | - | - |
| High School Diploma | - | - |
| College or Associate's Degree | - | - |
| Bachelor's Degree | - | - |
| Graduate Degree | - | - |
| Total | - | - |
Family Income in Echo
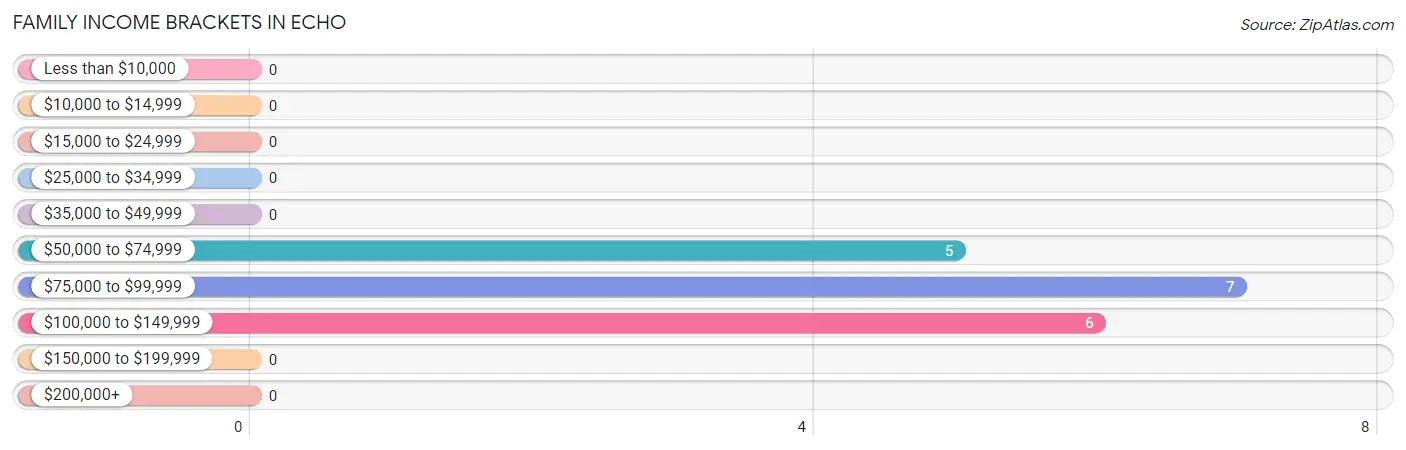
Family Income Brackets in Echo
According to the Echo family income data, there are 7 families falling into the $75,000 to $99,999 income range, which is the most common income bracket and makes up 38.9% of all families.
| Income Bracket | # Families | % Families |
| Less than $10,000 | 0 | 0.0% |
| $10,000 to $14,999 | 0 | 0.0% |
| $15,000 to $24,999 | 0 | 0.0% |
| $25,000 to $34,999 | 0 | 0.0% |
| $35,000 to $49,999 | 0 | 0.0% |
| $50,000 to $74,999 | 5 | 27.8% |
| $75,000 to $99,999 | 7 | 38.9% |
| $100,000 to $149,999 | 6 | 33.3% |
| $150,000 to $199,999 | 0 | 0.0% |
| $200,000+ | 0 | 0.0% |
Family Income by Famaliy Size in Echo
| Income Bracket | # Families | Median Income |
| 2-Person Families | 6 (33.3%) | $0 |
| 3-Person Families | 0 (0.0%) | $0 |
| 4-Person Families | 12 (66.7%) | $0 |
| 5-Person Families | 0 (0.0%) | $0 |
| 6-Person Families | 0 (0.0%) | $0 |
| 7+ Person Families | 0 (0.0%) | $0 |
| Total | 18 (100.0%) | $91,429 |
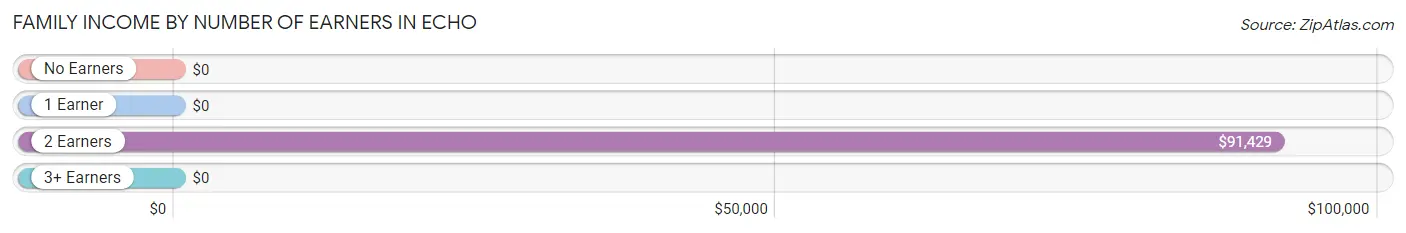
Family Income by Number of Earners in Echo
| Number of Earners | # Families | Median Income |
| No Earners | 0 (0.0%) | $0 |
| 1 Earner | 0 (0.0%) | $0 |
| 2 Earners | 18 (100.0%) | $91,429 |
| 3+ Earners | 0 (0.0%) | $0 |
| Total | 18 (100.0%) | $91,429 |
Household Income in Echo
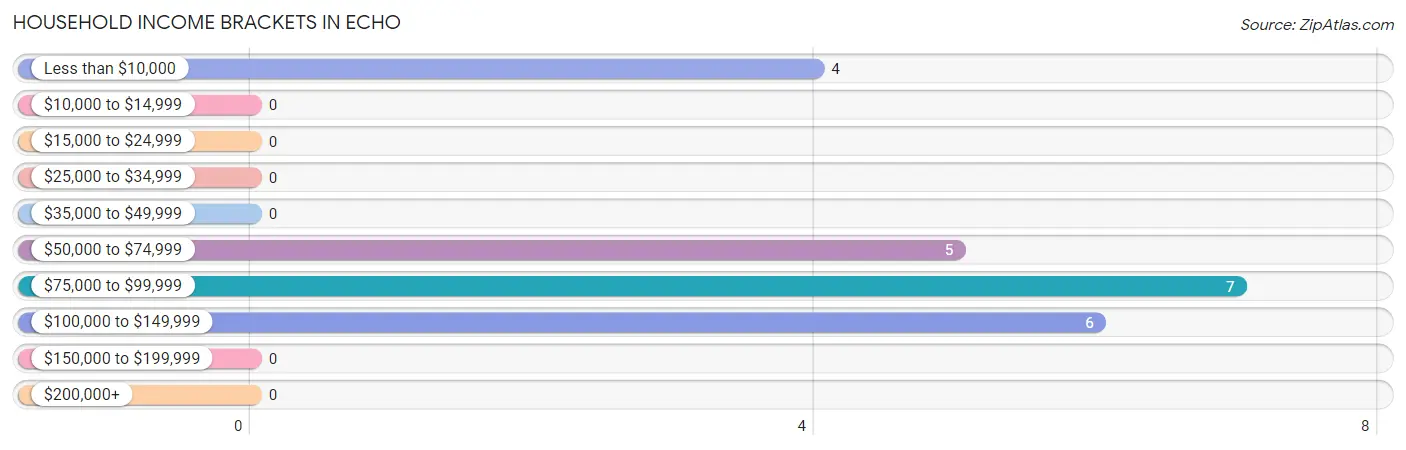
Household Income Brackets in Echo
With 7 households falling in the category, the $75,000 to $99,999 income range is the most frequent in Echo, accounting for 31.8% of all households.
| Income Bracket | # Households | % Households |
| Less than $10,000 | 4 | 18.2% |
| $10,000 to $14,999 | 0 | 0.0% |
| $15,000 to $24,999 | 0 | 0.0% |
| $25,000 to $34,999 | 0 | 0.0% |
| $35,000 to $49,999 | 0 | 0.0% |
| $50,000 to $74,999 | 5 | 22.7% |
| $75,000 to $99,999 | 7 | 31.8% |
| $100,000 to $149,999 | 6 | 27.3% |
| $150,000 to $199,999 | 0 | 0.0% |
| $200,000+ | 0 | 0.0% |
Household Income by Householder Age in Echo
| Income Bracket | # Households | Median Income |
| 15 to 24 Years | 0 (0.0%) | $0 |
| 25 to 44 Years | 4 (18.2%) | $0 |
| 45 to 64 Years | 11 (50.0%) | $0 |
| 65+ Years | 7 (31.8%) | $0 |
| Total | 22 (100.0%) | $90,714 |
Poverty in Echo
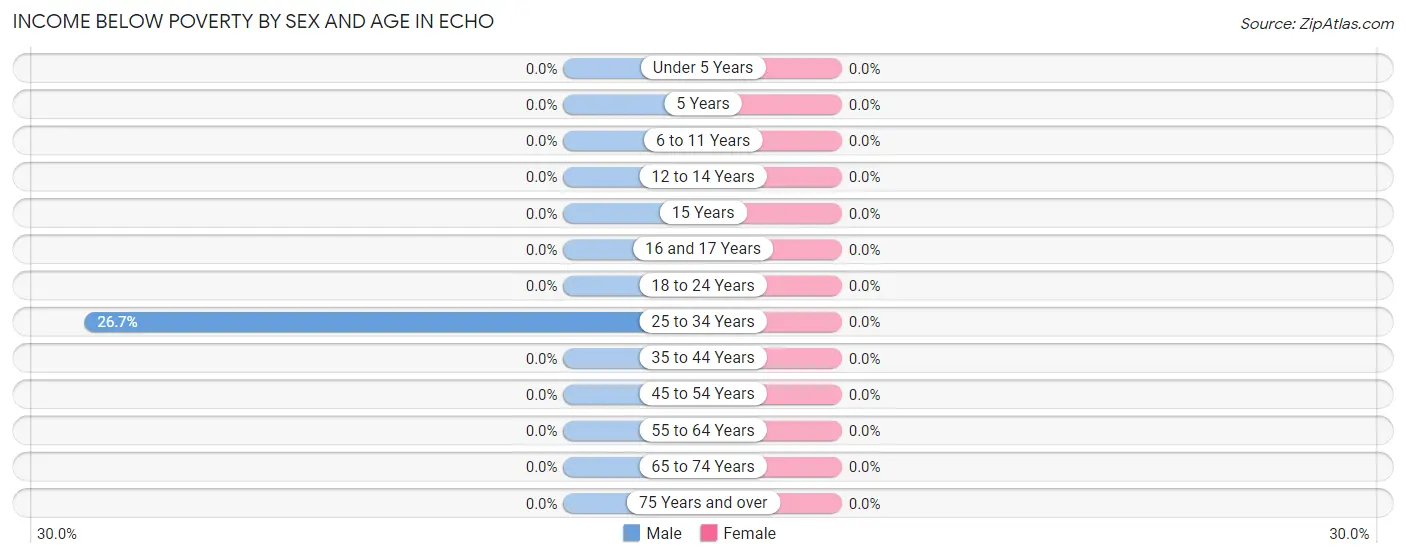
Income Below Poverty by Sex and Age in Echo
| Age Bracket | Male | Female |
| Under 5 Years | 0 (0.0%) | 0 (0.0%) |
| 5 Years | 0 (0.0%) | 0 (0.0%) |
| 6 to 11 Years | 0 (0.0%) | 0 (0.0%) |
| 12 to 14 Years | 0 (0.0%) | 0 (0.0%) |
| 15 Years | 0 (0.0%) | 0 (0.0%) |
| 16 and 17 Years | 0 (0.0%) | 0 (0.0%) |
| 18 to 24 Years | 0 (0.0%) | 0 (0.0%) |
| 25 to 34 Years | 4 (26.7%) | 0 (0.0%) |
| 35 to 44 Years | 0 (0.0%) | 0 (0.0%) |
| 45 to 54 Years | 0 (0.0%) | 0 (0.0%) |
| 55 to 64 Years | 0 (0.0%) | 0 (0.0%) |
| 65 to 74 Years | 0 (0.0%) | 0 (0.0%) |
| 75 Years and over | 0 (0.0%) | 0 (0.0%) |
| Total | 4 (8.5%) | 0 (0.0%) |
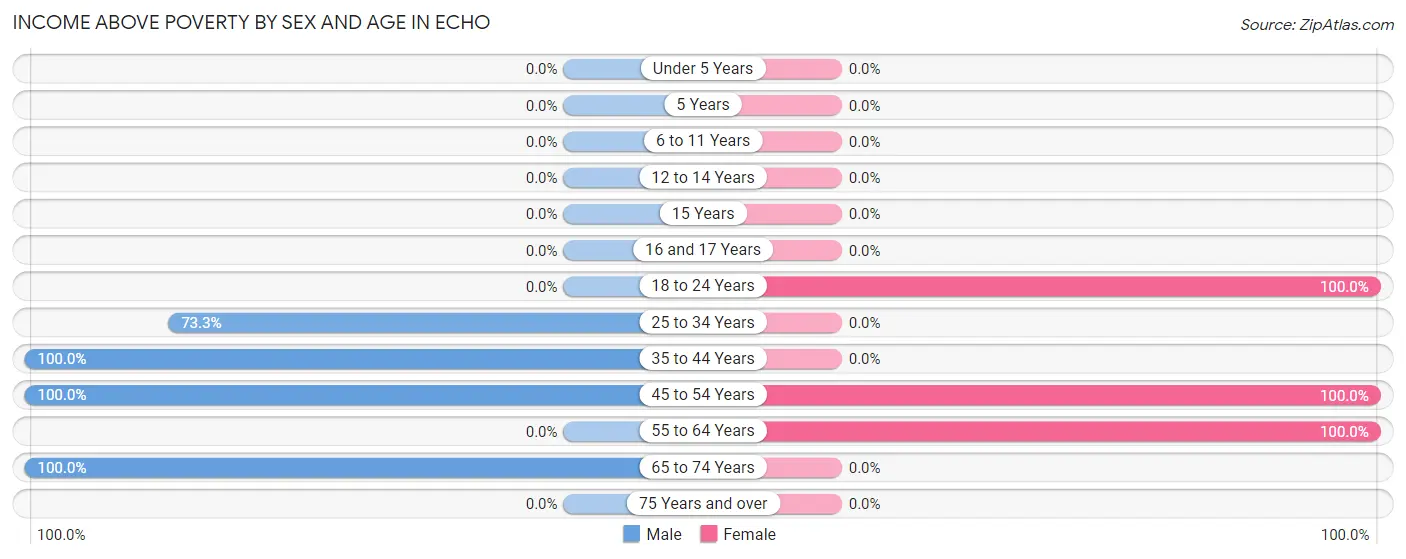
Income Above Poverty by Sex and Age in Echo
According to the poverty statistics in Echo, males aged 35 to 44 years and females aged 18 to 24 years are the age groups that are most secure financially, with 100.0% of males and 100.0% of females in these age groups living above the poverty line.
| Age Bracket | Male | Female |
| Under 5 Years | 0 (0.0%) | 0 (0.0%) |
| 5 Years | 0 (0.0%) | 0 (0.0%) |
| 6 to 11 Years | 0 (0.0%) | 0 (0.0%) |
| 12 to 14 Years | 0 (0.0%) | 0 (0.0%) |
| 15 Years | 0 (0.0%) | 0 (0.0%) |
| 16 and 17 Years | 0 (0.0%) | 0 (0.0%) |
| 18 to 24 Years | 0 (0.0%) | 18 (100.0%) |
| 25 to 34 Years | 11 (73.3%) | 0 (0.0%) |
| 35 to 44 Years | 15 (100.0%) | 0 (0.0%) |
| 45 to 54 Years | 6 (100.0%) | 6 (100.0%) |
| 55 to 64 Years | 0 (0.0%) | 8 (100.0%) |
| 65 to 74 Years | 11 (100.0%) | 0 (0.0%) |
| 75 Years and over | 0 (0.0%) | 0 (0.0%) |
| Total | 43 (91.5%) | 32 (100.0%) |
Income Below Poverty Among Married-Couple Families in Echo
| Children | Above Poverty | Below Poverty |
| No Children | 18 (100.0%) | 0 (0.0%) |
| 1 or 2 Children | 0 (0.0%) | 0 (0.0%) |
| 3 or 4 Children | 0 (0.0%) | 0 (0.0%) |
| 5 or more Children | 0 (0.0%) | 0 (0.0%) |
| Total | 18 (100.0%) | 0 (0.0%) |
Income Below Poverty Among Single-Parent Households in Echo
| Children | Single Father | Single Mother |
| No Children | 0 (0.0%) | 0 (0.0%) |
| 1 or 2 Children | 0 (0.0%) | 0 (0.0%) |
| 3 or 4 Children | 0 (0.0%) | 0 (0.0%) |
| 5 or more Children | 0 (0.0%) | 0 (0.0%) |
| Total | 0 (0.0%) | 0 (0.0%) |
Income Below Poverty Among Married-Couple vs Single-Parent Households in Echo
| Children | Married-Couple Families | Single-Parent Households |
| No Children | 0 (0.0%) | 0 (0.0%) |
| 1 or 2 Children | 0 (0.0%) | 0 (0.0%) |
| 3 or 4 Children | 0 (0.0%) | 0 (0.0%) |
| 5 or more Children | 0 (0.0%) | 0 (0.0%) |
| Total | 0 (0.0%) | 0 (0.0%) |
Race in Echo
The most populous races in Echo are White / Caucasian (53 | 67.1%), Hispanic or Latino (26 | 32.9%), and Two or more Races (23 | 29.1%).
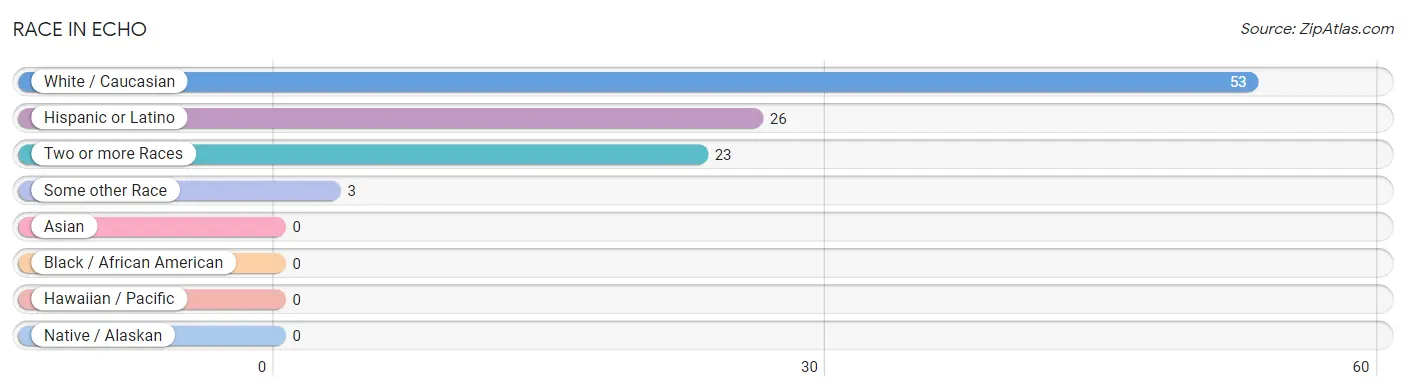
| Race | # Population | % Population |
| Asian | 0 | 0.0% |
| Black / African American | 0 | 0.0% |
| Hawaiian / Pacific | 0 | 0.0% |
| Hispanic or Latino | 26 | 32.9% |
| Native / Alaskan | 0 | 0.0% |
| White / Caucasian | 53 | 67.1% |
| Two or more Races | 23 | 29.1% |
| Some other Race | 3 | 3.8% |
| Total | 79 | 100.0% |
Ancestry in Echo
The most populous ancestries reported in Echo are English (6 | 7.6%), German (6 | 7.6%), Italian (6 | 7.6%), British (4 | 5.1%), and Scottish (4 | 5.1%), together accounting for 32.9% of all Echo residents.
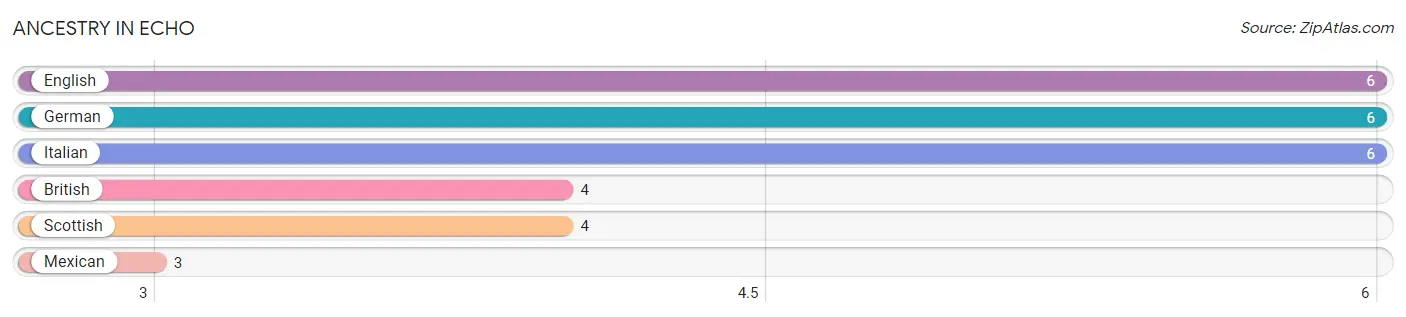
| Ancestry | # Population | % Population |
| British | 4 | 5.1% |
| English | 6 | 7.6% |
| German | 6 | 7.6% |
| Italian | 6 | 7.6% |
| Mexican | 3 | 3.8% |
| Scottish | 4 | 5.1% | View All 6 Rows |
Immigrants in Echo

| Immigration Origin | # Population | % Population | View All 0 Rows |
Sex and Age in Echo
Sex and Age in Echo
The most populous age groups in Echo are 40 to 44 Years (15 | 31.9%) for men and 20 to 24 Years (18 | 56.2%) for women.
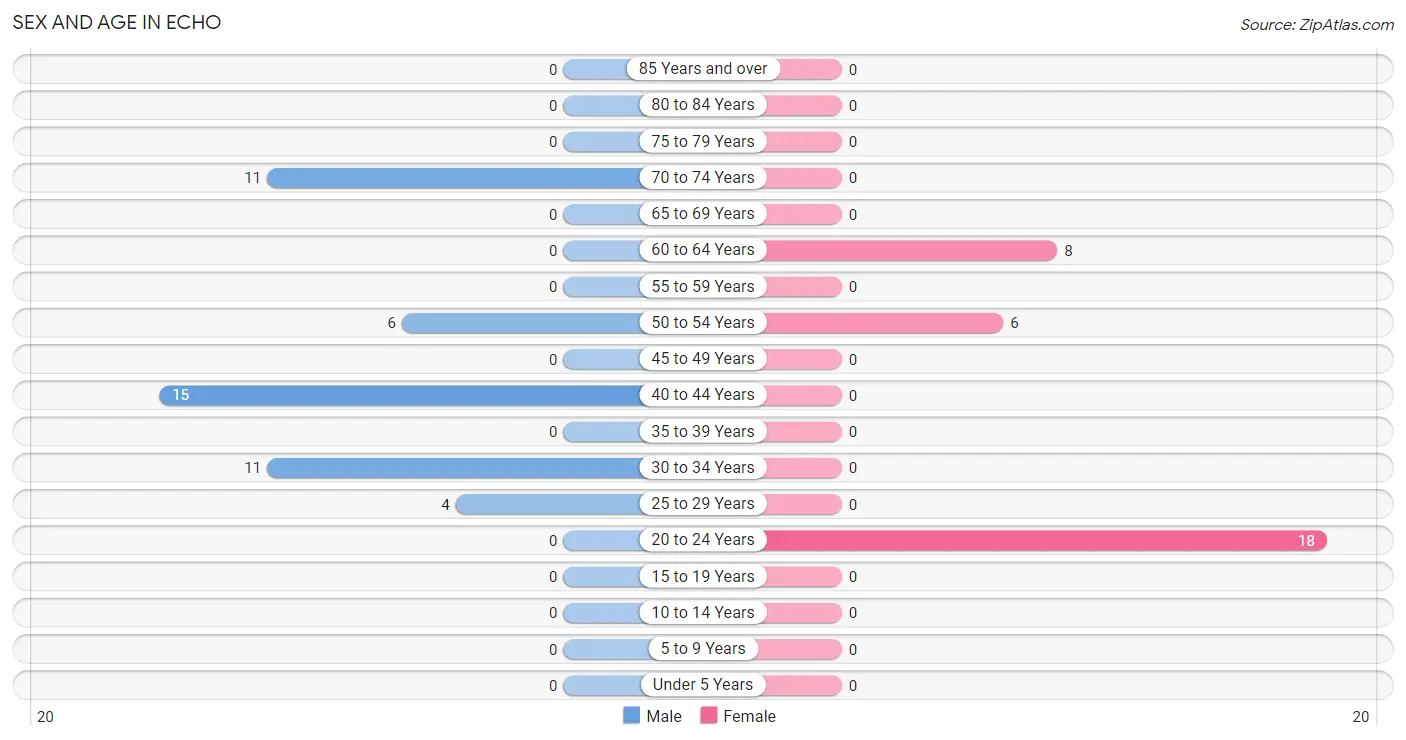
| Age Bracket | Male | Female |
| Under 5 Years | 0 (0.0%) | 0 (0.0%) |
| 5 to 9 Years | 0 (0.0%) | 0 (0.0%) |
| 10 to 14 Years | 0 (0.0%) | 0 (0.0%) |
| 15 to 19 Years | 0 (0.0%) | 0 (0.0%) |
| 20 to 24 Years | 0 (0.0%) | 18 (56.2%) |
| 25 to 29 Years | 4 (8.5%) | 0 (0.0%) |
| 30 to 34 Years | 11 (23.4%) | 0 (0.0%) |
| 35 to 39 Years | 0 (0.0%) | 0 (0.0%) |
| 40 to 44 Years | 15 (31.9%) | 0 (0.0%) |
| 45 to 49 Years | 0 (0.0%) | 0 (0.0%) |
| 50 to 54 Years | 6 (12.8%) | 6 (18.8%) |
| 55 to 59 Years | 0 (0.0%) | 0 (0.0%) |
| 60 to 64 Years | 0 (0.0%) | 8 (25.0%) |
| 65 to 69 Years | 0 (0.0%) | 0 (0.0%) |
| 70 to 74 Years | 11 (23.4%) | 0 (0.0%) |
| 75 to 79 Years | 0 (0.0%) | 0 (0.0%) |
| 80 to 84 Years | 0 (0.0%) | 0 (0.0%) |
| 85 Years and over | 0 (0.0%) | 0 (0.0%) |
| Total | 47 (100.0%) | 32 (100.0%) |
Families and Households in Echo
Median Family Size in Echo
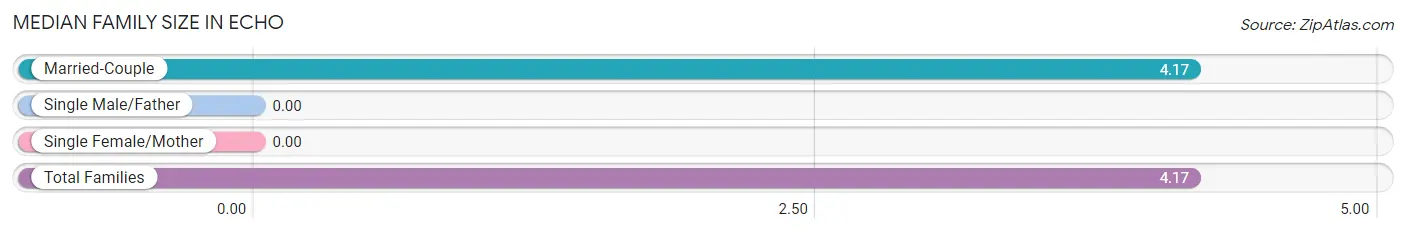
| Family Type | # Families | Family Size |
| Married-Couple | 18 (100.0%) | 4.17 |
| Single Male/Father | 0 (0.0%) | - |
| Single Female/Mother | 0 (0.0%) | - |
| Total Families | 18 (100.0%) | 4.17 |
Median Household Size in Echo
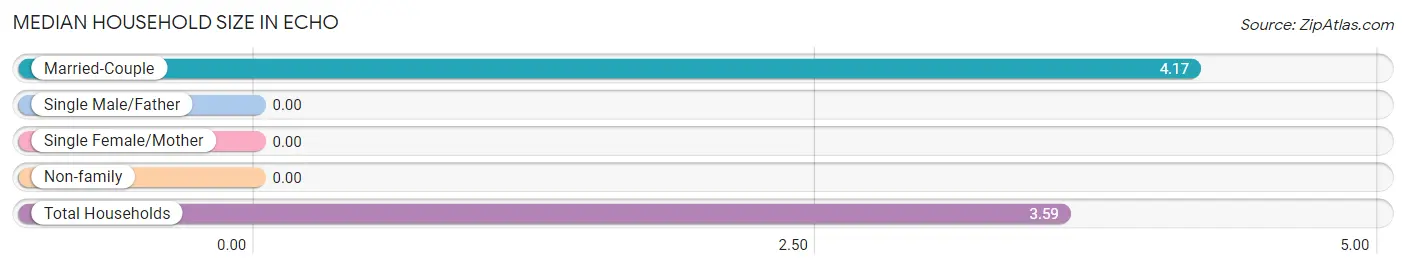
| Household Type | # Households | Household Size |
| Married-Couple | 18 (81.8%) | 4.17 |
| Single Male/Father | 0 (0.0%) | - |
| Single Female/Mother | 0 (0.0%) | - |
| Non-family | 4 (18.2%) | - |
| Total Households | 22 (100.0%) | 3.59 |
Household Size by Marriage Status in Echo
Out of a total of 22 households in Echo, 18 (81.8%) are family households, while 4 (18.2%) are nonfamily households. The most numerous type of family households are 4-person households, comprising 12, and the most common type of nonfamily households are 1-person households, comprising 4.
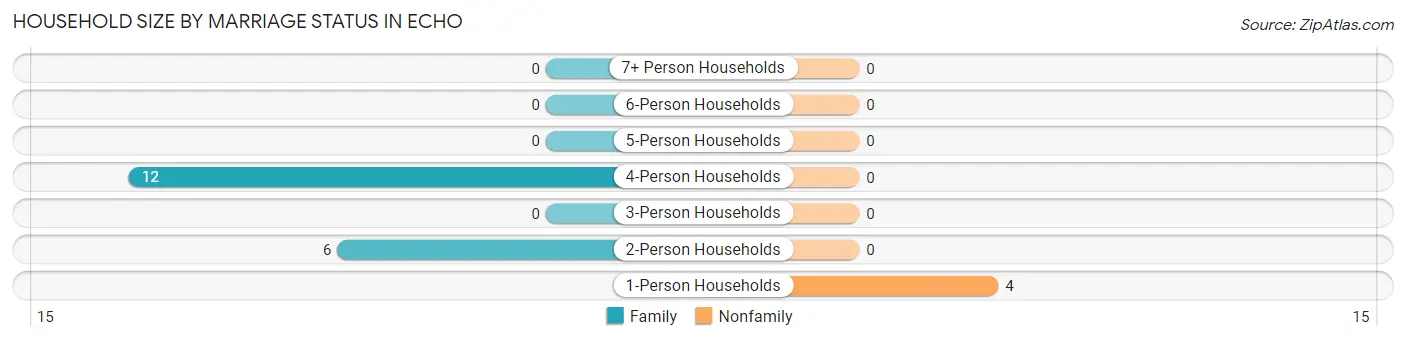
| Household Size | Family Households | Nonfamily Households |
| 1-Person Households | - | 4 (18.2%) |
| 2-Person Households | 6 (27.3%) | 0 (0.0%) |
| 3-Person Households | 0 (0.0%) | 0 (0.0%) |
| 4-Person Households | 12 (54.5%) | 0 (0.0%) |
| 5-Person Households | 0 (0.0%) | 0 (0.0%) |
| 6-Person Households | 0 (0.0%) | 0 (0.0%) |
| 7+ Person Households | 0 (0.0%) | 0 (0.0%) |
| Total | 18 (81.8%) | 4 (18.2%) |
Female Fertility in Echo
Fertility by Age in Echo
| Age Bracket | Women with Births | Births / 1,000 Women |
| 15 to 19 years | 0 (0.0%) | 0.0 |
| 20 to 34 years | 0 (0.0%) | 0.0 |
| 35 to 50 years | 0 (0.0%) | 0.0 |
| Total | 0 (0.0%) | 0.0 |
Fertility by Age by Marriage Status in Echo
| Age Bracket | Married | Unmarried |
| 15 to 19 years | 0 (0.0%) | 0 (0.0%) |
| 20 to 34 years | 0 (0.0%) | 0 (0.0%) |
| 35 to 50 years | 0 (0.0%) | 0 (0.0%) |
| Total | 0 (0.0%) | 0 (0.0%) |
Fertility by Education in Echo
| Educational Attainment | Women with Births | Births / 1,000 Women |
| Less than High School | 0 (0.0%) | 0.0 |
| High School Diploma | 0 (0.0%) | 0.0 |
| College or Associate's Degree | 0 (0.0%) | 0.0 |
| Bachelor's Degree | 0 (0.0%) | 0.0 |
| Graduate Degree | 0 (0.0%) | 0.0 |
| Total | 0 (0.0%) | 0.0 |
Fertility by Education by Marriage Status in Echo
| Educational Attainment | Married | Unmarried |
| Less than High School | 0 (0.0%) | 0 (0.0%) |
| High School Diploma | 0 (0.0%) | 0 (0.0%) |
| College or Associate's Degree | 0 (0.0%) | 0 (0.0%) |
| Bachelor's Degree | 0 (0.0%) | 0 (0.0%) |
| Graduate Degree | 0 (0.0%) | 0 (0.0%) |
| Total | 0 (0.0%) | 0 (0.0%) |
Employment Characteristics in Echo
Employment by Class of Employer in Echo
Among the 39 employed individuals in Echo, private company employees (21 | 53.8%), federal government employees (8 | 20.5%), and not-for-profit organizations (6 | 15.4%) make up the most common classes of employment.
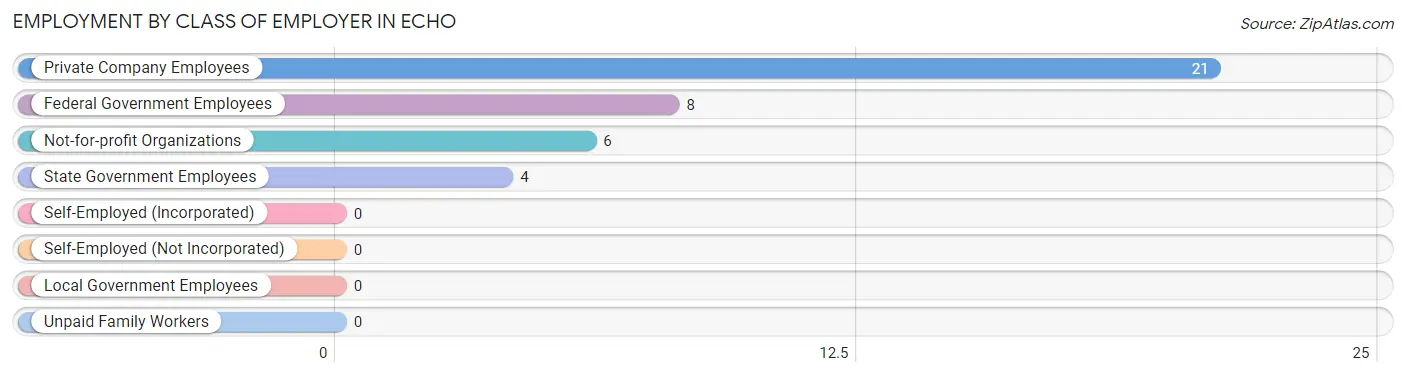
| Employer Class | # Employees | % Employees |
| Private Company Employees | 21 | 53.8% |
| Self-Employed (Incorporated) | 0 | 0.0% |
| Self-Employed (Not Incorporated) | 0 | 0.0% |
| Not-for-profit Organizations | 6 | 15.4% |
| Local Government Employees | 0 | 0.0% |
| State Government Employees | 4 | 10.3% |
| Federal Government Employees | 8 | 20.5% |
| Unpaid Family Workers | 0 | 0.0% |
| Total | 39 | 100.0% |
Employment Status by Age in Echo
According to the labor force statistics for Echo, out of the total population over 16 years of age (79), 68.4% or 54 individuals are in the labor force, with 27.8% or 15 of them unemployed. The age group with the highest labor force participation rate is 25 to 29 years, with 100.0% or 4 individuals in the labor force. Within the labor force, the 35 to 44 years age range has the highest percentage of unemployed individuals, with 100.0% or 15 of them being unemployed.
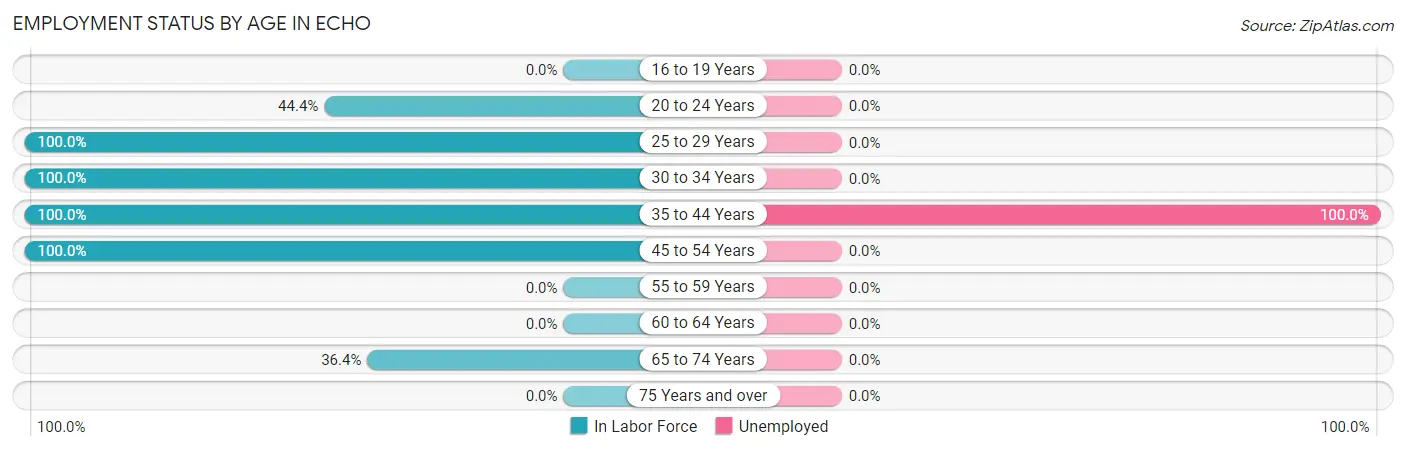
| Age Bracket | In Labor Force | Unemployed |
| 16 to 19 Years | 0 (0.0%) | 0 (0.0%) |
| 20 to 24 Years | 8 (44.4%) | 0 (0.0%) |
| 25 to 29 Years | 4 (100.0%) | 0 (0.0%) |
| 30 to 34 Years | 11 (100.0%) | 0 (0.0%) |
| 35 to 44 Years | 15 (100.0%) | 15 (100.0%) |
| 45 to 54 Years | 12 (100.0%) | 0 (0.0%) |
| 55 to 59 Years | 0 (0.0%) | 0 (0.0%) |
| 60 to 64 Years | 0 (0.0%) | 0 (0.0%) |
| 65 to 74 Years | 4 (36.4%) | 0 (0.0%) |
| 75 Years and over | 0 (0.0%) | 0 (0.0%) |
| Total | 54 (68.4%) | 15 (27.8%) |
Employment Status by Educational Attainment in Echo
According to labor force statistics for Echo, 84.0% of individuals (42) out of the total population between 25 and 64 years of age (50) are in the labor force, with 35.7% or 15 of them being unemployed. The group with the highest labor force participation rate are those with the educational attainment of college / associate degree, with 100.0% or 10 individuals in the labor force. Within the labor force, individuals with high school diploma education have the highest percentage of unemployment, with 46.9% or 15 of them being unemployed.
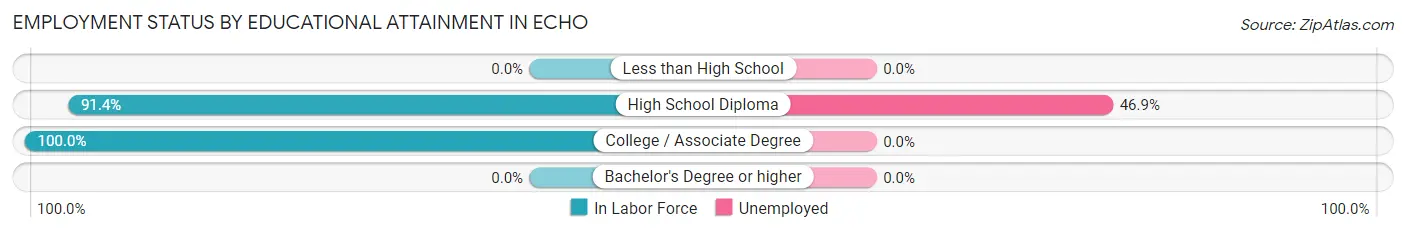
| Educational Attainment | In Labor Force | Unemployed |
| Less than High School | 0 (0.0%) | 0 (0.0%) |
| High School Diploma | 32 (91.4%) | 16 (46.9%) |
| College / Associate Degree | 10 (100.0%) | 0 (0.0%) |
| Bachelor's Degree or higher | 0 (0.0%) | 0 (0.0%) |
| Total | 42 (84.0%) | 18 (35.7%) |
Employment Occupations by Sex in Echo
Management, Business, Science and Arts Occupations
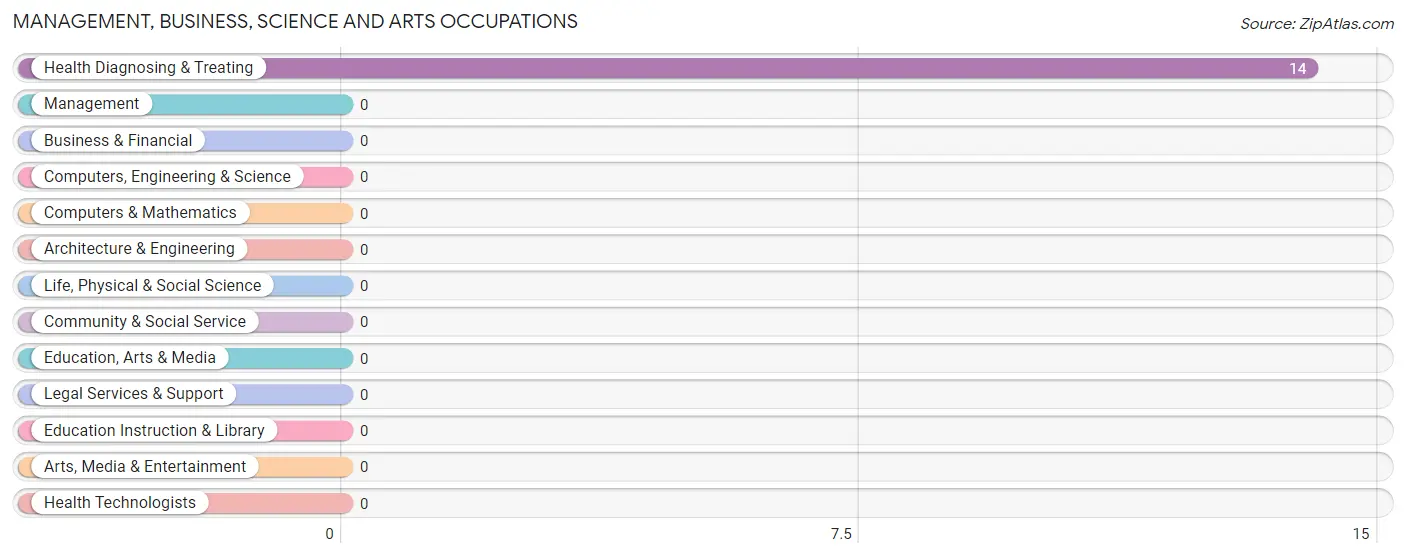
The most common Management, Business, Science and Arts occupations in Echo are , and Health Diagnosing & Treating (14 | 35.9%).
Management, Business, Science and Arts Occupations by Sex
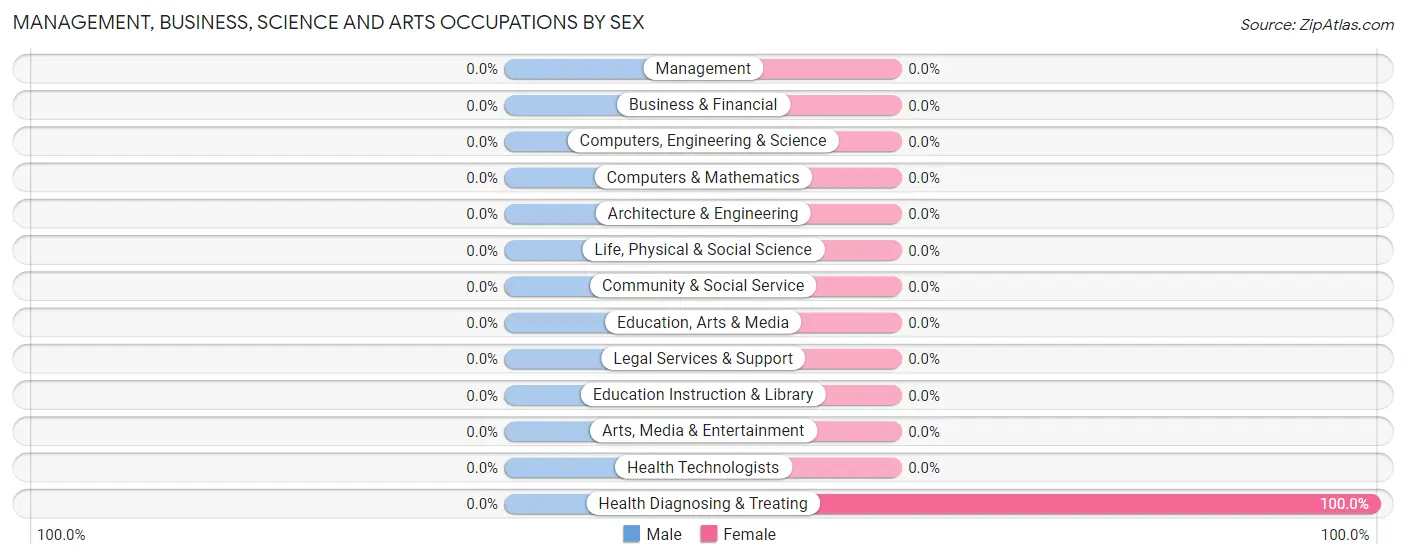
| Occupation | Male | Female |
| Management | 0 (0.0%) | 0 (0.0%) |
| Business & Financial | 0 (0.0%) | 0 (0.0%) |
| Computers, Engineering & Science | 0 (0.0%) | 0 (0.0%) |
| Computers & Mathematics | 0 (0.0%) | 0 (0.0%) |
| Architecture & Engineering | 0 (0.0%) | 0 (0.0%) |
| Life, Physical & Social Science | 0 (0.0%) | 0 (0.0%) |
| Community & Social Service | 0 (0.0%) | 0 (0.0%) |
| Education, Arts & Media | 0 (0.0%) | 0 (0.0%) |
| Legal Services & Support | 0 (0.0%) | 0 (0.0%) |
| Education Instruction & Library | 0 (0.0%) | 0 (0.0%) |
| Arts, Media & Entertainment | 0 (0.0%) | 0 (0.0%) |
| Health Diagnosing & Treating | 0 (0.0%) | 14 (100.0%) |
| Health Technologists | 0 (0.0%) | 0 (0.0%) |
| Total (Category) | 0 (0.0%) | 14 (100.0%) |
| Total (Overall) | 25 (64.1%) | 14 (35.9%) |
Services Occupations
The most common Services occupations in Echo are , and Cleaning & Maintenance (19 | 48.7%).
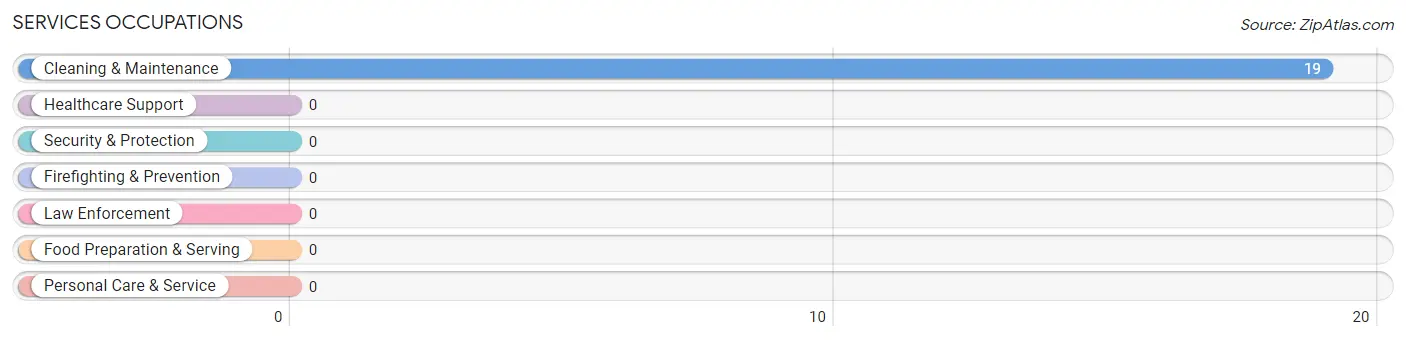
Services Occupations by Sex
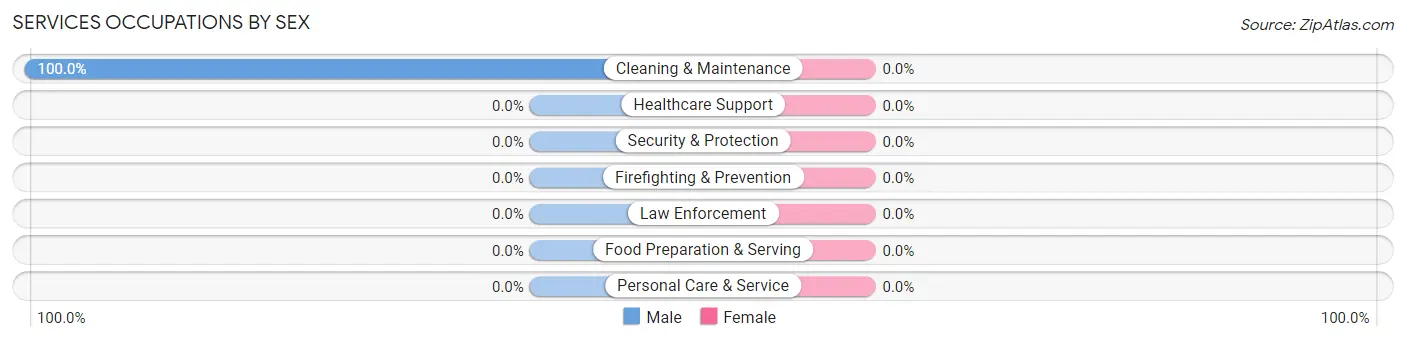
| Occupation | Male | Female |
| Healthcare Support | 0 (0.0%) | 0 (0.0%) |
| Security & Protection | 0 (0.0%) | 0 (0.0%) |
| Firefighting & Prevention | 0 (0.0%) | 0 (0.0%) |
| Law Enforcement | 0 (0.0%) | 0 (0.0%) |
| Food Preparation & Serving | 0 (0.0%) | 0 (0.0%) |
| Cleaning & Maintenance | 19 (100.0%) | 0 (0.0%) |
| Personal Care & Service | 0 (0.0%) | 0 (0.0%) |
| Total (Category) | 19 (100.0%) | 0 (0.0%) |
| Total (Overall) | 25 (64.1%) | 14 (35.9%) |
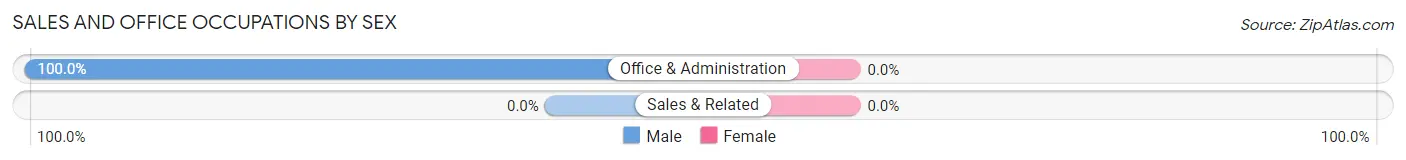
Sales and Office Occupations
The most common Sales and Office occupations in Echo are , and Office & Administration (6 | 15.4%).
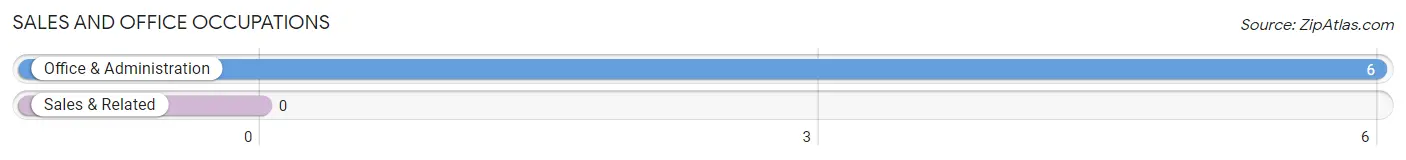
Sales and Office Occupations by Sex
| Occupation | Male | Female |
| Sales & Related | 0 (0.0%) | 0 (0.0%) |
| Office & Administration | 6 (100.0%) | 0 (0.0%) |
| Total (Category) | 6 (100.0%) | 0 (0.0%) |
| Total (Overall) | 25 (64.1%) | 14 (35.9%) |
Natural Resources, Construction and Maintenance Occupations
Natural Resources, Construction and Maintenance Occupations by Sex
| Occupation | Male | Female |
| Farming, Fishing & Forestry | 0 (0.0%) | 0 (0.0%) |
| Construction & Extraction | 0 (0.0%) | 0 (0.0%) |
| Installation, Maintenance & Repair | 0 (0.0%) | 0 (0.0%) |
| Total (Category) | 0 (0.0%) | 0 (0.0%) |
| Total (Overall) | 25 (64.1%) | 14 (35.9%) |
Production, Transportation and Moving Occupations
Production, Transportation and Moving Occupations by Sex
| Occupation | Male | Female |
| Production | 0 (0.0%) | 0 (0.0%) |
| Transportation | 0 (0.0%) | 0 (0.0%) |
| Material Moving | 0 (0.0%) | 0 (0.0%) |
| Total (Category) | 0 (0.0%) | 0 (0.0%) |
| Total (Overall) | 25 (64.1%) | 14 (35.9%) |
Employment Industries by Sex in Echo
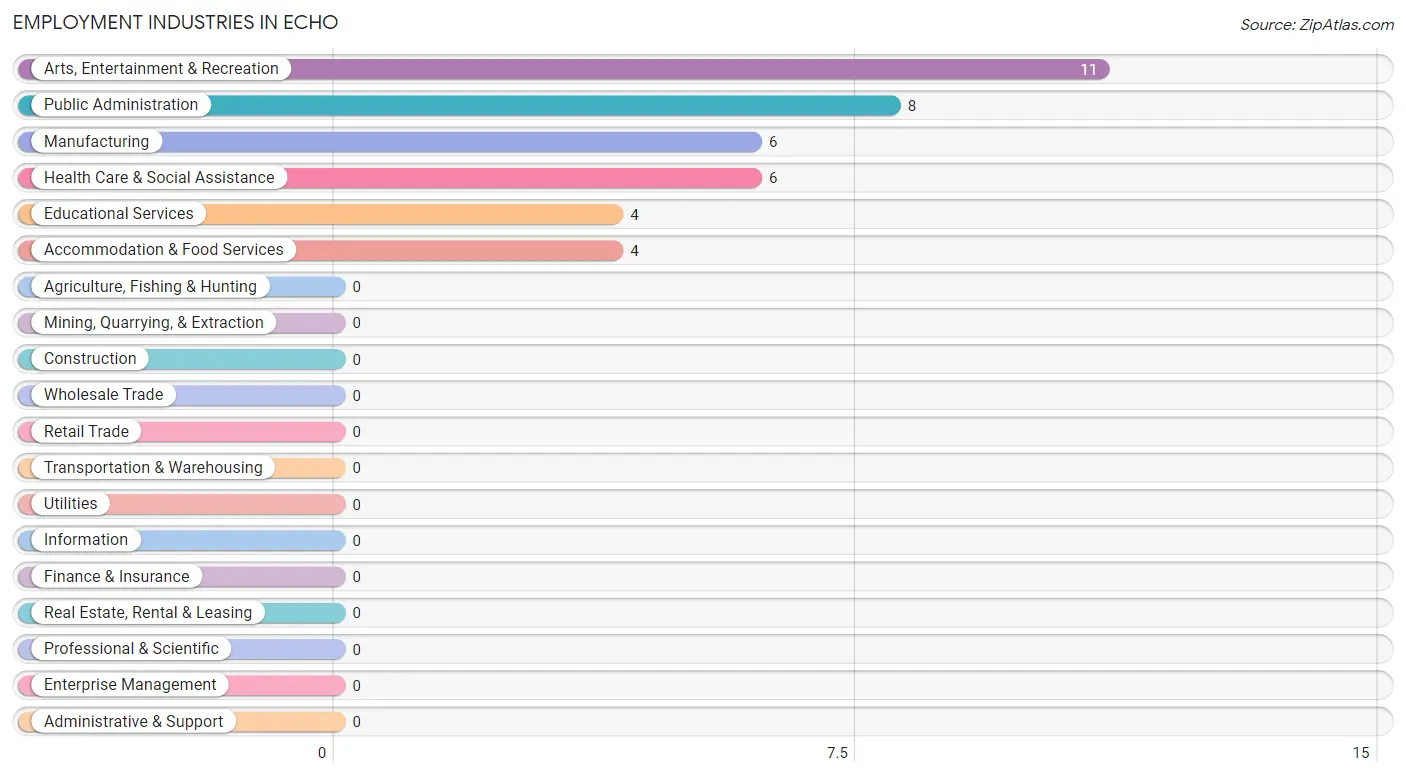
Employment Industries in Echo
The major employment industries in Echo include Arts, Entertainment & Recreation (11 | 28.2%), Public Administration (8 | 20.5%), Manufacturing (6 | 15.4%), Health Care & Social Assistance (6 | 15.4%), and Educational Services (4 | 10.3%).
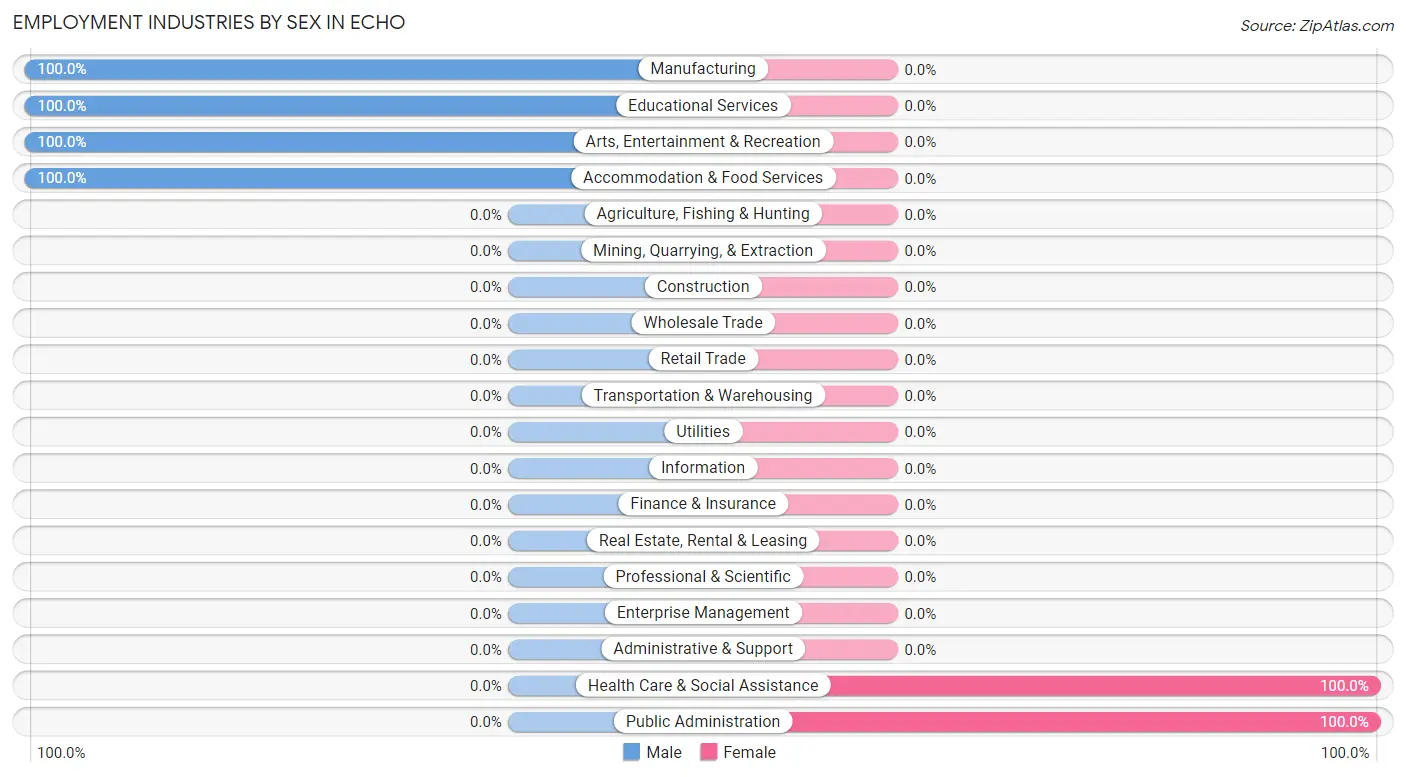
Employment Industries by Sex in Echo
The Echo industries that see more men than women are Manufacturing (100.0%), Educational Services (100.0%), and Arts, Entertainment & Recreation (100.0%), whereas the industries that tend to have a higher number of women are Health Care & Social Assistance (100.0%), and Public Administration (100.0%).
| Industry | Male | Female |
| Agriculture, Fishing & Hunting | 0 (0.0%) | 0 (0.0%) |
| Mining, Quarrying, & Extraction | 0 (0.0%) | 0 (0.0%) |
| Construction | 0 (0.0%) | 0 (0.0%) |
| Manufacturing | 6 (100.0%) | 0 (0.0%) |
| Wholesale Trade | 0 (0.0%) | 0 (0.0%) |
| Retail Trade | 0 (0.0%) | 0 (0.0%) |
| Transportation & Warehousing | 0 (0.0%) | 0 (0.0%) |
| Utilities | 0 (0.0%) | 0 (0.0%) |
| Information | 0 (0.0%) | 0 (0.0%) |
| Finance & Insurance | 0 (0.0%) | 0 (0.0%) |
| Real Estate, Rental & Leasing | 0 (0.0%) | 0 (0.0%) |
| Professional & Scientific | 0 (0.0%) | 0 (0.0%) |
| Enterprise Management | 0 (0.0%) | 0 (0.0%) |
| Administrative & Support | 0 (0.0%) | 0 (0.0%) |
| Educational Services | 4 (100.0%) | 0 (0.0%) |
| Health Care & Social Assistance | 0 (0.0%) | 6 (100.0%) |
| Arts, Entertainment & Recreation | 11 (100.0%) | 0 (0.0%) |
| Accommodation & Food Services | 4 (100.0%) | 0 (0.0%) |
| Public Administration | 0 (0.0%) | 8 (100.0%) |
| Total | 25 (64.1%) | 14 (35.9%) |
Education in Echo
School Enrollment in Echo
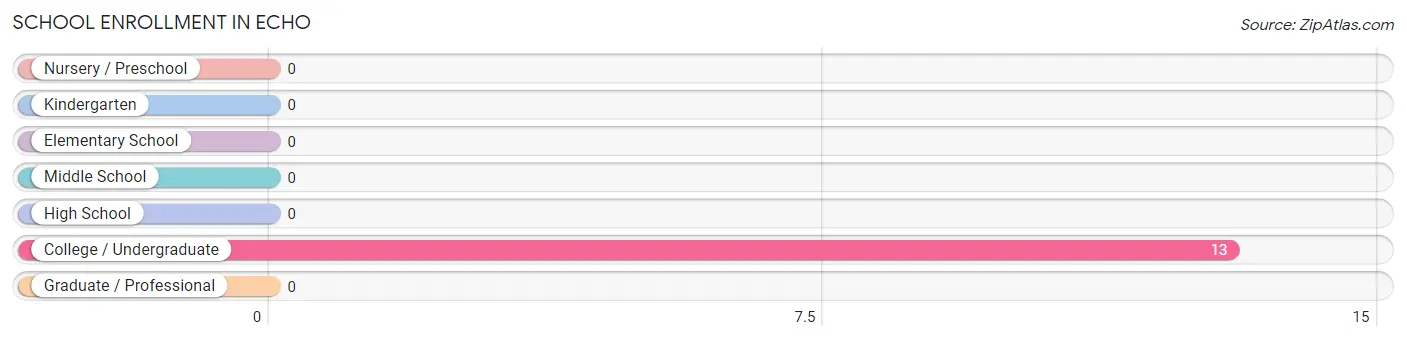
| School Level | # Students | % Students |
| Nursery / Preschool | 0 | 0.0% |
| Kindergarten | 0 | 0.0% |
| Elementary School | 0 | 0.0% |
| Middle School | 0 | 0.0% |
| High School | 0 | 0.0% |
| College / Undergraduate | 13 | 100.0% |
| Graduate / Professional | 0 | 0.0% |
| Total | 13 | 100.0% |
School Enrollment by Age by Funding Source in Echo
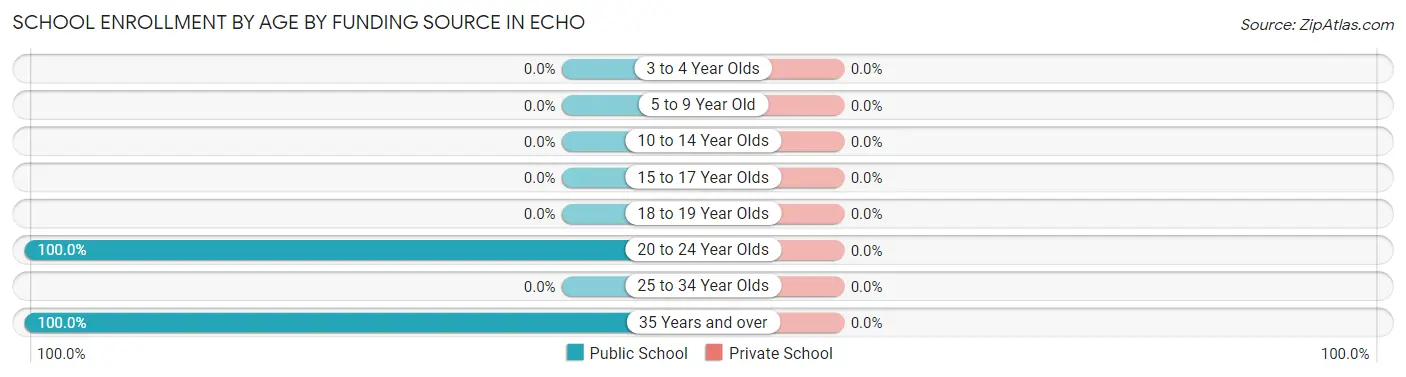
| Age Bracket | Public School | Private School |
| 3 to 4 Year Olds | 0 (0.0%) | 0 (0.0%) |
| 5 to 9 Year Old | 0 (0.0%) | 0 (0.0%) |
| 10 to 14 Year Olds | 0 (0.0%) | 0 (0.0%) |
| 15 to 17 Year Olds | 0 (0.0%) | 0 (0.0%) |
| 18 to 19 Year Olds | 0 (0.0%) | 0 (0.0%) |
| 20 to 24 Year Olds | 8 (100.0%) | 0 (0.0%) |
| 25 to 34 Year Olds | 0 (0.0%) | 0 (0.0%) |
| 35 Years and over | 5 (100.0%) | 0 (0.0%) |
| Total | 13 (100.0%) | 0 (0.0%) |
Educational Attainment by Field of Study in Echo
, and science & technology (5 | 100.0%) are the most common fields of study among 5 individuals in Echo who have obtained a bachelor's degree or higher.
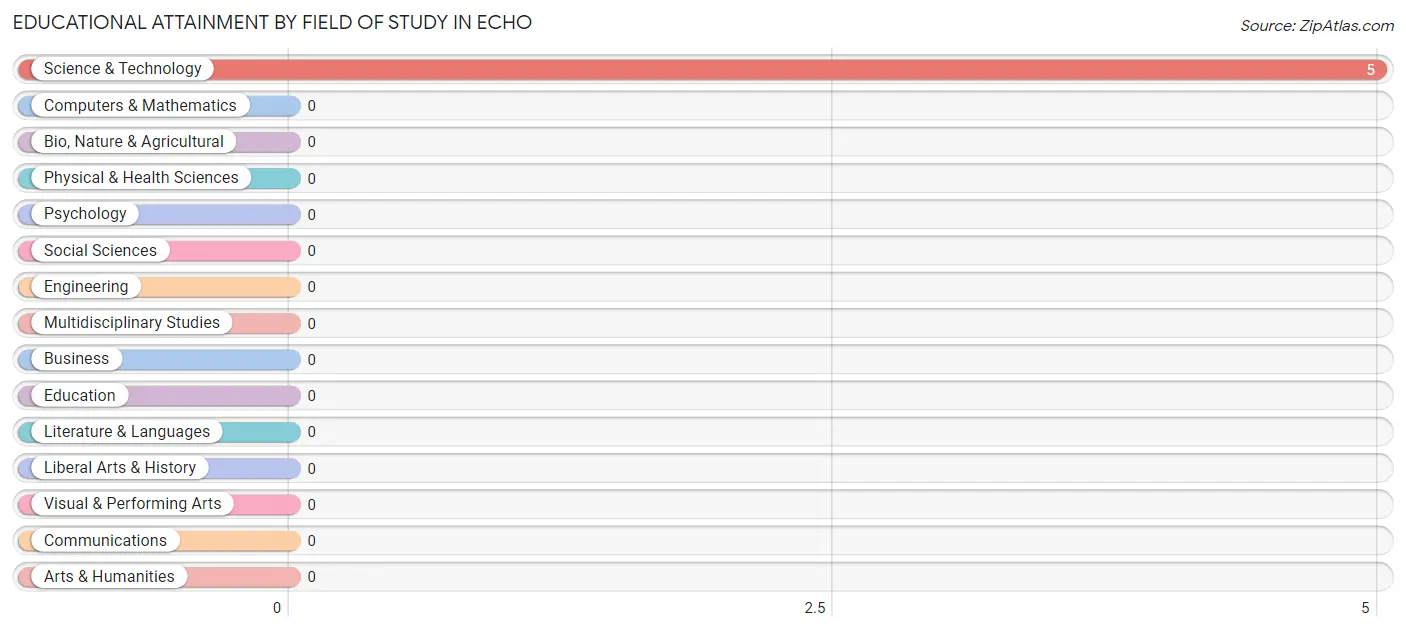
| Field of Study | # Graduates | % Graduates |
| Computers & Mathematics | 0 | 0.0% |
| Bio, Nature & Agricultural | 0 | 0.0% |
| Physical & Health Sciences | 0 | 0.0% |
| Psychology | 0 | 0.0% |
| Social Sciences | 0 | 0.0% |
| Engineering | 0 | 0.0% |
| Multidisciplinary Studies | 0 | 0.0% |
| Science & Technology | 5 | 100.0% |
| Business | 0 | 0.0% |
| Education | 0 | 0.0% |
| Literature & Languages | 0 | 0.0% |
| Liberal Arts & History | 0 | 0.0% |
| Visual & Performing Arts | 0 | 0.0% |
| Communications | 0 | 0.0% |
| Arts & Humanities | 0 | 0.0% |
| Total | 5 | 100.0% |
Transportation & Commute in Echo
Vehicle Availability by Sex in Echo
The most prevalent vehicle ownership categories in Echo are males with 5 or more vehicles (15, accounting for 60.0%) and females with 5 or more vehicles (0, making up 107.1%).
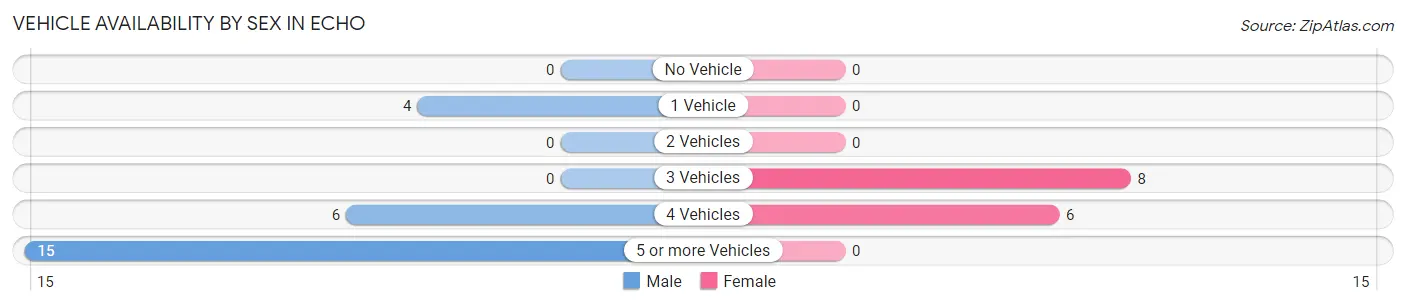
| Vehicles Available | Male | Female |
| No Vehicle | 0 (0.0%) | 0 (0.0%) |
| 1 Vehicle | 4 (16.0%) | 0 (0.0%) |
| 2 Vehicles | 0 (0.0%) | 0 (0.0%) |
| 3 Vehicles | 0 (0.0%) | 8 (57.1%) |
| 4 Vehicles | 6 (24.0%) | 6 (42.9%) |
| 5 or more Vehicles | 15 (60.0%) | 0 (0.0%) |
| Total | 25 (100.0%) | 14 (100.0%) |
Commute Time in Echo
The most frequently occuring commute durations in Echo are 15 to 19 minutes (12 commuters, 30.8%), 25 to 29 minutes (11 commuters, 28.2%), and 5 to 9 minutes (6 commuters, 15.4%).
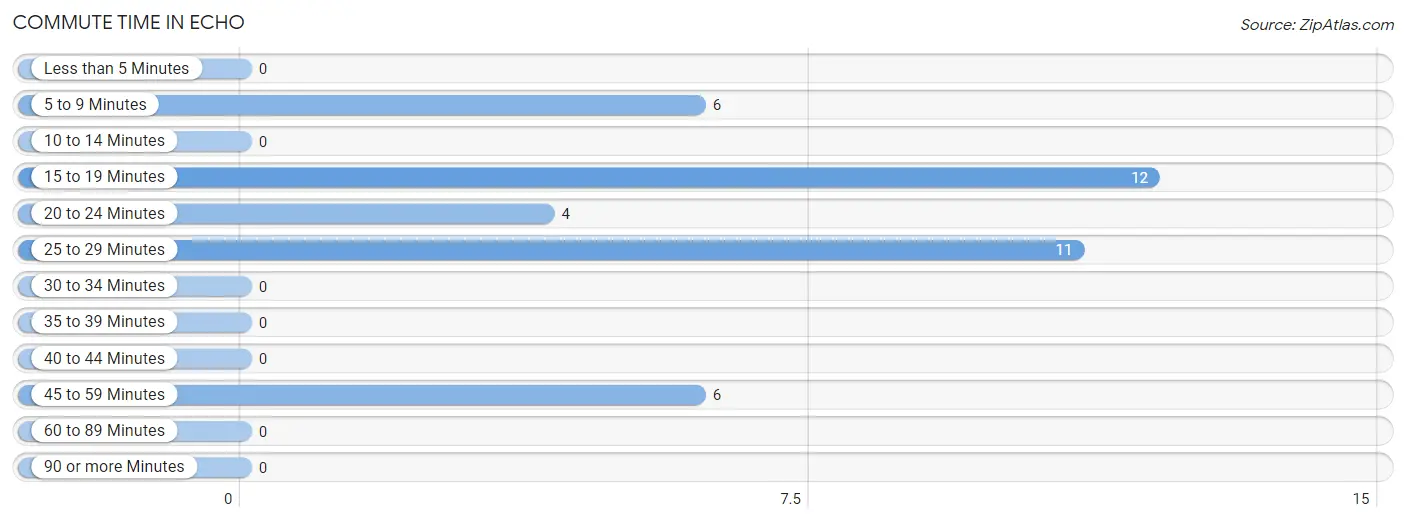
| Commute Time | # Commuters | % Commuters |
| Less than 5 Minutes | 0 | 0.0% |
| 5 to 9 Minutes | 6 | 15.4% |
| 10 to 14 Minutes | 0 | 0.0% |
| 15 to 19 Minutes | 12 | 30.8% |
| 20 to 24 Minutes | 4 | 10.3% |
| 25 to 29 Minutes | 11 | 28.2% |
| 30 to 34 Minutes | 0 | 0.0% |
| 35 to 39 Minutes | 0 | 0.0% |
| 40 to 44 Minutes | 0 | 0.0% |
| 45 to 59 Minutes | 6 | 15.4% |
| 60 to 89 Minutes | 0 | 0.0% |
| 90 or more Minutes | 0 | 0.0% |
Commute Time by Sex in Echo
The most common commute times in Echo are 25 to 29 minutes (11 commuters, 44.0%) for males and 15 to 19 minutes (8 commuters, 57.1%) for females.
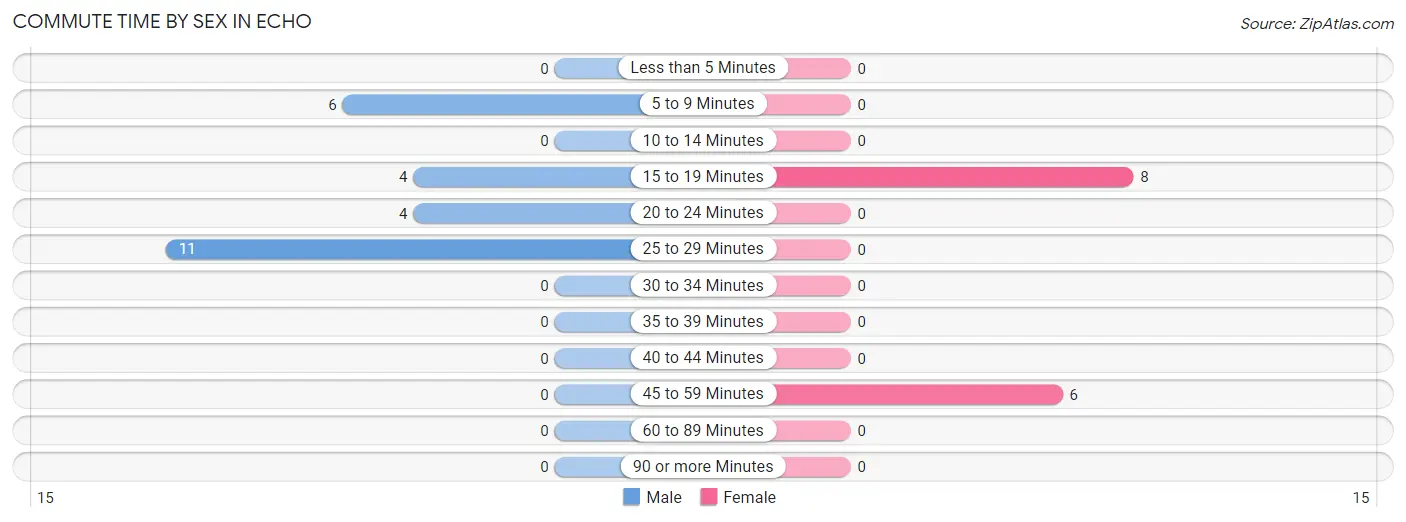
| Commute Time | Male | Female |
| Less than 5 Minutes | 0 (0.0%) | 0 (0.0%) |
| 5 to 9 Minutes | 6 (24.0%) | 0 (0.0%) |
| 10 to 14 Minutes | 0 (0.0%) | 0 (0.0%) |
| 15 to 19 Minutes | 4 (16.0%) | 8 (57.1%) |
| 20 to 24 Minutes | 4 (16.0%) | 0 (0.0%) |
| 25 to 29 Minutes | 11 (44.0%) | 0 (0.0%) |
| 30 to 34 Minutes | 0 (0.0%) | 0 (0.0%) |
| 35 to 39 Minutes | 0 (0.0%) | 0 (0.0%) |
| 40 to 44 Minutes | 0 (0.0%) | 0 (0.0%) |
| 45 to 59 Minutes | 0 (0.0%) | 6 (42.9%) |
| 60 to 89 Minutes | 0 (0.0%) | 0 (0.0%) |
| 90 or more Minutes | 0 (0.0%) | 0 (0.0%) |
Time of Departure to Work by Sex in Echo
The most frequent times of departure to work in Echo are 7:30 AM to 7:59 AM (19, 76.0%) for males and 6:30 AM to 6:59 AM (8, 57.1%) for females.
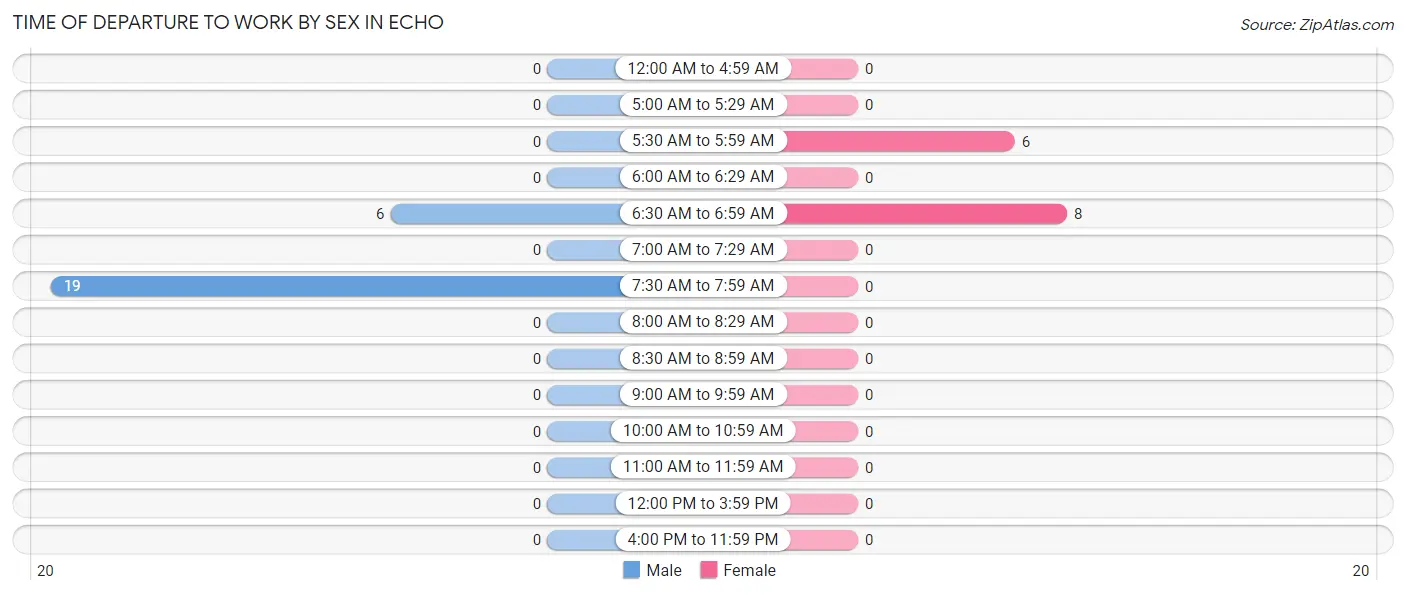
| Time of Departure | Male | Female |
| 12:00 AM to 4:59 AM | 0 (0.0%) | 0 (0.0%) |
| 5:00 AM to 5:29 AM | 0 (0.0%) | 0 (0.0%) |
| 5:30 AM to 5:59 AM | 0 (0.0%) | 6 (42.9%) |
| 6:00 AM to 6:29 AM | 0 (0.0%) | 0 (0.0%) |
| 6:30 AM to 6:59 AM | 6 (24.0%) | 8 (57.1%) |
| 7:00 AM to 7:29 AM | 0 (0.0%) | 0 (0.0%) |
| 7:30 AM to 7:59 AM | 19 (76.0%) | 0 (0.0%) |
| 8:00 AM to 8:29 AM | 0 (0.0%) | 0 (0.0%) |
| 8:30 AM to 8:59 AM | 0 (0.0%) | 0 (0.0%) |
| 9:00 AM to 9:59 AM | 0 (0.0%) | 0 (0.0%) |
| 10:00 AM to 10:59 AM | 0 (0.0%) | 0 (0.0%) |
| 11:00 AM to 11:59 AM | 0 (0.0%) | 0 (0.0%) |
| 12:00 PM to 3:59 PM | 0 (0.0%) | 0 (0.0%) |
| 4:00 PM to 11:59 PM | 0 (0.0%) | 0 (0.0%) |
| Total | 25 (100.0%) | 14 (100.0%) |
Housing Occupancy in Echo
Occupancy by Ownership in Echo
Of the total 22 dwellings in Echo, owner-occupied units account for 18 (81.8%), while renter-occupied units make up 4 (18.2%).
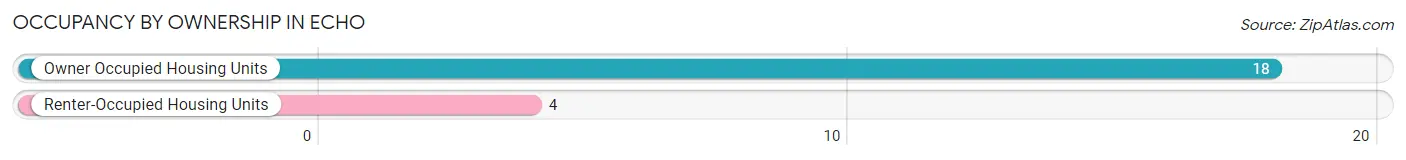
| Occupancy | # Housing Units | % Housing Units |
| Owner Occupied Housing Units | 18 | 81.8% |
| Renter-Occupied Housing Units | 4 | 18.2% |
| Total Occupied Housing Units | 22 | 100.0% |
Occupancy by Household Size in Echo
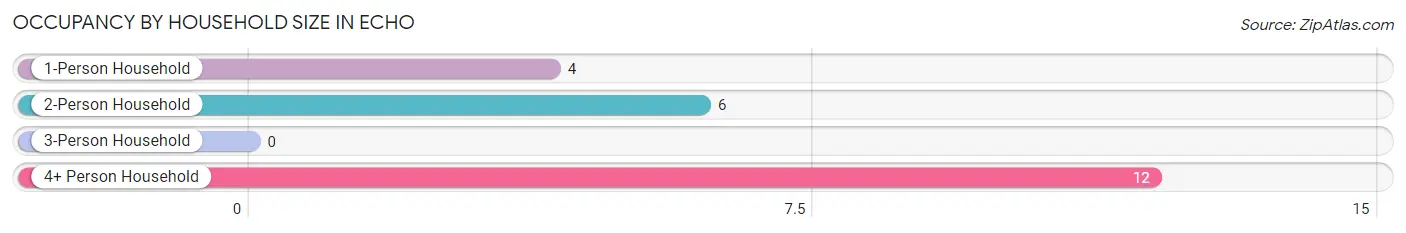
| Household Size | # Housing Units | % Housing Units |
| 1-Person Household | 4 | 18.2% |
| 2-Person Household | 6 | 27.3% |
| 3-Person Household | 0 | 0.0% |
| 4+ Person Household | 12 | 54.5% |
| Total Housing Units | 22 | 100.0% |
Occupancy by Ownership by Household Size in Echo
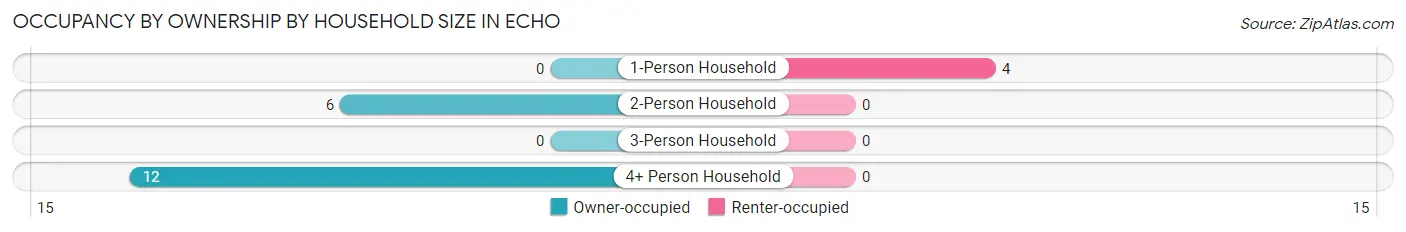
| Household Size | Owner-occupied | Renter-occupied |
| 1-Person Household | 0 (0.0%) | 4 (100.0%) |
| 2-Person Household | 6 (100.0%) | 0 (0.0%) |
| 3-Person Household | 0 (0.0%) | 0 (0.0%) |
| 4+ Person Household | 12 (100.0%) | 0 (0.0%) |
| Total Housing Units | 18 (81.8%) | 4 (18.2%) |
Occupancy by Educational Attainment in Echo
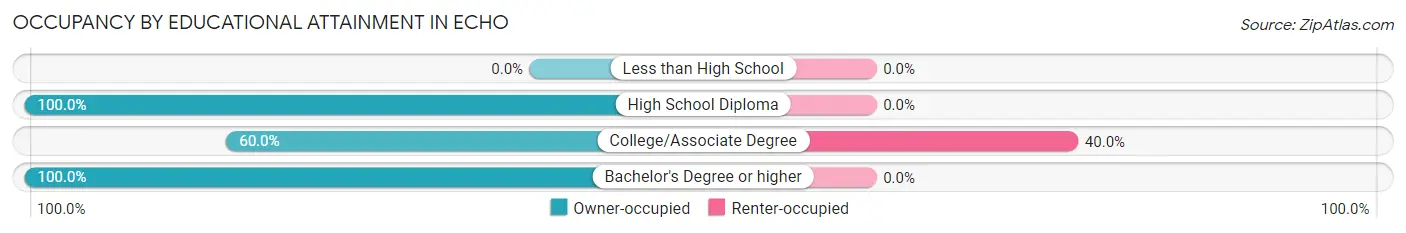
| Household Size | Owner-occupied | Renter-occupied |
| Less than High School | 0 (0.0%) | 0 (0.0%) |
| High School Diploma | 7 (100.0%) | 0 (0.0%) |
| College/Associate Degree | 6 (60.0%) | 4 (40.0%) |
| Bachelor's Degree or higher | 5 (100.0%) | 0 (0.0%) |
Occupancy by Age of Householder in Echo
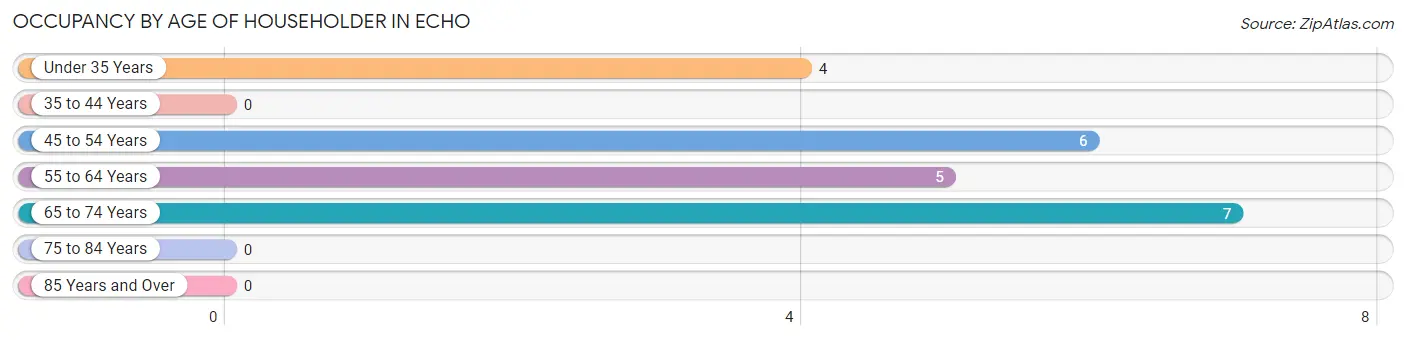
| Age Bracket | # Households | % Households |
| Under 35 Years | 4 | 18.2% |
| 35 to 44 Years | 0 | 0.0% |
| 45 to 54 Years | 6 | 27.3% |
| 55 to 64 Years | 5 | 22.7% |
| 65 to 74 Years | 7 | 31.8% |
| 75 to 84 Years | 0 | 0.0% |
| 85 Years and Over | 0 | 0.0% |
| Total | 22 | 100.0% |
Housing Finances in Echo
Median Income by Occupancy in Echo
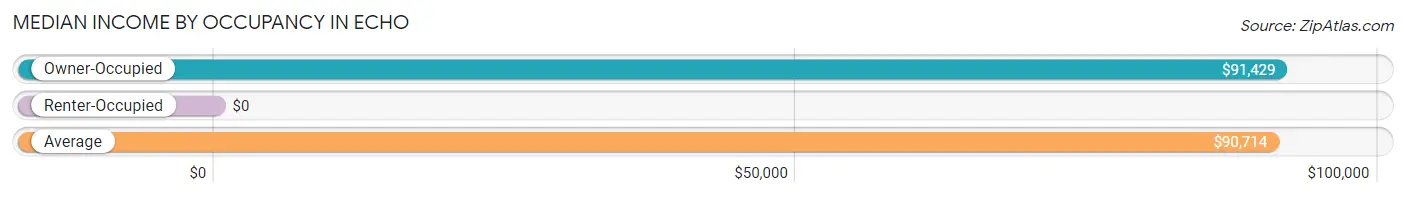
| Occupancy Type | # Households | Median Income |
| Owner-Occupied | 18 (81.8%) | $91,429 |
| Renter-Occupied | 4 (18.2%) | $0 |
| Average | 22 (100.0%) | $90,714 |
Occupancy by Householder Income Bracket in Echo
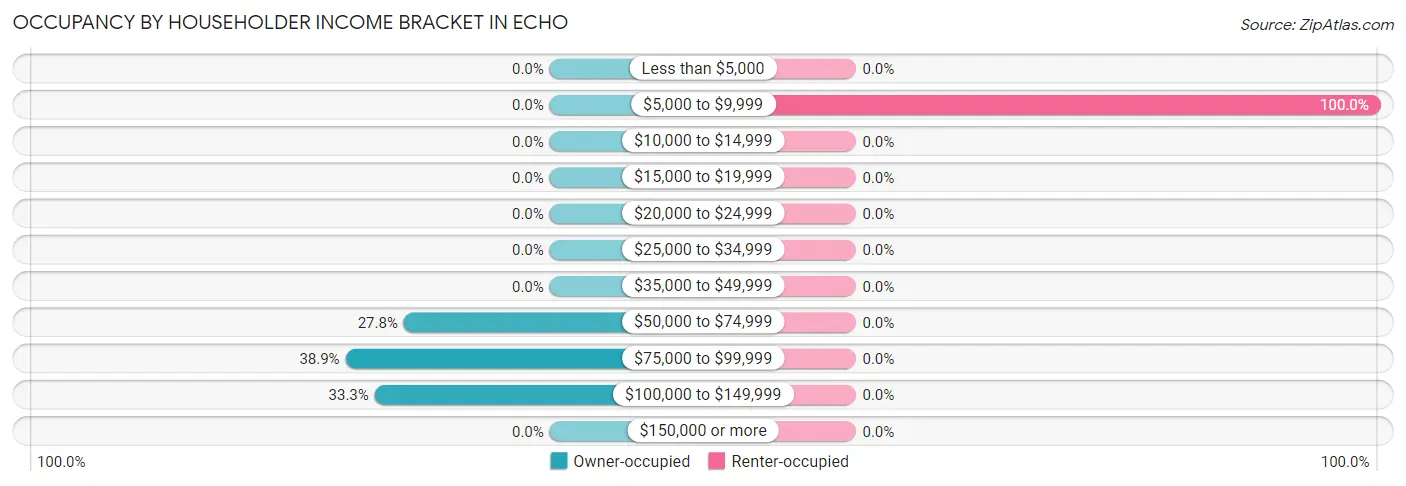
| Income Bracket | Owner-occupied | Renter-occupied |
| Less than $5,000 | 0 (0.0%) | 0 (0.0%) |
| $5,000 to $9,999 | 0 (0.0%) | 4 (100.0%) |
| $10,000 to $14,999 | 0 (0.0%) | 0 (0.0%) |
| $15,000 to $19,999 | 0 (0.0%) | 0 (0.0%) |
| $20,000 to $24,999 | 0 (0.0%) | 0 (0.0%) |
| $25,000 to $34,999 | 0 (0.0%) | 0 (0.0%) |
| $35,000 to $49,999 | 0 (0.0%) | 0 (0.0%) |
| $50,000 to $74,999 | 5 (27.8%) | 0 (0.0%) |
| $75,000 to $99,999 | 7 (38.9%) | 0 (0.0%) |
| $100,000 to $149,999 | 6 (33.3%) | 0 (0.0%) |
| $150,000 or more | 0 (0.0%) | 0 (0.0%) |
| Total | 18 (100.0%) | 4 (100.0%) |
Monthly Housing Cost Tiers in Echo
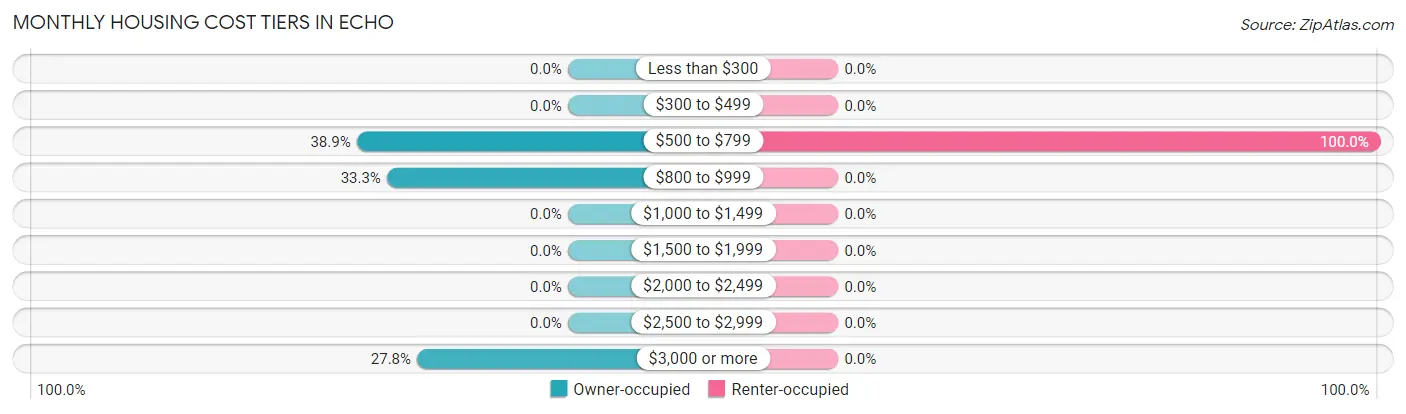
| Monthly Cost | Owner-occupied | Renter-occupied |
| Less than $300 | 0 (0.0%) | 0 (0.0%) |
| $300 to $499 | 0 (0.0%) | 0 (0.0%) |
| $500 to $799 | 7 (38.9%) | 4 (100.0%) |
| $800 to $999 | 6 (33.3%) | 0 (0.0%) |
| $1,000 to $1,499 | 0 (0.0%) | 0 (0.0%) |
| $1,500 to $1,999 | 0 (0.0%) | 0 (0.0%) |
| $2,000 to $2,499 | 0 (0.0%) | 0 (0.0%) |
| $2,500 to $2,999 | 0 (0.0%) | 0 (0.0%) |
| $3,000 or more | 5 (27.8%) | 0 (0.0%) |
| Total | 18 (100.0%) | 4 (100.0%) |
Physical Housing Characteristics in Echo
Housing Structures in Echo
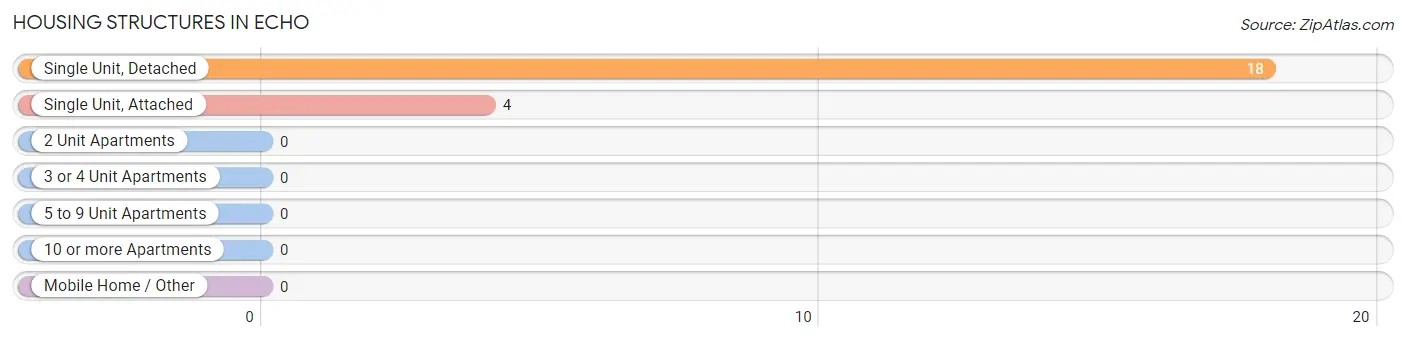
| Structure Type | # Housing Units | % Housing Units |
| Single Unit, Detached | 18 | 81.8% |
| Single Unit, Attached | 4 | 18.2% |
| 2 Unit Apartments | 0 | 0.0% |
| 3 or 4 Unit Apartments | 0 | 0.0% |
| 5 to 9 Unit Apartments | 0 | 0.0% |
| 10 or more Apartments | 0 | 0.0% |
| Mobile Home / Other | 0 | 0.0% |
| Total | 22 | 100.0% |
Housing Structures by Occupancy in Echo
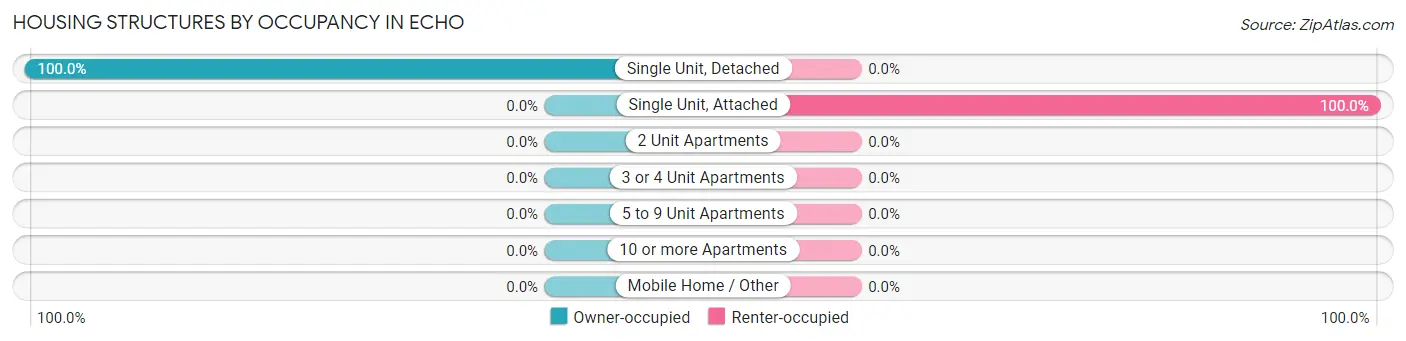
| Structure Type | Owner-occupied | Renter-occupied |
| Single Unit, Detached | 18 (100.0%) | 0 (0.0%) |
| Single Unit, Attached | 0 (0.0%) | 4 (100.0%) |
| 2 Unit Apartments | 0 (0.0%) | 0 (0.0%) |
| 3 or 4 Unit Apartments | 0 (0.0%) | 0 (0.0%) |
| 5 to 9 Unit Apartments | 0 (0.0%) | 0 (0.0%) |
| 10 or more Apartments | 0 (0.0%) | 0 (0.0%) |
| Mobile Home / Other | 0 (0.0%) | 0 (0.0%) |
| Total | 18 (81.8%) | 4 (18.2%) |
Housing Structures by Number of Rooms in Echo
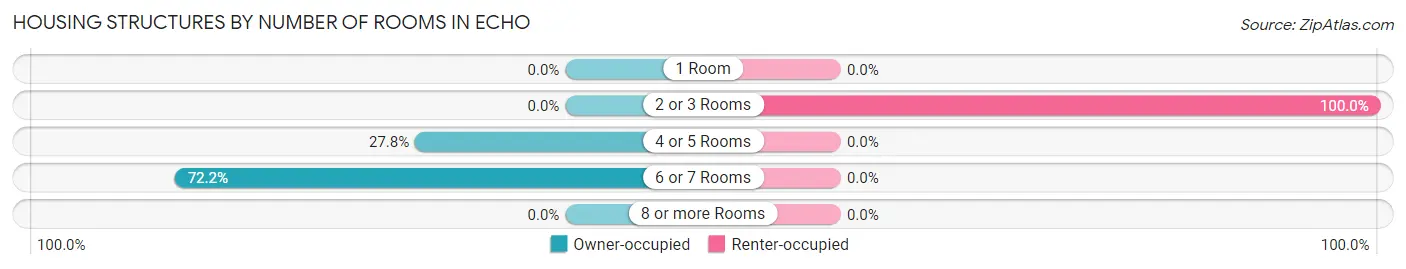
| Number of Rooms | Owner-occupied | Renter-occupied |
| 1 Room | 0 (0.0%) | 0 (0.0%) |
| 2 or 3 Rooms | 0 (0.0%) | 4 (100.0%) |
| 4 or 5 Rooms | 5 (27.8%) | 0 (0.0%) |
| 6 or 7 Rooms | 13 (72.2%) | 0 (0.0%) |
| 8 or more Rooms | 0 (0.0%) | 0 (0.0%) |
| Total | 18 (100.0%) | 4 (100.0%) |
Housing Structure by Heating Type in Echo
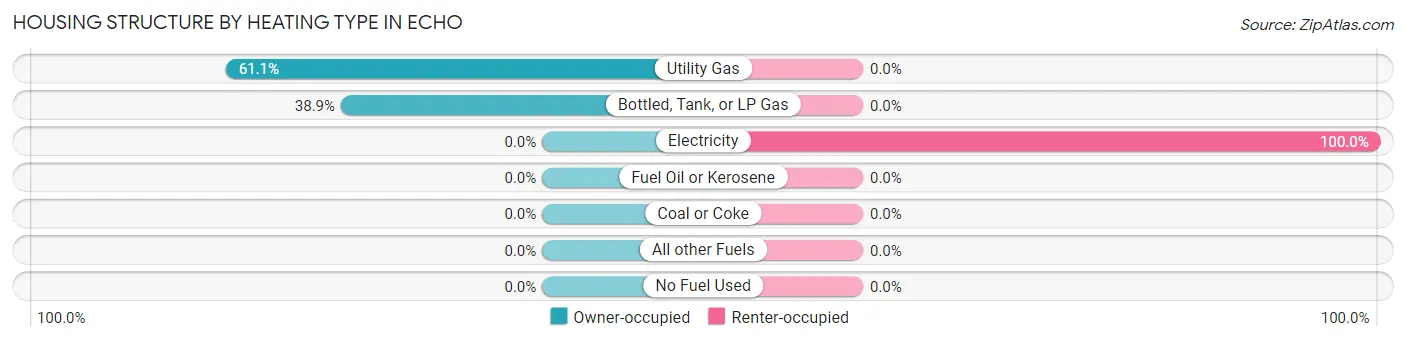
| Heating Type | Owner-occupied | Renter-occupied |
| Utility Gas | 11 (61.1%) | 0 (0.0%) |
| Bottled, Tank, or LP Gas | 7 (38.9%) | 0 (0.0%) |
| Electricity | 0 (0.0%) | 4 (100.0%) |
| Fuel Oil or Kerosene | 0 (0.0%) | 0 (0.0%) |
| Coal or Coke | 0 (0.0%) | 0 (0.0%) |
| All other Fuels | 0 (0.0%) | 0 (0.0%) |
| No Fuel Used | 0 (0.0%) | 0 (0.0%) |
| Total | 18 (100.0%) | 4 (100.0%) |
Household Vehicle Usage in Echo
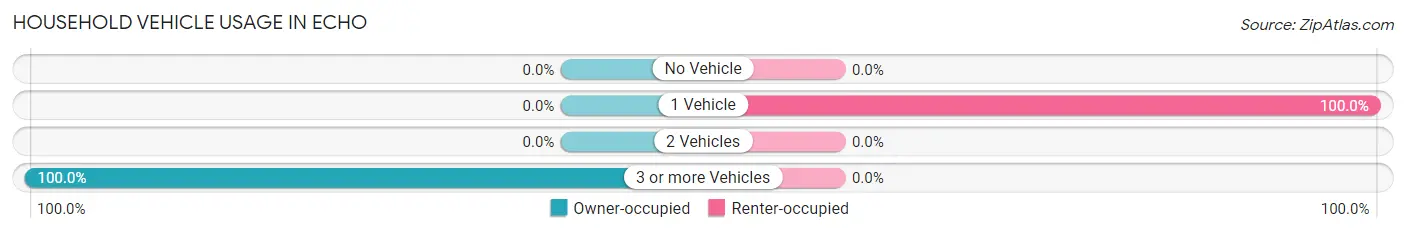
| Vehicles per Household | Owner-occupied | Renter-occupied |
| No Vehicle | 0 (0.0%) | 0 (0.0%) |
| 1 Vehicle | 0 (0.0%) | 4 (100.0%) |
| 2 Vehicles | 0 (0.0%) | 0 (0.0%) |
| 3 or more Vehicles | 18 (100.0%) | 0 (0.0%) |
| Total | 18 (100.0%) | 4 (100.0%) |
Real Estate & Mortgages in Echo
Real Estate and Mortgage Overview in Echo
| Characteristic | Without Mortgage | With Mortgage |
| Housing Units | 7 | 11 |
| Median Property Value | - | - |
| Median Household Income | - | - |
| Monthly Housing Costs | - | - |
| Real Estate Taxes | - | - |
Property Value by Mortgage Status in Echo
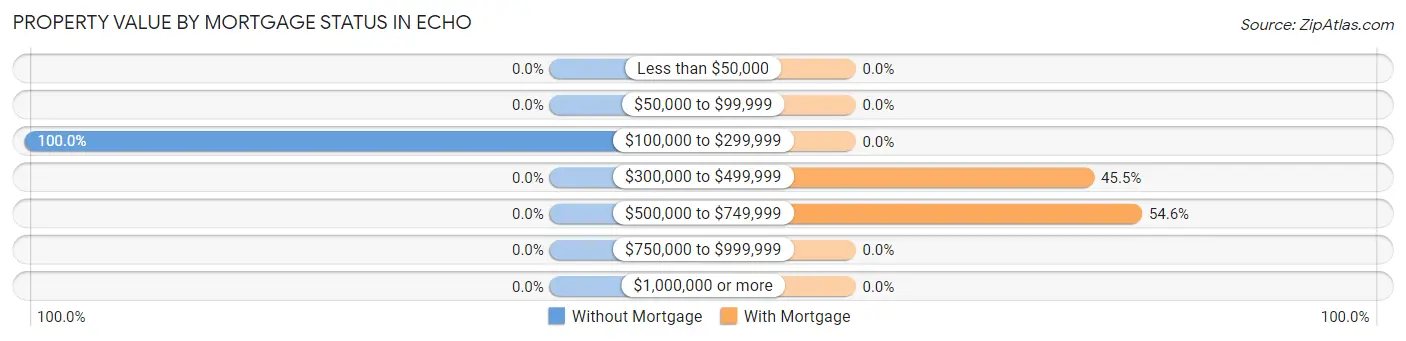
| Property Value | Without Mortgage | With Mortgage |
| Less than $50,000 | 0 (0.0%) | 0 (0.0%) |
| $50,000 to $99,999 | 0 (0.0%) | 0 (0.0%) |
| $100,000 to $299,999 | 7 (100.0%) | 0 (0.0%) |
| $300,000 to $499,999 | 0 (0.0%) | 5 (45.5%) |
| $500,000 to $749,999 | 0 (0.0%) | 6 (54.5%) |
| $750,000 to $999,999 | 0 (0.0%) | 0 (0.0%) |
| $1,000,000 or more | 0 (0.0%) | 0 (0.0%) |
| Total | 7 (100.0%) | 11 (100.0%) |
Household Income by Mortgage Status in Echo
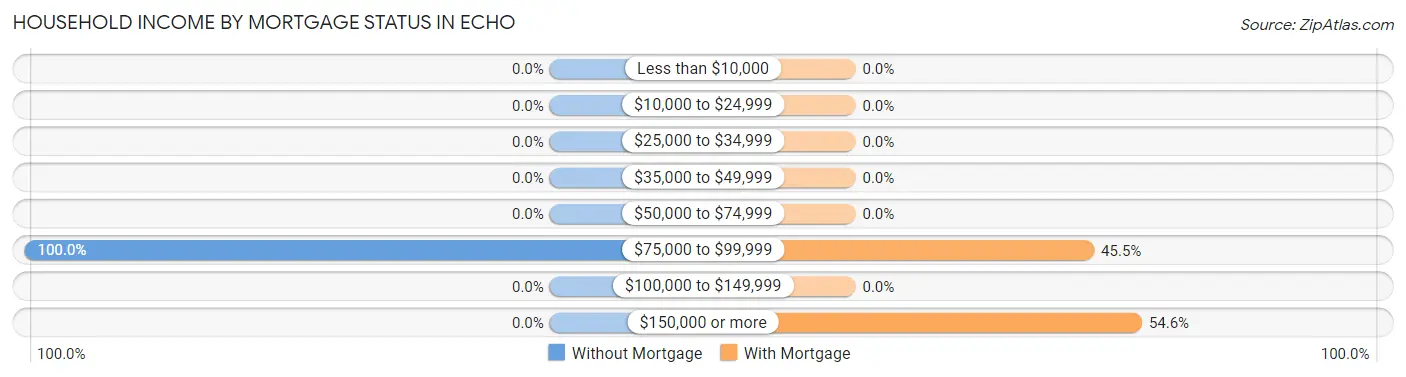
| Household Income | Without Mortgage | With Mortgage |
| Less than $10,000 | 0 (0.0%) | 0 (0.0%) |
| $10,000 to $24,999 | 0 (0.0%) | 0 (0.0%) |
| $25,000 to $34,999 | 0 (0.0%) | 0 (0.0%) |
| $35,000 to $49,999 | 0 (0.0%) | 0 (0.0%) |
| $50,000 to $74,999 | 0 (0.0%) | 0 (0.0%) |
| $75,000 to $99,999 | 7 (100.0%) | 5 (45.5%) |
| $100,000 to $149,999 | 0 (0.0%) | 0 (0.0%) |
| $150,000 or more | 0 (0.0%) | 6 (54.5%) |
| Total | 7 (100.0%) | 11 (100.0%) |
Property Value to Household Income Ratio in Echo
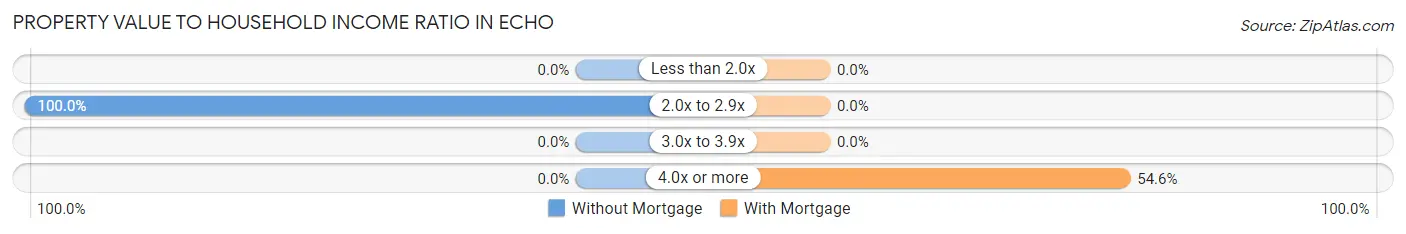
| Value-to-Income Ratio | Without Mortgage | With Mortgage |
| Less than 2.0x | 0 (0.0%) | 0 (0.0%) |
| 2.0x to 2.9x | 7 (100.0%) | 0 (0.0%) |
| 3.0x to 3.9x | 0 (0.0%) | 0 (0.0%) |
| 4.0x or more | 0 (0.0%) | 6 (54.5%) |
| Total | 7 (100.0%) | 11 (100.0%) |
Real Estate Taxes by Mortgage Status in Echo
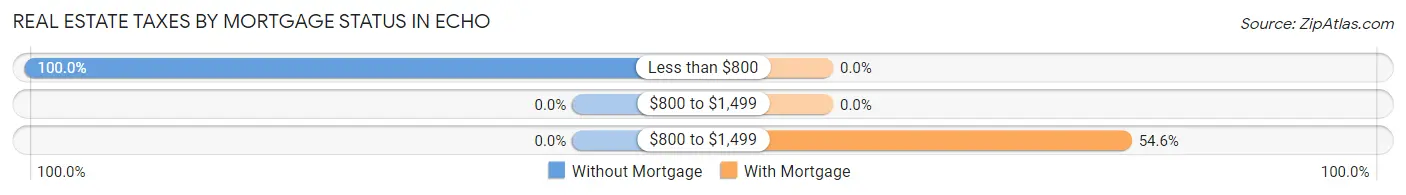
| Property Taxes | Without Mortgage | With Mortgage |
| Less than $800 | 7 (100.0%) | 0 (0.0%) |
| $800 to $1,499 | 0 (0.0%) | 0 (0.0%) |
| $800 to $1,499 | 0 (0.0%) | 6 (54.5%) |
| Total | 7 (100.0%) | 11 (100.0%) |
Health & Disability in Echo
Health Insurance Coverage by Age in Echo
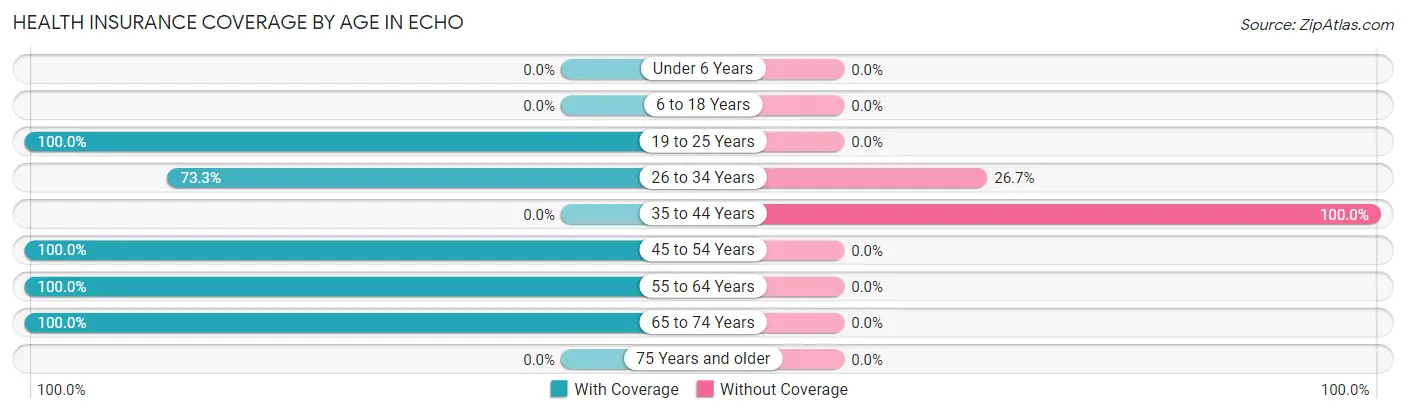
| Age Bracket | With Coverage | Without Coverage |
| Under 6 Years | 0 (0.0%) | 0 (0.0%) |
| 6 to 18 Years | 0 (0.0%) | 0 (0.0%) |
| 19 to 25 Years | 18 (100.0%) | 0 (0.0%) |
| 26 to 34 Years | 11 (73.3%) | 4 (26.7%) |
| 35 to 44 Years | 0 (0.0%) | 15 (100.0%) |
| 45 to 54 Years | 12 (100.0%) | 0 (0.0%) |
| 55 to 64 Years | 8 (100.0%) | 0 (0.0%) |
| 65 to 74 Years | 11 (100.0%) | 0 (0.0%) |
| 75 Years and older | 0 (0.0%) | 0 (0.0%) |
| Total | 60 (75.9%) | 19 (24.0%) |
Health Insurance Coverage by Citizenship Status in Echo
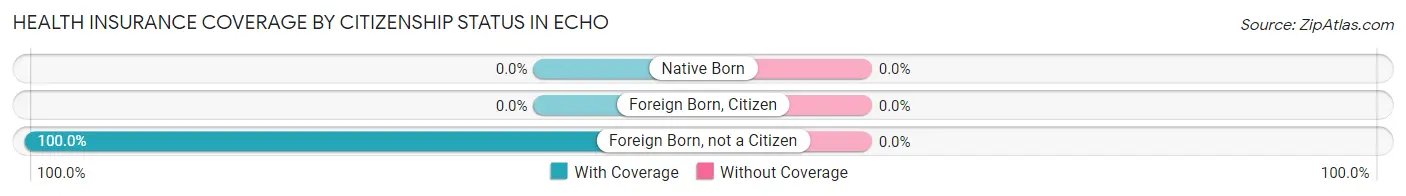
| Citizenship Status | With Coverage | Without Coverage |
| Native Born | 0 (0.0%) | 0 (0.0%) |
| Foreign Born, Citizen | 0 (0.0%) | 0 (0.0%) |
| Foreign Born, not a Citizen | 18 (100.0%) | 0 (0.0%) |
Health Insurance Coverage by Household Income in Echo
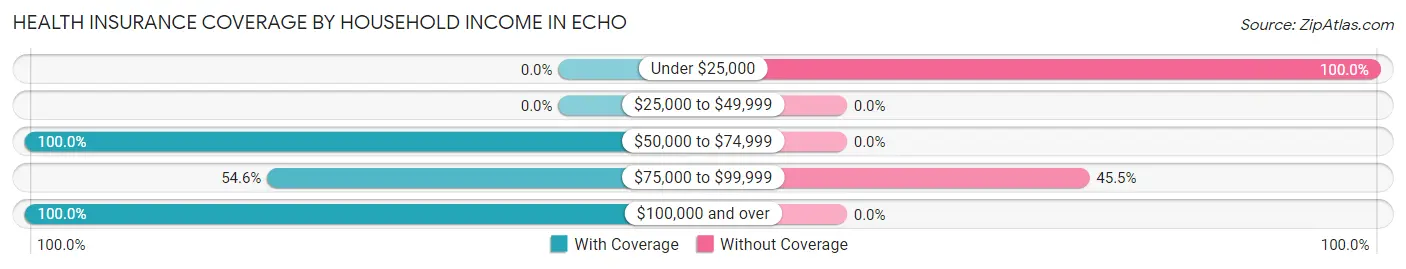
| Household Income | With Coverage | Without Coverage |
| Under $25,000 | 0 (0.0%) | 4 (100.0%) |
| $25,000 to $49,999 | 0 (0.0%) | 0 (0.0%) |
| $50,000 to $74,999 | 30 (100.0%) | 0 (0.0%) |
| $75,000 to $99,999 | 18 (54.5%) | 15 (45.5%) |
| $100,000 and over | 12 (100.0%) | 0 (0.0%) |
Public vs Private Health Insurance Coverage by Age in Echo
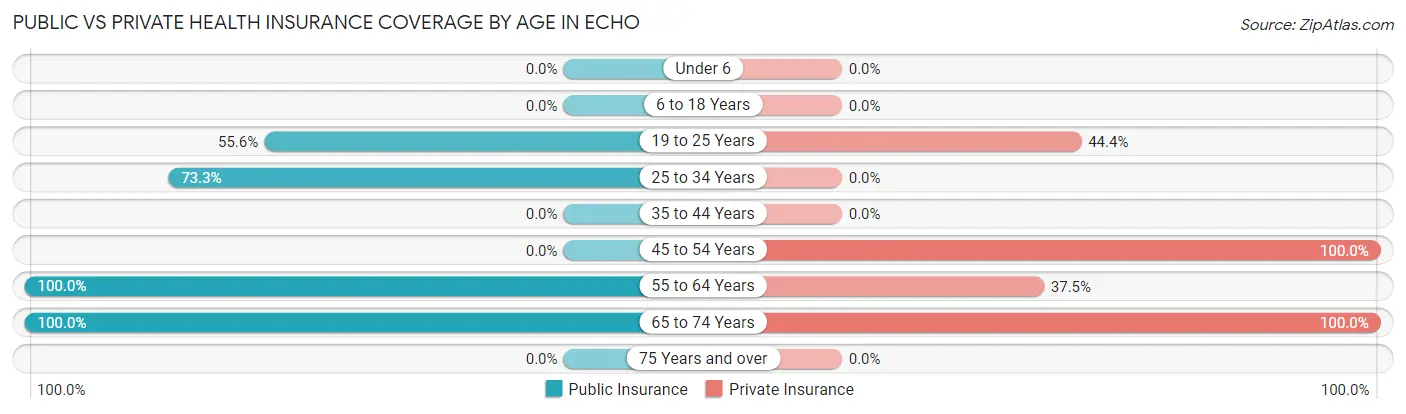
| Age Bracket | Public Insurance | Private Insurance |
| Under 6 | 0 (0.0%) | 0 (0.0%) |
| 6 to 18 Years | 0 (0.0%) | 0 (0.0%) |
| 19 to 25 Years | 10 (55.6%) | 8 (44.4%) |
| 25 to 34 Years | 11 (73.3%) | 0 (0.0%) |
| 35 to 44 Years | 0 (0.0%) | 0 (0.0%) |
| 45 to 54 Years | 0 (0.0%) | 12 (100.0%) |
| 55 to 64 Years | 8 (100.0%) | 3 (37.5%) |
| 65 to 74 Years | 11 (100.0%) | 11 (100.0%) |
| 75 Years and over | 0 (0.0%) | 0 (0.0%) |
| Total | 40 (50.6%) | 34 (43.0%) |
Disability Status by Sex by Age in Echo
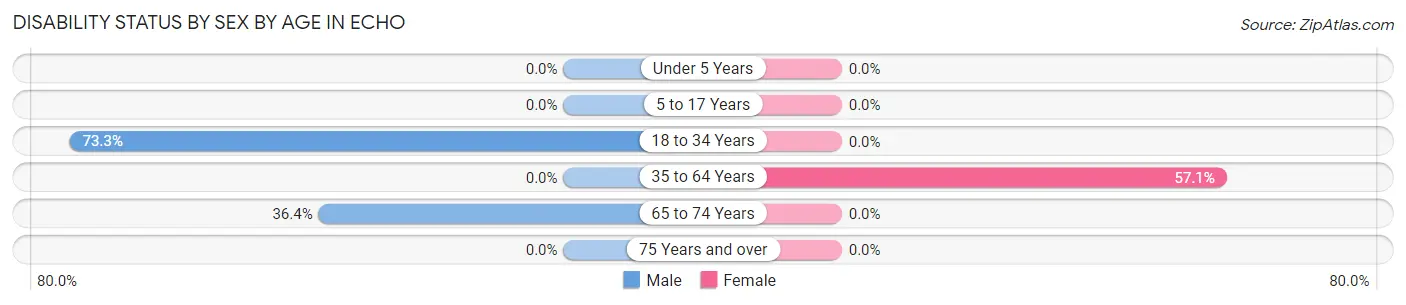
| Age Bracket | Male | Female |
| Under 5 Years | 0 (0.0%) | 0 (0.0%) |
| 5 to 17 Years | 0 (0.0%) | 0 (0.0%) |
| 18 to 34 Years | 11 (73.3%) | 0 (0.0%) |
| 35 to 64 Years | 0 (0.0%) | 8 (57.1%) |
| 65 to 74 Years | 4 (36.4%) | 0 (0.0%) |
| 75 Years and over | 0 (0.0%) | 0 (0.0%) |
Disability Class by Sex by Age in Echo
Disability Class: Hearing Difficulty
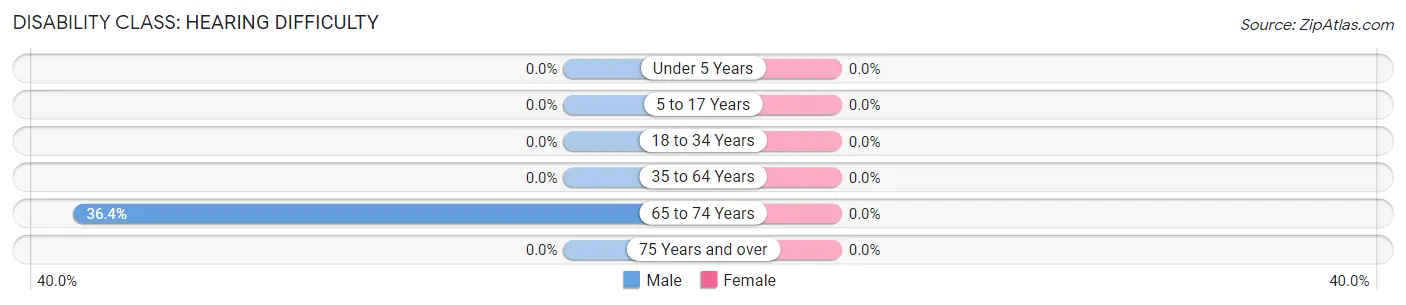
| Age Bracket | Male | Female |
| Under 5 Years | 0 (0.0%) | 0 (0.0%) |
| 5 to 17 Years | 0 (0.0%) | 0 (0.0%) |
| 18 to 34 Years | 0 (0.0%) | 0 (0.0%) |
| 35 to 64 Years | 0 (0.0%) | 0 (0.0%) |
| 65 to 74 Years | 4 (36.4%) | 0 (0.0%) |
| 75 Years and over | 0 (0.0%) | 0 (0.0%) |
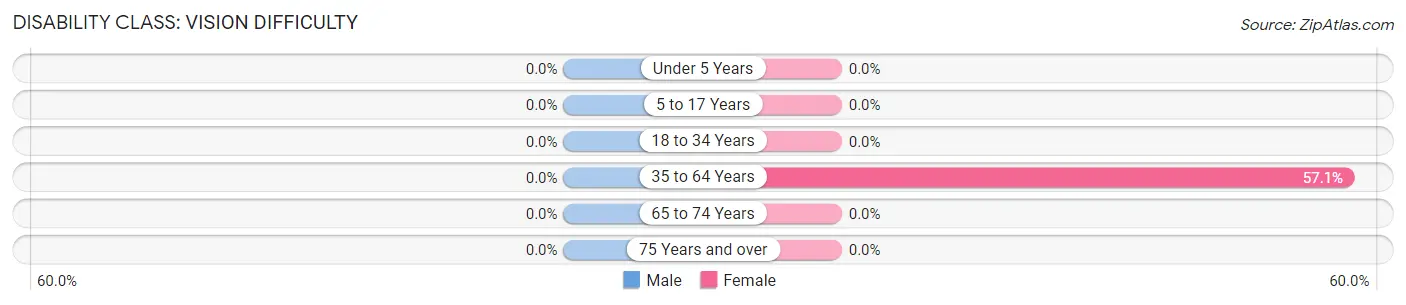
Disability Class: Vision Difficulty
| Age Bracket | Male | Female |
| Under 5 Years | 0 (0.0%) | 0 (0.0%) |
| 5 to 17 Years | 0 (0.0%) | 0 (0.0%) |
| 18 to 34 Years | 0 (0.0%) | 0 (0.0%) |
| 35 to 64 Years | 0 (0.0%) | 8 (57.1%) |
| 65 to 74 Years | 0 (0.0%) | 0 (0.0%) |
| 75 Years and over | 0 (0.0%) | 0 (0.0%) |
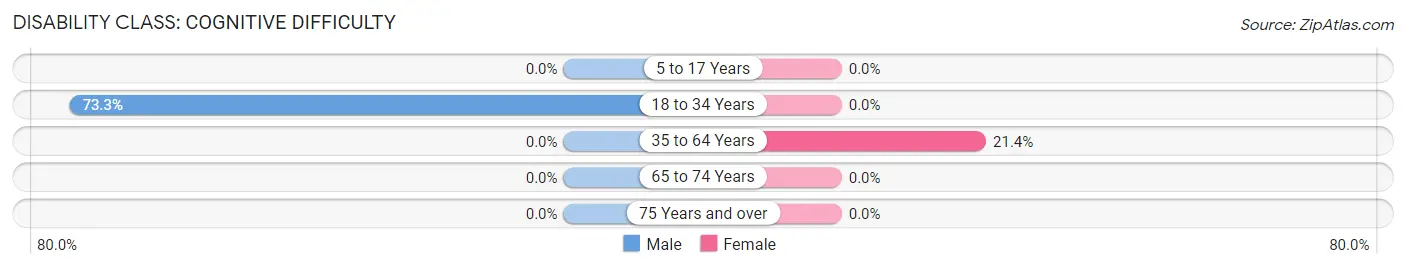
Disability Class: Cognitive Difficulty
| Age Bracket | Male | Female |
| 5 to 17 Years | 0 (0.0%) | 0 (0.0%) |
| 18 to 34 Years | 11 (73.3%) | 0 (0.0%) |
| 35 to 64 Years | 0 (0.0%) | 3 (21.4%) |
| 65 to 74 Years | 0 (0.0%) | 0 (0.0%) |
| 75 Years and over | 0 (0.0%) | 0 (0.0%) |
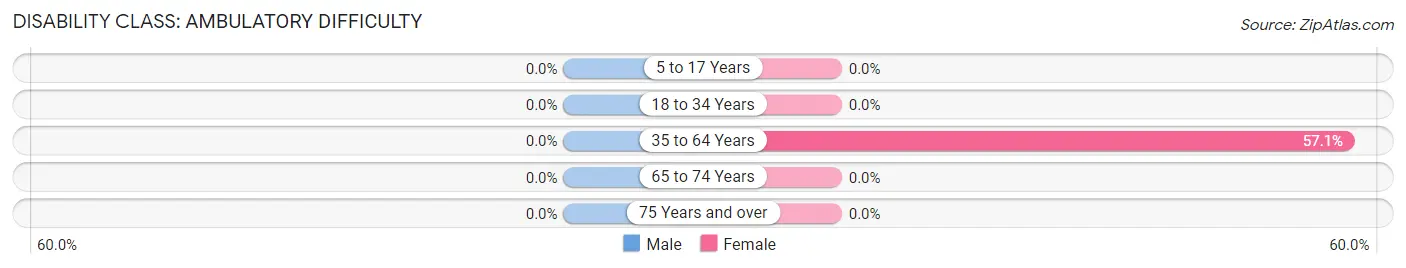
Disability Class: Ambulatory Difficulty
| Age Bracket | Male | Female |
| 5 to 17 Years | 0 (0.0%) | 0 (0.0%) |
| 18 to 34 Years | 0 (0.0%) | 0 (0.0%) |
| 35 to 64 Years | 0 (0.0%) | 8 (57.1%) |
| 65 to 74 Years | 0 (0.0%) | 0 (0.0%) |
| 75 Years and over | 0 (0.0%) | 0 (0.0%) |
Disability Class: Self-Care Difficulty
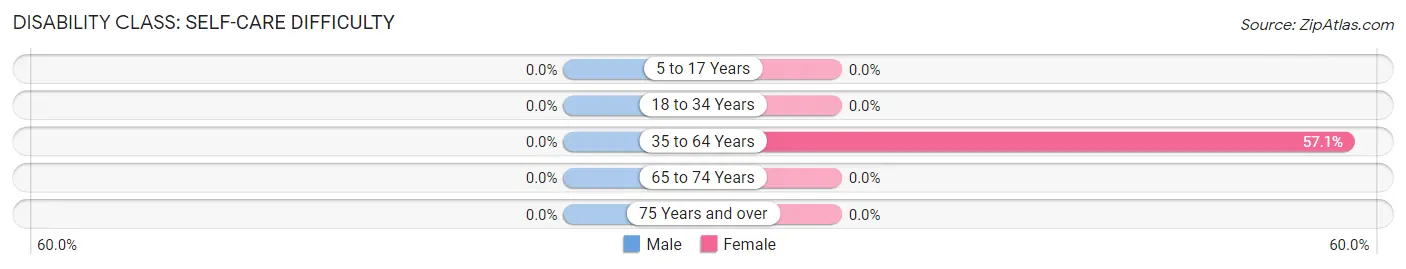
| Age Bracket | Male | Female |
| 5 to 17 Years | 0 (0.0%) | 0 (0.0%) |
| 18 to 34 Years | 0 (0.0%) | 0 (0.0%) |
| 35 to 64 Years | 0 (0.0%) | 8 (57.1%) |
| 65 to 74 Years | 0 (0.0%) | 0 (0.0%) |
| 75 Years and over | 0 (0.0%) | 0 (0.0%) |
Technology Access in Echo
Computing Device Access in Echo
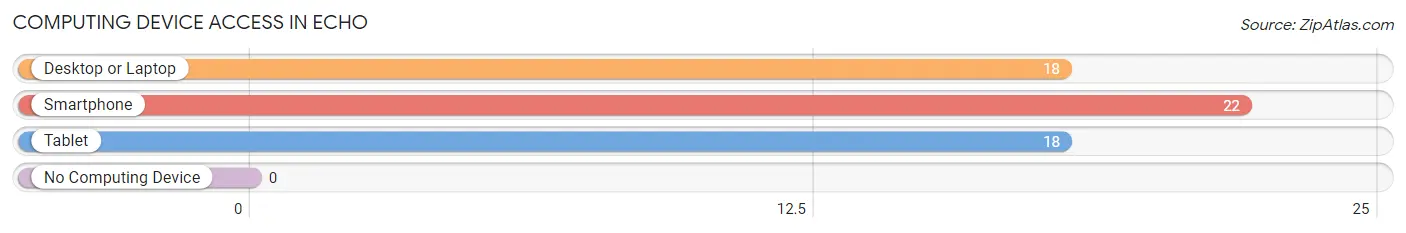
| Device Type | # Households | % Households |
| Desktop or Laptop | 18 | 81.8% |
| Smartphone | 22 | 100.0% |
| Tablet | 18 | 81.8% |
| No Computing Device | 0 | 0.0% |
| Total | 22 | 100.0% |
Internet Access in Echo
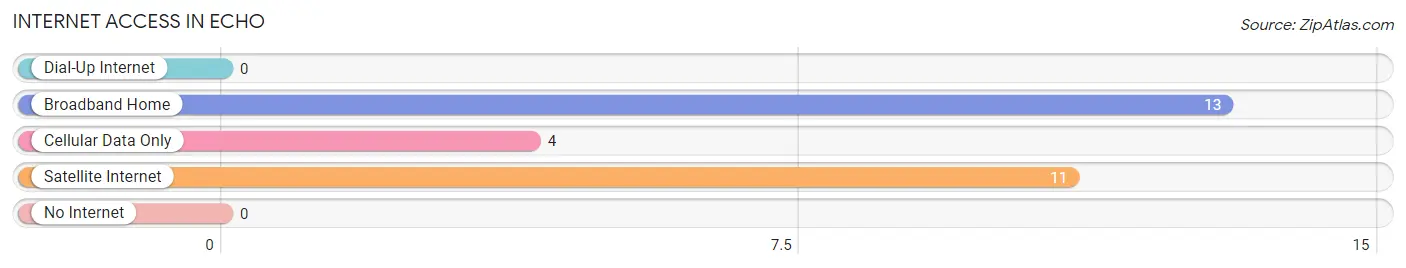
| Internet Type | # Households | % Households |
| Dial-Up Internet | 0 | 0.0% |
| Broadband Home | 13 | 59.1% |
| Cellular Data Only | 4 | 18.2% |
| Satellite Internet | 11 | 50.0% |
| No Internet | 0 | 0.0% |
| Total | 22 | 100.0% |
Echo Summary
Echo is a small city located in the Uinta County of Utah, United States. It is situated in the northeastern part of the state, about 40 miles east of Salt Lake City. The city has a population of 1,062 as of the 2010 census.
History
The area that is now Echo was first settled in 1864 by a group of Mormon pioneers led by William H. Hooper. The settlement was originally known as Hooper’s Fort, and was located near the present-day city of Echo. The settlement was later renamed Echo in 1868, after the nearby Echo Canyon.
The city of Echo was officially incorporated in 1883. During the late 19th century, the city was a major stop on the Union Pacific Railroad, and was a popular destination for travelers.
Geography
Echo is located in the northeastern part of Utah, about 40 miles east of Salt Lake City. The city is situated in the Uinta Basin, at an elevation of 4,890 feet. The city is surrounded by the Wasatch Mountains to the west and the Uinta Mountains to the east.
The city covers an area of 1.2 square miles, all of which is land. The city is located near the Weber River, which flows through the city.
Economy
The economy of Echo is largely based on agriculture and tourism. The city is home to several farms, which produce a variety of crops, including hay, wheat, and corn. The city is also home to several tourist attractions, including the Echo Canyon State Park and the Echo Reservoir.
The city is also home to several small businesses, including restaurants, retail stores, and service providers.
Demographics
As of the 2010 census, the population of Echo was 1,062. The racial makeup of the city was 95.2% White, 0.7% Native American, 0.3% Asian, 0.2% African American, and 3.6% from other races.
The median household income in Echo was $41,250, and the median family income was $45,833. The per capita income in the city was $19,845. About 11.2% of the population was below the poverty line.
Conclusion
Echo is a small city located in the Uinta County of Utah, United States. It is situated in the northeastern part of the state, about 40 miles east of Salt Lake City. The city has a population of 1,062 as of the 2010 census. The city was first settled in 1864 by a group of Mormon pioneers, and was officially incorporated in 1883. The economy of Echo is largely based on agriculture and tourism. The racial makeup of the city was 95.2% White, 0.7% Native American, 0.3% Asian, 0.2% African American, and 3.6% from other races. The median household income in Echo was $41,250, and the median family income was $45,833.
Common Questions
What is Per Capita Income in Echo?
Per Capita income in Echo is $26,577.
What is the Median Family Income in Echo?
Median Family Income in Echo is $91,429.
What is the Median Household income in Echo?
Median Household Income in Echo is $90,714.
What is Inequality or Gini Index in Echo?
Inequality or Gini Index in Echo is 0.28.
What is the Total Population of Echo?
Total Population of Echo is 79.
What is the Total Male Population of Echo?
Total Male Population of Echo is 47.
What is the Total Female Population of Echo?
Total Female Population of Echo is 32.
What is the Ratio of Males per 100 Females in Echo?
There are 146.88 Males per 100 Females in Echo.
What is the Ratio of Females per 100 Males in Echo?
There are 68.09 Females per 100 Males in Echo.
What is the Median Population Age in Echo?
Median Population Age in Echo is 41.4 Years.
What is the Average Family Size in Echo
Average Family Size in Echo is 4.2 People.
What is the Average Household Size in Echo
Average Household Size in Echo is 3.6 People.
How Large is the Labor Force in Echo?
There are 54 People in the Labor Forcein in Echo.
What is the Percentage of People in the Labor Force in Echo?
68.4% of People are in the Labor Force in Echo.
What is the Unemployment Rate in Echo?
Unemployment Rate in Echo is 27.8%.