Golden Gate, IL Map & Demographics
Golden Gate Map
Golden Gate Overview
$12,541
PER CAPITA INCOME
$2,499
AVG FAMILY INCOME
$15,764
AVG HOUSEHOLD INCOME
94.8%
WAGE / INCOME GAP [ % ]
5.2¢/ $1
WAGE / INCOME GAP [ $ ]
0.41
INEQUALITY / GINI INDEX
90
TOTAL POPULATION
60
MALE POPULATION
30
FEMALE POPULATION
200.00
MALES / 100 FEMALES
50.00
FEMALES / 100 MALES
68.0
MEDIAN AGE
2.9
AVG FAMILY SIZE
1.6
AVG HOUSEHOLD SIZE
19
LABOR FORCE [ PEOPLE ]
25.0%
PERCENT IN LABOR FORCE
Golden Gate Zip Codes
Golden Gate Area Codes
Income in Golden Gate
Income Overview in Golden Gate
Per Capita Income in Golden Gate is $12,541, while median incomes of families and households are $2,499 and $15,764 respectively.
| Characteristic | Number | Measure |
| Per Capita Income | 90 | $12,541 |
| Median Family Income | 14 | $2,499 |
| Mean Family Income | 14 | $28,529 |
| Median Household Income | 58 | $15,764 |
| Mean Household Income | 58 | $18,090 |
| Income Deficit | 14 | $0 |
| Wage / Income Gap (%) | 90 | 94.81% |
| Wage / Income Gap ($) | 90 | 5.19¢ per $1 |
| Gini / Inequality Index | 90 | 0.41 |
Earnings by Sex in Golden Gate
Average Earnings in Golden Gate are $2,499, $2,499 for men and $48,125 for women, a difference of 94.8%.
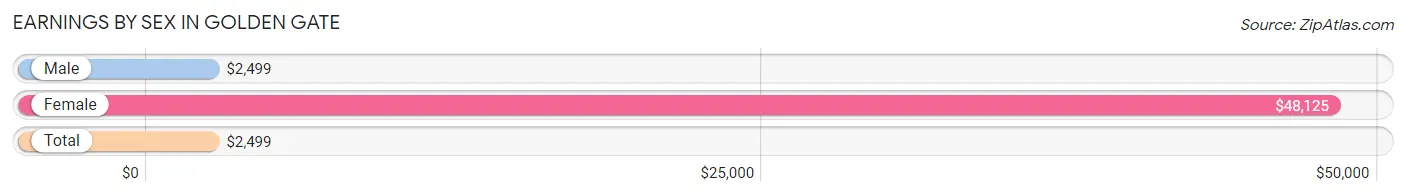
| Sex | Number | Average Earnings |
| Male | 14 (73.7%) | $2,499 |
| Female | 5 (26.3%) | $48,125 |
| Total | 19 (100.0%) | $2,499 |
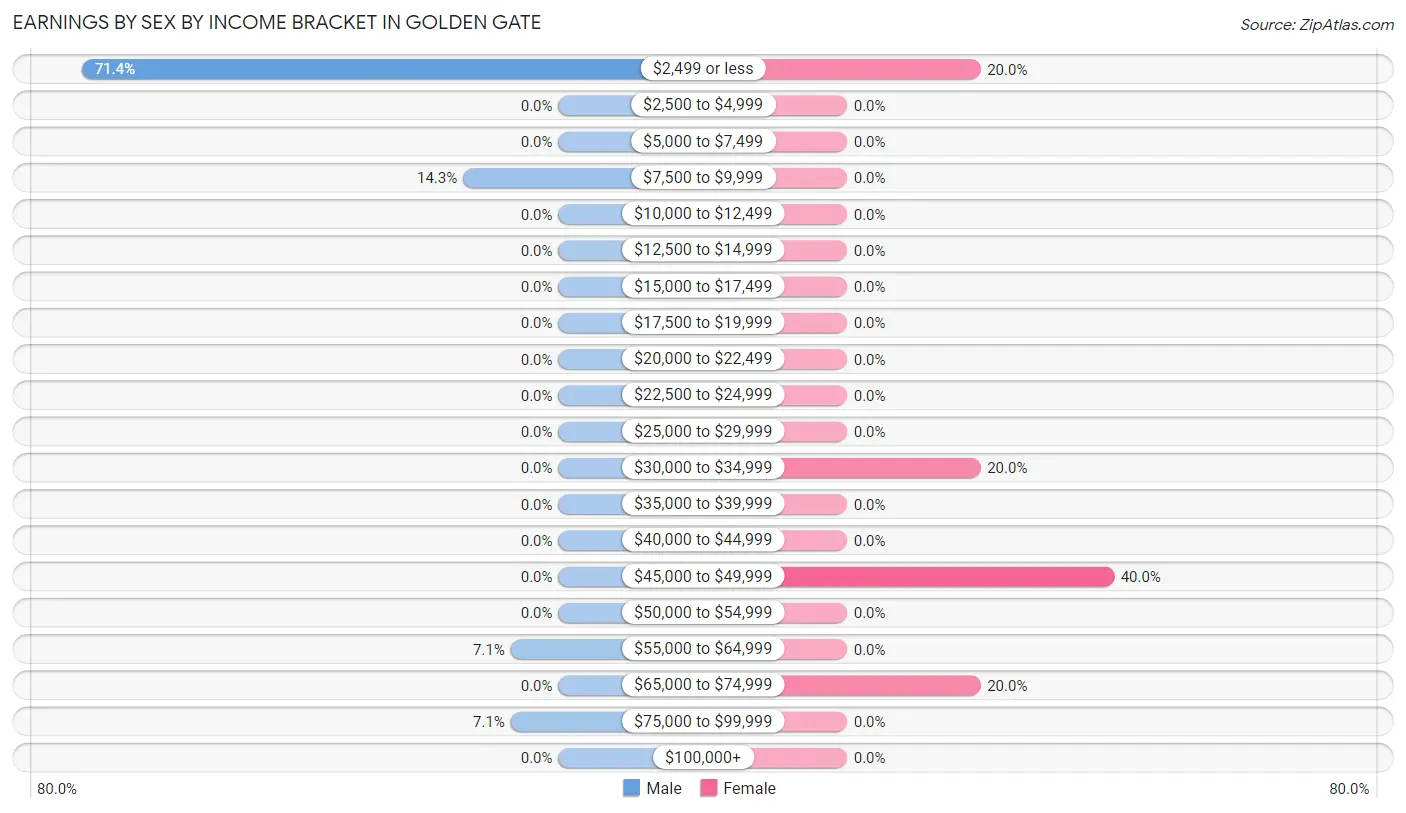
Earnings by Sex by Income Bracket in Golden Gate
The most common earnings brackets in Golden Gate are $2,499 or less for men (10 | 71.4%) and $45,000 to $49,999 for women (2 | 40.0%).
| Income | Male | Female |
| $2,499 or less | 10 (71.4%) | 1 (20.0%) |
| $2,500 to $4,999 | 0 (0.0%) | 0 (0.0%) |
| $5,000 to $7,499 | 0 (0.0%) | 0 (0.0%) |
| $7,500 to $9,999 | 2 (14.3%) | 0 (0.0%) |
| $10,000 to $12,499 | 0 (0.0%) | 0 (0.0%) |
| $12,500 to $14,999 | 0 (0.0%) | 0 (0.0%) |
| $15,000 to $17,499 | 0 (0.0%) | 0 (0.0%) |
| $17,500 to $19,999 | 0 (0.0%) | 0 (0.0%) |
| $20,000 to $22,499 | 0 (0.0%) | 0 (0.0%) |
| $22,500 to $24,999 | 0 (0.0%) | 0 (0.0%) |
| $25,000 to $29,999 | 0 (0.0%) | 0 (0.0%) |
| $30,000 to $34,999 | 0 (0.0%) | 1 (20.0%) |
| $35,000 to $39,999 | 0 (0.0%) | 0 (0.0%) |
| $40,000 to $44,999 | 0 (0.0%) | 0 (0.0%) |
| $45,000 to $49,999 | 0 (0.0%) | 2 (40.0%) |
| $50,000 to $54,999 | 0 (0.0%) | 0 (0.0%) |
| $55,000 to $64,999 | 1 (7.1%) | 0 (0.0%) |
| $65,000 to $74,999 | 0 (0.0%) | 1 (20.0%) |
| $75,000 to $99,999 | 1 (7.1%) | 0 (0.0%) |
| $100,000+ | 0 (0.0%) | 0 (0.0%) |
| Total | 14 (100.0%) | 5 (100.0%) |
Earnings by Sex by Educational Attainment in Golden Gate
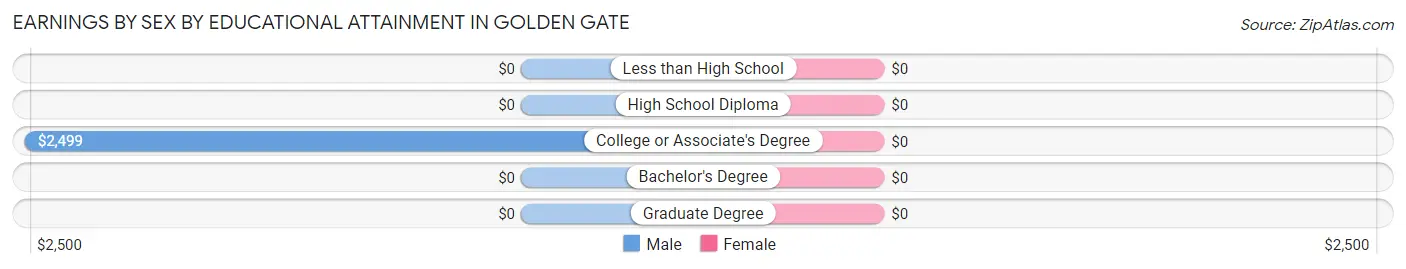
| Educational Attainment | Male Income | Female Income |
| Less than High School | - | - |
| High School Diploma | - | - |
| College or Associate's Degree | $2,499 | $0 |
| Bachelor's Degree | - | - |
| Graduate Degree | - | - |
| Total | $2,499 | $48,125 |
Family Income in Golden Gate
Family Income Brackets in Golden Gate
According to the Golden Gate family income data, there are 9 families falling into the less than $10,000 income range, which is the most common income bracket and makes up 64.3% of all families.
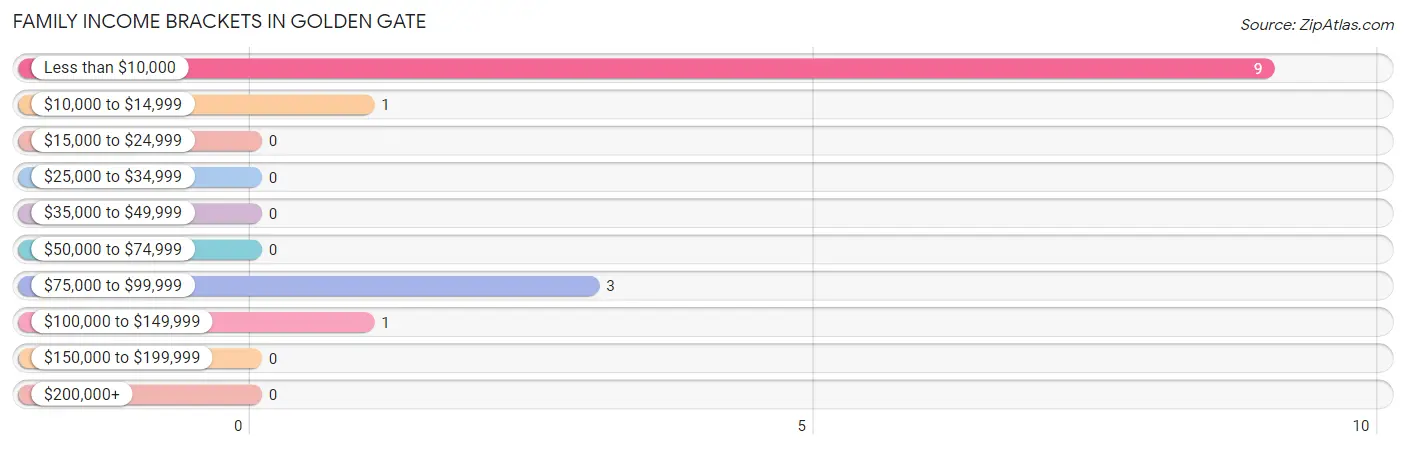
| Income Bracket | # Families | % Families |
| Less than $10,000 | 9 | 64.3% |
| $10,000 to $14,999 | 1 | 7.1% |
| $15,000 to $24,999 | 0 | 0.0% |
| $25,000 to $34,999 | 0 | 0.0% |
| $35,000 to $49,999 | 0 | 0.0% |
| $50,000 to $74,999 | 0 | 0.0% |
| $75,000 to $99,999 | 3 | 21.4% |
| $100,000 to $149,999 | 1 | 7.1% |
| $150,000 to $199,999 | 0 | 0.0% |
| $200,000+ | 0 | 0.0% |
Family Income by Famaliy Size in Golden Gate
2-person families (3 | 21.4%) account for the highest median family income in Golden Gate with $76,250 per family, while 2-person families (3 | 21.4%) have the highest median income of $38,125 per family member.
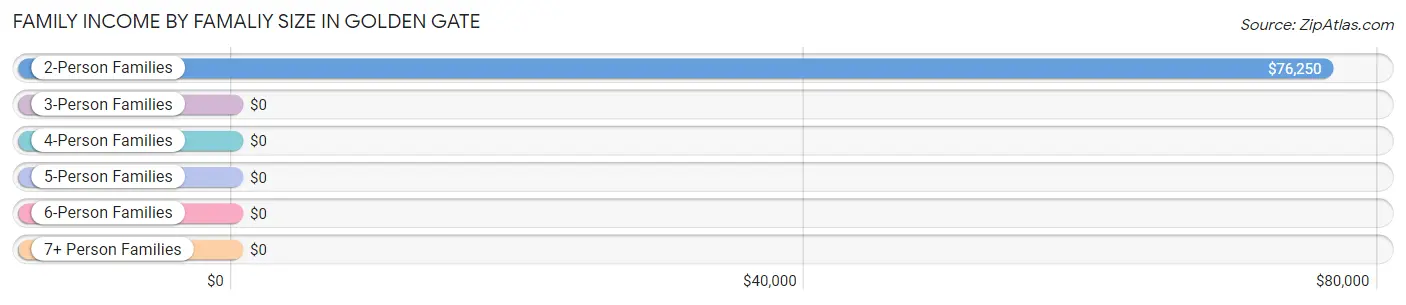
| Income Bracket | # Families | Median Income |
| 2-Person Families | 3 (21.4%) | $76,250 |
| 3-Person Families | 9 (64.3%) | $0 |
| 4-Person Families | 2 (14.3%) | $0 |
| 5-Person Families | 0 (0.0%) | $0 |
| 6-Person Families | 0 (0.0%) | $0 |
| 7+ Person Families | 0 (0.0%) | $0 |
| Total | 14 (100.0%) | $2,499 |
Family Income by Number of Earners in Golden Gate
| Number of Earners | # Families | Median Income |
| No Earners | 2 (14.3%) | $0 |
| 1 Earner | 9 (64.3%) | $0 |
| 2 Earners | 2 (14.3%) | $0 |
| 3+ Earners | 1 (7.1%) | $0 |
| Total | 14 (100.0%) | $2,499 |
Household Income in Golden Gate
Household Income Brackets in Golden Gate
With 36 households falling in the category, the $15,000 to $24,999 income range is the most frequent in Golden Gate, accounting for 62.1% of all households.
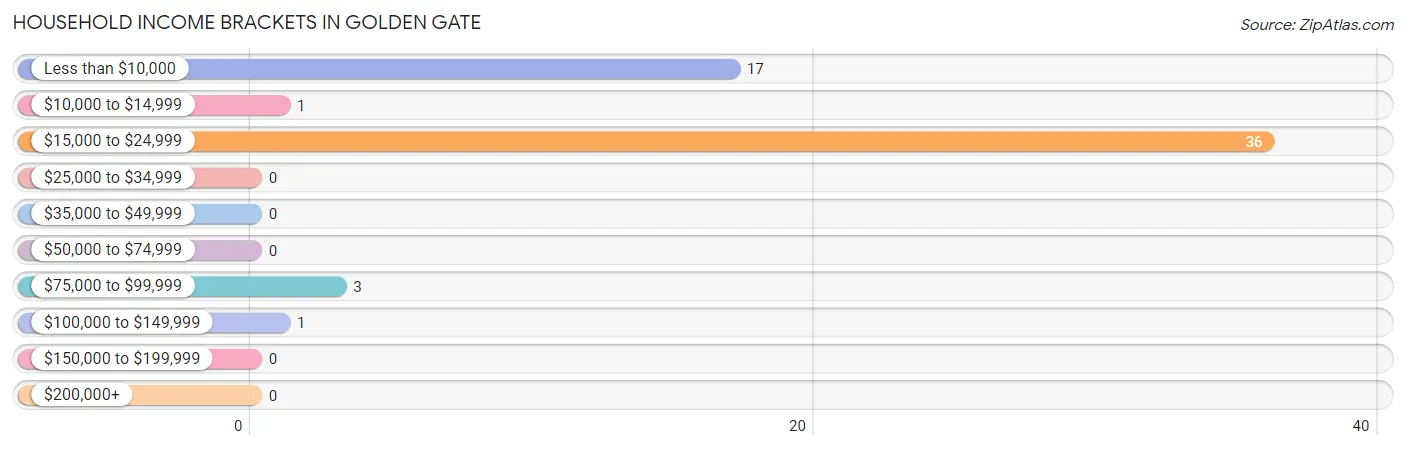
| Income Bracket | # Households | % Households |
| Less than $10,000 | 17 | 29.3% |
| $10,000 to $14,999 | 1 | 1.7% |
| $15,000 to $24,999 | 36 | 62.1% |
| $25,000 to $34,999 | 0 | 0.0% |
| $35,000 to $49,999 | 0 | 0.0% |
| $50,000 to $74,999 | 0 | 0.0% |
| $75,000 to $99,999 | 3 | 5.2% |
| $100,000 to $149,999 | 1 | 1.7% |
| $150,000 to $199,999 | 0 | 0.0% |
| $200,000+ | 0 | 0.0% |
Household Income by Householder Age in Golden Gate
The median household income in Golden Gate is $15,764, with the highest median household income of $16,042 found in the 65+ years age bracket for the primary householder. A total of 44 households (75.9%) fall into this category.
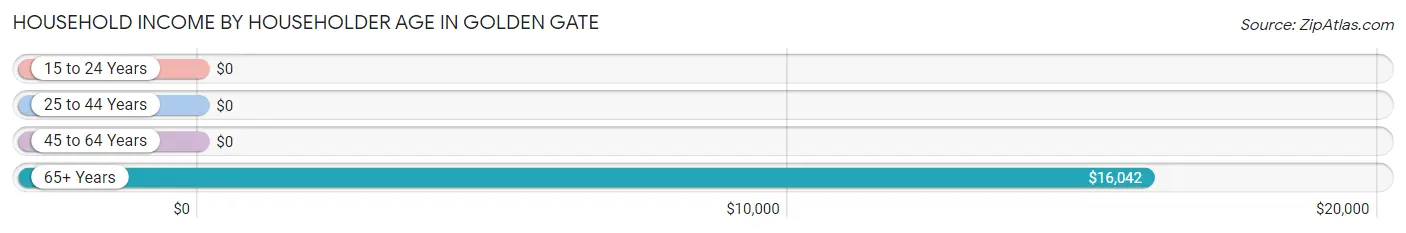
| Income Bracket | # Households | Median Income |
| 15 to 24 Years | 0 (0.0%) | $0 |
| 25 to 44 Years | 9 (15.5%) | $0 |
| 45 to 64 Years | 5 (8.6%) | $0 |
| 65+ Years | 44 (75.9%) | $16,042 |
| Total | 58 (100.0%) | $15,764 |
Poverty in Golden Gate
Income Below Poverty by Sex and Age in Golden Gate
With 23.3% poverty level for males and 80.0% for females among the residents of Golden Gate, under 5 year old males and 12 to 14 year old females are the most vulnerable to poverty, with 5 males (100.0%) and 1 females (100.0%) in their respective age groups living below the poverty level.
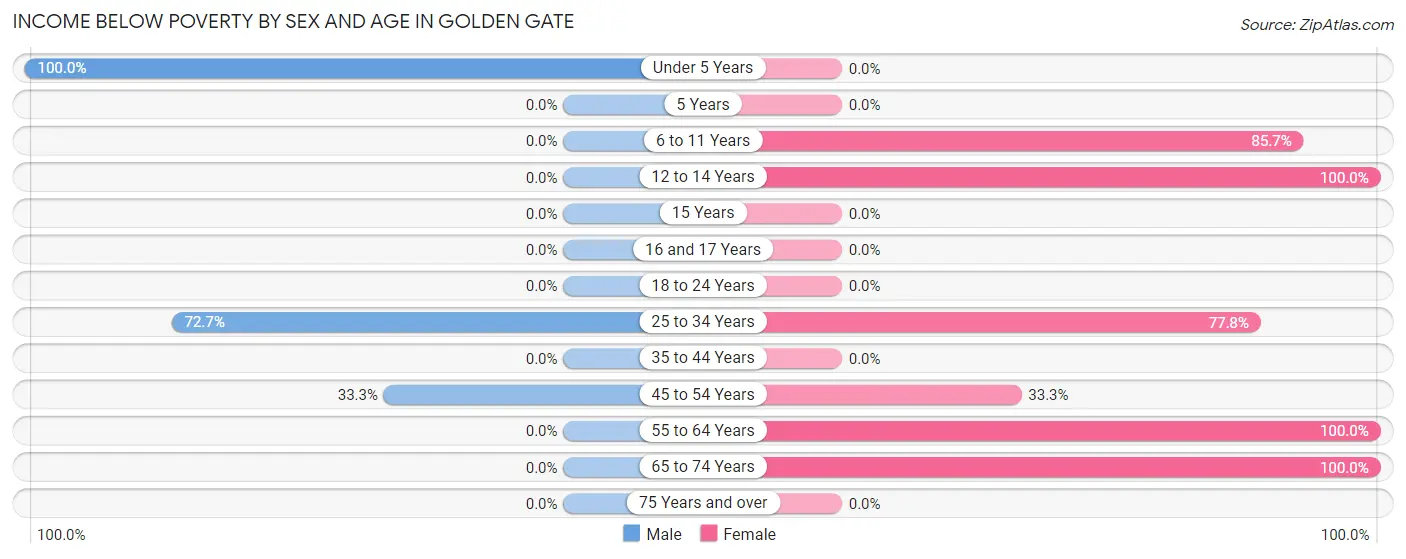
| Age Bracket | Male | Female |
| Under 5 Years | 5 (100.0%) | 0 (0.0%) |
| 5 Years | 0 (0.0%) | 0 (0.0%) |
| 6 to 11 Years | 0 (0.0%) | 6 (85.7%) |
| 12 to 14 Years | 0 (0.0%) | 1 (100.0%) |
| 15 Years | 0 (0.0%) | 0 (0.0%) |
| 16 and 17 Years | 0 (0.0%) | 0 (0.0%) |
| 18 to 24 Years | 0 (0.0%) | 0 (0.0%) |
| 25 to 34 Years | 8 (72.7%) | 7 (77.8%) |
| 35 to 44 Years | 0 (0.0%) | 0 (0.0%) |
| 45 to 54 Years | 1 (33.3%) | 1 (33.3%) |
| 55 to 64 Years | 0 (0.0%) | 2 (100.0%) |
| 65 to 74 Years | 0 (0.0%) | 7 (100.0%) |
| 75 Years and over | 0 (0.0%) | 0 (0.0%) |
| Total | 14 (23.3%) | 24 (80.0%) |
Income Above Poverty by Sex and Age in Golden Gate
According to the poverty statistics in Golden Gate, males aged 6 to 11 years and females aged 75 years and over are the age groups that are most secure financially, with 100.0% of males and 100.0% of females in these age groups living above the poverty line.
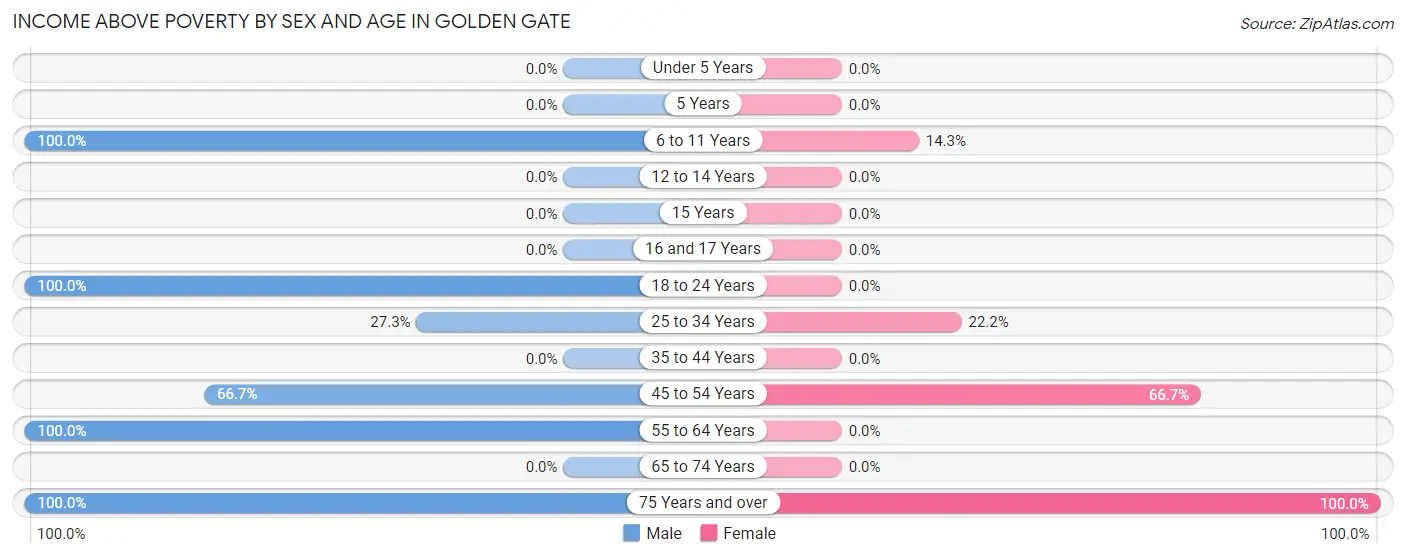
| Age Bracket | Male | Female |
| Under 5 Years | 0 (0.0%) | 0 (0.0%) |
| 5 Years | 0 (0.0%) | 0 (0.0%) |
| 6 to 11 Years | 1 (100.0%) | 1 (14.3%) |
| 12 to 14 Years | 0 (0.0%) | 0 (0.0%) |
| 15 Years | 0 (0.0%) | 0 (0.0%) |
| 16 and 17 Years | 0 (0.0%) | 0 (0.0%) |
| 18 to 24 Years | 2 (100.0%) | 0 (0.0%) |
| 25 to 34 Years | 3 (27.3%) | 2 (22.2%) |
| 35 to 44 Years | 0 (0.0%) | 0 (0.0%) |
| 45 to 54 Years | 2 (66.7%) | 2 (66.7%) |
| 55 to 64 Years | 1 (100.0%) | 0 (0.0%) |
| 65 to 74 Years | 0 (0.0%) | 0 (0.0%) |
| 75 Years and over | 37 (100.0%) | 1 (100.0%) |
| Total | 46 (76.7%) | 6 (20.0%) |
Income Below Poverty Among Married-Couple Families in Golden Gate
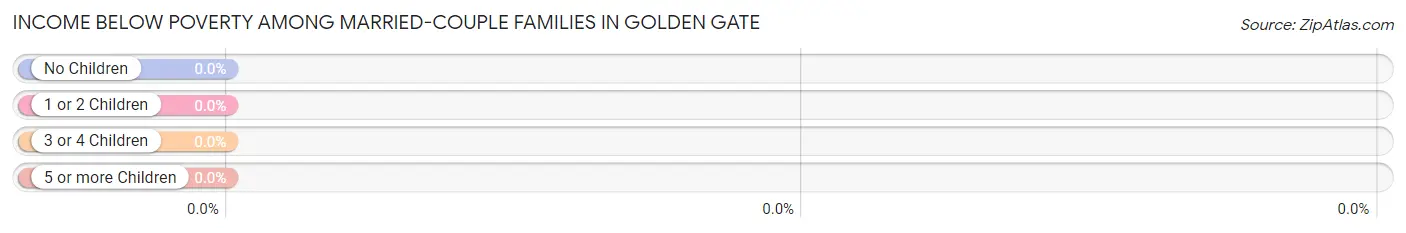
| Children | Above Poverty | Below Poverty |
| No Children | 3 (100.0%) | 0 (0.0%) |
| 1 or 2 Children | 1 (100.0%) | 0 (0.0%) |
| 3 or 4 Children | 0 (0.0%) | 0 (0.0%) |
| 5 or more Children | 0 (0.0%) | 0 (0.0%) |
| Total | 4 (100.0%) | 0 (0.0%) |
Income Below Poverty Among Single-Parent Households in Golden Gate
According to the poverty data in Golden Gate, 100.0% or 8 single-father households and 100.0% or 2 single-mother households are living below the poverty line. Among single-father households, those with 1 or 2 children have the highest poverty rate, with 8 households (100.0%) experiencing poverty. Likewise, among single-mother households, those with no children have the highest poverty rate, with 1 households (100.0%) falling below the poverty line.
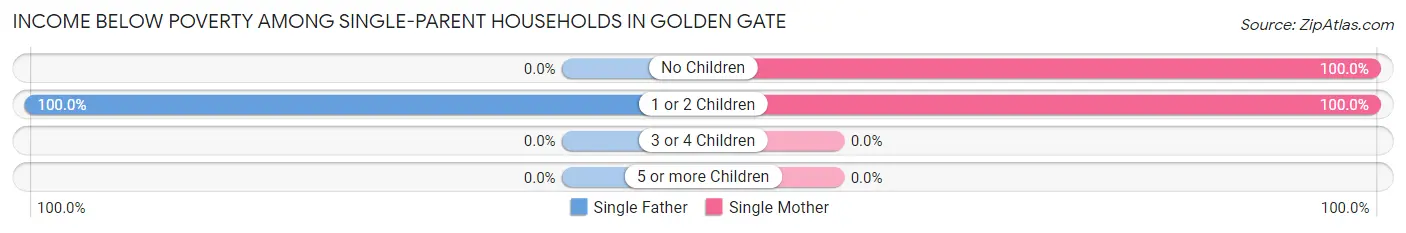
| Children | Single Father | Single Mother |
| No Children | 0 (0.0%) | 1 (100.0%) |
| 1 or 2 Children | 8 (100.0%) | 1 (100.0%) |
| 3 or 4 Children | 0 (0.0%) | 0 (0.0%) |
| 5 or more Children | 0 (0.0%) | 0 (0.0%) |
| Total | 8 (100.0%) | 2 (100.0%) |
Income Below Poverty Among Married-Couple vs Single-Parent Households in Golden Gate
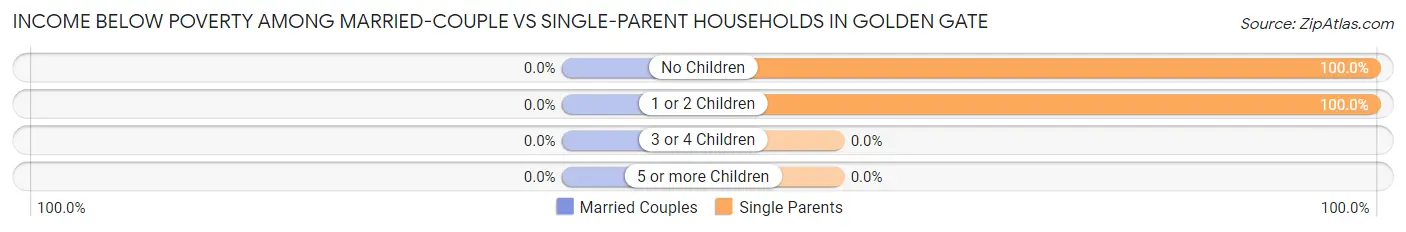
| Children | Married-Couple Families | Single-Parent Households |
| No Children | 0 (0.0%) | 1 (100.0%) |
| 1 or 2 Children | 0 (0.0%) | 9 (100.0%) |
| 3 or 4 Children | 0 (0.0%) | 0 (0.0%) |
| 5 or more Children | 0 (0.0%) | 0 (0.0%) |
| Total | 0 (0.0%) | 10 (100.0%) |
Race in Golden Gate
The most populous races in Golden Gate are White / Caucasian (83 | 92.2%), and Asian (7 | 7.8%).
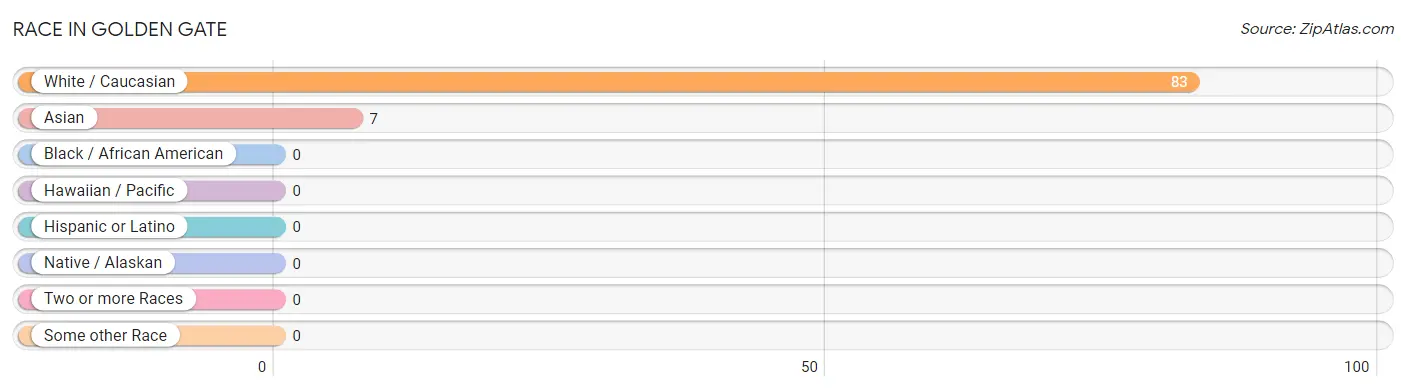
| Race | # Population | % Population |
| Asian | 7 | 7.8% |
| Black / African American | 0 | 0.0% |
| Hawaiian / Pacific | 0 | 0.0% |
| Hispanic or Latino | 0 | 0.0% |
| Native / Alaskan | 0 | 0.0% |
| White / Caucasian | 83 | 92.2% |
| Two or more Races | 0 | 0.0% |
| Some other Race | 0 | 0.0% |
| Total | 90 | 100.0% |
Ancestry in Golden Gate
The most populous ancestries reported in Golden Gate are German (39 | 43.3%), Irish (16 | 17.8%), English (8 | 8.9%), Korean (7 | 7.8%), and American (1 | 1.1%), together accounting for 78.9% of all Golden Gate residents.
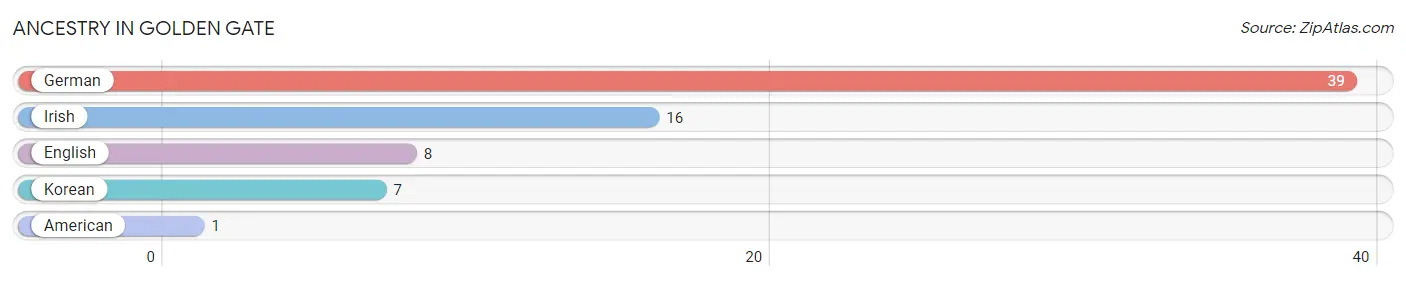
| Ancestry | # Population | % Population |
| American | 1 | 1.1% |
| English | 8 | 8.9% |
| German | 39 | 43.3% |
| Irish | 16 | 17.8% |
| Korean | 7 | 7.8% | View All 5 Rows |
Immigrants in Golden Gate
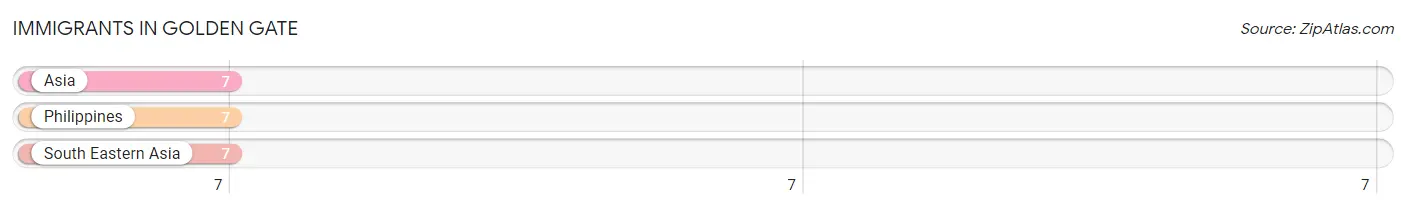
The most numerous immigrant groups reported in Golden Gate came from Asia (7 | 7.8%), Philippines (7 | 7.8%), and South Eastern Asia (7 | 7.8%), together accounting for 23.3% of all Golden Gate residents.
| Immigration Origin | # Population | % Population |
| Asia | 7 | 7.8% |
| Philippines | 7 | 7.8% |
| South Eastern Asia | 7 | 7.8% | View All 3 Rows |
Sex and Age in Golden Gate
Sex and Age in Golden Gate
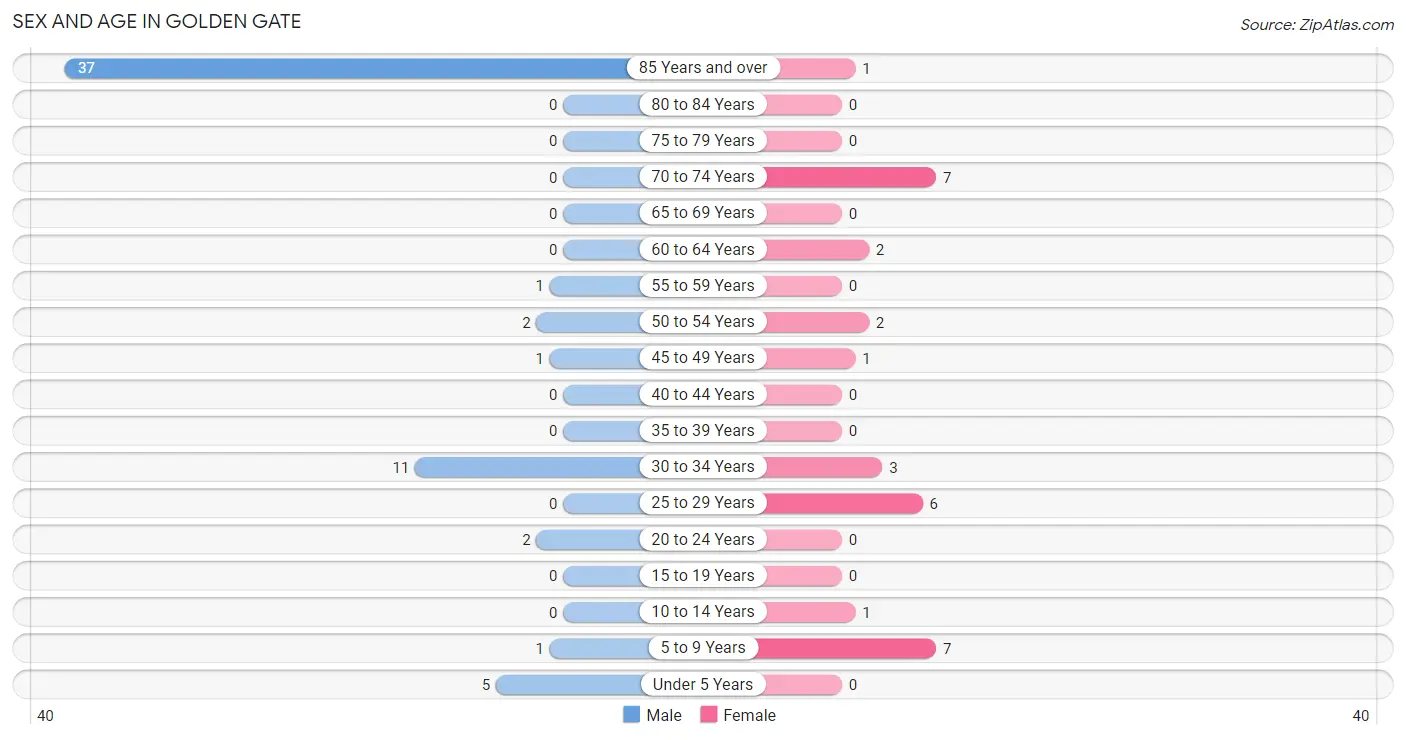
The most populous age groups in Golden Gate are 85 Years and over (37 | 61.7%) for men and 5 to 9 Years (7 | 23.3%) for women.
| Age Bracket | Male | Female |
| Under 5 Years | 5 (8.3%) | 0 (0.0%) |
| 5 to 9 Years | 1 (1.7%) | 7 (23.3%) |
| 10 to 14 Years | 0 (0.0%) | 1 (3.3%) |
| 15 to 19 Years | 0 (0.0%) | 0 (0.0%) |
| 20 to 24 Years | 2 (3.3%) | 0 (0.0%) |
| 25 to 29 Years | 0 (0.0%) | 6 (20.0%) |
| 30 to 34 Years | 11 (18.3%) | 3 (10.0%) |
| 35 to 39 Years | 0 (0.0%) | 0 (0.0%) |
| 40 to 44 Years | 0 (0.0%) | 0 (0.0%) |
| 45 to 49 Years | 1 (1.7%) | 1 (3.3%) |
| 50 to 54 Years | 2 (3.3%) | 2 (6.7%) |
| 55 to 59 Years | 1 (1.7%) | 0 (0.0%) |
| 60 to 64 Years | 0 (0.0%) | 2 (6.7%) |
| 65 to 69 Years | 0 (0.0%) | 0 (0.0%) |
| 70 to 74 Years | 0 (0.0%) | 7 (23.3%) |
| 75 to 79 Years | 0 (0.0%) | 0 (0.0%) |
| 80 to 84 Years | 0 (0.0%) | 0 (0.0%) |
| 85 Years and over | 37 (61.7%) | 1 (3.3%) |
| Total | 60 (100.0%) | 30 (100.0%) |
Families and Households in Golden Gate
Median Family Size in Golden Gate
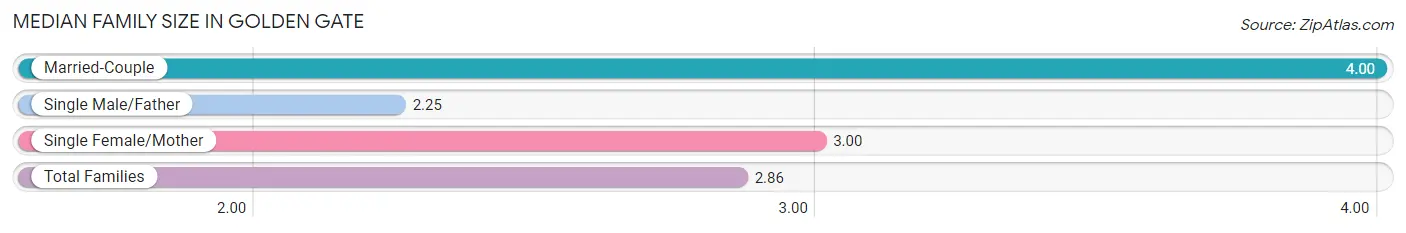
The median family size in Golden Gate is 2.86 persons per family, with married-couple families (4 | 28.6%) accounting for the largest median family size of 4 persons per family. On the other hand, single male/father families (8 | 57.1%) represent the smallest median family size with 2.25 persons per family.
| Family Type | # Families | Family Size |
| Married-Couple | 4 (28.6%) | 4.00 |
| Single Male/Father | 8 (57.1%) | 2.25 |
| Single Female/Mother | 2 (14.3%) | 3.00 |
| Total Families | 14 (100.0%) | 2.86 |
Median Household Size in Golden Gate
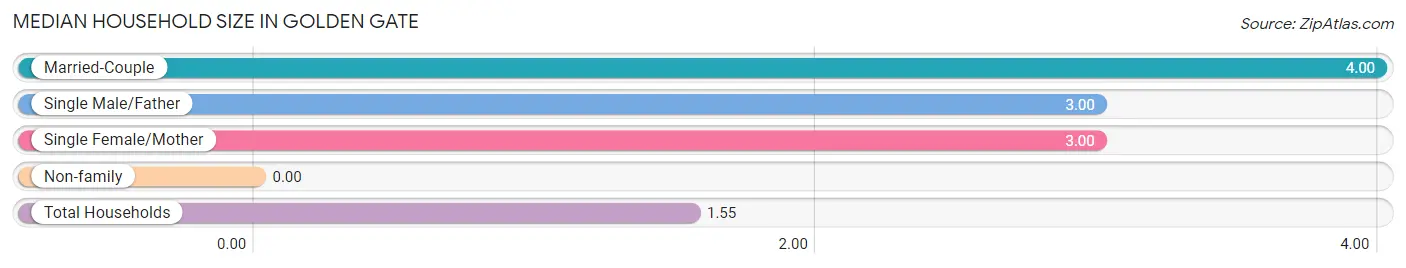
| Household Type | # Households | Household Size |
| Married-Couple | 4 (6.9%) | 4.00 |
| Single Male/Father | 8 (13.8%) | 3.00 |
| Single Female/Mother | 2 (3.5%) | 3.00 |
| Non-family | 44 (75.9%) | - |
| Total Households | 58 (100.0%) | 1.55 |
Household Size by Marriage Status in Golden Gate
Out of a total of 58 households in Golden Gate, 14 (24.1%) are family households, while 44 (75.9%) are nonfamily households. The most numerous type of family households are 4-person households, comprising 10, and the most common type of nonfamily households are 1-person households, comprising 44.
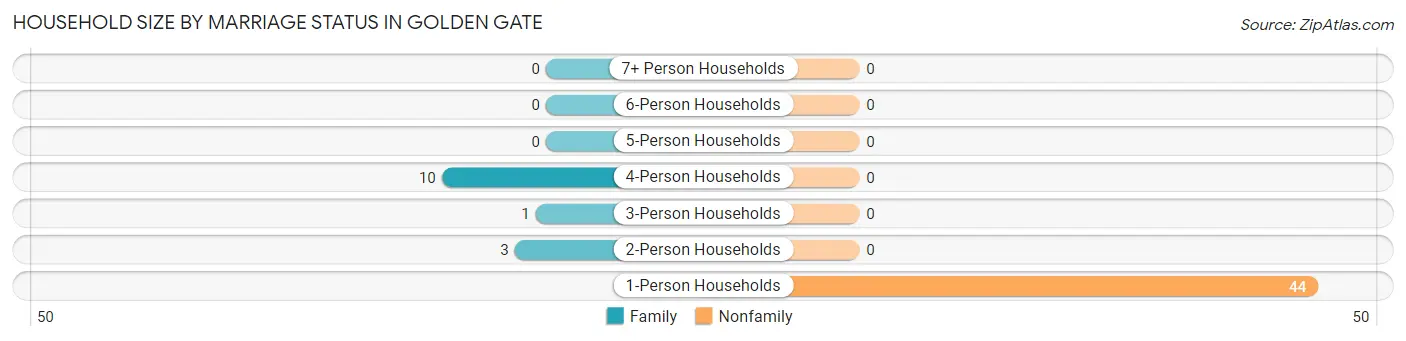
| Household Size | Family Households | Nonfamily Households |
| 1-Person Households | - | 44 (75.9%) |
| 2-Person Households | 3 (5.2%) | 0 (0.0%) |
| 3-Person Households | 1 (1.7%) | 0 (0.0%) |
| 4-Person Households | 10 (17.2%) | 0 (0.0%) |
| 5-Person Households | 0 (0.0%) | 0 (0.0%) |
| 6-Person Households | 0 (0.0%) | 0 (0.0%) |
| 7+ Person Households | 0 (0.0%) | 0 (0.0%) |
| Total | 14 (24.1%) | 44 (75.9%) |
Female Fertility in Golden Gate
Fertility by Age in Golden Gate
| Age Bracket | Women with Births | Births / 1,000 Women |
| 15 to 19 years | 0 (0.0%) | 0.0 |
| 20 to 34 years | 0 (0.0%) | 0.0 |
| 35 to 50 years | 0 (0.0%) | 0.0 |
| Total | 0 (0.0%) | 0.0 |
Fertility by Age by Marriage Status in Golden Gate
| Age Bracket | Married | Unmarried |
| 15 to 19 years | 0 (0.0%) | 0 (0.0%) |
| 20 to 34 years | 0 (0.0%) | 0 (0.0%) |
| 35 to 50 years | 0 (0.0%) | 0 (0.0%) |
| Total | 0 (0.0%) | 0 (0.0%) |
Fertility by Education in Golden Gate
| Educational Attainment | Women with Births | Births / 1,000 Women |
| Less than High School | 0 (0.0%) | 0.0 |
| High School Diploma | 0 (0.0%) | 0.0 |
| College or Associate's Degree | 0 (0.0%) | 0.0 |
| Bachelor's Degree | 0 (0.0%) | 0.0 |
| Graduate Degree | 0 (0.0%) | 0.0 |
| Total | 0 (0.0%) | 0.0 |
Fertility by Education by Marriage Status in Golden Gate
| Educational Attainment | Married | Unmarried |
| Less than High School | 0 (0.0%) | 0 (0.0%) |
| High School Diploma | 0 (0.0%) | 0 (0.0%) |
| College or Associate's Degree | 0 (0.0%) | 0 (0.0%) |
| Bachelor's Degree | 0 (0.0%) | 0 (0.0%) |
| Graduate Degree | 0 (0.0%) | 0 (0.0%) |
| Total | 0 (0.0%) | 0 (0.0%) |
Employment Characteristics in Golden Gate
Employment by Class of Employer in Golden Gate
Among the 19 employed individuals in Golden Gate, private company employees (9 | 47.4%), self-employed (not incorporated) (8 | 42.1%), and not-for-profit organizations (1 | 5.3%) make up the most common classes of employment.
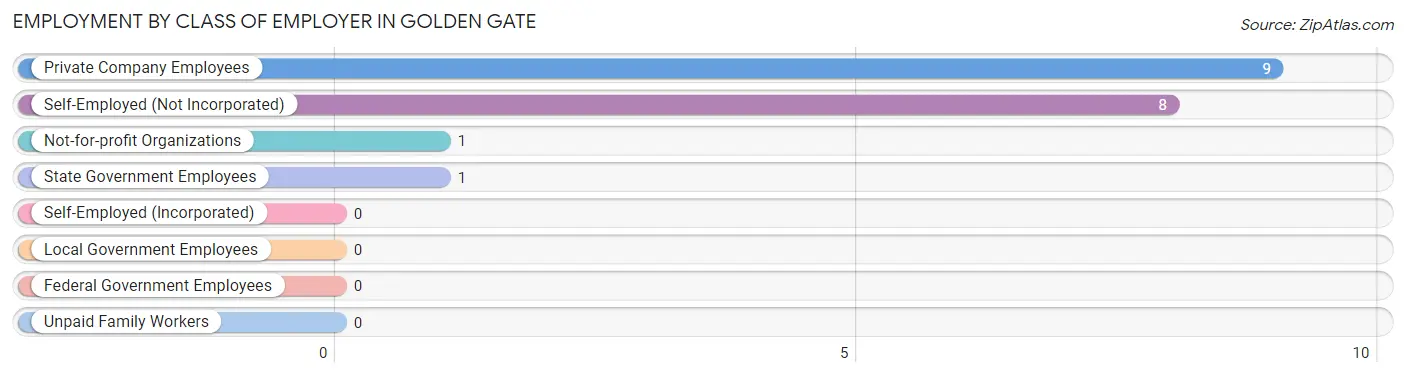
| Employer Class | # Employees | % Employees |
| Private Company Employees | 9 | 47.4% |
| Self-Employed (Incorporated) | 0 | 0.0% |
| Self-Employed (Not Incorporated) | 8 | 42.1% |
| Not-for-profit Organizations | 1 | 5.3% |
| Local Government Employees | 0 | 0.0% |
| State Government Employees | 1 | 5.3% |
| Federal Government Employees | 0 | 0.0% |
| Unpaid Family Workers | 0 | 0.0% |
| Total | 19 | 100.0% |
Employment Status by Age in Golden Gate
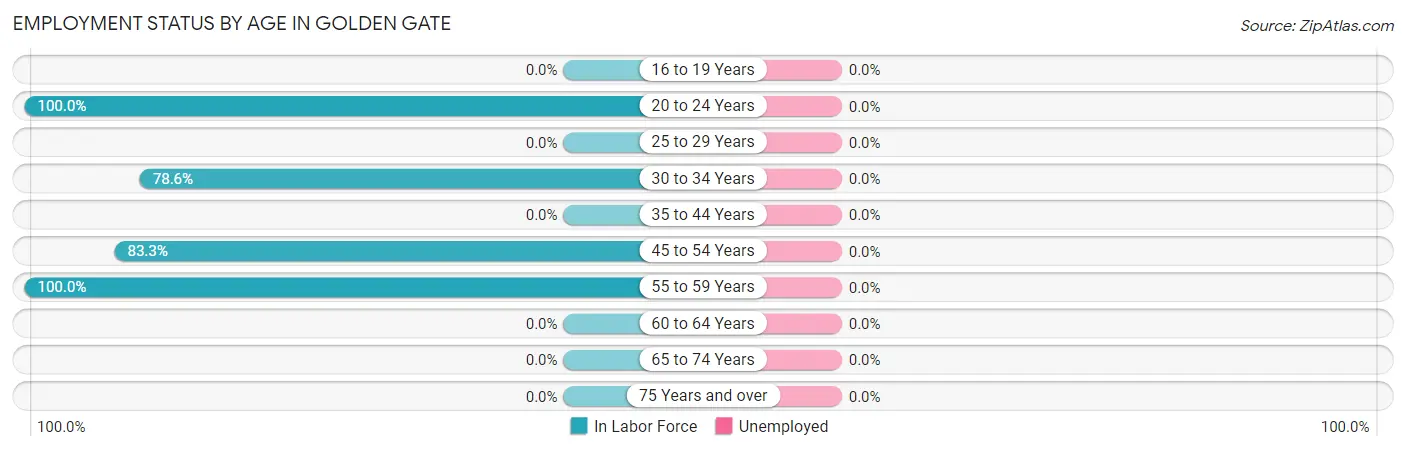
| Age Bracket | In Labor Force | Unemployed |
| 16 to 19 Years | 0 (0.0%) | 0 (0.0%) |
| 20 to 24 Years | 2 (100.0%) | 0 (0.0%) |
| 25 to 29 Years | 0 (0.0%) | 0 (0.0%) |
| 30 to 34 Years | 11 (78.6%) | 0 (0.0%) |
| 35 to 44 Years | 0 (0.0%) | 0 (0.0%) |
| 45 to 54 Years | 5 (83.3%) | 0 (0.0%) |
| 55 to 59 Years | 1 (100.0%) | 0 (0.0%) |
| 60 to 64 Years | 0 (0.0%) | 0 (0.0%) |
| 65 to 74 Years | 0 (0.0%) | 0 (0.0%) |
| 75 Years and over | 0 (0.0%) | 0 (0.0%) |
| Total | 19 (25.0%) | 0 (0.0%) |
Employment Status by Educational Attainment in Golden Gate
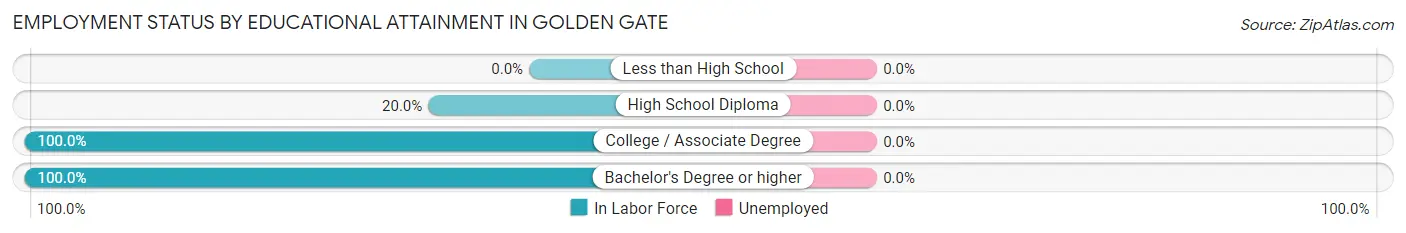
| Educational Attainment | In Labor Force | Unemployed |
| Less than High School | 0 (0.0%) | 0 (0.0%) |
| High School Diploma | 3 (20.0%) | 0 (0.0%) |
| College / Associate Degree | 12 (100.0%) | 0 (0.0%) |
| Bachelor's Degree or higher | 2 (100.0%) | 0 (0.0%) |
| Total | 17 (58.6%) | 0 (0.0%) |
Employment Occupations by Sex in Golden Gate
Management, Business, Science and Arts Occupations
The most common Management, Business, Science and Arts occupations in Golden Gate are Management (1 | 5.3%), Health Diagnosing & Treating (1 | 5.3%), and Health Technologists (1 | 5.3%).
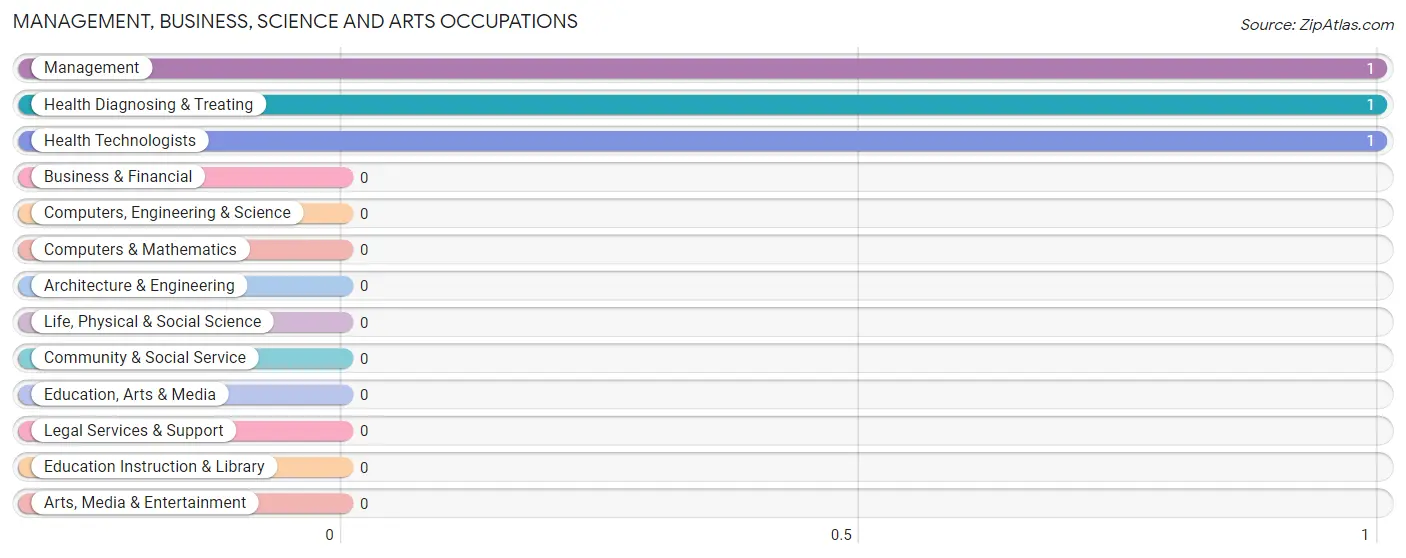
Management, Business, Science and Arts Occupations by Sex
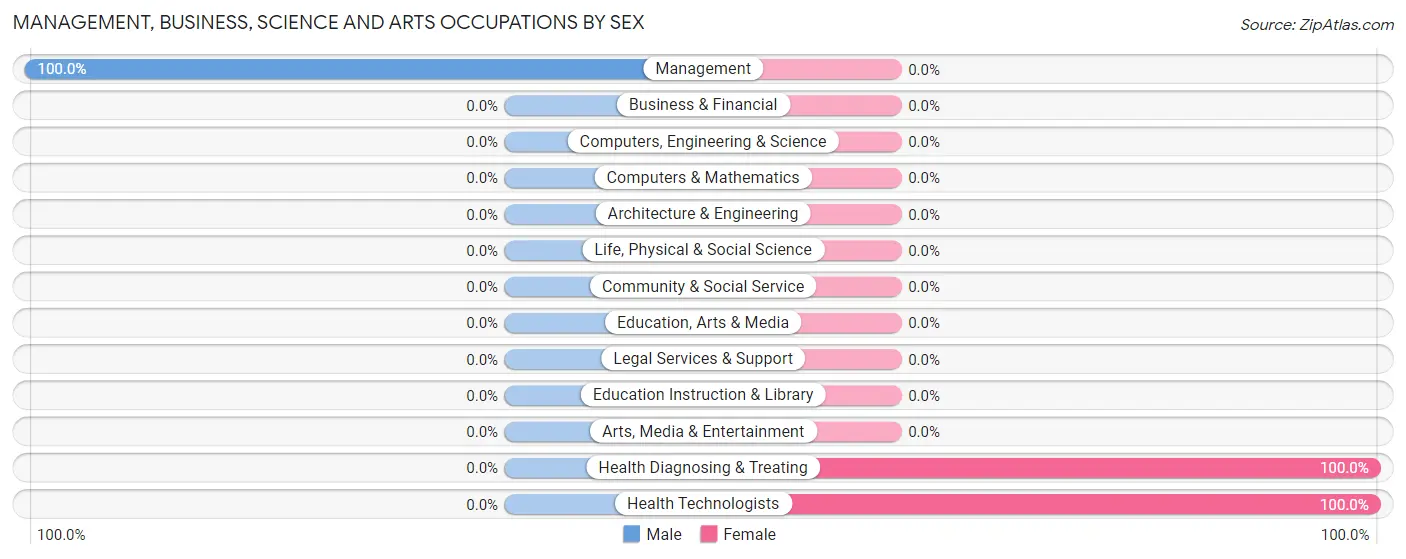
| Occupation | Male | Female |
| Management | 1 (100.0%) | 0 (0.0%) |
| Business & Financial | 0 (0.0%) | 0 (0.0%) |
| Computers, Engineering & Science | 0 (0.0%) | 0 (0.0%) |
| Computers & Mathematics | 0 (0.0%) | 0 (0.0%) |
| Architecture & Engineering | 0 (0.0%) | 0 (0.0%) |
| Life, Physical & Social Science | 0 (0.0%) | 0 (0.0%) |
| Community & Social Service | 0 (0.0%) | 0 (0.0%) |
| Education, Arts & Media | 0 (0.0%) | 0 (0.0%) |
| Legal Services & Support | 0 (0.0%) | 0 (0.0%) |
| Education Instruction & Library | 0 (0.0%) | 0 (0.0%) |
| Arts, Media & Entertainment | 0 (0.0%) | 0 (0.0%) |
| Health Diagnosing & Treating | 0 (0.0%) | 1 (100.0%) |
| Health Technologists | 0 (0.0%) | 1 (100.0%) |
| Total (Category) | 1 (50.0%) | 1 (50.0%) |
| Total (Overall) | 14 (73.7%) | 5 (26.3%) |
Services Occupations
The most common Services occupations in Golden Gate are Cleaning & Maintenance (10 | 52.6%), and Healthcare Support (1 | 5.3%).
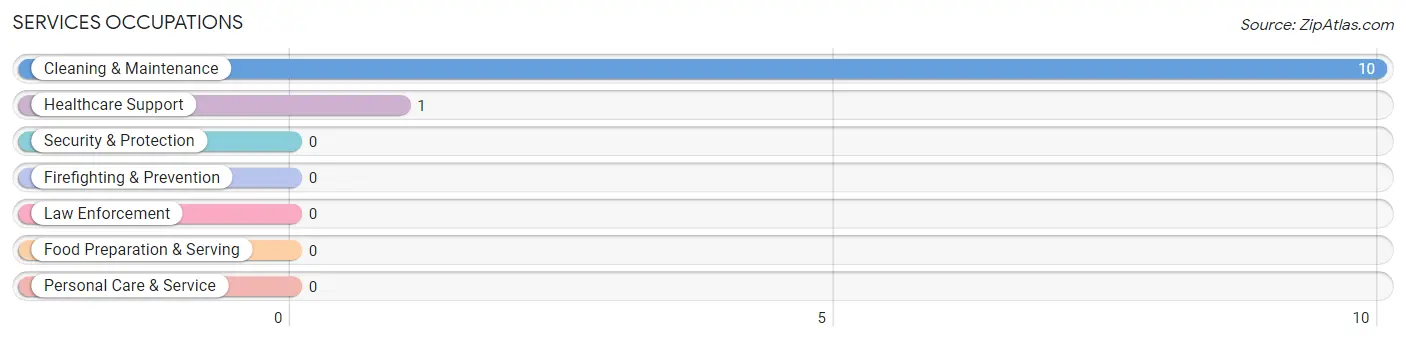
Services Occupations by Sex
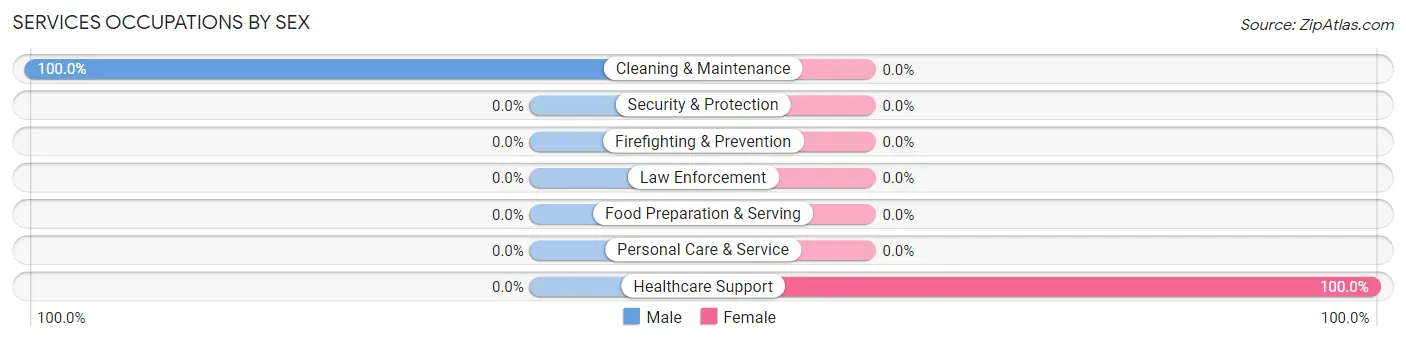
| Occupation | Male | Female |
| Healthcare Support | 0 (0.0%) | 1 (100.0%) |
| Security & Protection | 0 (0.0%) | 0 (0.0%) |
| Firefighting & Prevention | 0 (0.0%) | 0 (0.0%) |
| Law Enforcement | 0 (0.0%) | 0 (0.0%) |
| Food Preparation & Serving | 0 (0.0%) | 0 (0.0%) |
| Cleaning & Maintenance | 10 (100.0%) | 0 (0.0%) |
| Personal Care & Service | 0 (0.0%) | 0 (0.0%) |
| Total (Category) | 10 (90.9%) | 1 (9.1%) |
| Total (Overall) | 14 (73.7%) | 5 (26.3%) |
Sales and Office Occupations
The most common Sales and Office occupations in Golden Gate are , and Office & Administration (3 | 15.8%).
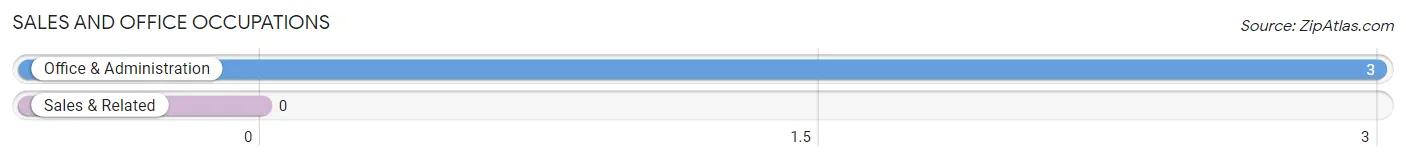
Sales and Office Occupations by Sex

| Occupation | Male | Female |
| Sales & Related | 0 (0.0%) | 0 (0.0%) |
| Office & Administration | 0 (0.0%) | 3 (100.0%) |
| Total (Category) | 0 (0.0%) | 3 (100.0%) |
| Total (Overall) | 14 (73.7%) | 5 (26.3%) |
Natural Resources, Construction and Maintenance Occupations
Natural Resources, Construction and Maintenance Occupations by Sex
| Occupation | Male | Female |
| Farming, Fishing & Forestry | 0 (0.0%) | 0 (0.0%) |
| Construction & Extraction | 0 (0.0%) | 0 (0.0%) |
| Installation, Maintenance & Repair | 0 (0.0%) | 0 (0.0%) |
| Total (Category) | 0 (0.0%) | 0 (0.0%) |
| Total (Overall) | 14 (73.7%) | 5 (26.3%) |
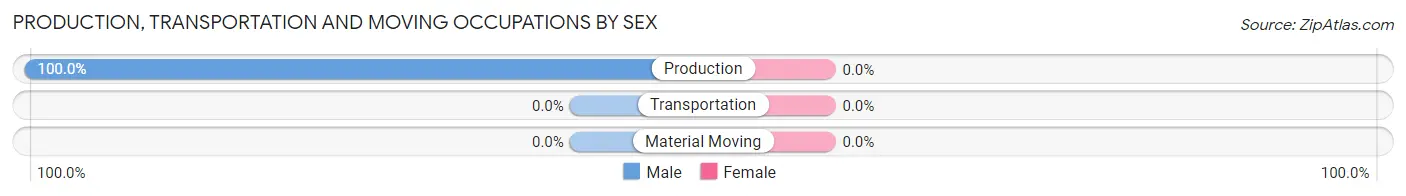
Production, Transportation and Moving Occupations
The most common Production, Transportation and Moving occupations in Golden Gate are , and Production (3 | 15.8%).
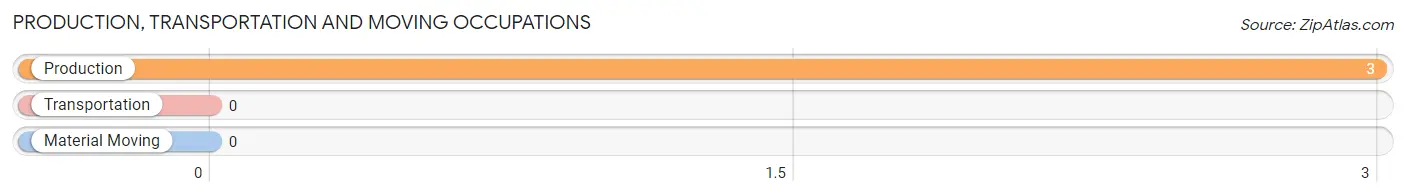
Production, Transportation and Moving Occupations by Sex
| Occupation | Male | Female |
| Production | 3 (100.0%) | 0 (0.0%) |
| Transportation | 0 (0.0%) | 0 (0.0%) |
| Material Moving | 0 (0.0%) | 0 (0.0%) |
| Total (Category) | 3 (100.0%) | 0 (0.0%) |
| Total (Overall) | 14 (73.7%) | 5 (26.3%) |
Employment Industries by Sex in Golden Gate
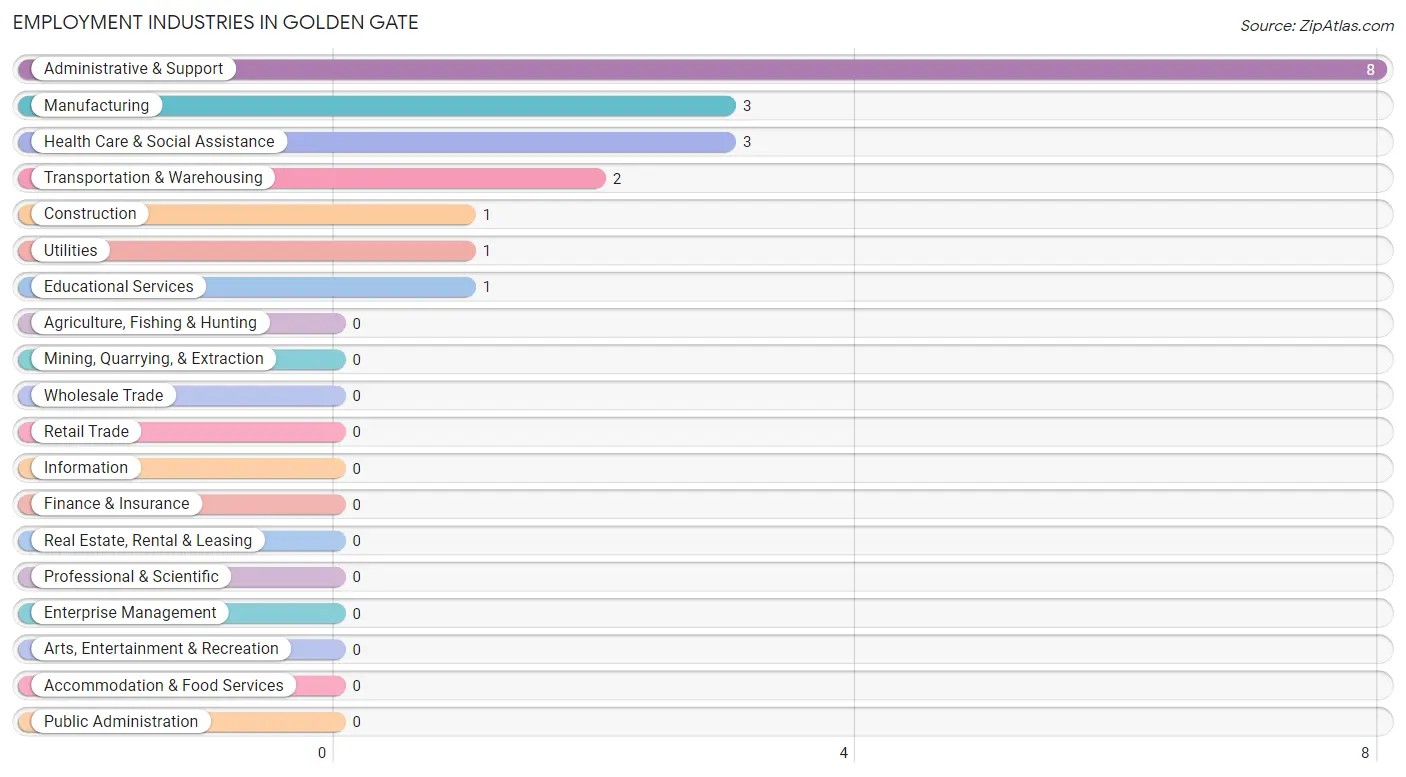
Employment Industries in Golden Gate
The major employment industries in Golden Gate include Administrative & Support (8 | 42.1%), Manufacturing (3 | 15.8%), Health Care & Social Assistance (3 | 15.8%), Transportation & Warehousing (2 | 10.5%), and Construction (1 | 5.3%).
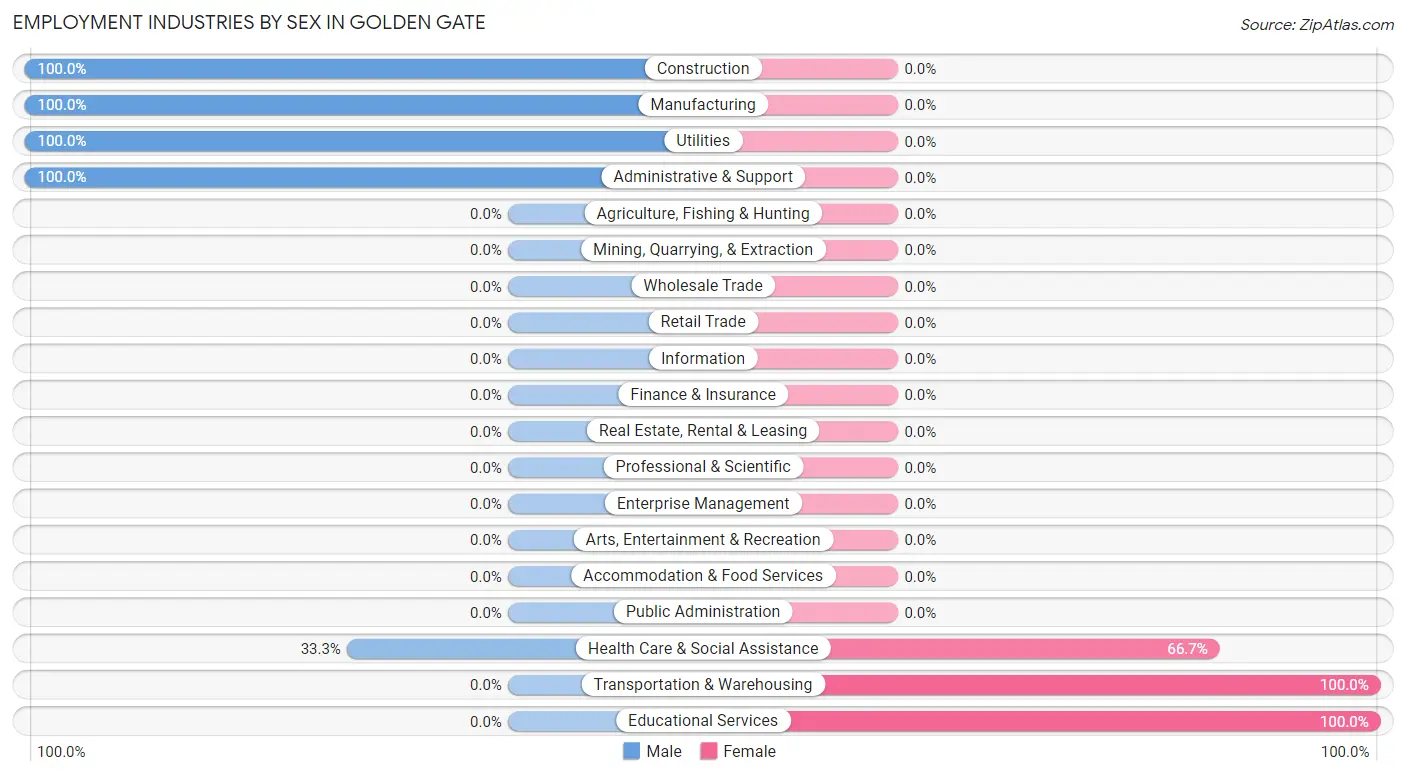
Employment Industries by Sex in Golden Gate
The Golden Gate industries that see more men than women are Construction (100.0%), Manufacturing (100.0%), and Utilities (100.0%), whereas the industries that tend to have a higher number of women are Transportation & Warehousing (100.0%), Educational Services (100.0%), and Health Care & Social Assistance (66.7%).
| Industry | Male | Female |
| Agriculture, Fishing & Hunting | 0 (0.0%) | 0 (0.0%) |
| Mining, Quarrying, & Extraction | 0 (0.0%) | 0 (0.0%) |
| Construction | 1 (100.0%) | 0 (0.0%) |
| Manufacturing | 3 (100.0%) | 0 (0.0%) |
| Wholesale Trade | 0 (0.0%) | 0 (0.0%) |
| Retail Trade | 0 (0.0%) | 0 (0.0%) |
| Transportation & Warehousing | 0 (0.0%) | 2 (100.0%) |
| Utilities | 1 (100.0%) | 0 (0.0%) |
| Information | 0 (0.0%) | 0 (0.0%) |
| Finance & Insurance | 0 (0.0%) | 0 (0.0%) |
| Real Estate, Rental & Leasing | 0 (0.0%) | 0 (0.0%) |
| Professional & Scientific | 0 (0.0%) | 0 (0.0%) |
| Enterprise Management | 0 (0.0%) | 0 (0.0%) |
| Administrative & Support | 8 (100.0%) | 0 (0.0%) |
| Educational Services | 0 (0.0%) | 1 (100.0%) |
| Health Care & Social Assistance | 1 (33.3%) | 2 (66.7%) |
| Arts, Entertainment & Recreation | 0 (0.0%) | 0 (0.0%) |
| Accommodation & Food Services | 0 (0.0%) | 0 (0.0%) |
| Public Administration | 0 (0.0%) | 0 (0.0%) |
| Total | 14 (73.7%) | 5 (26.3%) |
Education in Golden Gate
School Enrollment in Golden Gate
The most common levels of schooling among the 15 students in Golden Gate are elementary school (8 | 53.3%), college / undergraduate (6 | 40.0%), and middle school (1 | 6.7%).
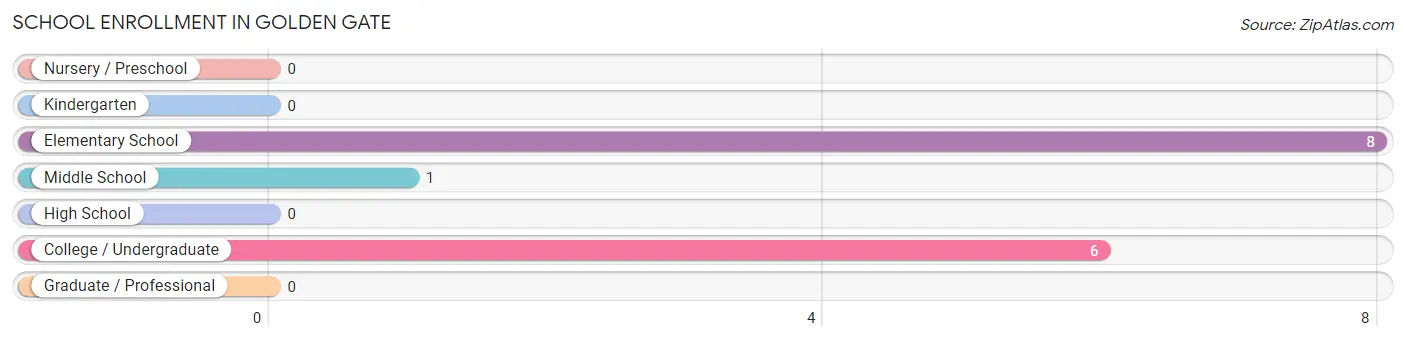
| School Level | # Students | % Students |
| Nursery / Preschool | 0 | 0.0% |
| Kindergarten | 0 | 0.0% |
| Elementary School | 8 | 53.3% |
| Middle School | 1 | 6.7% |
| High School | 0 | 0.0% |
| College / Undergraduate | 6 | 40.0% |
| Graduate / Professional | 0 | 0.0% |
| Total | 15 | 100.0% |
School Enrollment by Age by Funding Source in Golden Gate
Out of a total of 15 students who are enrolled in schools in Golden Gate, 1 (6.7%) attend a private institution, while the remaining 14 (93.3%) are enrolled in public schools. The age group of 5 to 9 year old has the highest likelihood of being enrolled in private schools, with 1 (12.5% in the age bracket) enrolled. Conversely, the age group of 10 to 14 year olds has the lowest likelihood of being enrolled in a private school, with 1 (100.0% in the age bracket) attending a public institution.
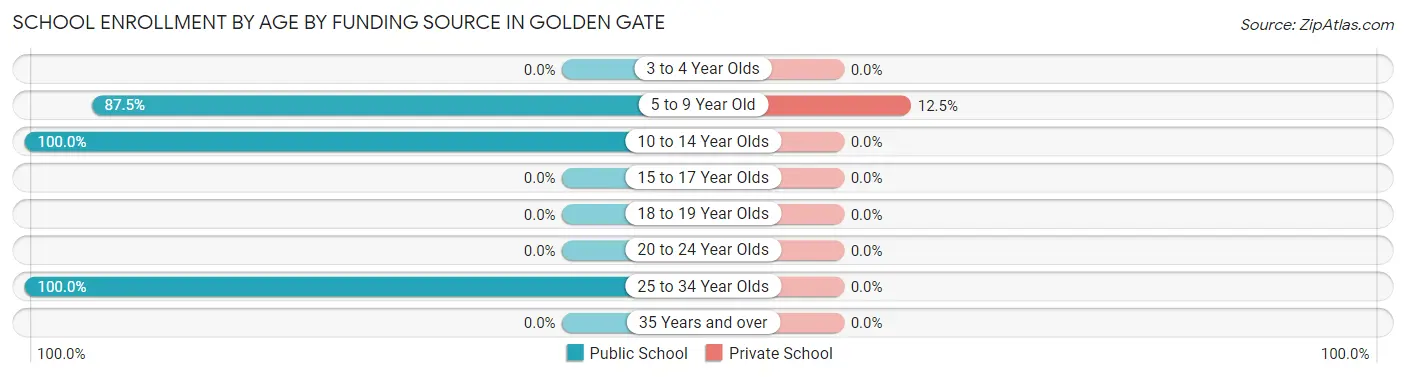
| Age Bracket | Public School | Private School |
| 3 to 4 Year Olds | 0 (0.0%) | 0 (0.0%) |
| 5 to 9 Year Old | 7 (87.5%) | 1 (12.5%) |
| 10 to 14 Year Olds | 1 (100.0%) | 0 (0.0%) |
| 15 to 17 Year Olds | 0 (0.0%) | 0 (0.0%) |
| 18 to 19 Year Olds | 0 (0.0%) | 0 (0.0%) |
| 20 to 24 Year Olds | 0 (0.0%) | 0 (0.0%) |
| 25 to 34 Year Olds | 6 (100.0%) | 0 (0.0%) |
| 35 Years and over | 0 (0.0%) | 0 (0.0%) |
| Total | 14 (93.3%) | 1 (6.7%) |
Educational Attainment by Field of Study in Golden Gate
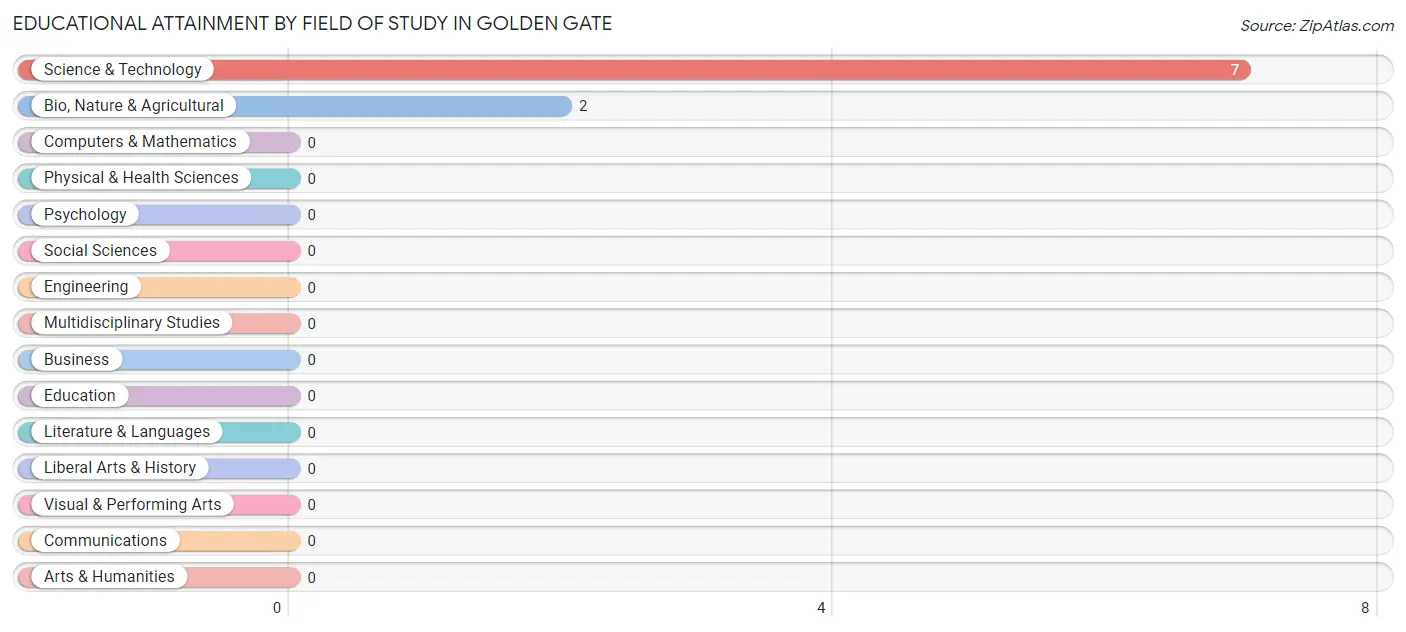
Science & technology (7 | 77.8%), and bio, nature & agricultural (2 | 22.2%) are the most common fields of study among 9 individuals in Golden Gate who have obtained a bachelor's degree or higher.
| Field of Study | # Graduates | % Graduates |
| Computers & Mathematics | 0 | 0.0% |
| Bio, Nature & Agricultural | 2 | 22.2% |
| Physical & Health Sciences | 0 | 0.0% |
| Psychology | 0 | 0.0% |
| Social Sciences | 0 | 0.0% |
| Engineering | 0 | 0.0% |
| Multidisciplinary Studies | 0 | 0.0% |
| Science & Technology | 7 | 77.8% |
| Business | 0 | 0.0% |
| Education | 0 | 0.0% |
| Literature & Languages | 0 | 0.0% |
| Liberal Arts & History | 0 | 0.0% |
| Visual & Performing Arts | 0 | 0.0% |
| Communications | 0 | 0.0% |
| Arts & Humanities | 0 | 0.0% |
| Total | 9 | 100.0% |
Transportation & Commute in Golden Gate
Vehicle Availability by Sex in Golden Gate
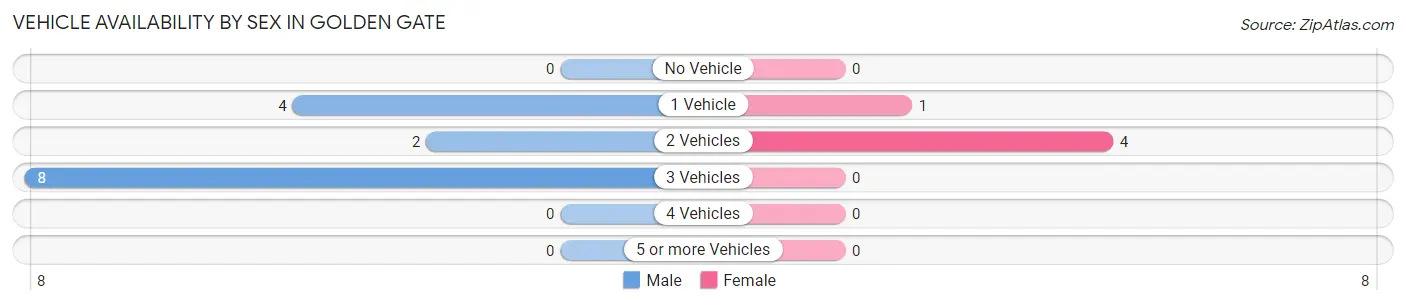
The most prevalent vehicle ownership categories in Golden Gate are males with 3 vehicles (8, accounting for 57.1%) and females with 3 vehicles (0, making up 160.0%).
| Vehicles Available | Male | Female |
| No Vehicle | 0 (0.0%) | 0 (0.0%) |
| 1 Vehicle | 4 (28.6%) | 1 (20.0%) |
| 2 Vehicles | 2 (14.3%) | 4 (80.0%) |
| 3 Vehicles | 8 (57.1%) | 0 (0.0%) |
| 4 Vehicles | 0 (0.0%) | 0 (0.0%) |
| 5 or more Vehicles | 0 (0.0%) | 0 (0.0%) |
| Total | 14 (100.0%) | 5 (100.0%) |
Commute Time in Golden Gate
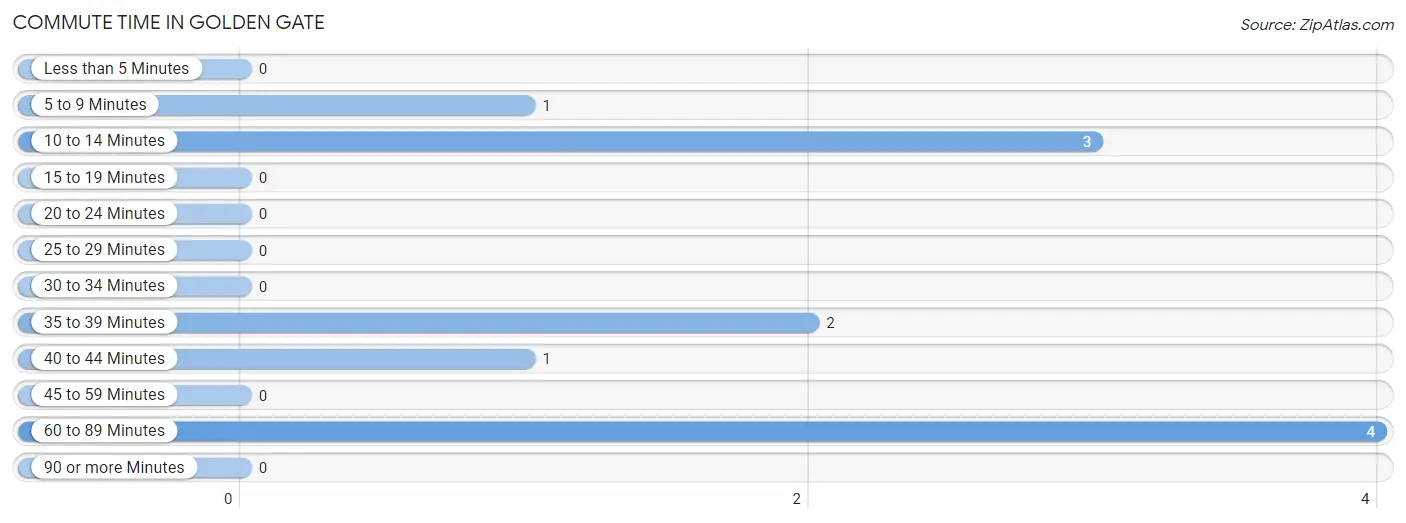
The most frequently occuring commute durations in Golden Gate are 60 to 89 minutes (4 commuters, 36.4%), 10 to 14 minutes (3 commuters, 27.3%), and 35 to 39 minutes (2 commuters, 18.2%).
| Commute Time | # Commuters | % Commuters |
| Less than 5 Minutes | 0 | 0.0% |
| 5 to 9 Minutes | 1 | 9.1% |
| 10 to 14 Minutes | 3 | 27.3% |
| 15 to 19 Minutes | 0 | 0.0% |
| 20 to 24 Minutes | 0 | 0.0% |
| 25 to 29 Minutes | 0 | 0.0% |
| 30 to 34 Minutes | 0 | 0.0% |
| 35 to 39 Minutes | 2 | 18.2% |
| 40 to 44 Minutes | 1 | 9.1% |
| 45 to 59 Minutes | 0 | 0.0% |
| 60 to 89 Minutes | 4 | 36.4% |
| 90 or more Minutes | 0 | 0.0% |
Commute Time by Sex in Golden Gate
The most common commute times in Golden Gate are 60 to 89 minutes (2 commuters, 33.3%) for males and 10 to 14 minutes (2 commuters, 40.0%) for females.
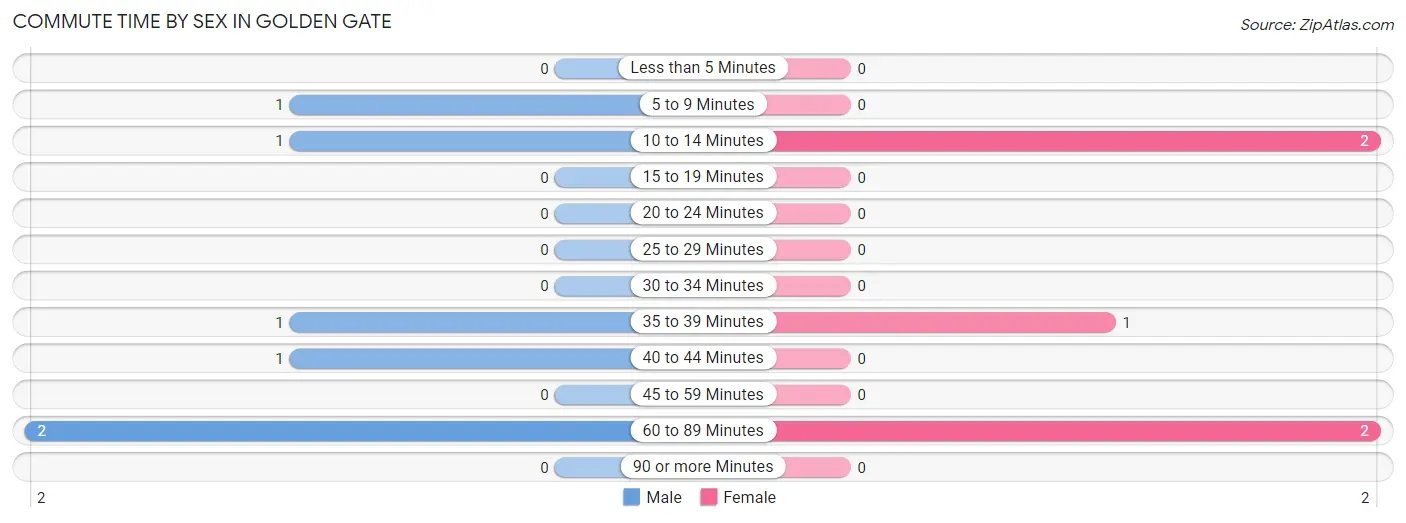
| Commute Time | Male | Female |
| Less than 5 Minutes | 0 (0.0%) | 0 (0.0%) |
| 5 to 9 Minutes | 1 (16.7%) | 0 (0.0%) |
| 10 to 14 Minutes | 1 (16.7%) | 2 (40.0%) |
| 15 to 19 Minutes | 0 (0.0%) | 0 (0.0%) |
| 20 to 24 Minutes | 0 (0.0%) | 0 (0.0%) |
| 25 to 29 Minutes | 0 (0.0%) | 0 (0.0%) |
| 30 to 34 Minutes | 0 (0.0%) | 0 (0.0%) |
| 35 to 39 Minutes | 1 (16.7%) | 1 (20.0%) |
| 40 to 44 Minutes | 1 (16.7%) | 0 (0.0%) |
| 45 to 59 Minutes | 0 (0.0%) | 0 (0.0%) |
| 60 to 89 Minutes | 2 (33.3%) | 2 (40.0%) |
| 90 or more Minutes | 0 (0.0%) | 0 (0.0%) |
Time of Departure to Work by Sex in Golden Gate
The most frequent times of departure to work in Golden Gate are 7:00 AM to 7:29 AM (2, 33.3%) for males and 7:30 AM to 7:59 AM (4, 80.0%) for females.
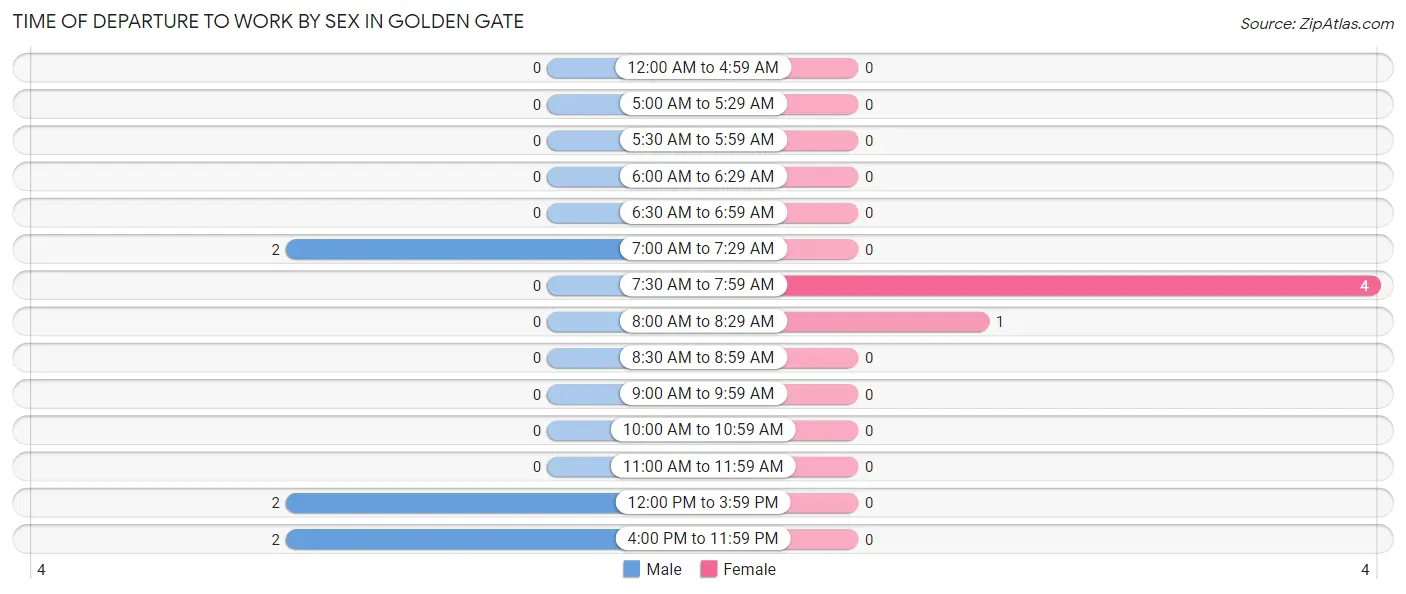
| Time of Departure | Male | Female |
| 12:00 AM to 4:59 AM | 0 (0.0%) | 0 (0.0%) |
| 5:00 AM to 5:29 AM | 0 (0.0%) | 0 (0.0%) |
| 5:30 AM to 5:59 AM | 0 (0.0%) | 0 (0.0%) |
| 6:00 AM to 6:29 AM | 0 (0.0%) | 0 (0.0%) |
| 6:30 AM to 6:59 AM | 0 (0.0%) | 0 (0.0%) |
| 7:00 AM to 7:29 AM | 2 (33.3%) | 0 (0.0%) |
| 7:30 AM to 7:59 AM | 0 (0.0%) | 4 (80.0%) |
| 8:00 AM to 8:29 AM | 0 (0.0%) | 1 (20.0%) |
| 8:30 AM to 8:59 AM | 0 (0.0%) | 0 (0.0%) |
| 9:00 AM to 9:59 AM | 0 (0.0%) | 0 (0.0%) |
| 10:00 AM to 10:59 AM | 0 (0.0%) | 0 (0.0%) |
| 11:00 AM to 11:59 AM | 0 (0.0%) | 0 (0.0%) |
| 12:00 PM to 3:59 PM | 2 (33.3%) | 0 (0.0%) |
| 4:00 PM to 11:59 PM | 2 (33.3%) | 0 (0.0%) |
| Total | 6 (100.0%) | 5 (100.0%) |
Housing Occupancy in Golden Gate
Occupancy by Ownership in Golden Gate
Of the total 58 dwellings in Golden Gate, owner-occupied units account for 22 (37.9%), while renter-occupied units make up 36 (62.1%).
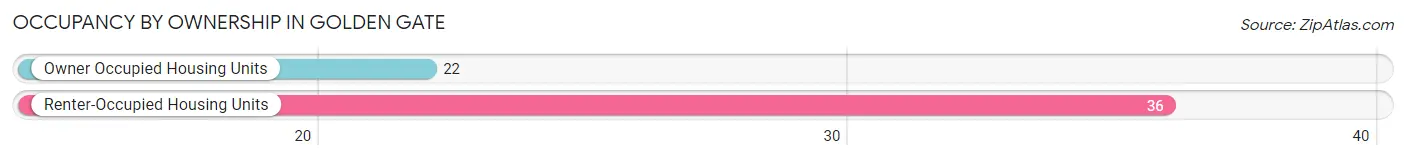
| Occupancy | # Housing Units | % Housing Units |
| Owner Occupied Housing Units | 22 | 37.9% |
| Renter-Occupied Housing Units | 36 | 62.1% |
| Total Occupied Housing Units | 58 | 100.0% |
Occupancy by Household Size in Golden Gate
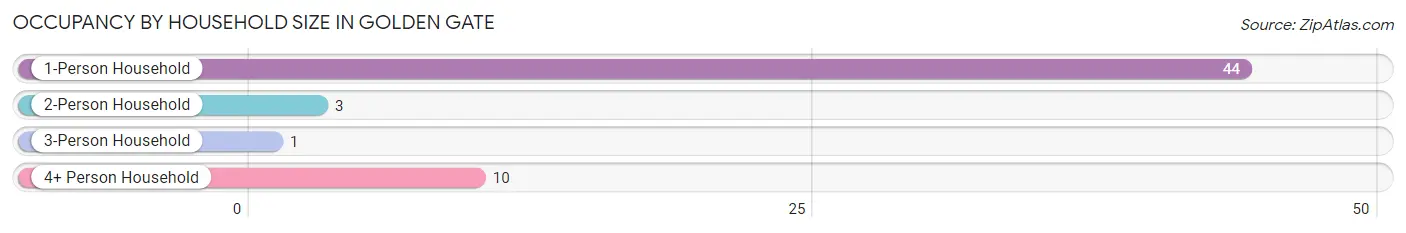
| Household Size | # Housing Units | % Housing Units |
| 1-Person Household | 44 | 75.9% |
| 2-Person Household | 3 | 5.2% |
| 3-Person Household | 1 | 1.7% |
| 4+ Person Household | 10 | 17.2% |
| Total Housing Units | 58 | 100.0% |
Occupancy by Ownership by Household Size in Golden Gate
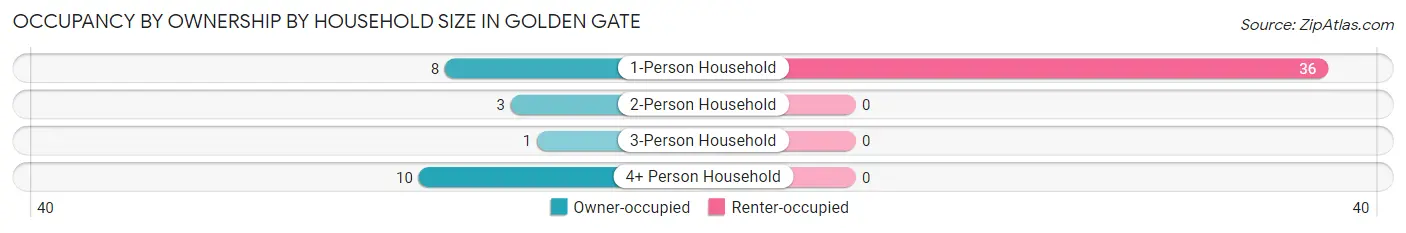
| Household Size | Owner-occupied | Renter-occupied |
| 1-Person Household | 8 (18.2%) | 36 (81.8%) |
| 2-Person Household | 3 (100.0%) | 0 (0.0%) |
| 3-Person Household | 1 (100.0%) | 0 (0.0%) |
| 4+ Person Household | 10 (100.0%) | 0 (0.0%) |
| Total Housing Units | 22 (37.9%) | 36 (62.1%) |
Occupancy by Educational Attainment in Golden Gate
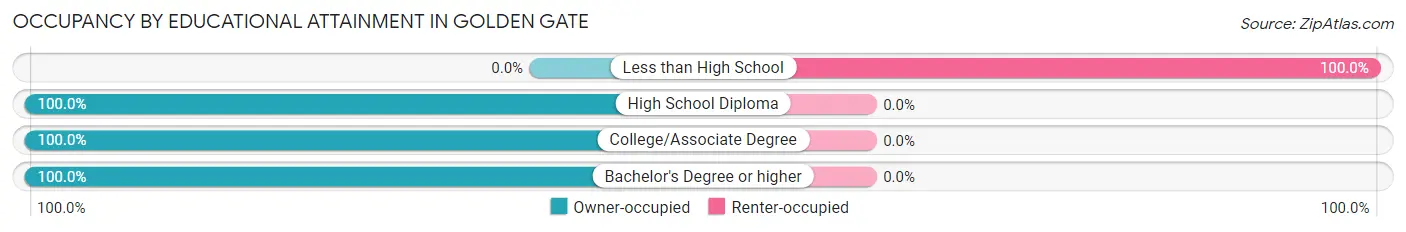
| Household Size | Owner-occupied | Renter-occupied |
| Less than High School | 0 (0.0%) | 36 (100.0%) |
| High School Diploma | 5 (100.0%) | 0 (0.0%) |
| College/Associate Degree | 10 (100.0%) | 0 (0.0%) |
| Bachelor's Degree or higher | 7 (100.0%) | 0 (0.0%) |
Occupancy by Age of Householder in Golden Gate
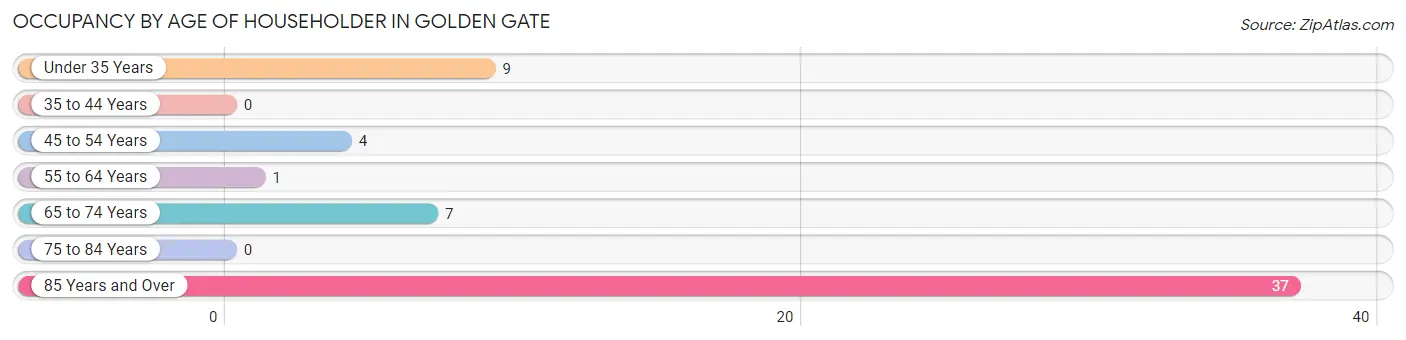
| Age Bracket | # Households | % Households |
| Under 35 Years | 9 | 15.5% |
| 35 to 44 Years | 0 | 0.0% |
| 45 to 54 Years | 4 | 6.9% |
| 55 to 64 Years | 1 | 1.7% |
| 65 to 74 Years | 7 | 12.1% |
| 75 to 84 Years | 0 | 0.0% |
| 85 Years and Over | 37 | 63.8% |
| Total | 58 | 100.0% |
Housing Finances in Golden Gate
Median Income by Occupancy in Golden Gate
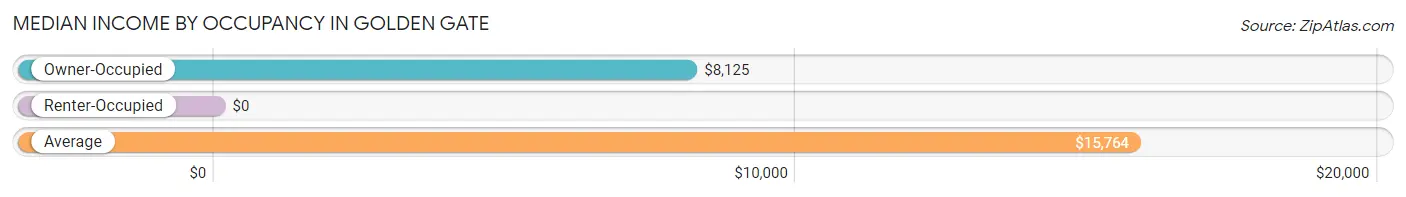
| Occupancy Type | # Households | Median Income |
| Owner-Occupied | 22 (37.9%) | $8,125 |
| Renter-Occupied | 36 (62.1%) | $0 |
| Average | 58 (100.0%) | $15,764 |
Occupancy by Householder Income Bracket in Golden Gate
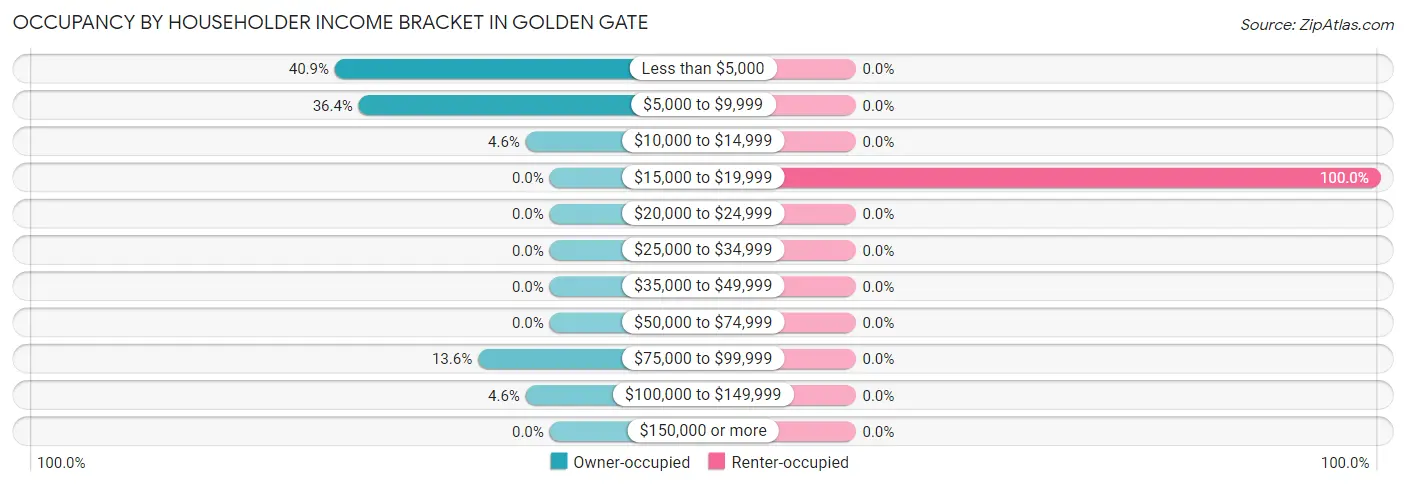
| Income Bracket | Owner-occupied | Renter-occupied |
| Less than $5,000 | 9 (40.9%) | 0 (0.0%) |
| $5,000 to $9,999 | 8 (36.4%) | 0 (0.0%) |
| $10,000 to $14,999 | 1 (4.5%) | 0 (0.0%) |
| $15,000 to $19,999 | 0 (0.0%) | 36 (100.0%) |
| $20,000 to $24,999 | 0 (0.0%) | 0 (0.0%) |
| $25,000 to $34,999 | 0 (0.0%) | 0 (0.0%) |
| $35,000 to $49,999 | 0 (0.0%) | 0 (0.0%) |
| $50,000 to $74,999 | 0 (0.0%) | 0 (0.0%) |
| $75,000 to $99,999 | 3 (13.6%) | 0 (0.0%) |
| $100,000 to $149,999 | 1 (4.5%) | 0 (0.0%) |
| $150,000 or more | 0 (0.0%) | 0 (0.0%) |
| Total | 22 (100.0%) | 36 (100.0%) |
Monthly Housing Cost Tiers in Golden Gate
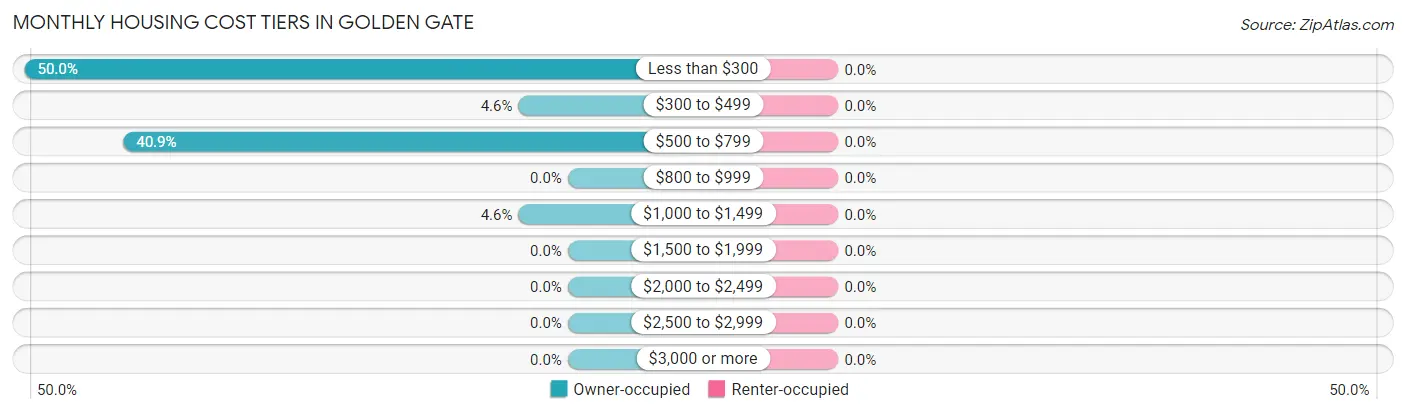
| Monthly Cost | Owner-occupied | Renter-occupied |
| Less than $300 | 11 (50.0%) | 0 (0.0%) |
| $300 to $499 | 1 (4.5%) | 0 (0.0%) |
| $500 to $799 | 9 (40.9%) | 0 (0.0%) |
| $800 to $999 | 0 (0.0%) | 0 (0.0%) |
| $1,000 to $1,499 | 1 (4.5%) | 0 (0.0%) |
| $1,500 to $1,999 | 0 (0.0%) | 0 (0.0%) |
| $2,000 to $2,499 | 0 (0.0%) | 0 (0.0%) |
| $2,500 to $2,999 | 0 (0.0%) | 0 (0.0%) |
| $3,000 or more | 0 (0.0%) | 0 (0.0%) |
| Total | 22 (100.0%) | 36 (100.0%) |
Physical Housing Characteristics in Golden Gate
Housing Structures in Golden Gate
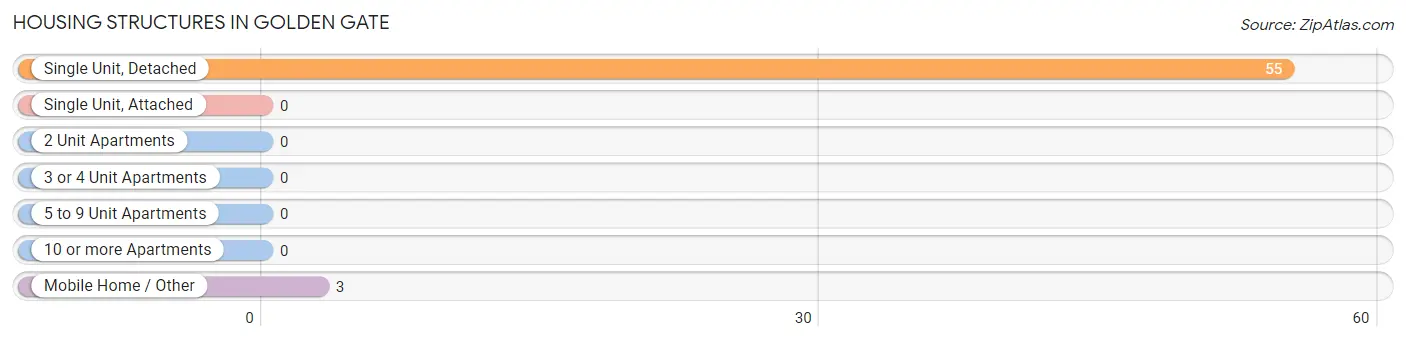
| Structure Type | # Housing Units | % Housing Units |
| Single Unit, Detached | 55 | 94.8% |
| Single Unit, Attached | 0 | 0.0% |
| 2 Unit Apartments | 0 | 0.0% |
| 3 or 4 Unit Apartments | 0 | 0.0% |
| 5 to 9 Unit Apartments | 0 | 0.0% |
| 10 or more Apartments | 0 | 0.0% |
| Mobile Home / Other | 3 | 5.2% |
| Total | 58 | 100.0% |
Housing Structures by Occupancy in Golden Gate
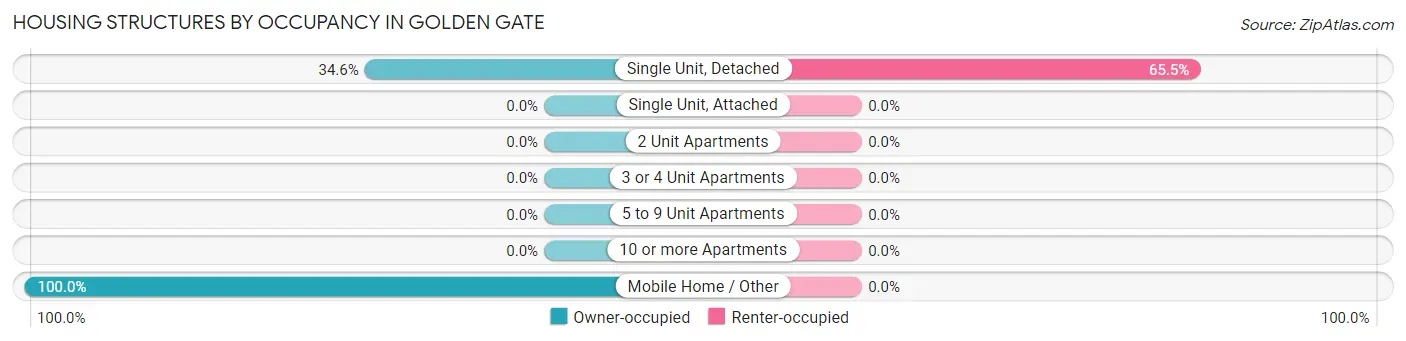
| Structure Type | Owner-occupied | Renter-occupied |
| Single Unit, Detached | 19 (34.5%) | 36 (65.4%) |
| Single Unit, Attached | 0 (0.0%) | 0 (0.0%) |
| 2 Unit Apartments | 0 (0.0%) | 0 (0.0%) |
| 3 or 4 Unit Apartments | 0 (0.0%) | 0 (0.0%) |
| 5 to 9 Unit Apartments | 0 (0.0%) | 0 (0.0%) |
| 10 or more Apartments | 0 (0.0%) | 0 (0.0%) |
| Mobile Home / Other | 3 (100.0%) | 0 (0.0%) |
| Total | 22 (37.9%) | 36 (62.1%) |
Housing Structures by Number of Rooms in Golden Gate
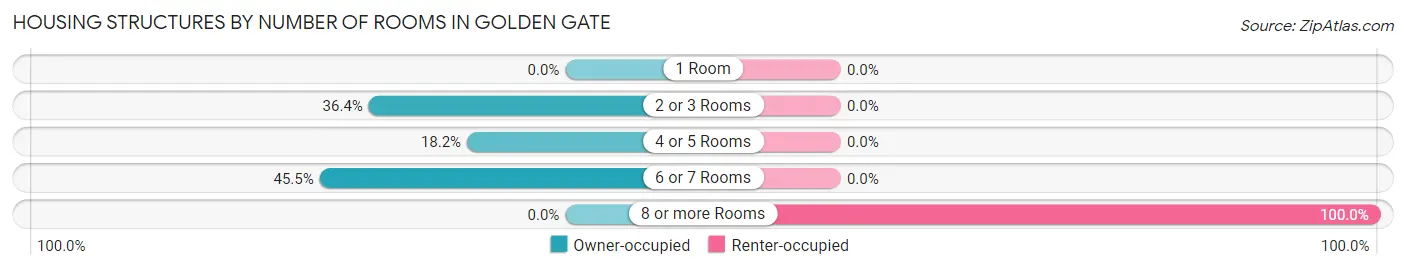
| Number of Rooms | Owner-occupied | Renter-occupied |
| 1 Room | 0 (0.0%) | 0 (0.0%) |
| 2 or 3 Rooms | 8 (36.4%) | 0 (0.0%) |
| 4 or 5 Rooms | 4 (18.2%) | 0 (0.0%) |
| 6 or 7 Rooms | 10 (45.5%) | 0 (0.0%) |
| 8 or more Rooms | 0 (0.0%) | 36 (100.0%) |
| Total | 22 (100.0%) | 36 (100.0%) |
Housing Structure by Heating Type in Golden Gate
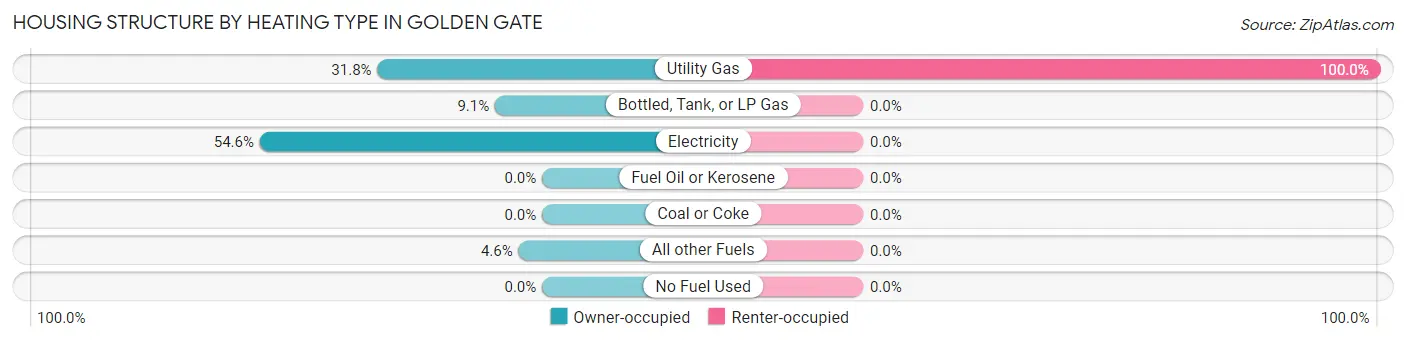
| Heating Type | Owner-occupied | Renter-occupied |
| Utility Gas | 7 (31.8%) | 36 (100.0%) |
| Bottled, Tank, or LP Gas | 2 (9.1%) | 0 (0.0%) |
| Electricity | 12 (54.5%) | 0 (0.0%) |
| Fuel Oil or Kerosene | 0 (0.0%) | 0 (0.0%) |
| Coal or Coke | 0 (0.0%) | 0 (0.0%) |
| All other Fuels | 1 (4.5%) | 0 (0.0%) |
| No Fuel Used | 0 (0.0%) | 0 (0.0%) |
| Total | 22 (100.0%) | 36 (100.0%) |
Household Vehicle Usage in Golden Gate
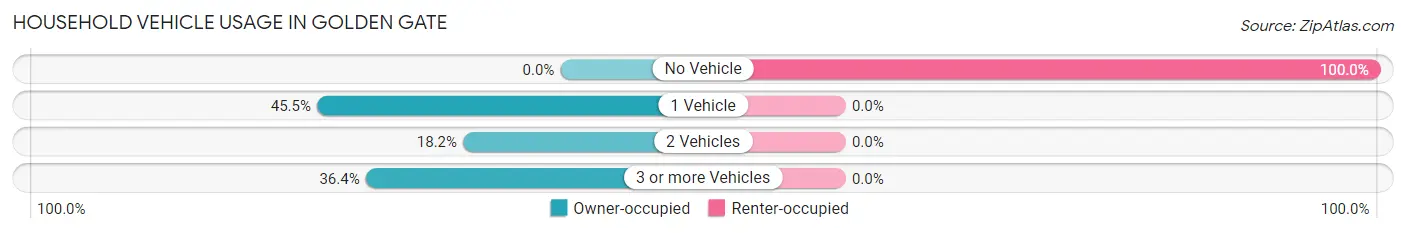
| Vehicles per Household | Owner-occupied | Renter-occupied |
| No Vehicle | 0 (0.0%) | 36 (100.0%) |
| 1 Vehicle | 10 (45.5%) | 0 (0.0%) |
| 2 Vehicles | 4 (18.2%) | 0 (0.0%) |
| 3 or more Vehicles | 8 (36.4%) | 0 (0.0%) |
| Total | 22 (100.0%) | 36 (100.0%) |
Real Estate & Mortgages in Golden Gate
Real Estate and Mortgage Overview in Golden Gate
| Characteristic | Without Mortgage | With Mortgage |
| Housing Units | 19 | 3 |
| Median Property Value | - | - |
| Median Household Income | $7,656 | $0 |
| Monthly Housing Costs | - | - |
| Real Estate Taxes | - | - |
Property Value by Mortgage Status in Golden Gate
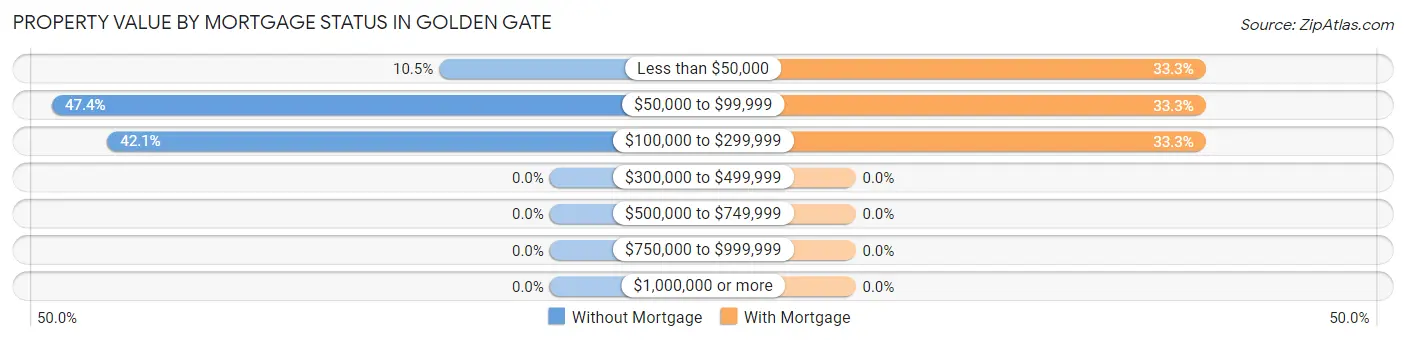
| Property Value | Without Mortgage | With Mortgage |
| Less than $50,000 | 2 (10.5%) | 1 (33.3%) |
| $50,000 to $99,999 | 9 (47.4%) | 1 (33.3%) |
| $100,000 to $299,999 | 8 (42.1%) | 1 (33.3%) |
| $300,000 to $499,999 | 0 (0.0%) | 0 (0.0%) |
| $500,000 to $749,999 | 0 (0.0%) | 0 (0.0%) |
| $750,000 to $999,999 | 0 (0.0%) | 0 (0.0%) |
| $1,000,000 or more | 0 (0.0%) | 0 (0.0%) |
| Total | 19 (100.0%) | 3 (100.0%) |
Household Income by Mortgage Status in Golden Gate
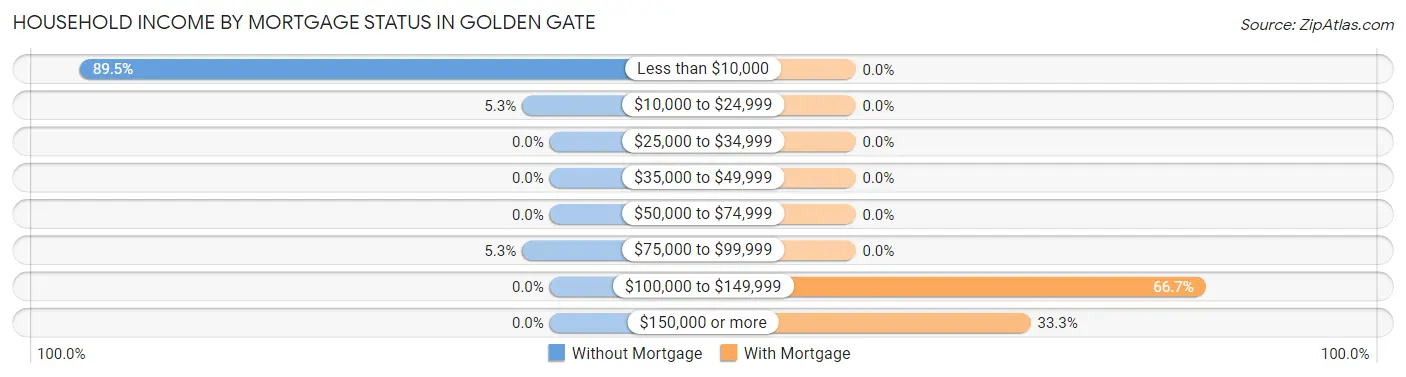
| Household Income | Without Mortgage | With Mortgage |
| Less than $10,000 | 17 (89.5%) | 0 (0.0%) |
| $10,000 to $24,999 | 1 (5.3%) | 0 (0.0%) |
| $25,000 to $34,999 | 0 (0.0%) | 0 (0.0%) |
| $35,000 to $49,999 | 0 (0.0%) | 0 (0.0%) |
| $50,000 to $74,999 | 0 (0.0%) | 0 (0.0%) |
| $75,000 to $99,999 | 1 (5.3%) | 0 (0.0%) |
| $100,000 to $149,999 | 0 (0.0%) | 2 (66.7%) |
| $150,000 or more | 0 (0.0%) | 1 (33.3%) |
| Total | 19 (100.0%) | 3 (100.0%) |
Property Value to Household Income Ratio in Golden Gate
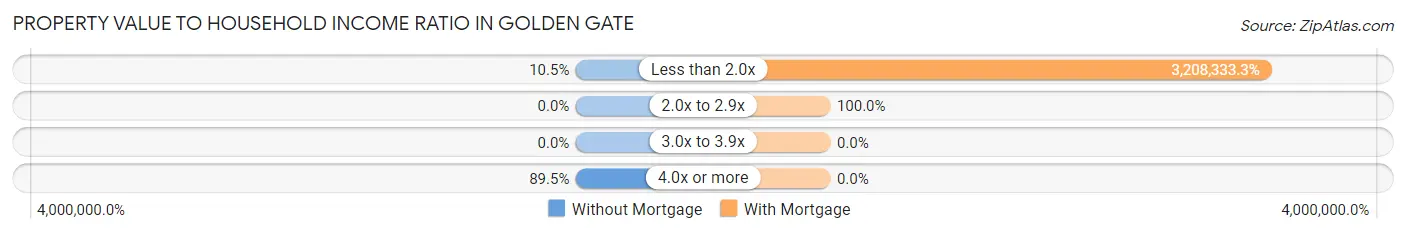
| Value-to-Income Ratio | Without Mortgage | With Mortgage |
| Less than 2.0x | 2 (10.5%) | 96,250 (3,208,333.3%) |
| 2.0x to 2.9x | 0 (0.0%) | 3 (100.0%) |
| 3.0x to 3.9x | 0 (0.0%) | 0 (0.0%) |
| 4.0x or more | 17 (89.5%) | 0 (0.0%) |
| Total | 19 (100.0%) | 3 (100.0%) |
Real Estate Taxes by Mortgage Status in Golden Gate
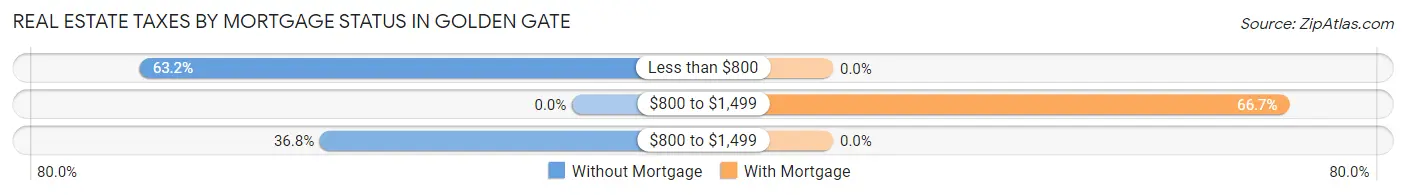
| Property Taxes | Without Mortgage | With Mortgage |
| Less than $800 | 12 (63.2%) | 0 (0.0%) |
| $800 to $1,499 | 0 (0.0%) | 2 (66.7%) |
| $800 to $1,499 | 7 (36.8%) | 0 (0.0%) |
| Total | 19 (100.0%) | 3 (100.0%) |
Health & Disability in Golden Gate
Health Insurance Coverage by Age in Golden Gate
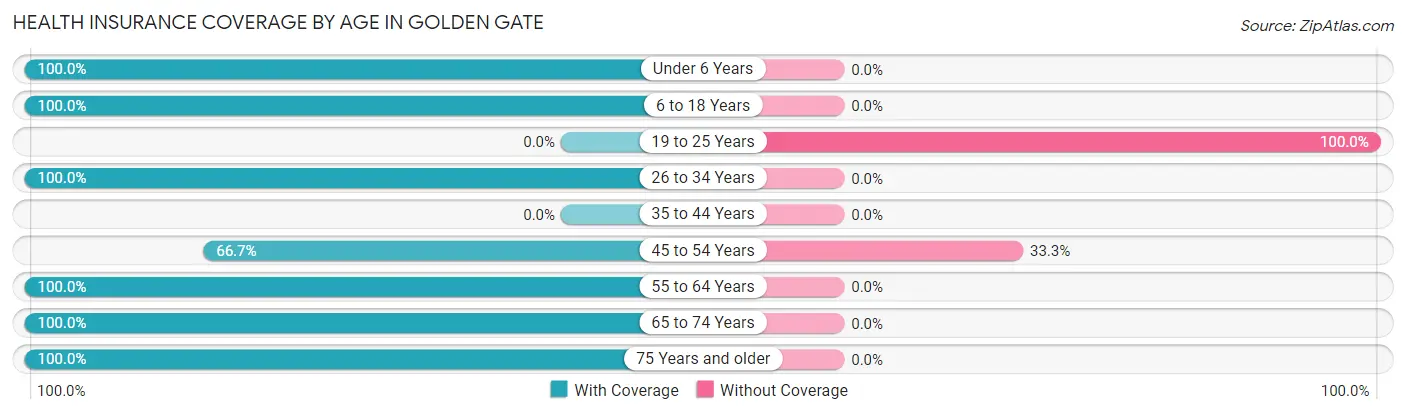
| Age Bracket | With Coverage | Without Coverage |
| Under 6 Years | 5 (100.0%) | 0 (0.0%) |
| 6 to 18 Years | 9 (100.0%) | 0 (0.0%) |
| 19 to 25 Years | 0 (0.0%) | 2 (100.0%) |
| 26 to 34 Years | 20 (100.0%) | 0 (0.0%) |
| 35 to 44 Years | 0 (0.0%) | 0 (0.0%) |
| 45 to 54 Years | 4 (66.7%) | 2 (33.3%) |
| 55 to 64 Years | 3 (100.0%) | 0 (0.0%) |
| 65 to 74 Years | 7 (100.0%) | 0 (0.0%) |
| 75 Years and older | 38 (100.0%) | 0 (0.0%) |
| Total | 86 (95.6%) | 4 (4.4%) |
Health Insurance Coverage by Citizenship Status in Golden Gate
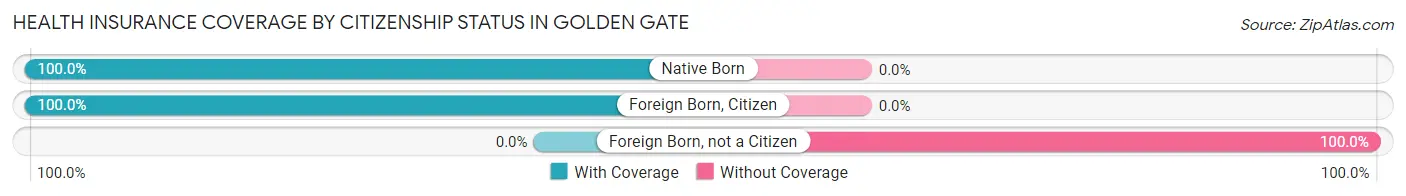
| Citizenship Status | With Coverage | Without Coverage |
| Native Born | 5 (100.0%) | 0 (0.0%) |
| Foreign Born, Citizen | 9 (100.0%) | 0 (0.0%) |
| Foreign Born, not a Citizen | 0 (0.0%) | 2 (100.0%) |
Health Insurance Coverage by Household Income in Golden Gate
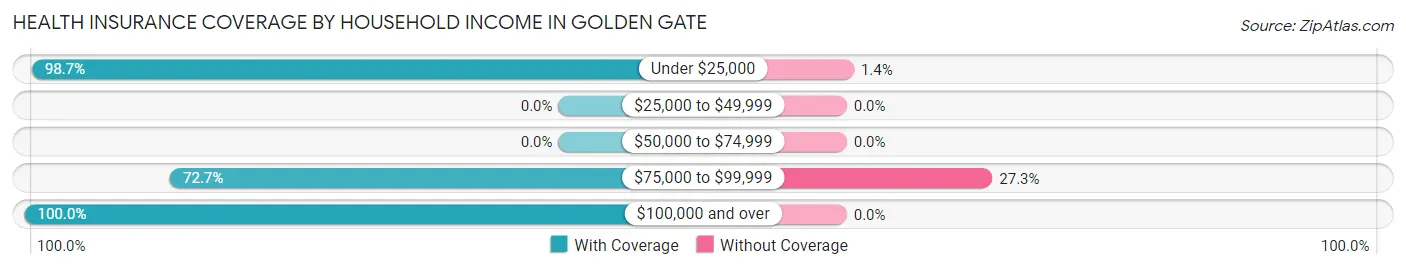
| Household Income | With Coverage | Without Coverage |
| Under $25,000 | 73 (98.7%) | 1 (1.3%) |
| $25,000 to $49,999 | 0 (0.0%) | 0 (0.0%) |
| $50,000 to $74,999 | 0 (0.0%) | 0 (0.0%) |
| $75,000 to $99,999 | 8 (72.7%) | 3 (27.3%) |
| $100,000 and over | 5 (100.0%) | 0 (0.0%) |
Public vs Private Health Insurance Coverage by Age in Golden Gate
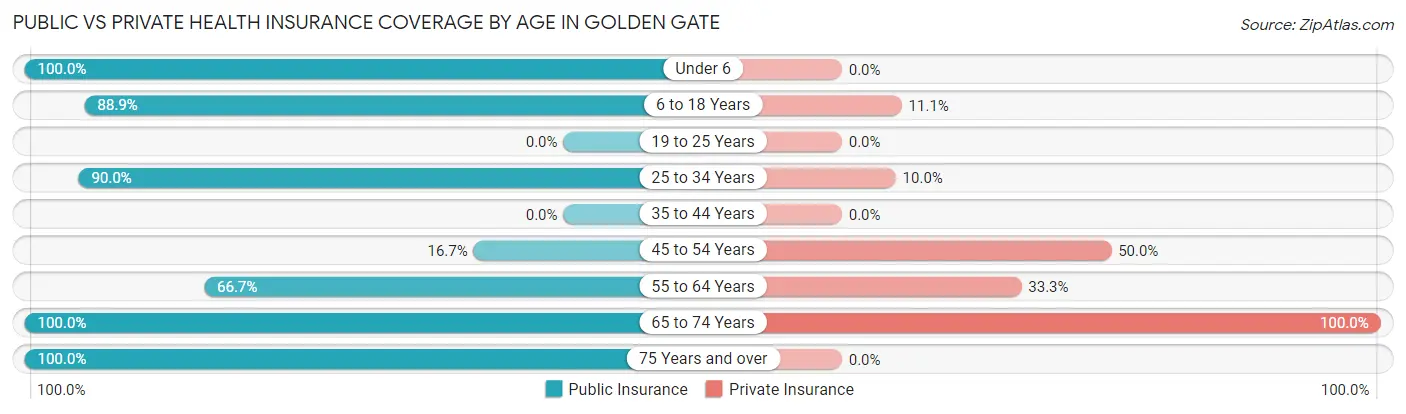
| Age Bracket | Public Insurance | Private Insurance |
| Under 6 | 5 (100.0%) | 0 (0.0%) |
| 6 to 18 Years | 8 (88.9%) | 1 (11.1%) |
| 19 to 25 Years | 0 (0.0%) | 0 (0.0%) |
| 25 to 34 Years | 18 (90.0%) | 2 (10.0%) |
| 35 to 44 Years | 0 (0.0%) | 0 (0.0%) |
| 45 to 54 Years | 1 (16.7%) | 3 (50.0%) |
| 55 to 64 Years | 2 (66.7%) | 1 (33.3%) |
| 65 to 74 Years | 7 (100.0%) | 7 (100.0%) |
| 75 Years and over | 38 (100.0%) | 0 (0.0%) |
| Total | 79 (87.8%) | 14 (15.6%) |
Disability Status by Sex by Age in Golden Gate
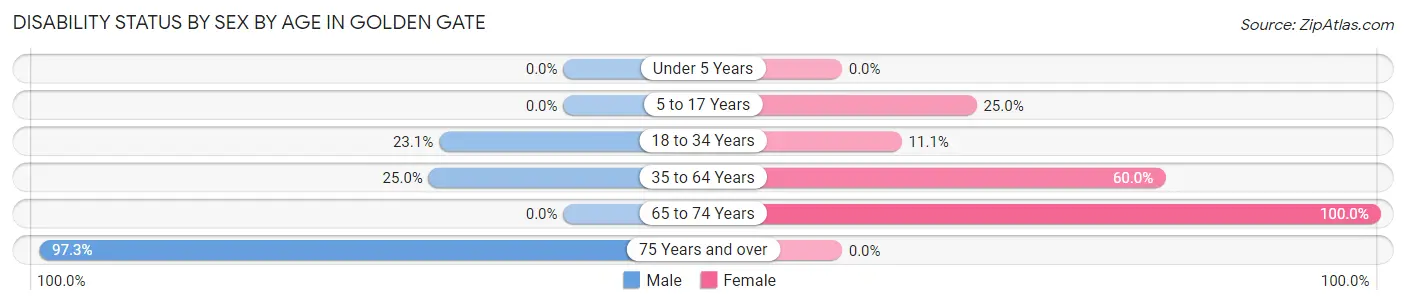
| Age Bracket | Male | Female |
| Under 5 Years | 0 (0.0%) | 0 (0.0%) |
| 5 to 17 Years | 0 (0.0%) | 2 (25.0%) |
| 18 to 34 Years | 3 (23.1%) | 1 (11.1%) |
| 35 to 64 Years | 1 (25.0%) | 3 (60.0%) |
| 65 to 74 Years | 0 (0.0%) | 7 (100.0%) |
| 75 Years and over | 36 (97.3%) | 0 (0.0%) |
Disability Class by Sex by Age in Golden Gate
Disability Class: Hearing Difficulty
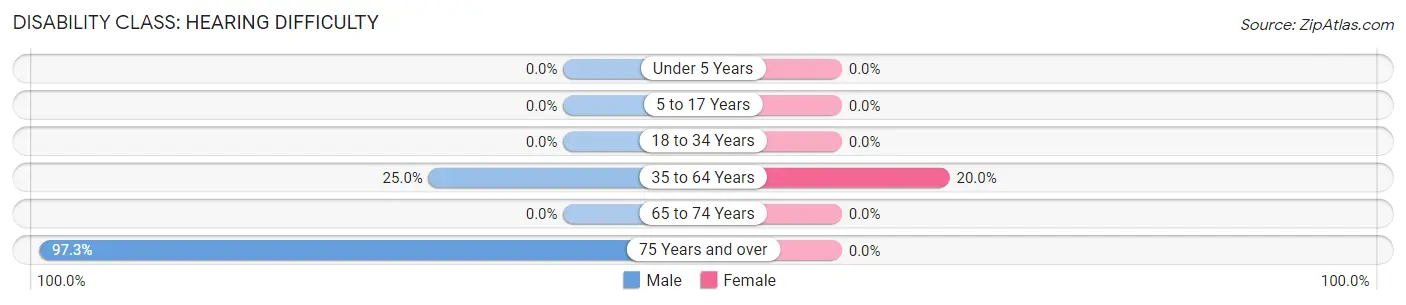
| Age Bracket | Male | Female |
| Under 5 Years | 0 (0.0%) | 0 (0.0%) |
| 5 to 17 Years | 0 (0.0%) | 0 (0.0%) |
| 18 to 34 Years | 0 (0.0%) | 0 (0.0%) |
| 35 to 64 Years | 1 (25.0%) | 1 (20.0%) |
| 65 to 74 Years | 0 (0.0%) | 0 (0.0%) |
| 75 Years and over | 36 (97.3%) | 0 (0.0%) |
Disability Class: Vision Difficulty
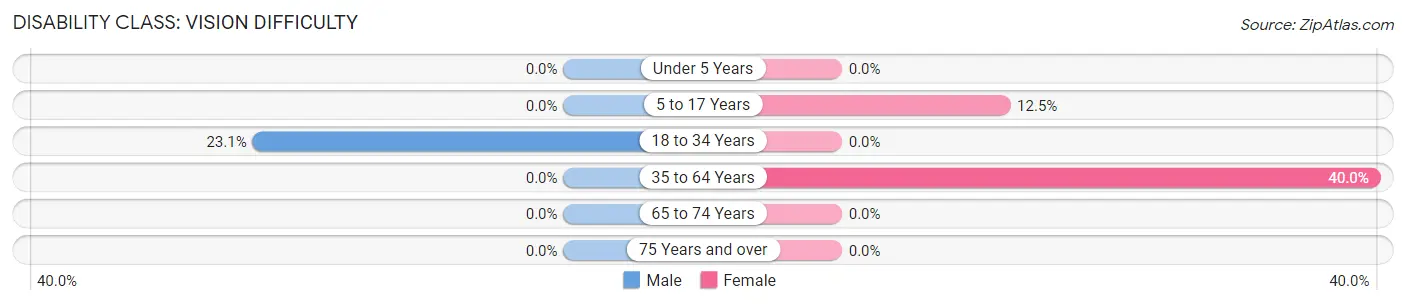
| Age Bracket | Male | Female |
| Under 5 Years | 0 (0.0%) | 0 (0.0%) |
| 5 to 17 Years | 0 (0.0%) | 1 (12.5%) |
| 18 to 34 Years | 3 (23.1%) | 0 (0.0%) |
| 35 to 64 Years | 0 (0.0%) | 2 (40.0%) |
| 65 to 74 Years | 0 (0.0%) | 0 (0.0%) |
| 75 Years and over | 0 (0.0%) | 0 (0.0%) |
Disability Class: Cognitive Difficulty
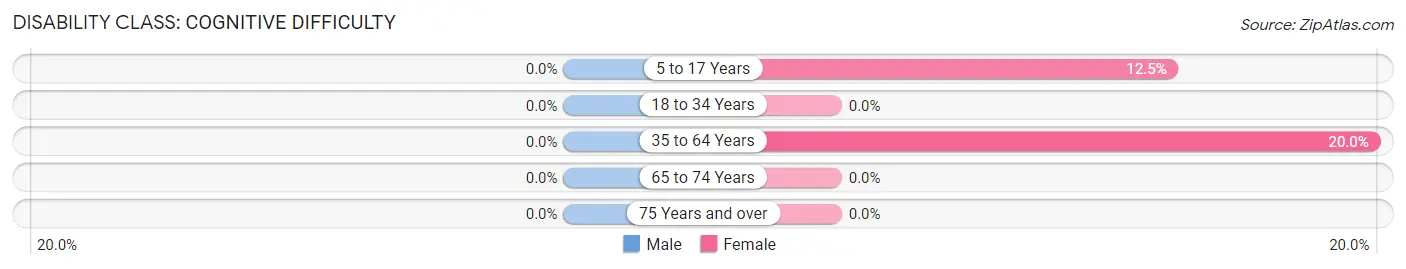
| Age Bracket | Male | Female |
| 5 to 17 Years | 0 (0.0%) | 1 (12.5%) |
| 18 to 34 Years | 0 (0.0%) | 0 (0.0%) |
| 35 to 64 Years | 0 (0.0%) | 1 (20.0%) |
| 65 to 74 Years | 0 (0.0%) | 0 (0.0%) |
| 75 Years and over | 0 (0.0%) | 0 (0.0%) |
Disability Class: Ambulatory Difficulty
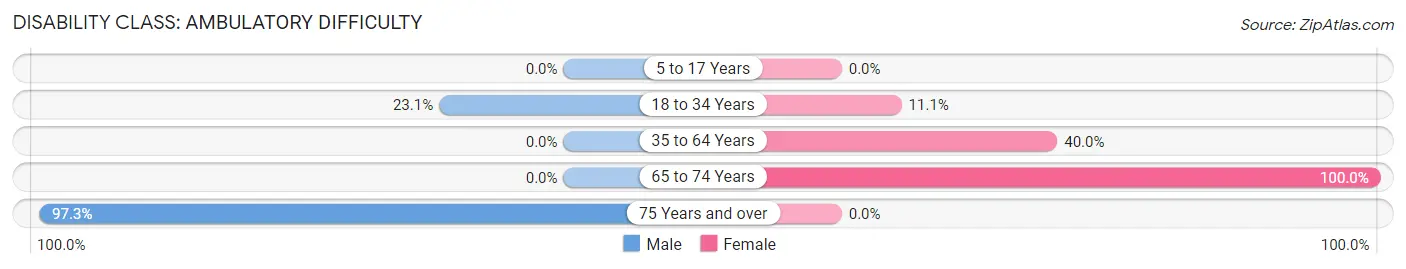
| Age Bracket | Male | Female |
| 5 to 17 Years | 0 (0.0%) | 0 (0.0%) |
| 18 to 34 Years | 3 (23.1%) | 1 (11.1%) |
| 35 to 64 Years | 0 (0.0%) | 2 (40.0%) |
| 65 to 74 Years | 0 (0.0%) | 7 (100.0%) |
| 75 Years and over | 36 (97.3%) | 0 (0.0%) |
Disability Class: Self-Care Difficulty
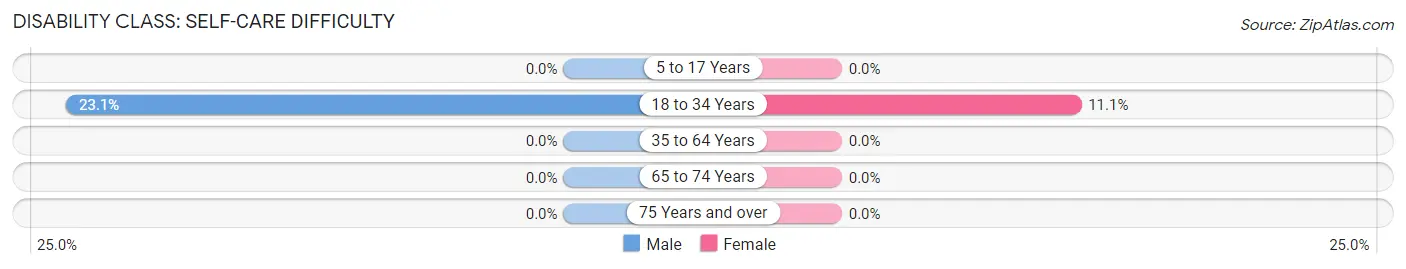
| Age Bracket | Male | Female |
| 5 to 17 Years | 0 (0.0%) | 0 (0.0%) |
| 18 to 34 Years | 3 (23.1%) | 1 (11.1%) |
| 35 to 64 Years | 0 (0.0%) | 0 (0.0%) |
| 65 to 74 Years | 0 (0.0%) | 0 (0.0%) |
| 75 Years and over | 0 (0.0%) | 0 (0.0%) |
Technology Access in Golden Gate
Computing Device Access in Golden Gate
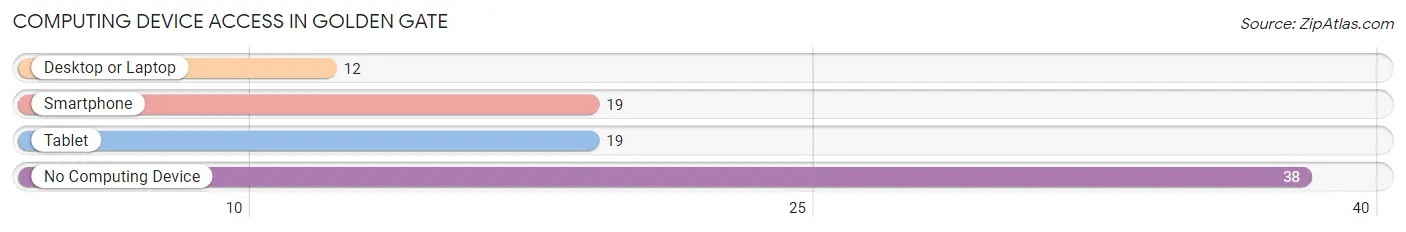
| Device Type | # Households | % Households |
| Desktop or Laptop | 12 | 20.7% |
| Smartphone | 19 | 32.8% |
| Tablet | 19 | 32.8% |
| No Computing Device | 38 | 65.5% |
| Total | 58 | 100.0% |
Internet Access in Golden Gate
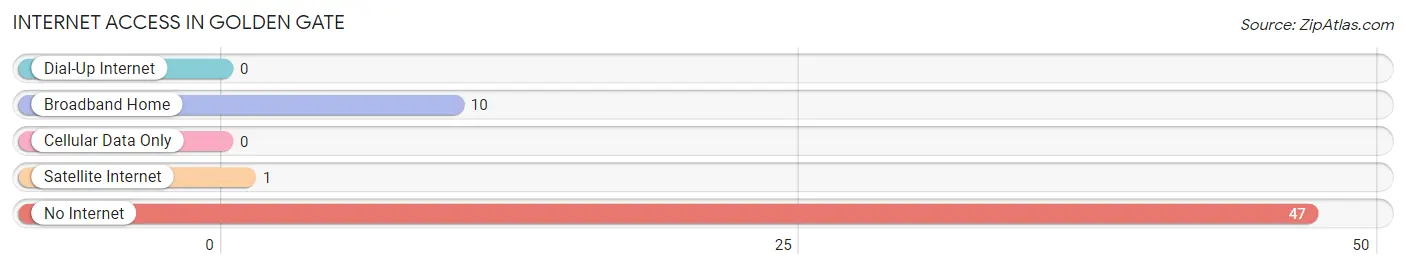
| Internet Type | # Households | % Households |
| Dial-Up Internet | 0 | 0.0% |
| Broadband Home | 10 | 17.2% |
| Cellular Data Only | 0 | 0.0% |
| Satellite Internet | 1 | 1.7% |
| No Internet | 47 | 81.0% |
| Total | 58 | 100.0% |
Golden Gate Summary
Geography
Golden Gate is a small village located in the state of Illinois, in the United States. It is situated in the northeastern part of the state, in the county of Will. The village is located in the Chicago metropolitan area, and is part of the Joliet-Naperville-Aurora Combined Statistical Area. The village is situated on the banks of the Des Plaines River, and is bordered by the towns of Romeoville and Bolingbrook.
The village of Golden Gate covers an area of 1.3 square miles, and has a population of 2,845 people, according to the 2010 census. The village is located at an elevation of 645 feet above sea level. The climate of the area is classified as humid continental, with hot summers and cold winters.
History
The area that is now known as Golden Gate was first settled in the early 19th century by German immigrants. The village was originally known as “German Settlement”, and was later renamed to “Golden Gate” in 1854. The name was chosen to reflect the golden hue of the Des Plaines River, which flows through the village.
The village was incorporated in 1872, and the first mayor was elected in 1873. The village grew slowly over the years, and by the early 20th century, it had become a popular destination for tourists and vacationers. The village was also home to several factories, which provided employment for many of the residents.
Economy
The economy of Golden Gate is largely based on the service industry. The village is home to several restaurants, bars, and other businesses that cater to tourists and vacationers. The village is also home to several manufacturing companies, which provide employment for many of the residents.
The village is also home to several retail stores, including a grocery store, a hardware store, and a pharmacy. The village is also home to several banks, which provide financial services to the residents.
Demographics
According to the 2010 census, the population of Golden Gate was 2,845 people. The racial makeup of the village was 79.3% White, 11.2% African American, 0.3% Native American, 1.2% Asian, and 6.9% from other races. The median household income was $50,945, and the median family income was $60,945.
The village is served by the Will County School District, which includes two elementary schools, one middle school, and one high school. The village is also home to several churches, including the Golden Gate United Methodist Church, the Golden Gate Lutheran Church, and the Golden Gate Baptist Church.
Conclusion
Golden Gate is a small village located in the state of Illinois, in the United States. It is situated in the northeastern part of the state, in the county of Will. The village is located in the Chicago metropolitan area, and is part of the Joliet-Naperville-Aurora Combined Statistical Area. The village was first settled in the early 19th century by German immigrants, and was later renamed to “Golden Gate” in 1854. The economy of Golden Gate is largely based on the service industry, and the village is home to several restaurants, bars, and other businesses that cater to tourists and vacationers. According to the 2010 census, the population of Golden Gate was 2,845 people, and the median household income was $50,945. The village is served by the Will County School District, and is home to several churches.
Common Questions
What is Per Capita Income in Golden Gate?
Per Capita income in Golden Gate is $12,541.
What is the Median Family Income in Golden Gate?
Median Family Income in Golden Gate is $2,499.
What is the Median Household income in Golden Gate?
Median Household Income in Golden Gate is $15,764.
What is Income or Wage Gap in Golden Gate?
Income or Wage Gap in Golden Gate is 94.8%.
Women in Golden Gate earn 5.2 cents for every dollar earned by a man.
What is Inequality or Gini Index in Golden Gate?
Inequality or Gini Index in Golden Gate is 0.41.
What is the Total Population of Golden Gate?
Total Population of Golden Gate is 90.
What is the Total Male Population of Golden Gate?
Total Male Population of Golden Gate is 60.
What is the Total Female Population of Golden Gate?
Total Female Population of Golden Gate is 30.
What is the Ratio of Males per 100 Females in Golden Gate?
There are 200.00 Males per 100 Females in Golden Gate.
What is the Ratio of Females per 100 Males in Golden Gate?
There are 50.00 Females per 100 Males in Golden Gate.
What is the Median Population Age in Golden Gate?
Median Population Age in Golden Gate is 68.0 Years.
What is the Average Family Size in Golden Gate
Average Family Size in Golden Gate is 2.9 People.
What is the Average Household Size in Golden Gate
Average Household Size in Golden Gate is 1.6 People.
How Large is the Labor Force in Golden Gate?
There are 19 People in the Labor Forcein in Golden Gate.
What is the Percentage of People in the Labor Force in Golden Gate?
25.0% of People are in the Labor Force in Golden Gate.