Zip Codes with the Highest Percentage of Population with a Degree in Communications in San Antonio, TX

RELATED REPORTS & OPTIONS

Communications
Population
Families and Households
Female Fertility
Female Fertility (Unmarried)
Race (Community Size)
Race (Percentage)
Ancestry (Community Size)
AfghanAfricanAlbanianAleutAlsatianAmericanApacheArabArgentineanArmenianAustralianAustrianBahamianBangladeshiBarbadianBasqueBelgianBelizeanBhutaneseBlackfeetBolivianBrazilianBritishBritish West IndianBulgarianBurmeseCajunCambodianCanadianCape VerdeanCelticCentral AmericanCentral American IndianCherokeeCheyenneChickasawChileanChineseChippewaChoctawColombianComancheCosta RicanCreekCroatianCubanCzechCzechoslovakianDanishDelawareDominicanDutchDutch West IndianEastern EuropeanEcuadorianEgyptianEnglishEstonianEthiopianEuropeanFilipinoFinnishFrenchFrench American IndianFrench CanadianGermanGerman RussianGhanaianGreekGuamanian / ChamorroGuatemalanGuyaneseHaitianHonduranHopiHungarianIcelanderIndian (Asian)IndonesianInupiatIranianIraqiIrishIroquoisIsraeliItalianJamaicanJapaneseJordanianKenyanKoreanLaotianLatvianLebaneseLiberianLithuanianLumbeeLuxembourgerMacedonianMalaysianMexicanMexican American IndianMongolianMoroccanNative HawaiianNavajoNew ZealanderNicaraguanNigerianNorthern EuropeanNorwegianOkinawanOsageOttawaPakistaniPalestinianPanamanianParaguayanPennsylvania GermanPeruvianPimaPolishPortuguesePotawatomiPuebloPuerto RicanRomanianRussianSalvadoranSamoanScandinavianScotch-IrishScottishSeminoleSerbianShoshoneSierra LeoneanSiouxSlavicSlovakSloveneSomaliSouth AfricanSouth AmericanSouth American IndianSoviet UnionSpaniardSpanishSpanish AmericanSpanish American IndianSri LankanSubsaharan AfricanSudaneseSwedishSwissSyrianThaiTrinidadian and TobagonianTurkishU.S. Virgin IslanderUgandanUkrainianUruguayanUteVenezuelanVietnameseWelshWest IndianYaquiYugoslavian
Ancestry (Percentage)
AfghanAfricanAlbanianAleutAlsatianAmericanApacheArabArgentineanArmenianAustralianAustrianBahamianBangladeshiBarbadianBasqueBelgianBelizeanBhutaneseBlackfeetBolivianBrazilianBritishBritish West IndianBulgarianBurmeseCajunCambodianCanadianCape VerdeanCelticCentral AmericanCentral American IndianCherokeeCheyenneChickasawChileanChineseChippewaChoctawColombianComancheCosta RicanCreekCroatianCubanCzechCzechoslovakianDanishDelawareDominicanDutchDutch West IndianEastern EuropeanEcuadorianEgyptianEnglishEstonianEthiopianEuropeanFilipinoFinnishFrenchFrench American IndianFrench CanadianGermanGerman RussianGhanaianGreekGuamanian / ChamorroGuatemalanGuyaneseHaitianHonduranHopiHungarianIcelanderIndian (Asian)IndonesianInupiatIranianIraqiIrishIroquoisIsraeliItalianJamaicanJapaneseJordanianKenyanKoreanLaotianLatvianLebaneseLiberianLithuanianLumbeeLuxembourgerMacedonianMalaysianMexicanMexican American IndianMongolianMoroccanNative HawaiianNavajoNew ZealanderNicaraguanNigerianNorthern EuropeanNorwegianOkinawanOsageOttawaPakistaniPalestinianPanamanianParaguayanPennsylvania GermanPeruvianPimaPolishPortuguesePotawatomiPuebloPuerto RicanRomanianRussianSalvadoranSamoanScandinavianScotch-IrishScottishSeminoleSerbianShoshoneSierra LeoneanSiouxSlavicSlovakSloveneSomaliSouth AfricanSouth AmericanSouth American IndianSoviet UnionSpaniardSpanishSpanish AmericanSpanish American IndianSri LankanSubsaharan AfricanSudaneseSwedishSwissSyrianThaiTrinidadian and TobagonianTurkishU.S. Virgin IslanderUgandanUkrainianUruguayanUteVenezuelanVietnameseWelshWest IndianYaquiYugoslavian
Immigrant Origin (Total)
AfghanistanAfricaArgentinaAsiaAustraliaAustriaBangladeshBarbadosBelizeBoliviaBrazilBulgariaBurma / MyanmarCambodiaCameroonCanadaCaribbeanCentral AmericaChileChinaColombiaCongoCosta RicaCubaCzechoslovakiaDenmarkDominican RepublicEastern AfricaEastern AsiaEastern EuropeEcuadorEgyptEl SalvadorEnglandEritreaEthiopiaEuropeFijiFranceGermanyGhanaGreeceGuatemalaGuyanaHaitiHondurasHong KongHungaryIndiaIndonesiaIranIraqIrelandIsraelItalyJamaicaJapanJordanKazakhstanKenyaKoreaKuwaitLaosLatin AmericaLatviaLebanonLiberiaLithuaniaMalaysiaMexicoMiddle AfricaMoldovaMoroccoNepalNetherlandsNicaraguaNigeriaNorthern AfricaNorthern EuropeNorwayOceaniaPakistanPanamaPeruPhilippinesPolandPortugalRomaniaRussiaSaudi ArabiaScotlandSerbiaSierra LeoneSingaporeSomaliaSouth AfricaSouth AmericaSouth Central AsiaSouth Eastern AsiaSouthern EuropeSpainSri LankaSudanSwedenSwitzerlandSyriaTaiwanThailandTrinidad and TobagoTurkeyUgandaUkraineUruguayUzbekistanVenezuelaVietnamWestern AfricaWestern AsiaWestern EuropeZaireZimbabwe
Immigrant Origin (Percentage)
AfghanistanAfricaArgentinaAsiaAustraliaAustriaBangladeshBarbadosBelizeBoliviaBrazilBulgariaBurma / MyanmarCambodiaCameroonCanadaCaribbeanCentral AmericaChileChinaColombiaCongoCosta RicaCubaCzechoslovakiaDenmarkDominican RepublicEastern AfricaEastern AsiaEastern EuropeEcuadorEgyptEl SalvadorEnglandEritreaEthiopiaEuropeFijiFranceGermanyGhanaGreeceGuatemalaGuyanaHaitiHondurasHong KongHungaryIndiaIndonesiaIranIraqIrelandIsraelItalyJamaicaJapanJordanKazakhstanKenyaKoreaKuwaitLaosLatin AmericaLatviaLebanonLiberiaLithuaniaMalaysiaMexicoMiddle AfricaMoldovaMoroccoNepalNetherlandsNicaraguaNigeriaNorthern AfricaNorthern EuropeNorwayOceaniaPakistanPanamaPeruPhilippinesPolandPortugalRomaniaRussiaSaudi ArabiaScotlandSerbiaSierra LeoneSingaporeSomaliaSouth AfricaSouth AmericaSouth Central AsiaSouth Eastern AsiaSouthern EuropeSpainSri LankaSudanSwedenSwitzerlandSyriaTaiwanThailandTrinidad and TobagoTurkeyUgandaUkraineUruguayUzbekistanVenezuelaVietnamWestern AfricaWestern AsiaWestern EuropeZaireZimbabwe
Income
Income (Families)
Income (Households)
Poverty
Poverty (Families)
Unemployment
Employment Occupations
Employment Industries
Employer Class
Commute Time
Commute Means
School Enrollment
Education by Degree Field
Occupancy
Finances
Physical Characteristics
San Antonio
Compare Zip Codes
Comparison Subject

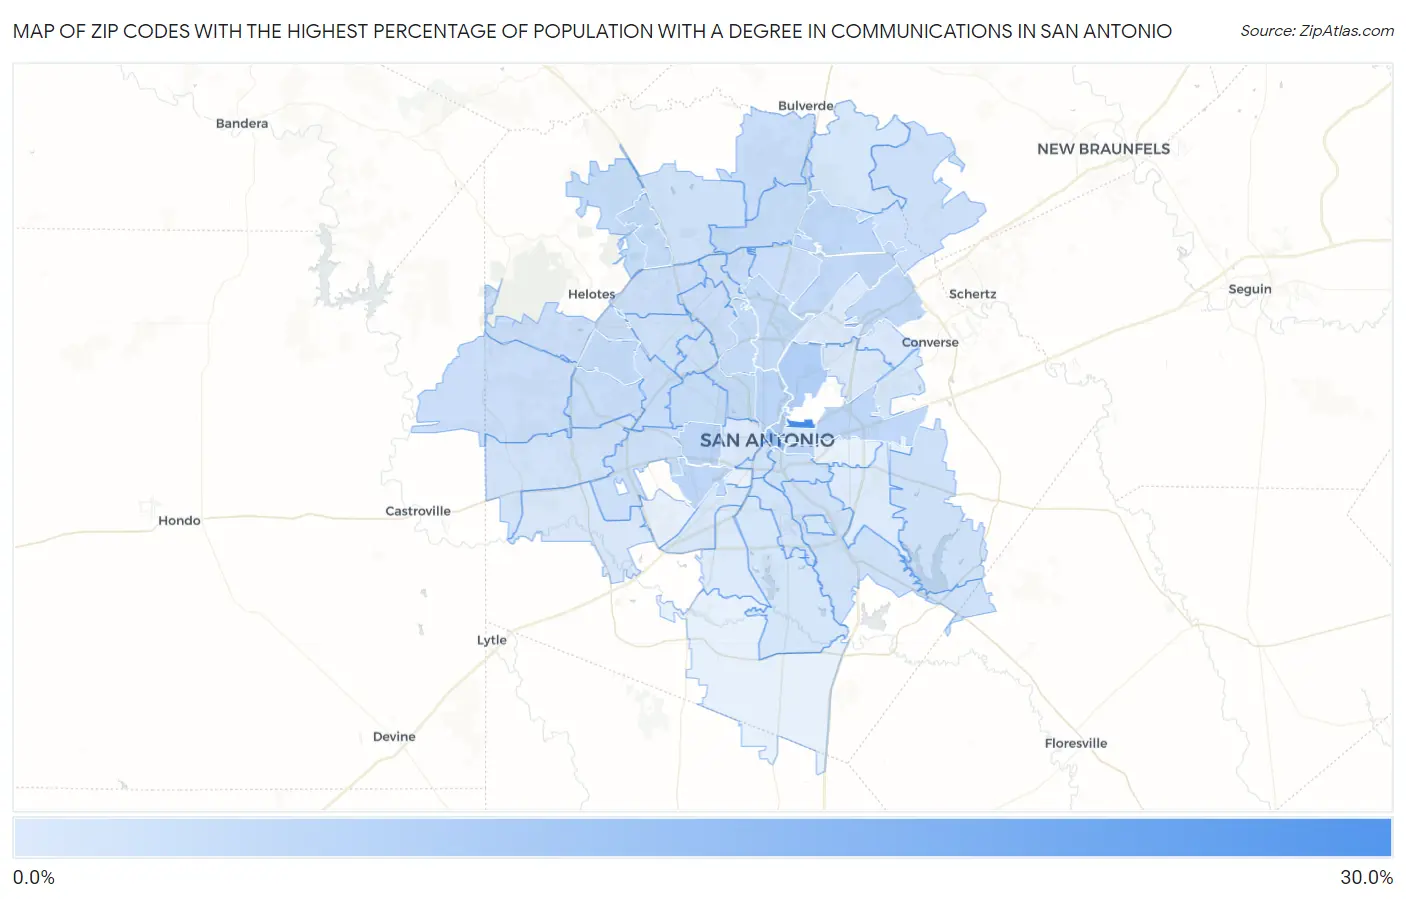
Map of Zip Codes with the Highest Percentage of Population with a Degree in Communications in San Antonio

0.0%
30.0%
Zip Codes with the Highest Percentage of Population with a Degree in Communications in San Antonio Map

Zip Codes with the Highest Percentage of Population with a Degree in Communications in San Antonio, TX

Zip Code % Graduates vs State vs National
1.7820827.4%4.1%(+23.3)#114.1%(+23.2)#179
2.7820512.6%4.1%(+8.53)#414.1%(+8.48)#751
3.782098.0%4.1%(+3.96)#1134.1%(+3.91)#1,850
4.782157.3%4.1%(+3.22)#1434.1%(+3.18)#2,331
5.782037.0%4.1%(+2.92)#1574.1%(+2.87)#2,599
6.782126.6%4.1%(+2.47)#1804.1%(+2.42)#3,065
7.782376.1%4.1%(+2.04)#2164.1%(+1.99)#3,581
8.782195.8%4.1%(+1.72)#2414.1%(+1.68)#4,096
9.782595.8%4.1%(+1.69)#2444.1%(+1.64)#4,150
10.782265.6%4.1%(+1.50)#2584.1%(+1.46)#4,471
11.782475.5%4.1%(+1.37)#2714.1%(+1.32)#4,717
12.782335.2%4.1%(+1.10)#3144.1%(+1.06)#5,273
13.782165.0%4.1%(+0.938)#3314.1%(+0.892)#5,626
14.782134.9%4.1%(+0.852)#3424.1%(+0.807)#5,829
15.782564.9%4.1%(+0.788)#3514.1%(+0.743)#5,985
16.782504.8%4.1%(+0.731)#3594.1%(+0.685)#6,131
17.782584.7%4.1%(+0.578)#3824.1%(+0.533)#6,501
18.782014.7%4.1%(+0.566)#3854.1%(+0.520)#6,530
19.782284.5%4.1%(+0.362)#4214.1%(+0.317)#7,096
20.782554.4%4.1%(+0.312)#4244.1%(+0.266)#7,248
21.782484.3%4.1%(+0.229)#4384.1%(+0.183)#7,529
22.782604.2%4.1%(+0.150)#4494.1%(+0.104)#7,771
23.782384.2%4.1%(+0.074)#4644.1%(+0.028)#8,019
24.782514.2%4.1%(+0.067)#4664.1%(+0.022)#8,039
25.782323.9%4.1%(-0.154)#5124.1%(-0.200)#8,786
26.782493.9%4.1%(-0.217)#5274.1%(-0.263)#9,008
27.782543.7%4.1%(-0.399)#5634.1%(-0.445)#9,666
28.782533.7%4.1%(-0.416)#5674.1%(-0.462)#9,722
29.782303.7%4.1%(-0.435)#5714.1%(-0.481)#9,800
30.782663.6%4.1%(-0.465)#5784.1%(-0.510)#9,882
31.782293.5%4.1%(-0.565)#5994.1%(-0.611)#10,232
32.782273.5%4.1%(-0.614)#6144.1%(-0.660)#10,422
33.782403.2%4.1%(-0.887)#6754.1%(-0.932)#11,446
34.782633.1%4.1%(-1.03)#7014.1%(-1.07)#11,956
35.782103.1%4.1%(-1.03)#7024.1%(-1.08)#11,985
36.782233.0%4.1%(-1.14)#7334.1%(-1.18)#12,381
37.782572.9%4.1%(-1.16)#7384.1%(-1.20)#12,481
38.782452.8%4.1%(-1.30)#7804.1%(-1.35)#13,068
39.782142.8%4.1%(-1.32)#7834.1%(-1.37)#13,129
40.782042.6%4.1%(-1.47)#8124.1%(-1.51)#13,702
41.782312.6%4.1%(-1.49)#8164.1%(-1.54)#13,783
42.782612.1%4.1%(-1.97)#9044.1%(-2.02)#15,460
43.782022.0%4.1%(-2.08)#9234.1%(-2.13)#15,854
44.782211.9%4.1%(-2.18)#9424.1%(-2.23)#16,210
45.782351.9%4.1%(-2.22)#9524.1%(-2.27)#16,339
46.782441.8%4.1%(-2.28)#9664.1%(-2.33)#16,558
47.782111.5%4.1%(-2.56)#1,0244.1%(-2.61)#17,444
48.782521.5%4.1%(-2.58)#1,0264.1%(-2.62)#17,474
49.782181.4%4.1%(-2.64)#1,0424.1%(-2.69)#17,677
50.782071.4%4.1%(-2.68)#1,0494.1%(-2.73)#17,805
51.782171.2%4.1%(-2.89)#1,0794.1%(-2.93)#18,388
52.782391.2%4.1%(-2.91)#1,0824.1%(-2.95)#18,460
53.782241.0%4.1%(-3.06)#1,1104.1%(-3.10)#18,884
54.782220.90%4.1%(-3.19)#1,1344.1%(-3.24)#19,264

Common Questions

What are the Top 10 Zip Codes with the Highest Percentage of Population with a Degree in Communications in San Antonio, TX?
Top 10 Zip Codes with the Highest Percentage of Population with a Degree in Communications in San Antonio, TX are:
#1
27.4%
#2
12.6%
#3
8.0%
#4
7.3%
#5
7.0%
#6
6.6%
#7
6.1%
#8
5.8%
#9
5.8%
#10
5.6%
What zip code has the Highest Percentage of Population with a Degree in Communications in San Antonio, TX?
78208 has the Highest Percentage of Population with a Degree in Communications in San Antonio, TX with 27.4%.
What is the Percentage of Population with a Degree in Communications in San Antonio, TX?
Percentage of Population with a Degree in Communications in San Antonio is 4.0%.
What is the Percentage of Population with a Degree in Communications in Texas?
Percentage of Population with a Degree in Communications in Texas is 4.1%.
What is the Percentage of Population with a Degree in Communications in the United States?
Percentage of Population with a Degree in Communications in the United States is 4.1%.