Lacy Lakeview, TX Map & Demographics
Lacy Lakeview Map
Lacy Lakeview Overview
$27,088
PER CAPITA INCOME
$65,288
AVG FAMILY INCOME
$46,311
AVG HOUSEHOLD INCOME
32.9%
WAGE / INCOME GAP [ % ]
67.1¢/ $1
WAGE / INCOME GAP [ $ ]
0.46
INEQUALITY / GINI INDEX
7,190
TOTAL POPULATION
3,242
MALE POPULATION
3,948
FEMALE POPULATION
82.12
MALES / 100 FEMALES
121.78
FEMALES / 100 MALES
33.6
MEDIAN AGE
3.4
AVG FAMILY SIZE
2.5
AVG HOUSEHOLD SIZE
3,851
LABOR FORCE [ PEOPLE ]
67.2%
PERCENT IN LABOR FORCE
4.1%
UNEMPLOYMENT RATE
Lacy Lakeview Area Codes
Income in Lacy Lakeview
Income Overview in Lacy Lakeview
Per Capita Income in Lacy Lakeview is $27,088, while median incomes of families and households are $65,288 and $46,311 respectively.
| Characteristic | Number | Measure |
| Per Capita Income | 7,190 | $27,088 |
| Median Family Income | 1,527 | $65,288 |
| Mean Family Income | 1,527 | $87,209 |
| Median Household Income | 2,894 | $46,311 |
| Mean Household Income | 2,894 | $66,771 |
| Income Deficit | 1,527 | $0 |
| Wage / Income Gap (%) | 7,190 | 32.90% |
| Wage / Income Gap ($) | 7,190 | 67.10¢ per $1 |
| Gini / Inequality Index | 7,190 | 0.46 |
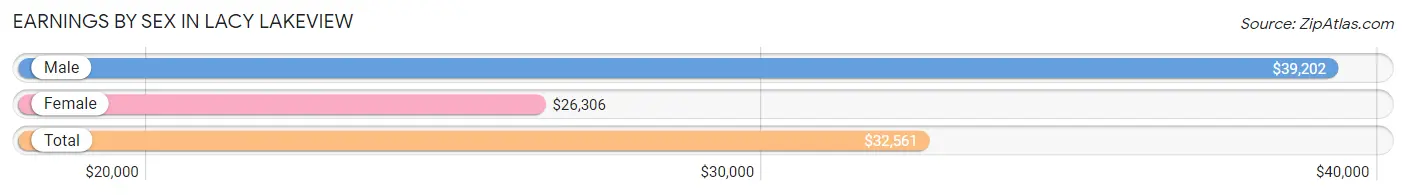
Earnings by Sex in Lacy Lakeview
Average Earnings in Lacy Lakeview are $32,561, $39,202 for men and $26,306 for women, a difference of 32.9%.
| Sex | Number | Average Earnings |
| Male | 1,986 (49.6%) | $39,202 |
| Female | 2,015 (50.4%) | $26,306 |
| Total | 4,001 (100.0%) | $32,561 |
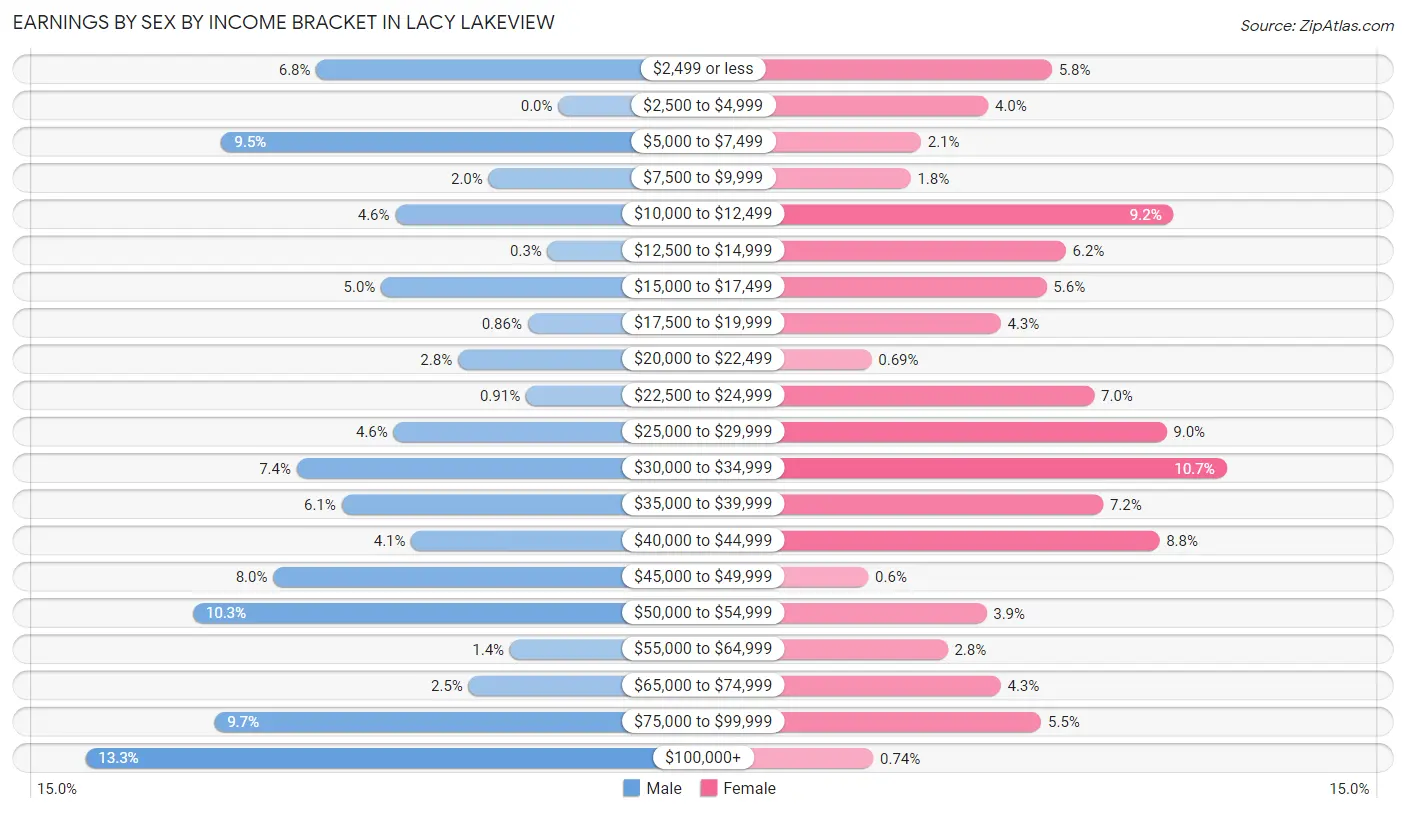
Earnings by Sex by Income Bracket in Lacy Lakeview
The most common earnings brackets in Lacy Lakeview are $100,000+ for men (264 | 13.3%) and $30,000 to $34,999 for women (215 | 10.7%).
| Income | Male | Female |
| $2,499 or less | 135 (6.8%) | 116 (5.8%) |
| $2,500 to $4,999 | 0 (0.0%) | 80 (4.0%) |
| $5,000 to $7,499 | 188 (9.5%) | 42 (2.1%) |
| $7,500 to $9,999 | 39 (2.0%) | 36 (1.8%) |
| $10,000 to $12,499 | 91 (4.6%) | 185 (9.2%) |
| $12,500 to $14,999 | 6 (0.3%) | 124 (6.1%) |
| $15,000 to $17,499 | 99 (5.0%) | 113 (5.6%) |
| $17,500 to $19,999 | 17 (0.9%) | 87 (4.3%) |
| $20,000 to $22,499 | 56 (2.8%) | 14 (0.7%) |
| $22,500 to $24,999 | 18 (0.9%) | 140 (7.0%) |
| $25,000 to $29,999 | 92 (4.6%) | 181 (9.0%) |
| $30,000 to $34,999 | 146 (7.3%) | 215 (10.7%) |
| $35,000 to $39,999 | 121 (6.1%) | 145 (7.2%) |
| $40,000 to $44,999 | 82 (4.1%) | 177 (8.8%) |
| $45,000 to $49,999 | 159 (8.0%) | 12 (0.6%) |
| $50,000 to $54,999 | 204 (10.3%) | 79 (3.9%) |
| $55,000 to $64,999 | 27 (1.4%) | 57 (2.8%) |
| $65,000 to $74,999 | 50 (2.5%) | 87 (4.3%) |
| $75,000 to $99,999 | 192 (9.7%) | 110 (5.5%) |
| $100,000+ | 264 (13.3%) | 15 (0.7%) |
| Total | 1,986 (100.0%) | 2,015 (100.0%) |
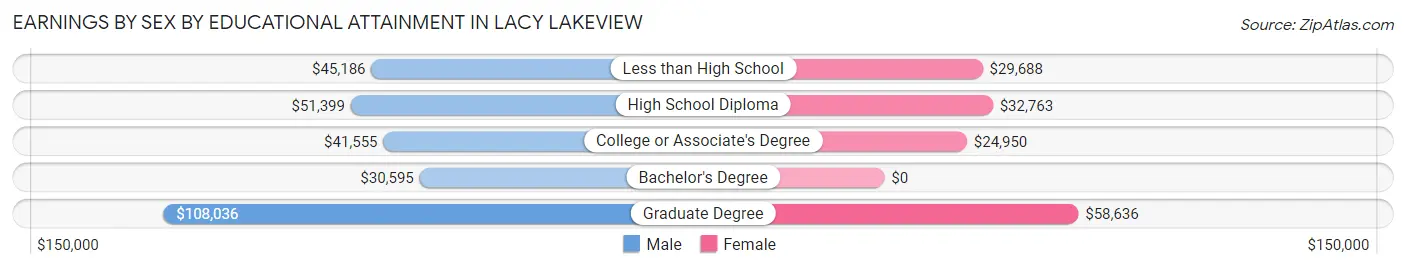
Earnings by Sex by Educational Attainment in Lacy Lakeview
Average earnings in Lacy Lakeview are $47,670 for men and $29,212 for women, a difference of 38.7%. Men with an educational attainment of graduate degree enjoy the highest average annual earnings of $108,036, while those with bachelor's degree education earn the least with $30,595. Women with an educational attainment of graduate degree earn the most with the average annual earnings of $58,636, while those with college or associate's degree education have the smallest earnings of $24,950.
| Educational Attainment | Male Income | Female Income |
| Less than High School | $45,186 | $29,688 |
| High School Diploma | $51,399 | $32,763 |
| College or Associate's Degree | $41,555 | $24,950 |
| Bachelor's Degree | $30,595 | $0 |
| Graduate Degree | $108,036 | $58,636 |
| Total | $47,670 | $29,212 |
Family Income in Lacy Lakeview
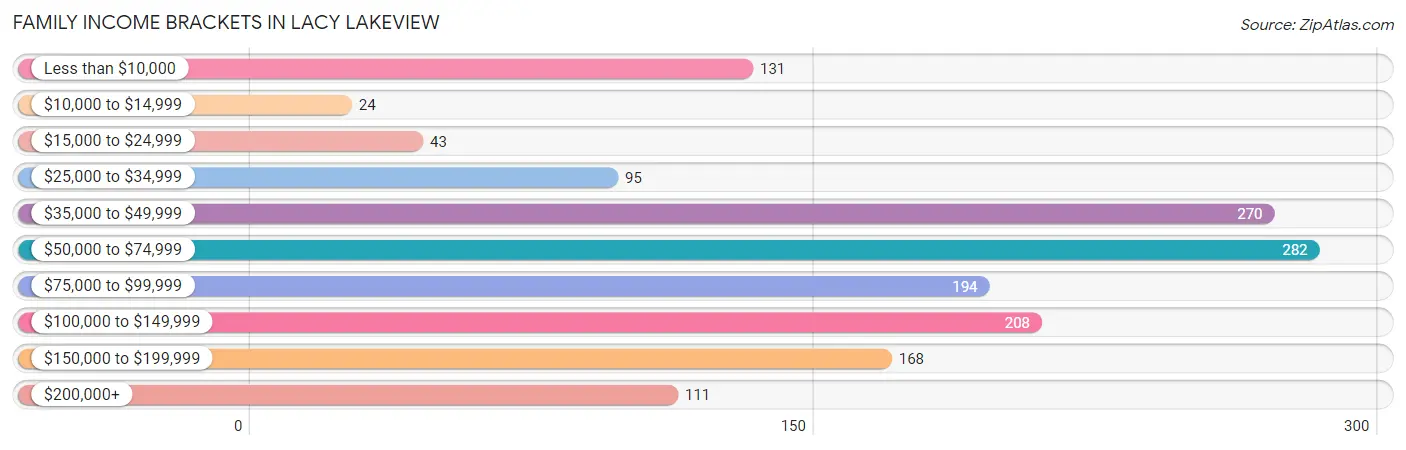
Family Income Brackets in Lacy Lakeview
According to the Lacy Lakeview family income data, there are 282 families falling into the $50,000 to $74,999 income range, which is the most common income bracket and makes up 18.5% of all families. Conversely, the $10,000 to $14,999 income bracket is the least frequent group with only 24 families (1.6%) belonging to this category.
| Income Bracket | # Families | % Families |
| Less than $10,000 | 131 | 8.6% |
| $10,000 to $14,999 | 24 | 1.6% |
| $15,000 to $24,999 | 43 | 2.8% |
| $25,000 to $34,999 | 95 | 6.2% |
| $35,000 to $49,999 | 270 | 17.7% |
| $50,000 to $74,999 | 282 | 18.5% |
| $75,000 to $99,999 | 194 | 12.7% |
| $100,000 to $149,999 | 208 | 13.6% |
| $150,000 to $199,999 | 168 | 11.0% |
| $200,000+ | 111 | 7.3% |
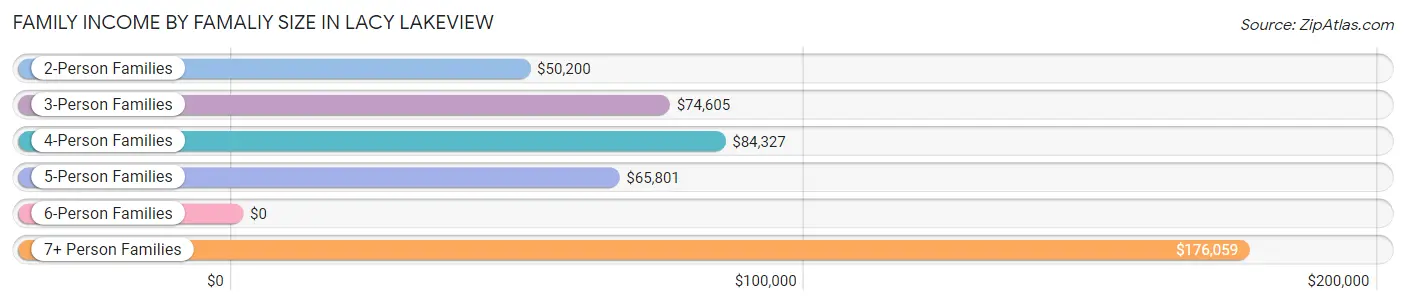
Family Income by Famaliy Size in Lacy Lakeview
7+ person families (100 | 6.6%) account for the highest median family income in Lacy Lakeview with $176,059 per family, while 7+ person families (100 | 6.6%) have the highest median income of $25,151 per family member.
| Income Bracket | # Families | Median Income |
| 2-Person Families | 580 (38.0%) | $50,200 |
| 3-Person Families | 514 (33.7%) | $74,605 |
| 4-Person Families | 227 (14.9%) | $84,327 |
| 5-Person Families | 73 (4.8%) | $65,801 |
| 6-Person Families | 33 (2.2%) | $0 |
| 7+ Person Families | 100 (6.6%) | $176,059 |
| Total | 1,527 (100.0%) | $65,288 |
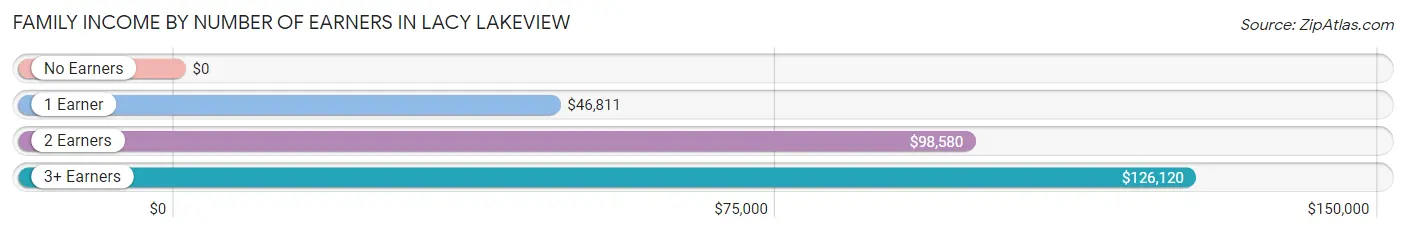
Family Income by Number of Earners in Lacy Lakeview
| Number of Earners | # Families | Median Income |
| No Earners | 191 (12.5%) | $0 |
| 1 Earner | 490 (32.1%) | $46,811 |
| 2 Earners | 553 (36.2%) | $98,580 |
| 3+ Earners | 293 (19.2%) | $126,120 |
| Total | 1,527 (100.0%) | $65,288 |
Household Income in Lacy Lakeview
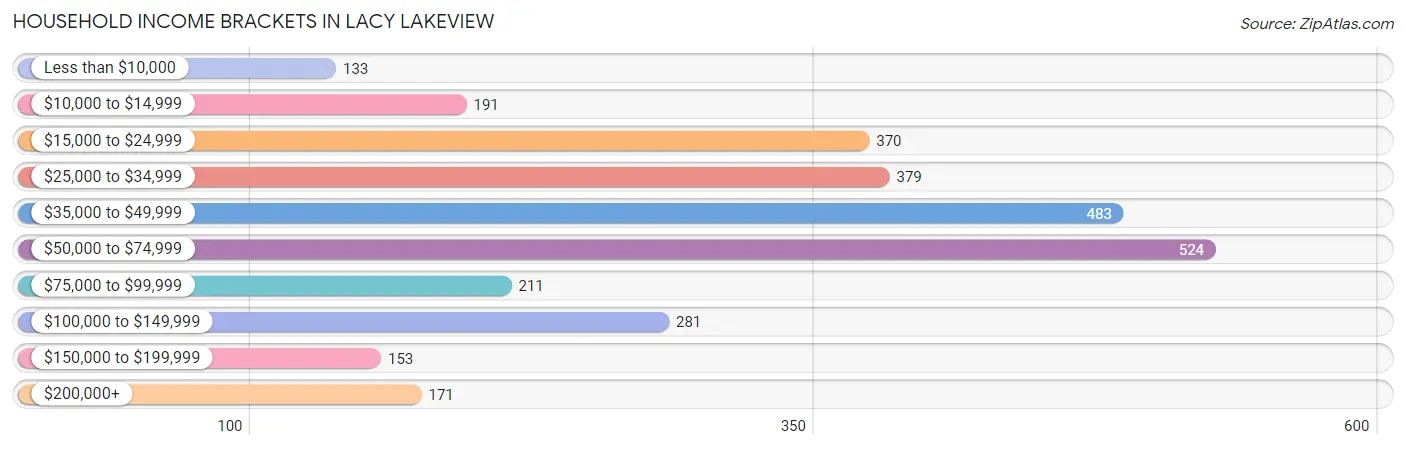
Household Income Brackets in Lacy Lakeview
With 524 households falling in the category, the $50,000 to $74,999 income range is the most frequent in Lacy Lakeview, accounting for 18.1% of all households. In contrast, only 133 households (4.6%) fall into the less than $10,000 income bracket, making it the least populous group.
| Income Bracket | # Households | % Households |
| Less than $10,000 | 133 | 4.6% |
| $10,000 to $14,999 | 191 | 6.6% |
| $15,000 to $24,999 | 370 | 12.8% |
| $25,000 to $34,999 | 379 | 13.1% |
| $35,000 to $49,999 | 483 | 16.7% |
| $50,000 to $74,999 | 524 | 18.1% |
| $75,000 to $99,999 | 211 | 7.3% |
| $100,000 to $149,999 | 281 | 9.7% |
| $150,000 to $199,999 | 153 | 5.3% |
| $200,000+ | 171 | 5.9% |
Household Income by Householder Age in Lacy Lakeview
The median household income in Lacy Lakeview is $46,311, with the highest median household income of $54,500 found in the 45 to 64 years age bracket for the primary householder. A total of 934 households (32.3%) fall into this category. Meanwhile, the 15 to 24 years age bracket for the primary householder has the lowest median household income of $39,135, with 190 households (6.6%) in this group.
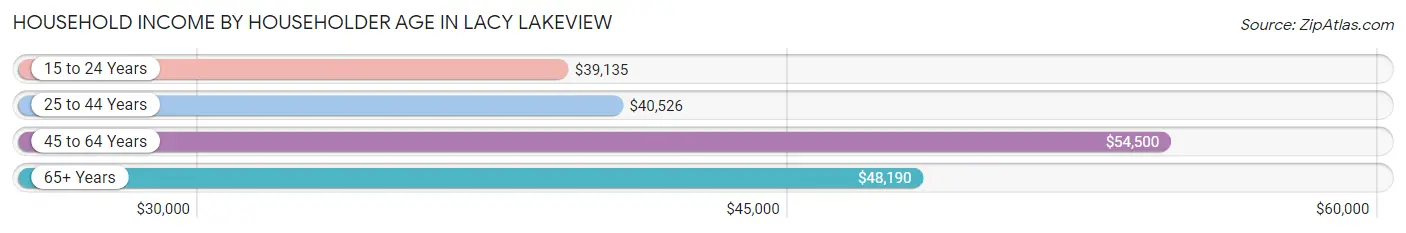
| Income Bracket | # Households | Median Income |
| 15 to 24 Years | 190 (6.6%) | $39,135 |
| 25 to 44 Years | 1,250 (43.2%) | $40,526 |
| 45 to 64 Years | 934 (32.3%) | $54,500 |
| 65+ Years | 520 (18.0%) | $48,190 |
| Total | 2,894 (100.0%) | $46,311 |
Poverty in Lacy Lakeview
Income Below Poverty by Sex and Age in Lacy Lakeview
With 14.2% poverty level for males and 18.7% for females among the residents of Lacy Lakeview, 12 to 14 year old males and 6 to 11 year old females are the most vulnerable to poverty, with 80 males (80.0%) and 146 females (46.2%) in their respective age groups living below the poverty level.
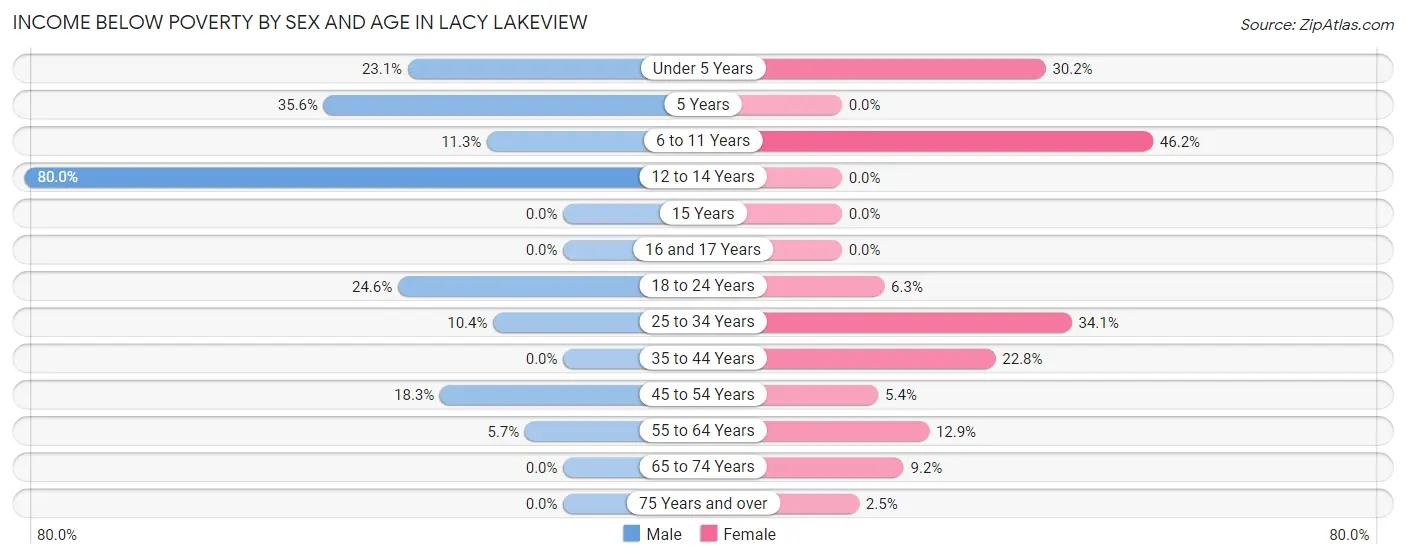
| Age Bracket | Male | Female |
| Under 5 Years | 48 (23.1%) | 114 (30.2%) |
| 5 Years | 16 (35.6%) | 0 (0.0%) |
| 6 to 11 Years | 25 (11.3%) | 146 (46.2%) |
| 12 to 14 Years | 80 (80.0%) | 0 (0.0%) |
| 15 Years | 0 (0.0%) | 0 (0.0%) |
| 16 and 17 Years | 0 (0.0%) | 0 (0.0%) |
| 18 to 24 Years | 110 (24.5%) | 32 (6.3%) |
| 25 to 34 Years | 63 (10.4%) | 173 (34.1%) |
| 35 to 44 Years | 0 (0.0%) | 168 (22.8%) |
| 45 to 54 Years | 99 (18.3%) | 19 (5.4%) |
| 55 to 64 Years | 18 (5.7%) | 48 (12.9%) |
| 65 to 74 Years | 0 (0.0%) | 27 (9.2%) |
| 75 Years and over | 0 (0.0%) | 7 (2.5%) |
| Total | 459 (14.2%) | 734 (18.7%) |
Income Above Poverty by Sex and Age in Lacy Lakeview
According to the poverty statistics in Lacy Lakeview, males aged 16 and 17 years and females aged 12 to 14 years are the age groups that are most secure financially, with 100.0% of males and 100.0% of females in these age groups living above the poverty line.
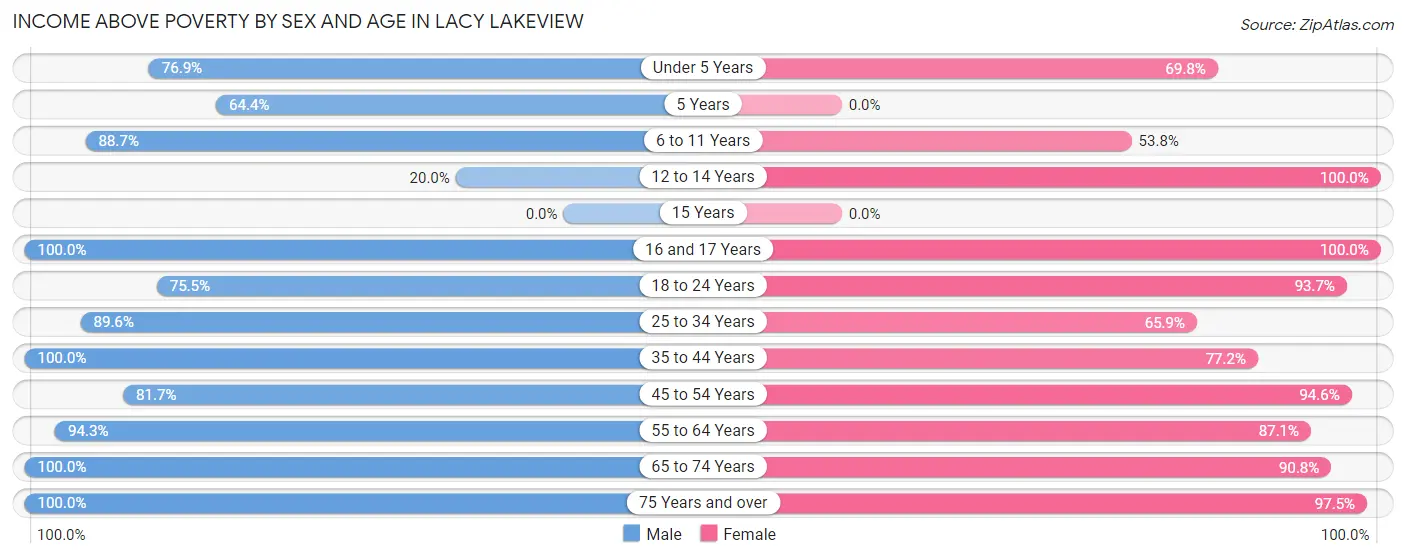
| Age Bracket | Male | Female |
| Under 5 Years | 160 (76.9%) | 263 (69.8%) |
| 5 Years | 29 (64.4%) | 0 (0.0%) |
| 6 to 11 Years | 196 (88.7%) | 170 (53.8%) |
| 12 to 14 Years | 20 (20.0%) | 157 (100.0%) |
| 15 Years | 0 (0.0%) | 0 (0.0%) |
| 16 and 17 Years | 129 (100.0%) | 29 (100.0%) |
| 18 to 24 Years | 338 (75.4%) | 477 (93.7%) |
| 25 to 34 Years | 543 (89.6%) | 334 (65.9%) |
| 35 to 44 Years | 336 (100.0%) | 569 (77.2%) |
| 45 to 54 Years | 442 (81.7%) | 333 (94.6%) |
| 55 to 64 Years | 299 (94.3%) | 323 (87.1%) |
| 65 to 74 Years | 102 (100.0%) | 267 (90.8%) |
| 75 Years and over | 176 (100.0%) | 269 (97.5%) |
| Total | 2,770 (85.8%) | 3,191 (81.3%) |
Income Below Poverty Among Married-Couple Families in Lacy Lakeview
The poverty statistics for married-couple families in Lacy Lakeview show that 5.4% or 52 of the total 957 families live below the poverty line. Families with 3 or 4 children have the highest poverty rate of 23.4%, comprising of 33 families. On the other hand, families with 1 or 2 children have the lowest poverty rate of 0.0%, which includes 0 families.
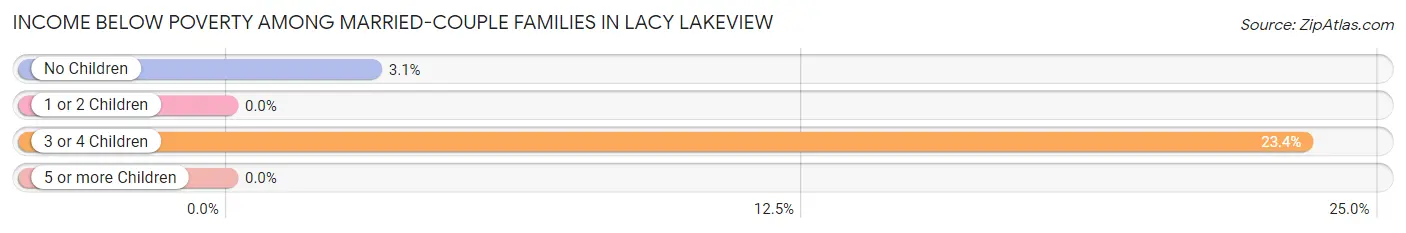
| Children | Above Poverty | Below Poverty |
| No Children | 588 (96.9%) | 19 (3.1%) |
| 1 or 2 Children | 209 (100.0%) | 0 (0.0%) |
| 3 or 4 Children | 108 (76.6%) | 33 (23.4%) |
| 5 or more Children | 0 (0.0%) | 0 (0.0%) |
| Total | 905 (94.6%) | 52 (5.4%) |
Income Below Poverty Among Single-Parent Households in Lacy Lakeview
According to the poverty data in Lacy Lakeview, 15.6% or 24 single-father households and 23.8% or 99 single-mother households are living below the poverty line. Among single-father households, those with 1 or 2 children have the highest poverty rate, with 24 households (19.1%) experiencing poverty. Likewise, among single-mother households, those with 5 or more children have the highest poverty rate, with 16 households (100.0%) falling below the poverty line.
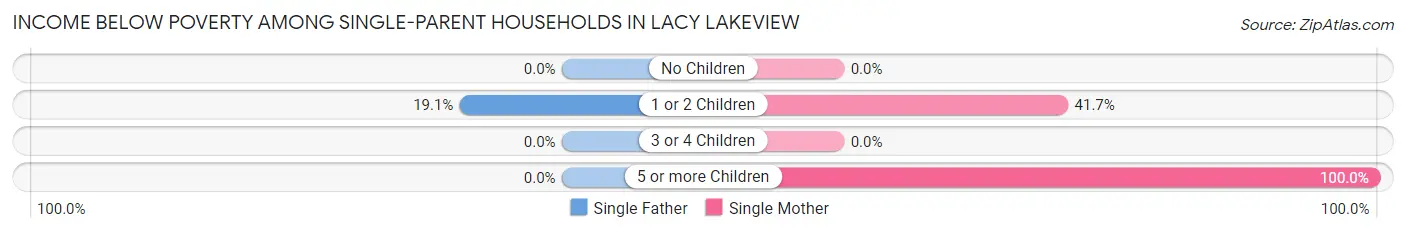
| Children | Single Father | Single Mother |
| No Children | 0 (0.0%) | 0 (0.0%) |
| 1 or 2 Children | 24 (19.1%) | 83 (41.7%) |
| 3 or 4 Children | 0 (0.0%) | 0 (0.0%) |
| 5 or more Children | 0 (0.0%) | 16 (100.0%) |
| Total | 24 (15.6%) | 99 (23.8%) |
Income Below Poverty Among Married-Couple vs Single-Parent Households in Lacy Lakeview
The poverty data for Lacy Lakeview shows that 52 of the married-couple family households (5.4%) and 123 of the single-parent households (21.6%) are living below the poverty level. Within the married-couple family households, those with 3 or 4 children have the highest poverty rate, with 33 households (23.4%) falling below the poverty line. Among the single-parent households, those with 5 or more children have the highest poverty rate, with 16 household (100.0%) living below poverty.
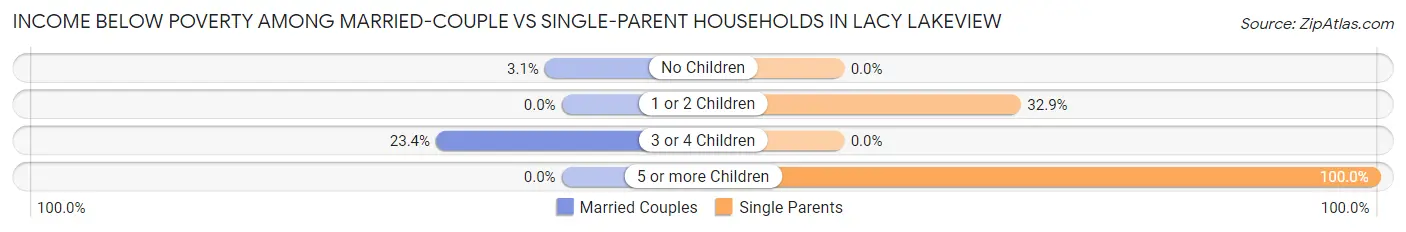
| Children | Married-Couple Families | Single-Parent Households |
| No Children | 19 (3.1%) | 0 (0.0%) |
| 1 or 2 Children | 0 (0.0%) | 107 (32.9%) |
| 3 or 4 Children | 33 (23.4%) | 0 (0.0%) |
| 5 or more Children | 0 (0.0%) | 16 (100.0%) |
| Total | 52 (5.4%) | 123 (21.6%) |
Race in Lacy Lakeview
The most populous races in Lacy Lakeview are White / Caucasian (3,747 | 52.1%), Black / African American (1,935 | 26.9%), and Hispanic or Latino (1,853 | 25.8%).
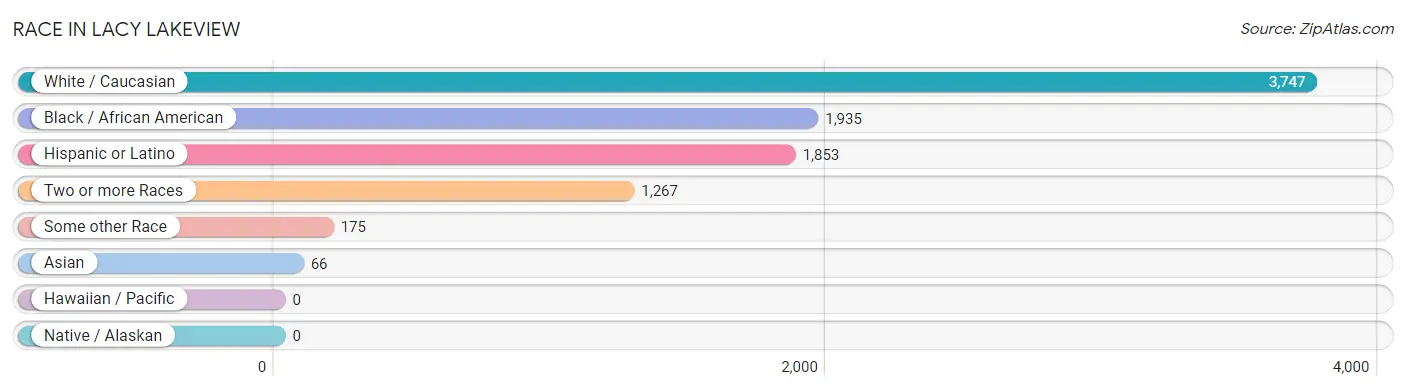
| Race | # Population | % Population |
| Asian | 66 | 0.9% |
| Black / African American | 1,935 | 26.9% |
| Hawaiian / Pacific | 0 | 0.0% |
| Hispanic or Latino | 1,853 | 25.8% |
| Native / Alaskan | 0 | 0.0% |
| White / Caucasian | 3,747 | 52.1% |
| Two or more Races | 1,267 | 17.6% |
| Some other Race | 175 | 2.4% |
| Total | 7,190 | 100.0% |
Ancestry in Lacy Lakeview
The most populous ancestries reported in Lacy Lakeview are Mexican (1,815 | 25.2%), German (683 | 9.5%), Irish (360 | 5.0%), English (281 | 3.9%), and American (232 | 3.2%), together accounting for 46.9% of all Lacy Lakeview residents.
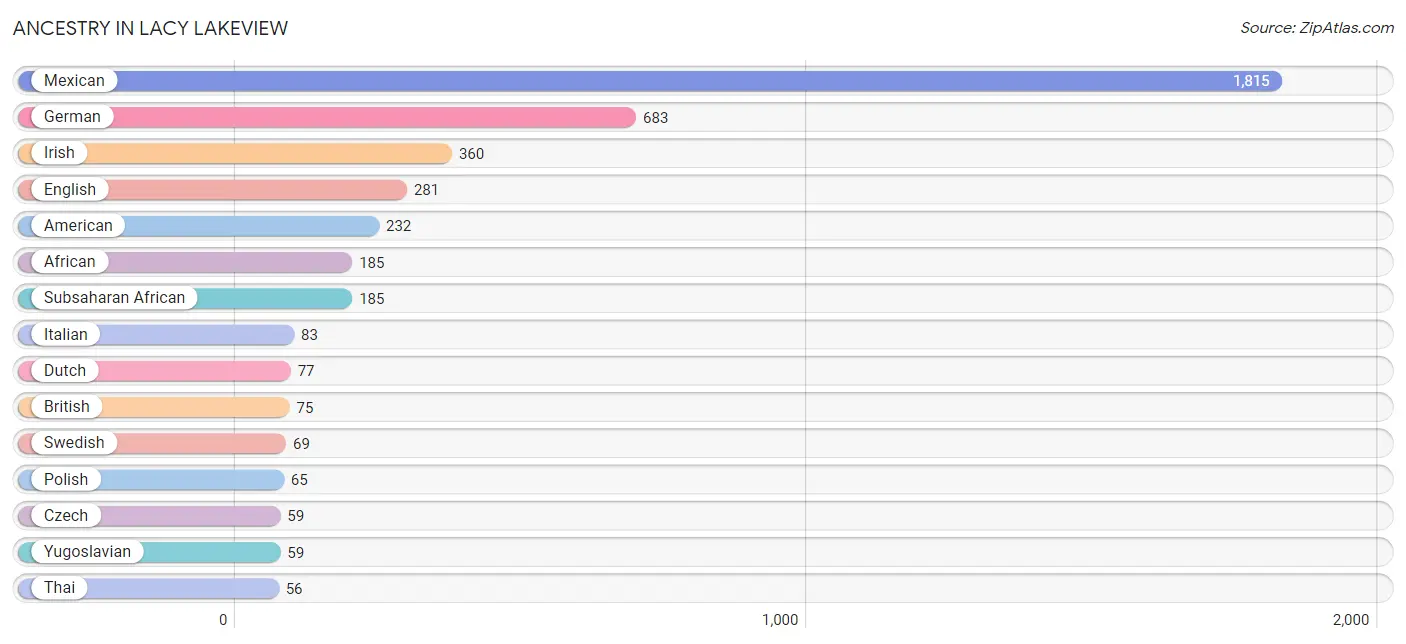
| Ancestry | # Population | % Population |
| African | 185 | 2.6% |
| American | 232 | 3.2% |
| Bhutanese | 41 | 0.6% |
| British | 75 | 1.0% |
| Cuban | 31 | 0.4% |
| Czech | 59 | 0.8% |
| Czechoslovakian | 12 | 0.2% |
| Danish | 46 | 0.6% |
| Dutch | 77 | 1.1% |
| English | 281 | 3.9% |
| European | 46 | 0.6% |
| French | 52 | 0.7% |
| German | 683 | 9.5% |
| Greek | 13 | 0.2% |
| Indian (Asian) | 27 | 0.4% |
| Irish | 360 | 5.0% |
| Italian | 83 | 1.1% |
| Korean | 10 | 0.1% |
| Mexican | 1,815 | 25.2% |
| Northern European | 19 | 0.3% |
| Polish | 65 | 0.9% |
| Portuguese | 25 | 0.4% |
| Scottish | 17 | 0.2% |
| Spanish | 7 | 0.1% |
| Subsaharan African | 185 | 2.6% |
| Swedish | 69 | 1.0% |
| Thai | 56 | 0.8% |
| Welsh | 10 | 0.1% |
| Yugoslavian | 59 | 0.8% | View All 29 Rows |
Immigrants in Lacy Lakeview
The most numerous immigrant groups reported in Lacy Lakeview came from Latin America (415 | 5.8%), Central America (409 | 5.7%), Mexico (409 | 5.7%), Asia (40 | 0.6%), and South Eastern Asia (40 | 0.6%), together accounting for 18.3% of all Lacy Lakeview residents.
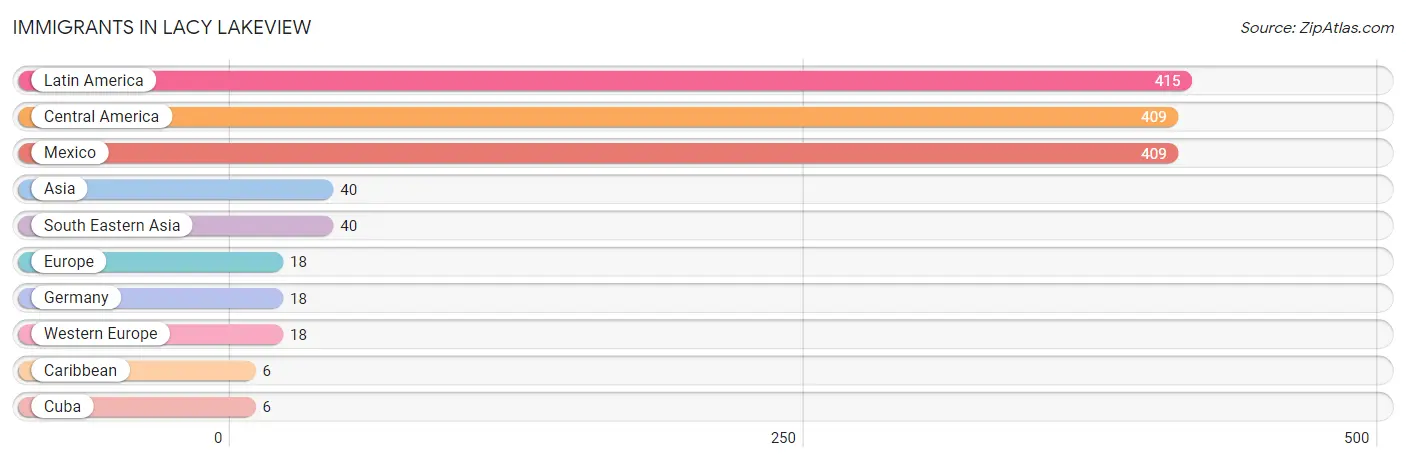
| Immigration Origin | # Population | % Population |
| Asia | 40 | 0.6% |
| Caribbean | 6 | 0.1% |
| Central America | 409 | 5.7% |
| Cuba | 6 | 0.1% |
| Europe | 18 | 0.3% |
| Germany | 18 | 0.3% |
| Latin America | 415 | 5.8% |
| Mexico | 409 | 5.7% |
| South Eastern Asia | 40 | 0.6% |
| Western Europe | 18 | 0.3% | View All 10 Rows |
Sex and Age in Lacy Lakeview
Sex and Age in Lacy Lakeview
The most populous age groups in Lacy Lakeview are 50 to 54 Years (399 | 12.3%) for men and 40 to 44 Years (502 | 12.7%) for women.
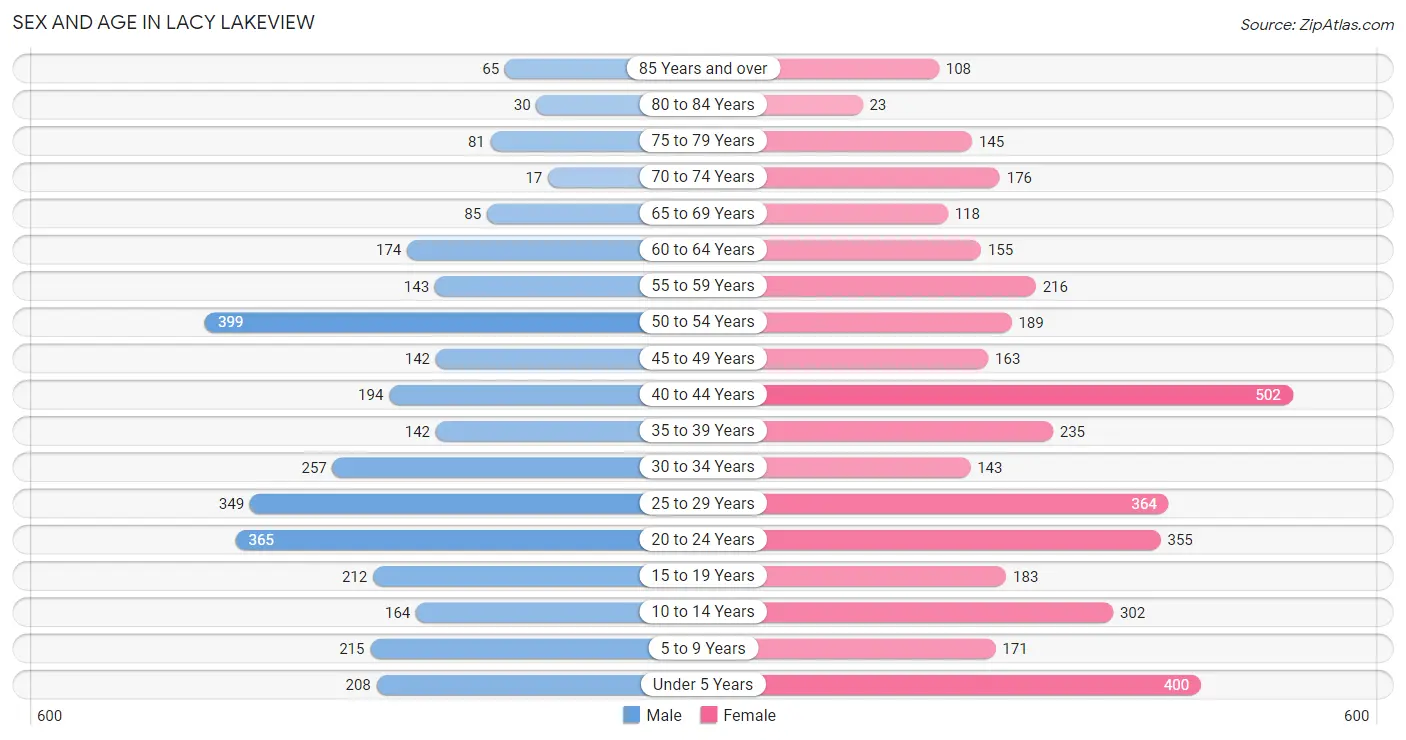
| Age Bracket | Male | Female |
| Under 5 Years | 208 (6.4%) | 400 (10.1%) |
| 5 to 9 Years | 215 (6.6%) | 171 (4.3%) |
| 10 to 14 Years | 164 (5.1%) | 302 (7.6%) |
| 15 to 19 Years | 212 (6.5%) | 183 (4.6%) |
| 20 to 24 Years | 365 (11.3%) | 355 (9.0%) |
| 25 to 29 Years | 349 (10.8%) | 364 (9.2%) |
| 30 to 34 Years | 257 (7.9%) | 143 (3.6%) |
| 35 to 39 Years | 142 (4.4%) | 235 (5.9%) |
| 40 to 44 Years | 194 (6.0%) | 502 (12.7%) |
| 45 to 49 Years | 142 (4.4%) | 163 (4.1%) |
| 50 to 54 Years | 399 (12.3%) | 189 (4.8%) |
| 55 to 59 Years | 143 (4.4%) | 216 (5.5%) |
| 60 to 64 Years | 174 (5.4%) | 155 (3.9%) |
| 65 to 69 Years | 85 (2.6%) | 118 (3.0%) |
| 70 to 74 Years | 17 (0.5%) | 176 (4.5%) |
| 75 to 79 Years | 81 (2.5%) | 145 (3.7%) |
| 80 to 84 Years | 30 (0.9%) | 23 (0.6%) |
| 85 Years and over | 65 (2.0%) | 108 (2.7%) |
| Total | 3,242 (100.0%) | 3,948 (100.0%) |
Families and Households in Lacy Lakeview
Median Family Size in Lacy Lakeview
The median family size in Lacy Lakeview is 3.42 persons per family, with married-couple families (957 | 62.7%) accounting for the largest median family size of 3.65 persons per family. On the other hand, single male/father families (154 | 10.1%) represent the smallest median family size with 2.41 persons per family.
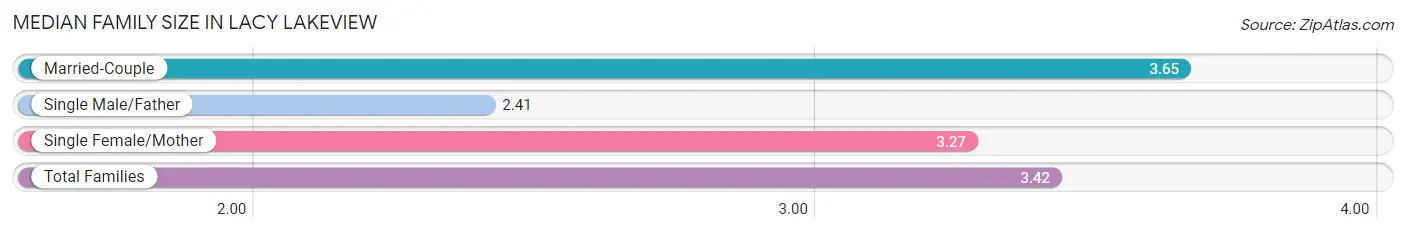
| Family Type | # Families | Family Size |
| Married-Couple | 957 (62.7%) | 3.65 |
| Single Male/Father | 154 (10.1%) | 2.41 |
| Single Female/Mother | 416 (27.2%) | 3.27 |
| Total Families | 1,527 (100.0%) | 3.42 |
Median Household Size in Lacy Lakeview
The median household size in Lacy Lakeview is 2.48 persons per household, with married-couple households (957 | 33.1%) accounting for the largest median household size of 3.87 persons per household. non-family households (1,367 | 47.2%) represent the smallest median household size with 1.11 persons per household.
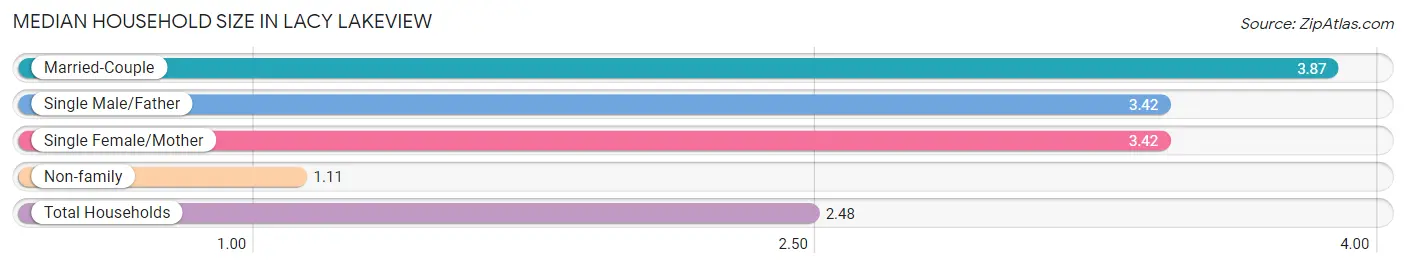
| Household Type | # Households | Household Size |
| Married-Couple | 957 (33.1%) | 3.87 |
| Single Male/Father | 154 (5.3%) | 3.42 |
| Single Female/Mother | 416 (14.4%) | 3.42 |
| Non-family | 1,367 (47.2%) | 1.11 |
| Total Households | 2,894 (100.0%) | 2.48 |
Household Size by Marriage Status in Lacy Lakeview
Out of a total of 2,894 households in Lacy Lakeview, 1,527 (52.8%) are family households, while 1,367 (47.2%) are nonfamily households. The most numerous type of family households are 3-person households, comprising 528, and the most common type of nonfamily households are 1-person households, comprising 1,225.
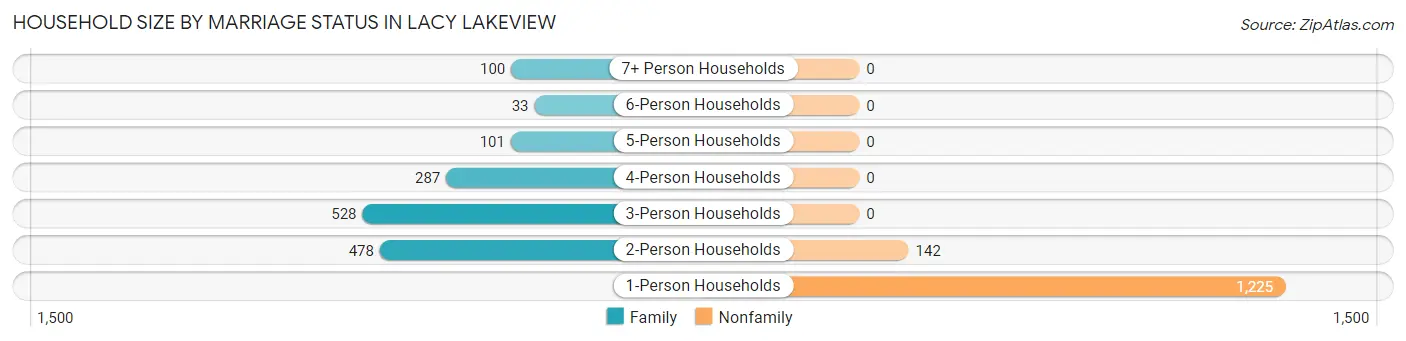
| Household Size | Family Households | Nonfamily Households |
| 1-Person Households | - | 1,225 (42.3%) |
| 2-Person Households | 478 (16.5%) | 142 (4.9%) |
| 3-Person Households | 528 (18.2%) | 0 (0.0%) |
| 4-Person Households | 287 (9.9%) | 0 (0.0%) |
| 5-Person Households | 101 (3.5%) | 0 (0.0%) |
| 6-Person Households | 33 (1.1%) | 0 (0.0%) |
| 7+ Person Households | 100 (3.5%) | 0 (0.0%) |
| Total | 1,527 (52.8%) | 1,367 (47.2%) |
Female Fertility in Lacy Lakeview
Fertility by Age in Lacy Lakeview
Average fertility rate in Lacy Lakeview is 79.0 births per 1,000 women. Women in the age bracket of 20 to 34 years have the highest fertility rate with 181.0 births per 1,000 women. Women in the age bracket of 20 to 34 years acount for 100.0% of all women with births.
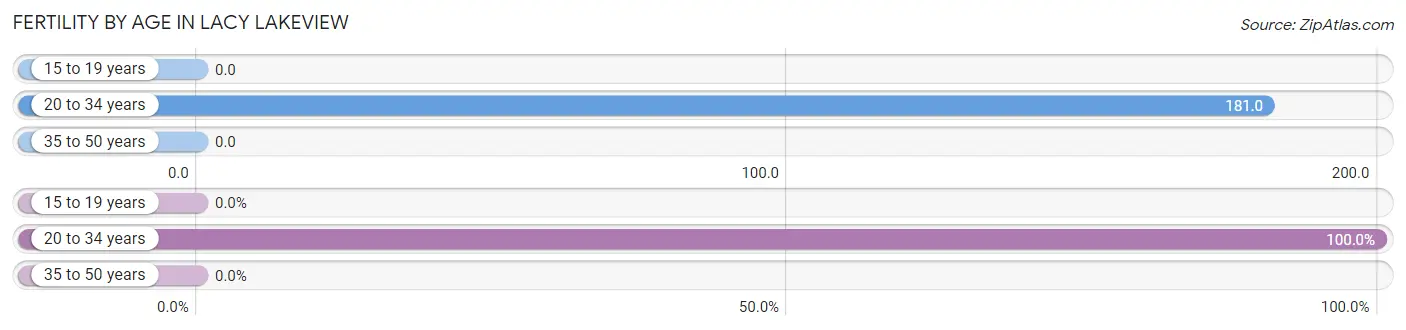
| Age Bracket | Women with Births | Births / 1,000 Women |
| 15 to 19 years | 0 (0.0%) | 0.0 |
| 20 to 34 years | 156 (100.0%) | 181.0 |
| 35 to 50 years | 0 (0.0%) | 0.0 |
| Total | 156 (100.0%) | 79.0 |
Fertility by Age by Marriage Status in Lacy Lakeview
22.4% of women with births (156) in Lacy Lakeview are married. The highest percentage of unmarried women with births falls into 20 to 34 years age bracket with 77.6% of them unmarried at the time of birth, while the lowest percentage of unmarried women with births belong to 20 to 34 years age bracket with 77.6% of them unmarried.
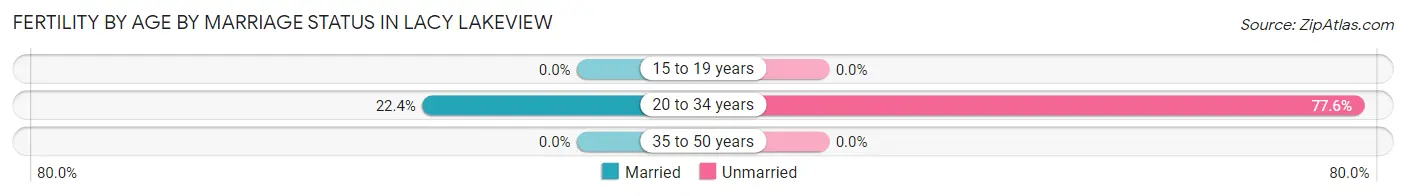
| Age Bracket | Married | Unmarried |
| 15 to 19 years | 0 (0.0%) | 0 (0.0%) |
| 20 to 34 years | 35 (22.4%) | 121 (77.6%) |
| 35 to 50 years | 0 (0.0%) | 0 (0.0%) |
| Total | 35 (22.4%) | 121 (77.6%) |
Fertility by Education in Lacy Lakeview
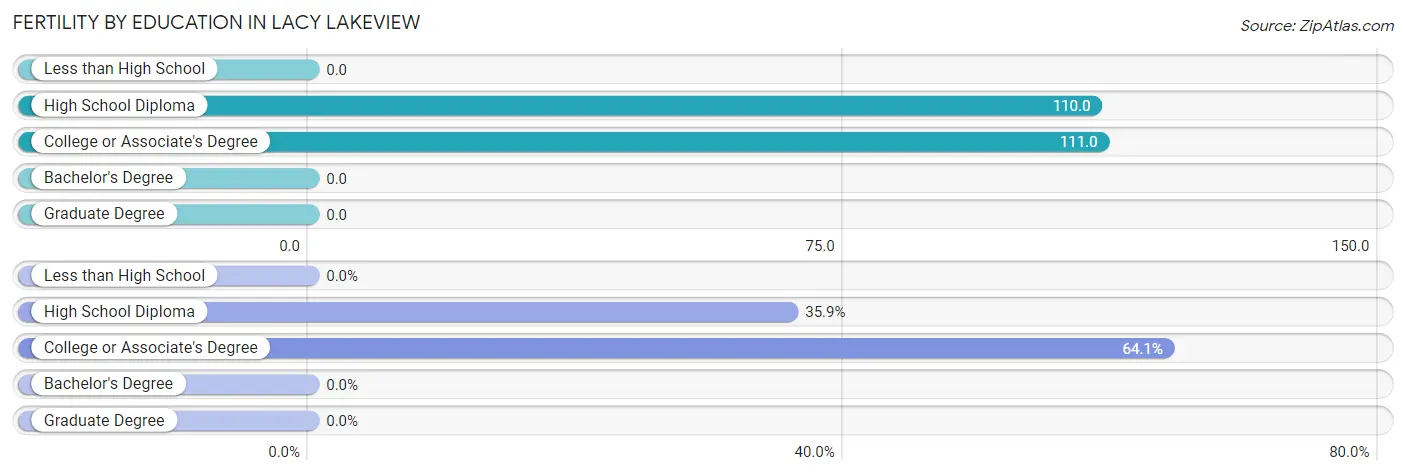
| Educational Attainment | Women with Births | Births / 1,000 Women |
| Less than High School | 0 (0.0%) | 0.0 |
| High School Diploma | 56 (35.9%) | 110.0 |
| College or Associate's Degree | 100 (64.1%) | 111.0 |
| Bachelor's Degree | 0 (0.0%) | 0.0 |
| Graduate Degree | 0 (0.0%) | 0.0 |
| Total | 156 (100.0%) | 79.0 |
Fertility by Education by Marriage Status in Lacy Lakeview
77.6% of women with births in Lacy Lakeview are unmarried. Women with the educational attainment of college or associate's degree are most likely to be married with 35.0% of them married at childbirth, while women with the educational attainment of high school diploma are least likely to be married with 100.0% of them unmarried at childbirth.
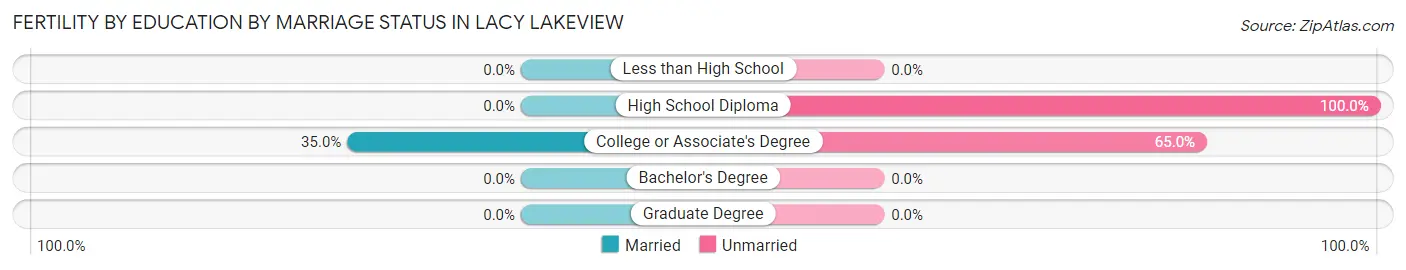
| Educational Attainment | Married | Unmarried |
| Less than High School | 0 (0.0%) | 0 (0.0%) |
| High School Diploma | 0 (0.0%) | 56 (100.0%) |
| College or Associate's Degree | 35 (35.0%) | 65 (65.0%) |
| Bachelor's Degree | 0 (0.0%) | 0 (0.0%) |
| Graduate Degree | 0 (0.0%) | 0 (0.0%) |
| Total | 35 (22.4%) | 121 (77.6%) |
Employment Characteristics in Lacy Lakeview
Employment by Class of Employer in Lacy Lakeview
Among the 3,690 employed individuals in Lacy Lakeview, private company employees (2,776 | 75.2%), self-employed (not incorporated) (225 | 6.1%), and not-for-profit organizations (224 | 6.1%) make up the most common classes of employment.
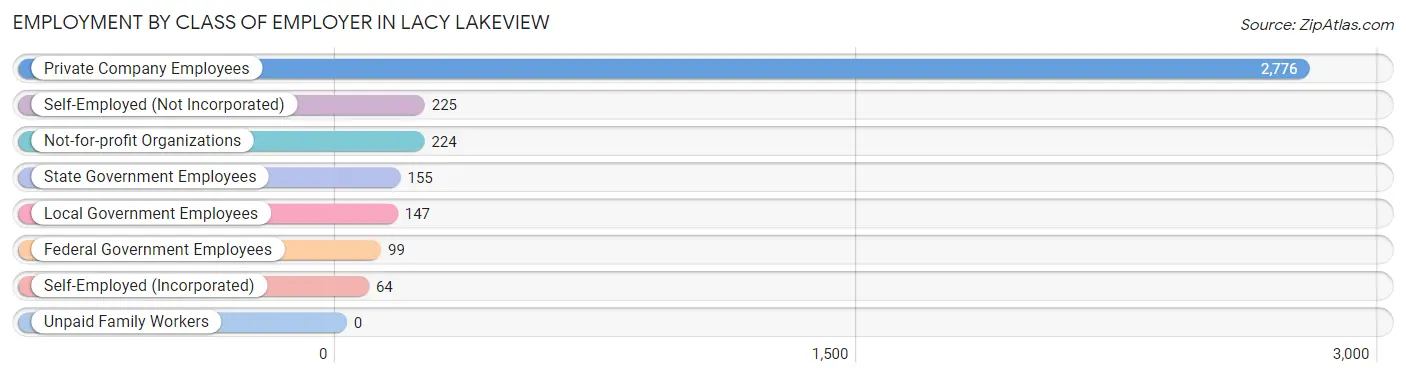
| Employer Class | # Employees | % Employees |
| Private Company Employees | 2,776 | 75.2% |
| Self-Employed (Incorporated) | 64 | 1.7% |
| Self-Employed (Not Incorporated) | 225 | 6.1% |
| Not-for-profit Organizations | 224 | 6.1% |
| Local Government Employees | 147 | 4.0% |
| State Government Employees | 155 | 4.2% |
| Federal Government Employees | 99 | 2.7% |
| Unpaid Family Workers | 0 | 0.0% |
| Total | 3,690 | 100.0% |
Employment Status by Age in Lacy Lakeview
According to the labor force statistics for Lacy Lakeview, out of the total population over 16 years of age (5,730), 67.2% or 3,851 individuals are in the labor force, with 4.1% or 158 of them unemployed. The age group with the highest labor force participation rate is 30 to 34 years, with 95.0% or 380 individuals in the labor force. Within the labor force, the 16 to 19 years age range has the highest percentage of unemployed individuals, with 31.9% or 75 of them being unemployed.
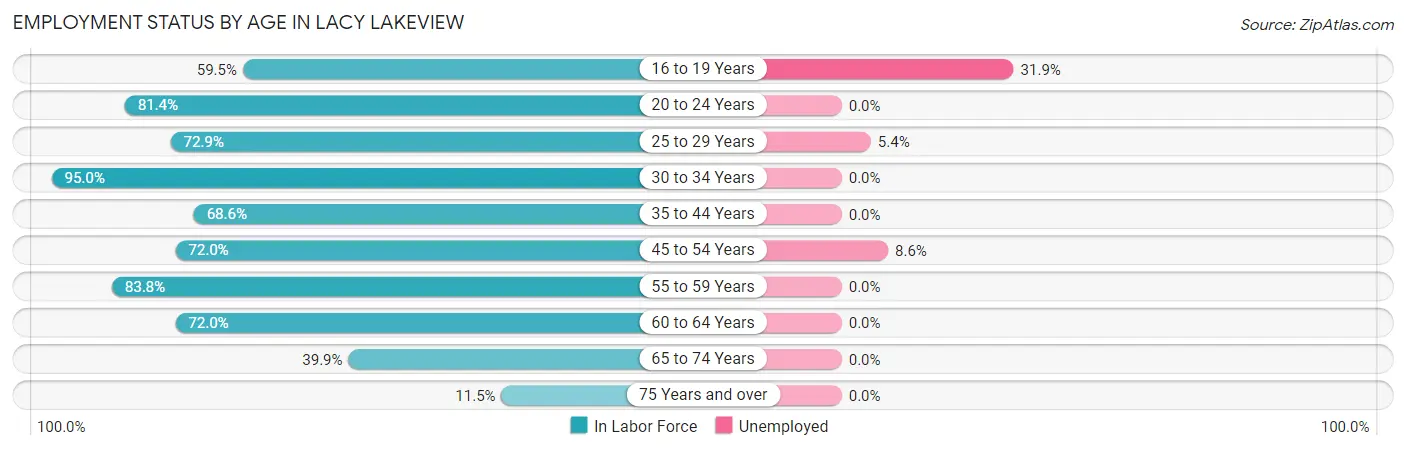
| Age Bracket | In Labor Force | Unemployed |
| 16 to 19 Years | 235 (59.5%) | 75 (31.9%) |
| 20 to 24 Years | 586 (81.4%) | 0 (0.0%) |
| 25 to 29 Years | 520 (72.9%) | 28 (5.4%) |
| 30 to 34 Years | 380 (95.0%) | 0 (0.0%) |
| 35 to 44 Years | 736 (68.6%) | 0 (0.0%) |
| 45 to 54 Years | 643 (72.0%) | 55 (8.6%) |
| 55 to 59 Years | 301 (83.8%) | 0 (0.0%) |
| 60 to 64 Years | 237 (72.0%) | 0 (0.0%) |
| 65 to 74 Years | 158 (39.9%) | 0 (0.0%) |
| 75 Years and over | 52 (11.5%) | 0 (0.0%) |
| Total | 3,851 (67.2%) | 158 (4.1%) |
Employment Status by Educational Attainment in Lacy Lakeview
According to labor force statistics for Lacy Lakeview, 74.8% of individuals (2,818) out of the total population between 25 and 64 years of age (3,767) are in the labor force, with 2.9% or 82 of them being unemployed. The group with the highest labor force participation rate are those with the educational attainment of bachelor's degree or higher, with 93.4% or 385 individuals in the labor force. Within the labor force, individuals with less than high school education have the highest percentage of unemployment, with 14.7% or 45 of them being unemployed.
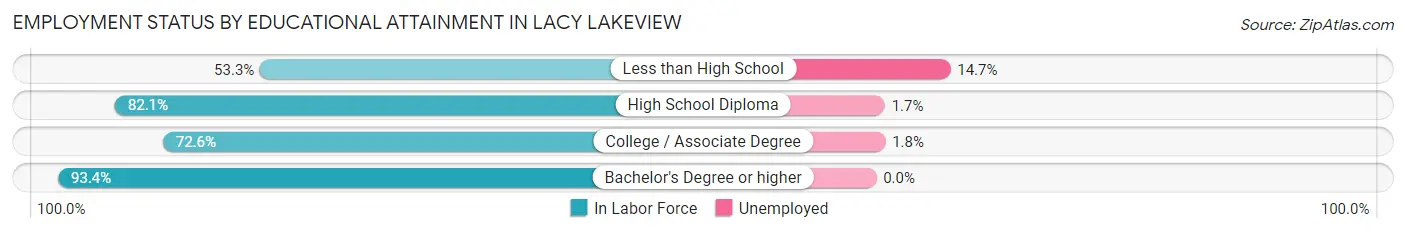
| Educational Attainment | In Labor Force | Unemployed |
| Less than High School | 307 (53.3%) | 85 (14.7%) |
| High School Diploma | 931 (82.1%) | 19 (1.7%) |
| College / Associate Degree | 1,194 (72.6%) | 30 (1.8%) |
| Bachelor's Degree or higher | 385 (93.4%) | 0 (0.0%) |
| Total | 2,818 (74.8%) | 109 (2.9%) |
Employment Occupations by Sex in Lacy Lakeview
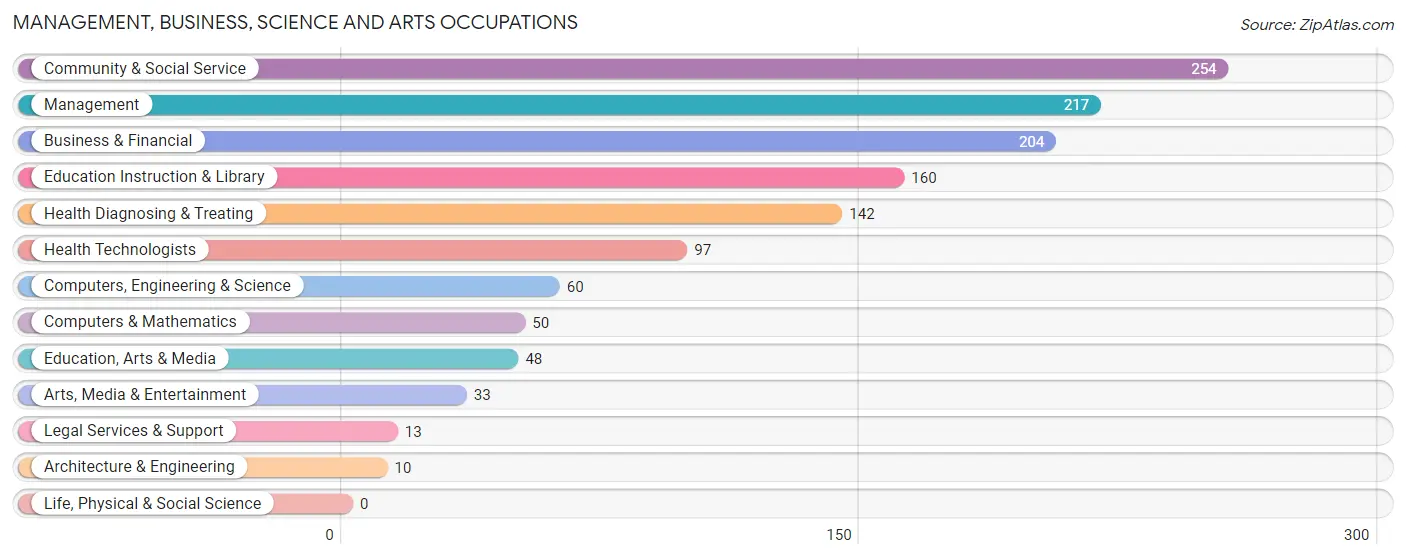
Management, Business, Science and Arts Occupations
The most common Management, Business, Science and Arts occupations in Lacy Lakeview are Community & Social Service (254 | 6.9%), Management (217 | 5.9%), Business & Financial (204 | 5.5%), Education Instruction & Library (160 | 4.3%), and Health Diagnosing & Treating (142 | 3.8%).
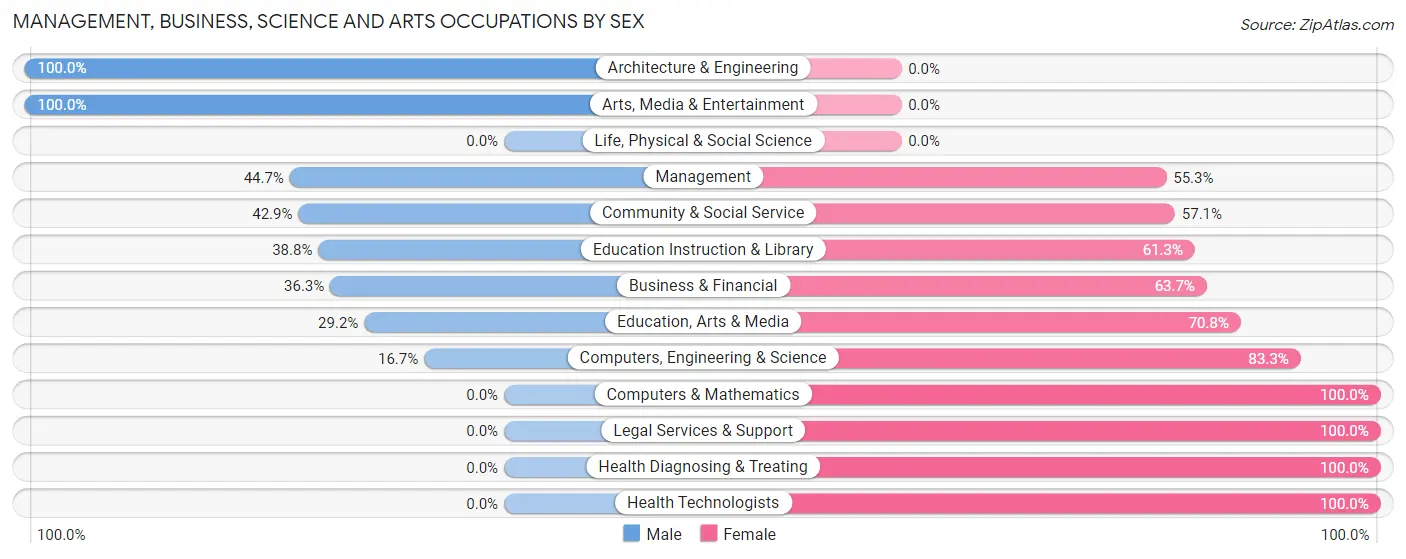
Management, Business, Science and Arts Occupations by Sex
Within the Management, Business, Science and Arts occupations in Lacy Lakeview, the most male-oriented occupations are Architecture & Engineering (100.0%), Arts, Media & Entertainment (100.0%), and Management (44.7%), while the most female-oriented occupations are Computers & Mathematics (100.0%), Legal Services & Support (100.0%), and Health Diagnosing & Treating (100.0%).
| Occupation | Male | Female |
| Management | 97 (44.7%) | 120 (55.3%) |
| Business & Financial | 74 (36.3%) | 130 (63.7%) |
| Computers, Engineering & Science | 10 (16.7%) | 50 (83.3%) |
| Computers & Mathematics | 0 (0.0%) | 50 (100.0%) |
| Architecture & Engineering | 10 (100.0%) | 0 (0.0%) |
| Life, Physical & Social Science | 0 (0.0%) | 0 (0.0%) |
| Community & Social Service | 109 (42.9%) | 145 (57.1%) |
| Education, Arts & Media | 14 (29.2%) | 34 (70.8%) |
| Legal Services & Support | 0 (0.0%) | 13 (100.0%) |
| Education Instruction & Library | 62 (38.8%) | 98 (61.3%) |
| Arts, Media & Entertainment | 33 (100.0%) | 0 (0.0%) |
| Health Diagnosing & Treating | 0 (0.0%) | 142 (100.0%) |
| Health Technologists | 0 (0.0%) | 97 (100.0%) |
| Total (Category) | 290 (33.1%) | 587 (66.9%) |
| Total (Overall) | 1,956 (53.0%) | 1,734 (47.0%) |
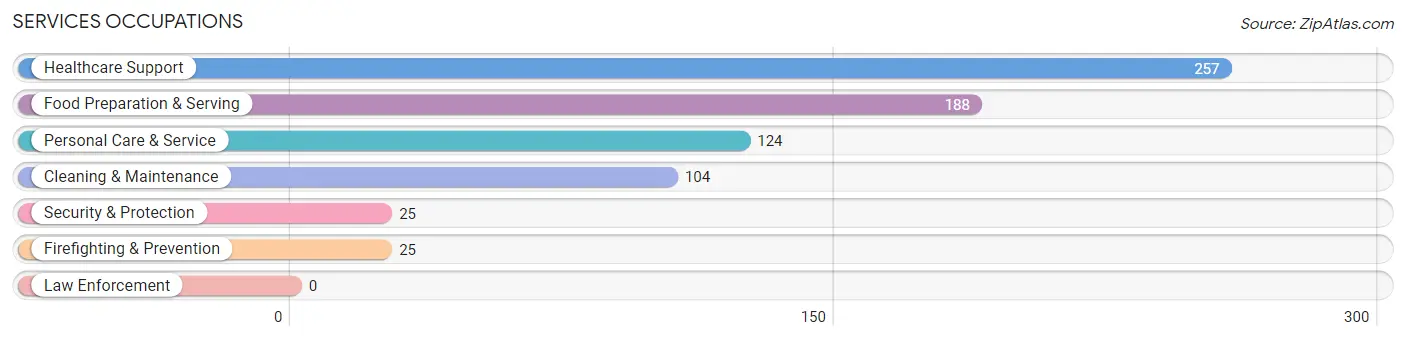
Services Occupations
The most common Services occupations in Lacy Lakeview are Healthcare Support (257 | 7.0%), Food Preparation & Serving (188 | 5.1%), Personal Care & Service (124 | 3.4%), Cleaning & Maintenance (104 | 2.8%), and Security & Protection (25 | 0.7%).
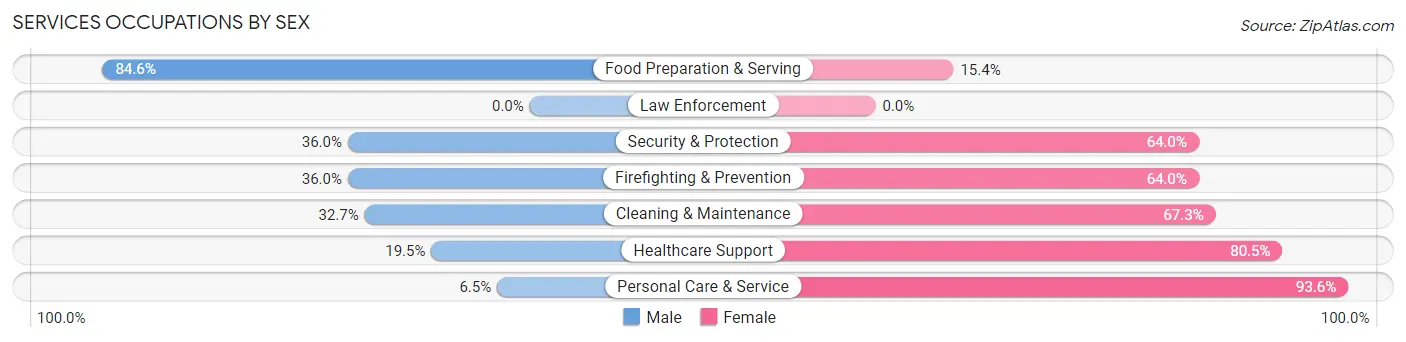
Services Occupations by Sex
Within the Services occupations in Lacy Lakeview, the most male-oriented occupations are Food Preparation & Serving (84.6%), Security & Protection (36.0%), and Firefighting & Prevention (36.0%), while the most female-oriented occupations are Personal Care & Service (93.5%), Healthcare Support (80.5%), and Cleaning & Maintenance (67.3%).
| Occupation | Male | Female |
| Healthcare Support | 50 (19.5%) | 207 (80.5%) |
| Security & Protection | 9 (36.0%) | 16 (64.0%) |
| Firefighting & Prevention | 9 (36.0%) | 16 (64.0%) |
| Law Enforcement | 0 (0.0%) | 0 (0.0%) |
| Food Preparation & Serving | 159 (84.6%) | 29 (15.4%) |
| Cleaning & Maintenance | 34 (32.7%) | 70 (67.3%) |
| Personal Care & Service | 8 (6.5%) | 116 (93.5%) |
| Total (Category) | 260 (37.2%) | 438 (62.7%) |
| Total (Overall) | 1,956 (53.0%) | 1,734 (47.0%) |
Sales and Office Occupations
The most common Sales and Office occupations in Lacy Lakeview are Office & Administration (374 | 10.1%), and Sales & Related (331 | 9.0%).

Sales and Office Occupations by Sex

| Occupation | Male | Female |
| Sales & Related | 72 (21.7%) | 259 (78.2%) |
| Office & Administration | 49 (13.1%) | 325 (86.9%) |
| Total (Category) | 121 (17.2%) | 584 (82.8%) |
| Total (Overall) | 1,956 (53.0%) | 1,734 (47.0%) |
Natural Resources, Construction and Maintenance Occupations
The most common Natural Resources, Construction and Maintenance occupations in Lacy Lakeview are Construction & Extraction (241 | 6.5%), Installation, Maintenance & Repair (111 | 3.0%), and Farming, Fishing & Forestry (27 | 0.7%).
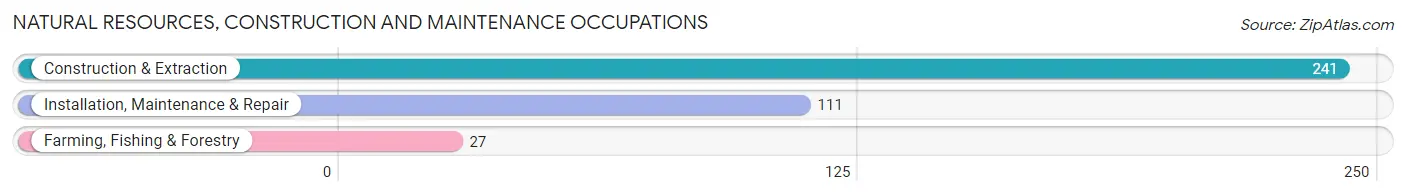
Natural Resources, Construction and Maintenance Occupations by Sex

| Occupation | Male | Female |
| Farming, Fishing & Forestry | 27 (100.0%) | 0 (0.0%) |
| Construction & Extraction | 241 (100.0%) | 0 (0.0%) |
| Installation, Maintenance & Repair | 111 (100.0%) | 0 (0.0%) |
| Total (Category) | 379 (100.0%) | 0 (0.0%) |
| Total (Overall) | 1,956 (53.0%) | 1,734 (47.0%) |
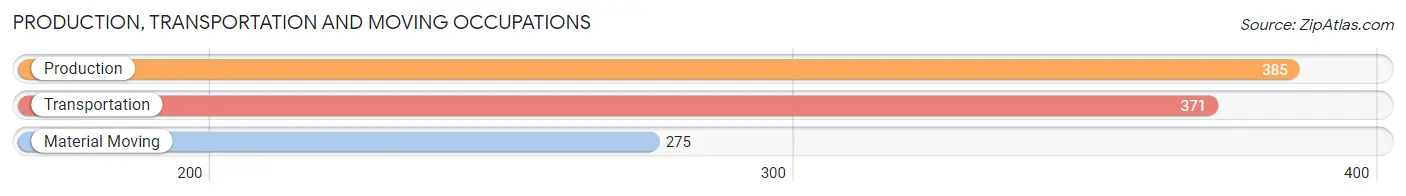
Production, Transportation and Moving Occupations
The most common Production, Transportation and Moving occupations in Lacy Lakeview are Production (385 | 10.4%), Transportation (371 | 10.1%), and Material Moving (275 | 7.4%).
Production, Transportation and Moving Occupations by Sex
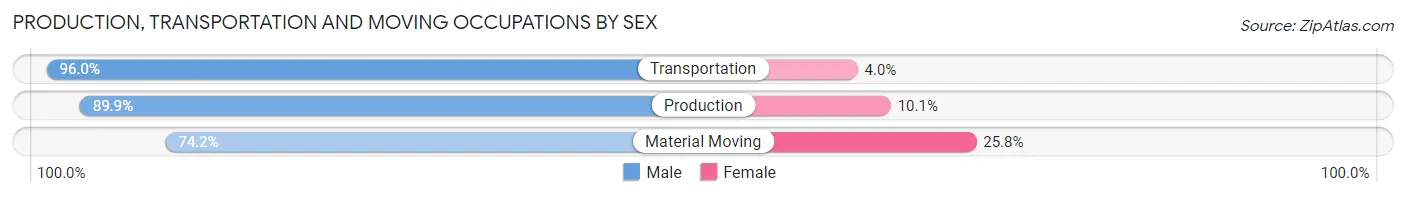
| Occupation | Male | Female |
| Production | 346 (89.9%) | 39 (10.1%) |
| Transportation | 356 (96.0%) | 15 (4.0%) |
| Material Moving | 204 (74.2%) | 71 (25.8%) |
| Total (Category) | 906 (87.9%) | 125 (12.1%) |
| Total (Overall) | 1,956 (53.0%) | 1,734 (47.0%) |
Employment Industries by Sex in Lacy Lakeview
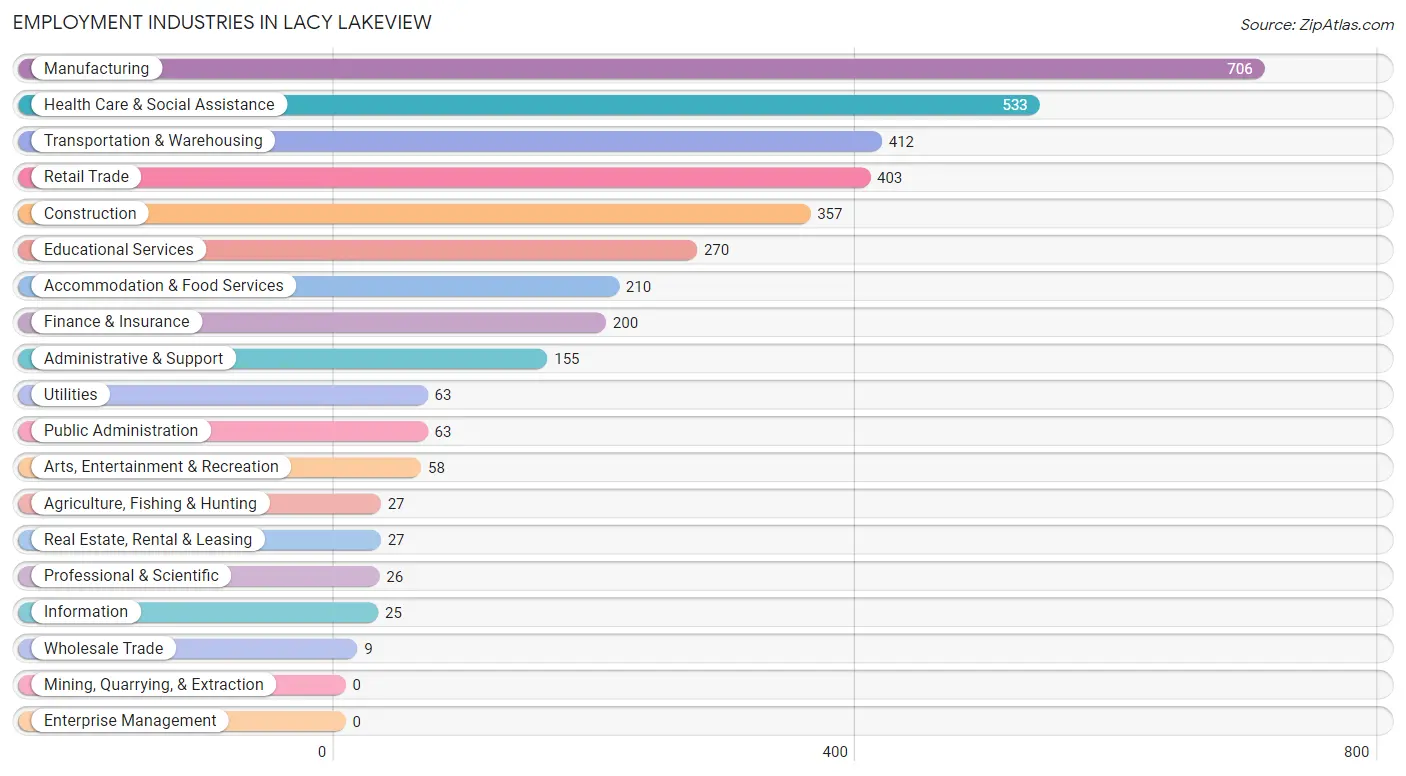
Employment Industries in Lacy Lakeview
The major employment industries in Lacy Lakeview include Manufacturing (706 | 19.1%), Health Care & Social Assistance (533 | 14.4%), Transportation & Warehousing (412 | 11.2%), Retail Trade (403 | 10.9%), and Construction (357 | 9.7%).
Employment Industries by Sex in Lacy Lakeview
The Lacy Lakeview industries that see more men than women are Agriculture, Fishing & Hunting (100.0%), Wholesale Trade (100.0%), and Utilities (100.0%), whereas the industries that tend to have a higher number of women are Health Care & Social Assistance (90.6%), Arts, Entertainment & Recreation (86.2%), and Administrative & Support (72.9%).
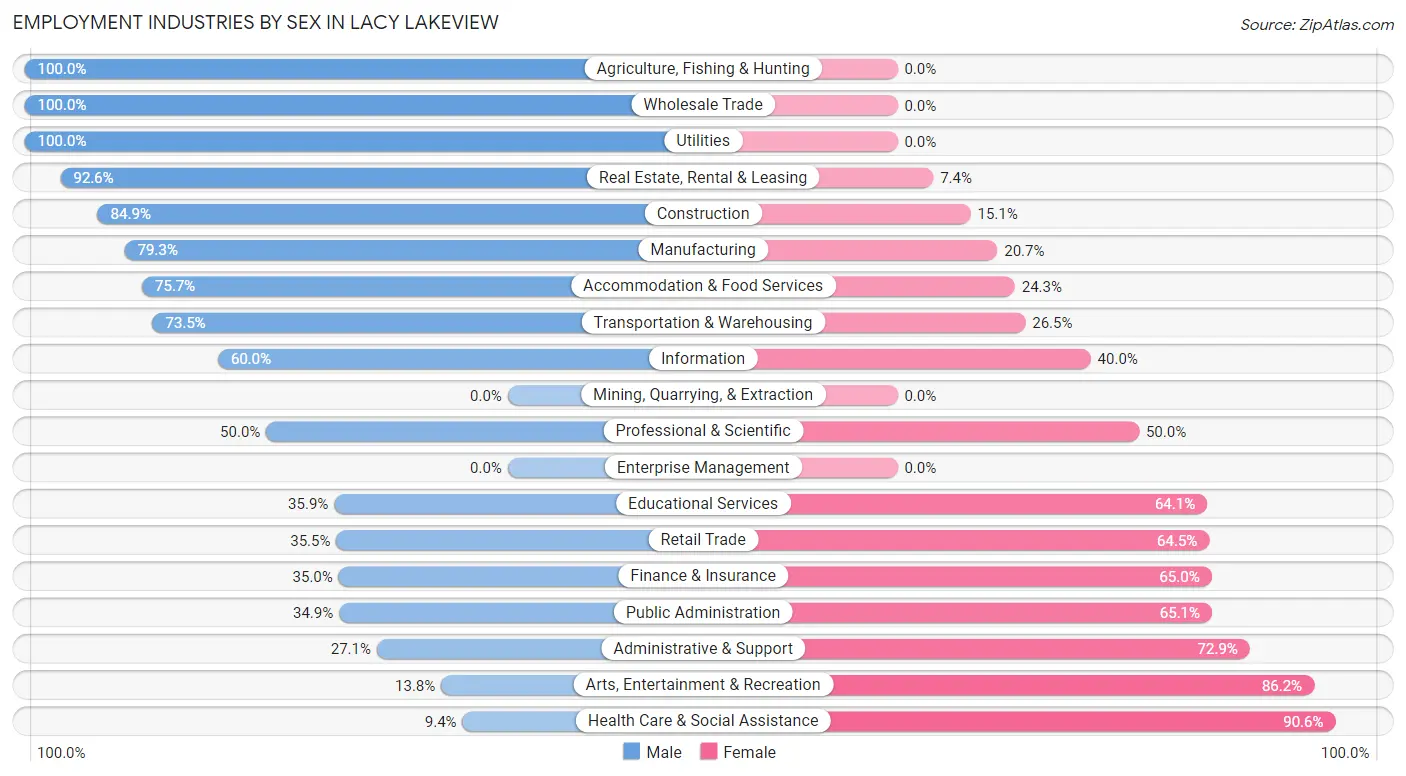
| Industry | Male | Female |
| Agriculture, Fishing & Hunting | 27 (100.0%) | 0 (0.0%) |
| Mining, Quarrying, & Extraction | 0 (0.0%) | 0 (0.0%) |
| Construction | 303 (84.9%) | 54 (15.1%) |
| Manufacturing | 560 (79.3%) | 146 (20.7%) |
| Wholesale Trade | 9 (100.0%) | 0 (0.0%) |
| Retail Trade | 143 (35.5%) | 260 (64.5%) |
| Transportation & Warehousing | 303 (73.5%) | 109 (26.5%) |
| Utilities | 63 (100.0%) | 0 (0.0%) |
| Information | 15 (60.0%) | 10 (40.0%) |
| Finance & Insurance | 70 (35.0%) | 130 (65.0%) |
| Real Estate, Rental & Leasing | 25 (92.6%) | 2 (7.4%) |
| Professional & Scientific | 13 (50.0%) | 13 (50.0%) |
| Enterprise Management | 0 (0.0%) | 0 (0.0%) |
| Administrative & Support | 42 (27.1%) | 113 (72.9%) |
| Educational Services | 97 (35.9%) | 173 (64.1%) |
| Health Care & Social Assistance | 50 (9.4%) | 483 (90.6%) |
| Arts, Entertainment & Recreation | 8 (13.8%) | 50 (86.2%) |
| Accommodation & Food Services | 159 (75.7%) | 51 (24.3%) |
| Public Administration | 22 (34.9%) | 41 (65.1%) |
| Total | 1,956 (53.0%) | 1,734 (47.0%) |
Education in Lacy Lakeview
School Enrollment in Lacy Lakeview
The most common levels of schooling among the 1,440 students in Lacy Lakeview are middle school (373 | 25.9%), elementary school (372 | 25.8%), and college / undergraduate (270 | 18.8%).
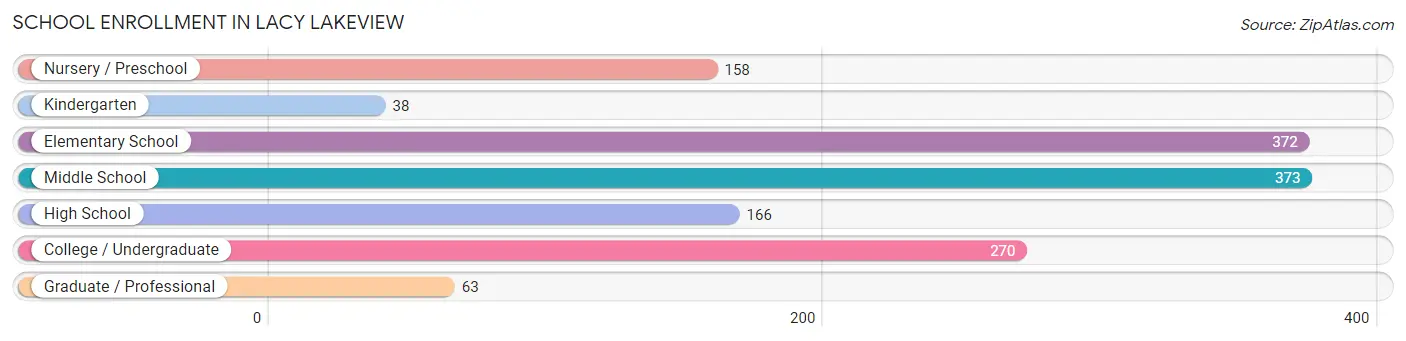
| School Level | # Students | % Students |
| Nursery / Preschool | 158 | 11.0% |
| Kindergarten | 38 | 2.6% |
| Elementary School | 372 | 25.8% |
| Middle School | 373 | 25.9% |
| High School | 166 | 11.5% |
| College / Undergraduate | 270 | 18.8% |
| Graduate / Professional | 63 | 4.4% |
| Total | 1,440 | 100.0% |
School Enrollment by Age by Funding Source in Lacy Lakeview
Out of a total of 1,440 students who are enrolled in schools in Lacy Lakeview, 248 (17.2%) attend a private institution, while the remaining 1,192 (82.8%) are enrolled in public schools. The age group of 3 to 4 year olds has the highest likelihood of being enrolled in private schools, with 100 (74.1% in the age bracket) enrolled. Conversely, the age group of 18 to 19 year olds has the lowest likelihood of being enrolled in a private school, with 32 (100.0% in the age bracket) attending a public institution.
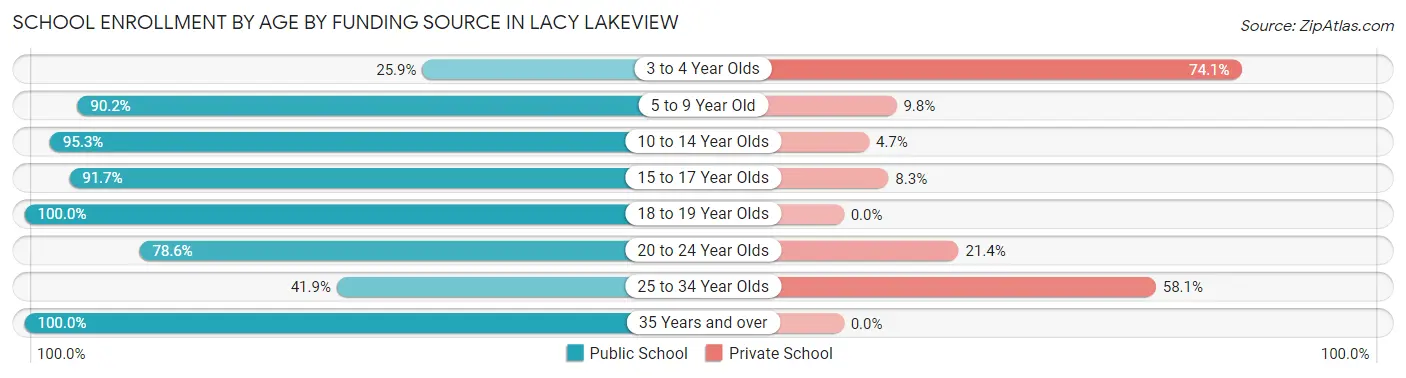
| Age Bracket | Public School | Private School |
| 3 to 4 Year Olds | 35 (25.9%) | 100 (74.1%) |
| 5 to 9 Year Old | 348 (90.2%) | 38 (9.8%) |
| 10 to 14 Year Olds | 444 (95.3%) | 22 (4.7%) |
| 15 to 17 Year Olds | 110 (91.7%) | 10 (8.3%) |
| 18 to 19 Year Olds | 32 (100.0%) | 0 (0.0%) |
| 20 to 24 Year Olds | 191 (78.6%) | 52 (21.4%) |
| 25 to 34 Year Olds | 18 (41.9%) | 25 (58.1%) |
| 35 Years and over | 15 (100.0%) | 0 (0.0%) |
| Total | 1,192 (82.8%) | 248 (17.2%) |
Educational Attainment by Field of Study in Lacy Lakeview
Business (202 | 29.1%), education (156 | 22.5%), communications (83 | 12.0%), computers & mathematics (67 | 9.7%), and physical & health sciences (49 | 7.1%) are the most common fields of study among 694 individuals in Lacy Lakeview who have obtained a bachelor's degree or higher.
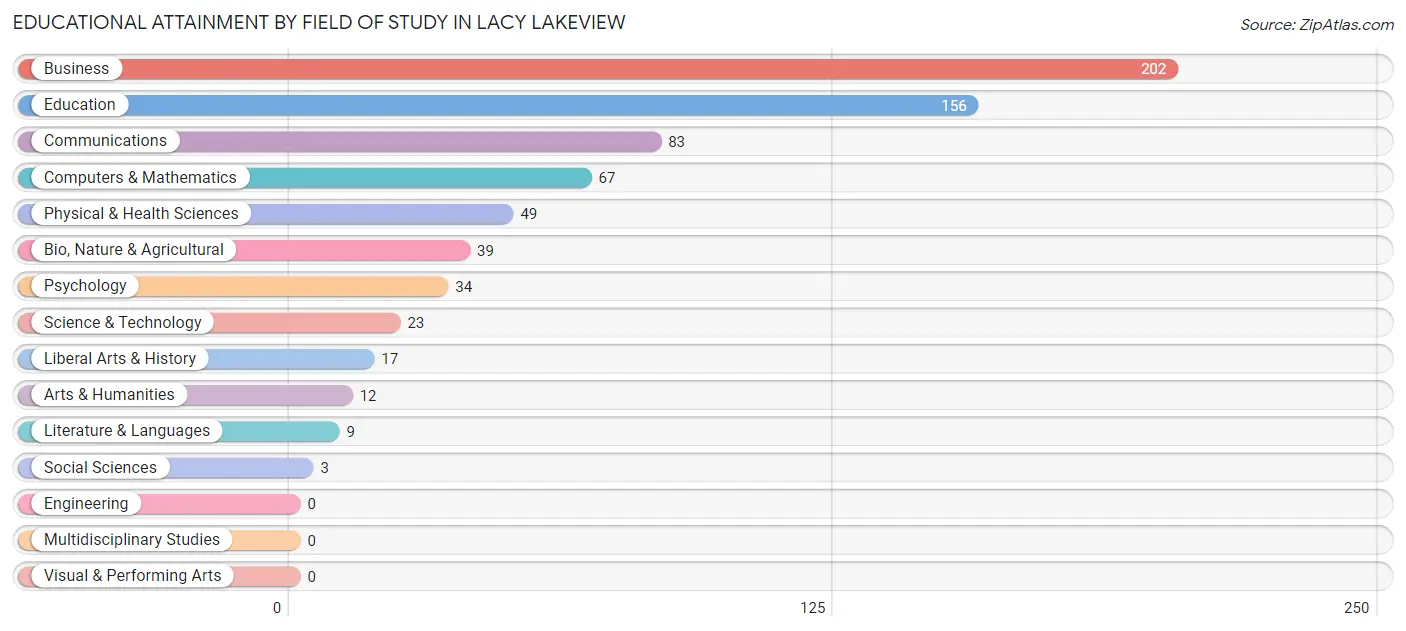
| Field of Study | # Graduates | % Graduates |
| Computers & Mathematics | 67 | 9.7% |
| Bio, Nature & Agricultural | 39 | 5.6% |
| Physical & Health Sciences | 49 | 7.1% |
| Psychology | 34 | 4.9% |
| Social Sciences | 3 | 0.4% |
| Engineering | 0 | 0.0% |
| Multidisciplinary Studies | 0 | 0.0% |
| Science & Technology | 23 | 3.3% |
| Business | 202 | 29.1% |
| Education | 156 | 22.5% |
| Literature & Languages | 9 | 1.3% |
| Liberal Arts & History | 17 | 2.5% |
| Visual & Performing Arts | 0 | 0.0% |
| Communications | 83 | 12.0% |
| Arts & Humanities | 12 | 1.7% |
| Total | 694 | 100.0% |
Transportation & Commute in Lacy Lakeview
Vehicle Availability by Sex in Lacy Lakeview
The most prevalent vehicle ownership categories in Lacy Lakeview are males with 1 vehicle (758, accounting for 38.9%) and females with 1 vehicle (635, making up 43.7%).
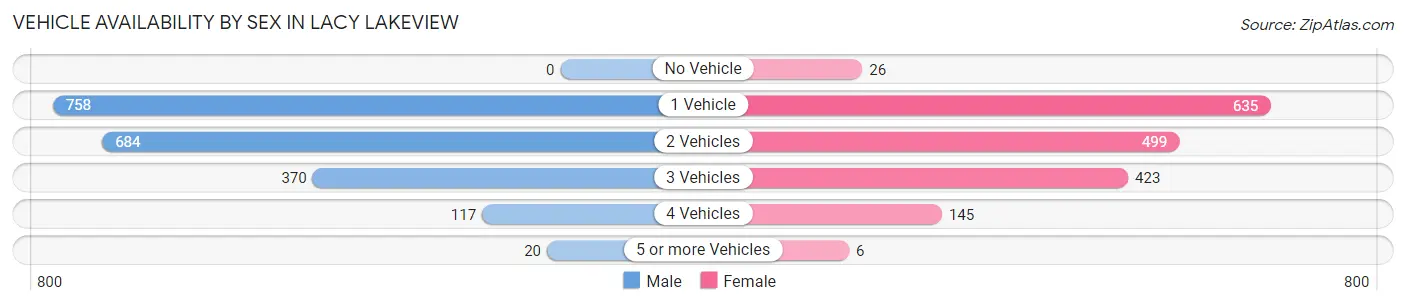
| Vehicles Available | Male | Female |
| No Vehicle | 0 (0.0%) | 26 (1.5%) |
| 1 Vehicle | 758 (38.9%) | 635 (36.6%) |
| 2 Vehicles | 684 (35.1%) | 499 (28.8%) |
| 3 Vehicles | 370 (19.0%) | 423 (24.4%) |
| 4 Vehicles | 117 (6.0%) | 145 (8.4%) |
| 5 or more Vehicles | 20 (1.0%) | 6 (0.4%) |
| Total | 1,949 (100.0%) | 1,734 (100.0%) |
Commute Time in Lacy Lakeview
The most frequently occuring commute durations in Lacy Lakeview are 15 to 19 minutes (926 commuters, 27.4%), 20 to 24 minutes (560 commuters, 16.6%), and 5 to 9 minutes (440 commuters, 13.0%).
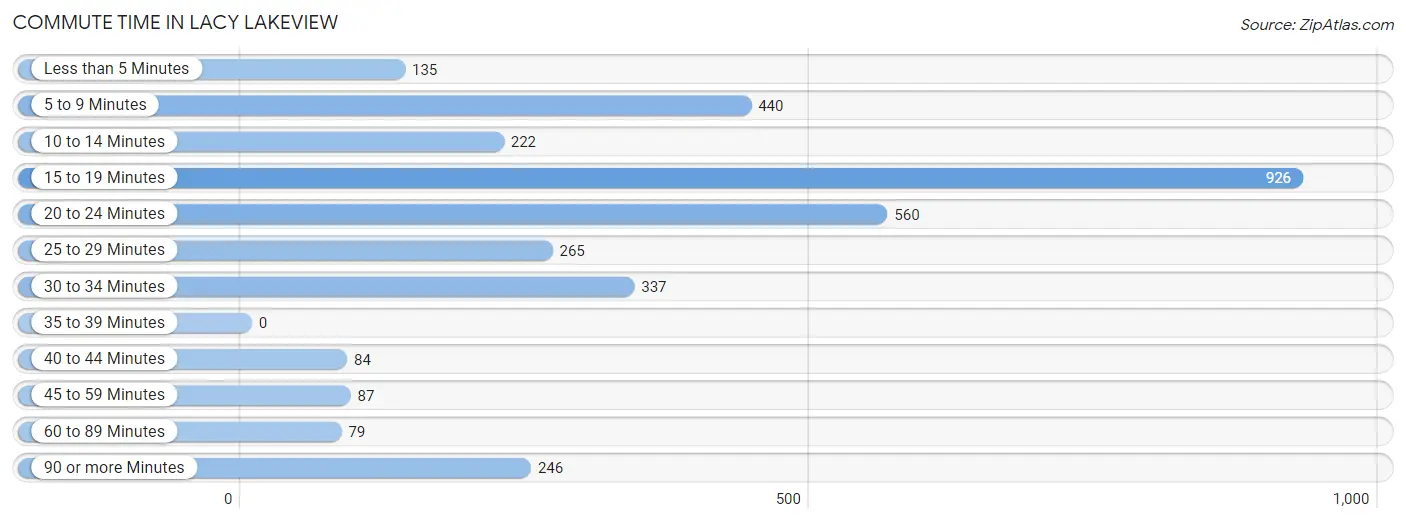
| Commute Time | # Commuters | % Commuters |
| Less than 5 Minutes | 135 | 4.0% |
| 5 to 9 Minutes | 440 | 13.0% |
| 10 to 14 Minutes | 222 | 6.6% |
| 15 to 19 Minutes | 926 | 27.4% |
| 20 to 24 Minutes | 560 | 16.6% |
| 25 to 29 Minutes | 265 | 7.8% |
| 30 to 34 Minutes | 337 | 10.0% |
| 35 to 39 Minutes | 0 | 0.0% |
| 40 to 44 Minutes | 84 | 2.5% |
| 45 to 59 Minutes | 87 | 2.6% |
| 60 to 89 Minutes | 79 | 2.3% |
| 90 or more Minutes | 246 | 7.3% |
Commute Time by Sex in Lacy Lakeview
The most common commute times in Lacy Lakeview are 15 to 19 minutes (705 commuters, 37.0%) for males and 20 to 24 minutes (370 commuters, 25.0%) for females.
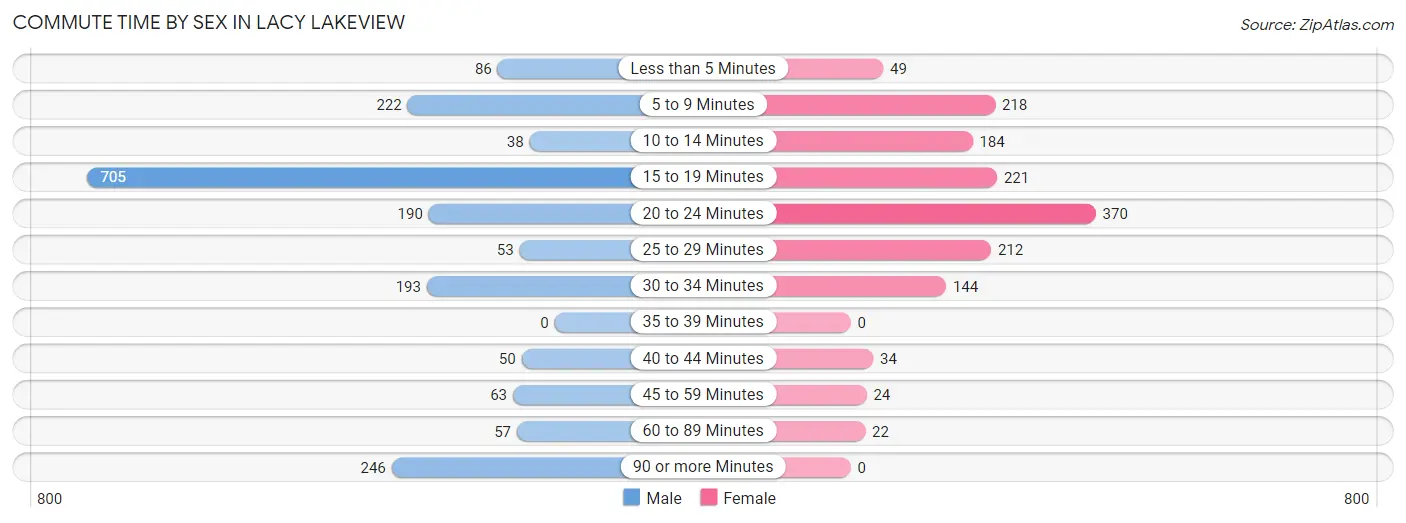
| Commute Time | Male | Female |
| Less than 5 Minutes | 86 (4.5%) | 49 (3.3%) |
| 5 to 9 Minutes | 222 (11.7%) | 218 (14.7%) |
| 10 to 14 Minutes | 38 (2.0%) | 184 (12.4%) |
| 15 to 19 Minutes | 705 (37.0%) | 221 (14.9%) |
| 20 to 24 Minutes | 190 (10.0%) | 370 (25.0%) |
| 25 to 29 Minutes | 53 (2.8%) | 212 (14.3%) |
| 30 to 34 Minutes | 193 (10.1%) | 144 (9.7%) |
| 35 to 39 Minutes | 0 (0.0%) | 0 (0.0%) |
| 40 to 44 Minutes | 50 (2.6%) | 34 (2.3%) |
| 45 to 59 Minutes | 63 (3.3%) | 24 (1.6%) |
| 60 to 89 Minutes | 57 (3.0%) | 22 (1.5%) |
| 90 or more Minutes | 246 (12.9%) | 0 (0.0%) |
Time of Departure to Work by Sex in Lacy Lakeview
The most frequent times of departure to work in Lacy Lakeview are 7:30 AM to 7:59 AM (242, 12.7%) for males and 7:30 AM to 7:59 AM (319, 21.6%) for females.
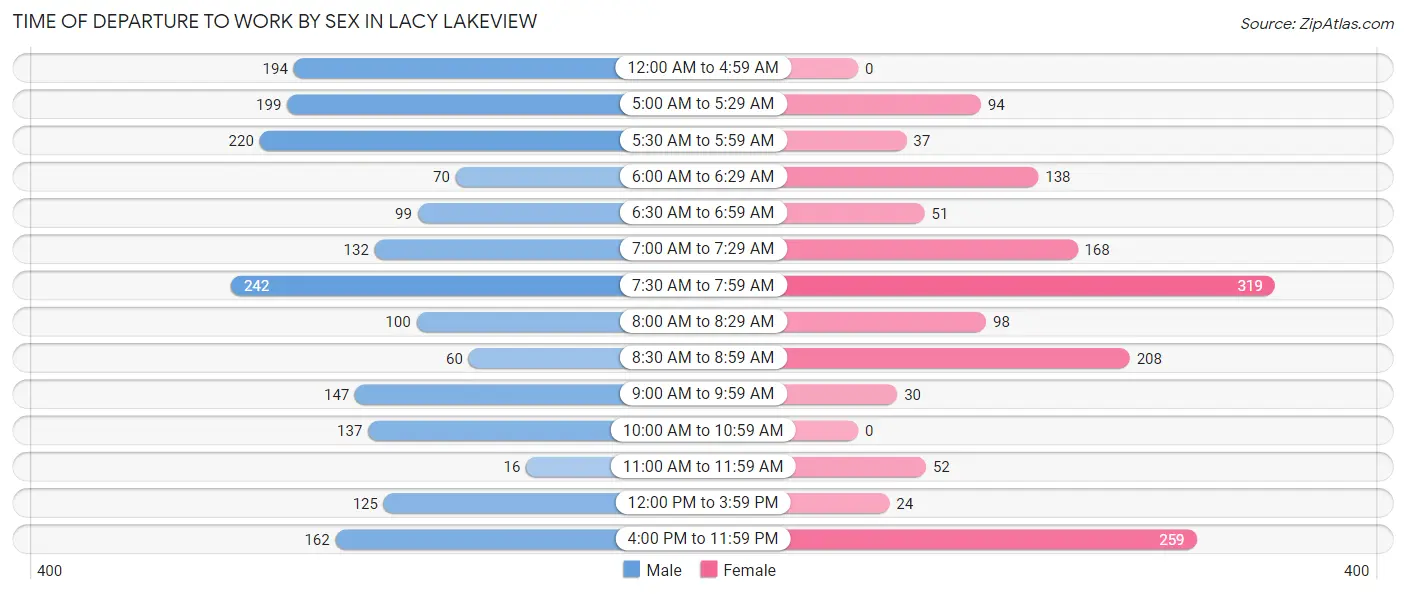
| Time of Departure | Male | Female |
| 12:00 AM to 4:59 AM | 194 (10.2%) | 0 (0.0%) |
| 5:00 AM to 5:29 AM | 199 (10.5%) | 94 (6.4%) |
| 5:30 AM to 5:59 AM | 220 (11.6%) | 37 (2.5%) |
| 6:00 AM to 6:29 AM | 70 (3.7%) | 138 (9.3%) |
| 6:30 AM to 6:59 AM | 99 (5.2%) | 51 (3.5%) |
| 7:00 AM to 7:29 AM | 132 (6.9%) | 168 (11.4%) |
| 7:30 AM to 7:59 AM | 242 (12.7%) | 319 (21.6%) |
| 8:00 AM to 8:29 AM | 100 (5.2%) | 98 (6.6%) |
| 8:30 AM to 8:59 AM | 60 (3.2%) | 208 (14.1%) |
| 9:00 AM to 9:59 AM | 147 (7.7%) | 30 (2.0%) |
| 10:00 AM to 10:59 AM | 137 (7.2%) | 0 (0.0%) |
| 11:00 AM to 11:59 AM | 16 (0.8%) | 52 (3.5%) |
| 12:00 PM to 3:59 PM | 125 (6.6%) | 24 (1.6%) |
| 4:00 PM to 11:59 PM | 162 (8.5%) | 259 (17.5%) |
| Total | 1,903 (100.0%) | 1,478 (100.0%) |
Housing Occupancy in Lacy Lakeview
Occupancy by Ownership in Lacy Lakeview
Of the total 2,894 dwellings in Lacy Lakeview, owner-occupied units account for 1,297 (44.8%), while renter-occupied units make up 1,597 (55.2%).
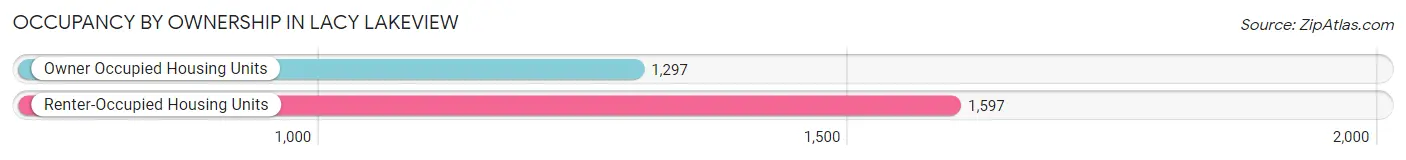
| Occupancy | # Housing Units | % Housing Units |
| Owner Occupied Housing Units | 1,297 | 44.8% |
| Renter-Occupied Housing Units | 1,597 | 55.2% |
| Total Occupied Housing Units | 2,894 | 100.0% |
Occupancy by Household Size in Lacy Lakeview
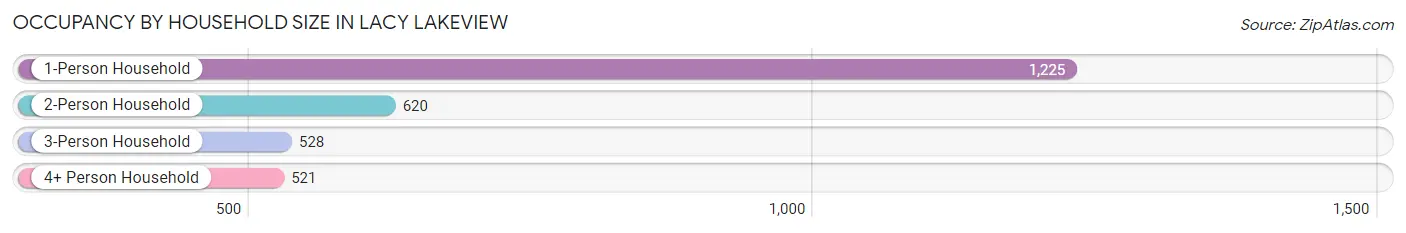
| Household Size | # Housing Units | % Housing Units |
| 1-Person Household | 1,225 | 42.3% |
| 2-Person Household | 620 | 21.4% |
| 3-Person Household | 528 | 18.2% |
| 4+ Person Household | 521 | 18.0% |
| Total Housing Units | 2,894 | 100.0% |
Occupancy by Ownership by Household Size in Lacy Lakeview
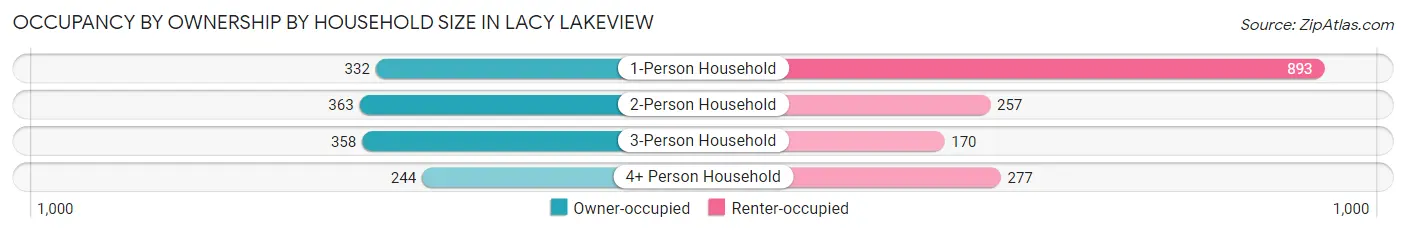
| Household Size | Owner-occupied | Renter-occupied |
| 1-Person Household | 332 (27.1%) | 893 (72.9%) |
| 2-Person Household | 363 (58.6%) | 257 (41.4%) |
| 3-Person Household | 358 (67.8%) | 170 (32.2%) |
| 4+ Person Household | 244 (46.8%) | 277 (53.2%) |
| Total Housing Units | 1,297 (44.8%) | 1,597 (55.2%) |
Occupancy by Educational Attainment in Lacy Lakeview
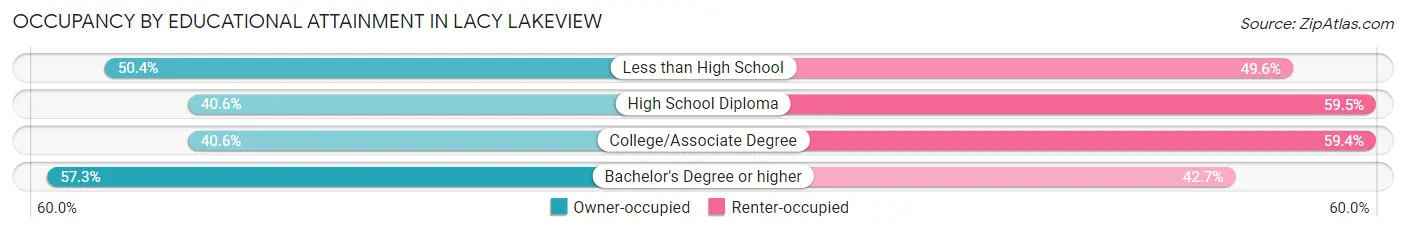
| Household Size | Owner-occupied | Renter-occupied |
| Less than High School | 172 (50.4%) | 169 (49.6%) |
| High School Diploma | 324 (40.6%) | 475 (59.5%) |
| College/Associate Degree | 495 (40.6%) | 725 (59.4%) |
| Bachelor's Degree or higher | 306 (57.3%) | 228 (42.7%) |
Occupancy by Age of Householder in Lacy Lakeview
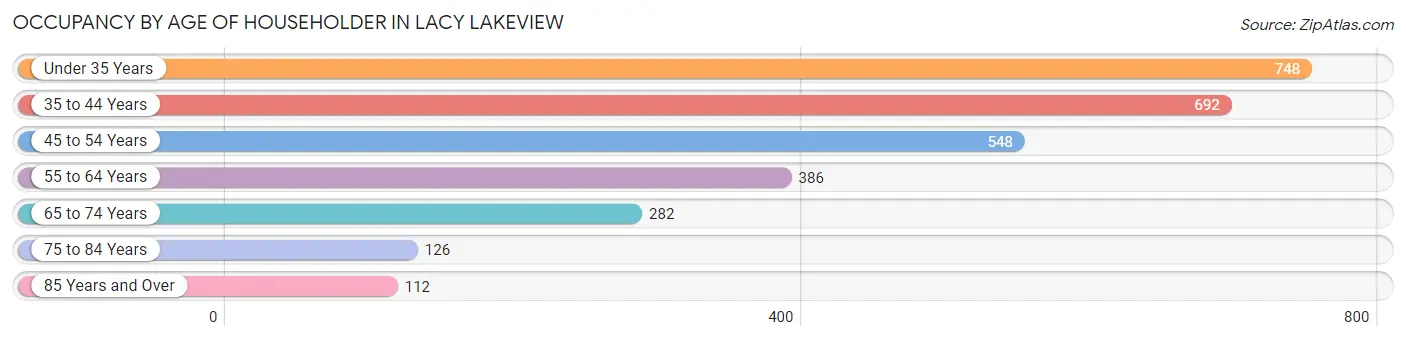
| Age Bracket | # Households | % Households |
| Under 35 Years | 748 | 25.9% |
| 35 to 44 Years | 692 | 23.9% |
| 45 to 54 Years | 548 | 18.9% |
| 55 to 64 Years | 386 | 13.3% |
| 65 to 74 Years | 282 | 9.7% |
| 75 to 84 Years | 126 | 4.3% |
| 85 Years and Over | 112 | 3.9% |
| Total | 2,894 | 100.0% |
Housing Finances in Lacy Lakeview
Median Income by Occupancy in Lacy Lakeview
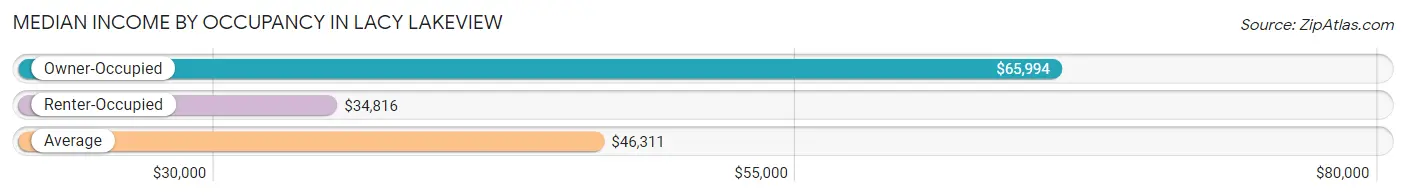
| Occupancy Type | # Households | Median Income |
| Owner-Occupied | 1,297 (44.8%) | $65,994 |
| Renter-Occupied | 1,597 (55.2%) | $34,816 |
| Average | 2,894 (100.0%) | $46,311 |
Occupancy by Householder Income Bracket in Lacy Lakeview
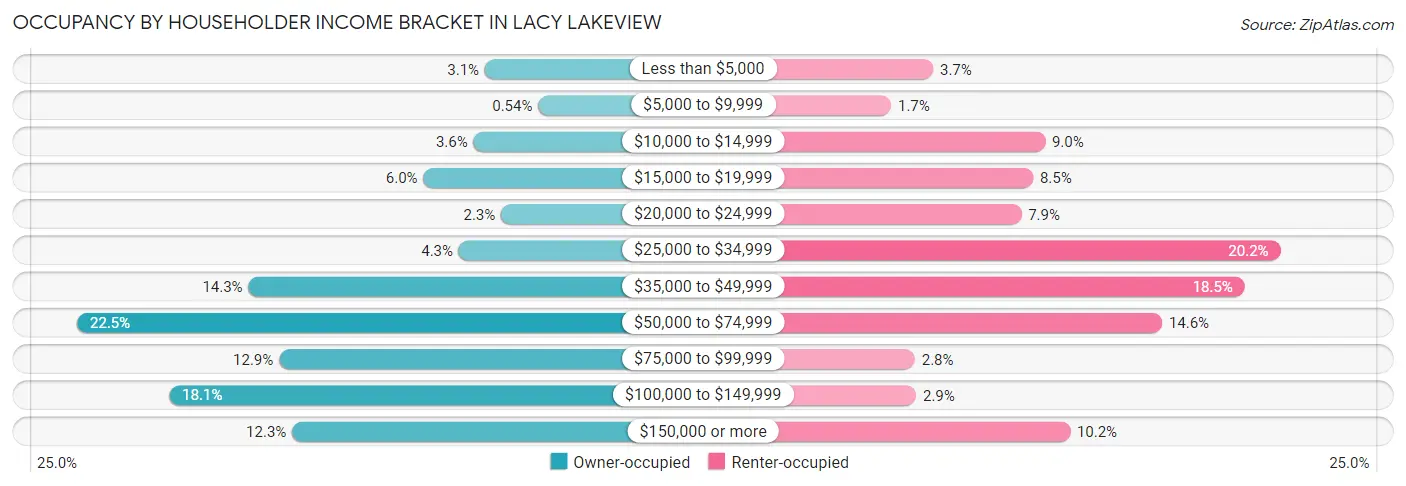
| Income Bracket | Owner-occupied | Renter-occupied |
| Less than $5,000 | 40 (3.1%) | 59 (3.7%) |
| $5,000 to $9,999 | 7 (0.5%) | 27 (1.7%) |
| $10,000 to $14,999 | 47 (3.6%) | 144 (9.0%) |
| $15,000 to $19,999 | 78 (6.0%) | 135 (8.5%) |
| $20,000 to $24,999 | 30 (2.3%) | 126 (7.9%) |
| $25,000 to $34,999 | 56 (4.3%) | 323 (20.2%) |
| $35,000 to $49,999 | 186 (14.3%) | 296 (18.5%) |
| $50,000 to $74,999 | 292 (22.5%) | 233 (14.6%) |
| $75,000 to $99,999 | 167 (12.9%) | 45 (2.8%) |
| $100,000 to $149,999 | 235 (18.1%) | 46 (2.9%) |
| $150,000 or more | 159 (12.3%) | 163 (10.2%) |
| Total | 1,297 (100.0%) | 1,597 (100.0%) |
Monthly Housing Cost Tiers in Lacy Lakeview
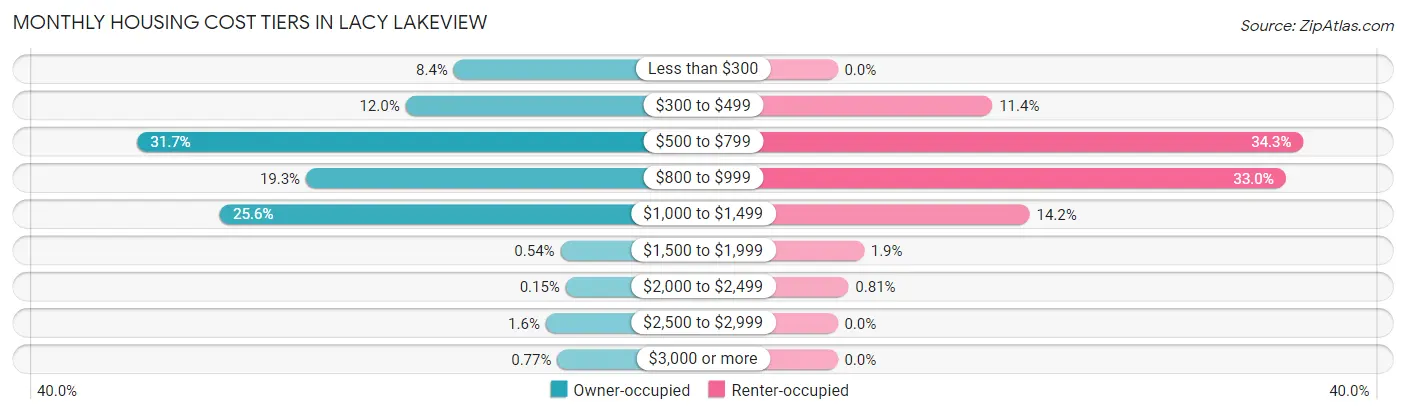
| Monthly Cost | Owner-occupied | Renter-occupied |
| Less than $300 | 109 (8.4%) | 0 (0.0%) |
| $300 to $499 | 155 (11.9%) | 182 (11.4%) |
| $500 to $799 | 411 (31.7%) | 548 (34.3%) |
| $800 to $999 | 250 (19.3%) | 527 (33.0%) |
| $1,000 to $1,499 | 332 (25.6%) | 226 (14.1%) |
| $1,500 to $1,999 | 7 (0.5%) | 31 (1.9%) |
| $2,000 to $2,499 | 2 (0.2%) | 13 (0.8%) |
| $2,500 to $2,999 | 21 (1.6%) | 0 (0.0%) |
| $3,000 or more | 10 (0.8%) | 0 (0.0%) |
| Total | 1,297 (100.0%) | 1,597 (100.0%) |
Physical Housing Characteristics in Lacy Lakeview
Housing Structures in Lacy Lakeview
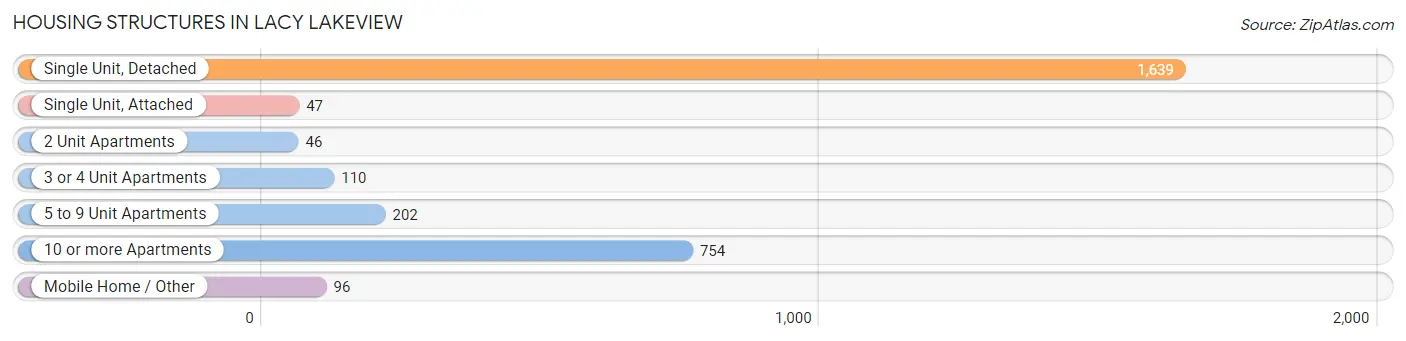
| Structure Type | # Housing Units | % Housing Units |
| Single Unit, Detached | 1,639 | 56.6% |
| Single Unit, Attached | 47 | 1.6% |
| 2 Unit Apartments | 46 | 1.6% |
| 3 or 4 Unit Apartments | 110 | 3.8% |
| 5 to 9 Unit Apartments | 202 | 7.0% |
| 10 or more Apartments | 754 | 26.1% |
| Mobile Home / Other | 96 | 3.3% |
| Total | 2,894 | 100.0% |
Housing Structures by Occupancy in Lacy Lakeview
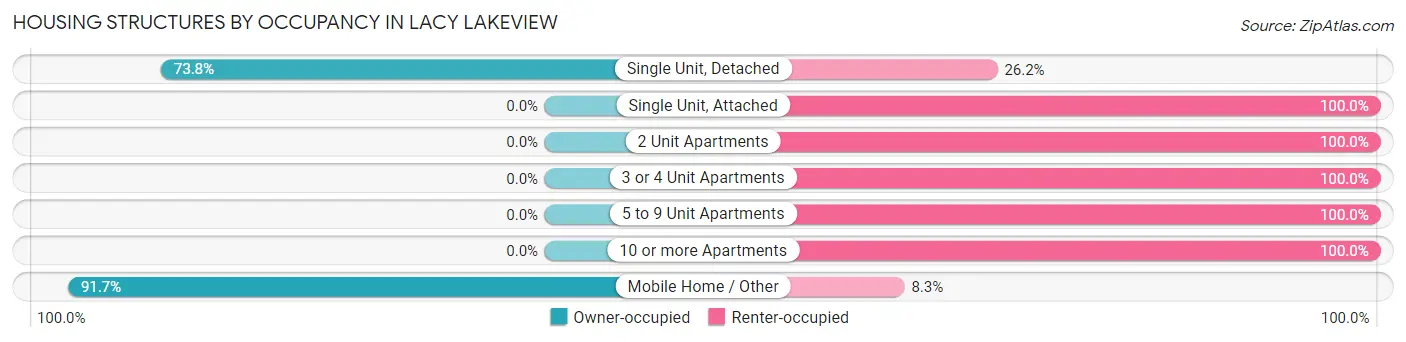
| Structure Type | Owner-occupied | Renter-occupied |
| Single Unit, Detached | 1,209 (73.8%) | 430 (26.2%) |
| Single Unit, Attached | 0 (0.0%) | 47 (100.0%) |
| 2 Unit Apartments | 0 (0.0%) | 46 (100.0%) |
| 3 or 4 Unit Apartments | 0 (0.0%) | 110 (100.0%) |
| 5 to 9 Unit Apartments | 0 (0.0%) | 202 (100.0%) |
| 10 or more Apartments | 0 (0.0%) | 754 (100.0%) |
| Mobile Home / Other | 88 (91.7%) | 8 (8.3%) |
| Total | 1,297 (44.8%) | 1,597 (55.2%) |
Housing Structures by Number of Rooms in Lacy Lakeview
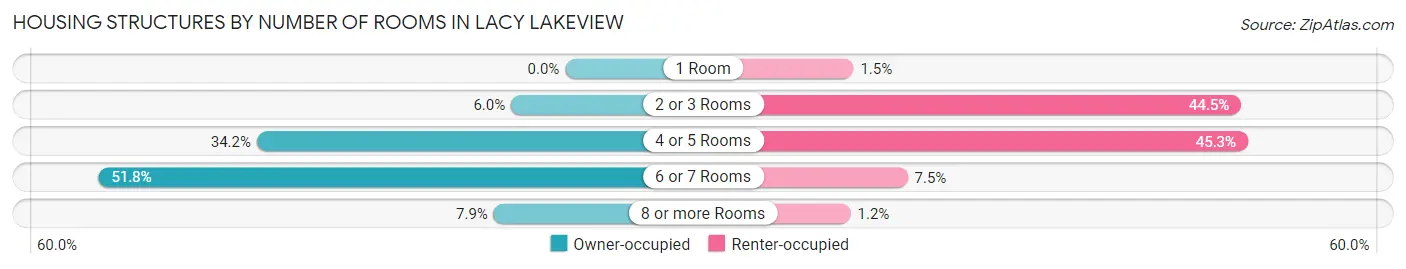
| Number of Rooms | Owner-occupied | Renter-occupied |
| 1 Room | 0 (0.0%) | 24 (1.5%) |
| 2 or 3 Rooms | 78 (6.0%) | 711 (44.5%) |
| 4 or 5 Rooms | 444 (34.2%) | 723 (45.3%) |
| 6 or 7 Rooms | 672 (51.8%) | 120 (7.5%) |
| 8 or more Rooms | 103 (7.9%) | 19 (1.2%) |
| Total | 1,297 (100.0%) | 1,597 (100.0%) |
Housing Structure by Heating Type in Lacy Lakeview
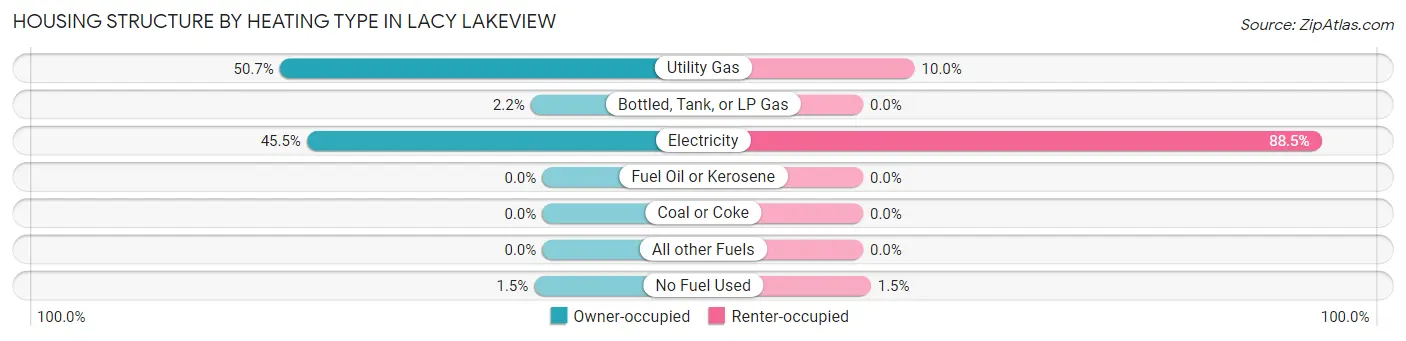
| Heating Type | Owner-occupied | Renter-occupied |
| Utility Gas | 658 (50.7%) | 159 (10.0%) |
| Bottled, Tank, or LP Gas | 29 (2.2%) | 0 (0.0%) |
| Electricity | 590 (45.5%) | 1,414 (88.5%) |
| Fuel Oil or Kerosene | 0 (0.0%) | 0 (0.0%) |
| Coal or Coke | 0 (0.0%) | 0 (0.0%) |
| All other Fuels | 0 (0.0%) | 0 (0.0%) |
| No Fuel Used | 20 (1.5%) | 24 (1.5%) |
| Total | 1,297 (100.0%) | 1,597 (100.0%) |
Household Vehicle Usage in Lacy Lakeview
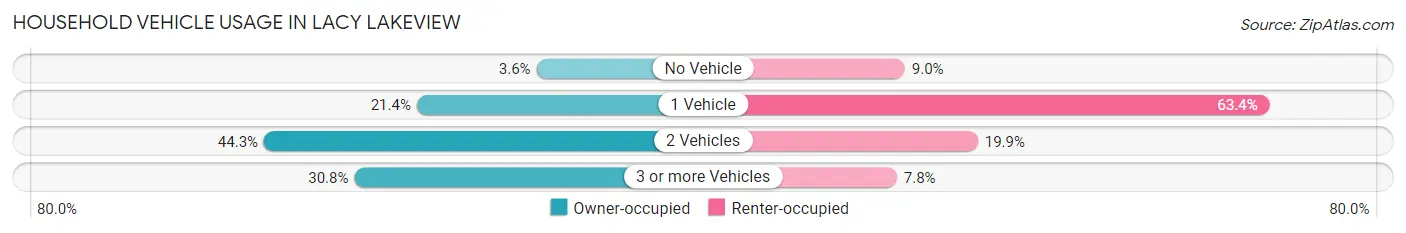
| Vehicles per Household | Owner-occupied | Renter-occupied |
| No Vehicle | 46 (3.5%) | 143 (8.9%) |
| 1 Vehicle | 278 (21.4%) | 1,013 (63.4%) |
| 2 Vehicles | 574 (44.3%) | 317 (19.9%) |
| 3 or more Vehicles | 399 (30.8%) | 124 (7.8%) |
| Total | 1,297 (100.0%) | 1,597 (100.0%) |
Real Estate & Mortgages in Lacy Lakeview
Real Estate and Mortgage Overview in Lacy Lakeview
| Characteristic | Without Mortgage | With Mortgage |
| Housing Units | 664 | 633 |
| Median Property Value | $116,600 | $151,900 |
| Median Household Income | $54,300 | $68 |
| Monthly Housing Costs | $548 | $10 |
| Real Estate Taxes | $1,319 | $33 |
Property Value by Mortgage Status in Lacy Lakeview
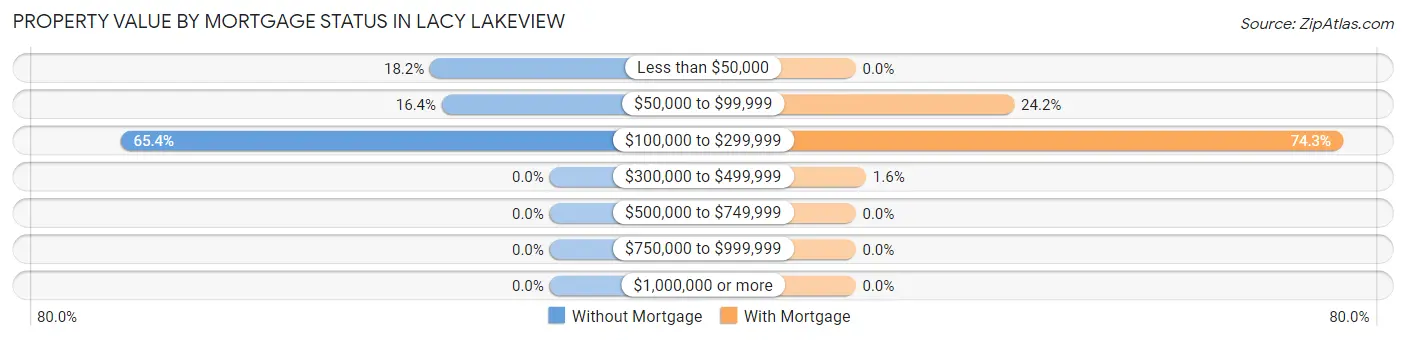
| Property Value | Without Mortgage | With Mortgage |
| Less than $50,000 | 121 (18.2%) | 0 (0.0%) |
| $50,000 to $99,999 | 109 (16.4%) | 153 (24.2%) |
| $100,000 to $299,999 | 434 (65.4%) | 470 (74.3%) |
| $300,000 to $499,999 | 0 (0.0%) | 10 (1.6%) |
| $500,000 to $749,999 | 0 (0.0%) | 0 (0.0%) |
| $750,000 to $999,999 | 0 (0.0%) | 0 (0.0%) |
| $1,000,000 or more | 0 (0.0%) | 0 (0.0%) |
| Total | 664 (100.0%) | 633 (100.0%) |
Household Income by Mortgage Status in Lacy Lakeview
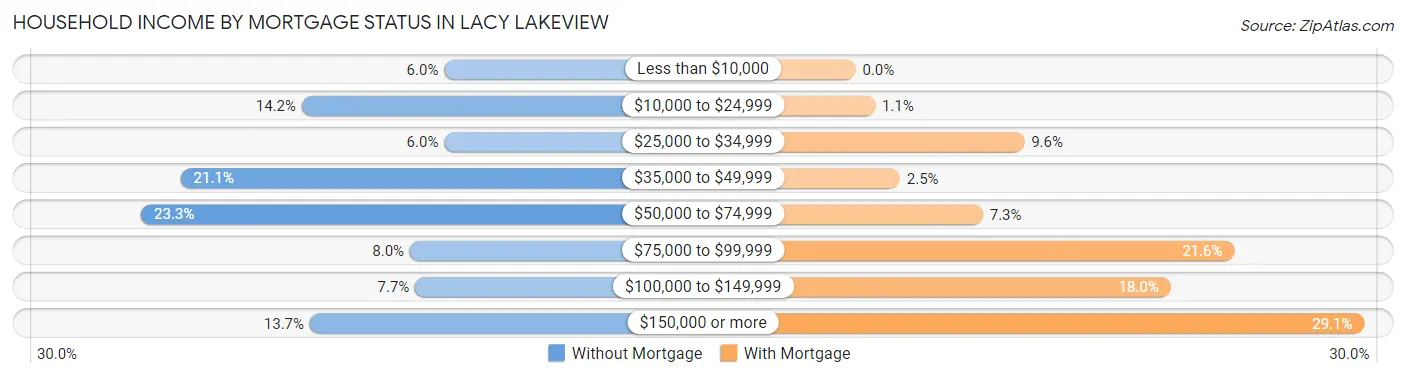
| Household Income | Without Mortgage | With Mortgage |
| Less than $10,000 | 40 (6.0%) | 0 (0.0%) |
| $10,000 to $24,999 | 94 (14.2%) | 7 (1.1%) |
| $25,000 to $34,999 | 40 (6.0%) | 61 (9.6%) |
| $35,000 to $49,999 | 140 (21.1%) | 16 (2.5%) |
| $50,000 to $74,999 | 155 (23.3%) | 46 (7.3%) |
| $75,000 to $99,999 | 53 (8.0%) | 137 (21.6%) |
| $100,000 to $149,999 | 51 (7.7%) | 114 (18.0%) |
| $150,000 or more | 91 (13.7%) | 184 (29.1%) |
| Total | 664 (100.0%) | 633 (100.0%) |
Property Value to Household Income Ratio in Lacy Lakeview
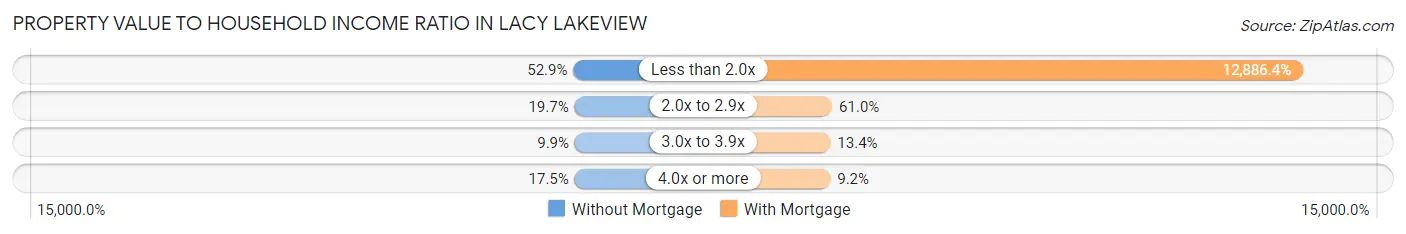
| Value-to-Income Ratio | Without Mortgage | With Mortgage |
| Less than 2.0x | 351 (52.9%) | 81,571 (12,886.4%) |
| 2.0x to 2.9x | 131 (19.7%) | 386 (61.0%) |
| 3.0x to 3.9x | 66 (9.9%) | 85 (13.4%) |
| 4.0x or more | 116 (17.5%) | 58 (9.2%) |
| Total | 664 (100.0%) | 633 (100.0%) |
Real Estate Taxes by Mortgage Status in Lacy Lakeview
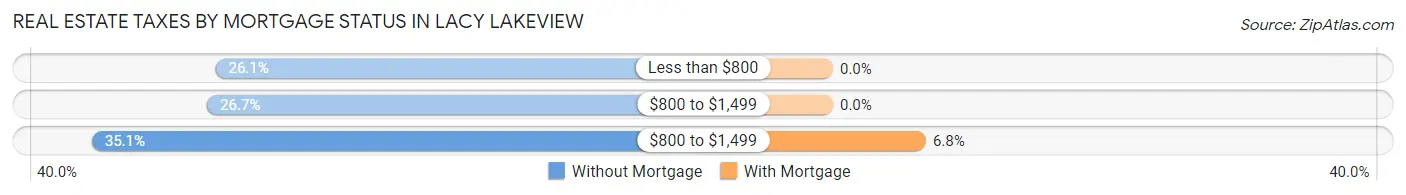
| Property Taxes | Without Mortgage | With Mortgage |
| Less than $800 | 173 (26.1%) | 0 (0.0%) |
| $800 to $1,499 | 177 (26.7%) | 0 (0.0%) |
| $800 to $1,499 | 233 (35.1%) | 43 (6.8%) |
| Total | 664 (100.0%) | 633 (100.0%) |
Health & Disability in Lacy Lakeview
Health Insurance Coverage by Age in Lacy Lakeview
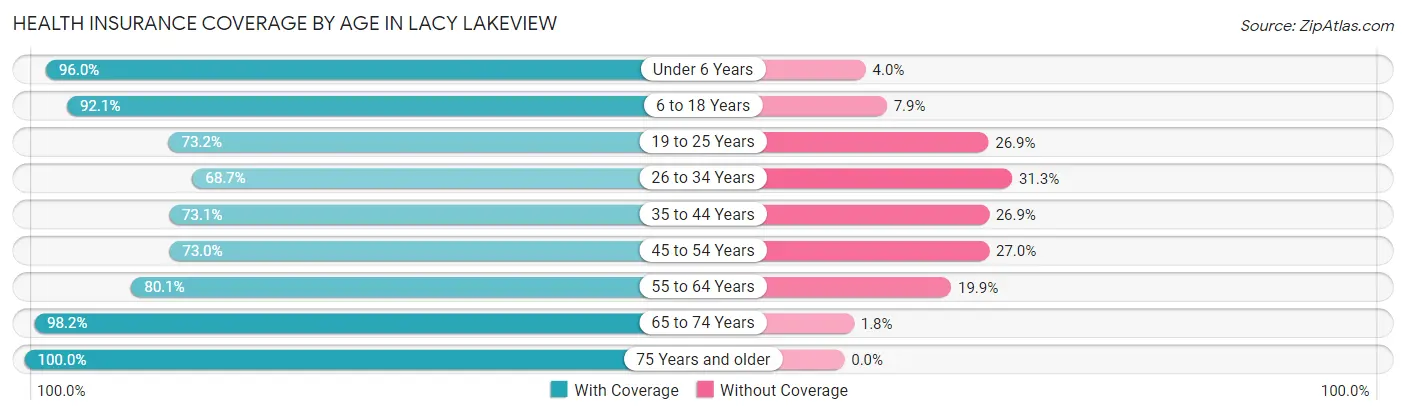
| Age Bracket | With Coverage | Without Coverage |
| Under 6 Years | 627 (96.0%) | 26 (4.0%) |
| 6 to 18 Years | 1,001 (92.1%) | 86 (7.9%) |
| 19 to 25 Years | 782 (73.2%) | 287 (26.9%) |
| 26 to 34 Years | 604 (68.7%) | 275 (31.3%) |
| 35 to 44 Years | 784 (73.1%) | 289 (26.9%) |
| 45 to 54 Years | 652 (73.0%) | 241 (27.0%) |
| 55 to 64 Years | 551 (80.1%) | 137 (19.9%) |
| 65 to 74 Years | 389 (98.2%) | 7 (1.8%) |
| 75 Years and older | 452 (100.0%) | 0 (0.0%) |
| Total | 5,842 (81.2%) | 1,348 (18.8%) |
Health Insurance Coverage by Citizenship Status in Lacy Lakeview
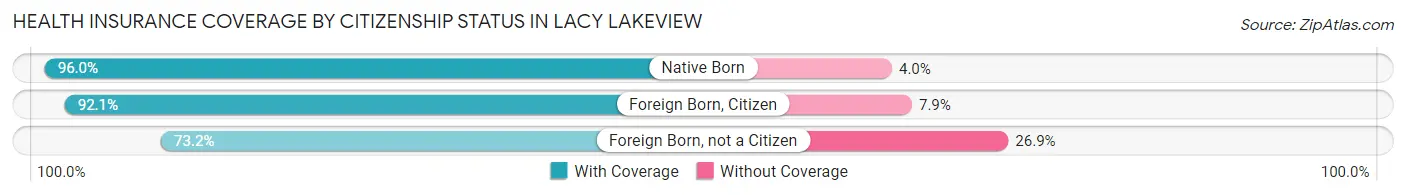
| Citizenship Status | With Coverage | Without Coverage |
| Native Born | 627 (96.0%) | 26 (4.0%) |
| Foreign Born, Citizen | 1,001 (92.1%) | 86 (7.9%) |
| Foreign Born, not a Citizen | 782 (73.2%) | 287 (26.9%) |
Health Insurance Coverage by Household Income in Lacy Lakeview
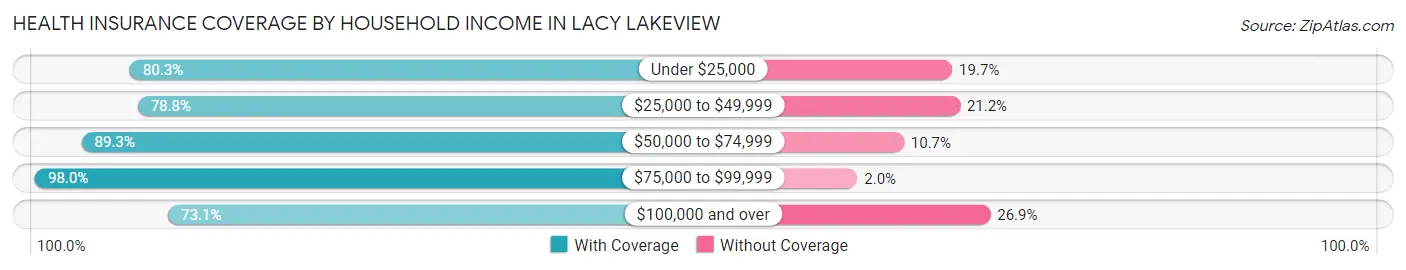
| Household Income | With Coverage | Without Coverage |
| Under $25,000 | 923 (80.3%) | 227 (19.7%) |
| $25,000 to $49,999 | 1,282 (78.8%) | 345 (21.2%) |
| $50,000 to $74,999 | 1,428 (89.3%) | 171 (10.7%) |
| $75,000 to $99,999 | 597 (98.0%) | 12 (2.0%) |
| $100,000 and over | 1,594 (73.1%) | 586 (26.9%) |
Public vs Private Health Insurance Coverage by Age in Lacy Lakeview
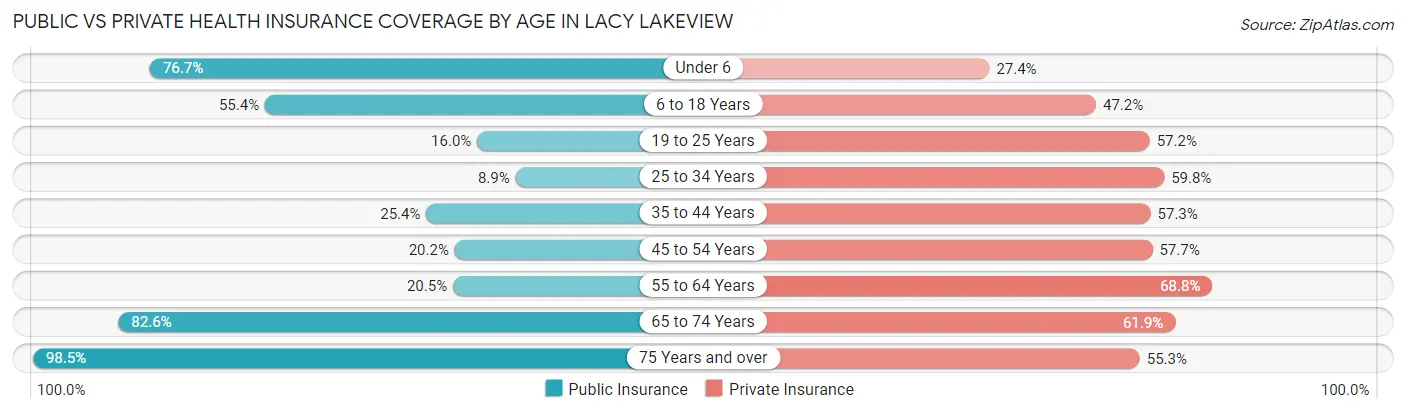
| Age Bracket | Public Insurance | Private Insurance |
| Under 6 | 501 (76.7%) | 179 (27.4%) |
| 6 to 18 Years | 602 (55.4%) | 513 (47.2%) |
| 19 to 25 Years | 171 (16.0%) | 611 (57.2%) |
| 25 to 34 Years | 78 (8.9%) | 526 (59.8%) |
| 35 to 44 Years | 273 (25.4%) | 615 (57.3%) |
| 45 to 54 Years | 180 (20.2%) | 515 (57.7%) |
| 55 to 64 Years | 141 (20.5%) | 473 (68.8%) |
| 65 to 74 Years | 327 (82.6%) | 245 (61.9%) |
| 75 Years and over | 445 (98.5%) | 250 (55.3%) |
| Total | 2,718 (37.8%) | 3,927 (54.6%) |
Disability Status by Sex by Age in Lacy Lakeview
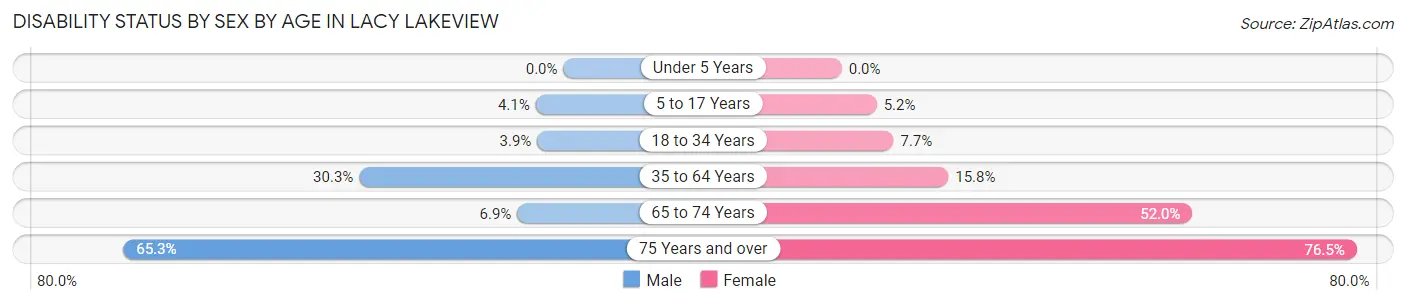
| Age Bracket | Male | Female |
| Under 5 Years | 0 (0.0%) | 0 (0.0%) |
| 5 to 17 Years | 21 (4.1%) | 26 (5.2%) |
| 18 to 34 Years | 41 (3.9%) | 78 (7.7%) |
| 35 to 64 Years | 362 (30.3%) | 231 (15.8%) |
| 65 to 74 Years | 7 (6.9%) | 153 (52.0%) |
| 75 Years and over | 115 (65.3%) | 211 (76.4%) |
Disability Class by Sex by Age in Lacy Lakeview
Disability Class: Hearing Difficulty
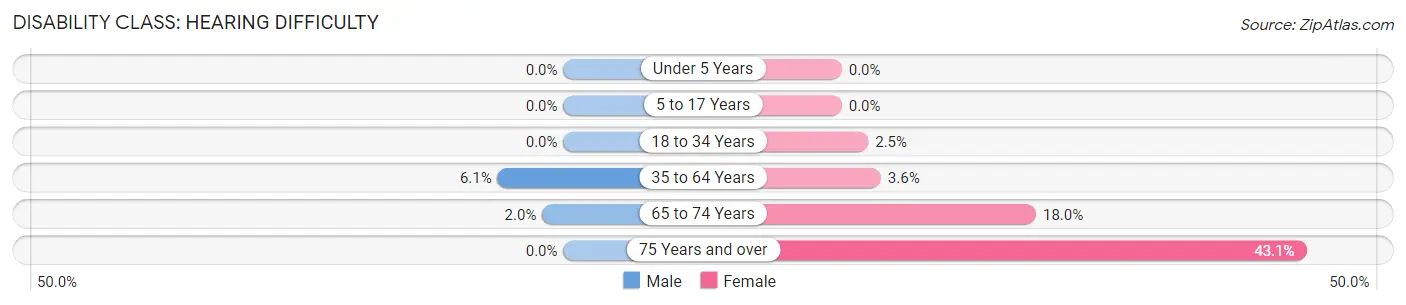
| Age Bracket | Male | Female |
| Under 5 Years | 0 (0.0%) | 0 (0.0%) |
| 5 to 17 Years | 0 (0.0%) | 0 (0.0%) |
| 18 to 34 Years | 0 (0.0%) | 25 (2.5%) |
| 35 to 64 Years | 73 (6.1%) | 53 (3.6%) |
| 65 to 74 Years | 2 (2.0%) | 53 (18.0%) |
| 75 Years and over | 0 (0.0%) | 119 (43.1%) |
Disability Class: Vision Difficulty
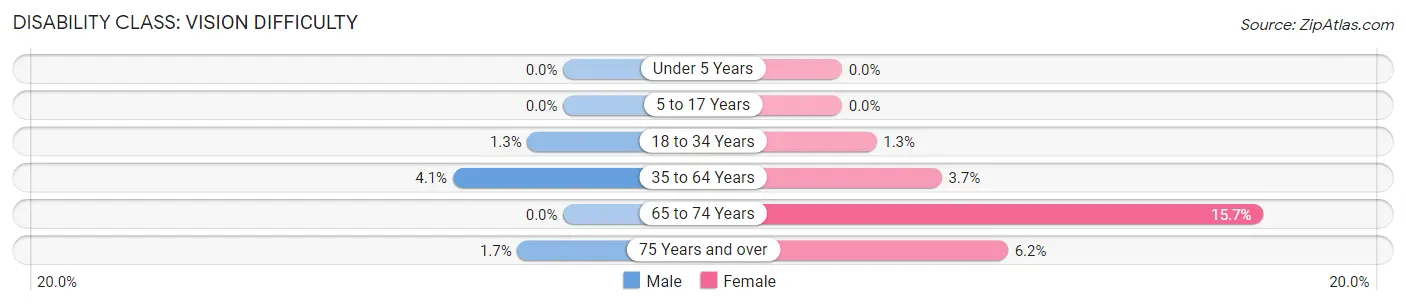
| Age Bracket | Male | Female |
| Under 5 Years | 0 (0.0%) | 0 (0.0%) |
| 5 to 17 Years | 0 (0.0%) | 0 (0.0%) |
| 18 to 34 Years | 14 (1.3%) | 13 (1.3%) |
| 35 to 64 Years | 49 (4.1%) | 54 (3.7%) |
| 65 to 74 Years | 0 (0.0%) | 46 (15.7%) |
| 75 Years and over | 3 (1.7%) | 17 (6.2%) |
Disability Class: Cognitive Difficulty
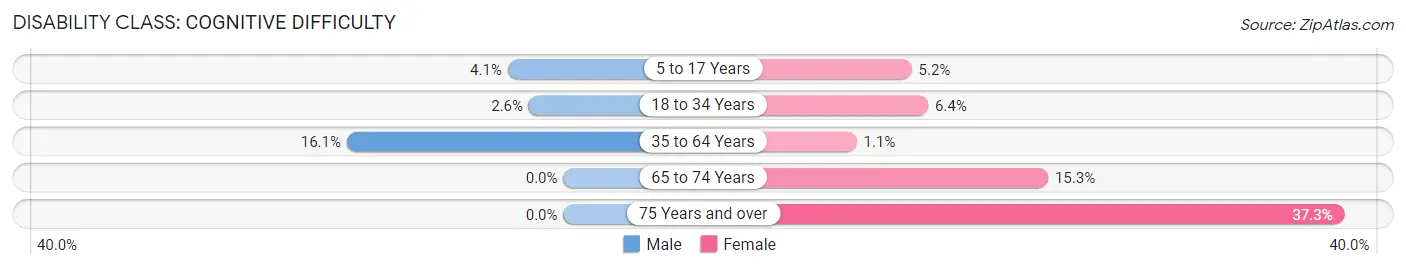
| Age Bracket | Male | Female |
| 5 to 17 Years | 21 (4.1%) | 26 (5.2%) |
| 18 to 34 Years | 27 (2.6%) | 65 (6.4%) |
| 35 to 64 Years | 192 (16.1%) | 16 (1.1%) |
| 65 to 74 Years | 0 (0.0%) | 45 (15.3%) |
| 75 Years and over | 0 (0.0%) | 103 (37.3%) |
Disability Class: Ambulatory Difficulty
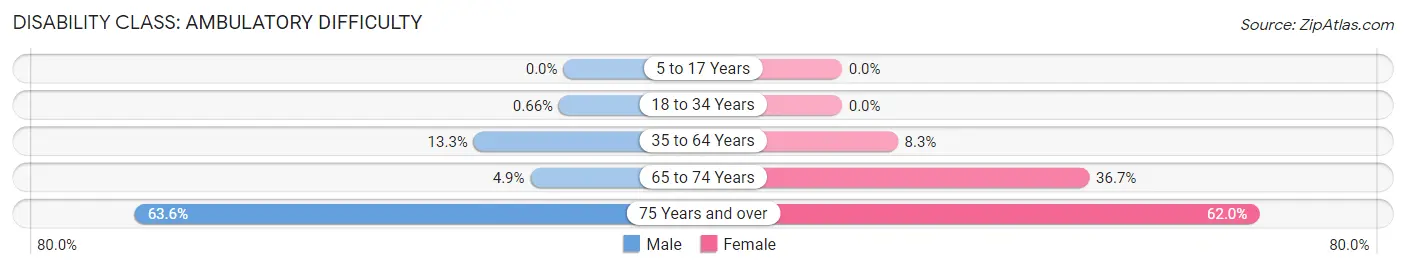
| Age Bracket | Male | Female |
| 5 to 17 Years | 0 (0.0%) | 0 (0.0%) |
| 18 to 34 Years | 7 (0.7%) | 0 (0.0%) |
| 35 to 64 Years | 159 (13.3%) | 121 (8.3%) |
| 65 to 74 Years | 5 (4.9%) | 108 (36.7%) |
| 75 Years and over | 112 (63.6%) | 171 (62.0%) |
Disability Class: Self-Care Difficulty
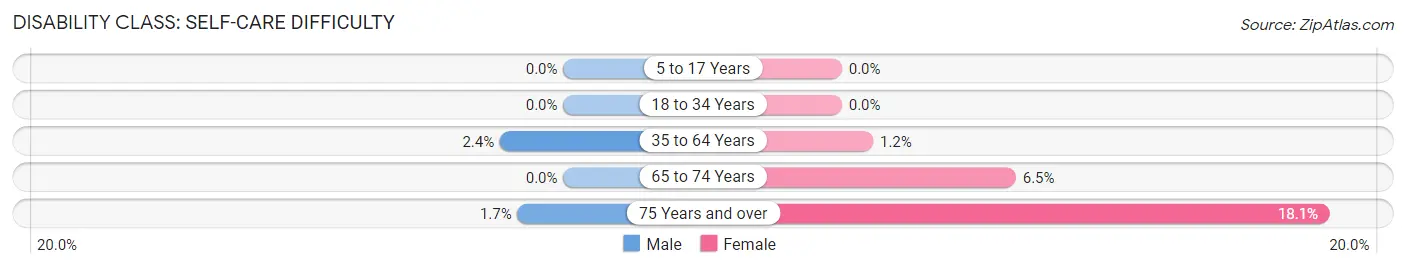
| Age Bracket | Male | Female |
| 5 to 17 Years | 0 (0.0%) | 0 (0.0%) |
| 18 to 34 Years | 0 (0.0%) | 0 (0.0%) |
| 35 to 64 Years | 28 (2.4%) | 17 (1.2%) |
| 65 to 74 Years | 0 (0.0%) | 19 (6.5%) |
| 75 Years and over | 3 (1.7%) | 50 (18.1%) |
Technology Access in Lacy Lakeview
Computing Device Access in Lacy Lakeview
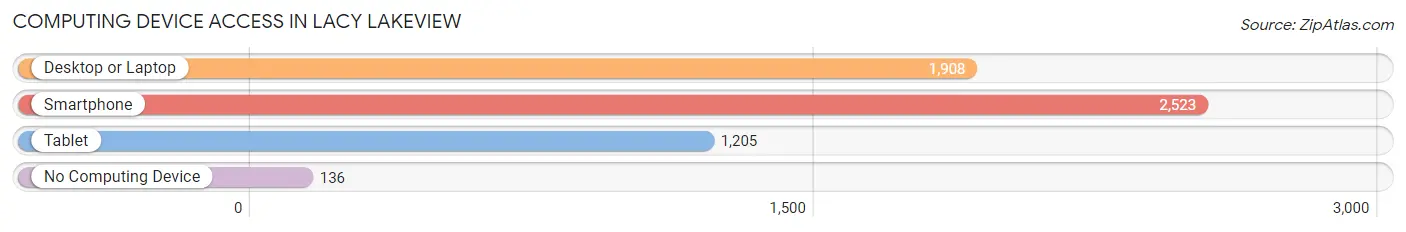
| Device Type | # Households | % Households |
| Desktop or Laptop | 1,908 | 65.9% |
| Smartphone | 2,523 | 87.2% |
| Tablet | 1,205 | 41.6% |
| No Computing Device | 136 | 4.7% |
| Total | 2,894 | 100.0% |
Internet Access in Lacy Lakeview
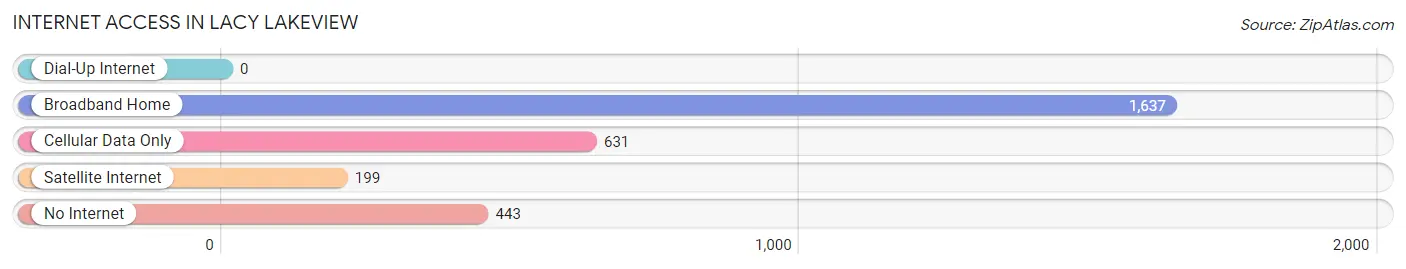
| Internet Type | # Households | % Households |
| Dial-Up Internet | 0 | 0.0% |
| Broadband Home | 1,637 | 56.6% |
| Cellular Data Only | 631 | 21.8% |
| Satellite Internet | 199 | 6.9% |
| No Internet | 443 | 15.3% |
| Total | 2,894 | 100.0% |
Lacy Lakeview Summary
Lacy Lakeview is a city located in McLennan County, Texas, United States. The population was 6,822 at the 2010 census. It is part of the Waco Metropolitan Statistical Area.
History
Lacy Lakeview was founded in the early 1900s by the Lacy family, who owned a large amount of land in the area. The city was named after the Lacy family, and the lakeview was added to the name to reflect the city's proximity to Lake Waco.
The city was incorporated in 1959, and the first mayor was elected in 1960. The city has grown steadily since then, and today it is home to a variety of businesses, including a Walmart Supercenter, a Lowe's Home Improvement store, and several restaurants.
Geography
Lacy Lakeview is located at 31°33'25" North, 97°10'17" West (31.556944, -97.171389). It is situated on the western edge of McLennan County, just south of the city of Waco.
The city has a total area of 4.2 square miles, all of which is land. The terrain is mostly flat, with some rolling hills in the northern part of the city.
Economy
The economy of Lacy Lakeview is largely based on retail and services. The city is home to a Walmart Supercenter, a Lowe's Home Improvement store, and several restaurants.
The city also has a number of small businesses, including auto repair shops, beauty salons, and other retail stores.
Demographics
As of the 2010 census, there were 6,822 people, 2,541 households, and 1,845 families residing in the city. The population density was 1,637.2 people per square mile. The racial makeup of the city was 73.2% White, 11.3% African American, 0.7% Native American, 0.7% Asian, 0.1% Pacific Islander, 11.3% from other races, and 3.1% from two or more races. Hispanic or Latino of any race were 24.2% of the population.
The median income for a household in the city was $37,917, and the median income for a family was $45,938. The per capita income for the city was $17,945. About 16.2% of families and 19.2% of the population were below the poverty line, including 28.2% of those under age 18 and 11.2% of those age 65 or over.
Common Questions
What is Per Capita Income in Lacy Lakeview?
Per Capita income in Lacy Lakeview is $27,088.
What is the Median Family Income in Lacy Lakeview?
Median Family Income in Lacy Lakeview is $65,288.
What is the Median Household income in Lacy Lakeview?
Median Household Income in Lacy Lakeview is $46,311.
What is Income or Wage Gap in Lacy Lakeview?
Income or Wage Gap in Lacy Lakeview is 32.9%.
Women in Lacy Lakeview earn 67.1 cents for every dollar earned by a man.
What is Inequality or Gini Index in Lacy Lakeview?
Inequality or Gini Index in Lacy Lakeview is 0.46.
What is the Total Population of Lacy Lakeview?
Total Population of Lacy Lakeview is 7,190.
What is the Total Male Population of Lacy Lakeview?
Total Male Population of Lacy Lakeview is 3,242.
What is the Total Female Population of Lacy Lakeview?
Total Female Population of Lacy Lakeview is 3,948.
What is the Ratio of Males per 100 Females in Lacy Lakeview?
There are 82.12 Males per 100 Females in Lacy Lakeview.
What is the Ratio of Females per 100 Males in Lacy Lakeview?
There are 121.78 Females per 100 Males in Lacy Lakeview.
What is the Median Population Age in Lacy Lakeview?
Median Population Age in Lacy Lakeview is 33.6 Years.
What is the Average Family Size in Lacy Lakeview
Average Family Size in Lacy Lakeview is 3.4 People.
What is the Average Household Size in Lacy Lakeview
Average Household Size in Lacy Lakeview is 2.5 People.
How Large is the Labor Force in Lacy Lakeview?
There are 3,851 People in the Labor Forcein in Lacy Lakeview.
What is the Percentage of People in the Labor Force in Lacy Lakeview?
67.2% of People are in the Labor Force in Lacy Lakeview.
What is the Unemployment Rate in Lacy Lakeview?
Unemployment Rate in Lacy Lakeview is 4.1%.