Zip Codes with the Highest Percentage of Population with a Degree in Communications in Texas
RELATED REPORTS & OPTIONS
Communications
Texas
Compare Zip Codes
Map of Zip Codes with the Highest Percentage of Population with a Degree in Communications in Texas
0.0%
100.0%
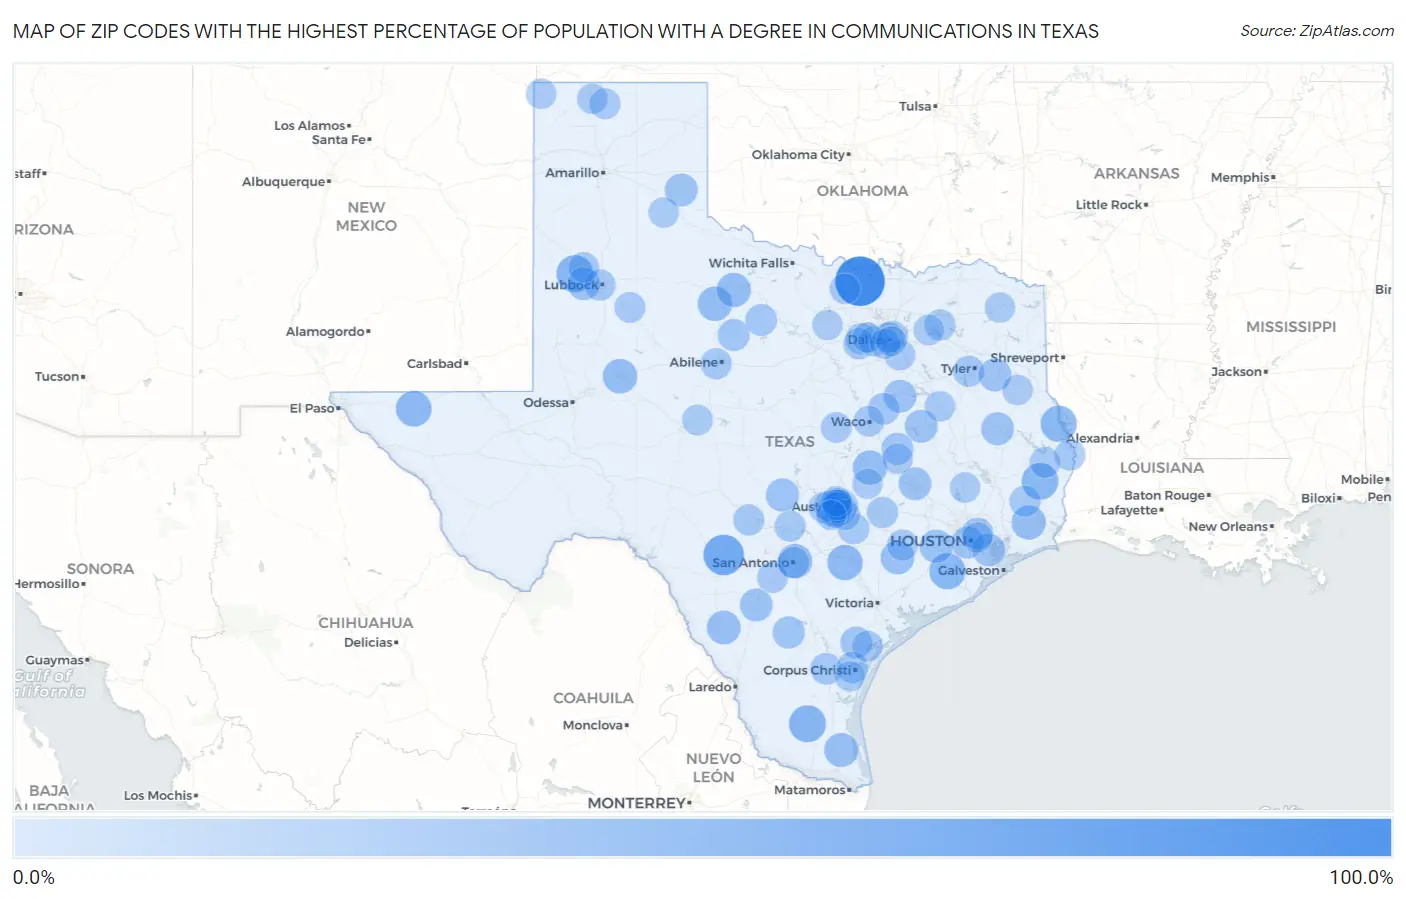
Zip Codes with the Highest Percentage of Population with a Degree in Communications in Texas
| Zip Code | % Graduates | vs State | vs National | |
| 1. | 76253 | 100.0% | 4.1% (+95.9)#1 | 4.1% (+95.9)#7 |
| 2. | 78838 | 56.7% | 4.1% (+52.6)#2 | 4.1% (+52.5)#36 |
| 3. | 79380 | 40.0% | 4.1% (+35.9)#3 | 4.1% (+35.9)#79 |
| 4. | 78353 | 39.0% | 4.1% (+35.0)#4 | 4.1% (+34.9)#84 |
| 5. | 77660 | 37.5% | 4.1% (+33.4)#5 | 4.1% (+33.4)#92 |
| 6. | 75959 | 35.5% | 4.1% (+31.4)#6 | 4.1% (+31.4)#102 |
| 7. | 77444 | 35.3% | 4.1% (+31.2)#7 | 4.1% (+31.2)#106 |
| 8. | 79847 | 33.3% | 4.1% (+29.2)#8 | 4.1% (+29.2)#128 |
| 9. | 78614 | 31.6% | 4.1% (+27.5)#9 | 4.1% (+27.4)#144 |
| 10. | 79721 | 27.6% | 4.1% (+23.5)#10 | 4.1% (+23.5)#176 |
| 11. | 78208 | 27.4% | 4.1% (+23.3)#11 | 4.1% (+23.2)#179 |
| 12. | 79544 | 27.3% | 4.1% (+23.2)#12 | 4.1% (+23.1)#180 |
| 13. | 76518 | 26.6% | 4.1% (+22.5)#13 | 4.1% (+22.5)#189 |
| 14. | 76363 | 26.3% | 4.1% (+22.2)#14 | 4.1% (+22.2)#192 |
| 15. | 77613 | 26.3% | 4.1% (+22.2)#15 | 4.1% (+22.1)#193 |
| 16. | 78590 | 25.0% | 4.1% (+20.9)#16 | 4.1% (+20.9)#208 |
| 17. | 78827 | 24.0% | 4.1% (+19.9)#17 | 4.1% (+19.9)#233 |
| 18. | 77475 | 23.1% | 4.1% (+19.0)#18 | 4.1% (+18.9)#246 |
| 19. | 77476 | 22.0% | 4.1% (+17.9)#19 | 4.1% (+17.9)#275 |
| 20. | 78675 | 21.4% | 4.1% (+17.3)#20 | 4.1% (+17.3)#289 |
| 21. | 79367 | 20.0% | 4.1% (+15.9)#21 | 4.1% (+15.9)#327 |
| 22. | 75838 | 20.0% | 4.1% (+15.9)#22 | 4.1% (+15.9)#328 |
| 23. | 79251 | 20.0% | 4.1% (+15.9)#23 | 4.1% (+15.9)#335 |
| 24. | 75969 | 20.0% | 4.1% (+15.9)#24 | 4.1% (+15.8)#336 |
| 25. | 76679 | 19.9% | 4.1% (+15.8)#25 | 4.1% (+15.8)#337 |
| 26. | 77843 | 19.8% | 4.1% (+15.7)#26 | 4.1% (+15.7)#339 |
| 27. | 75682 | 19.8% | 4.1% (+15.7)#27 | 4.1% (+15.6)#343 |
| 28. | 78742 | 19.4% | 4.1% (+15.4)#28 | 4.1% (+15.3)#349 |
| 29. | 78017 | 19.4% | 4.1% (+15.3)#29 | 4.1% (+15.3)#351 |
| 30. | 77507 | 19.1% | 4.1% (+15.0)#30 | 4.1% (+14.9)#365 |
| 31. | 78072 | 17.2% | 4.1% (+13.2)#31 | 4.1% (+13.1)#427 |
| 32. | 77046 | 16.8% | 4.1% (+12.7)#32 | 4.1% (+12.7)#449 |
| 33. | 77078 | 16.4% | 4.1% (+12.3)#33 | 4.1% (+12.3)#475 |
| 34. | 79533 | 15.7% | 4.1% (+11.6)#34 | 4.1% (+11.6)#515 |
| 35. | 76629 | 15.3% | 4.1% (+11.2)#35 | 4.1% (+11.2)#533 |
| 36. | 78393 | 15.0% | 4.1% (+10.9)#36 | 4.1% (+10.8)#553 |
| 37. | 76673 | 14.7% | 4.1% (+10.6)#37 | 4.1% (+10.6)#568 |
| 38. | 78330 | 14.5% | 4.1% (+10.5)#38 | 4.1% (+10.4)#578 |
| 39. | 76491 | 14.3% | 4.1% (+10.2)#39 | 4.1% (+10.2)#597 |
| 40. | 78408 | 13.6% | 4.1% (+9.48)#40 | 4.1% (+9.44)#650 |
| 41. | 78205 | 12.6% | 4.1% (+8.53)#41 | 4.1% (+8.48)#751 |
| 42. | 78662 | 12.5% | 4.1% (+8.41)#42 | 4.1% (+8.36)#758 |
| 43. | 78942 | 12.5% | 4.1% (+8.37)#43 | 4.1% (+8.32)#768 |
| 44. | 76111 | 12.3% | 4.1% (+8.17)#44 | 4.1% (+8.12)#784 |
| 45. | 75453 | 12.1% | 4.1% (+8.00)#45 | 4.1% (+7.96)#809 |
| 46. | 79410 | 12.1% | 4.1% (+8.00)#46 | 4.1% (+7.95)#810 |
| 47. | 77625 | 11.8% | 4.1% (+7.70)#47 | 4.1% (+7.65)#848 |
| 48. | 75709 | 11.8% | 4.1% (+7.68)#48 | 4.1% (+7.63)#849 |
| 49. | 78025 | 11.6% | 4.1% (+7.49)#49 | 4.1% (+7.44)#883 |
| 50. | 76110 | 11.5% | 4.1% (+7.45)#50 | 4.1% (+7.40)#891 |
| 51. | 79607 | 11.5% | 4.1% (+7.43)#51 | 4.1% (+7.39)#893 |
| 52. | 75932 | 11.5% | 4.1% (+7.39)#52 | 4.1% (+7.34)#899 |
| 53. | 78934 | 11.4% | 4.1% (+7.36)#53 | 4.1% (+7.31)#905 |
| 54. | 78027 | 11.3% | 4.1% (+7.22)#54 | 4.1% (+7.17)#926 |
| 55. | 75951 | 11.1% | 4.1% (+6.99)#55 | 4.1% (+6.95)#971 |
| 56. | 78721 | 10.9% | 4.1% (+6.80)#56 | 4.1% (+6.76)#993 |
| 57. | 78340 | 10.7% | 4.1% (+6.62)#57 | 4.1% (+6.58)#1,025 |
| 58. | 75214 | 10.7% | 4.1% (+6.61)#58 | 4.1% (+6.56)#1,029 |
| 59. | 78724 | 10.7% | 4.1% (+6.58)#59 | 4.1% (+6.53)#1,034 |
| 60. | 79086 | 10.5% | 4.1% (+6.42)#60 | 4.1% (+6.37)#1,058 |
| 61. | 78751 | 10.5% | 4.1% (+6.39)#61 | 4.1% (+6.35)#1,062 |
| 62. | 79356 | 10.3% | 4.1% (+6.19)#62 | 4.1% (+6.14)#1,092 |
| 63. | 78703 | 10.3% | 4.1% (+6.16)#63 | 4.1% (+6.12)#1,097 |
| 64. | 76599 | 10.2% | 4.1% (+6.08)#64 | 4.1% (+6.03)#1,106 |
| 65. | 78701 | 10.1% | 4.1% (+6.02)#65 | 4.1% (+5.97)#1,115 |
| 66. | 76707 | 10.1% | 4.1% (+6.02)#66 | 4.1% (+5.97)#1,116 |
| 67. | 78704 | 10.1% | 4.1% (+5.99)#67 | 4.1% (+5.94)#1,120 |
| 68. | 78745 | 10.0% | 4.1% (+5.93)#68 | 4.1% (+5.88)#1,129 |
| 69. | 76861 | 10.0% | 4.1% (+5.88)#69 | 4.1% (+5.83)#1,157 |
| 70. | 78059 | 9.9% | 4.1% (+5.86)#70 | 4.1% (+5.81)#1,164 |
| 71. | 79313 | 9.9% | 4.1% (+5.78)#71 | 4.1% (+5.73)#1,183 |
| 72. | 75125 | 9.8% | 4.1% (+5.68)#72 | 4.1% (+5.64)#1,201 |
| 73. | 79084 | 9.7% | 4.1% (+5.57)#73 | 4.1% (+5.52)#1,227 |
| 74. | 76239 | 9.5% | 4.1% (+5.43)#74 | 4.1% (+5.39)#1,254 |
| 75. | 78736 | 9.4% | 4.1% (+5.35)#75 | 4.1% (+5.30)#1,290 |
| 76. | 78723 | 9.3% | 4.1% (+5.21)#76 | 4.1% (+5.17)#1,327 |
| 77. | 76011 | 9.3% | 4.1% (+5.17)#77 | 4.1% (+5.12)#1,337 |
| 78. | 75474 | 9.2% | 4.1% (+5.15)#78 | 4.1% (+5.11)#1,342 |
| 79. | 75886 | 9.2% | 4.1% (+5.11)#79 | 4.1% (+5.06)#1,362 |
| 80. | 75219 | 9.1% | 4.1% (+5.03)#80 | 4.1% (+4.98)#1,390 |
| 81. | 79239 | 9.1% | 4.1% (+5.00)#81 | 4.1% (+4.96)#1,406 |
| 82. | 78735 | 9.1% | 4.1% (+4.96)#82 | 4.1% (+4.92)#1,418 |
| 83. | 77837 | 9.0% | 4.1% (+4.91)#83 | 4.1% (+4.86)#1,437 |
| 84. | 78744 | 8.9% | 4.1% (+4.80)#84 | 4.1% (+4.75)#1,482 |
| 85. | 77358 | 8.9% | 4.1% (+4.79)#85 | 4.1% (+4.74)#1,484 |
| 86. | 79087 | 8.8% | 4.1% (+4.73)#86 | 4.1% (+4.69)#1,501 |
| 87. | 78702 | 8.8% | 4.1% (+4.68)#87 | 4.1% (+4.64)#1,520 |
| 88. | 75669 | 8.7% | 4.1% (+4.61)#88 | 4.1% (+4.56)#1,549 |
| 89. | 76118 | 8.7% | 4.1% (+4.58)#89 | 4.1% (+4.54)#1,563 |
| 90. | 76577 | 8.6% | 4.1% (+4.55)#90 | 4.1% (+4.51)#1,574 |
| 91. | 75558 | 8.6% | 4.1% (+4.55)#91 | 4.1% (+4.51)#1,575 |
| 92. | 75233 | 8.6% | 4.1% (+4.48)#92 | 4.1% (+4.43)#1,607 |
| 93. | 78617 | 8.5% | 4.1% (+4.42)#93 | 4.1% (+4.37)#1,627 |
| 94. | 78722 | 8.5% | 4.1% (+4.40)#94 | 4.1% (+4.36)#1,634 |
| 95. | 78757 | 8.5% | 4.1% (+4.37)#95 | 4.1% (+4.32)#1,649 |
| 96. | 76487 | 8.5% | 4.1% (+4.37)#96 | 4.1% (+4.32)#1,652 |
| 97. | 77013 | 8.4% | 4.1% (+4.34)#97 | 4.1% (+4.29)#1,666 |
| 98. | 78748 | 8.4% | 4.1% (+4.30)#98 | 4.1% (+4.25)#1,684 |
| 99. | 75215 | 8.4% | 4.1% (+4.27)#99 | 4.1% (+4.22)#1,695 |
| 100. | 78415 | 8.4% | 4.1% (+4.26)#100 | 4.1% (+4.22)#1,698 |
Common Questions
What are the Top 10 Zip Codes with the Highest Percentage of Population with a Degree in Communications in Texas?
Top 10 Zip Codes with the Highest Percentage of Population with a Degree in Communications in Texas are:
What zip code has the Highest Percentage of Population with a Degree in Communications in Texas?
76253 has the Highest Percentage of Population with a Degree in Communications in Texas with 100.0%.
What is the Percentage of Population with a Degree in Communications in the State of Texas?
Percentage of Population with a Degree in Communications in Texas is 4.1%.
What is the Percentage of Population with a Degree in Communications in the United States?
Percentage of Population with a Degree in Communications in the United States is 4.1%.