Ferris, TX Map & Demographics
Ferris Map
Ferris Overview
$23,092
PER CAPITA INCOME
$66,771
AVG FAMILY INCOME
$62,036
AVG HOUSEHOLD INCOME
41.6%
WAGE / INCOME GAP [ % ]
58.4¢/ $1
WAGE / INCOME GAP [ $ ]
0.35
INEQUALITY / GINI INDEX
2,785
TOTAL POPULATION
1,364
MALE POPULATION
1,421
FEMALE POPULATION
95.99
MALES / 100 FEMALES
104.18
FEMALES / 100 MALES
31.1
MEDIAN AGE
3.4
AVG FAMILY SIZE
3.1
AVG HOUSEHOLD SIZE
1,321
LABOR FORCE [ PEOPLE ]
69.3%
PERCENT IN LABOR FORCE
0.8%
UNEMPLOYMENT RATE
Ferris Zip Codes
Income in Ferris
Income Overview in Ferris
Per Capita Income in Ferris is $23,092, while median incomes of families and households are $66,771 and $62,036 respectively.
| Characteristic | Number | Measure |
| Per Capita Income | 2,785 | $23,092 |
| Median Family Income | 781 | $66,771 |
| Mean Family Income | 781 | $75,489 |
| Median Household Income | 886 | $62,036 |
| Mean Household Income | 886 | $71,628 |
| Income Deficit | 781 | $0 |
| Wage / Income Gap (%) | 2,785 | 41.60% |
| Wage / Income Gap ($) | 2,785 | 58.40¢ per $1 |
| Gini / Inequality Index | 2,785 | 0.35 |
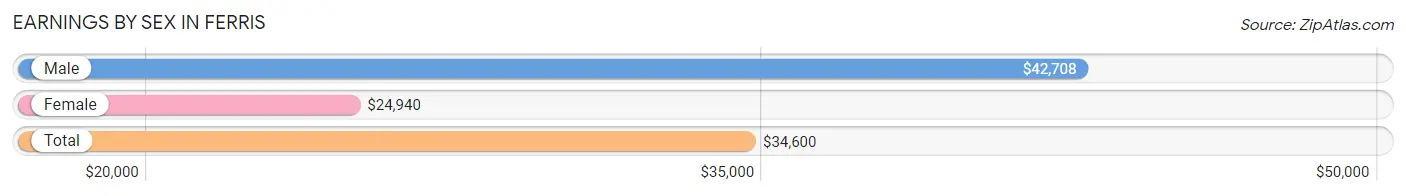
Earnings by Sex in Ferris
Average Earnings in Ferris are $34,600, $42,708 for men and $24,940 for women, a difference of 41.6%.
| Sex | Number | Average Earnings |
| Male | 737 (52.9%) | $42,708 |
| Female | 655 (47.0%) | $24,940 |
| Total | 1,392 (100.0%) | $34,600 |
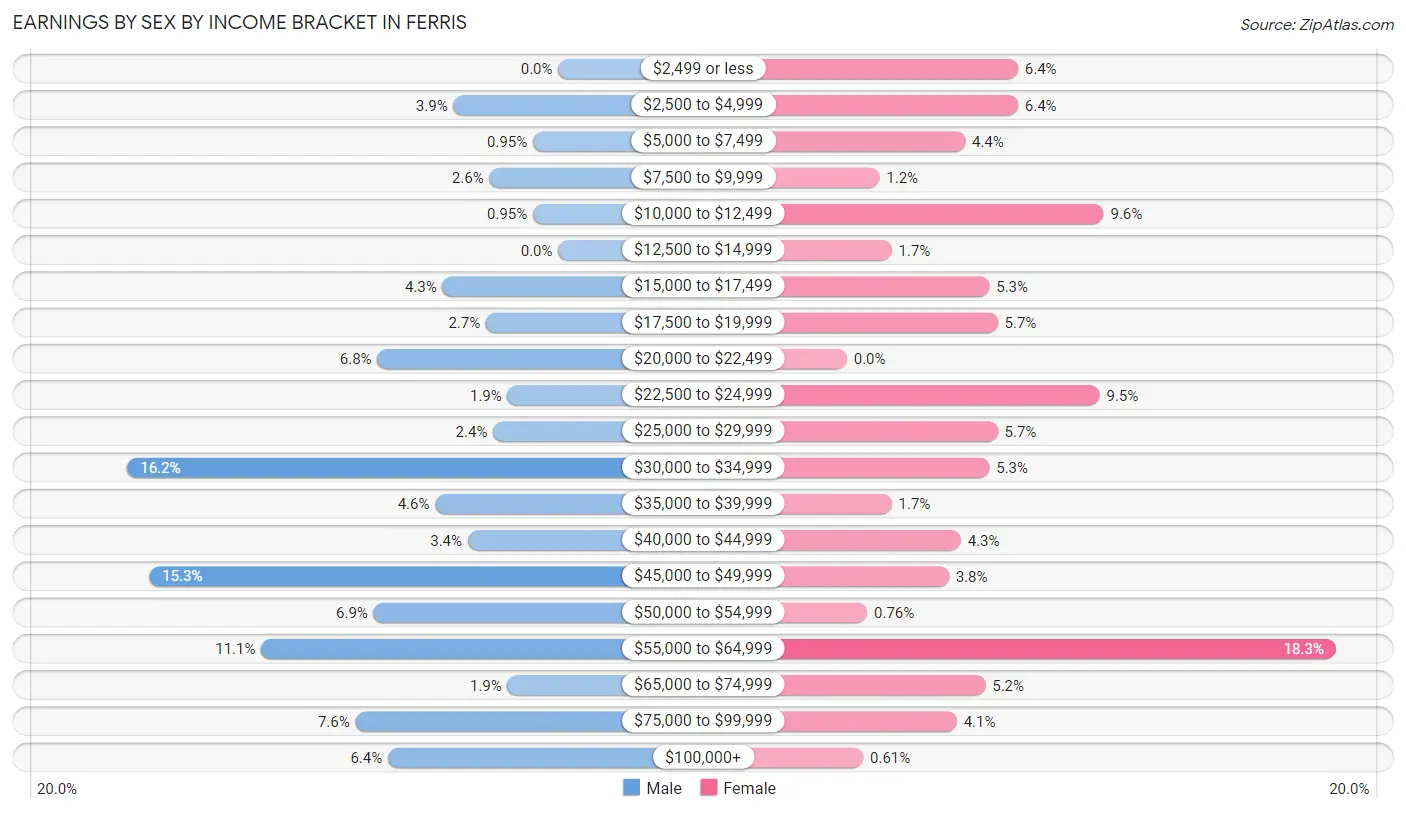
Earnings by Sex by Income Bracket in Ferris
The most common earnings brackets in Ferris are $30,000 to $34,999 for men (119 | 16.2%) and $55,000 to $64,999 for women (120 | 18.3%).
| Income | Male | Female |
| $2,499 or less | 0 (0.0%) | 42 (6.4%) |
| $2,500 to $4,999 | 29 (3.9%) | 42 (6.4%) |
| $5,000 to $7,499 | 7 (0.9%) | 29 (4.4%) |
| $7,500 to $9,999 | 19 (2.6%) | 8 (1.2%) |
| $10,000 to $12,499 | 7 (0.9%) | 63 (9.6%) |
| $12,500 to $14,999 | 0 (0.0%) | 11 (1.7%) |
| $15,000 to $17,499 | 32 (4.3%) | 35 (5.3%) |
| $17,500 to $19,999 | 20 (2.7%) | 37 (5.7%) |
| $20,000 to $22,499 | 50 (6.8%) | 0 (0.0%) |
| $22,500 to $24,999 | 14 (1.9%) | 62 (9.5%) |
| $25,000 to $29,999 | 18 (2.4%) | 37 (5.7%) |
| $30,000 to $34,999 | 119 (16.2%) | 35 (5.3%) |
| $35,000 to $39,999 | 34 (4.6%) | 11 (1.7%) |
| $40,000 to $44,999 | 25 (3.4%) | 28 (4.3%) |
| $45,000 to $49,999 | 113 (15.3%) | 25 (3.8%) |
| $50,000 to $54,999 | 51 (6.9%) | 5 (0.8%) |
| $55,000 to $64,999 | 82 (11.1%) | 120 (18.3%) |
| $65,000 to $74,999 | 14 (1.9%) | 34 (5.2%) |
| $75,000 to $99,999 | 56 (7.6%) | 27 (4.1%) |
| $100,000+ | 47 (6.4%) | 4 (0.6%) |
| Total | 737 (100.0%) | 655 (100.0%) |
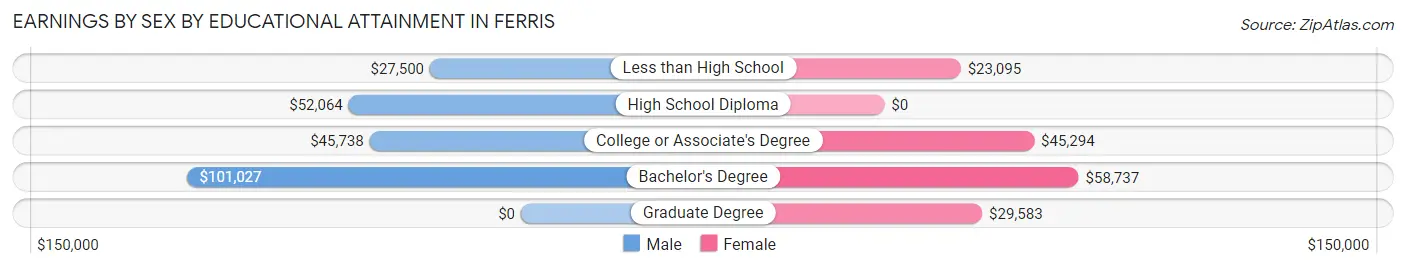
Earnings by Sex by Educational Attainment in Ferris
Average earnings in Ferris are $46,158 for men and $29,764 for women, a difference of 35.5%. Men with an educational attainment of bachelor's degree enjoy the highest average annual earnings of $101,027, while those with less than high school education earn the least with $27,500. Women with an educational attainment of bachelor's degree earn the most with the average annual earnings of $58,737, while those with less than high school education have the smallest earnings of $23,095.
| Educational Attainment | Male Income | Female Income |
| Less than High School | $27,500 | $23,095 |
| High School Diploma | $52,064 | $0 |
| College or Associate's Degree | $45,738 | $45,294 |
| Bachelor's Degree | $101,027 | $58,737 |
| Graduate Degree | - | - |
| Total | $46,158 | $29,764 |
Family Income in Ferris
Family Income Brackets in Ferris
According to the Ferris family income data, there are 197 families falling into the $100,000 to $149,999 income range, which is the most common income bracket and makes up 25.2% of all families.
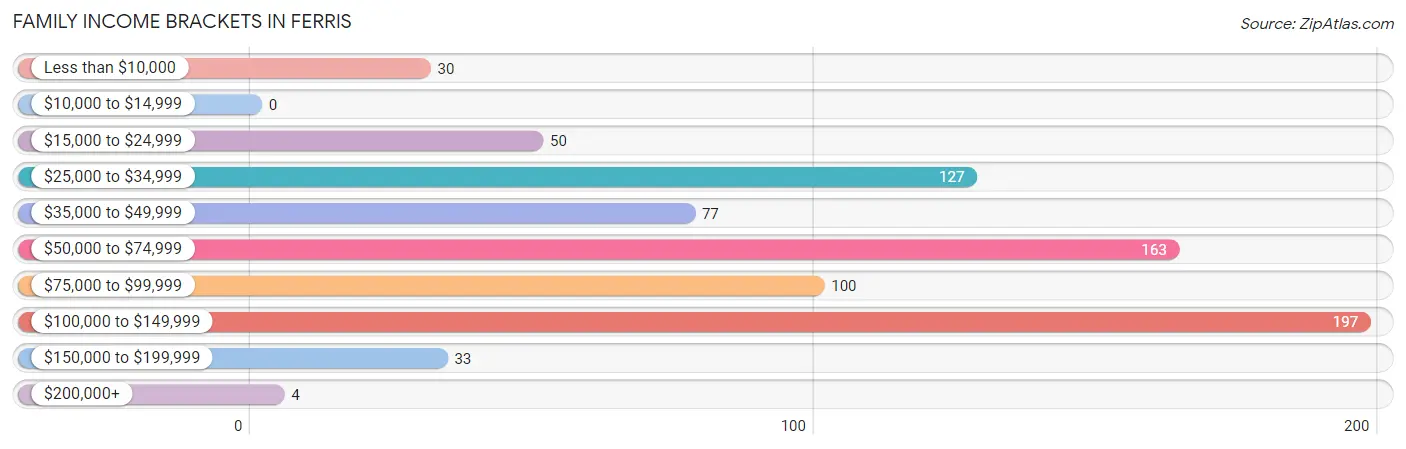
| Income Bracket | # Families | % Families |
| Less than $10,000 | 30 | 3.8% |
| $10,000 to $14,999 | 0 | 0.0% |
| $15,000 to $24,999 | 50 | 6.4% |
| $25,000 to $34,999 | 127 | 16.3% |
| $35,000 to $49,999 | 77 | 9.9% |
| $50,000 to $74,999 | 163 | 20.9% |
| $75,000 to $99,999 | 100 | 12.8% |
| $100,000 to $149,999 | 197 | 25.2% |
| $150,000 to $199,999 | 33 | 4.2% |
| $200,000+ | 4 | 0.5% |
Family Income by Famaliy Size in Ferris
4-person families (154 | 19.7%) account for the highest median family income in Ferris with $83,333 per family, while 3-person families (205 | 26.3%) have the highest median income of $23,734 per family member.
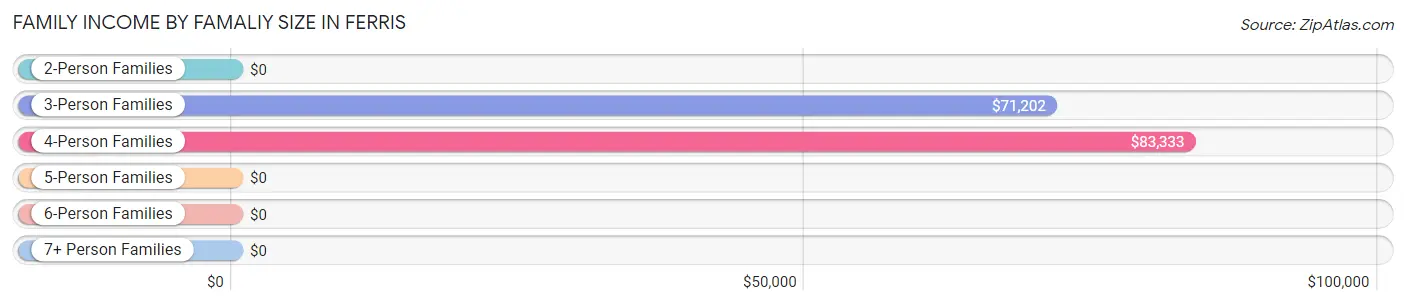
| Income Bracket | # Families | Median Income |
| 2-Person Families | 316 (40.5%) | $0 |
| 3-Person Families | 205 (26.3%) | $71,202 |
| 4-Person Families | 154 (19.7%) | $83,333 |
| 5-Person Families | 35 (4.5%) | $0 |
| 6-Person Families | 14 (1.8%) | $0 |
| 7+ Person Families | 57 (7.3%) | $0 |
| Total | 781 (100.0%) | $66,771 |
Family Income by Number of Earners in Ferris
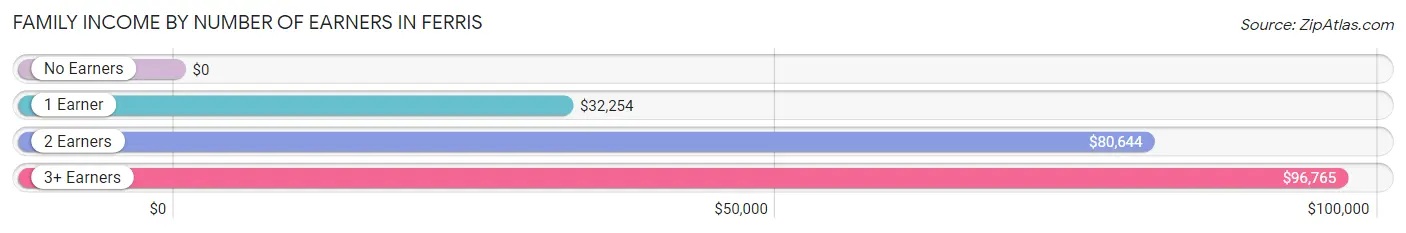
| Number of Earners | # Families | Median Income |
| No Earners | 55 (7.0%) | $0 |
| 1 Earner | 235 (30.1%) | $32,254 |
| 2 Earners | 413 (52.9%) | $80,644 |
| 3+ Earners | 78 (10.0%) | $96,765 |
| Total | 781 (100.0%) | $66,771 |
Household Income in Ferris
Household Income Brackets in Ferris
With 201 households falling in the category, the $100,000 to $149,999 income range is the most frequent in Ferris, accounting for 22.7% of all households. In contrast, only 4 households (0.4%) fall into the $200,000+ income bracket, making it the least populous group.
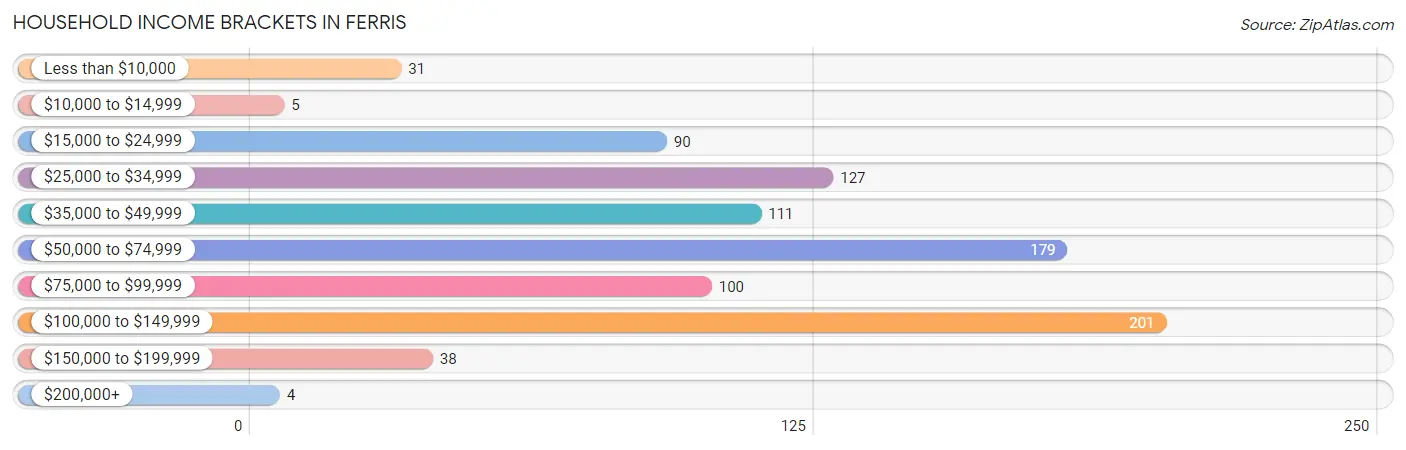
| Income Bracket | # Households | % Households |
| Less than $10,000 | 31 | 3.5% |
| $10,000 to $14,999 | 5 | 0.6% |
| $15,000 to $24,999 | 90 | 10.2% |
| $25,000 to $34,999 | 127 | 14.3% |
| $35,000 to $49,999 | 111 | 12.5% |
| $50,000 to $74,999 | 179 | 20.2% |
| $75,000 to $99,999 | 100 | 11.3% |
| $100,000 to $149,999 | 201 | 22.7% |
| $150,000 to $199,999 | 38 | 4.3% |
| $200,000+ | 4 | 0.5% |
Household Income by Householder Age in Ferris
The median household income in Ferris is $62,036, with the highest median household income of $96,667 found in the 45 to 64 years age bracket for the primary householder. A total of 292 households (33.0%) fall into this category. Meanwhile, the 65+ years age bracket for the primary householder has the lowest median household income of $32,455, with 212 households (23.9%) in this group.
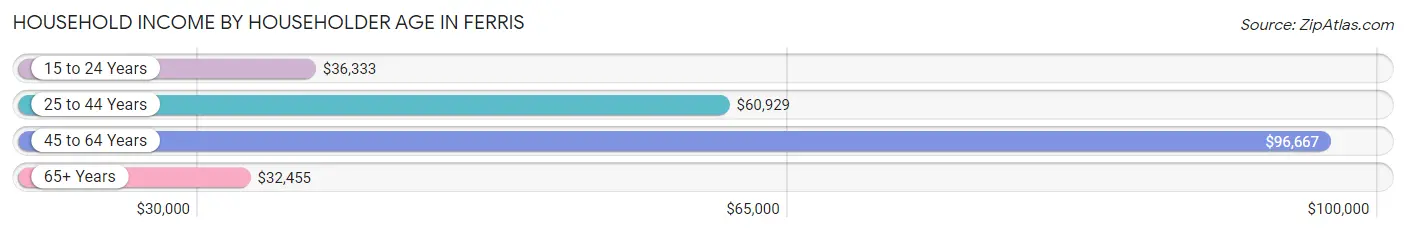
| Income Bracket | # Households | Median Income |
| 15 to 24 Years | 42 (4.7%) | $36,333 |
| 25 to 44 Years | 340 (38.4%) | $60,929 |
| 45 to 64 Years | 292 (33.0%) | $96,667 |
| 65+ Years | 212 (23.9%) | $32,455 |
| Total | 886 (100.0%) | $62,036 |
Poverty in Ferris
Income Below Poverty by Sex and Age in Ferris
With 13.0% poverty level for males and 9.2% for females among the residents of Ferris, 12 to 14 year old males and 18 to 24 year old females are the most vulnerable to poverty, with 40 males (47.6%) and 24 females (22.0%) in their respective age groups living below the poverty level.
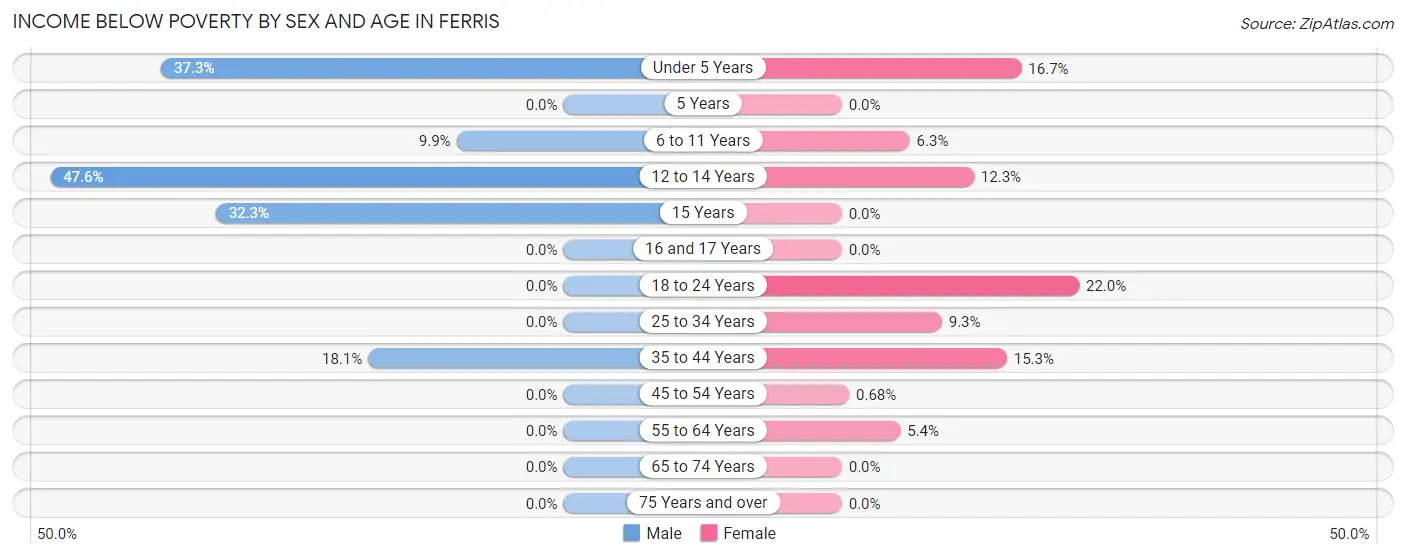
| Age Bracket | Male | Female |
| Under 5 Years | 81 (37.3%) | 28 (16.7%) |
| 5 Years | 0 (0.0%) | 0 (0.0%) |
| 6 to 11 Years | 13 (9.9%) | 8 (6.3%) |
| 12 to 14 Years | 40 (47.6%) | 13 (12.3%) |
| 15 Years | 10 (32.3%) | 0 (0.0%) |
| 16 and 17 Years | 0 (0.0%) | 0 (0.0%) |
| 18 to 24 Years | 0 (0.0%) | 24 (22.0%) |
| 25 to 34 Years | 0 (0.0%) | 22 (9.3%) |
| 35 to 44 Years | 33 (18.1%) | 30 (15.3%) |
| 45 to 54 Years | 0 (0.0%) | 1 (0.7%) |
| 55 to 64 Years | 0 (0.0%) | 5 (5.4%) |
| 65 to 74 Years | 0 (0.0%) | 0 (0.0%) |
| 75 Years and over | 0 (0.0%) | 0 (0.0%) |
| Total | 177 (13.0%) | 131 (9.2%) |
Income Above Poverty by Sex and Age in Ferris
According to the poverty statistics in Ferris, males aged 5 years and females aged 5 years are the age groups that are most secure financially, with 100.0% of males and 100.0% of females in these age groups living above the poverty line.
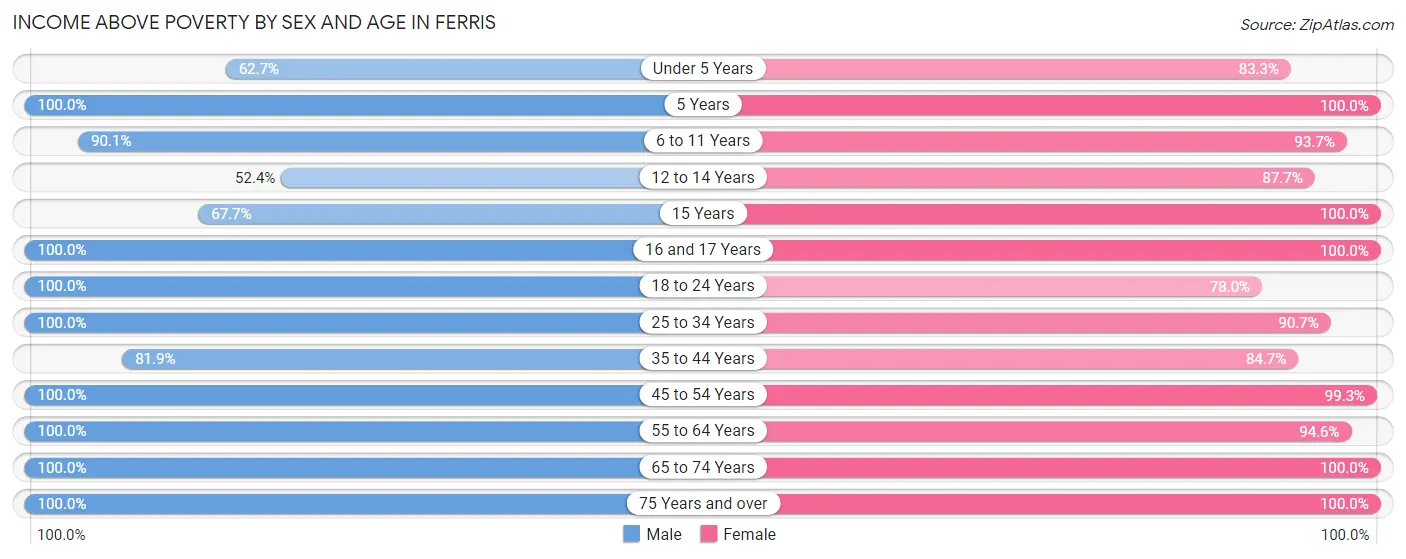
| Age Bracket | Male | Female |
| Under 5 Years | 136 (62.7%) | 140 (83.3%) |
| 5 Years | 8 (100.0%) | 3 (100.0%) |
| 6 to 11 Years | 118 (90.1%) | 119 (93.7%) |
| 12 to 14 Years | 44 (52.4%) | 93 (87.7%) |
| 15 Years | 21 (67.7%) | 4 (100.0%) |
| 16 and 17 Years | 20 (100.0%) | 32 (100.0%) |
| 18 to 24 Years | 107 (100.0%) | 85 (78.0%) |
| 25 to 34 Years | 166 (100.0%) | 215 (90.7%) |
| 35 to 44 Years | 149 (81.9%) | 166 (84.7%) |
| 45 to 54 Years | 208 (100.0%) | 146 (99.3%) |
| 55 to 64 Years | 84 (100.0%) | 87 (94.6%) |
| 65 to 74 Years | 73 (100.0%) | 148 (100.0%) |
| 75 Years and over | 53 (100.0%) | 52 (100.0%) |
| Total | 1,187 (87.0%) | 1,290 (90.8%) |
Income Below Poverty Among Married-Couple Families in Ferris
The poverty statistics for married-couple families in Ferris show that 4.9% or 33 of the total 670 families live below the poverty line. Families with 3 or 4 children have the highest poverty rate of 13.7%, comprising of 14 families. On the other hand, families with no children have the lowest poverty rate of 0.0%, which includes 0 families.
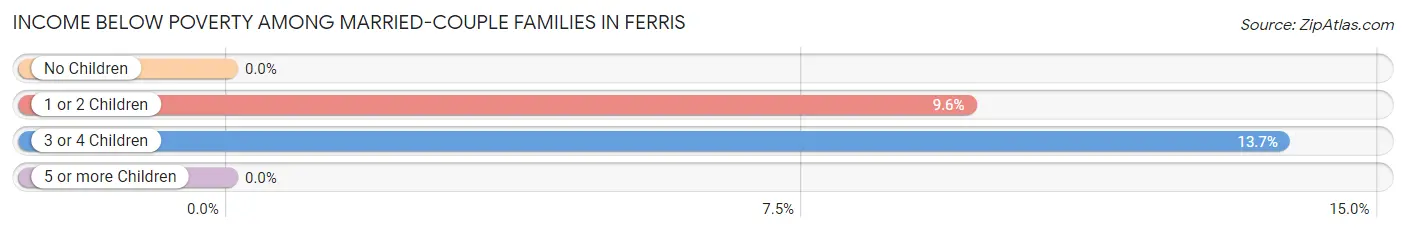
| Children | Above Poverty | Below Poverty |
| No Children | 371 (100.0%) | 0 (0.0%) |
| 1 or 2 Children | 178 (90.4%) | 19 (9.6%) |
| 3 or 4 Children | 88 (86.3%) | 14 (13.7%) |
| 5 or more Children | 0 (0.0%) | 0 (0.0%) |
| Total | 637 (95.1%) | 33 (4.9%) |
Income Below Poverty Among Single-Parent Households in Ferris
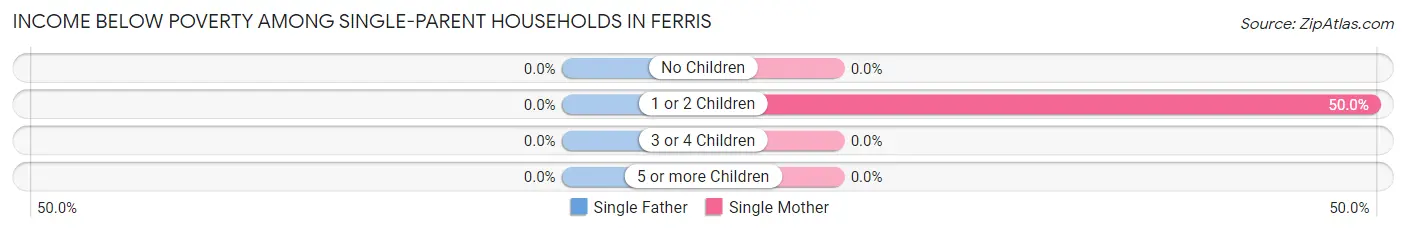
| Children | Single Father | Single Mother |
| No Children | 0 (0.0%) | 0 (0.0%) |
| 1 or 2 Children | 0 (0.0%) | 31 (50.0%) |
| 3 or 4 Children | 0 (0.0%) | 0 (0.0%) |
| 5 or more Children | 0 (0.0%) | 0 (0.0%) |
| Total | 0 (0.0%) | 31 (29.8%) |
Income Below Poverty Among Married-Couple vs Single-Parent Households in Ferris
The poverty data for Ferris shows that 33 of the married-couple family households (4.9%) and 31 of the single-parent households (27.9%) are living below the poverty level. Within the married-couple family households, those with 3 or 4 children have the highest poverty rate, with 14 households (13.7%) falling below the poverty line. Among the single-parent households, those with 1 or 2 children have the highest poverty rate, with 31 household (44.9%) living below poverty.
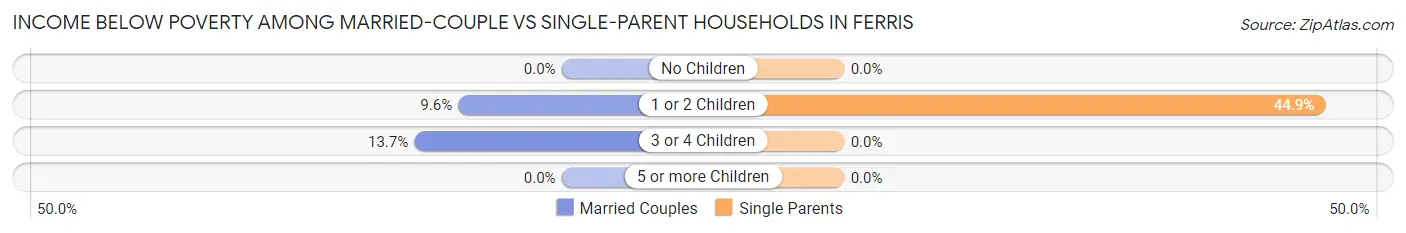
| Children | Married-Couple Families | Single-Parent Households |
| No Children | 0 (0.0%) | 0 (0.0%) |
| 1 or 2 Children | 19 (9.6%) | 31 (44.9%) |
| 3 or 4 Children | 14 (13.7%) | 0 (0.0%) |
| 5 or more Children | 0 (0.0%) | 0 (0.0%) |
| Total | 33 (4.9%) | 31 (27.9%) |
Race in Ferris
The most populous races in Ferris are Hispanic or Latino (1,573 | 56.5%), White / Caucasian (1,303 | 46.8%), and Black / African American (497 | 17.8%).
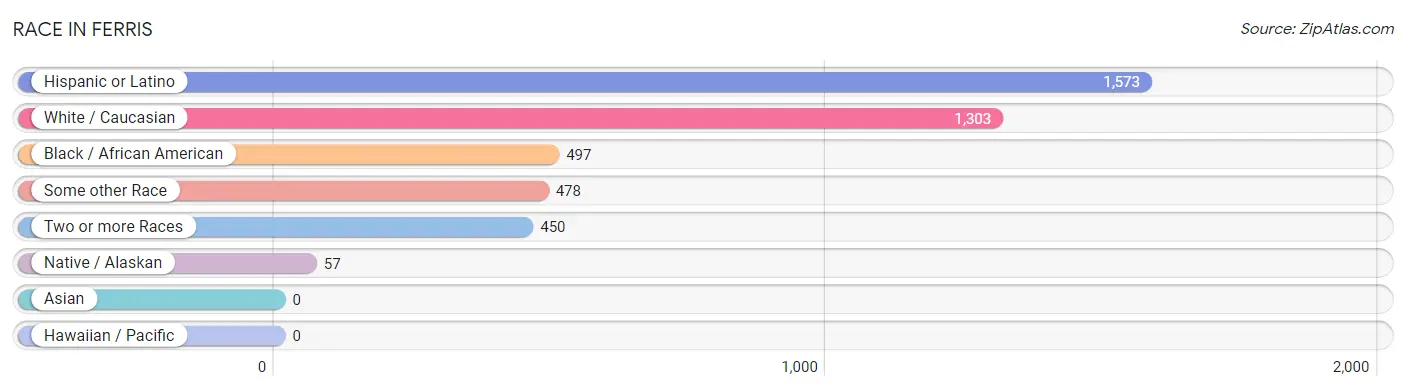
| Race | # Population | % Population |
| Asian | 0 | 0.0% |
| Black / African American | 497 | 17.8% |
| Hawaiian / Pacific | 0 | 0.0% |
| Hispanic or Latino | 1,573 | 56.5% |
| Native / Alaskan | 57 | 2.1% |
| White / Caucasian | 1,303 | 46.8% |
| Two or more Races | 450 | 16.2% |
| Some other Race | 478 | 17.2% |
| Total | 2,785 | 100.0% |
Ancestry in Ferris
The most populous ancestries reported in Ferris are Mexican (1,421 | 51.0%), Irish (256 | 9.2%), American (235 | 8.4%), Central American (152 | 5.5%), and English (128 | 4.6%), together accounting for 78.7% of all Ferris residents.
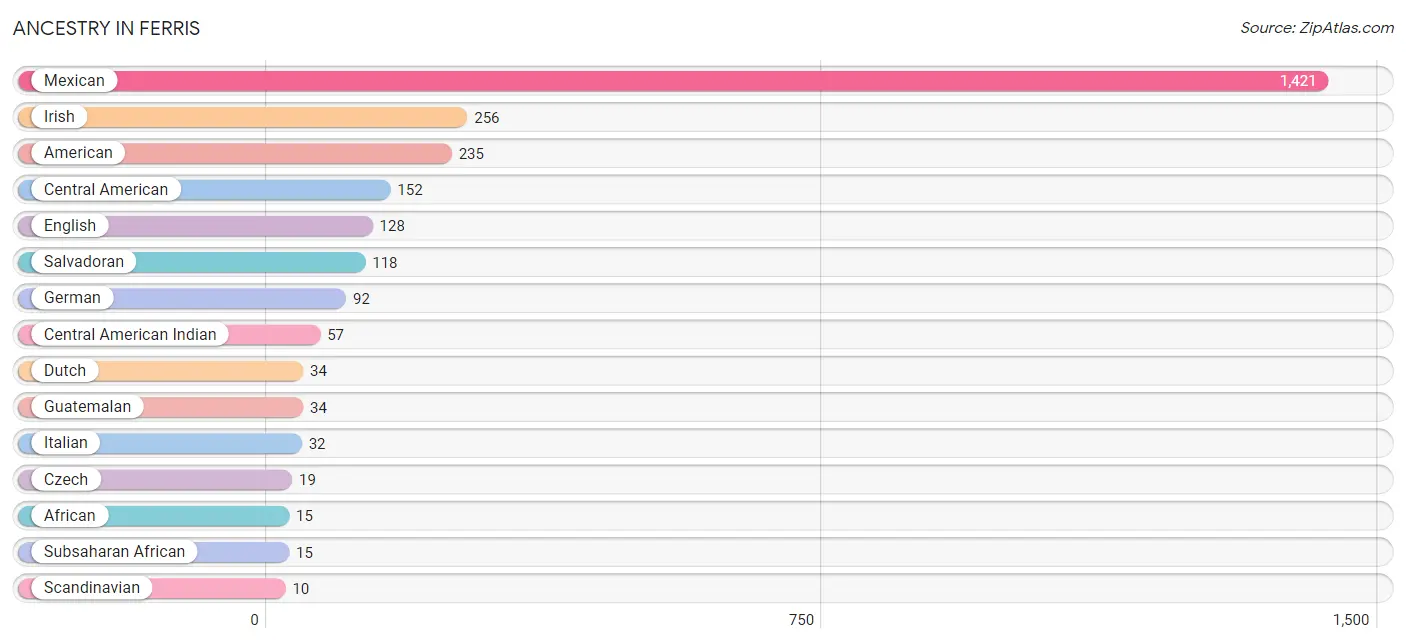
| Ancestry | # Population | % Population |
| African | 15 | 0.5% |
| American | 235 | 8.4% |
| British | 5 | 0.2% |
| Burmese | 2 | 0.1% |
| Central American | 152 | 5.5% |
| Central American Indian | 57 | 2.1% |
| Czech | 19 | 0.7% |
| Dutch | 34 | 1.2% |
| English | 128 | 4.6% |
| French | 8 | 0.3% |
| French Canadian | 5 | 0.2% |
| German | 92 | 3.3% |
| Guatemalan | 34 | 1.2% |
| Irish | 256 | 9.2% |
| Italian | 32 | 1.1% |
| Mexican | 1,421 | 51.0% |
| Norwegian | 3 | 0.1% |
| Polish | 8 | 0.3% |
| Salvadoran | 118 | 4.2% |
| Scandinavian | 10 | 0.4% |
| Scotch-Irish | 8 | 0.3% |
| Scottish | 8 | 0.3% |
| Subsaharan African | 15 | 0.5% | View All 23 Rows |
Immigrants in Ferris
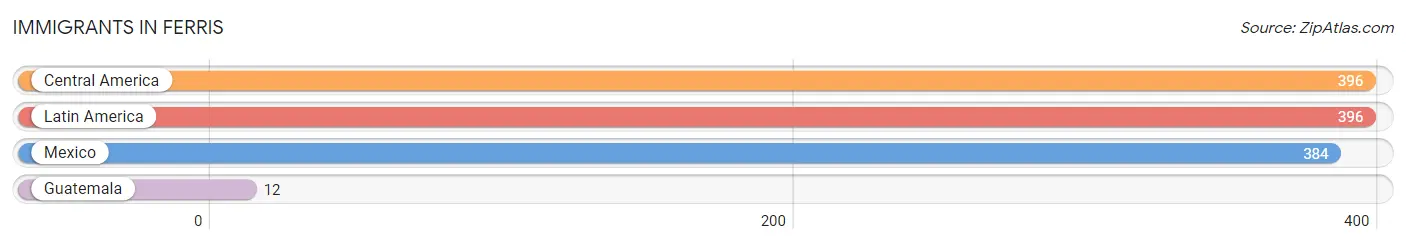
The most numerous immigrant groups reported in Ferris came from Central America (396 | 14.2%), Latin America (396 | 14.2%), Mexico (384 | 13.8%), and Guatemala (12 | 0.4%), together accounting for 42.7% of all Ferris residents.
| Immigration Origin | # Population | % Population |
| Central America | 396 | 14.2% |
| Guatemala | 12 | 0.4% |
| Latin America | 396 | 14.2% |
| Mexico | 384 | 13.8% | View All 4 Rows |
Sex and Age in Ferris
Sex and Age in Ferris
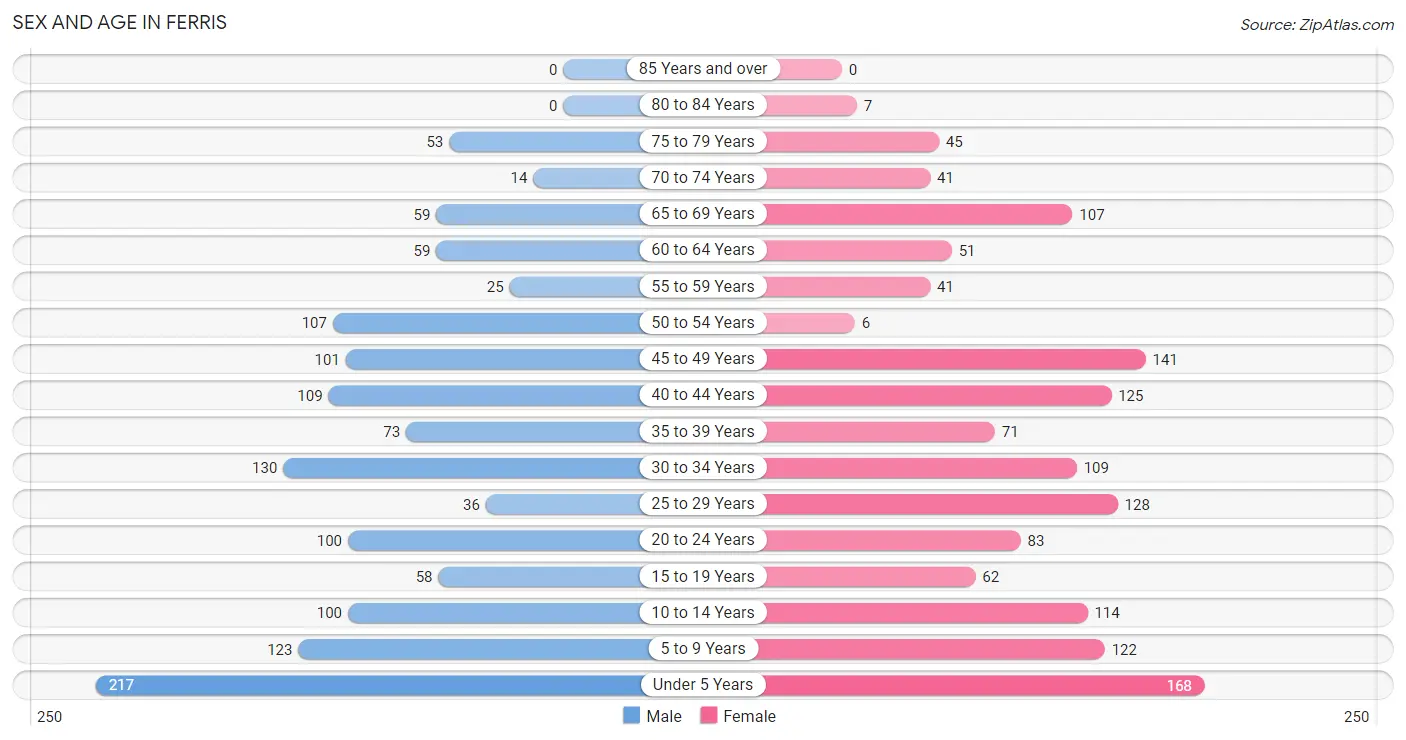
The most populous age groups in Ferris are Under 5 Years (217 | 15.9%) for men and Under 5 Years (168 | 11.8%) for women.
| Age Bracket | Male | Female |
| Under 5 Years | 217 (15.9%) | 168 (11.8%) |
| 5 to 9 Years | 123 (9.0%) | 122 (8.6%) |
| 10 to 14 Years | 100 (7.3%) | 114 (8.0%) |
| 15 to 19 Years | 58 (4.3%) | 62 (4.4%) |
| 20 to 24 Years | 100 (7.3%) | 83 (5.8%) |
| 25 to 29 Years | 36 (2.6%) | 128 (9.0%) |
| 30 to 34 Years | 130 (9.5%) | 109 (7.7%) |
| 35 to 39 Years | 73 (5.3%) | 71 (5.0%) |
| 40 to 44 Years | 109 (8.0%) | 125 (8.8%) |
| 45 to 49 Years | 101 (7.4%) | 141 (9.9%) |
| 50 to 54 Years | 107 (7.8%) | 6 (0.4%) |
| 55 to 59 Years | 25 (1.8%) | 41 (2.9%) |
| 60 to 64 Years | 59 (4.3%) | 51 (3.6%) |
| 65 to 69 Years | 59 (4.3%) | 107 (7.5%) |
| 70 to 74 Years | 14 (1.0%) | 41 (2.9%) |
| 75 to 79 Years | 53 (3.9%) | 45 (3.2%) |
| 80 to 84 Years | 0 (0.0%) | 7 (0.5%) |
| 85 Years and over | 0 (0.0%) | 0 (0.0%) |
| Total | 1,364 (100.0%) | 1,421 (100.0%) |
Families and Households in Ferris
Median Family Size in Ferris
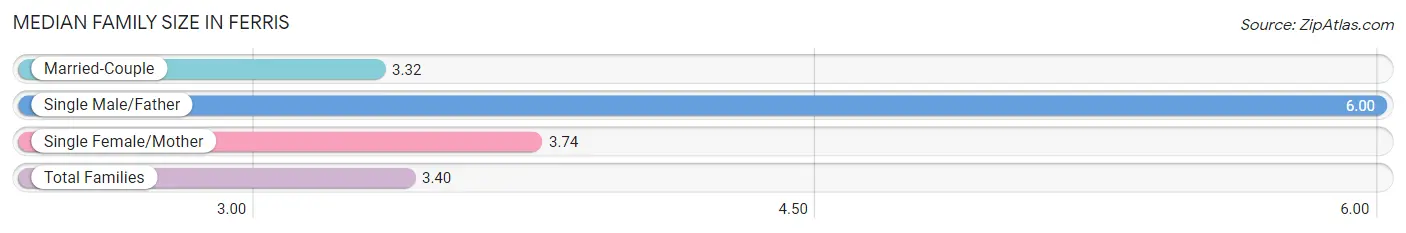
The median family size in Ferris is 3.40 persons per family, with single male/father families (7 | 0.9%) accounting for the largest median family size of 6 persons per family. On the other hand, married-couple families (670 | 85.8%) represent the smallest median family size with 3.32 persons per family.
| Family Type | # Families | Family Size |
| Married-Couple | 670 (85.8%) | 3.32 |
| Single Male/Father | 7 (0.9%) | 6.00 |
| Single Female/Mother | 104 (13.3%) | 3.74 |
| Total Families | 781 (100.0%) | 3.40 |
Median Household Size in Ferris
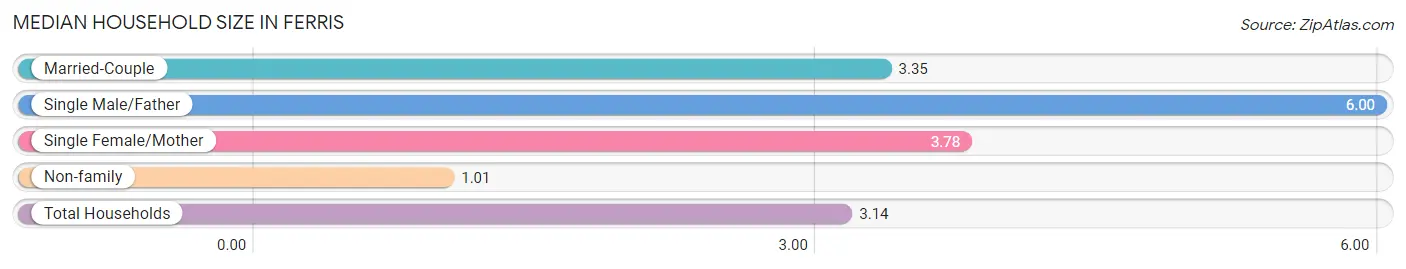
The median household size in Ferris is 3.14 persons per household, with single male/father households (7 | 0.8%) accounting for the largest median household size of 6 persons per household. non-family households (105 | 11.8%) represent the smallest median household size with 1.01 persons per household.
| Household Type | # Households | Household Size |
| Married-Couple | 670 (75.6%) | 3.35 |
| Single Male/Father | 7 (0.8%) | 6.00 |
| Single Female/Mother | 104 (11.7%) | 3.78 |
| Non-family | 105 (11.8%) | 1.01 |
| Total Households | 886 (100.0%) | 3.14 |
Household Size by Marriage Status in Ferris
Out of a total of 886 households in Ferris, 781 (88.1%) are family households, while 105 (11.8%) are nonfamily households. The most numerous type of family households are 2-person households, comprising 313, and the most common type of nonfamily households are 1-person households, comprising 104.
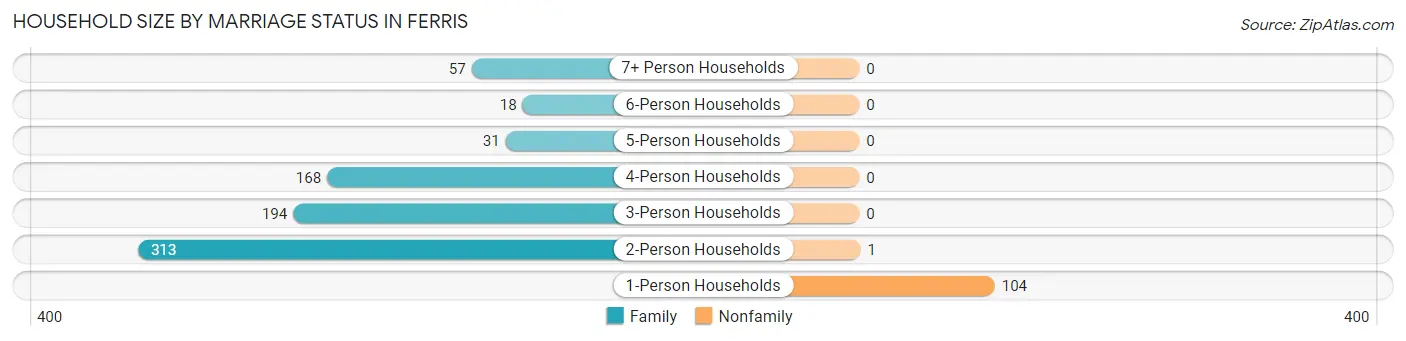
| Household Size | Family Households | Nonfamily Households |
| 1-Person Households | - | 104 (11.7%) |
| 2-Person Households | 313 (35.3%) | 1 (0.1%) |
| 3-Person Households | 194 (21.9%) | 0 (0.0%) |
| 4-Person Households | 168 (19.0%) | 0 (0.0%) |
| 5-Person Households | 31 (3.5%) | 0 (0.0%) |
| 6-Person Households | 18 (2.0%) | 0 (0.0%) |
| 7+ Person Households | 57 (6.4%) | 0 (0.0%) |
| Total | 781 (88.1%) | 105 (11.8%) |
Female Fertility in Ferris
Fertility by Age in Ferris
Average fertility rate in Ferris is 129.0 births per 1,000 women. Women in the age bracket of 20 to 34 years have the highest fertility rate with 291.0 births per 1,000 women. Women in the age bracket of 20 to 34 years acount for 100.0% of all women with births.
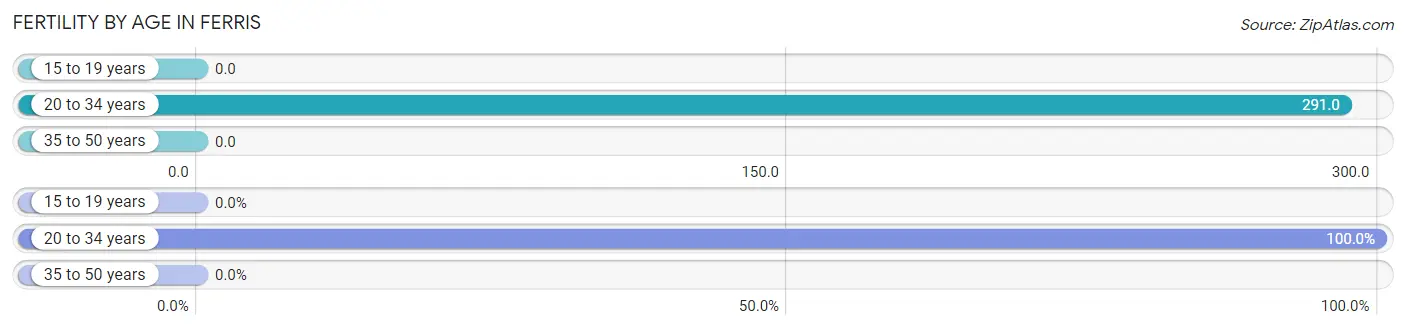
| Age Bracket | Women with Births | Births / 1,000 Women |
| 15 to 19 years | 0 (0.0%) | 0.0 |
| 20 to 34 years | 93 (100.0%) | 291.0 |
| 35 to 50 years | 0 (0.0%) | 0.0 |
| Total | 93 (100.0%) | 129.0 |
Fertility by Age by Marriage Status in Ferris
61.3% of women with births (93) in Ferris are married. The highest percentage of unmarried women with births falls into 20 to 34 years age bracket with 38.7% of them unmarried at the time of birth, while the lowest percentage of unmarried women with births belong to 20 to 34 years age bracket with 38.7% of them unmarried.
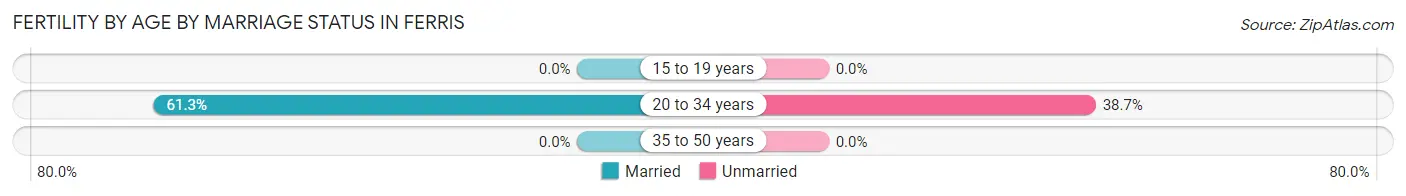
| Age Bracket | Married | Unmarried |
| 15 to 19 years | 0 (0.0%) | 0 (0.0%) |
| 20 to 34 years | 57 (61.3%) | 36 (38.7%) |
| 35 to 50 years | 0 (0.0%) | 0 (0.0%) |
| Total | 57 (61.3%) | 36 (38.7%) |
Fertility by Education in Ferris
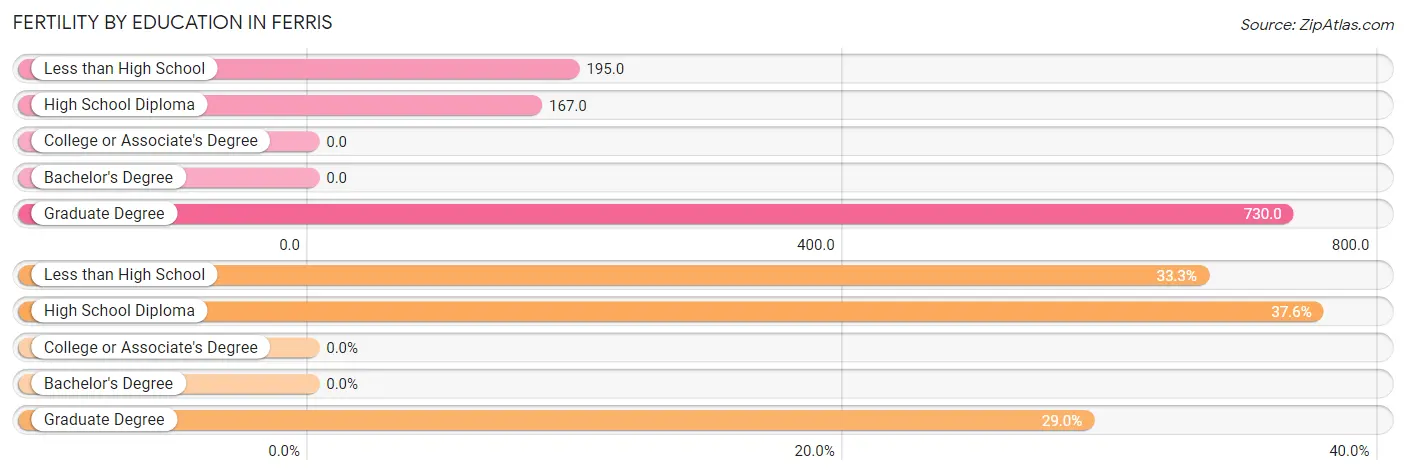
| Educational Attainment | Women with Births | Births / 1,000 Women |
| Less than High School | 31 (33.3%) | 195.0 |
| High School Diploma | 35 (37.6%) | 167.0 |
| College or Associate's Degree | 0 (0.0%) | 0.0 |
| Bachelor's Degree | 0 (0.0%) | 0.0 |
| Graduate Degree | 27 (29.0%) | 730.0 |
| Total | 93 (100.0%) | 129.0 |
Fertility by Education by Marriage Status in Ferris
38.7% of women with births in Ferris are unmarried. Women with the educational attainment of graduate degree are most likely to be married with 100.0% of them married at childbirth, while women with the educational attainment of less than high school are least likely to be married with 100.0% of them unmarried at childbirth.
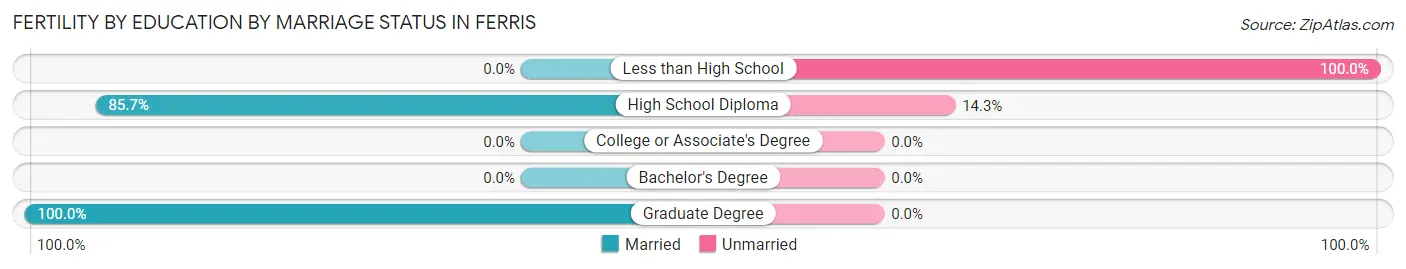
| Educational Attainment | Married | Unmarried |
| Less than High School | 0 (0.0%) | 31 (100.0%) |
| High School Diploma | 30 (85.7%) | 5 (14.3%) |
| College or Associate's Degree | 0 (0.0%) | 0 (0.0%) |
| Bachelor's Degree | 0 (0.0%) | 0 (0.0%) |
| Graduate Degree | 27 (100.0%) | 0 (0.0%) |
| Total | 57 (61.3%) | 36 (38.7%) |
Employment Characteristics in Ferris
Employment by Class of Employer in Ferris
Among the 1,304 employed individuals in Ferris, private company employees (891 | 68.3%), local government employees (220 | 16.9%), and self-employed (not incorporated) (102 | 7.8%) make up the most common classes of employment.
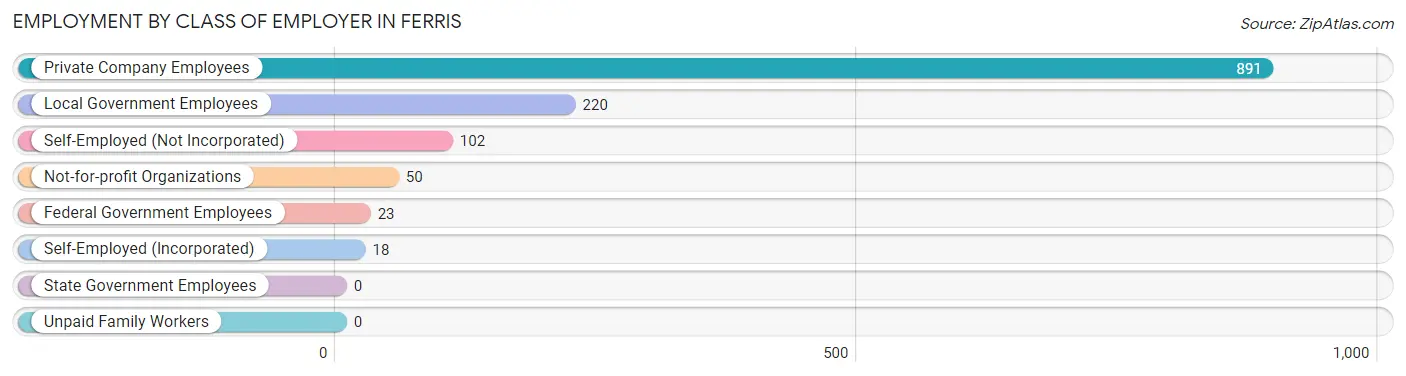
| Employer Class | # Employees | % Employees |
| Private Company Employees | 891 | 68.3% |
| Self-Employed (Incorporated) | 18 | 1.4% |
| Self-Employed (Not Incorporated) | 102 | 7.8% |
| Not-for-profit Organizations | 50 | 3.8% |
| Local Government Employees | 220 | 16.9% |
| State Government Employees | 0 | 0.0% |
| Federal Government Employees | 23 | 1.8% |
| Unpaid Family Workers | 0 | 0.0% |
| Total | 1,304 | 100.0% |
Employment Status by Age in Ferris
According to the labor force statistics for Ferris, out of the total population over 16 years of age (1,906), 69.3% or 1,321 individuals are in the labor force, with 0.8% or 11 of them unemployed. The age group with the highest labor force participation rate is 45 to 54 years, with 97.2% or 345 individuals in the labor force. Within the labor force, the 35 to 44 years age range has the highest percentage of unemployed individuals, with 3.4% or 11 of them being unemployed.
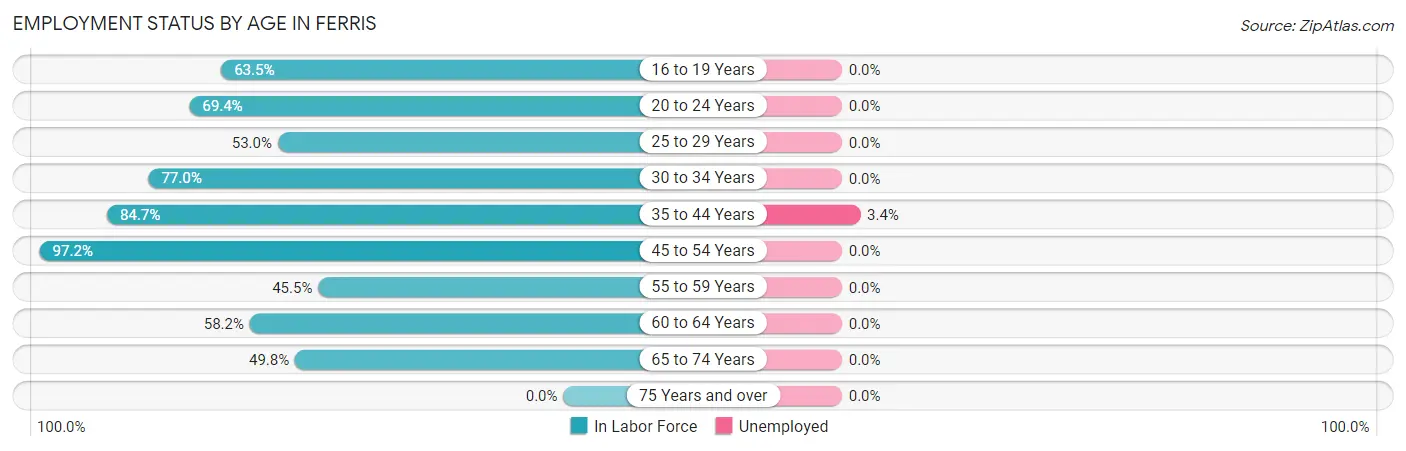
| Age Bracket | In Labor Force | Unemployed |
| 16 to 19 Years | 54 (63.5%) | 0 (0.0%) |
| 20 to 24 Years | 127 (69.4%) | 0 (0.0%) |
| 25 to 29 Years | 87 (53.0%) | 0 (0.0%) |
| 30 to 34 Years | 184 (77.0%) | 0 (0.0%) |
| 35 to 44 Years | 320 (84.7%) | 11 (3.4%) |
| 45 to 54 Years | 345 (97.2%) | 0 (0.0%) |
| 55 to 59 Years | 30 (45.5%) | 0 (0.0%) |
| 60 to 64 Years | 64 (58.2%) | 0 (0.0%) |
| 65 to 74 Years | 110 (49.8%) | 0 (0.0%) |
| 75 Years and over | 0 (0.0%) | 0 (0.0%) |
| Total | 1,321 (69.3%) | 11 (0.8%) |
Employment Status by Educational Attainment in Ferris
According to labor force statistics for Ferris, 78.5% of individuals (1,030) out of the total population between 25 and 64 years of age (1,312) are in the labor force, with 1.1% or 11 of them being unemployed. The group with the highest labor force participation rate are those with the educational attainment of bachelor's degree or higher, with 99.0% or 196 individuals in the labor force. Within the labor force, individuals with college / associate degree education have the highest percentage of unemployment, with 3.1% or 11 of them being unemployed.
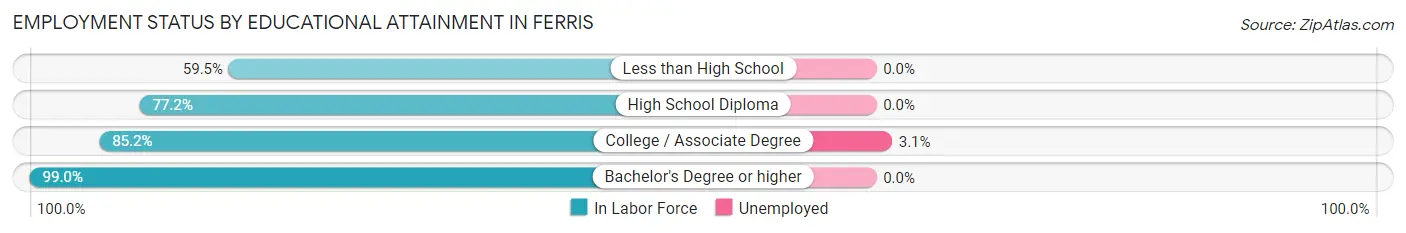
| Educational Attainment | In Labor Force | Unemployed |
| Less than High School | 201 (59.5%) | 0 (0.0%) |
| High School Diploma | 275 (77.2%) | 0 (0.0%) |
| College / Associate Degree | 358 (85.2%) | 13 (3.1%) |
| Bachelor's Degree or higher | 196 (99.0%) | 0 (0.0%) |
| Total | 1,030 (78.5%) | 14 (1.1%) |
Employment Occupations by Sex in Ferris
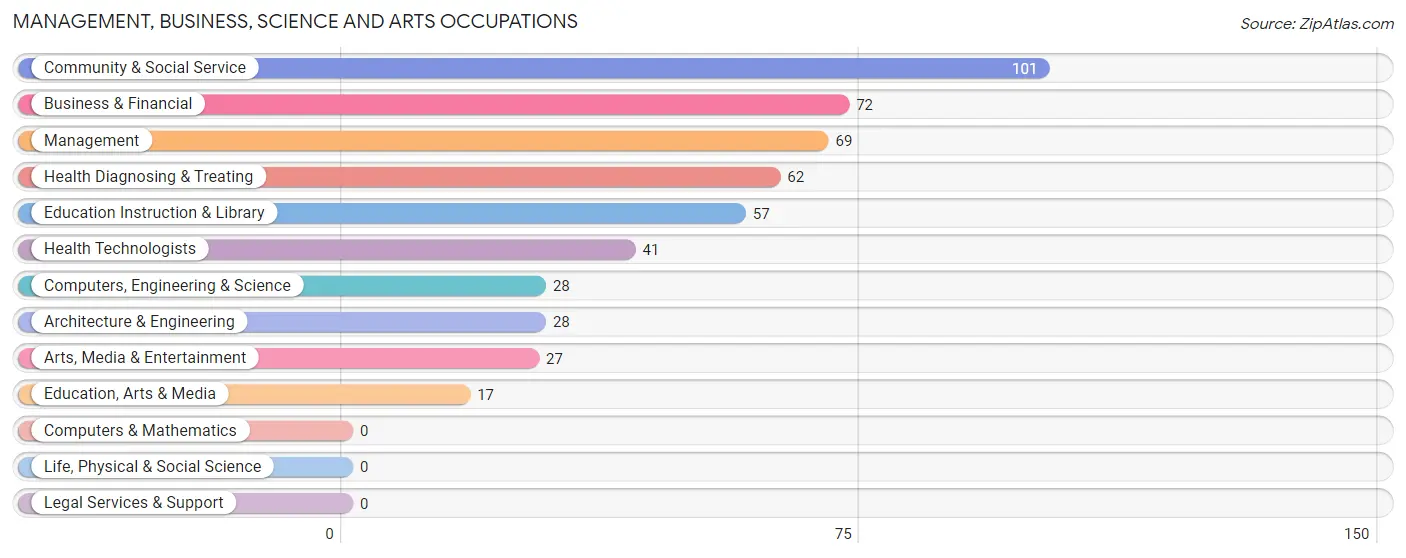
Management, Business, Science and Arts Occupations
The most common Management, Business, Science and Arts occupations in Ferris are Community & Social Service (101 | 7.7%), Business & Financial (72 | 5.5%), Management (69 | 5.3%), Health Diagnosing & Treating (62 | 4.7%), and Education Instruction & Library (57 | 4.3%).
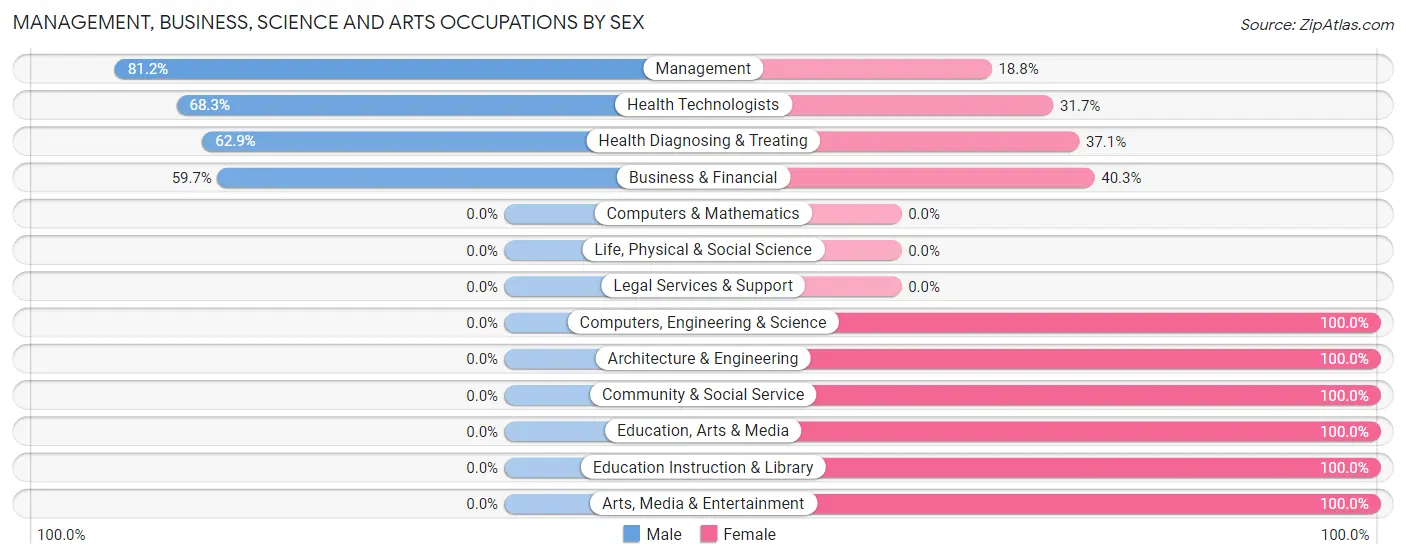
Management, Business, Science and Arts Occupations by Sex
Within the Management, Business, Science and Arts occupations in Ferris, the most male-oriented occupations are Management (81.2%), Health Technologists (68.3%), and Health Diagnosing & Treating (62.9%), while the most female-oriented occupations are Computers, Engineering & Science (100.0%), Architecture & Engineering (100.0%), and Community & Social Service (100.0%).
| Occupation | Male | Female |
| Management | 56 (81.2%) | 13 (18.8%) |
| Business & Financial | 43 (59.7%) | 29 (40.3%) |
| Computers, Engineering & Science | 0 (0.0%) | 28 (100.0%) |
| Computers & Mathematics | 0 (0.0%) | 0 (0.0%) |
| Architecture & Engineering | 0 (0.0%) | 28 (100.0%) |
| Life, Physical & Social Science | 0 (0.0%) | 0 (0.0%) |
| Community & Social Service | 0 (0.0%) | 101 (100.0%) |
| Education, Arts & Media | 0 (0.0%) | 17 (100.0%) |
| Legal Services & Support | 0 (0.0%) | 0 (0.0%) |
| Education Instruction & Library | 0 (0.0%) | 57 (100.0%) |
| Arts, Media & Entertainment | 0 (0.0%) | 27 (100.0%) |
| Health Diagnosing & Treating | 39 (62.9%) | 23 (37.1%) |
| Health Technologists | 28 (68.3%) | 13 (31.7%) |
| Total (Category) | 138 (41.6%) | 194 (58.4%) |
| Total (Overall) | 726 (55.4%) | 584 (44.6%) |
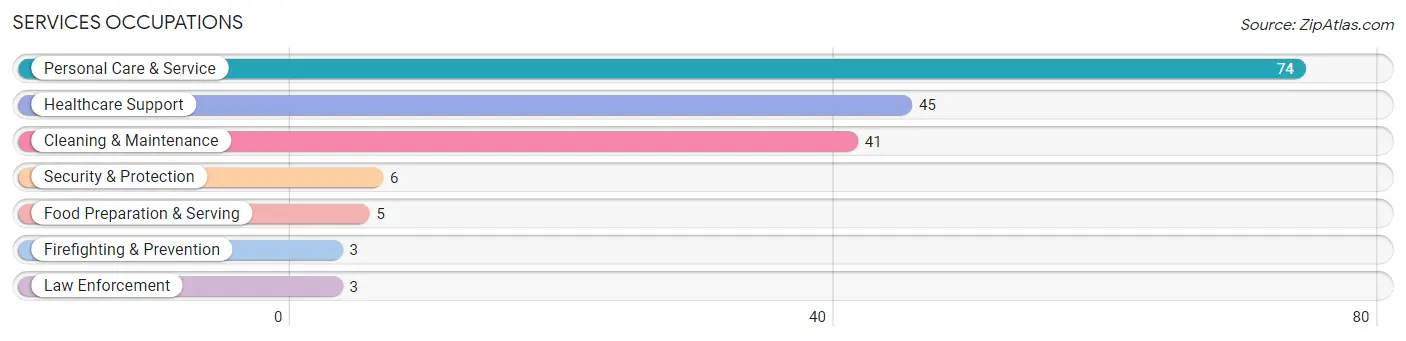
Services Occupations
The most common Services occupations in Ferris are Personal Care & Service (74 | 5.7%), Healthcare Support (45 | 3.4%), Cleaning & Maintenance (41 | 3.1%), Security & Protection (6 | 0.5%), and Food Preparation & Serving (5 | 0.4%).
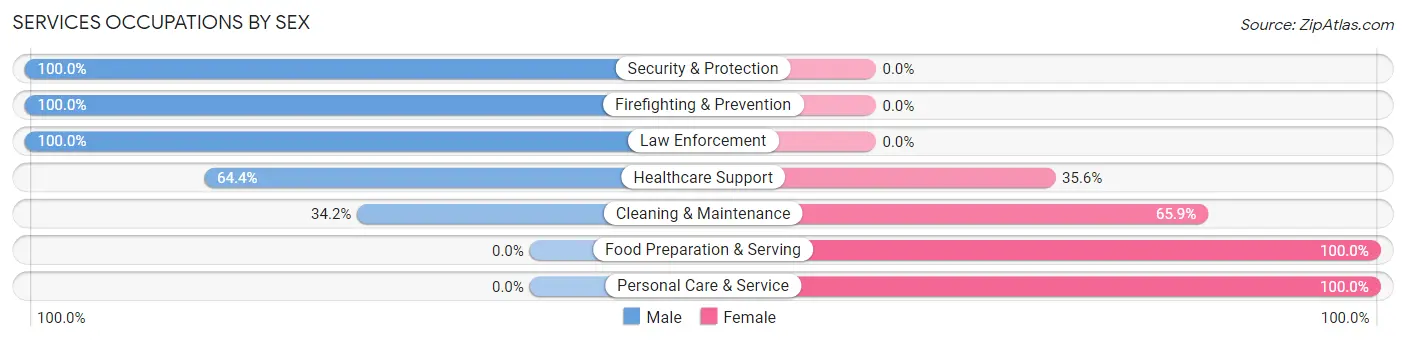
Services Occupations by Sex
Within the Services occupations in Ferris, the most male-oriented occupations are Security & Protection (100.0%), Firefighting & Prevention (100.0%), and Law Enforcement (100.0%), while the most female-oriented occupations are Food Preparation & Serving (100.0%), Personal Care & Service (100.0%), and Cleaning & Maintenance (65.8%).
| Occupation | Male | Female |
| Healthcare Support | 29 (64.4%) | 16 (35.6%) |
| Security & Protection | 6 (100.0%) | 0 (0.0%) |
| Firefighting & Prevention | 3 (100.0%) | 0 (0.0%) |
| Law Enforcement | 3 (100.0%) | 0 (0.0%) |
| Food Preparation & Serving | 0 (0.0%) | 5 (100.0%) |
| Cleaning & Maintenance | 14 (34.2%) | 27 (65.8%) |
| Personal Care & Service | 0 (0.0%) | 74 (100.0%) |
| Total (Category) | 49 (28.6%) | 122 (71.4%) |
| Total (Overall) | 726 (55.4%) | 584 (44.6%) |
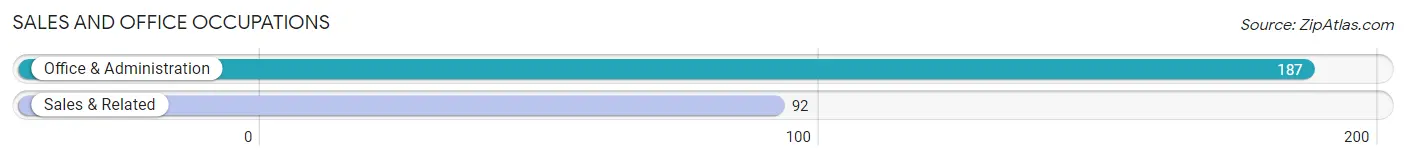
Sales and Office Occupations
The most common Sales and Office occupations in Ferris are Office & Administration (187 | 14.3%), and Sales & Related (92 | 7.0%).
Sales and Office Occupations by Sex
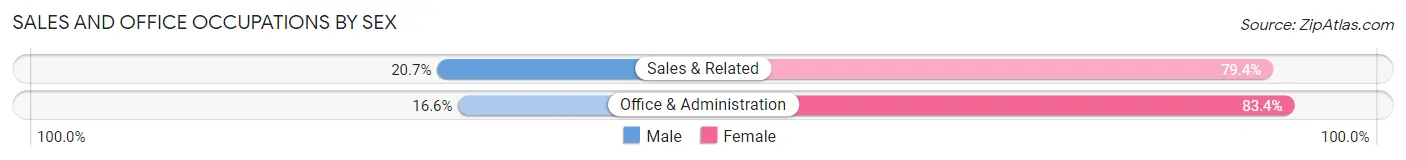
| Occupation | Male | Female |
| Sales & Related | 19 (20.6%) | 73 (79.3%) |
| Office & Administration | 31 (16.6%) | 156 (83.4%) |
| Total (Category) | 50 (17.9%) | 229 (82.1%) |
| Total (Overall) | 726 (55.4%) | 584 (44.6%) |
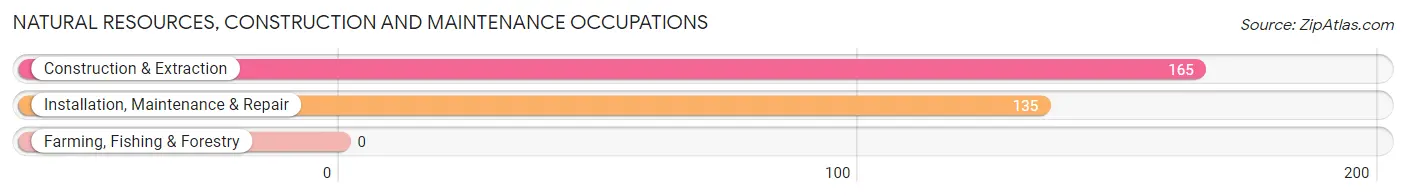
Natural Resources, Construction and Maintenance Occupations
The most common Natural Resources, Construction and Maintenance occupations in Ferris are Construction & Extraction (165 | 12.6%), and Installation, Maintenance & Repair (135 | 10.3%).
Natural Resources, Construction and Maintenance Occupations by Sex
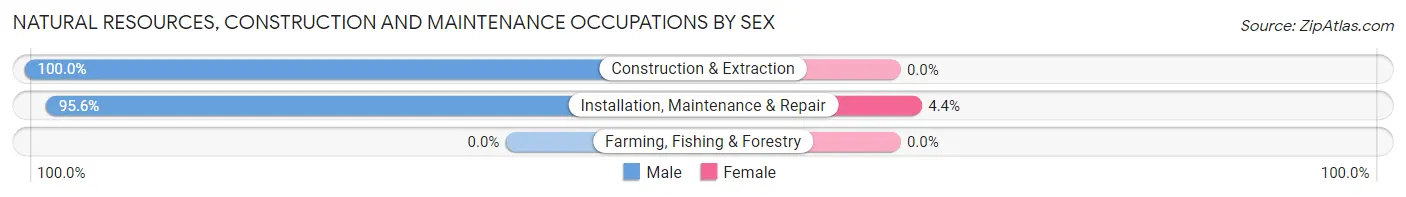
| Occupation | Male | Female |
| Farming, Fishing & Forestry | 0 (0.0%) | 0 (0.0%) |
| Construction & Extraction | 165 (100.0%) | 0 (0.0%) |
| Installation, Maintenance & Repair | 129 (95.6%) | 6 (4.4%) |
| Total (Category) | 294 (98.0%) | 6 (2.0%) |
| Total (Overall) | 726 (55.4%) | 584 (44.6%) |
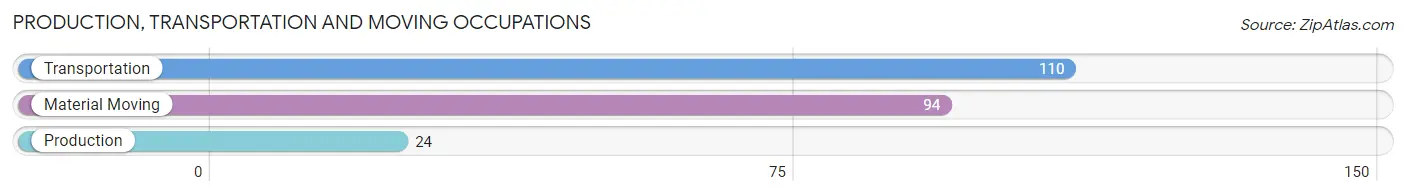
Production, Transportation and Moving Occupations
The most common Production, Transportation and Moving occupations in Ferris are Transportation (110 | 8.4%), Material Moving (94 | 7.2%), and Production (24 | 1.8%).
Production, Transportation and Moving Occupations by Sex
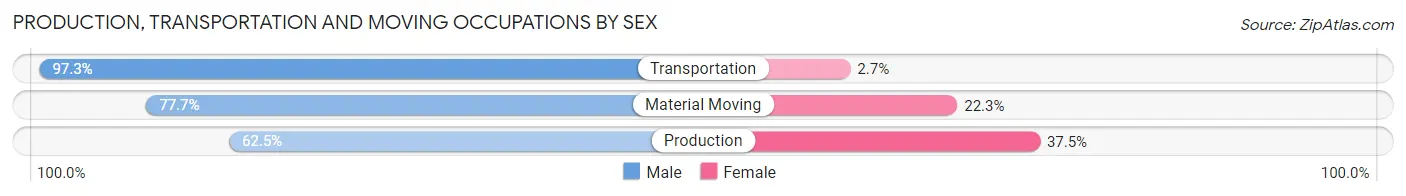
| Occupation | Male | Female |
| Production | 15 (62.5%) | 9 (37.5%) |
| Transportation | 107 (97.3%) | 3 (2.7%) |
| Material Moving | 73 (77.7%) | 21 (22.3%) |
| Total (Category) | 195 (85.5%) | 33 (14.5%) |
| Total (Overall) | 726 (55.4%) | 584 (44.6%) |
Employment Industries by Sex in Ferris
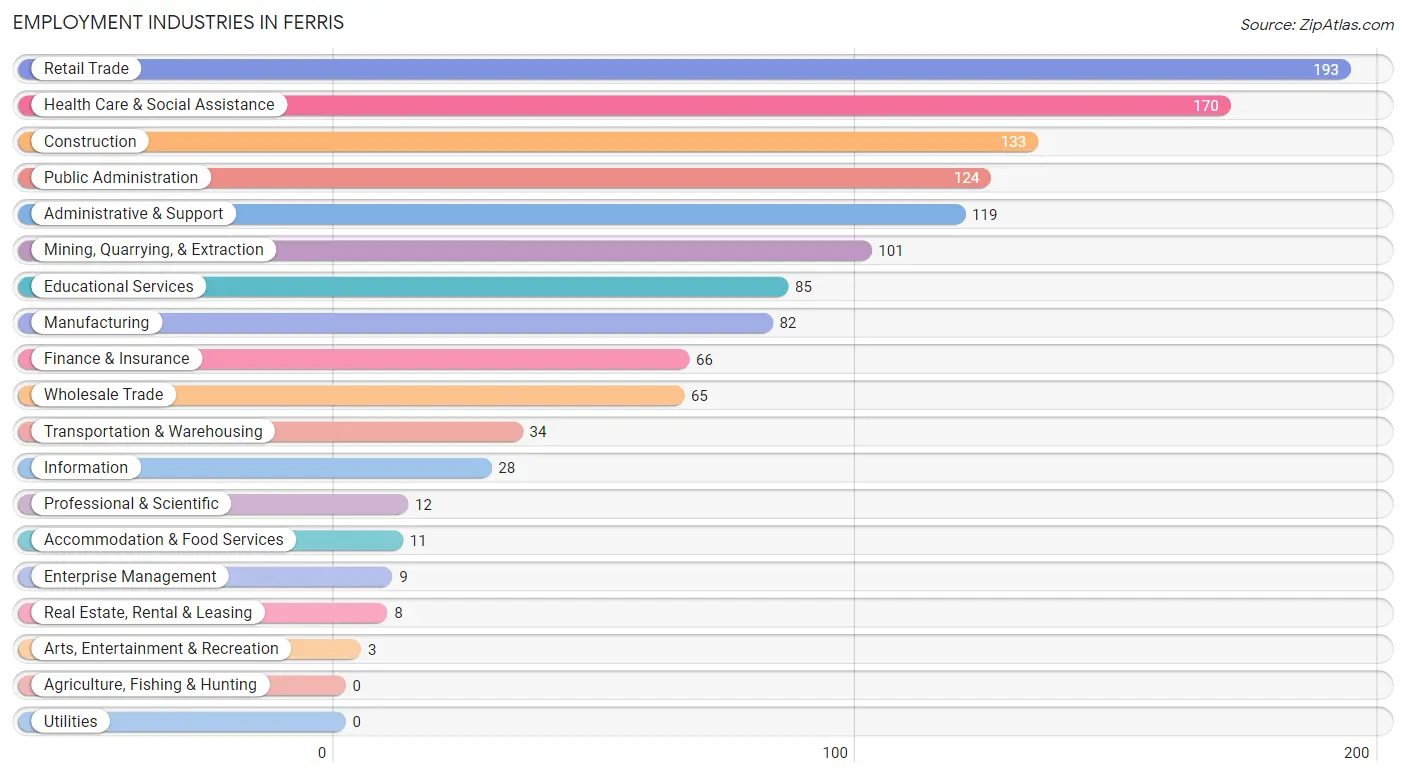
Employment Industries in Ferris
The major employment industries in Ferris include Retail Trade (193 | 14.7%), Health Care & Social Assistance (170 | 13.0%), Construction (133 | 10.2%), Public Administration (124 | 9.5%), and Administrative & Support (119 | 9.1%).
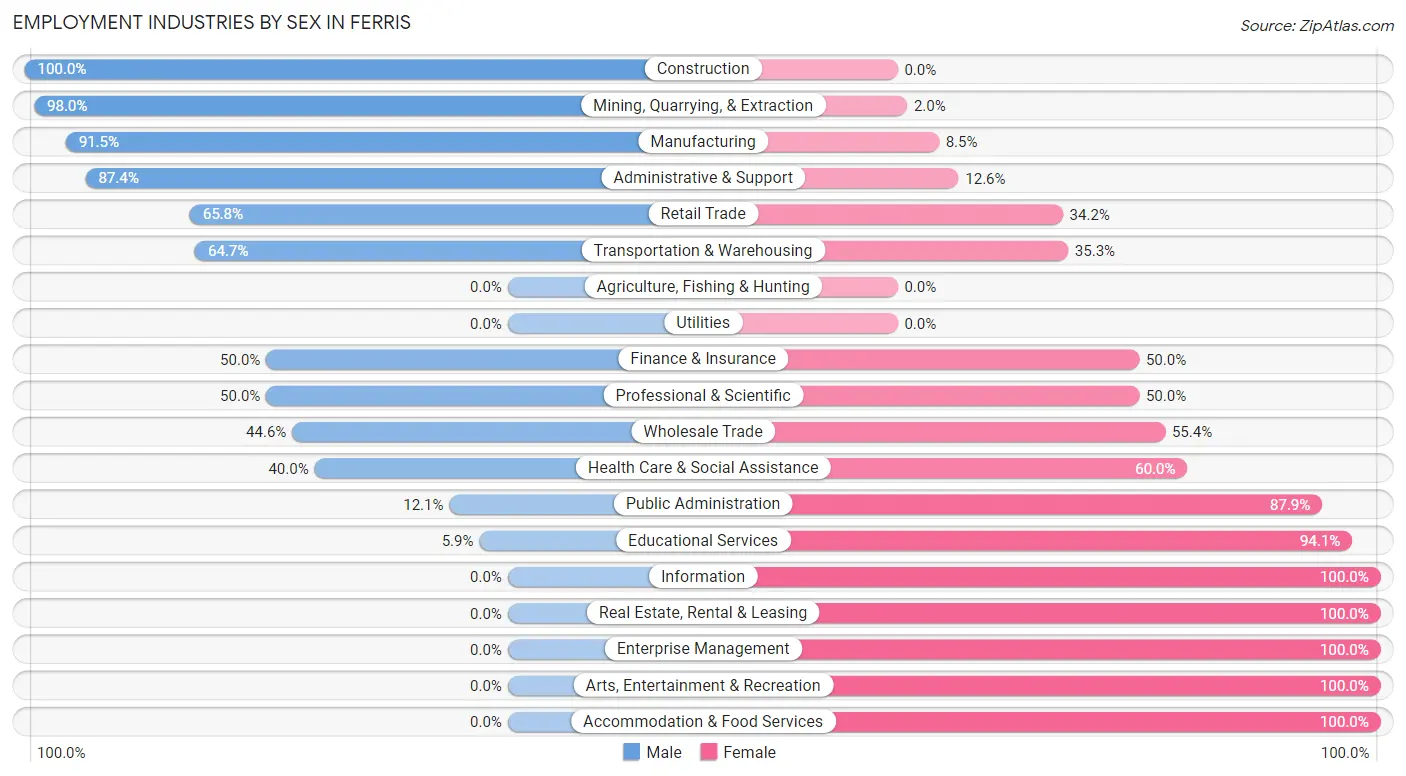
Employment Industries by Sex in Ferris
The Ferris industries that see more men than women are Construction (100.0%), Mining, Quarrying, & Extraction (98.0%), and Manufacturing (91.5%), whereas the industries that tend to have a higher number of women are Information (100.0%), Real Estate, Rental & Leasing (100.0%), and Enterprise Management (100.0%).
| Industry | Male | Female |
| Agriculture, Fishing & Hunting | 0 (0.0%) | 0 (0.0%) |
| Mining, Quarrying, & Extraction | 99 (98.0%) | 2 (2.0%) |
| Construction | 133 (100.0%) | 0 (0.0%) |
| Manufacturing | 75 (91.5%) | 7 (8.5%) |
| Wholesale Trade | 29 (44.6%) | 36 (55.4%) |
| Retail Trade | 127 (65.8%) | 66 (34.2%) |
| Transportation & Warehousing | 22 (64.7%) | 12 (35.3%) |
| Utilities | 0 (0.0%) | 0 (0.0%) |
| Information | 0 (0.0%) | 28 (100.0%) |
| Finance & Insurance | 33 (50.0%) | 33 (50.0%) |
| Real Estate, Rental & Leasing | 0 (0.0%) | 8 (100.0%) |
| Professional & Scientific | 6 (50.0%) | 6 (50.0%) |
| Enterprise Management | 0 (0.0%) | 9 (100.0%) |
| Administrative & Support | 104 (87.4%) | 15 (12.6%) |
| Educational Services | 5 (5.9%) | 80 (94.1%) |
| Health Care & Social Assistance | 68 (40.0%) | 102 (60.0%) |
| Arts, Entertainment & Recreation | 0 (0.0%) | 3 (100.0%) |
| Accommodation & Food Services | 0 (0.0%) | 11 (100.0%) |
| Public Administration | 15 (12.1%) | 109 (87.9%) |
| Total | 726 (55.4%) | 584 (44.6%) |
Education in Ferris
School Enrollment in Ferris
The most common levels of schooling among the 618 students in Ferris are elementary school (213 | 34.5%), middle school (161 | 26.1%), and high school (114 | 18.4%).
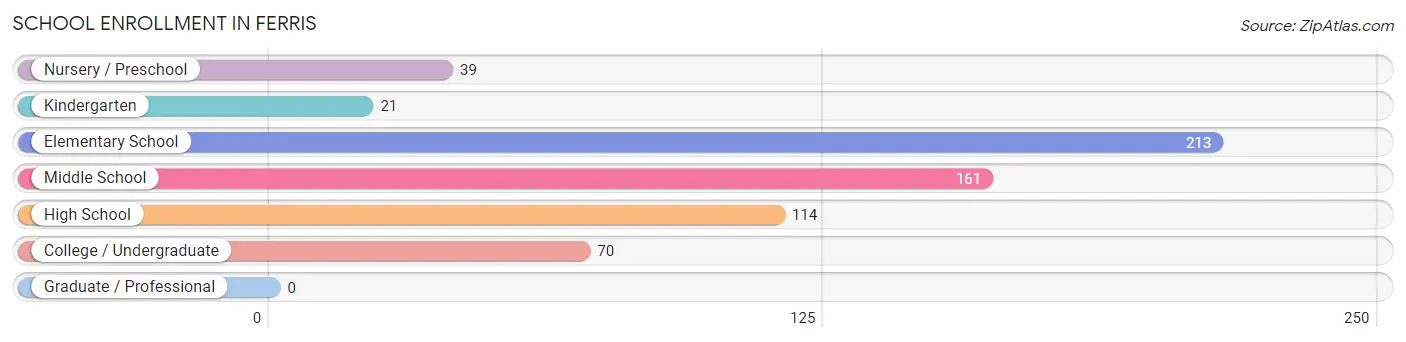
| School Level | # Students | % Students |
| Nursery / Preschool | 39 | 6.3% |
| Kindergarten | 21 | 3.4% |
| Elementary School | 213 | 34.5% |
| Middle School | 161 | 26.1% |
| High School | 114 | 18.4% |
| College / Undergraduate | 70 | 11.3% |
| Graduate / Professional | 0 | 0.0% |
| Total | 618 | 100.0% |
School Enrollment by Age by Funding Source in Ferris
Out of a total of 618 students who are enrolled in schools in Ferris, 101 (16.3%) attend a private institution, while the remaining 517 (83.7%) are enrolled in public schools. The age group of 25 to 34 year olds has the highest likelihood of being enrolled in private schools, with 33 (100.0% in the age bracket) enrolled. Conversely, the age group of 10 to 14 year olds has the lowest likelihood of being enrolled in a private school, with 205 (100.0% in the age bracket) attending a public institution.
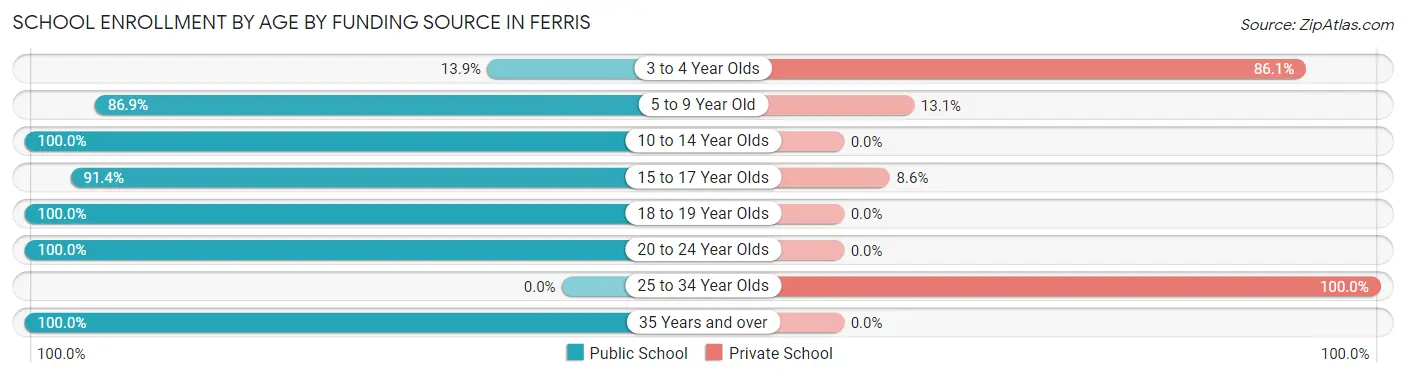
| Age Bracket | Public School | Private School |
| 3 to 4 Year Olds | 5 (13.9%) | 31 (86.1%) |
| 5 to 9 Year Old | 206 (86.9%) | 31 (13.1%) |
| 10 to 14 Year Olds | 205 (100.0%) | 0 (0.0%) |
| 15 to 17 Year Olds | 64 (91.4%) | 6 (8.6%) |
| 18 to 19 Year Olds | 9 (100.0%) | 0 (0.0%) |
| 20 to 24 Year Olds | 23 (100.0%) | 0 (0.0%) |
| 25 to 34 Year Olds | 0 (0.0%) | 33 (100.0%) |
| 35 Years and over | 5 (100.0%) | 0 (0.0%) |
| Total | 517 (83.7%) | 101 (16.3%) |
Educational Attainment by Field of Study in Ferris
Arts & humanities (169 | 57.9%), business (58 | 19.9%), communications (38 | 13.0%), physical & health sciences (10 | 3.4%), and education (10 | 3.4%) are the most common fields of study among 292 individuals in Ferris who have obtained a bachelor's degree or higher.
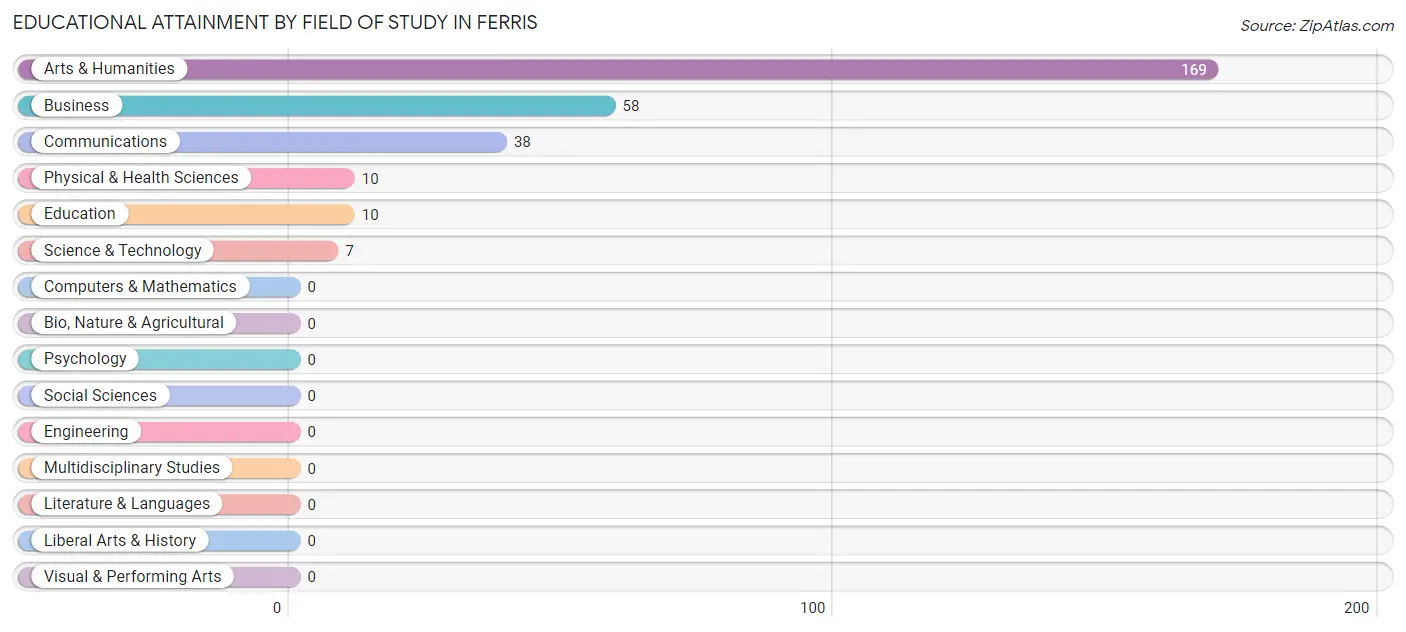
| Field of Study | # Graduates | % Graduates |
| Computers & Mathematics | 0 | 0.0% |
| Bio, Nature & Agricultural | 0 | 0.0% |
| Physical & Health Sciences | 10 | 3.4% |
| Psychology | 0 | 0.0% |
| Social Sciences | 0 | 0.0% |
| Engineering | 0 | 0.0% |
| Multidisciplinary Studies | 0 | 0.0% |
| Science & Technology | 7 | 2.4% |
| Business | 58 | 19.9% |
| Education | 10 | 3.4% |
| Literature & Languages | 0 | 0.0% |
| Liberal Arts & History | 0 | 0.0% |
| Visual & Performing Arts | 0 | 0.0% |
| Communications | 38 | 13.0% |
| Arts & Humanities | 169 | 57.9% |
| Total | 292 | 100.0% |
Transportation & Commute in Ferris
Vehicle Availability by Sex in Ferris
The most prevalent vehicle ownership categories in Ferris are males with 2 vehicles (366, accounting for 50.8%) and females with 2 vehicles (272, making up 62.7%).
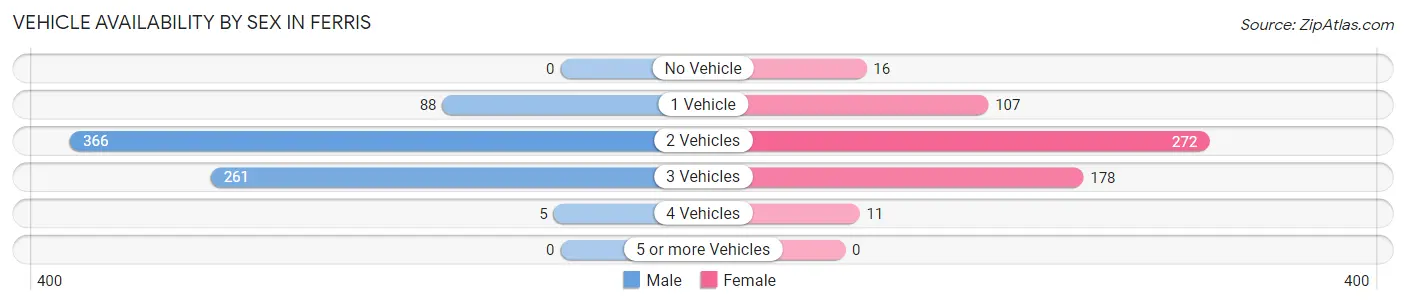
| Vehicles Available | Male | Female |
| No Vehicle | 0 (0.0%) | 16 (2.7%) |
| 1 Vehicle | 88 (12.2%) | 107 (18.3%) |
| 2 Vehicles | 366 (50.8%) | 272 (46.6%) |
| 3 Vehicles | 261 (36.2%) | 178 (30.5%) |
| 4 Vehicles | 5 (0.7%) | 11 (1.9%) |
| 5 or more Vehicles | 0 (0.0%) | 0 (0.0%) |
| Total | 720 (100.0%) | 584 (100.0%) |
Commute Time in Ferris
The most frequently occuring commute durations in Ferris are 45 to 59 minutes (309 commuters, 27.3%), 30 to 34 minutes (250 commuters, 22.1%), and 5 to 9 minutes (188 commuters, 16.6%).
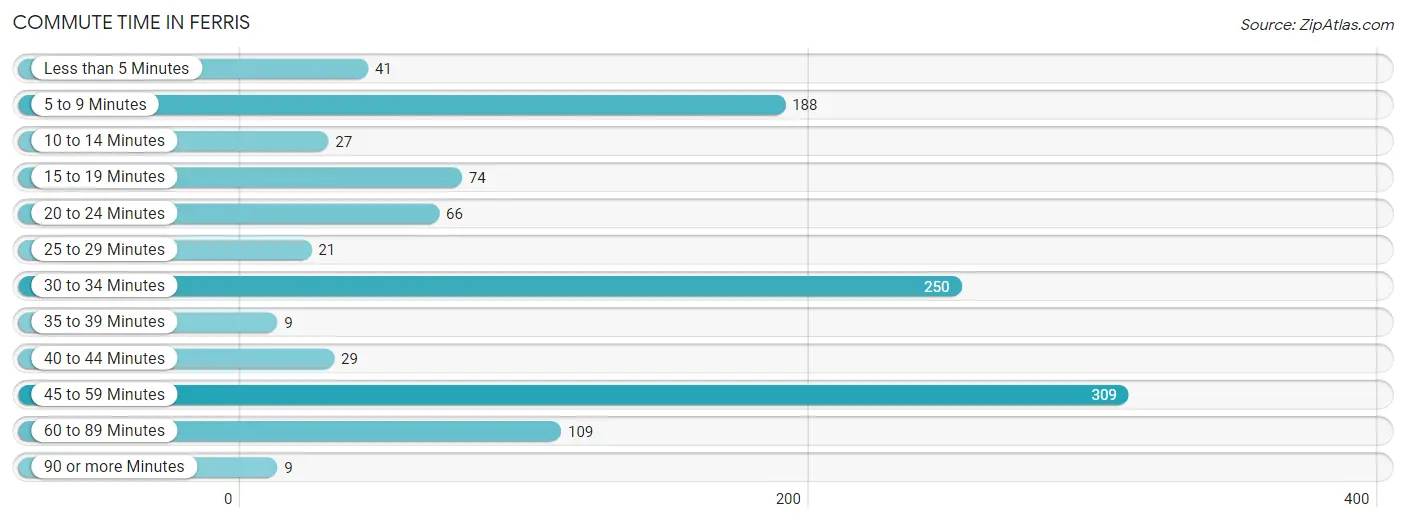
| Commute Time | # Commuters | % Commuters |
| Less than 5 Minutes | 41 | 3.6% |
| 5 to 9 Minutes | 188 | 16.6% |
| 10 to 14 Minutes | 27 | 2.4% |
| 15 to 19 Minutes | 74 | 6.5% |
| 20 to 24 Minutes | 66 | 5.8% |
| 25 to 29 Minutes | 21 | 1.9% |
| 30 to 34 Minutes | 250 | 22.1% |
| 35 to 39 Minutes | 9 | 0.8% |
| 40 to 44 Minutes | 29 | 2.6% |
| 45 to 59 Minutes | 309 | 27.3% |
| 60 to 89 Minutes | 109 | 9.6% |
| 90 or more Minutes | 9 | 0.8% |
Commute Time by Sex in Ferris
The most common commute times in Ferris are 45 to 59 minutes (261 commuters, 42.1%) for males and 30 to 34 minutes (155 commuters, 30.3%) for females.
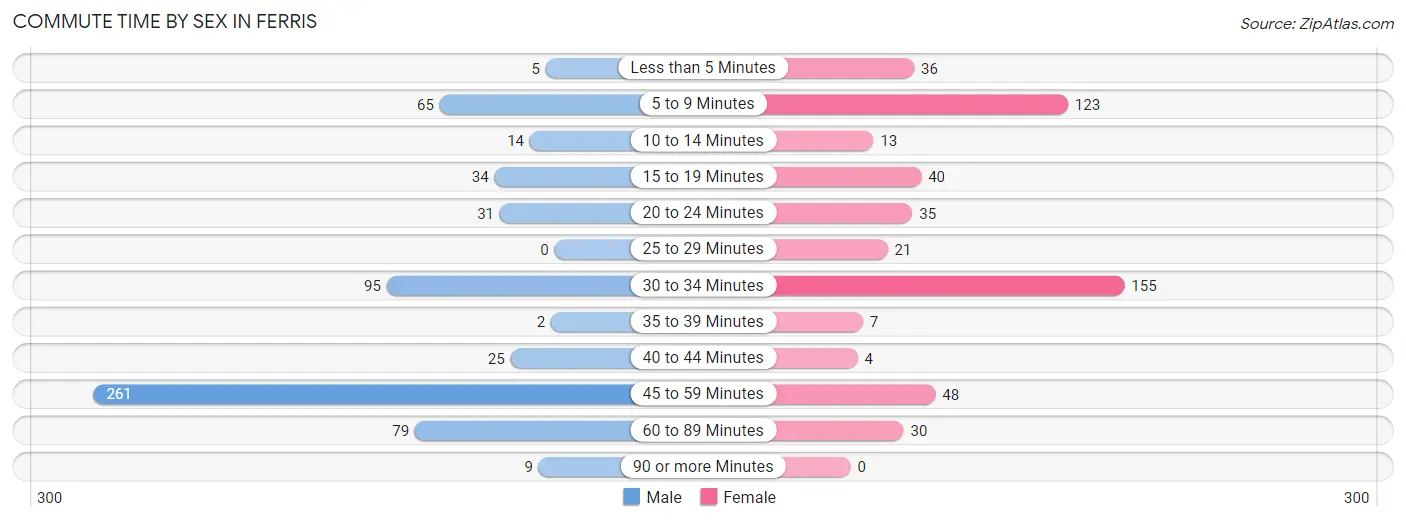
| Commute Time | Male | Female |
| Less than 5 Minutes | 5 (0.8%) | 36 (7.0%) |
| 5 to 9 Minutes | 65 (10.5%) | 123 (24.0%) |
| 10 to 14 Minutes | 14 (2.3%) | 13 (2.5%) |
| 15 to 19 Minutes | 34 (5.5%) | 40 (7.8%) |
| 20 to 24 Minutes | 31 (5.0%) | 35 (6.8%) |
| 25 to 29 Minutes | 0 (0.0%) | 21 (4.1%) |
| 30 to 34 Minutes | 95 (15.3%) | 155 (30.3%) |
| 35 to 39 Minutes | 2 (0.3%) | 7 (1.4%) |
| 40 to 44 Minutes | 25 (4.0%) | 4 (0.8%) |
| 45 to 59 Minutes | 261 (42.1%) | 48 (9.4%) |
| 60 to 89 Minutes | 79 (12.7%) | 30 (5.9%) |
| 90 or more Minutes | 9 (1.5%) | 0 (0.0%) |
Time of Departure to Work by Sex in Ferris
The most frequent times of departure to work in Ferris are 7:00 AM to 7:29 AM (129, 20.8%) for males and 5:30 AM to 5:59 AM (98, 19.1%) for females.
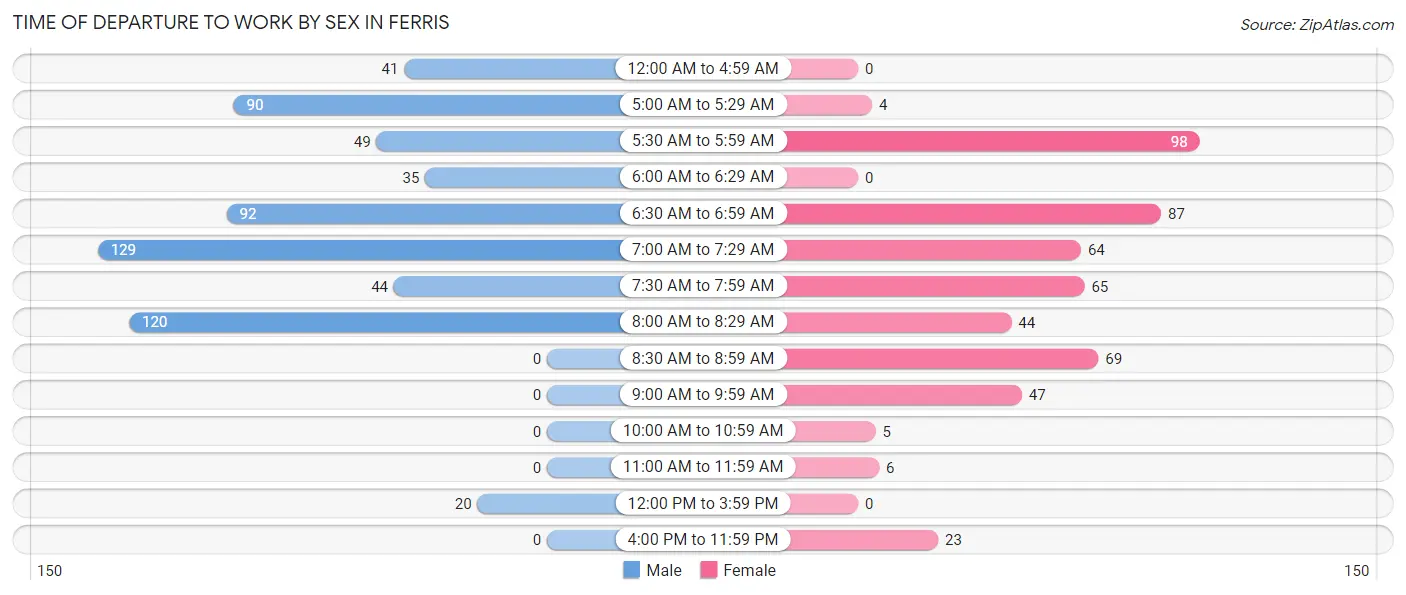
| Time of Departure | Male | Female |
| 12:00 AM to 4:59 AM | 41 (6.6%) | 0 (0.0%) |
| 5:00 AM to 5:29 AM | 90 (14.5%) | 4 (0.8%) |
| 5:30 AM to 5:59 AM | 49 (7.9%) | 98 (19.1%) |
| 6:00 AM to 6:29 AM | 35 (5.7%) | 0 (0.0%) |
| 6:30 AM to 6:59 AM | 92 (14.8%) | 87 (17.0%) |
| 7:00 AM to 7:29 AM | 129 (20.8%) | 64 (12.5%) |
| 7:30 AM to 7:59 AM | 44 (7.1%) | 65 (12.7%) |
| 8:00 AM to 8:29 AM | 120 (19.4%) | 44 (8.6%) |
| 8:30 AM to 8:59 AM | 0 (0.0%) | 69 (13.5%) |
| 9:00 AM to 9:59 AM | 0 (0.0%) | 47 (9.2%) |
| 10:00 AM to 10:59 AM | 0 (0.0%) | 5 (1.0%) |
| 11:00 AM to 11:59 AM | 0 (0.0%) | 6 (1.2%) |
| 12:00 PM to 3:59 PM | 20 (3.2%) | 0 (0.0%) |
| 4:00 PM to 11:59 PM | 0 (0.0%) | 23 (4.5%) |
| Total | 620 (100.0%) | 512 (100.0%) |
Housing Occupancy in Ferris
Occupancy by Ownership in Ferris
Of the total 886 dwellings in Ferris, owner-occupied units account for 519 (58.6%), while renter-occupied units make up 367 (41.4%).
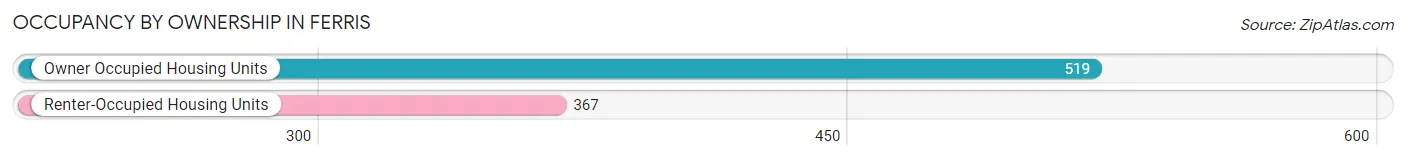
| Occupancy | # Housing Units | % Housing Units |
| Owner Occupied Housing Units | 519 | 58.6% |
| Renter-Occupied Housing Units | 367 | 41.4% |
| Total Occupied Housing Units | 886 | 100.0% |
Occupancy by Household Size in Ferris
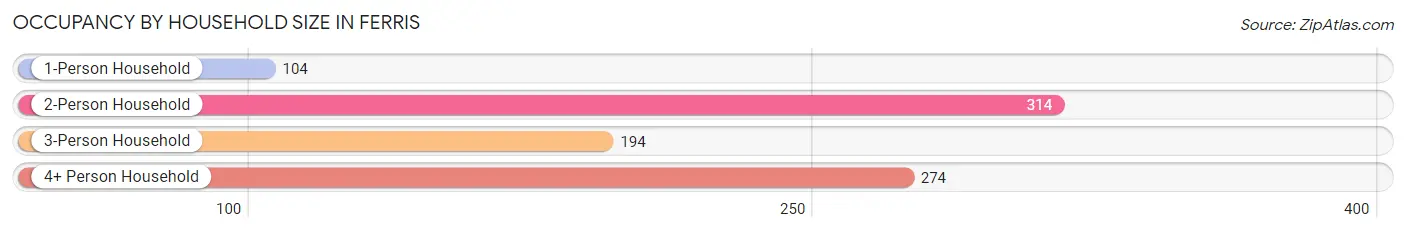
| Household Size | # Housing Units | % Housing Units |
| 1-Person Household | 104 | 11.7% |
| 2-Person Household | 314 | 35.4% |
| 3-Person Household | 194 | 21.9% |
| 4+ Person Household | 274 | 30.9% |
| Total Housing Units | 886 | 100.0% |
Occupancy by Ownership by Household Size in Ferris
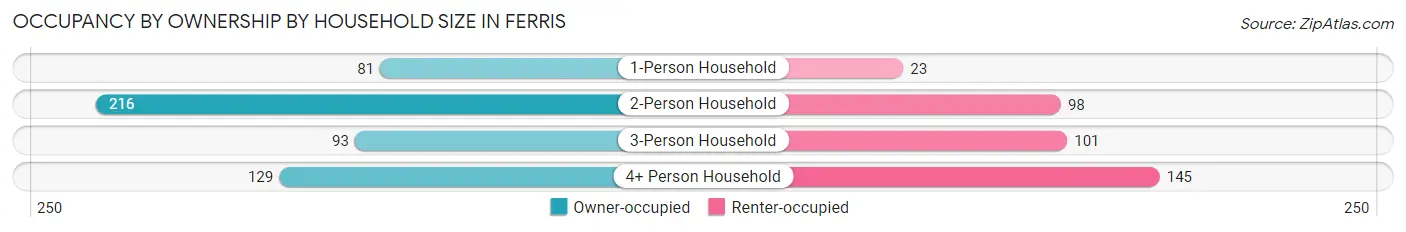
| Household Size | Owner-occupied | Renter-occupied |
| 1-Person Household | 81 (77.9%) | 23 (22.1%) |
| 2-Person Household | 216 (68.8%) | 98 (31.2%) |
| 3-Person Household | 93 (47.9%) | 101 (52.1%) |
| 4+ Person Household | 129 (47.1%) | 145 (52.9%) |
| Total Housing Units | 519 (58.6%) | 367 (41.4%) |
Occupancy by Educational Attainment in Ferris
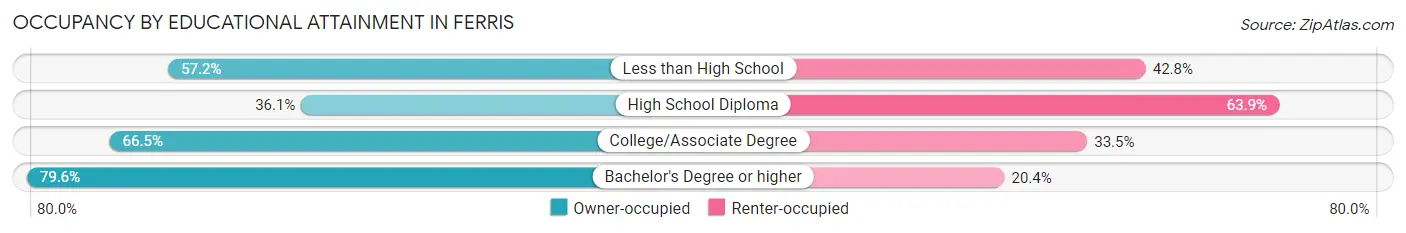
| Household Size | Owner-occupied | Renter-occupied |
| Less than High School | 99 (57.2%) | 74 (42.8%) |
| High School Diploma | 99 (36.1%) | 175 (63.9%) |
| College/Associate Degree | 145 (66.5%) | 73 (33.5%) |
| Bachelor's Degree or higher | 176 (79.6%) | 45 (20.4%) |
Occupancy by Age of Householder in Ferris
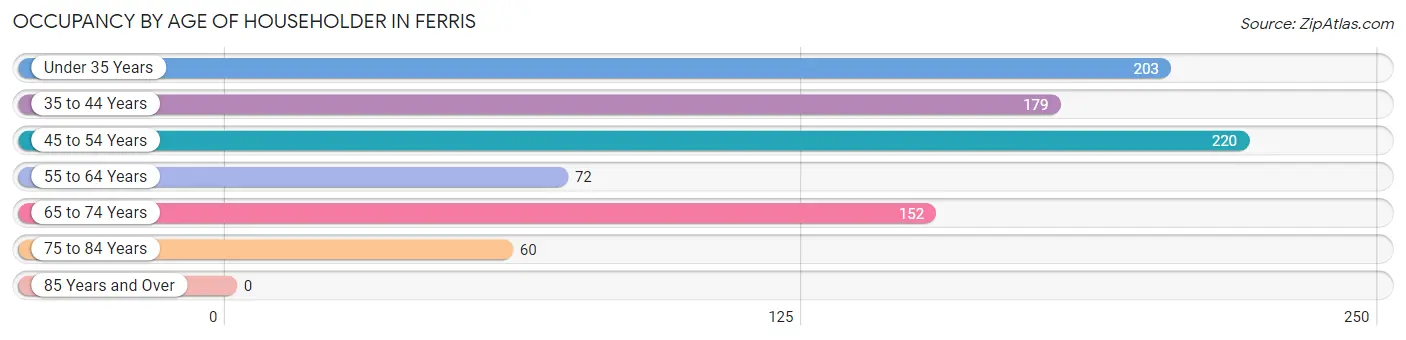
| Age Bracket | # Households | % Households |
| Under 35 Years | 203 | 22.9% |
| 35 to 44 Years | 179 | 20.2% |
| 45 to 54 Years | 220 | 24.8% |
| 55 to 64 Years | 72 | 8.1% |
| 65 to 74 Years | 152 | 17.2% |
| 75 to 84 Years | 60 | 6.8% |
| 85 Years and Over | 0 | 0.0% |
| Total | 886 | 100.0% |
Housing Finances in Ferris
Median Income by Occupancy in Ferris
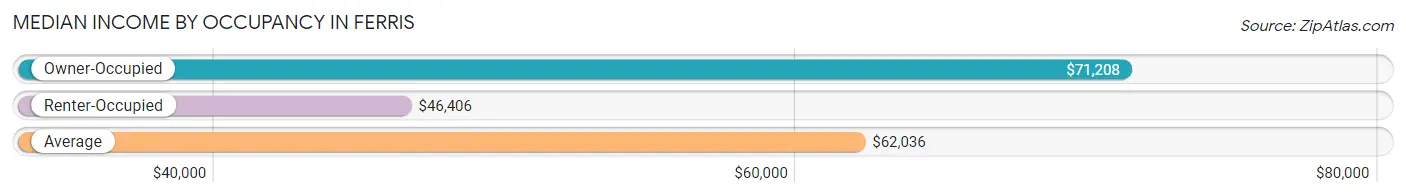
| Occupancy Type | # Households | Median Income |
| Owner-Occupied | 519 (58.6%) | $71,208 |
| Renter-Occupied | 367 (41.4%) | $46,406 |
| Average | 886 (100.0%) | $62,036 |
Occupancy by Householder Income Bracket in Ferris
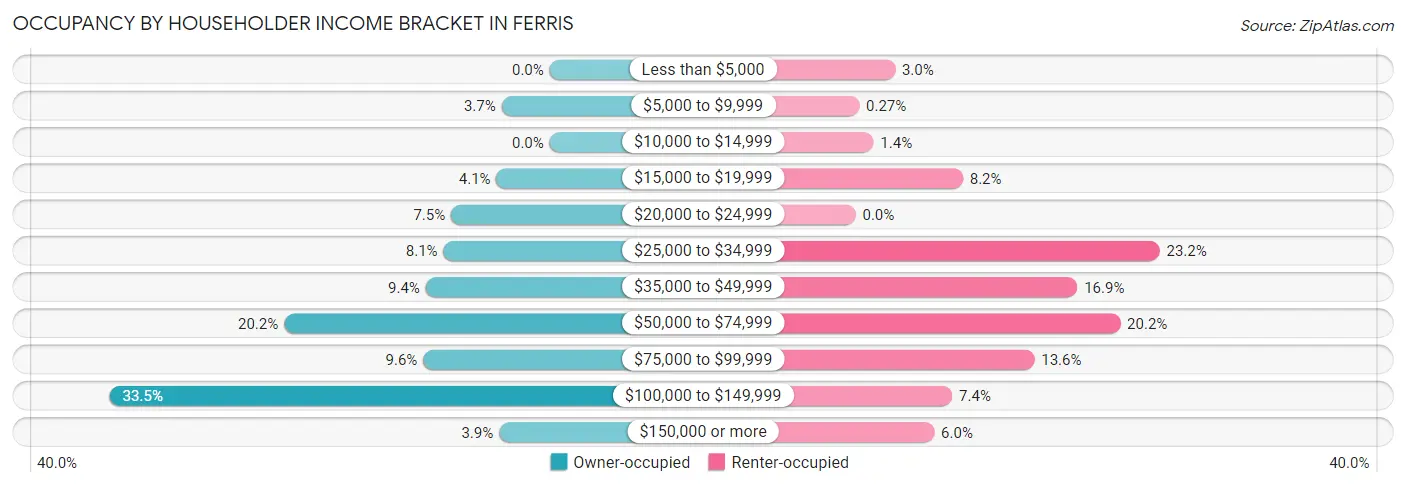
| Income Bracket | Owner-occupied | Renter-occupied |
| Less than $5,000 | 0 (0.0%) | 11 (3.0%) |
| $5,000 to $9,999 | 19 (3.7%) | 1 (0.3%) |
| $10,000 to $14,999 | 0 (0.0%) | 5 (1.4%) |
| $15,000 to $19,999 | 21 (4.1%) | 30 (8.2%) |
| $20,000 to $24,999 | 39 (7.5%) | 0 (0.0%) |
| $25,000 to $34,999 | 42 (8.1%) | 85 (23.2%) |
| $35,000 to $49,999 | 49 (9.4%) | 62 (16.9%) |
| $50,000 to $74,999 | 105 (20.2%) | 74 (20.2%) |
| $75,000 to $99,999 | 50 (9.6%) | 50 (13.6%) |
| $100,000 to $149,999 | 174 (33.5%) | 27 (7.4%) |
| $150,000 or more | 20 (3.8%) | 22 (6.0%) |
| Total | 519 (100.0%) | 367 (100.0%) |
Monthly Housing Cost Tiers in Ferris
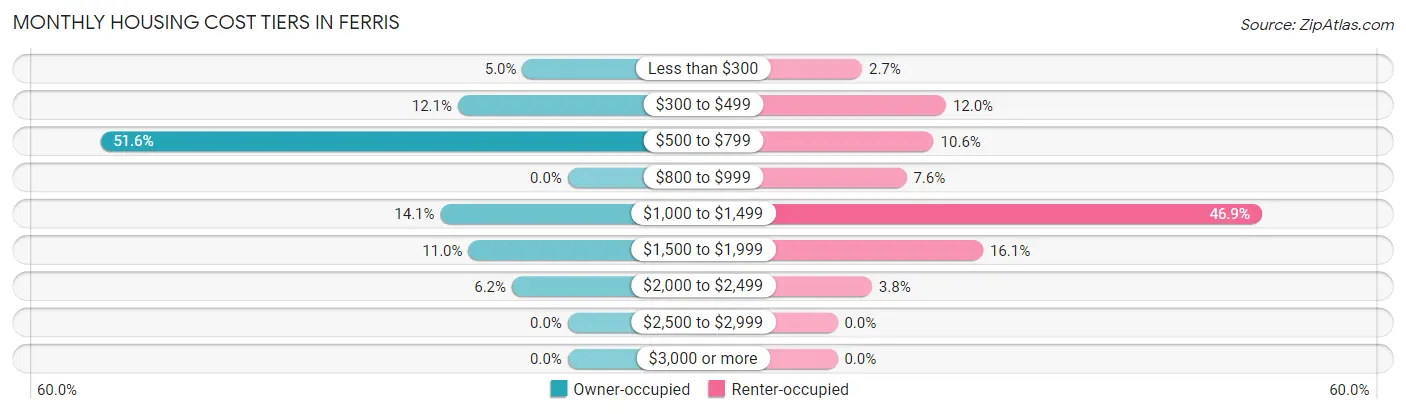
| Monthly Cost | Owner-occupied | Renter-occupied |
| Less than $300 | 26 (5.0%) | 10 (2.7%) |
| $300 to $499 | 63 (12.1%) | 44 (12.0%) |
| $500 to $799 | 268 (51.6%) | 39 (10.6%) |
| $800 to $999 | 0 (0.0%) | 28 (7.6%) |
| $1,000 to $1,499 | 73 (14.1%) | 172 (46.9%) |
| $1,500 to $1,999 | 57 (11.0%) | 59 (16.1%) |
| $2,000 to $2,499 | 32 (6.2%) | 14 (3.8%) |
| $2,500 to $2,999 | 0 (0.0%) | 0 (0.0%) |
| $3,000 or more | 0 (0.0%) | 0 (0.0%) |
| Total | 519 (100.0%) | 367 (100.0%) |
Physical Housing Characteristics in Ferris
Housing Structures in Ferris
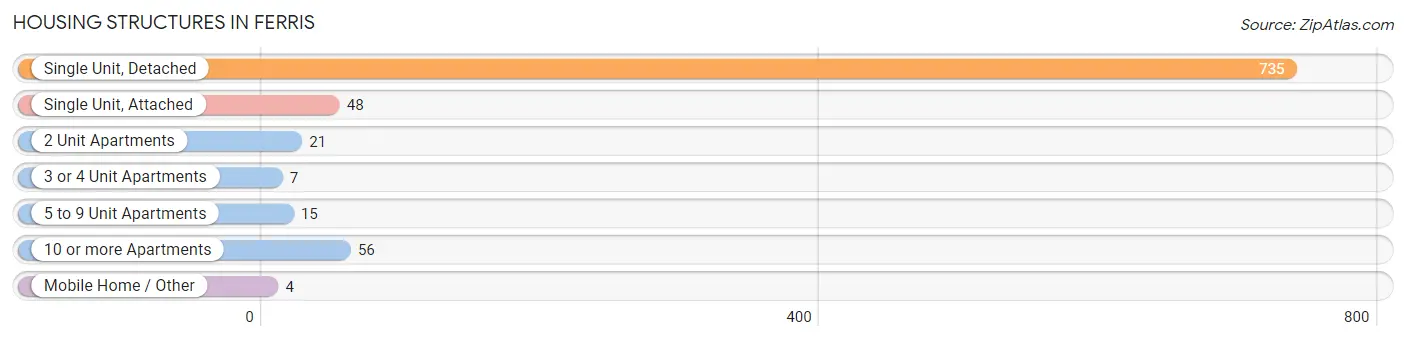
| Structure Type | # Housing Units | % Housing Units |
| Single Unit, Detached | 735 | 83.0% |
| Single Unit, Attached | 48 | 5.4% |
| 2 Unit Apartments | 21 | 2.4% |
| 3 or 4 Unit Apartments | 7 | 0.8% |
| 5 to 9 Unit Apartments | 15 | 1.7% |
| 10 or more Apartments | 56 | 6.3% |
| Mobile Home / Other | 4 | 0.4% |
| Total | 886 | 100.0% |
Housing Structures by Occupancy in Ferris
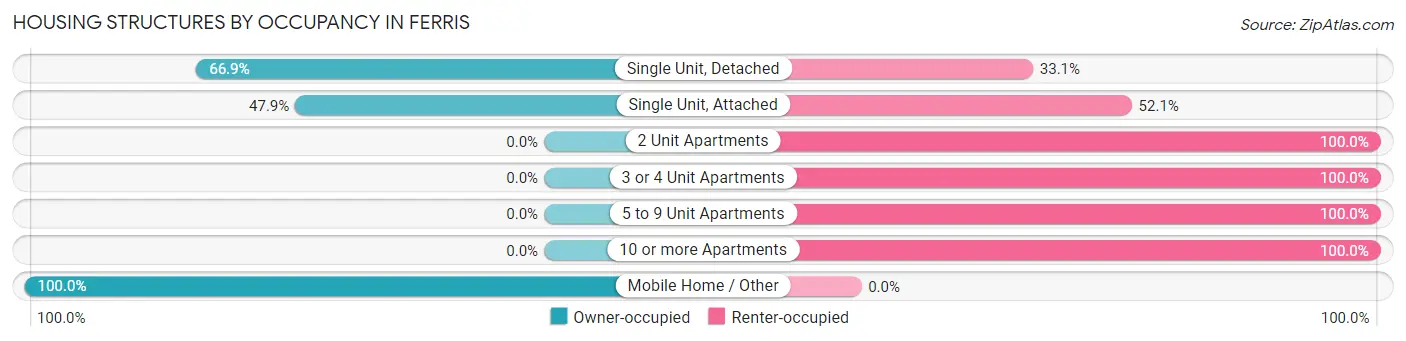
| Structure Type | Owner-occupied | Renter-occupied |
| Single Unit, Detached | 492 (66.9%) | 243 (33.1%) |
| Single Unit, Attached | 23 (47.9%) | 25 (52.1%) |
| 2 Unit Apartments | 0 (0.0%) | 21 (100.0%) |
| 3 or 4 Unit Apartments | 0 (0.0%) | 7 (100.0%) |
| 5 to 9 Unit Apartments | 0 (0.0%) | 15 (100.0%) |
| 10 or more Apartments | 0 (0.0%) | 56 (100.0%) |
| Mobile Home / Other | 4 (100.0%) | 0 (0.0%) |
| Total | 519 (58.6%) | 367 (41.4%) |
Housing Structures by Number of Rooms in Ferris
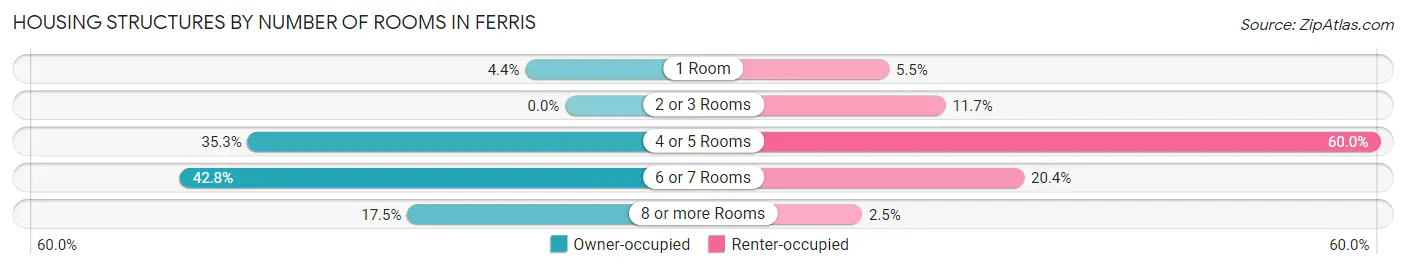
| Number of Rooms | Owner-occupied | Renter-occupied |
| 1 Room | 23 (4.4%) | 20 (5.4%) |
| 2 or 3 Rooms | 0 (0.0%) | 43 (11.7%) |
| 4 or 5 Rooms | 183 (35.3%) | 220 (60.0%) |
| 6 or 7 Rooms | 222 (42.8%) | 75 (20.4%) |
| 8 or more Rooms | 91 (17.5%) | 9 (2.5%) |
| Total | 519 (100.0%) | 367 (100.0%) |
Housing Structure by Heating Type in Ferris
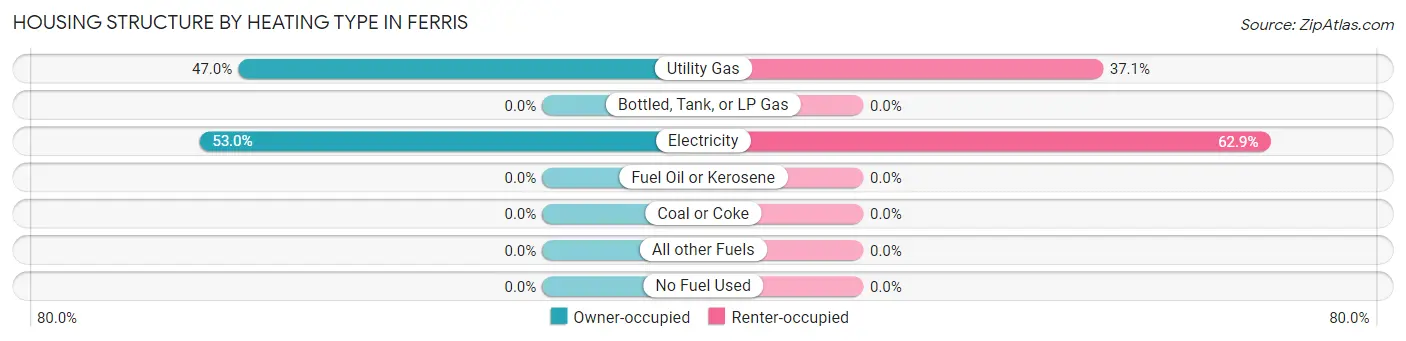
| Heating Type | Owner-occupied | Renter-occupied |
| Utility Gas | 244 (47.0%) | 136 (37.1%) |
| Bottled, Tank, or LP Gas | 0 (0.0%) | 0 (0.0%) |
| Electricity | 275 (53.0%) | 231 (62.9%) |
| Fuel Oil or Kerosene | 0 (0.0%) | 0 (0.0%) |
| Coal or Coke | 0 (0.0%) | 0 (0.0%) |
| All other Fuels | 0 (0.0%) | 0 (0.0%) |
| No Fuel Used | 0 (0.0%) | 0 (0.0%) |
| Total | 519 (100.0%) | 367 (100.0%) |
Household Vehicle Usage in Ferris
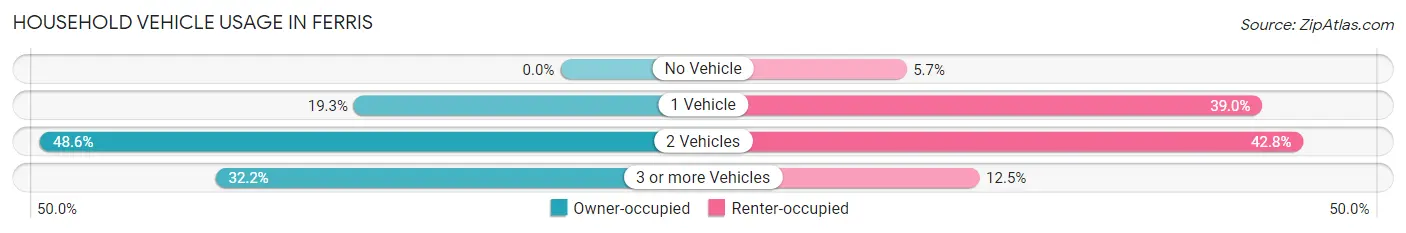
| Vehicles per Household | Owner-occupied | Renter-occupied |
| No Vehicle | 0 (0.0%) | 21 (5.7%) |
| 1 Vehicle | 100 (19.3%) | 143 (39.0%) |
| 2 Vehicles | 252 (48.5%) | 157 (42.8%) |
| 3 or more Vehicles | 167 (32.2%) | 46 (12.5%) |
| Total | 519 (100.0%) | 367 (100.0%) |
Real Estate & Mortgages in Ferris
Real Estate and Mortgage Overview in Ferris
| Characteristic | Without Mortgage | With Mortgage |
| Housing Units | 360 | 159 |
| Median Property Value | $117,700 | $195,100 |
| Median Household Income | $72,411 | $18 |
| Monthly Housing Costs | $624 | $0 |
| Real Estate Taxes | $1,546 | $0 |
Property Value by Mortgage Status in Ferris
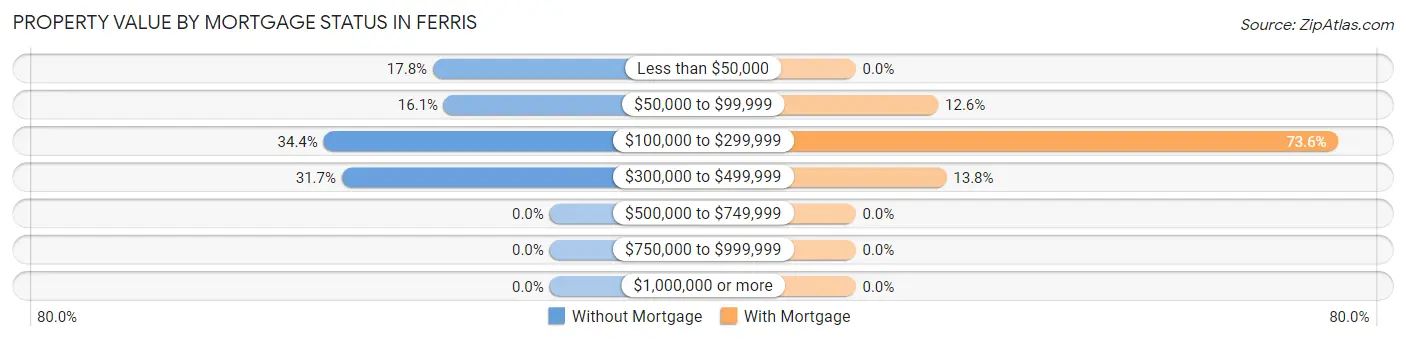
| Property Value | Without Mortgage | With Mortgage |
| Less than $50,000 | 64 (17.8%) | 0 (0.0%) |
| $50,000 to $99,999 | 58 (16.1%) | 20 (12.6%) |
| $100,000 to $299,999 | 124 (34.4%) | 117 (73.6%) |
| $300,000 to $499,999 | 114 (31.7%) | 22 (13.8%) |
| $500,000 to $749,999 | 0 (0.0%) | 0 (0.0%) |
| $750,000 to $999,999 | 0 (0.0%) | 0 (0.0%) |
| $1,000,000 or more | 0 (0.0%) | 0 (0.0%) |
| Total | 360 (100.0%) | 159 (100.0%) |
Household Income by Mortgage Status in Ferris
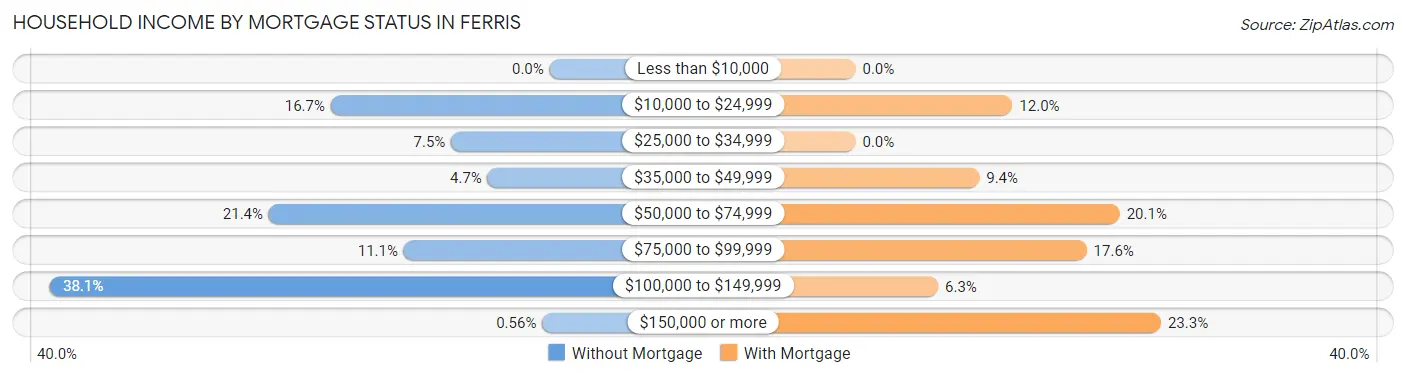
| Household Income | Without Mortgage | With Mortgage |
| Less than $10,000 | 0 (0.0%) | 0 (0.0%) |
| $10,000 to $24,999 | 60 (16.7%) | 19 (11.9%) |
| $25,000 to $34,999 | 27 (7.5%) | 0 (0.0%) |
| $35,000 to $49,999 | 17 (4.7%) | 15 (9.4%) |
| $50,000 to $74,999 | 77 (21.4%) | 32 (20.1%) |
| $75,000 to $99,999 | 40 (11.1%) | 28 (17.6%) |
| $100,000 to $149,999 | 137 (38.1%) | 10 (6.3%) |
| $150,000 or more | 2 (0.6%) | 37 (23.3%) |
| Total | 360 (100.0%) | 159 (100.0%) |
Property Value to Household Income Ratio in Ferris
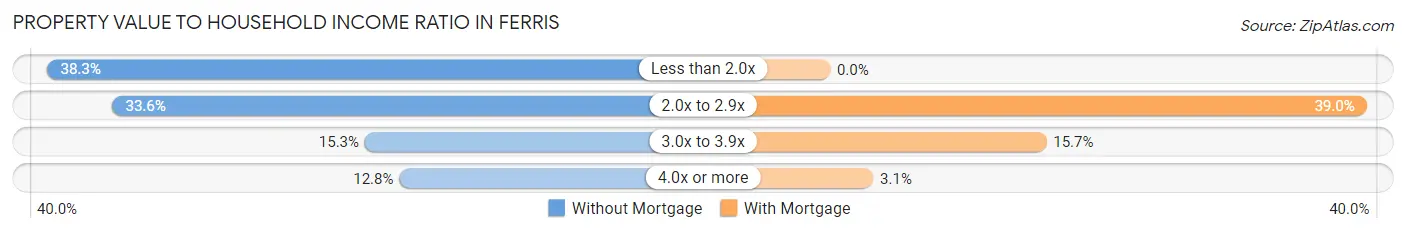
| Value-to-Income Ratio | Without Mortgage | With Mortgage |
| Less than 2.0x | 138 (38.3%) | 0 (0.0%) |
| 2.0x to 2.9x | 121 (33.6%) | 62 (39.0%) |
| 3.0x to 3.9x | 55 (15.3%) | 25 (15.7%) |
| 4.0x or more | 46 (12.8%) | 5 (3.1%) |
| Total | 360 (100.0%) | 159 (100.0%) |
Real Estate Taxes by Mortgage Status in Ferris
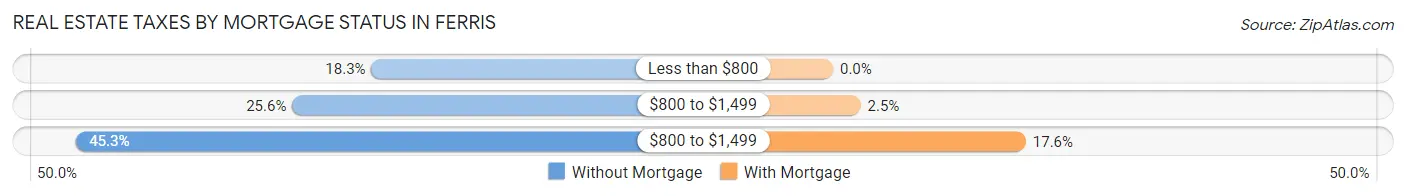
| Property Taxes | Without Mortgage | With Mortgage |
| Less than $800 | 66 (18.3%) | 0 (0.0%) |
| $800 to $1,499 | 92 (25.6%) | 4 (2.5%) |
| $800 to $1,499 | 163 (45.3%) | 28 (17.6%) |
| Total | 360 (100.0%) | 159 (100.0%) |
Health & Disability in Ferris
Health Insurance Coverage by Age in Ferris
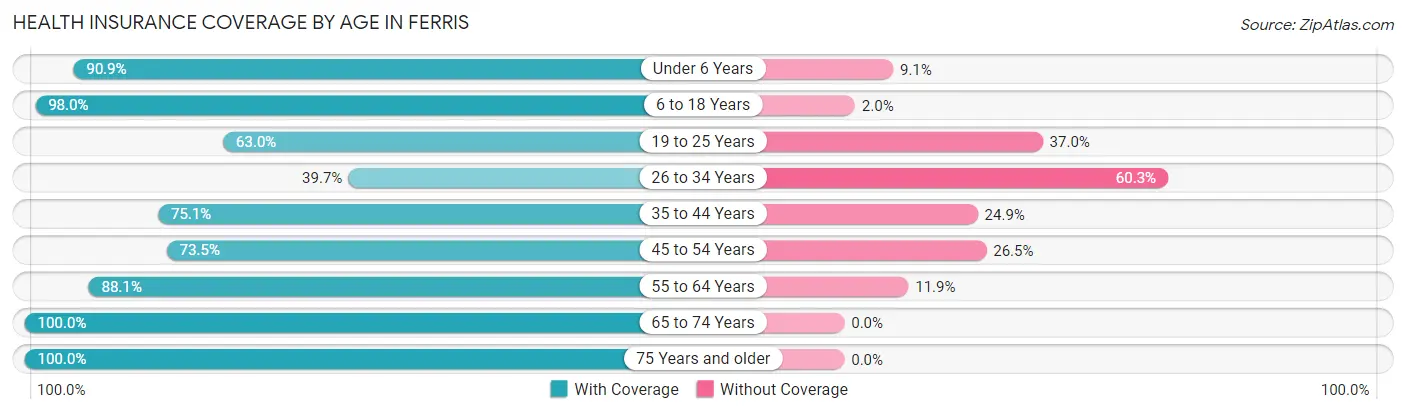
| Age Bracket | With Coverage | Without Coverage |
| Under 6 Years | 360 (90.9%) | 36 (9.1%) |
| 6 to 18 Years | 544 (98.0%) | 11 (2.0%) |
| 19 to 25 Years | 155 (63.0%) | 91 (37.0%) |
| 26 to 34 Years | 140 (39.7%) | 213 (60.3%) |
| 35 to 44 Years | 284 (75.1%) | 94 (24.9%) |
| 45 to 54 Years | 261 (73.5%) | 94 (26.5%) |
| 55 to 64 Years | 155 (88.1%) | 21 (11.9%) |
| 65 to 74 Years | 221 (100.0%) | 0 (0.0%) |
| 75 Years and older | 105 (100.0%) | 0 (0.0%) |
| Total | 2,225 (79.9%) | 560 (20.1%) |
Health Insurance Coverage by Citizenship Status in Ferris
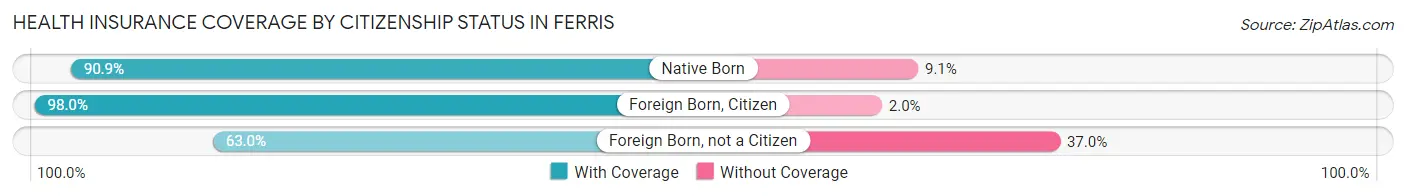
| Citizenship Status | With Coverage | Without Coverage |
| Native Born | 360 (90.9%) | 36 (9.1%) |
| Foreign Born, Citizen | 544 (98.0%) | 11 (2.0%) |
| Foreign Born, not a Citizen | 155 (63.0%) | 91 (37.0%) |
Health Insurance Coverage by Household Income in Ferris
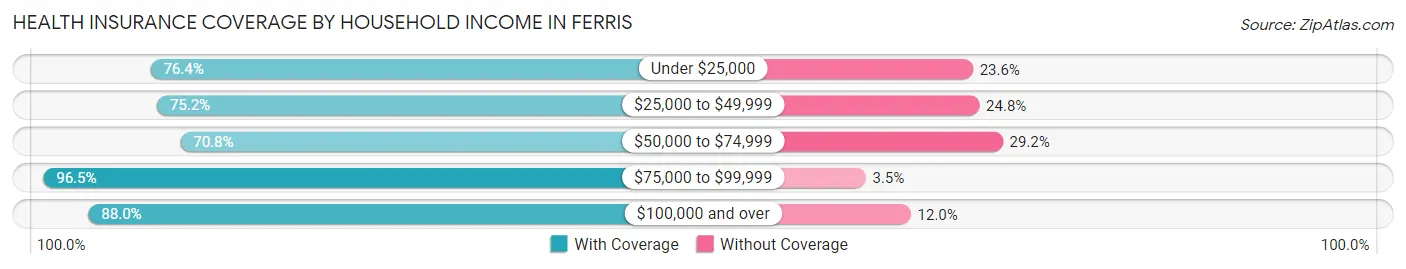
| Household Income | With Coverage | Without Coverage |
| Under $25,000 | 285 (76.4%) | 88 (23.6%) |
| $25,000 to $49,999 | 476 (75.2%) | 157 (24.8%) |
| $50,000 to $74,999 | 529 (70.8%) | 218 (29.2%) |
| $75,000 to $99,999 | 302 (96.5%) | 11 (3.5%) |
| $100,000 and over | 633 (88.0%) | 86 (12.0%) |
Public vs Private Health Insurance Coverage by Age in Ferris
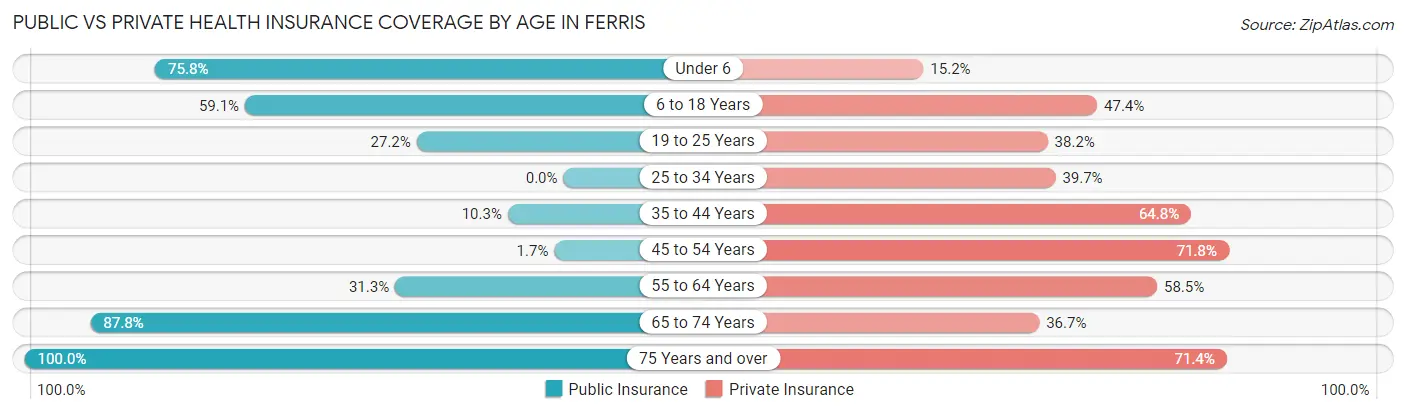
| Age Bracket | Public Insurance | Private Insurance |
| Under 6 | 300 (75.8%) | 60 (15.1%) |
| 6 to 18 Years | 328 (59.1%) | 263 (47.4%) |
| 19 to 25 Years | 67 (27.2%) | 94 (38.2%) |
| 25 to 34 Years | 0 (0.0%) | 140 (39.7%) |
| 35 to 44 Years | 39 (10.3%) | 245 (64.8%) |
| 45 to 54 Years | 6 (1.7%) | 255 (71.8%) |
| 55 to 64 Years | 55 (31.2%) | 103 (58.5%) |
| 65 to 74 Years | 194 (87.8%) | 81 (36.6%) |
| 75 Years and over | 105 (100.0%) | 75 (71.4%) |
| Total | 1,094 (39.3%) | 1,316 (47.2%) |
Disability Status by Sex by Age in Ferris
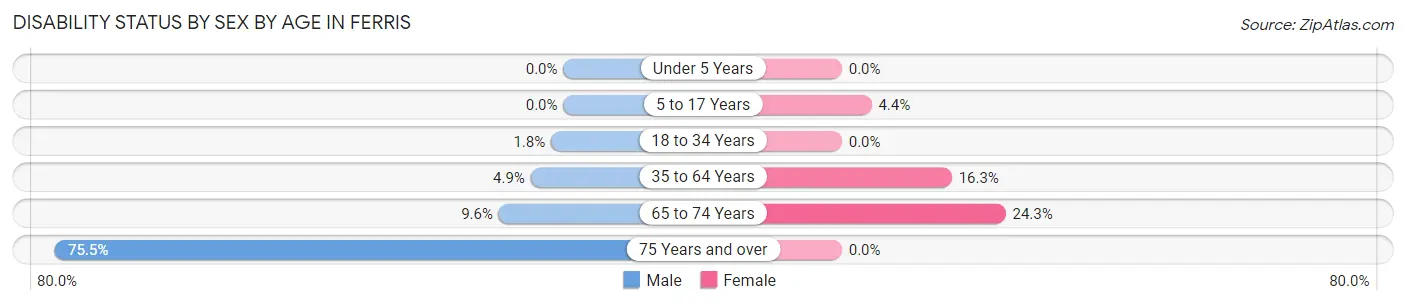
| Age Bracket | Male | Female |
| Under 5 Years | 0 (0.0%) | 0 (0.0%) |
| 5 to 17 Years | 0 (0.0%) | 12 (4.4%) |
| 18 to 34 Years | 5 (1.8%) | 0 (0.0%) |
| 35 to 64 Years | 23 (4.9%) | 71 (16.3%) |
| 65 to 74 Years | 7 (9.6%) | 36 (24.3%) |
| 75 Years and over | 40 (75.5%) | 0 (0.0%) |
Disability Class by Sex by Age in Ferris
Disability Class: Hearing Difficulty
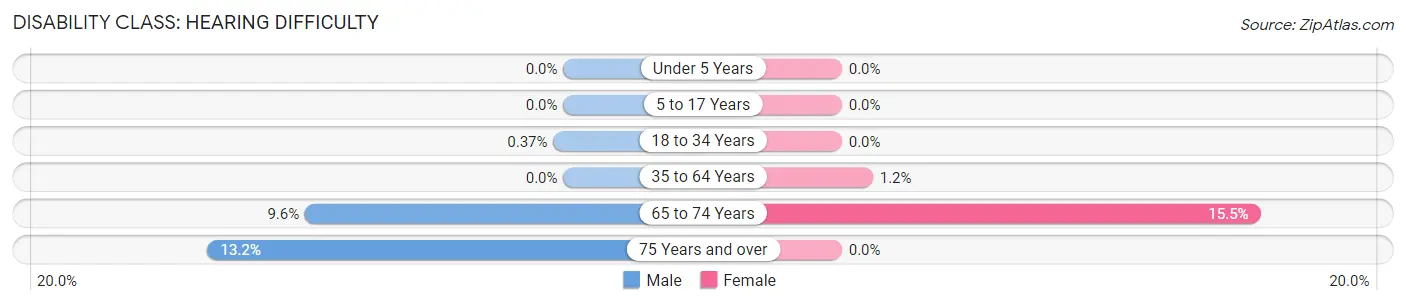
| Age Bracket | Male | Female |
| Under 5 Years | 0 (0.0%) | 0 (0.0%) |
| 5 to 17 Years | 0 (0.0%) | 0 (0.0%) |
| 18 to 34 Years | 1 (0.4%) | 0 (0.0%) |
| 35 to 64 Years | 0 (0.0%) | 5 (1.1%) |
| 65 to 74 Years | 7 (9.6%) | 23 (15.5%) |
| 75 Years and over | 7 (13.2%) | 0 (0.0%) |
Disability Class: Vision Difficulty
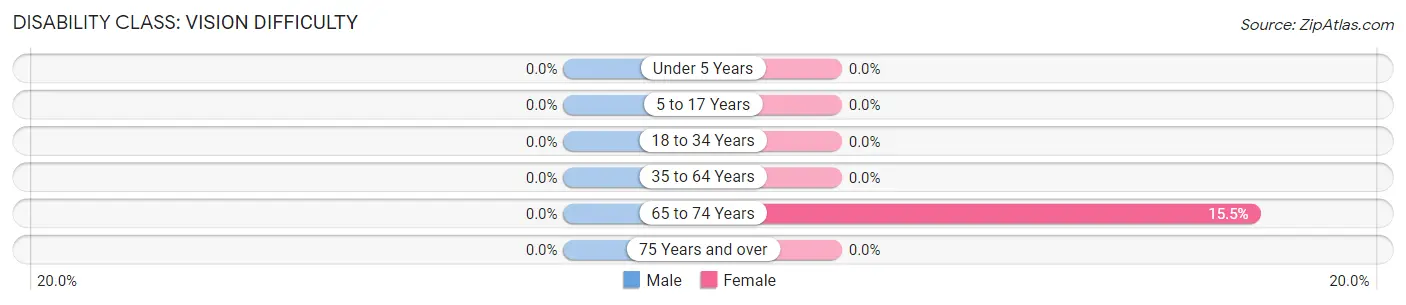
| Age Bracket | Male | Female |
| Under 5 Years | 0 (0.0%) | 0 (0.0%) |
| 5 to 17 Years | 0 (0.0%) | 0 (0.0%) |
| 18 to 34 Years | 0 (0.0%) | 0 (0.0%) |
| 35 to 64 Years | 0 (0.0%) | 0 (0.0%) |
| 65 to 74 Years | 0 (0.0%) | 23 (15.5%) |
| 75 Years and over | 0 (0.0%) | 0 (0.0%) |
Disability Class: Cognitive Difficulty
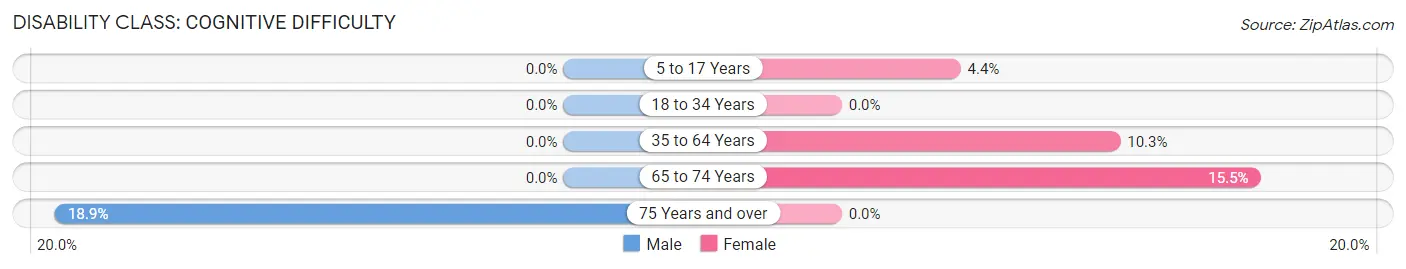
| Age Bracket | Male | Female |
| 5 to 17 Years | 0 (0.0%) | 12 (4.4%) |
| 18 to 34 Years | 0 (0.0%) | 0 (0.0%) |
| 35 to 64 Years | 0 (0.0%) | 45 (10.3%) |
| 65 to 74 Years | 0 (0.0%) | 23 (15.5%) |
| 75 Years and over | 10 (18.9%) | 0 (0.0%) |
Disability Class: Ambulatory Difficulty
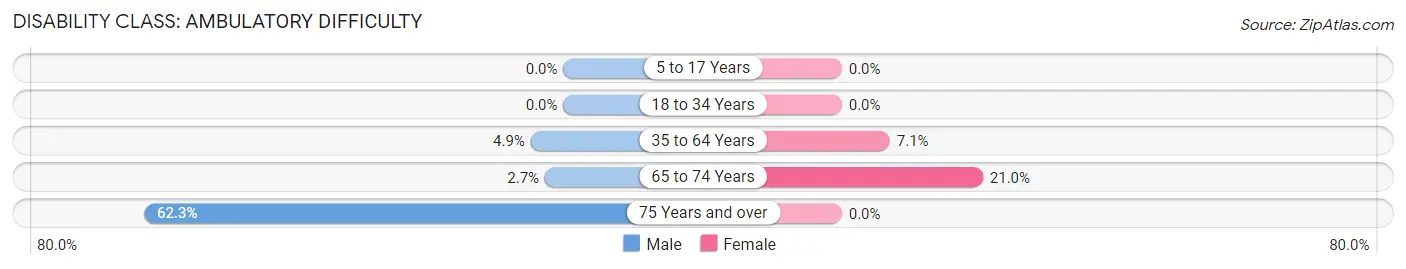
| Age Bracket | Male | Female |
| 5 to 17 Years | 0 (0.0%) | 0 (0.0%) |
| 18 to 34 Years | 0 (0.0%) | 0 (0.0%) |
| 35 to 64 Years | 23 (4.9%) | 31 (7.1%) |
| 65 to 74 Years | 2 (2.7%) | 31 (20.9%) |
| 75 Years and over | 33 (62.3%) | 0 (0.0%) |
Disability Class: Self-Care Difficulty
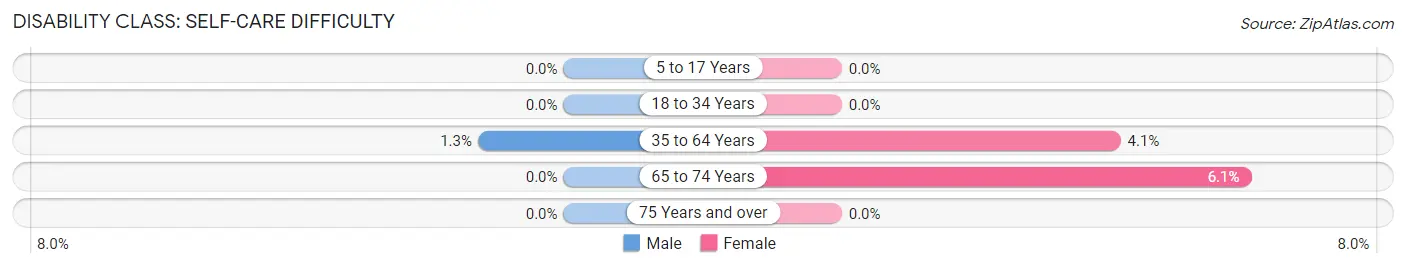
| Age Bracket | Male | Female |
| 5 to 17 Years | 0 (0.0%) | 0 (0.0%) |
| 18 to 34 Years | 0 (0.0%) | 0 (0.0%) |
| 35 to 64 Years | 6 (1.3%) | 18 (4.1%) |
| 65 to 74 Years | 0 (0.0%) | 9 (6.1%) |
| 75 Years and over | 0 (0.0%) | 0 (0.0%) |
Technology Access in Ferris
Computing Device Access in Ferris
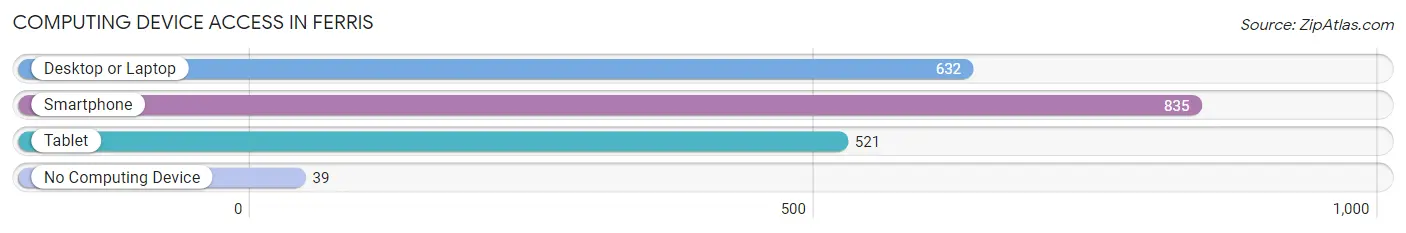
| Device Type | # Households | % Households |
| Desktop or Laptop | 632 | 71.3% |
| Smartphone | 835 | 94.2% |
| Tablet | 521 | 58.8% |
| No Computing Device | 39 | 4.4% |
| Total | 886 | 100.0% |
Internet Access in Ferris
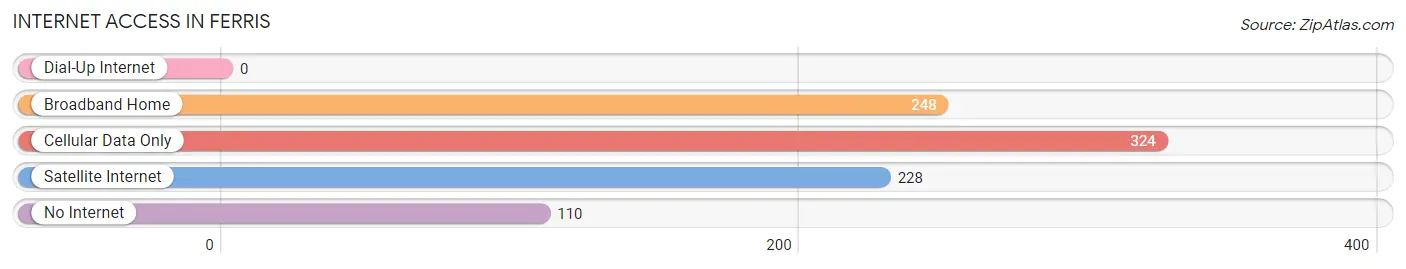
| Internet Type | # Households | % Households |
| Dial-Up Internet | 0 | 0.0% |
| Broadband Home | 248 | 28.0% |
| Cellular Data Only | 324 | 36.6% |
| Satellite Internet | 228 | 25.7% |
| No Internet | 110 | 12.4% |
| Total | 886 | 100.0% |
Ferris Summary
Ferris, Texas is a small city located in Ellis County, Texas, United States. It is situated about 25 miles south of Dallas and is part of the Dallas-Fort Worth metropolitan area. The city has a population of approximately 5,000 people and is known for its rural charm and small-town atmosphere.
History
Ferris was founded in 1881 by a group of settlers from the nearby town of Waxahachie. The town was named after James Ferris, a local landowner who donated the land for the town. The town was originally a farming community, but it soon developed into a small industrial center. The town was incorporated in 1891 and the first mayor was elected in 1892.
In the early 1900s, Ferris experienced a period of growth and development. The town was home to several businesses, including a cotton gin, a flour mill, a brick factory, and a lumber mill. The town also had a railroad station, which connected it to the larger cities of Dallas and Fort Worth.
In the 1920s, Ferris experienced a period of decline. The Great Depression caused many businesses to close and the population of the town decreased. However, the town was able to survive and in the 1940s, it experienced a period of growth and development. The town was home to several businesses, including a cotton gin, a flour mill, a brick factory, and a lumber mill.
Geography
Ferris is located in Ellis County, Texas, about 25 miles south of Dallas. The city is situated on the banks of the Trinity River and is surrounded by rolling hills and farmland. The city has a total area of 2.3 square miles, all of which is land.
Economy
Ferris is a small city with a population of approximately 5,000 people. The city’s economy is largely based on agriculture and manufacturing. The city is home to several businesses, including a cotton gin, a flour mill, a brick factory, and a lumber mill. The city also has a number of retail stores, restaurants, and other businesses.
Demographics
As of the 2010 census, the population of Ferris was 5,000 people. The racial makeup of the city was 79.2% White, 15.2% African American, 0.7% Native American, 0.3% Asian, 0.1% Pacific Islander, and 4.5% from other races. The median household income was $37,917 and the median family income was $45,000.
Conclusion
Ferris, Texas is a small city located in Ellis County, Texas, United States. It is situated about 25 miles south of Dallas and is part of the Dallas-Fort Worth metropolitan area. The city has a population of approximately 5,000 people and is known for its rural charm and small-town atmosphere. The city’s economy is largely based on agriculture and manufacturing and the city is home to several businesses, including a cotton gin, a flour mill, a brick factory, and a lumber mill. The racial makeup of the city is 79.2% White, 15.2% African American, 0.7% Native American, 0.3% Asian, 0.1% Pacific Islander, and 4.5% from other races. The median household income was $37,917 and the median family income was $45,000.
Common Questions
What is Per Capita Income in Ferris?
Per Capita income in Ferris is $23,092.
What is the Median Family Income in Ferris?
Median Family Income in Ferris is $66,771.
What is the Median Household income in Ferris?
Median Household Income in Ferris is $62,036.
What is Income or Wage Gap in Ferris?
Income or Wage Gap in Ferris is 41.6%.
Women in Ferris earn 58.4 cents for every dollar earned by a man.
What is Inequality or Gini Index in Ferris?
Inequality or Gini Index in Ferris is 0.35.
What is the Total Population of Ferris?
Total Population of Ferris is 2,785.
What is the Total Male Population of Ferris?
Total Male Population of Ferris is 1,364.
What is the Total Female Population of Ferris?
Total Female Population of Ferris is 1,421.
What is the Ratio of Males per 100 Females in Ferris?
There are 95.99 Males per 100 Females in Ferris.
What is the Ratio of Females per 100 Males in Ferris?
There are 104.18 Females per 100 Males in Ferris.
What is the Median Population Age in Ferris?
Median Population Age in Ferris is 31.1 Years.
What is the Average Family Size in Ferris
Average Family Size in Ferris is 3.4 People.
What is the Average Household Size in Ferris
Average Household Size in Ferris is 3.1 People.
How Large is the Labor Force in Ferris?
There are 1,321 People in the Labor Forcein in Ferris.
What is the Percentage of People in the Labor Force in Ferris?
69.3% of People are in the Labor Force in Ferris.
What is the Unemployment Rate in Ferris?
Unemployment Rate in Ferris is 0.8%.