Freeport, TX Map & Demographics
Freeport Map
Freeport Overview
$24,321
PER CAPITA INCOME
$53,608
AVG FAMILY INCOME
$50,704
AVG HOUSEHOLD INCOME
38.5%
WAGE / INCOME GAP [ % ]
61.5¢/ $1
WAGE / INCOME GAP [ $ ]
0.47
INEQUALITY / GINI INDEX
10,738
TOTAL POPULATION
5,144
MALE POPULATION
5,594
FEMALE POPULATION
91.96
MALES / 100 FEMALES
108.75
FEMALES / 100 MALES
32.6
MEDIAN AGE
3.2
AVG FAMILY SIZE
2.6
AVG HOUSEHOLD SIZE
4,449
LABOR FORCE [ PEOPLE ]
57.0%
PERCENT IN LABOR FORCE
6.3%
UNEMPLOYMENT RATE
Freeport Zip Codes
Freeport Area Codes
Income in Freeport
Income Overview in Freeport
Per Capita Income in Freeport is $24,321, while median incomes of families and households are $53,608 and $50,704 respectively.
| Characteristic | Number | Measure |
| Per Capita Income | 10,738 | $24,321 |
| Median Family Income | 2,860 | $53,608 |
| Mean Family Income | 2,860 | $70,466 |
| Median Household Income | 4,019 | $50,704 |
| Mean Household Income | 4,019 | $63,698 |
| Income Deficit | 2,860 | $0 |
| Wage / Income Gap (%) | 10,738 | 38.48% |
| Wage / Income Gap ($) | 10,738 | 61.52¢ per $1 |
| Gini / Inequality Index | 10,738 | 0.47 |
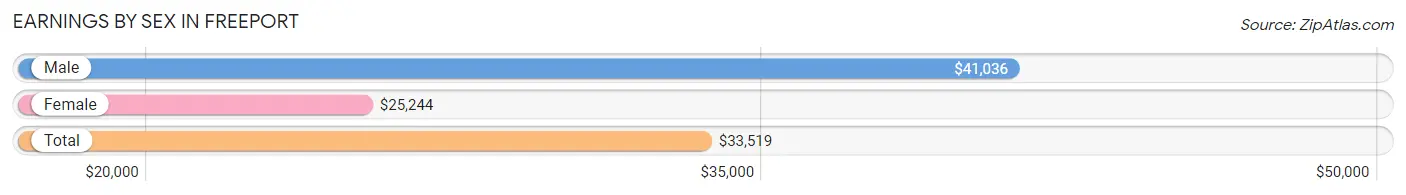
Earnings by Sex in Freeport
Average Earnings in Freeport are $33,519, $41,036 for men and $25,244 for women, a difference of 38.5%.
| Sex | Number | Average Earnings |
| Male | 2,357 (50.6%) | $41,036 |
| Female | 2,305 (49.4%) | $25,244 |
| Total | 4,662 (100.0%) | $33,519 |
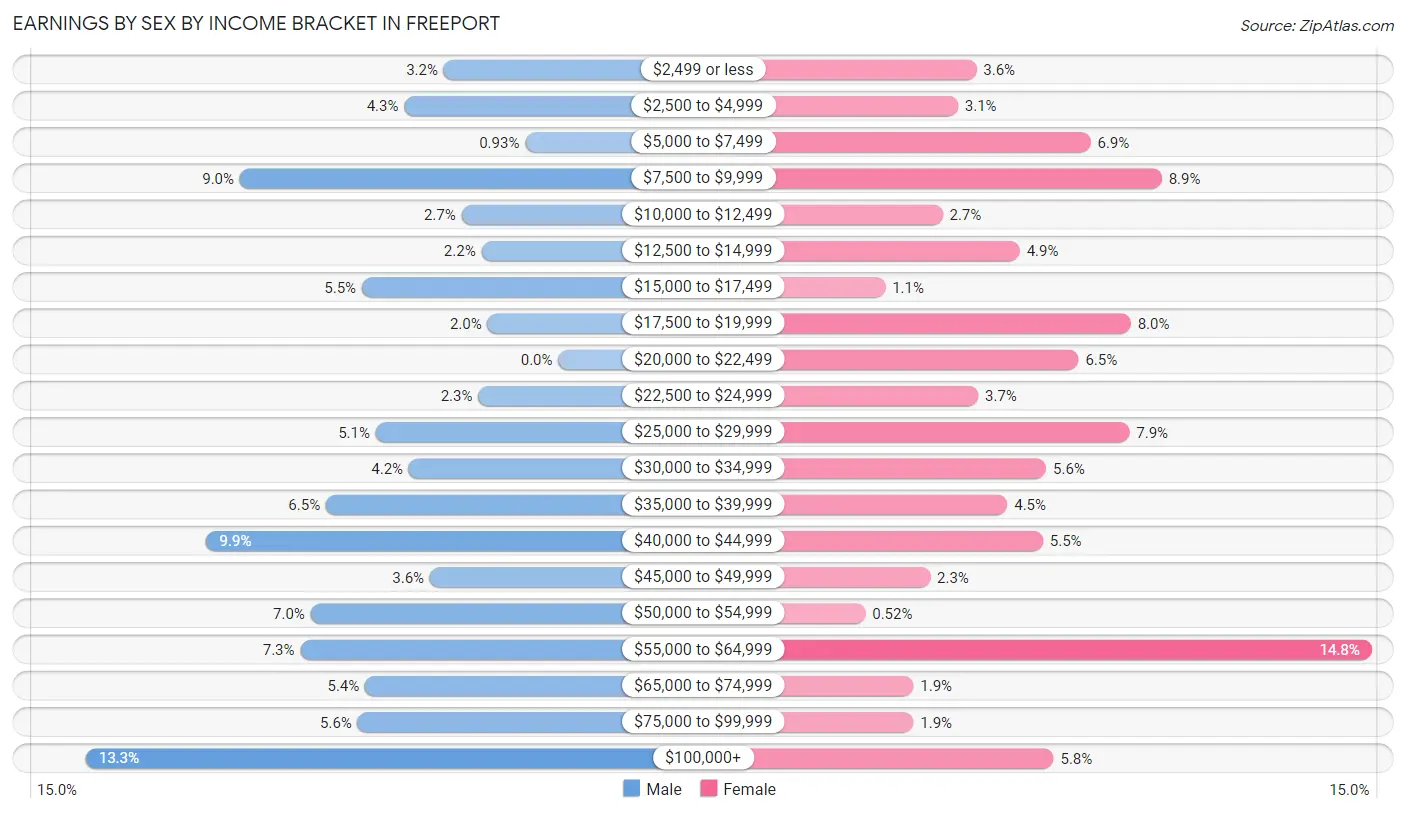
Earnings by Sex by Income Bracket in Freeport
The most common earnings brackets in Freeport are $100,000+ for men (313 | 13.3%) and $55,000 to $64,999 for women (340 | 14.7%).
| Income | Male | Female |
| $2,499 or less | 76 (3.2%) | 84 (3.6%) |
| $2,500 to $4,999 | 102 (4.3%) | 72 (3.1%) |
| $5,000 to $7,499 | 22 (0.9%) | 158 (6.9%) |
| $7,500 to $9,999 | 211 (8.9%) | 204 (8.8%) |
| $10,000 to $12,499 | 64 (2.7%) | 62 (2.7%) |
| $12,500 to $14,999 | 51 (2.2%) | 112 (4.9%) |
| $15,000 to $17,499 | 130 (5.5%) | 25 (1.1%) |
| $17,500 to $19,999 | 47 (2.0%) | 184 (8.0%) |
| $20,000 to $22,499 | 0 (0.0%) | 150 (6.5%) |
| $22,500 to $24,999 | 53 (2.2%) | 85 (3.7%) |
| $25,000 to $29,999 | 121 (5.1%) | 183 (7.9%) |
| $30,000 to $34,999 | 99 (4.2%) | 129 (5.6%) |
| $35,000 to $39,999 | 154 (6.5%) | 104 (4.5%) |
| $40,000 to $44,999 | 233 (9.9%) | 127 (5.5%) |
| $45,000 to $49,999 | 85 (3.6%) | 54 (2.3%) |
| $50,000 to $54,999 | 164 (7.0%) | 12 (0.5%) |
| $55,000 to $64,999 | 171 (7.2%) | 340 (14.7%) |
| $65,000 to $74,999 | 128 (5.4%) | 43 (1.9%) |
| $75,000 to $99,999 | 133 (5.6%) | 43 (1.9%) |
| $100,000+ | 313 (13.3%) | 134 (5.8%) |
| Total | 2,357 (100.0%) | 2,305 (100.0%) |
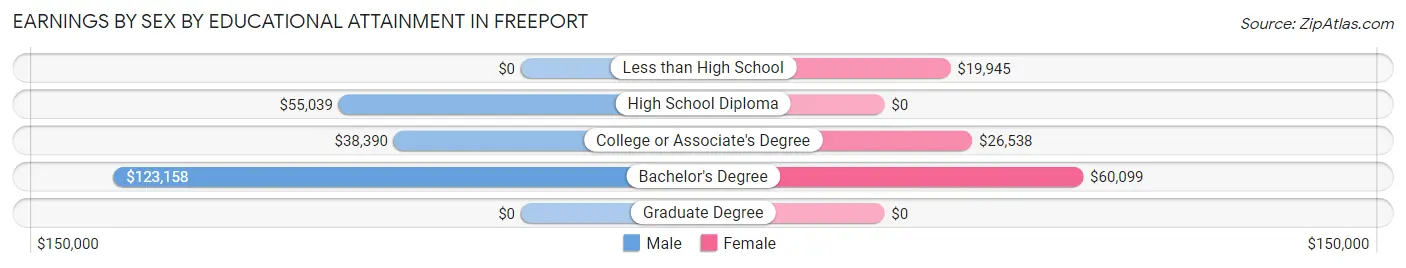
Earnings by Sex by Educational Attainment in Freeport
Average earnings in Freeport are $42,425 for men and $26,139 for women, a difference of 38.4%. Men with an educational attainment of bachelor's degree enjoy the highest average annual earnings of $123,158, while those with college or associate's degree education earn the least with $38,390. Women with an educational attainment of bachelor's degree earn the most with the average annual earnings of $60,099, while those with less than high school education have the smallest earnings of $19,945.
| Educational Attainment | Male Income | Female Income |
| Less than High School | - | - |
| High School Diploma | $55,039 | $0 |
| College or Associate's Degree | $38,390 | $26,538 |
| Bachelor's Degree | $123,158 | $60,099 |
| Graduate Degree | - | - |
| Total | $42,425 | $26,139 |
Family Income in Freeport
Family Income Brackets in Freeport
According to the Freeport family income data, there are 752 families falling into the $50,000 to $74,999 income range, which is the most common income bracket and makes up 26.3% of all families. Conversely, the $200,000+ income bracket is the least frequent group with only 126 families (4.4%) belonging to this category.
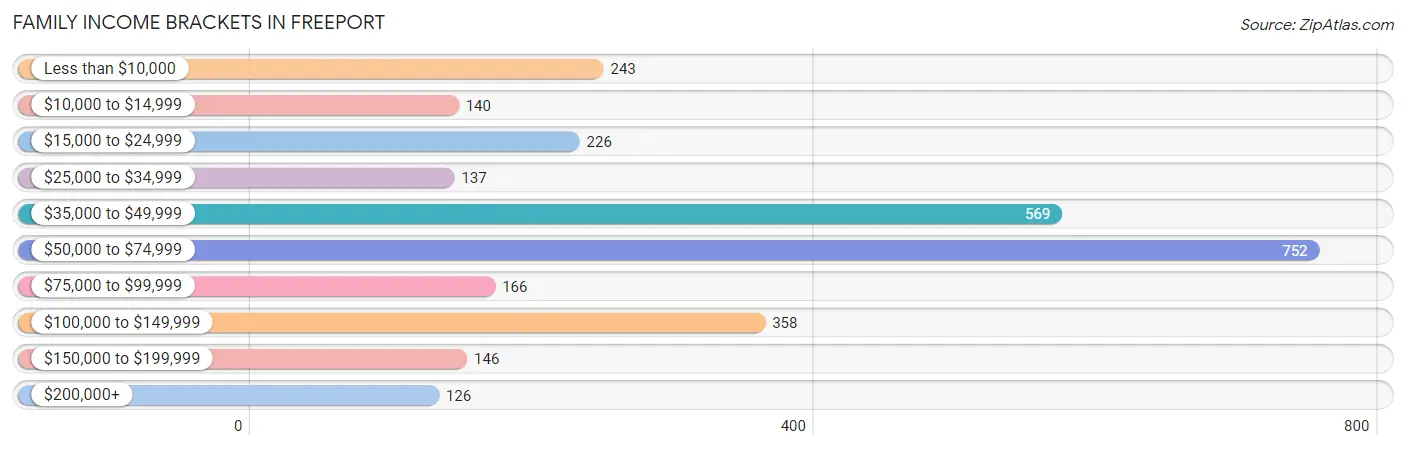
| Income Bracket | # Families | % Families |
| Less than $10,000 | 243 | 8.5% |
| $10,000 to $14,999 | 140 | 4.9% |
| $15,000 to $24,999 | 226 | 7.9% |
| $25,000 to $34,999 | 137 | 4.8% |
| $35,000 to $49,999 | 569 | 19.9% |
| $50,000 to $74,999 | 752 | 26.3% |
| $75,000 to $99,999 | 166 | 5.8% |
| $100,000 to $149,999 | 358 | 12.5% |
| $150,000 to $199,999 | 146 | 5.1% |
| $200,000+ | 126 | 4.4% |
Family Income by Famaliy Size in Freeport
4-person families (536 | 18.7%) account for the highest median family income in Freeport with $59,362 per family, while 2-person families (1,188 | 41.5%) have the highest median income of $26,838 per family member.
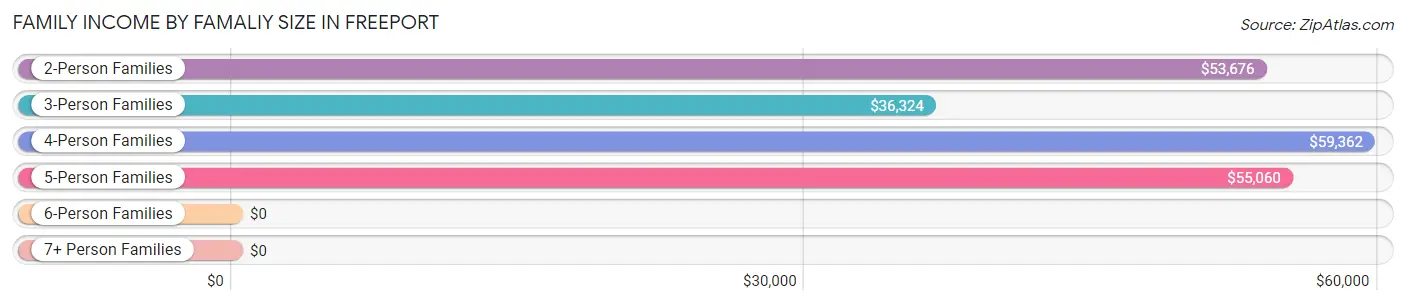
| Income Bracket | # Families | Median Income |
| 2-Person Families | 1,188 (41.5%) | $53,676 |
| 3-Person Families | 666 (23.3%) | $36,324 |
| 4-Person Families | 536 (18.7%) | $59,362 |
| 5-Person Families | 369 (12.9%) | $55,060 |
| 6-Person Families | 101 (3.5%) | $0 |
| 7+ Person Families | 0 (0.0%) | $0 |
| Total | 2,860 (100.0%) | $53,608 |
Family Income by Number of Earners in Freeport
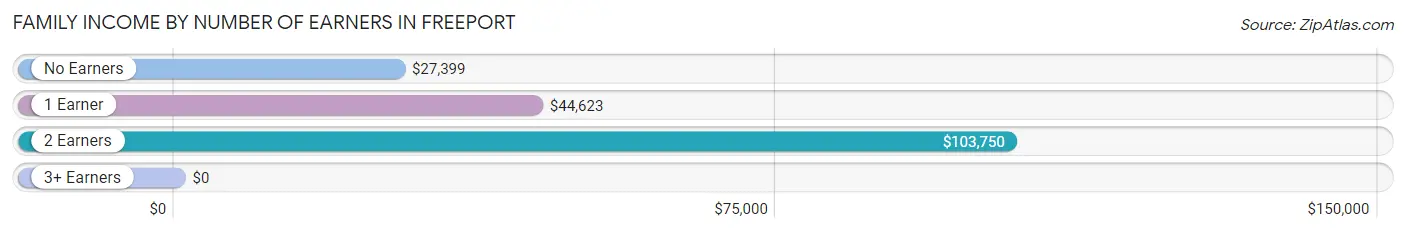
| Number of Earners | # Families | Median Income |
| No Earners | 399 (14.0%) | $27,399 |
| 1 Earner | 1,530 (53.5%) | $44,623 |
| 2 Earners | 860 (30.1%) | $103,750 |
| 3+ Earners | 71 (2.5%) | $0 |
| Total | 2,860 (100.0%) | $53,608 |
Household Income in Freeport
Household Income Brackets in Freeport
With 1,013 households falling in the category, the $50,000 to $74,999 income range is the most frequent in Freeport, accounting for 25.2% of all households. In contrast, only 153 households (3.8%) fall into the $200,000+ income bracket, making it the least populous group.
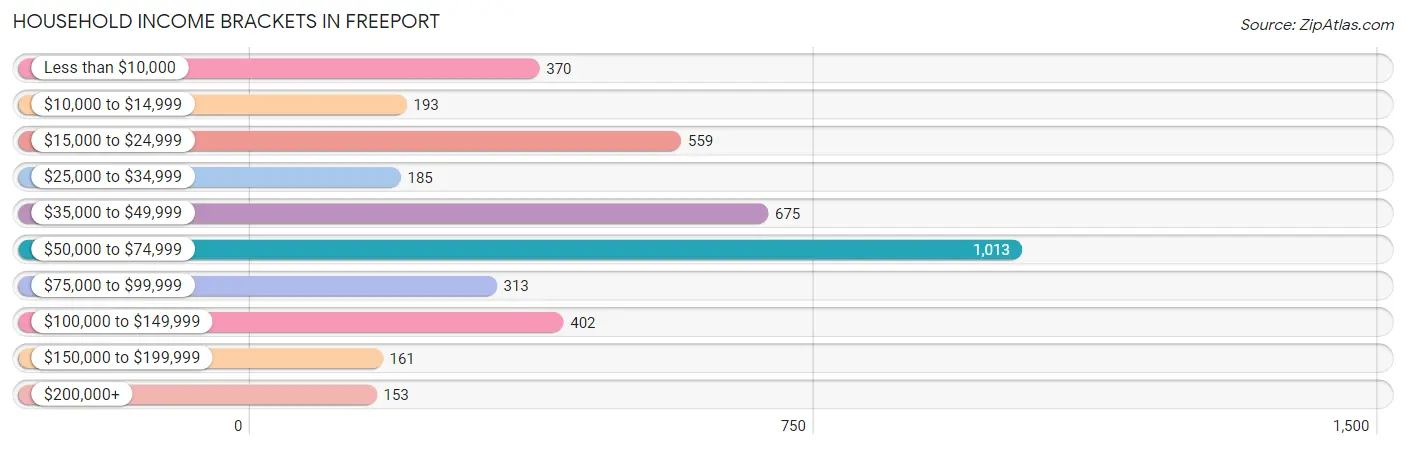
| Income Bracket | # Households | % Households |
| Less than $10,000 | 370 | 9.2% |
| $10,000 to $14,999 | 193 | 4.8% |
| $15,000 to $24,999 | 559 | 13.9% |
| $25,000 to $34,999 | 185 | 4.6% |
| $35,000 to $49,999 | 675 | 16.8% |
| $50,000 to $74,999 | 1,013 | 25.2% |
| $75,000 to $99,999 | 313 | 7.8% |
| $100,000 to $149,999 | 402 | 10.0% |
| $150,000 to $199,999 | 161 | 4.0% |
| $200,000+ | 153 | 3.8% |
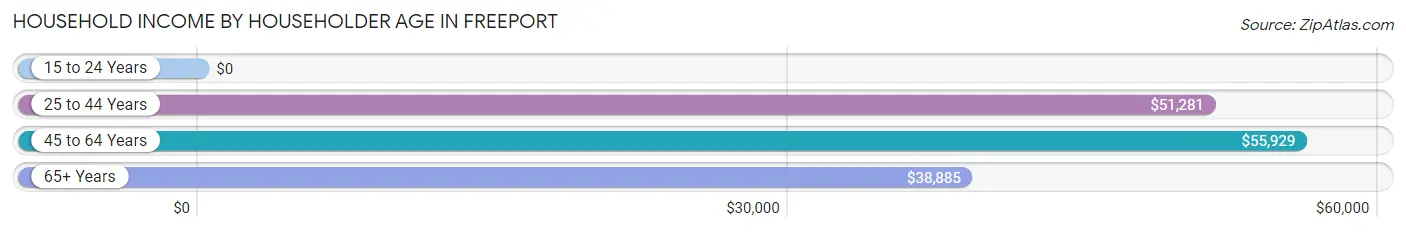
Household Income by Householder Age in Freeport
The median household income in Freeport is $50,704, with the highest median household income of $55,929 found in the 45 to 64 years age bracket for the primary householder. A total of 1,379 households (34.3%) fall into this category. Meanwhile, the 15 to 24 years age bracket for the primary householder has the lowest median household income of $0, with 178 households (4.4%) in this group.
| Income Bracket | # Households | Median Income |
| 15 to 24 Years | 178 (4.4%) | $0 |
| 25 to 44 Years | 1,533 (38.1%) | $51,281 |
| 45 to 64 Years | 1,379 (34.3%) | $55,929 |
| 65+ Years | 929 (23.1%) | $38,885 |
| Total | 4,019 (100.0%) | $50,704 |
Poverty in Freeport
Income Below Poverty by Sex and Age in Freeport
With 17.7% poverty level for males and 18.5% for females among the residents of Freeport, 5 year old males and 35 to 44 year old females are the most vulnerable to poverty, with 77 males (49.4%) and 228 females (42.9%) in their respective age groups living below the poverty level.
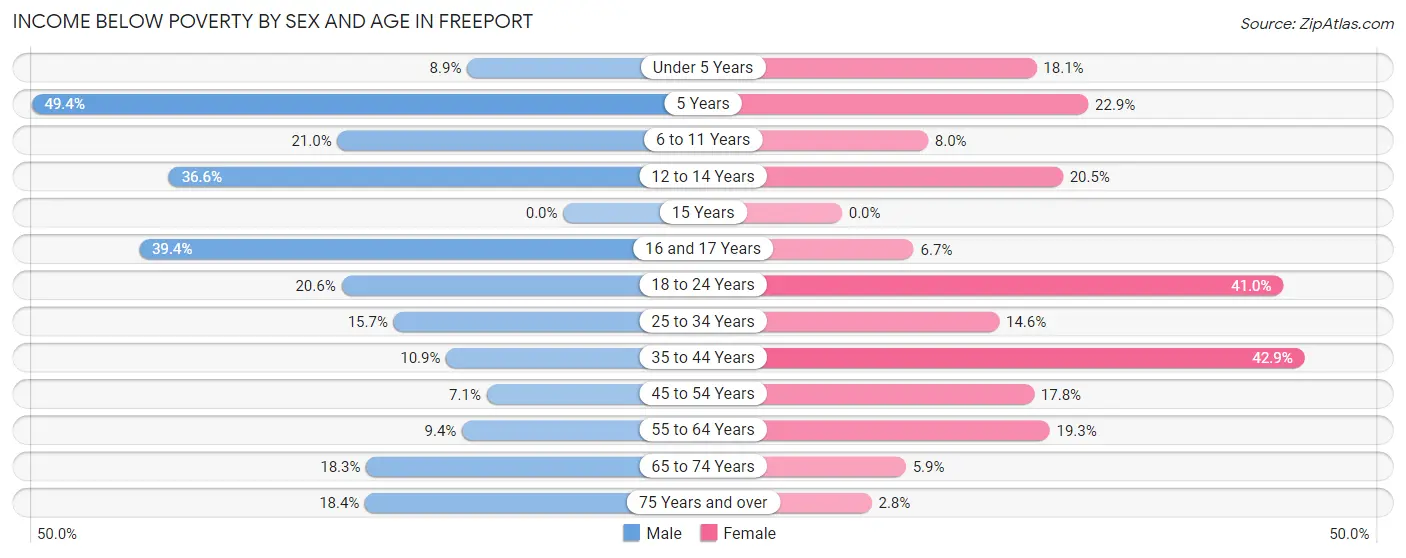
| Age Bracket | Male | Female |
| Under 5 Years | 37 (8.9%) | 69 (18.1%) |
| 5 Years | 77 (49.4%) | 24 (22.9%) |
| 6 to 11 Years | 122 (21.0%) | 53 (8.0%) |
| 12 to 14 Years | 119 (36.6%) | 57 (20.5%) |
| 15 Years | 0 (0.0%) | 0 (0.0%) |
| 16 and 17 Years | 115 (39.4%) | 12 (6.7%) |
| 18 to 24 Years | 77 (20.6%) | 159 (41.0%) |
| 25 to 34 Years | 82 (15.7%) | 153 (14.6%) |
| 35 to 44 Years | 67 (10.9%) | 228 (42.9%) |
| 45 to 54 Years | 42 (7.1%) | 143 (17.8%) |
| 55 to 64 Years | 58 (9.4%) | 102 (19.3%) |
| 65 to 74 Years | 96 (18.3%) | 30 (5.9%) |
| 75 Years and over | 16 (18.4%) | 5 (2.8%) |
| Total | 908 (17.7%) | 1,035 (18.5%) |
Income Above Poverty by Sex and Age in Freeport
According to the poverty statistics in Freeport, males aged 15 years and females aged 75 years and over are the age groups that are most secure financially, with 100.0% of males and 97.2% of females in these age groups living above the poverty line.
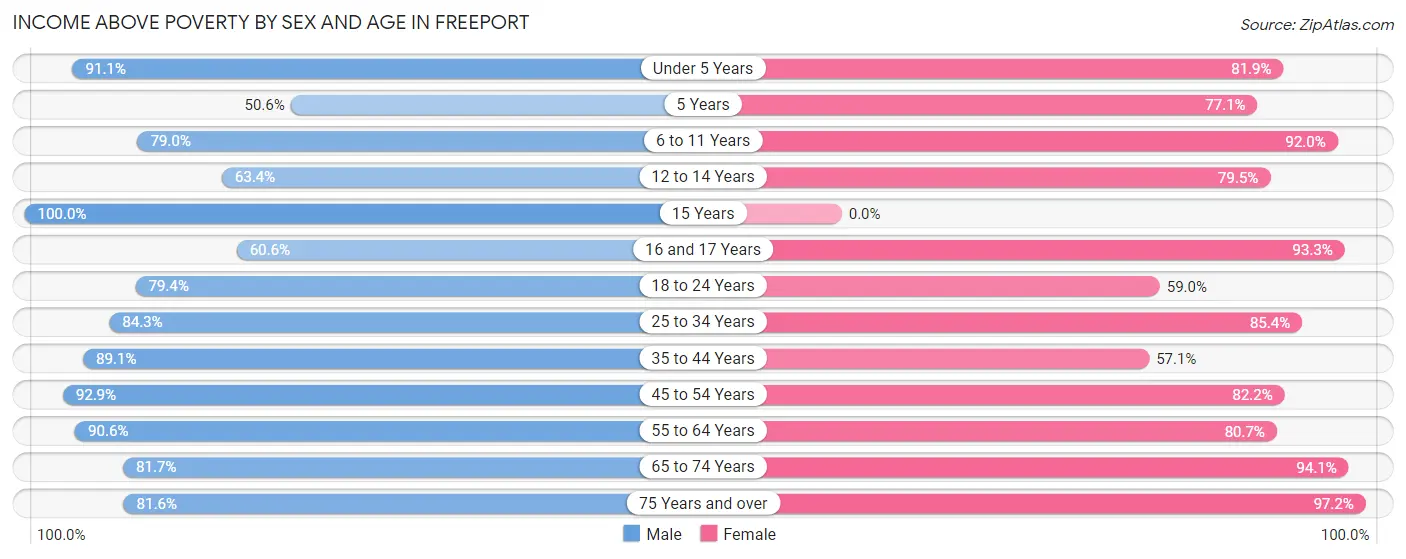
| Age Bracket | Male | Female |
| Under 5 Years | 378 (91.1%) | 313 (81.9%) |
| 5 Years | 79 (50.6%) | 81 (77.1%) |
| 6 to 11 Years | 460 (79.0%) | 610 (92.0%) |
| 12 to 14 Years | 206 (63.4%) | 221 (79.5%) |
| 15 Years | 27 (100.0%) | 0 (0.0%) |
| 16 and 17 Years | 177 (60.6%) | 168 (93.3%) |
| 18 to 24 Years | 297 (79.4%) | 229 (59.0%) |
| 25 to 34 Years | 439 (84.3%) | 896 (85.4%) |
| 35 to 44 Years | 550 (89.1%) | 303 (57.1%) |
| 45 to 54 Years | 549 (92.9%) | 659 (82.2%) |
| 55 to 64 Years | 560 (90.6%) | 427 (80.7%) |
| 65 to 74 Years | 429 (81.7%) | 476 (94.1%) |
| 75 Years and over | 71 (81.6%) | 176 (97.2%) |
| Total | 4,222 (82.3%) | 4,559 (81.5%) |
Income Below Poverty Among Married-Couple Families in Freeport
The poverty statistics for married-couple families in Freeport show that 10.1% or 169 of the total 1,681 families live below the poverty line. Families with 1 or 2 children have the highest poverty rate of 14.8%, comprising of 93 families. On the other hand, families with 3 or 4 children have the lowest poverty rate of 0.0%, which includes 0 families.
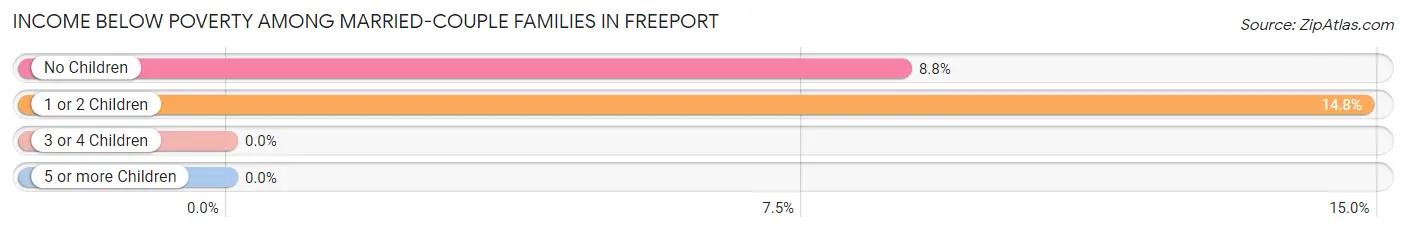
| Children | Above Poverty | Below Poverty |
| No Children | 788 (91.2%) | 76 (8.8%) |
| 1 or 2 Children | 534 (85.2%) | 93 (14.8%) |
| 3 or 4 Children | 190 (100.0%) | 0 (0.0%) |
| 5 or more Children | 0 (0.0%) | 0 (0.0%) |
| Total | 1,512 (89.9%) | 169 (10.1%) |
Income Below Poverty Among Single-Parent Households in Freeport
According to the poverty data in Freeport, 3.3% or 11 single-father households and 36.6% or 309 single-mother households are living below the poverty line. Among single-father households, those with no children have the highest poverty rate, with 11 households (6.6%) experiencing poverty. Likewise, among single-mother households, those with no children have the highest poverty rate, with 48 households (58.5%) falling below the poverty line.
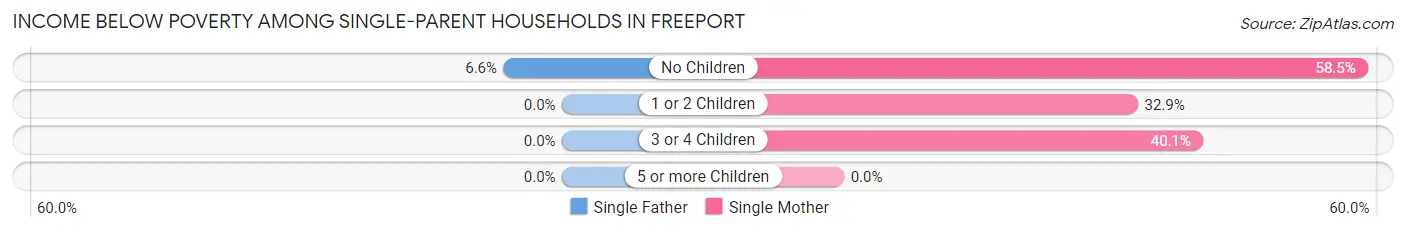
| Children | Single Father | Single Mother |
| No Children | 11 (6.6%) | 48 (58.5%) |
| 1 or 2 Children | 0 (0.0%) | 204 (32.9%) |
| 3 or 4 Children | 0 (0.0%) | 57 (40.1%) |
| 5 or more Children | 0 (0.0%) | 0 (0.0%) |
| Total | 11 (3.3%) | 309 (36.6%) |
Income Below Poverty Among Married-Couple vs Single-Parent Households in Freeport
The poverty data for Freeport shows that 169 of the married-couple family households (10.1%) and 320 of the single-parent households (27.1%) are living below the poverty level. Within the married-couple family households, those with 1 or 2 children have the highest poverty rate, with 93 households (14.8%) falling below the poverty line. Among the single-parent households, those with 3 or 4 children have the highest poverty rate, with 57 household (31.7%) living below poverty.
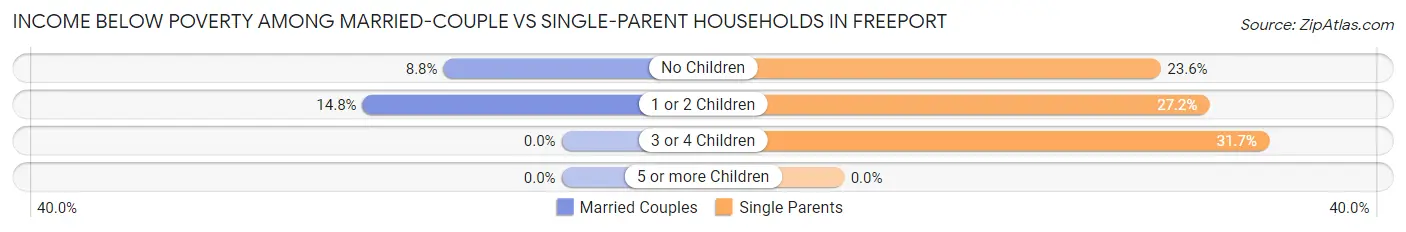
| Children | Married-Couple Families | Single-Parent Households |
| No Children | 76 (8.8%) | 59 (23.6%) |
| 1 or 2 Children | 93 (14.8%) | 204 (27.2%) |
| 3 or 4 Children | 0 (0.0%) | 57 (31.7%) |
| 5 or more Children | 0 (0.0%) | 0 (0.0%) |
| Total | 169 (10.1%) | 320 (27.1%) |
Race in Freeport
The most populous races in Freeport are Hispanic or Latino (5,801 | 54.0%), White / Caucasian (5,190 | 48.3%), and Black / African American (2,153 | 20.1%).
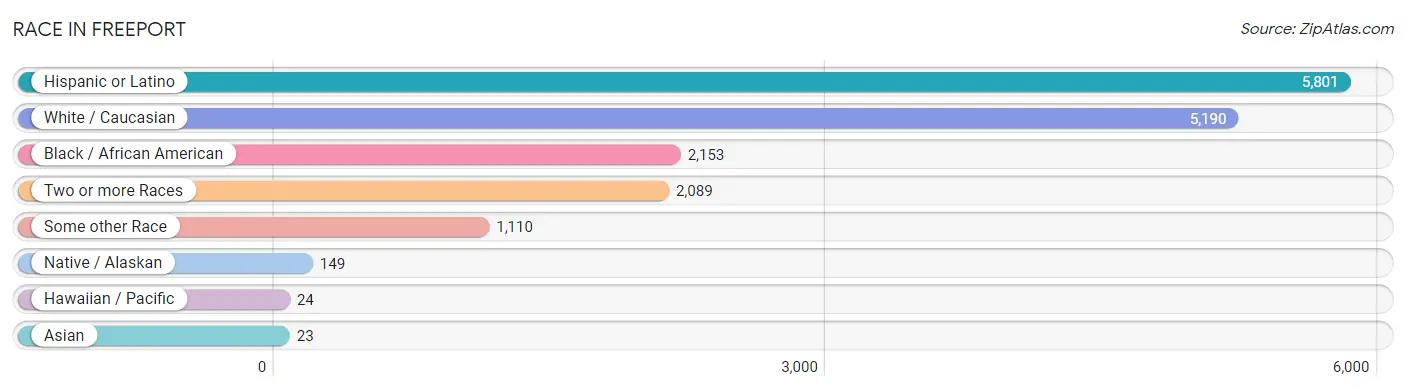
| Race | # Population | % Population |
| Asian | 23 | 0.2% |
| Black / African American | 2,153 | 20.1% |
| Hawaiian / Pacific | 24 | 0.2% |
| Hispanic or Latino | 5,801 | 54.0% |
| Native / Alaskan | 149 | 1.4% |
| White / Caucasian | 5,190 | 48.3% |
| Two or more Races | 2,089 | 19.5% |
| Some other Race | 1,110 | 10.3% |
| Total | 10,738 | 100.0% |
Ancestry in Freeport
The most populous ancestries reported in Freeport are Mexican (5,243 | 48.8%), American (738 | 6.9%), Irish (324 | 3.0%), German (250 | 2.3%), and English (247 | 2.3%), together accounting for 63.4% of all Freeport residents.
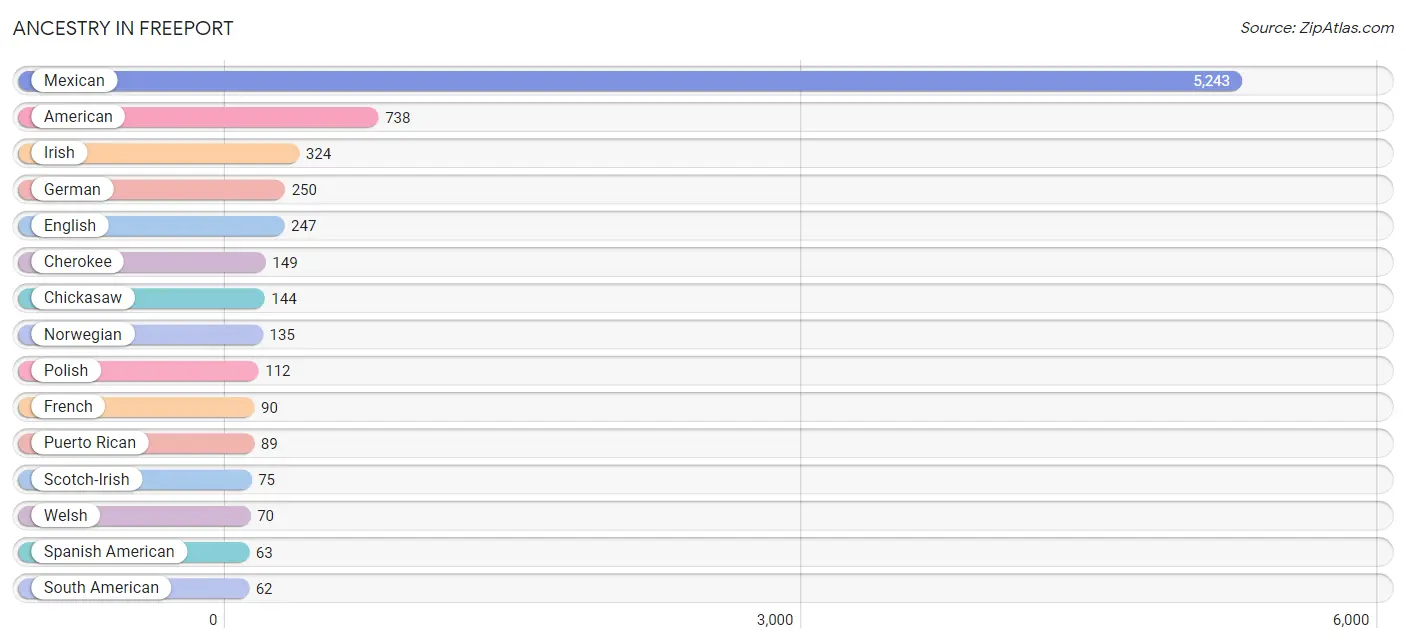
| Ancestry | # Population | % Population |
| African | 33 | 0.3% |
| American | 738 | 6.9% |
| British | 18 | 0.2% |
| Canadian | 10 | 0.1% |
| Central American | 59 | 0.5% |
| Cherokee | 149 | 1.4% |
| Chickasaw | 144 | 1.3% |
| Chilean | 7 | 0.1% |
| Choctaw | 14 | 0.1% |
| Czech | 31 | 0.3% |
| Czechoslovakian | 25 | 0.2% |
| Dominican | 6 | 0.1% |
| Dutch | 34 | 0.3% |
| Ecuadorian | 55 | 0.5% |
| English | 247 | 2.3% |
| European | 8 | 0.1% |
| French | 90 | 0.8% |
| German | 250 | 2.3% |
| Guamanian / Chamorro | 24 | 0.2% |
| Honduran | 37 | 0.3% |
| Indian (Asian) | 12 | 0.1% |
| Inupiat | 27 | 0.3% |
| Irish | 324 | 3.0% |
| Italian | 34 | 0.3% |
| Mexican | 5,243 | 48.8% |
| Native Hawaiian | 24 | 0.2% |
| Nicaraguan | 22 | 0.2% |
| Norwegian | 135 | 1.3% |
| Polish | 112 | 1.0% |
| Puerto Rican | 89 | 0.8% |
| Russian | 10 | 0.1% |
| Scandinavian | 12 | 0.1% |
| Scotch-Irish | 75 | 0.7% |
| Scottish | 39 | 0.4% |
| South American | 62 | 0.6% |
| Spaniard | 50 | 0.5% |
| Spanish American | 63 | 0.6% |
| Sri Lankan | 11 | 0.1% |
| Subsaharan African | 33 | 0.3% |
| Welsh | 70 | 0.6% | View All 40 Rows |
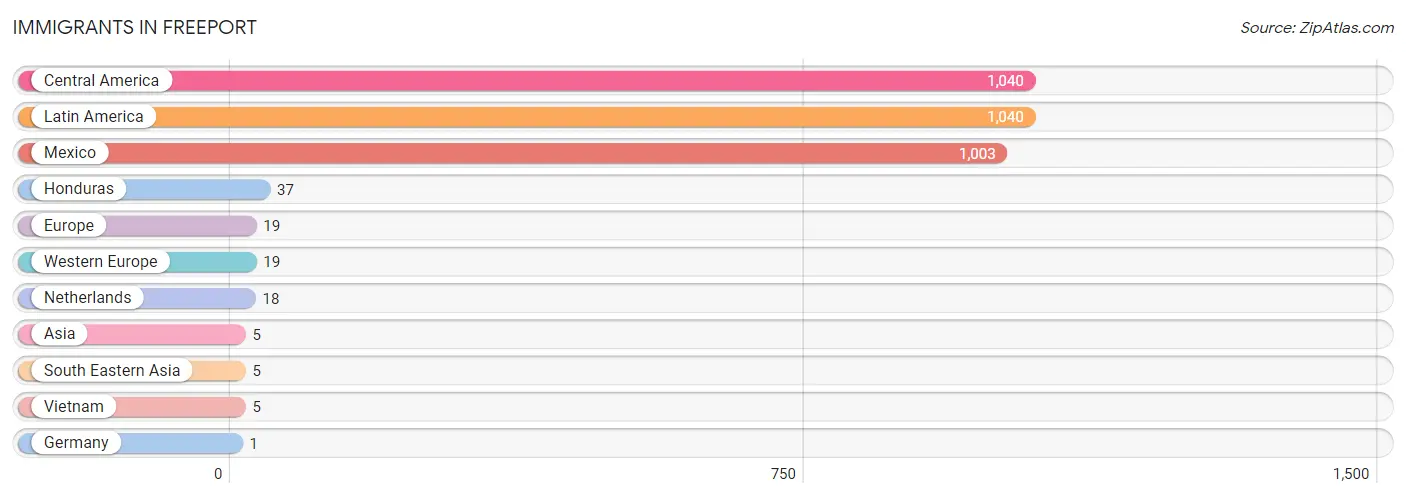
Immigrants in Freeport
The most numerous immigrant groups reported in Freeport came from Central America (1,040 | 9.7%), Latin America (1,040 | 9.7%), Mexico (1,003 | 9.3%), Honduras (37 | 0.3%), and Europe (19 | 0.2%), together accounting for 29.2% of all Freeport residents.
| Immigration Origin | # Population | % Population |
| Asia | 5 | 0.1% |
| Central America | 1,040 | 9.7% |
| Europe | 19 | 0.2% |
| Germany | 1 | 0.0% |
| Honduras | 37 | 0.3% |
| Latin America | 1,040 | 9.7% |
| Mexico | 1,003 | 9.3% |
| Netherlands | 18 | 0.2% |
| South Eastern Asia | 5 | 0.1% |
| Vietnam | 5 | 0.1% |
| Western Europe | 19 | 0.2% | View All 11 Rows |
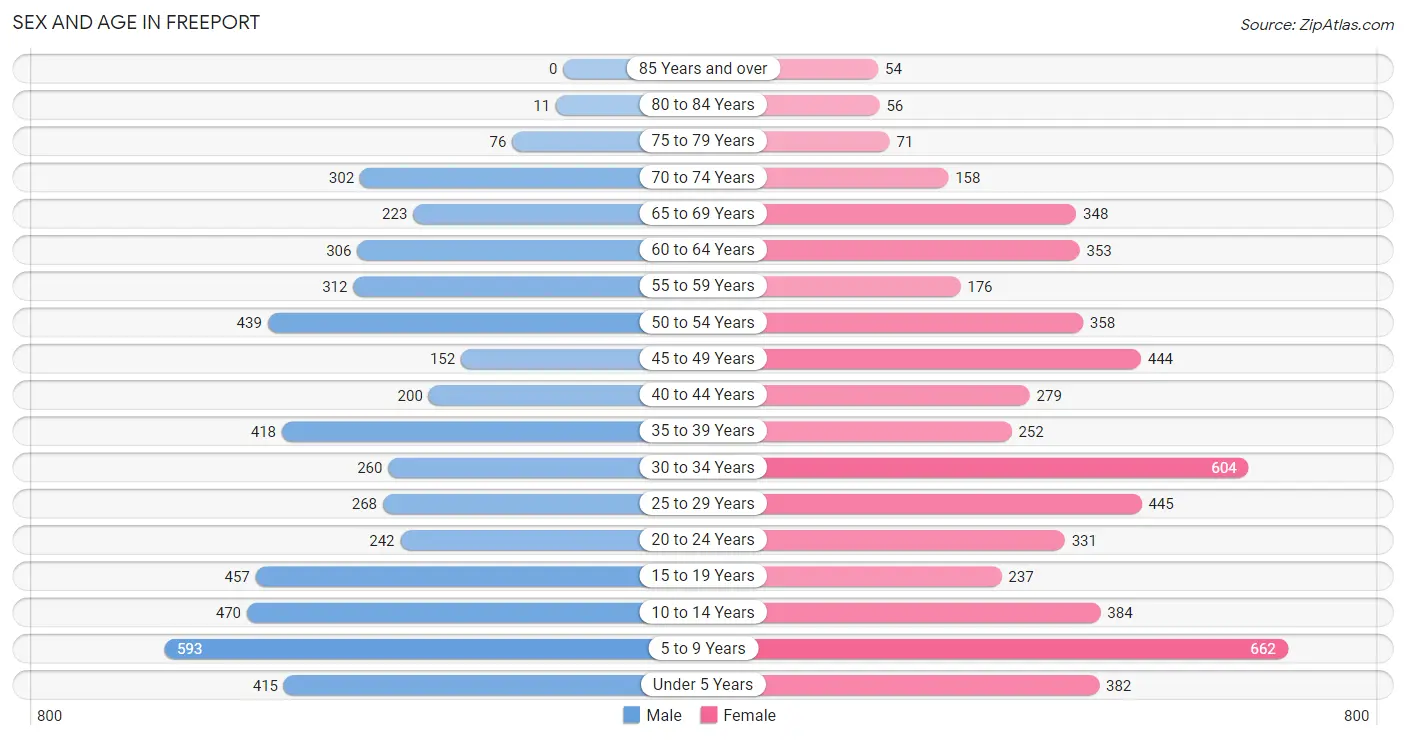
Sex and Age in Freeport
Sex and Age in Freeport
The most populous age groups in Freeport are 5 to 9 Years (593 | 11.5%) for men and 5 to 9 Years (662 | 11.8%) for women.
| Age Bracket | Male | Female |
| Under 5 Years | 415 (8.1%) | 382 (6.8%) |
| 5 to 9 Years | 593 (11.5%) | 662 (11.8%) |
| 10 to 14 Years | 470 (9.1%) | 384 (6.9%) |
| 15 to 19 Years | 457 (8.9%) | 237 (4.2%) |
| 20 to 24 Years | 242 (4.7%) | 331 (5.9%) |
| 25 to 29 Years | 268 (5.2%) | 445 (8.0%) |
| 30 to 34 Years | 260 (5.1%) | 604 (10.8%) |
| 35 to 39 Years | 418 (8.1%) | 252 (4.5%) |
| 40 to 44 Years | 200 (3.9%) | 279 (5.0%) |
| 45 to 49 Years | 152 (2.9%) | 444 (7.9%) |
| 50 to 54 Years | 439 (8.5%) | 358 (6.4%) |
| 55 to 59 Years | 312 (6.1%) | 176 (3.2%) |
| 60 to 64 Years | 306 (5.9%) | 353 (6.3%) |
| 65 to 69 Years | 223 (4.3%) | 348 (6.2%) |
| 70 to 74 Years | 302 (5.9%) | 158 (2.8%) |
| 75 to 79 Years | 76 (1.5%) | 71 (1.3%) |
| 80 to 84 Years | 11 (0.2%) | 56 (1.0%) |
| 85 Years and over | 0 (0.0%) | 54 (1.0%) |
| Total | 5,144 (100.0%) | 5,594 (100.0%) |
Families and Households in Freeport
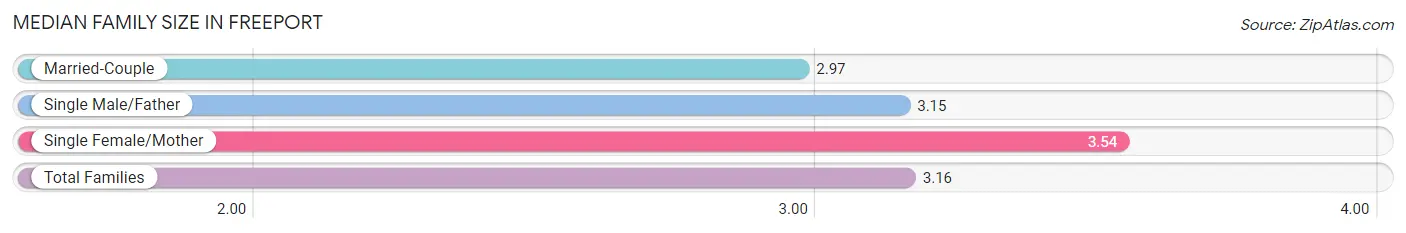
Median Family Size in Freeport
The median family size in Freeport is 3.16 persons per family, with single female/mother families (845 | 29.5%) accounting for the largest median family size of 3.54 persons per family. On the other hand, married-couple families (1,681 | 58.8%) represent the smallest median family size with 2.97 persons per family.
| Family Type | # Families | Family Size |
| Married-Couple | 1,681 (58.8%) | 2.97 |
| Single Male/Father | 334 (11.7%) | 3.15 |
| Single Female/Mother | 845 (29.5%) | 3.54 |
| Total Families | 2,860 (100.0%) | 3.16 |
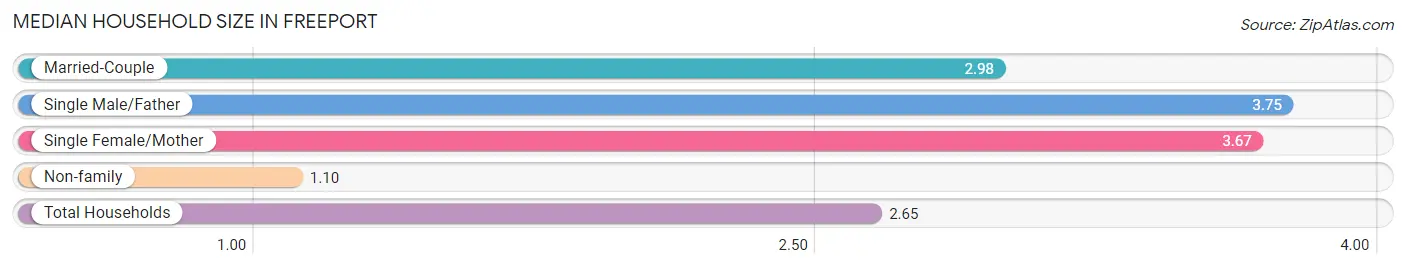
Median Household Size in Freeport
The median household size in Freeport is 2.65 persons per household, with single male/father households (334 | 8.3%) accounting for the largest median household size of 3.75 persons per household. non-family households (1,159 | 28.8%) represent the smallest median household size with 1.10 persons per household.
| Household Type | # Households | Household Size |
| Married-Couple | 1,681 (41.8%) | 2.98 |
| Single Male/Father | 334 (8.3%) | 3.75 |
| Single Female/Mother | 845 (21.0%) | 3.67 |
| Non-family | 1,159 (28.8%) | 1.10 |
| Total Households | 4,019 (100.0%) | 2.65 |
Household Size by Marriage Status in Freeport
Out of a total of 4,019 households in Freeport, 2,860 (71.2%) are family households, while 1,159 (28.8%) are nonfamily households. The most numerous type of family households are 2-person households, comprising 974, and the most common type of nonfamily households are 1-person households, comprising 1,047.
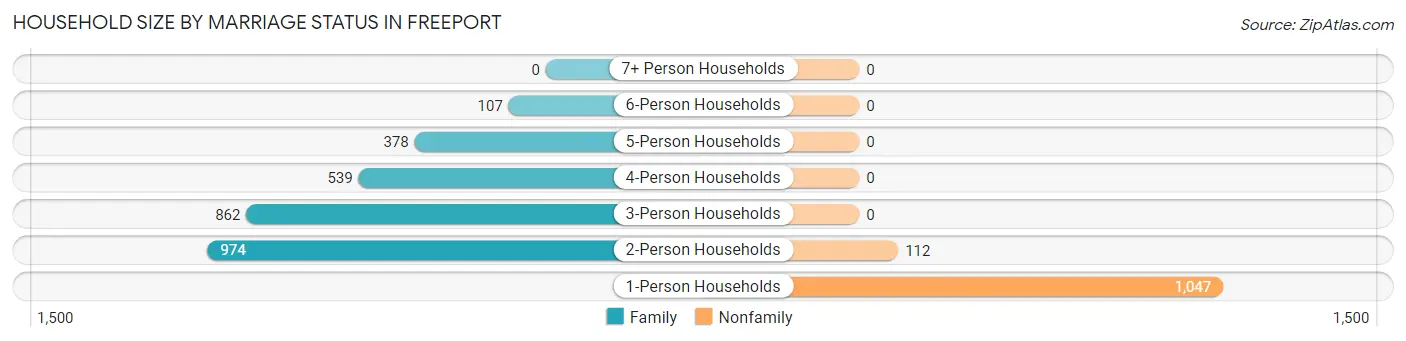
| Household Size | Family Households | Nonfamily Households |
| 1-Person Households | - | 1,047 (26.1%) |
| 2-Person Households | 974 (24.2%) | 112 (2.8%) |
| 3-Person Households | 862 (21.4%) | 0 (0.0%) |
| 4-Person Households | 539 (13.4%) | 0 (0.0%) |
| 5-Person Households | 378 (9.4%) | 0 (0.0%) |
| 6-Person Households | 107 (2.7%) | 0 (0.0%) |
| 7+ Person Households | 0 (0.0%) | 0 (0.0%) |
| Total | 2,860 (71.2%) | 1,159 (28.8%) |
Female Fertility in Freeport
Fertility by Age in Freeport
Average fertility rate in Freeport is 102.0 births per 1,000 women. Women in the age bracket of 20 to 34 years have the highest fertility rate with 186.0 births per 1,000 women. Women in the age bracket of 20 to 34 years acount for 94.8% of all women with births.
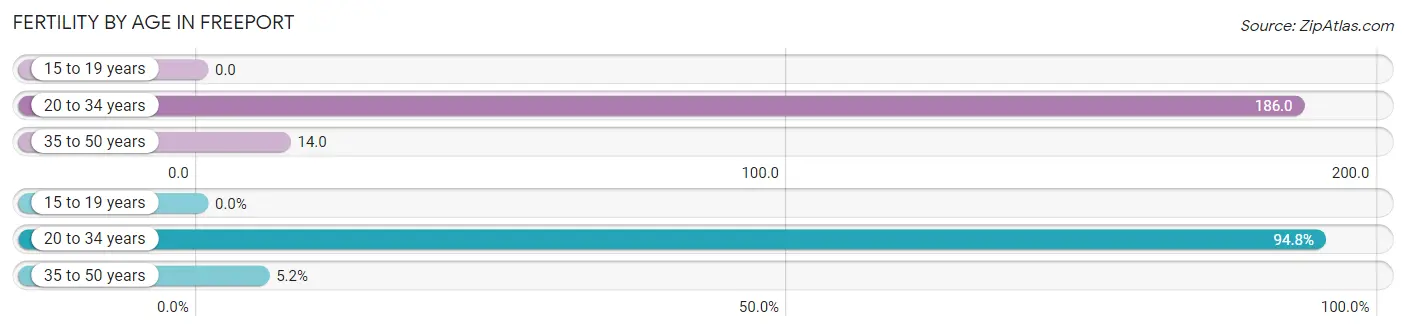
| Age Bracket | Women with Births | Births / 1,000 Women |
| 15 to 19 years | 0 (0.0%) | 0.0 |
| 20 to 34 years | 256 (94.8%) | 186.0 |
| 35 to 50 years | 14 (5.2%) | 14.0 |
| Total | 270 (100.0%) | 102.0 |
Fertility by Age by Marriage Status in Freeport
53.7% of women with births (270) in Freeport are married. The highest percentage of unmarried women with births falls into 20 to 34 years age bracket with 48.8% of them unmarried at the time of birth, while the lowest percentage of unmarried women with births belong to 35 to 50 years age bracket with 0.0% of them unmarried.
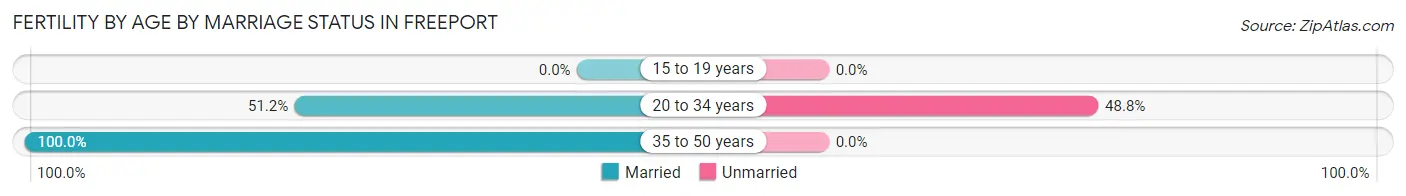
| Age Bracket | Married | Unmarried |
| 15 to 19 years | 0 (0.0%) | 0 (0.0%) |
| 20 to 34 years | 131 (51.2%) | 125 (48.8%) |
| 35 to 50 years | 14 (100.0%) | 0 (0.0%) |
| Total | 145 (53.7%) | 125 (46.3%) |
Fertility by Education in Freeport
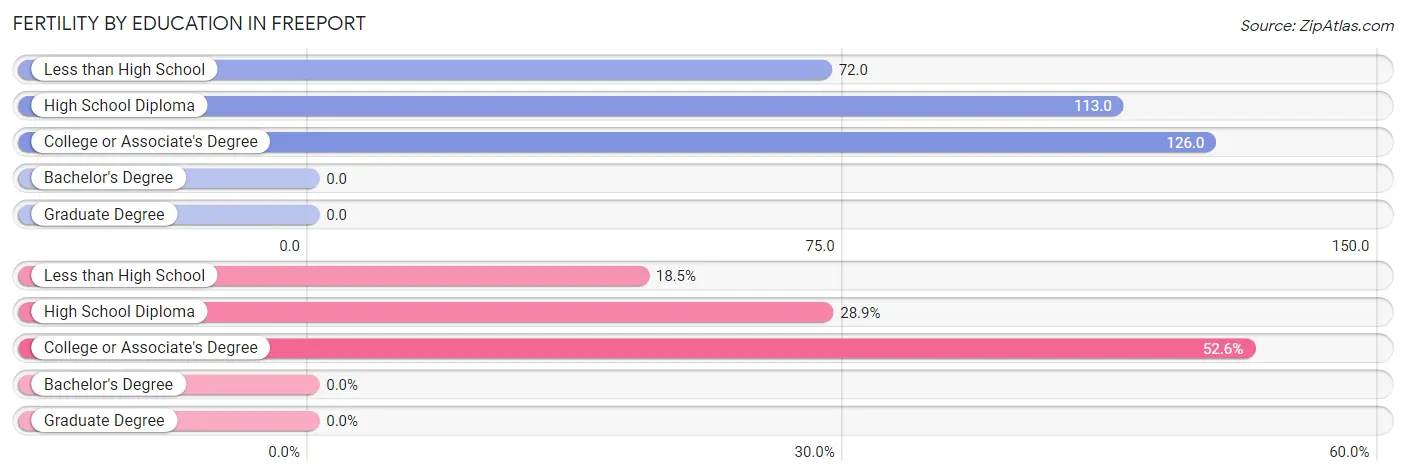
| Educational Attainment | Women with Births | Births / 1,000 Women |
| Less than High School | 50 (18.5%) | 72.0 |
| High School Diploma | 78 (28.9%) | 113.0 |
| College or Associate's Degree | 142 (52.6%) | 126.0 |
| Bachelor's Degree | 0 (0.0%) | 0.0 |
| Graduate Degree | 0 (0.0%) | 0.0 |
| Total | 270 (100.0%) | 102.0 |
Fertility by Education by Marriage Status in Freeport
46.3% of women with births in Freeport are unmarried. Women with the educational attainment of high school diploma are most likely to be married with 100.0% of them married at childbirth, while women with the educational attainment of less than high school are least likely to be married with 100.0% of them unmarried at childbirth.
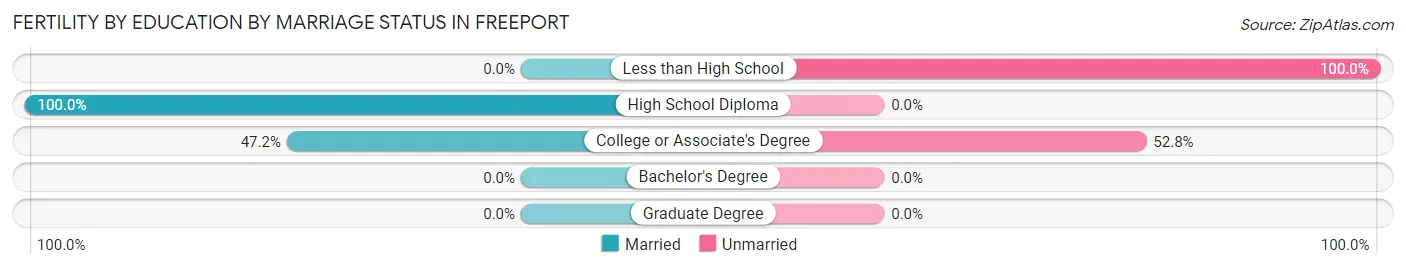
| Educational Attainment | Married | Unmarried |
| Less than High School | 0 (0.0%) | 50 (100.0%) |
| High School Diploma | 78 (100.0%) | 0 (0.0%) |
| College or Associate's Degree | 67 (47.2%) | 75 (52.8%) |
| Bachelor's Degree | 0 (0.0%) | 0 (0.0%) |
| Graduate Degree | 0 (0.0%) | 0 (0.0%) |
| Total | 145 (53.7%) | 125 (46.3%) |
Employment Characteristics in Freeport
Employment by Class of Employer in Freeport
Among the 4,053 employed individuals in Freeport, private company employees (2,970 | 73.3%), self-employed (not incorporated) (347 | 8.6%), and not-for-profit organizations (313 | 7.7%) make up the most common classes of employment.
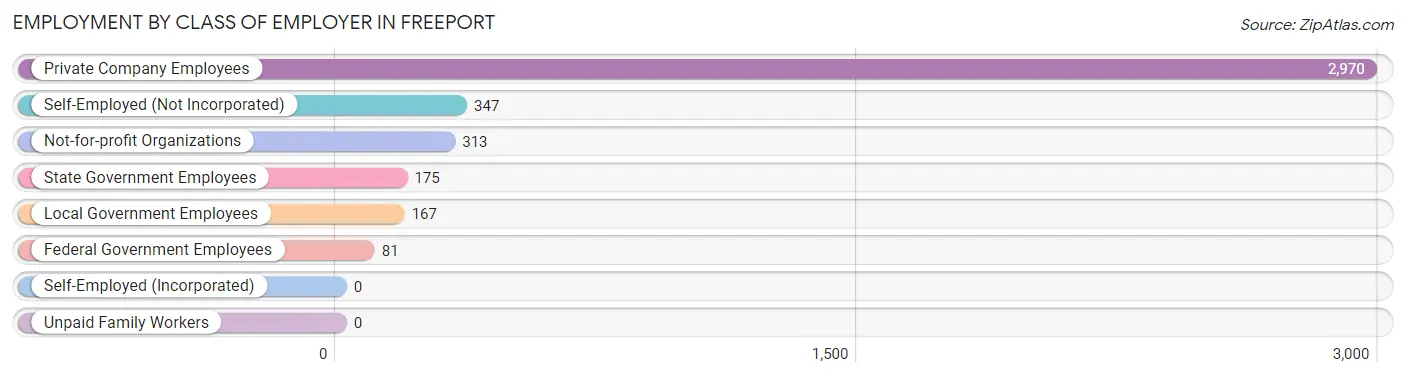
| Employer Class | # Employees | % Employees |
| Private Company Employees | 2,970 | 73.3% |
| Self-Employed (Incorporated) | 0 | 0.0% |
| Self-Employed (Not Incorporated) | 347 | 8.6% |
| Not-for-profit Organizations | 313 | 7.7% |
| Local Government Employees | 167 | 4.1% |
| State Government Employees | 175 | 4.3% |
| Federal Government Employees | 81 | 2.0% |
| Unpaid Family Workers | 0 | 0.0% |
| Total | 4,053 | 100.0% |
Employment Status by Age in Freeport
According to the labor force statistics for Freeport, out of the total population over 16 years of age (7,805), 57.0% or 4,449 individuals are in the labor force, with 6.3% or 280 of them unemployed. The age group with the highest labor force participation rate is 30 to 34 years, with 92.4% or 798 individuals in the labor force. Within the labor force, the 55 to 59 years age range has the highest percentage of unemployed individuals, with 29.3% or 88 of them being unemployed.
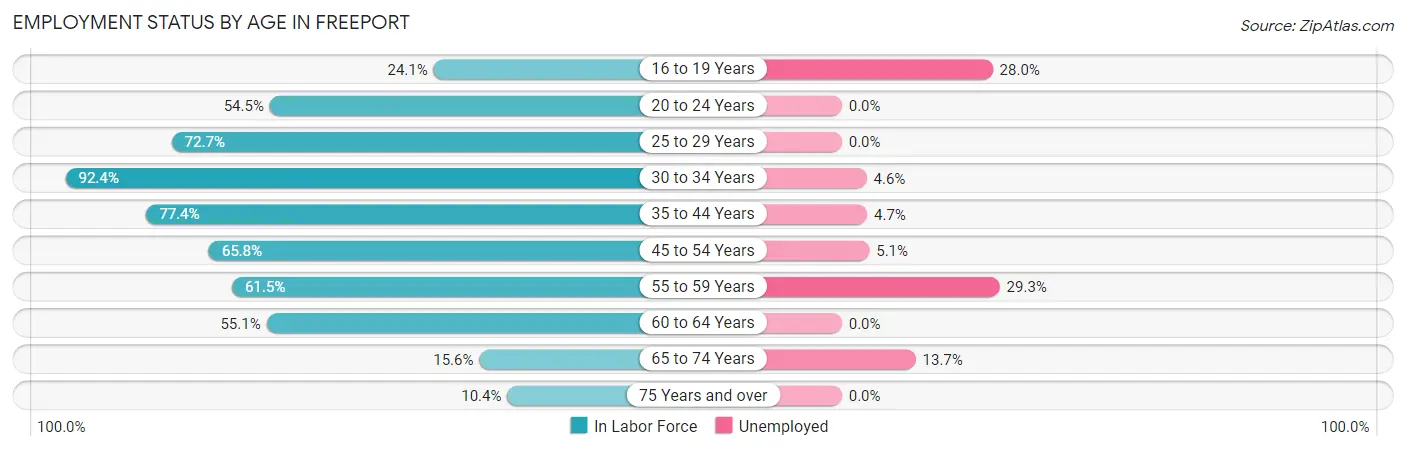
| Age Bracket | In Labor Force | Unemployed |
| 16 to 19 Years | 161 (24.1%) | 45 (28.0%) |
| 20 to 24 Years | 312 (54.5%) | 0 (0.0%) |
| 25 to 29 Years | 518 (72.7%) | 0 (0.0%) |
| 30 to 34 Years | 798 (92.4%) | 37 (4.6%) |
| 35 to 44 Years | 889 (77.4%) | 42 (4.7%) |
| 45 to 54 Years | 917 (65.8%) | 47 (5.1%) |
| 55 to 59 Years | 300 (61.5%) | 88 (29.3%) |
| 60 to 64 Years | 363 (55.1%) | 0 (0.0%) |
| 65 to 74 Years | 161 (15.6%) | 22 (13.7%) |
| 75 Years and over | 28 (10.4%) | 0 (0.0%) |
| Total | 4,449 (57.0%) | 280 (6.3%) |
Employment Status by Educational Attainment in Freeport
According to labor force statistics for Freeport, 71.9% of individuals (3,786) out of the total population between 25 and 64 years of age (5,266) are in the labor force, with 5.7% or 216 of them being unemployed. The group with the highest labor force participation rate are those with the educational attainment of college / associate degree, with 83.0% or 1,560 individuals in the labor force. Within the labor force, individuals with college / associate degree education have the highest percentage of unemployment, with 8.7% or 136 of them being unemployed.
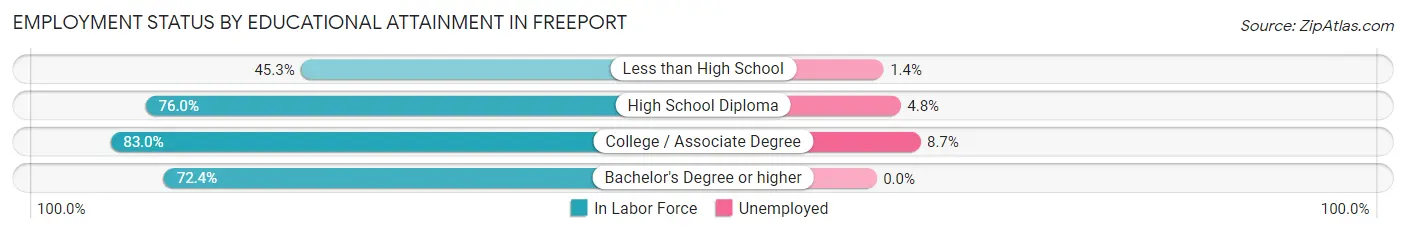
| Educational Attainment | In Labor Force | Unemployed |
| Less than High School | 500 (45.3%) | 15 (1.4%) |
| High School Diploma | 1,512 (76.0%) | 96 (4.8%) |
| College / Associate Degree | 1,560 (83.0%) | 163 (8.7%) |
| Bachelor's Degree or higher | 213 (72.4%) | 0 (0.0%) |
| Total | 3,786 (71.9%) | 300 (5.7%) |
Employment Occupations by Sex in Freeport
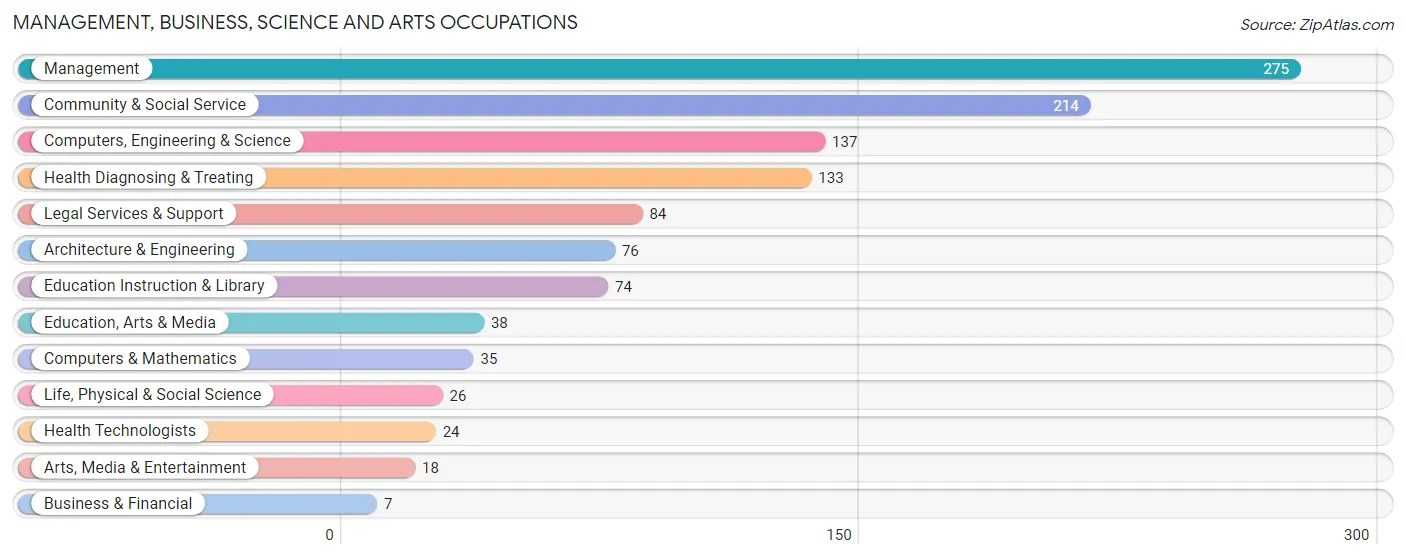
Management, Business, Science and Arts Occupations
The most common Management, Business, Science and Arts occupations in Freeport are Management (275 | 6.6%), Community & Social Service (214 | 5.1%), Computers, Engineering & Science (137 | 3.3%), Health Diagnosing & Treating (133 | 3.2%), and Legal Services & Support (84 | 2.0%).
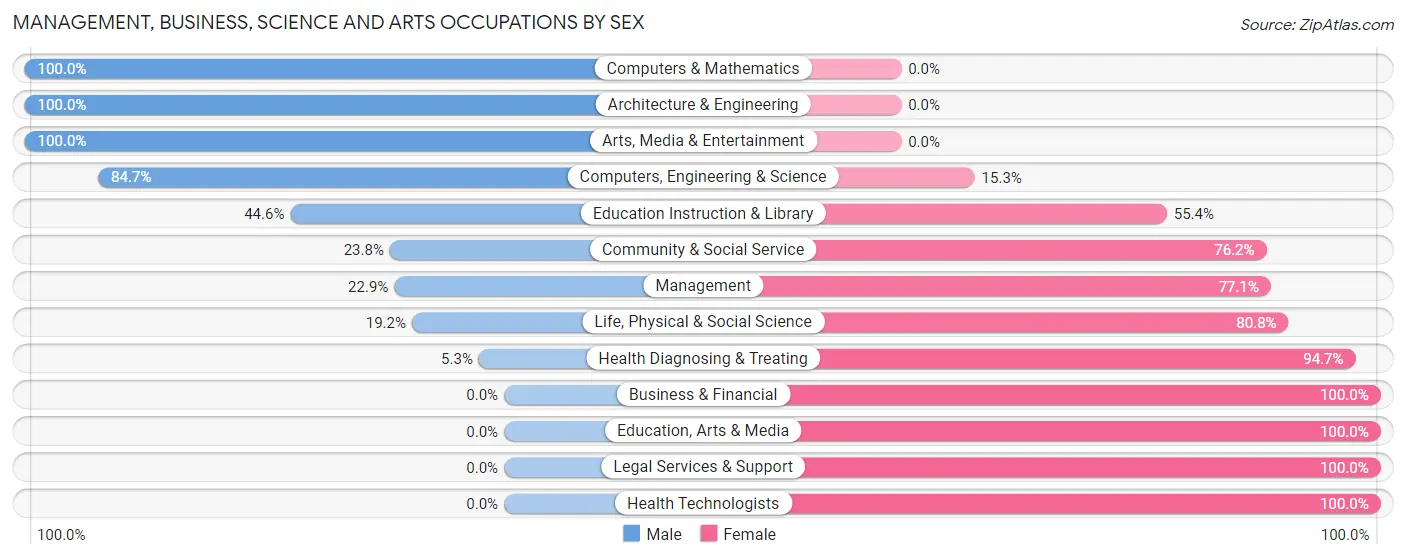
Management, Business, Science and Arts Occupations by Sex
Within the Management, Business, Science and Arts occupations in Freeport, the most male-oriented occupations are Computers & Mathematics (100.0%), Architecture & Engineering (100.0%), and Arts, Media & Entertainment (100.0%), while the most female-oriented occupations are Business & Financial (100.0%), Education, Arts & Media (100.0%), and Legal Services & Support (100.0%).
| Occupation | Male | Female |
| Management | 63 (22.9%) | 212 (77.1%) |
| Business & Financial | 0 (0.0%) | 7 (100.0%) |
| Computers, Engineering & Science | 116 (84.7%) | 21 (15.3%) |
| Computers & Mathematics | 35 (100.0%) | 0 (0.0%) |
| Architecture & Engineering | 76 (100.0%) | 0 (0.0%) |
| Life, Physical & Social Science | 5 (19.2%) | 21 (80.8%) |
| Community & Social Service | 51 (23.8%) | 163 (76.2%) |
| Education, Arts & Media | 0 (0.0%) | 38 (100.0%) |
| Legal Services & Support | 0 (0.0%) | 84 (100.0%) |
| Education Instruction & Library | 33 (44.6%) | 41 (55.4%) |
| Arts, Media & Entertainment | 18 (100.0%) | 0 (0.0%) |
| Health Diagnosing & Treating | 7 (5.3%) | 126 (94.7%) |
| Health Technologists | 0 (0.0%) | 24 (100.0%) |
| Total (Category) | 237 (30.9%) | 529 (69.1%) |
| Total (Overall) | 2,084 (50.0%) | 2,081 (50.0%) |
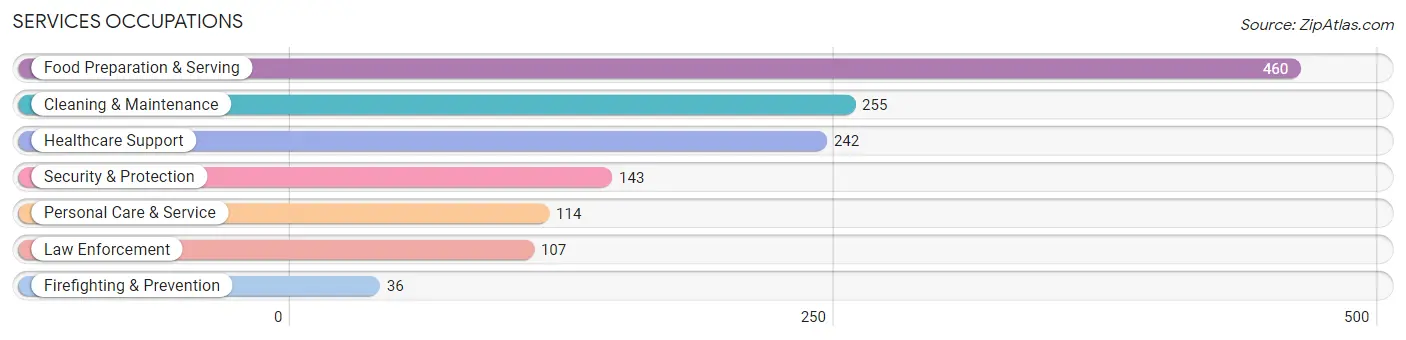
Services Occupations
The most common Services occupations in Freeport are Food Preparation & Serving (460 | 11.0%), Cleaning & Maintenance (255 | 6.1%), Healthcare Support (242 | 5.8%), Security & Protection (143 | 3.4%), and Personal Care & Service (114 | 2.7%).
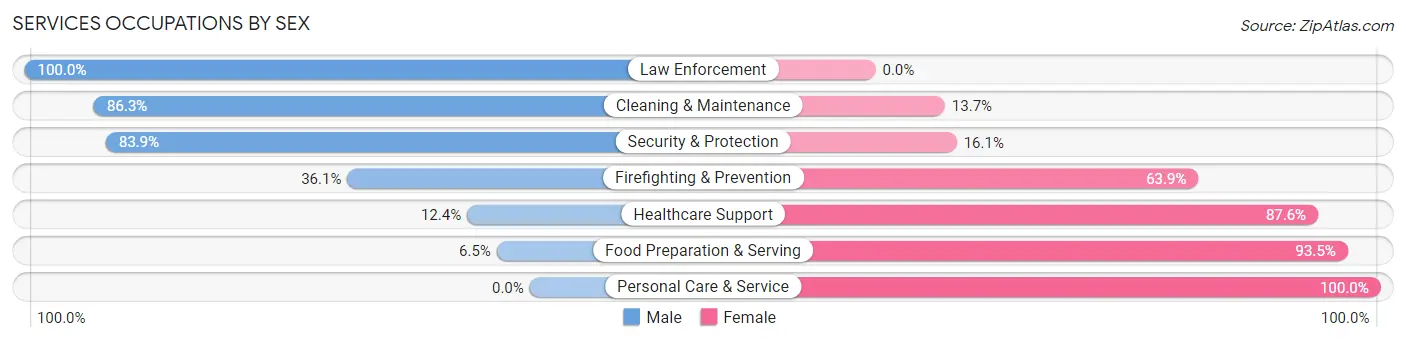
Services Occupations by Sex
Within the Services occupations in Freeport, the most male-oriented occupations are Law Enforcement (100.0%), Cleaning & Maintenance (86.3%), and Security & Protection (83.9%), while the most female-oriented occupations are Personal Care & Service (100.0%), Food Preparation & Serving (93.5%), and Healthcare Support (87.6%).
| Occupation | Male | Female |
| Healthcare Support | 30 (12.4%) | 212 (87.6%) |
| Security & Protection | 120 (83.9%) | 23 (16.1%) |
| Firefighting & Prevention | 13 (36.1%) | 23 (63.9%) |
| Law Enforcement | 107 (100.0%) | 0 (0.0%) |
| Food Preparation & Serving | 30 (6.5%) | 430 (93.5%) |
| Cleaning & Maintenance | 220 (86.3%) | 35 (13.7%) |
| Personal Care & Service | 0 (0.0%) | 114 (100.0%) |
| Total (Category) | 400 (33.0%) | 814 (67.0%) |
| Total (Overall) | 2,084 (50.0%) | 2,081 (50.0%) |
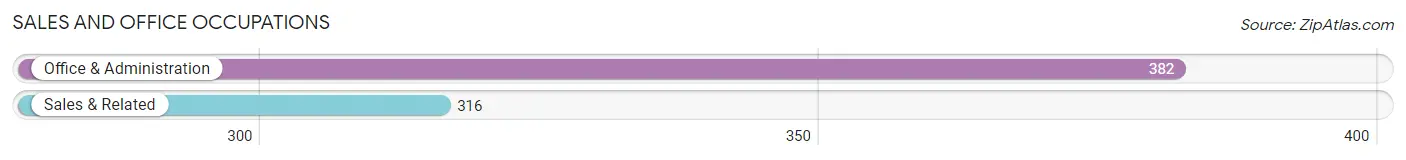
Sales and Office Occupations
The most common Sales and Office occupations in Freeport are Office & Administration (382 | 9.2%), and Sales & Related (316 | 7.6%).
Sales and Office Occupations by Sex
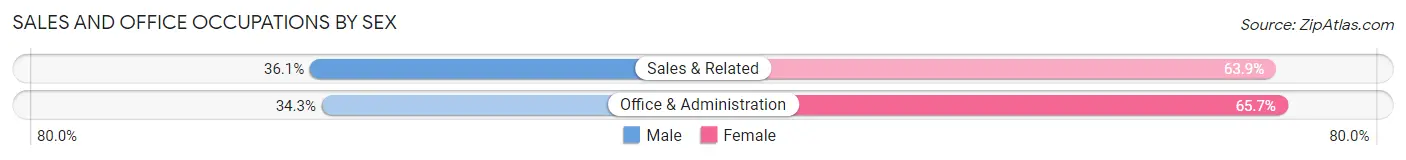
| Occupation | Male | Female |
| Sales & Related | 114 (36.1%) | 202 (63.9%) |
| Office & Administration | 131 (34.3%) | 251 (65.7%) |
| Total (Category) | 245 (35.1%) | 453 (64.9%) |
| Total (Overall) | 2,084 (50.0%) | 2,081 (50.0%) |
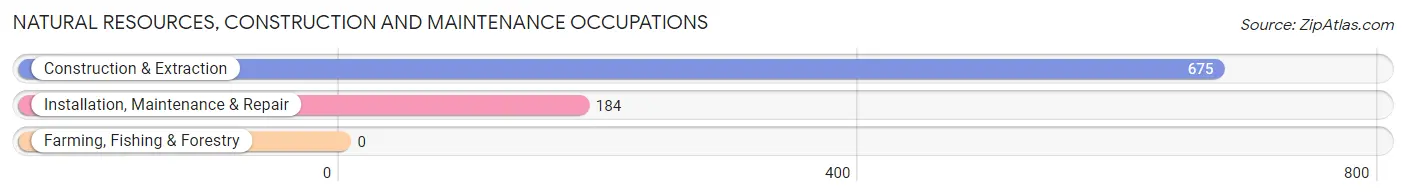
Natural Resources, Construction and Maintenance Occupations
The most common Natural Resources, Construction and Maintenance occupations in Freeport are Construction & Extraction (675 | 16.2%), and Installation, Maintenance & Repair (184 | 4.4%).
Natural Resources, Construction and Maintenance Occupations by Sex
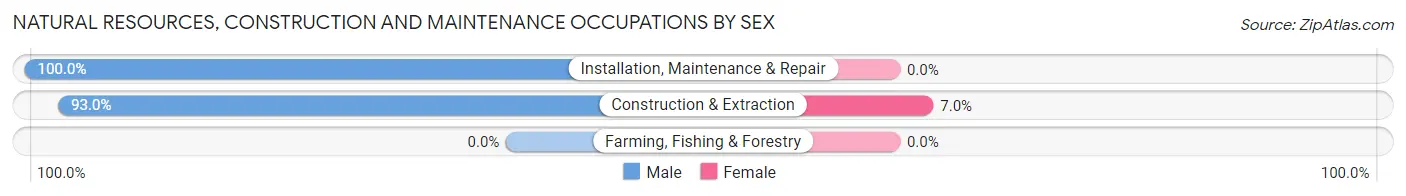
| Occupation | Male | Female |
| Farming, Fishing & Forestry | 0 (0.0%) | 0 (0.0%) |
| Construction & Extraction | 628 (93.0%) | 47 (7.0%) |
| Installation, Maintenance & Repair | 184 (100.0%) | 0 (0.0%) |
| Total (Category) | 812 (94.5%) | 47 (5.5%) |
| Total (Overall) | 2,084 (50.0%) | 2,081 (50.0%) |
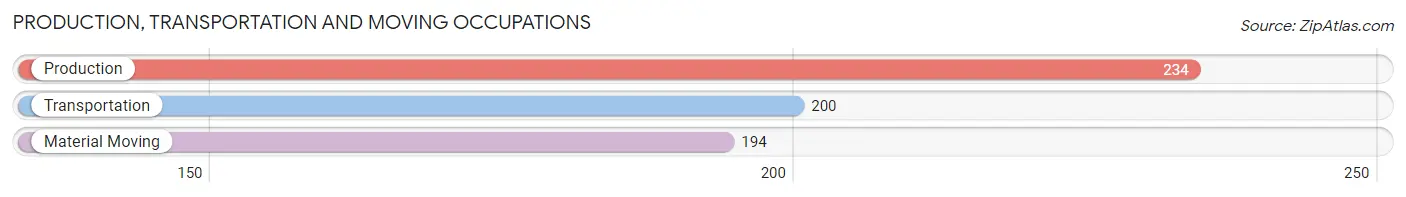
Production, Transportation and Moving Occupations
The most common Production, Transportation and Moving occupations in Freeport are Production (234 | 5.6%), Transportation (200 | 4.8%), and Material Moving (194 | 4.7%).
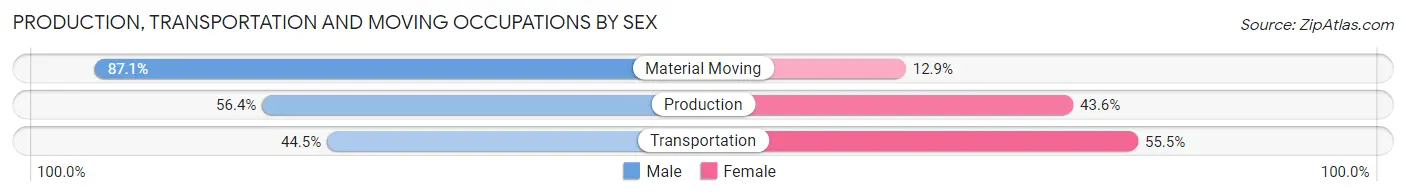
Production, Transportation and Moving Occupations by Sex
| Occupation | Male | Female |
| Production | 132 (56.4%) | 102 (43.6%) |
| Transportation | 89 (44.5%) | 111 (55.5%) |
| Material Moving | 169 (87.1%) | 25 (12.9%) |
| Total (Category) | 390 (62.1%) | 238 (37.9%) |
| Total (Overall) | 2,084 (50.0%) | 2,081 (50.0%) |
Employment Industries by Sex in Freeport
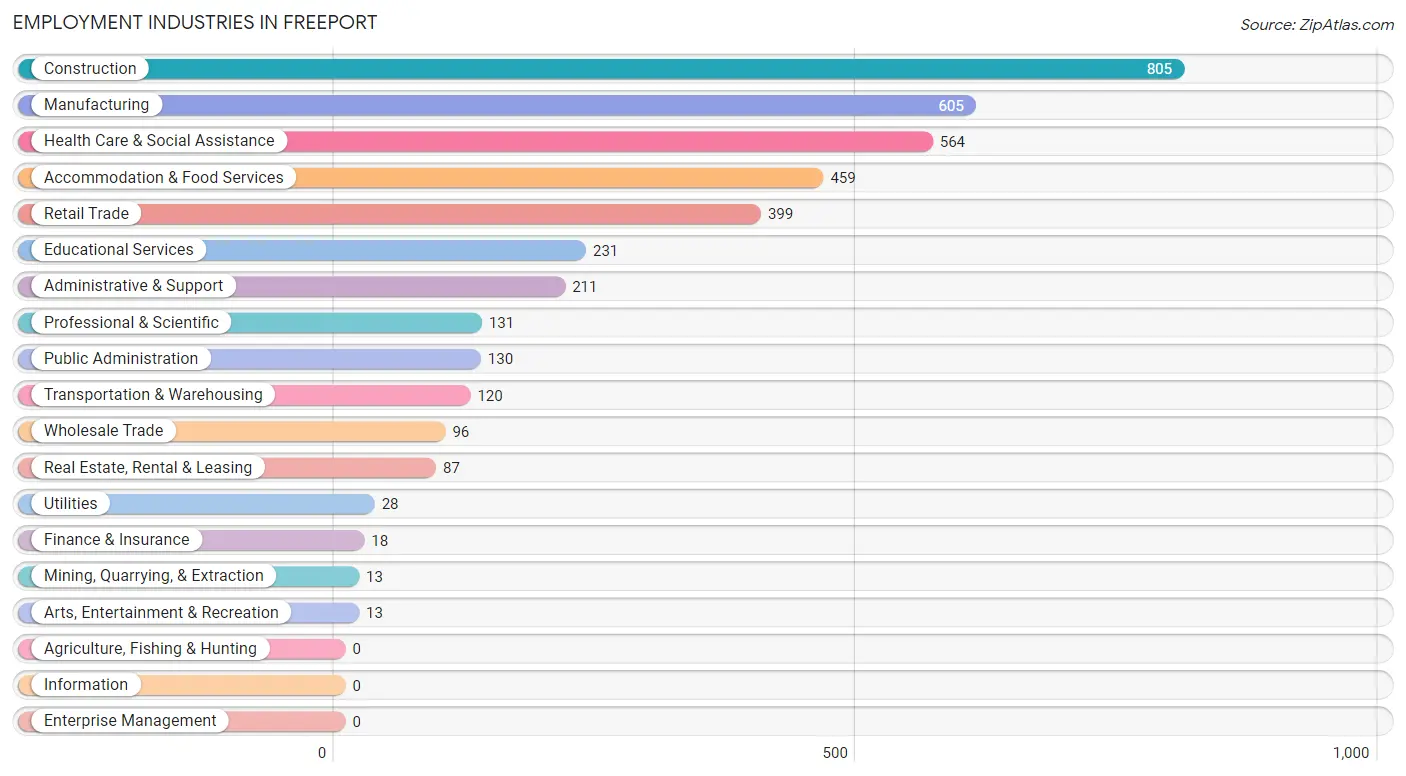
Employment Industries in Freeport
The major employment industries in Freeport include Construction (805 | 19.3%), Manufacturing (605 | 14.5%), Health Care & Social Assistance (564 | 13.5%), Accommodation & Food Services (459 | 11.0%), and Retail Trade (399 | 9.6%).
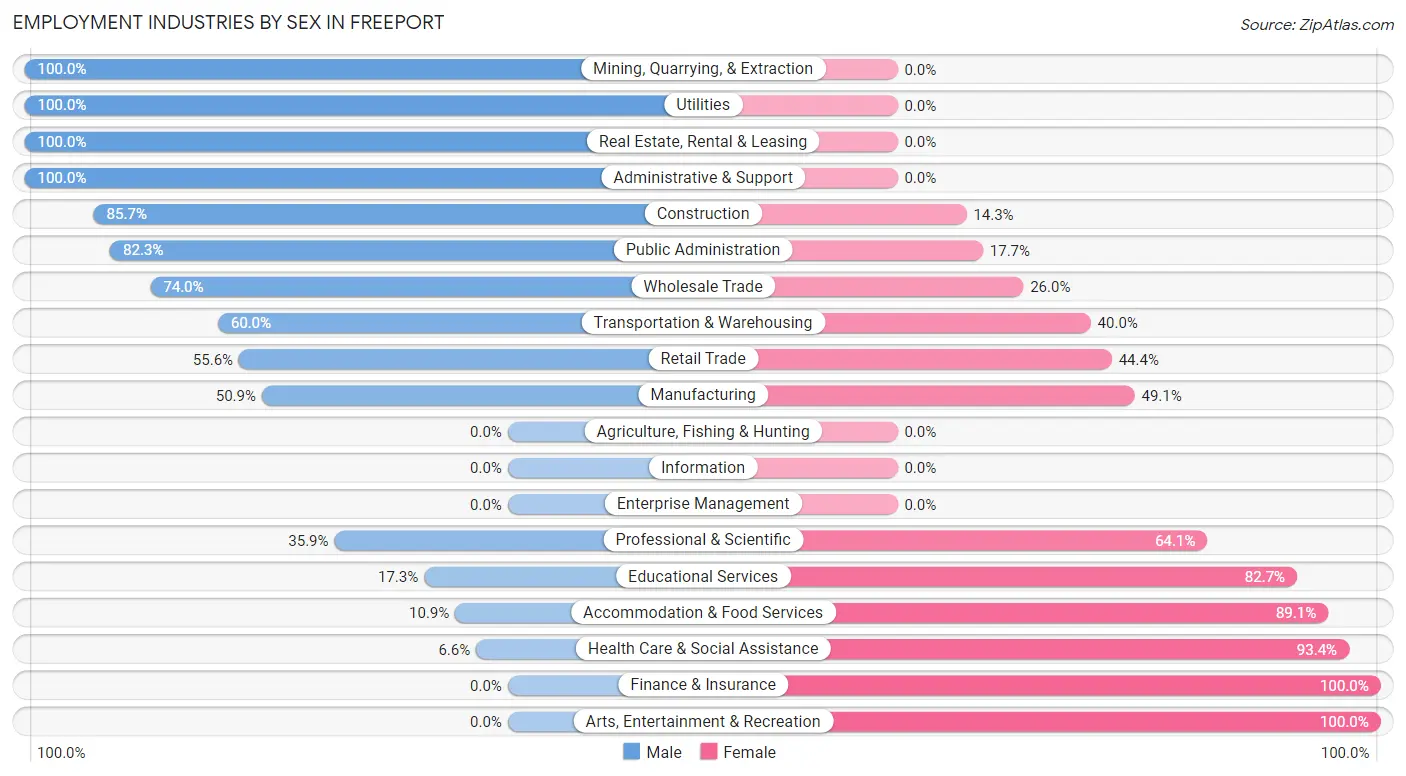
Employment Industries by Sex in Freeport
The Freeport industries that see more men than women are Mining, Quarrying, & Extraction (100.0%), Utilities (100.0%), and Real Estate, Rental & Leasing (100.0%), whereas the industries that tend to have a higher number of women are Finance & Insurance (100.0%), Arts, Entertainment & Recreation (100.0%), and Health Care & Social Assistance (93.4%).
| Industry | Male | Female |
| Agriculture, Fishing & Hunting | 0 (0.0%) | 0 (0.0%) |
| Mining, Quarrying, & Extraction | 13 (100.0%) | 0 (0.0%) |
| Construction | 690 (85.7%) | 115 (14.3%) |
| Manufacturing | 308 (50.9%) | 297 (49.1%) |
| Wholesale Trade | 71 (74.0%) | 25 (26.0%) |
| Retail Trade | 222 (55.6%) | 177 (44.4%) |
| Transportation & Warehousing | 72 (60.0%) | 48 (40.0%) |
| Utilities | 28 (100.0%) | 0 (0.0%) |
| Information | 0 (0.0%) | 0 (0.0%) |
| Finance & Insurance | 0 (0.0%) | 18 (100.0%) |
| Real Estate, Rental & Leasing | 87 (100.0%) | 0 (0.0%) |
| Professional & Scientific | 47 (35.9%) | 84 (64.1%) |
| Enterprise Management | 0 (0.0%) | 0 (0.0%) |
| Administrative & Support | 211 (100.0%) | 0 (0.0%) |
| Educational Services | 40 (17.3%) | 191 (82.7%) |
| Health Care & Social Assistance | 37 (6.6%) | 527 (93.4%) |
| Arts, Entertainment & Recreation | 0 (0.0%) | 13 (100.0%) |
| Accommodation & Food Services | 50 (10.9%) | 409 (89.1%) |
| Public Administration | 107 (82.3%) | 23 (17.7%) |
| Total | 2,084 (50.0%) | 2,081 (50.0%) |
Education in Freeport
School Enrollment in Freeport
The most common levels of schooling among the 2,859 students in Freeport are elementary school (736 | 25.7%), middle school (662 | 23.2%), and high school (573 | 20.0%).
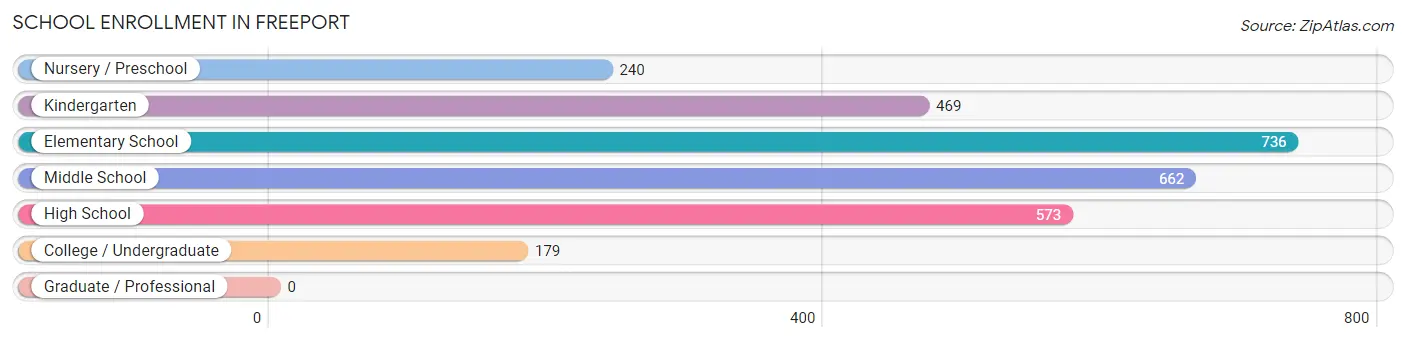
| School Level | # Students | % Students |
| Nursery / Preschool | 240 | 8.4% |
| Kindergarten | 469 | 16.4% |
| Elementary School | 736 | 25.7% |
| Middle School | 662 | 23.2% |
| High School | 573 | 20.0% |
| College / Undergraduate | 179 | 6.3% |
| Graduate / Professional | 0 | 0.0% |
| Total | 2,859 | 100.0% |
School Enrollment by Age by Funding Source in Freeport
Out of a total of 2,859 students who are enrolled in schools in Freeport, 54 (1.9%) attend a private institution, while the remaining 2,805 (98.1%) are enrolled in public schools. The age group of 20 to 24 year olds has the highest likelihood of being enrolled in private schools, with 52 (88.1% in the age bracket) enrolled. Conversely, the age group of 3 to 4 year olds has the lowest likelihood of being enrolled in a private school, with 161 (100.0% in the age bracket) attending a public institution.
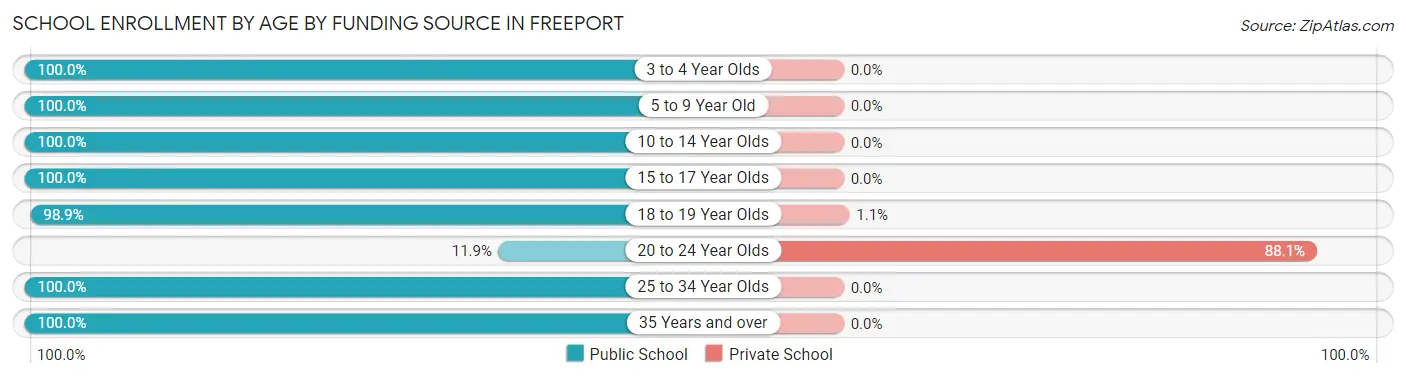
| Age Bracket | Public School | Private School |
| 3 to 4 Year Olds | 161 (100.0%) | 0 (0.0%) |
| 5 to 9 Year Old | 1,178 (100.0%) | 0 (0.0%) |
| 10 to 14 Year Olds | 816 (100.0%) | 0 (0.0%) |
| 15 to 17 Year Olds | 483 (100.0%) | 0 (0.0%) |
| 18 to 19 Year Olds | 93 (98.9%) | 1 (1.1%) |
| 20 to 24 Year Olds | 7 (11.9%) | 52 (88.1%) |
| 25 to 34 Year Olds | 61 (100.0%) | 0 (0.0%) |
| 35 Years and over | 7 (100.0%) | 0 (0.0%) |
| Total | 2,805 (98.1%) | 54 (1.9%) |
Educational Attainment by Field of Study in Freeport
Business (113 | 27.0%), physical & health sciences (64 | 15.3%), communications (64 | 15.3%), education (56 | 13.4%), and social sciences (41 | 9.8%) are the most common fields of study among 419 individuals in Freeport who have obtained a bachelor's degree or higher.
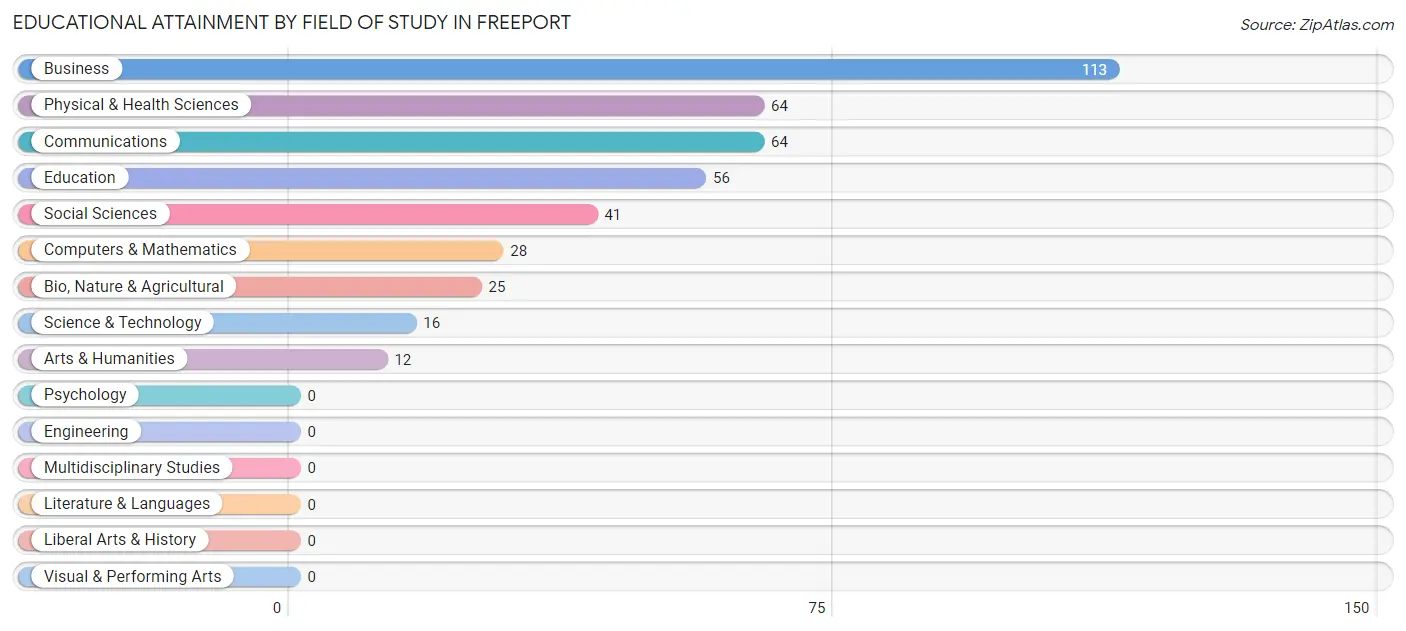
| Field of Study | # Graduates | % Graduates |
| Computers & Mathematics | 28 | 6.7% |
| Bio, Nature & Agricultural | 25 | 6.0% |
| Physical & Health Sciences | 64 | 15.3% |
| Psychology | 0 | 0.0% |
| Social Sciences | 41 | 9.8% |
| Engineering | 0 | 0.0% |
| Multidisciplinary Studies | 0 | 0.0% |
| Science & Technology | 16 | 3.8% |
| Business | 113 | 27.0% |
| Education | 56 | 13.4% |
| Literature & Languages | 0 | 0.0% |
| Liberal Arts & History | 0 | 0.0% |
| Visual & Performing Arts | 0 | 0.0% |
| Communications | 64 | 15.3% |
| Arts & Humanities | 12 | 2.9% |
| Total | 419 | 100.0% |
Transportation & Commute in Freeport
Vehicle Availability by Sex in Freeport
The most prevalent vehicle ownership categories in Freeport are males with 2 vehicles (1,013, accounting for 49.0%) and females with 2 vehicles (941, making up 51.1%).
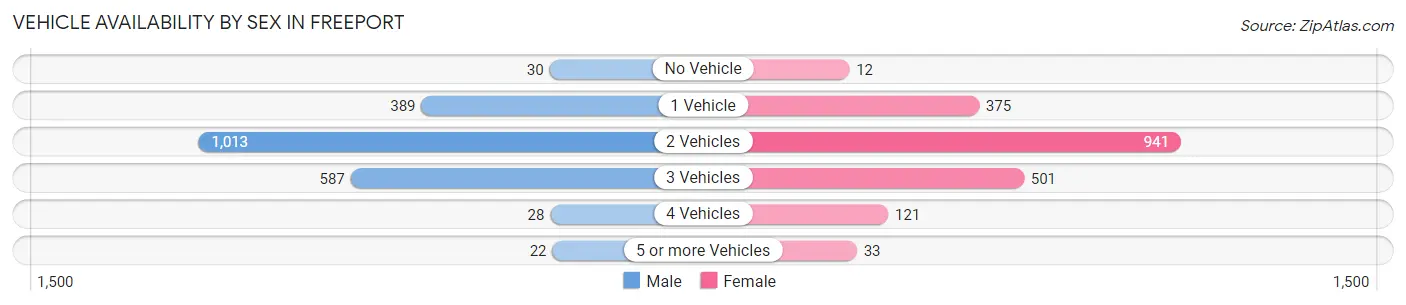
| Vehicles Available | Male | Female |
| No Vehicle | 30 (1.5%) | 12 (0.6%) |
| 1 Vehicle | 389 (18.8%) | 375 (18.9%) |
| 2 Vehicles | 1,013 (49.0%) | 941 (47.4%) |
| 3 Vehicles | 587 (28.4%) | 501 (25.3%) |
| 4 Vehicles | 28 (1.3%) | 121 (6.1%) |
| 5 or more Vehicles | 22 (1.1%) | 33 (1.7%) |
| Total | 2,069 (100.0%) | 1,983 (100.0%) |
Commute Time in Freeport
The most frequently occuring commute durations in Freeport are 10 to 14 minutes (755 commuters, 18.8%), 15 to 19 minutes (635 commuters, 15.8%), and 20 to 24 minutes (530 commuters, 13.2%).
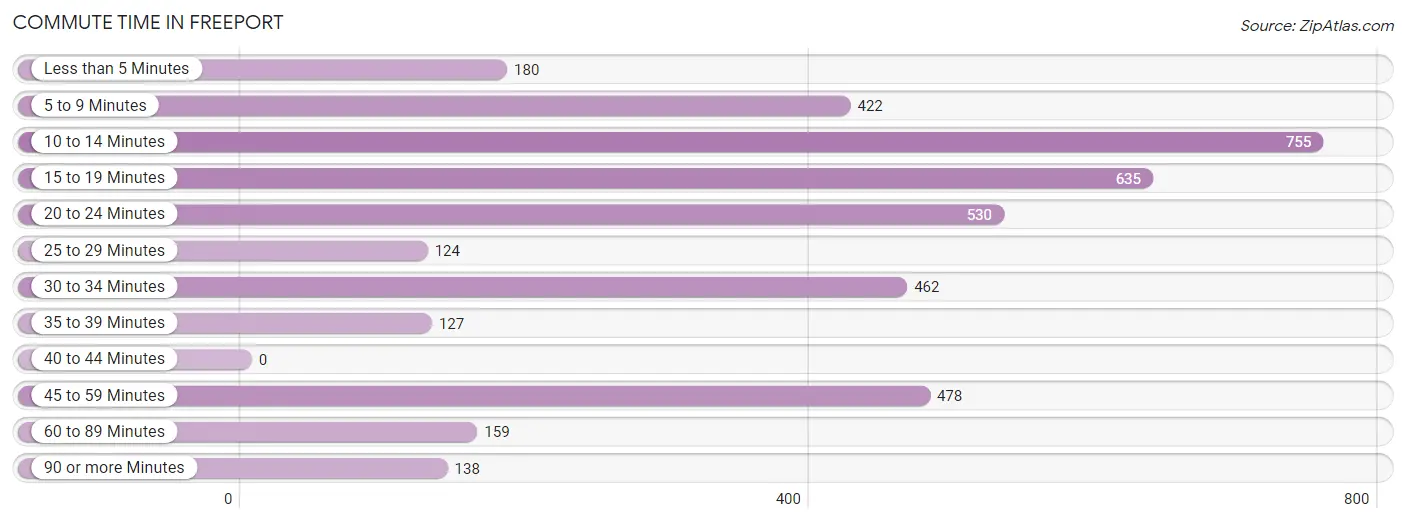
| Commute Time | # Commuters | % Commuters |
| Less than 5 Minutes | 180 | 4.5% |
| 5 to 9 Minutes | 422 | 10.5% |
| 10 to 14 Minutes | 755 | 18.8% |
| 15 to 19 Minutes | 635 | 15.8% |
| 20 to 24 Minutes | 530 | 13.2% |
| 25 to 29 Minutes | 124 | 3.1% |
| 30 to 34 Minutes | 462 | 11.5% |
| 35 to 39 Minutes | 127 | 3.2% |
| 40 to 44 Minutes | 0 | 0.0% |
| 45 to 59 Minutes | 478 | 11.9% |
| 60 to 89 Minutes | 159 | 4.0% |
| 90 or more Minutes | 138 | 3.4% |
Commute Time by Sex in Freeport
The most common commute times in Freeport are 45 to 59 minutes (458 commuters, 22.4%) for males and 10 to 14 minutes (406 commuters, 20.6%) for females.
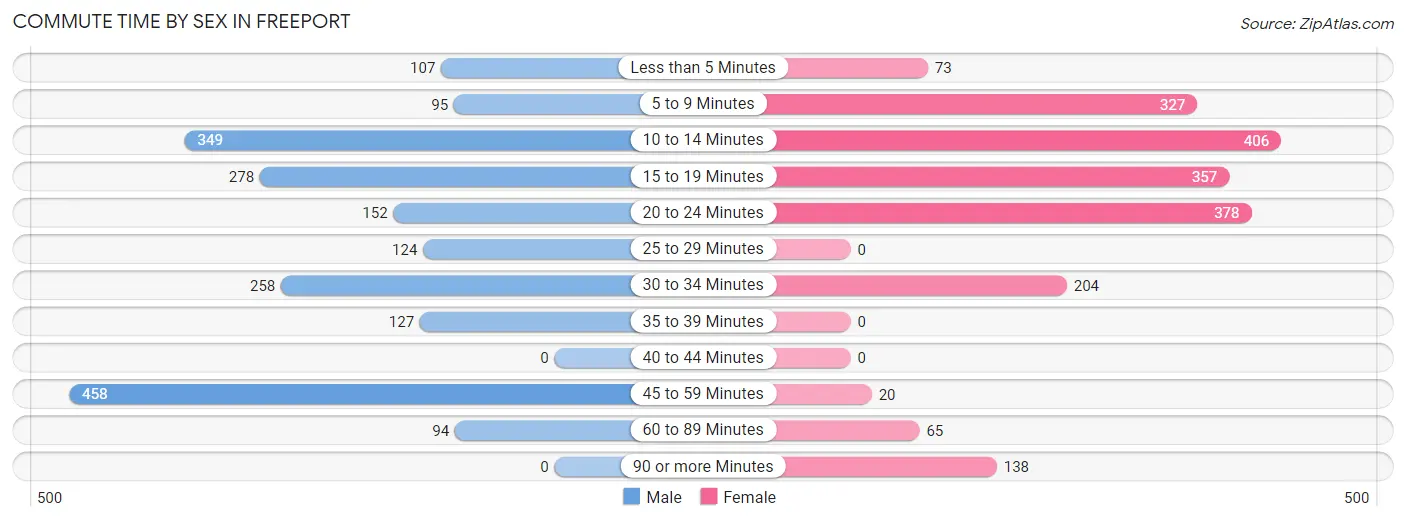
| Commute Time | Male | Female |
| Less than 5 Minutes | 107 (5.2%) | 73 (3.7%) |
| 5 to 9 Minutes | 95 (4.6%) | 327 (16.6%) |
| 10 to 14 Minutes | 349 (17.1%) | 406 (20.6%) |
| 15 to 19 Minutes | 278 (13.6%) | 357 (18.1%) |
| 20 to 24 Minutes | 152 (7.4%) | 378 (19.2%) |
| 25 to 29 Minutes | 124 (6.1%) | 0 (0.0%) |
| 30 to 34 Minutes | 258 (12.6%) | 204 (10.4%) |
| 35 to 39 Minutes | 127 (6.2%) | 0 (0.0%) |
| 40 to 44 Minutes | 0 (0.0%) | 0 (0.0%) |
| 45 to 59 Minutes | 458 (22.4%) | 20 (1.0%) |
| 60 to 89 Minutes | 94 (4.6%) | 65 (3.3%) |
| 90 or more Minutes | 0 (0.0%) | 138 (7.0%) |
Time of Departure to Work by Sex in Freeport
The most frequent times of departure to work in Freeport are 12:00 AM to 4:59 AM (380, 18.6%) for males and 12:00 AM to 4:59 AM (378, 19.2%) for females.
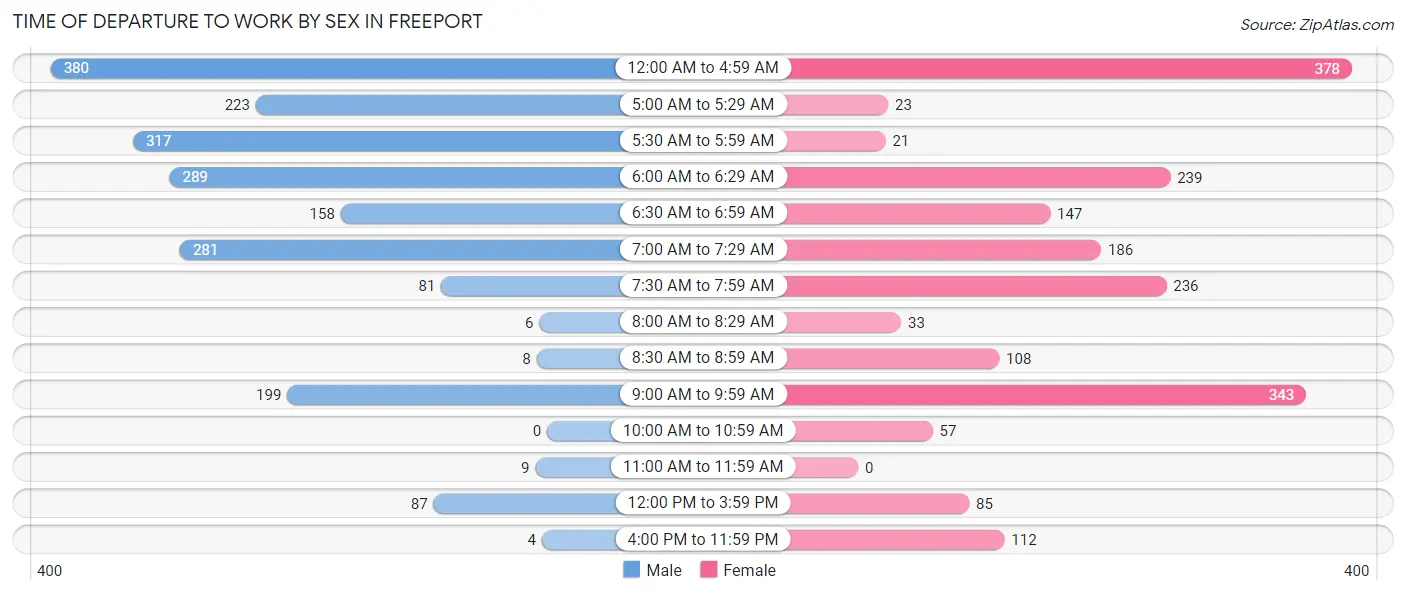
| Time of Departure | Male | Female |
| 12:00 AM to 4:59 AM | 380 (18.6%) | 378 (19.2%) |
| 5:00 AM to 5:29 AM | 223 (10.9%) | 23 (1.2%) |
| 5:30 AM to 5:59 AM | 317 (15.5%) | 21 (1.1%) |
| 6:00 AM to 6:29 AM | 289 (14.1%) | 239 (12.1%) |
| 6:30 AM to 6:59 AM | 158 (7.7%) | 147 (7.5%) |
| 7:00 AM to 7:29 AM | 281 (13.8%) | 186 (9.5%) |
| 7:30 AM to 7:59 AM | 81 (4.0%) | 236 (12.0%) |
| 8:00 AM to 8:29 AM | 6 (0.3%) | 33 (1.7%) |
| 8:30 AM to 8:59 AM | 8 (0.4%) | 108 (5.5%) |
| 9:00 AM to 9:59 AM | 199 (9.8%) | 343 (17.4%) |
| 10:00 AM to 10:59 AM | 0 (0.0%) | 57 (2.9%) |
| 11:00 AM to 11:59 AM | 9 (0.4%) | 0 (0.0%) |
| 12:00 PM to 3:59 PM | 87 (4.3%) | 85 (4.3%) |
| 4:00 PM to 11:59 PM | 4 (0.2%) | 112 (5.7%) |
| Total | 2,042 (100.0%) | 1,968 (100.0%) |
Housing Occupancy in Freeport
Occupancy by Ownership in Freeport
Of the total 4,019 dwellings in Freeport, owner-occupied units account for 2,332 (58.0%), while renter-occupied units make up 1,687 (42.0%).
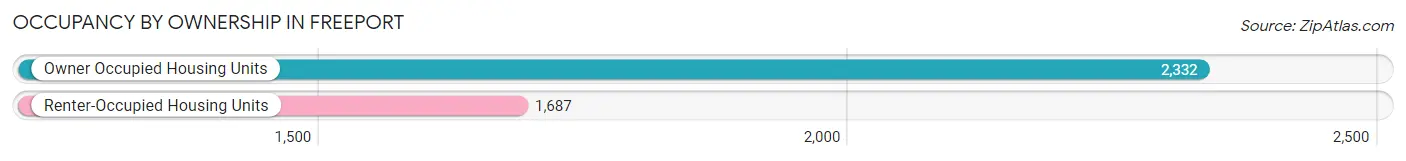
| Occupancy | # Housing Units | % Housing Units |
| Owner Occupied Housing Units | 2,332 | 58.0% |
| Renter-Occupied Housing Units | 1,687 | 42.0% |
| Total Occupied Housing Units | 4,019 | 100.0% |
Occupancy by Household Size in Freeport
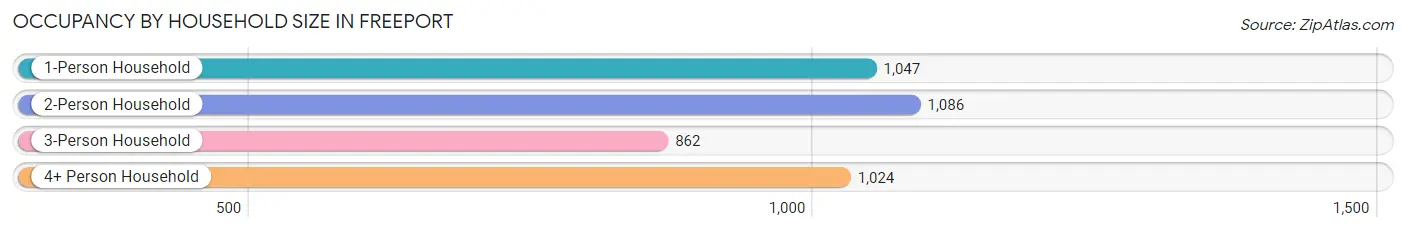
| Household Size | # Housing Units | % Housing Units |
| 1-Person Household | 1,047 | 26.1% |
| 2-Person Household | 1,086 | 27.0% |
| 3-Person Household | 862 | 21.4% |
| 4+ Person Household | 1,024 | 25.5% |
| Total Housing Units | 4,019 | 100.0% |
Occupancy by Ownership by Household Size in Freeport
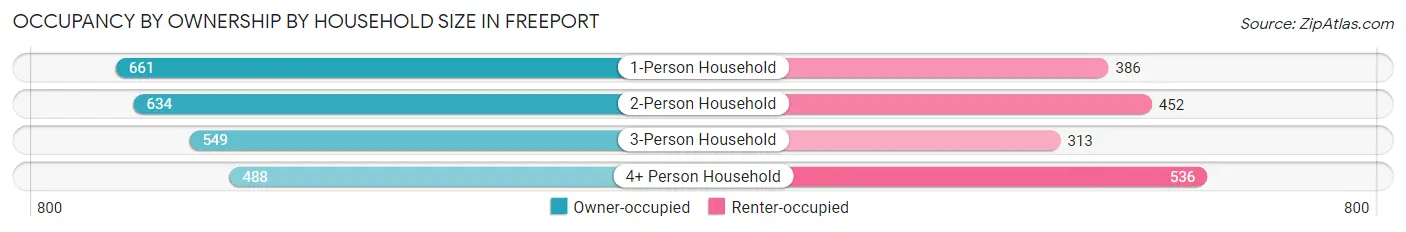
| Household Size | Owner-occupied | Renter-occupied |
| 1-Person Household | 661 (63.1%) | 386 (36.9%) |
| 2-Person Household | 634 (58.4%) | 452 (41.6%) |
| 3-Person Household | 549 (63.7%) | 313 (36.3%) |
| 4+ Person Household | 488 (47.7%) | 536 (52.3%) |
| Total Housing Units | 2,332 (58.0%) | 1,687 (42.0%) |
Occupancy by Educational Attainment in Freeport
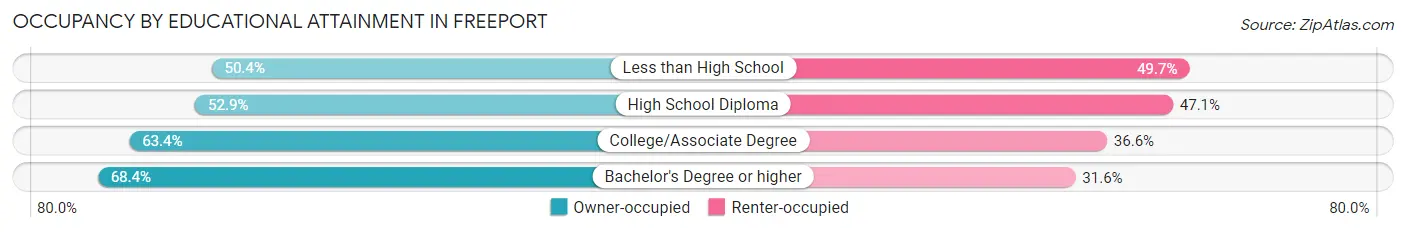
| Household Size | Owner-occupied | Renter-occupied |
| Less than High School | 284 (50.3%) | 280 (49.6%) |
| High School Diploma | 784 (52.9%) | 697 (47.1%) |
| College/Associate Degree | 1,093 (63.4%) | 631 (36.6%) |
| Bachelor's Degree or higher | 171 (68.4%) | 79 (31.6%) |
Occupancy by Age of Householder in Freeport
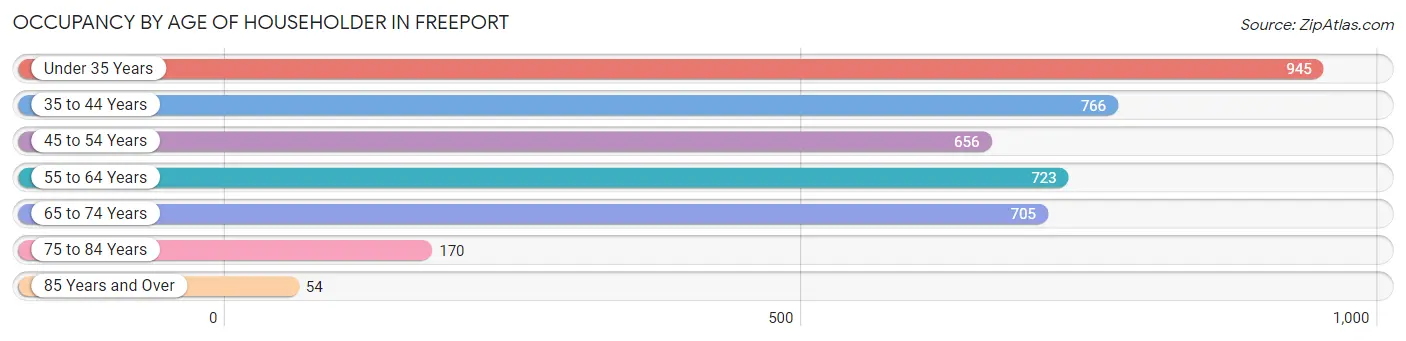
| Age Bracket | # Households | % Households |
| Under 35 Years | 945 | 23.5% |
| 35 to 44 Years | 766 | 19.1% |
| 45 to 54 Years | 656 | 16.3% |
| 55 to 64 Years | 723 | 18.0% |
| 65 to 74 Years | 705 | 17.5% |
| 75 to 84 Years | 170 | 4.2% |
| 85 Years and Over | 54 | 1.3% |
| Total | 4,019 | 100.0% |
Housing Finances in Freeport
Median Income by Occupancy in Freeport
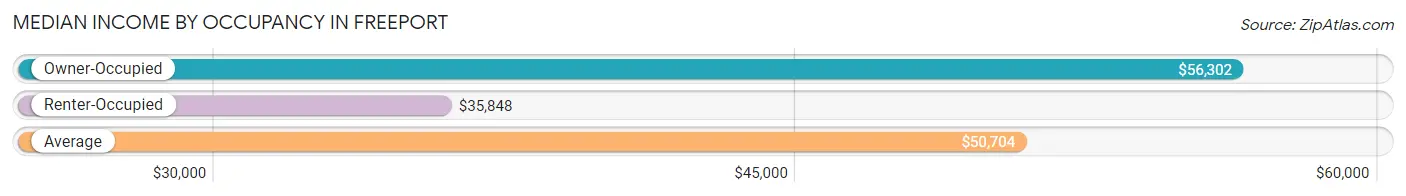
| Occupancy Type | # Households | Median Income |
| Owner-Occupied | 2,332 (58.0%) | $56,302 |
| Renter-Occupied | 1,687 (42.0%) | $35,848 |
| Average | 4,019 (100.0%) | $50,704 |
Occupancy by Householder Income Bracket in Freeport
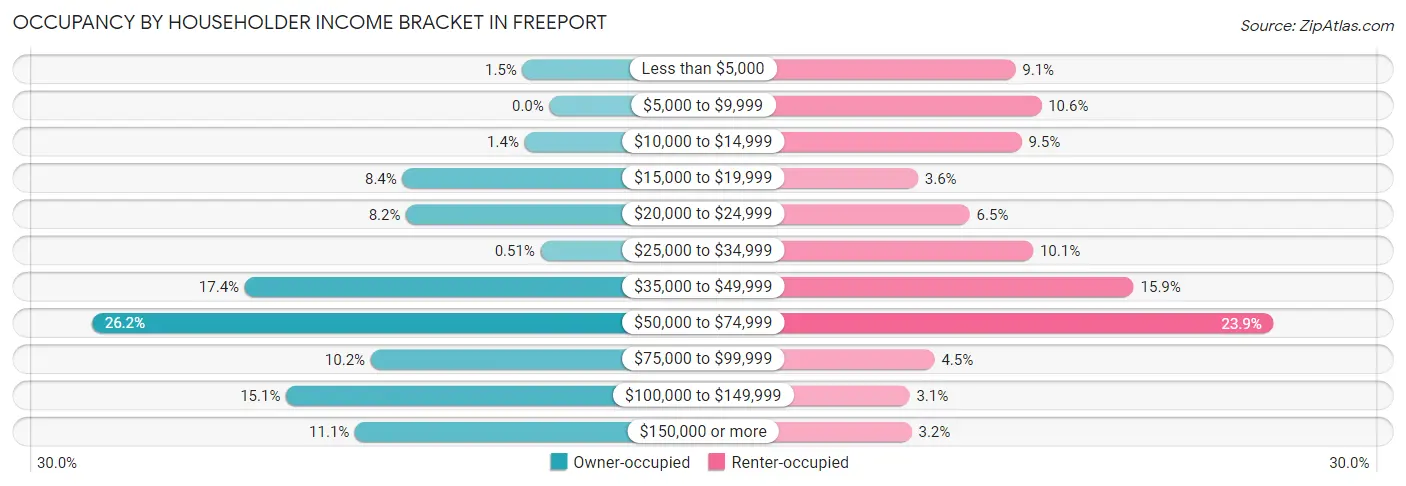
| Income Bracket | Owner-occupied | Renter-occupied |
| Less than $5,000 | 36 (1.5%) | 154 (9.1%) |
| $5,000 to $9,999 | 0 (0.0%) | 179 (10.6%) |
| $10,000 to $14,999 | 33 (1.4%) | 160 (9.5%) |
| $15,000 to $19,999 | 196 (8.4%) | 60 (3.6%) |
| $20,000 to $24,999 | 191 (8.2%) | 110 (6.5%) |
| $25,000 to $34,999 | 12 (0.5%) | 171 (10.1%) |
| $35,000 to $49,999 | 406 (17.4%) | 268 (15.9%) |
| $50,000 to $74,999 | 610 (26.2%) | 403 (23.9%) |
| $75,000 to $99,999 | 238 (10.2%) | 76 (4.5%) |
| $100,000 to $149,999 | 351 (15.0%) | 52 (3.1%) |
| $150,000 or more | 259 (11.1%) | 54 (3.2%) |
| Total | 2,332 (100.0%) | 1,687 (100.0%) |
Monthly Housing Cost Tiers in Freeport
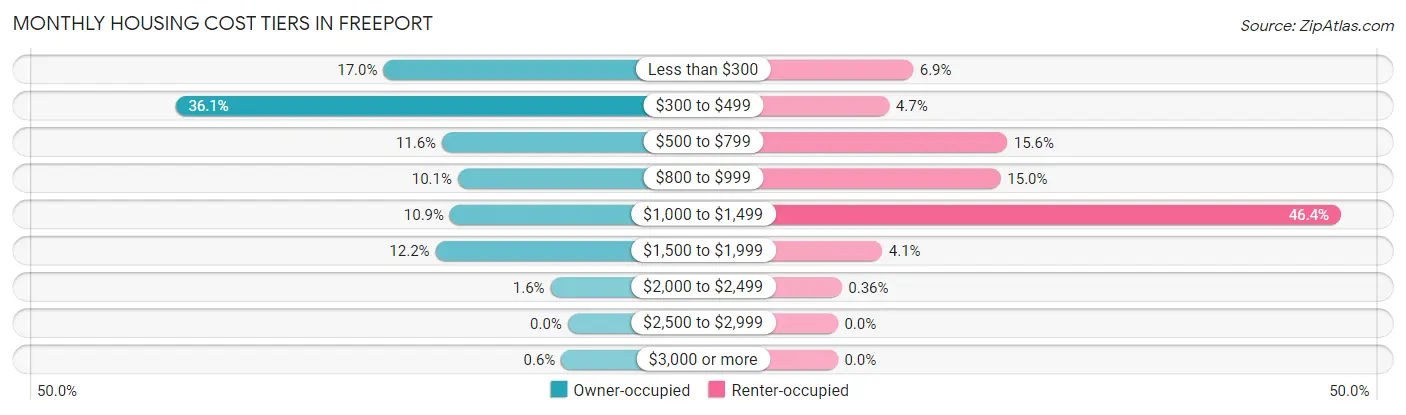
| Monthly Cost | Owner-occupied | Renter-occupied |
| Less than $300 | 396 (17.0%) | 117 (6.9%) |
| $300 to $499 | 842 (36.1%) | 80 (4.7%) |
| $500 to $799 | 270 (11.6%) | 263 (15.6%) |
| $800 to $999 | 236 (10.1%) | 253 (15.0%) |
| $1,000 to $1,499 | 253 (10.8%) | 782 (46.4%) |
| $1,500 to $1,999 | 284 (12.2%) | 69 (4.1%) |
| $2,000 to $2,499 | 37 (1.6%) | 6 (0.4%) |
| $2,500 to $2,999 | 0 (0.0%) | 0 (0.0%) |
| $3,000 or more | 14 (0.6%) | 0 (0.0%) |
| Total | 2,332 (100.0%) | 1,687 (100.0%) |
Physical Housing Characteristics in Freeport
Housing Structures in Freeport
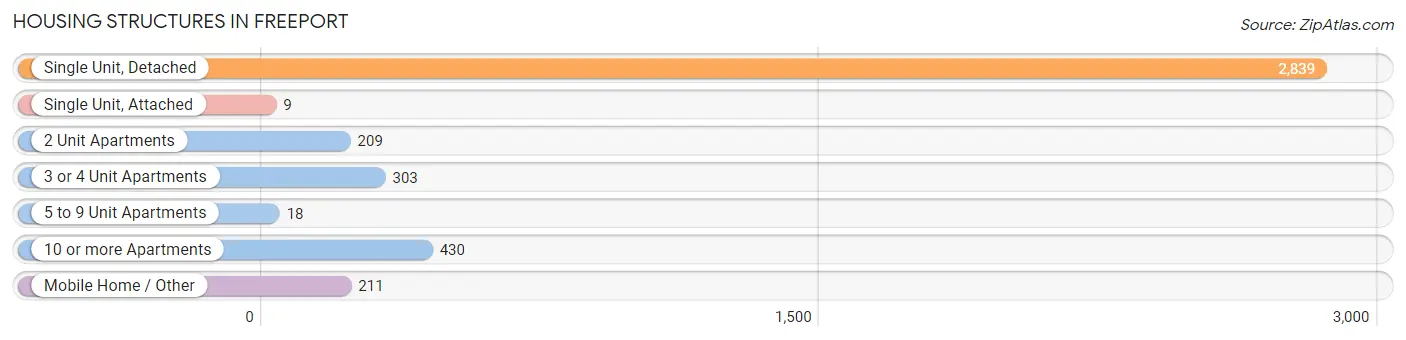
| Structure Type | # Housing Units | % Housing Units |
| Single Unit, Detached | 2,839 | 70.6% |
| Single Unit, Attached | 9 | 0.2% |
| 2 Unit Apartments | 209 | 5.2% |
| 3 or 4 Unit Apartments | 303 | 7.5% |
| 5 to 9 Unit Apartments | 18 | 0.4% |
| 10 or more Apartments | 430 | 10.7% |
| Mobile Home / Other | 211 | 5.2% |
| Total | 4,019 | 100.0% |
Housing Structures by Occupancy in Freeport
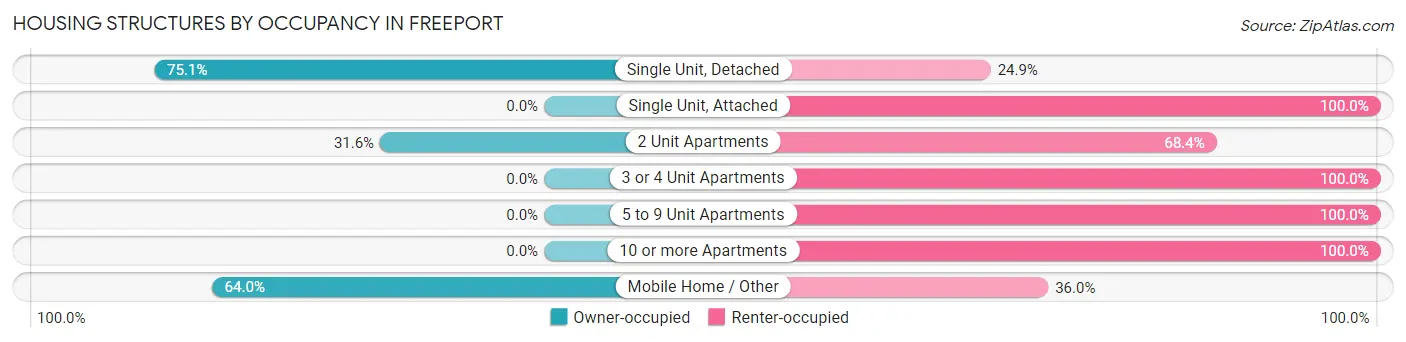
| Structure Type | Owner-occupied | Renter-occupied |
| Single Unit, Detached | 2,131 (75.1%) | 708 (24.9%) |
| Single Unit, Attached | 0 (0.0%) | 9 (100.0%) |
| 2 Unit Apartments | 66 (31.6%) | 143 (68.4%) |
| 3 or 4 Unit Apartments | 0 (0.0%) | 303 (100.0%) |
| 5 to 9 Unit Apartments | 0 (0.0%) | 18 (100.0%) |
| 10 or more Apartments | 0 (0.0%) | 430 (100.0%) |
| Mobile Home / Other | 135 (64.0%) | 76 (36.0%) |
| Total | 2,332 (58.0%) | 1,687 (42.0%) |
Housing Structures by Number of Rooms in Freeport
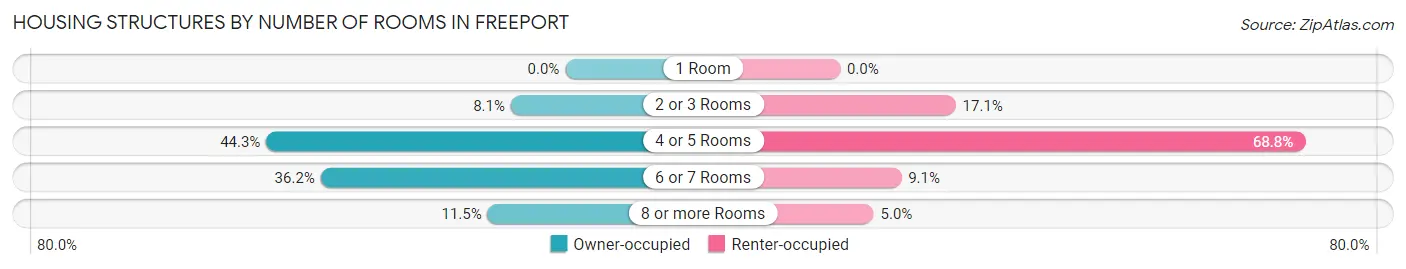
| Number of Rooms | Owner-occupied | Renter-occupied |
| 1 Room | 0 (0.0%) | 0 (0.0%) |
| 2 or 3 Rooms | 188 (8.1%) | 289 (17.1%) |
| 4 or 5 Rooms | 1,032 (44.3%) | 1,161 (68.8%) |
| 6 or 7 Rooms | 844 (36.2%) | 153 (9.1%) |
| 8 or more Rooms | 268 (11.5%) | 84 (5.0%) |
| Total | 2,332 (100.0%) | 1,687 (100.0%) |
Housing Structure by Heating Type in Freeport
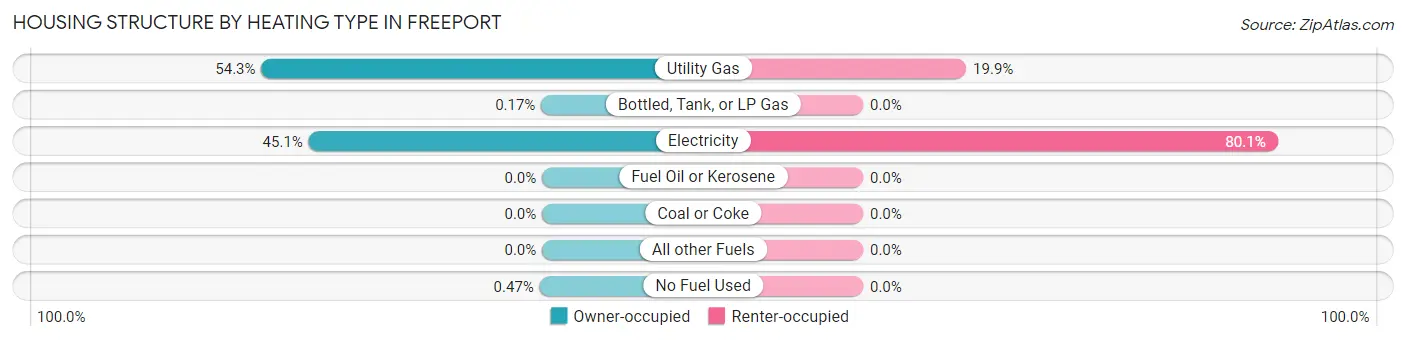
| Heating Type | Owner-occupied | Renter-occupied |
| Utility Gas | 1,265 (54.2%) | 336 (19.9%) |
| Bottled, Tank, or LP Gas | 4 (0.2%) | 0 (0.0%) |
| Electricity | 1,052 (45.1%) | 1,351 (80.1%) |
| Fuel Oil or Kerosene | 0 (0.0%) | 0 (0.0%) |
| Coal or Coke | 0 (0.0%) | 0 (0.0%) |
| All other Fuels | 0 (0.0%) | 0 (0.0%) |
| No Fuel Used | 11 (0.5%) | 0 (0.0%) |
| Total | 2,332 (100.0%) | 1,687 (100.0%) |
Household Vehicle Usage in Freeport
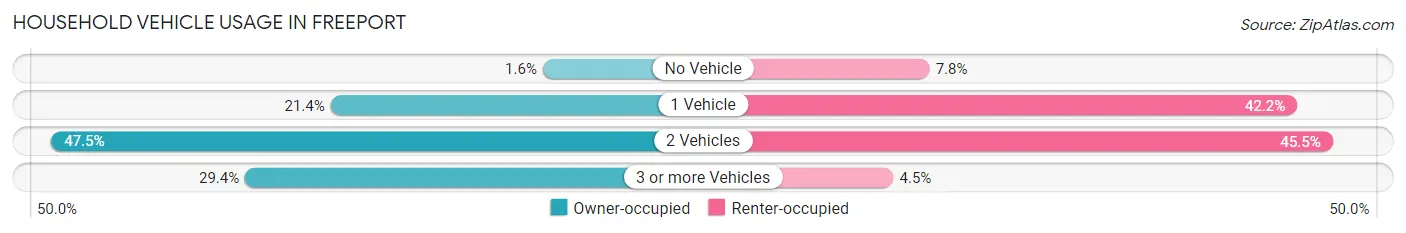
| Vehicles per Household | Owner-occupied | Renter-occupied |
| No Vehicle | 38 (1.6%) | 132 (7.8%) |
| 1 Vehicle | 500 (21.4%) | 712 (42.2%) |
| 2 Vehicles | 1,108 (47.5%) | 768 (45.5%) |
| 3 or more Vehicles | 686 (29.4%) | 75 (4.4%) |
| Total | 2,332 (100.0%) | 1,687 (100.0%) |
Real Estate & Mortgages in Freeport
Real Estate and Mortgage Overview in Freeport
| Characteristic | Without Mortgage | With Mortgage |
| Housing Units | 1,692 | 640 |
| Median Property Value | $98,700 | $185,800 |
| Median Household Income | $55,791 | $166 |
| Monthly Housing Costs | $413 | $14 |
| Real Estate Taxes | $880 | $24 |
Property Value by Mortgage Status in Freeport
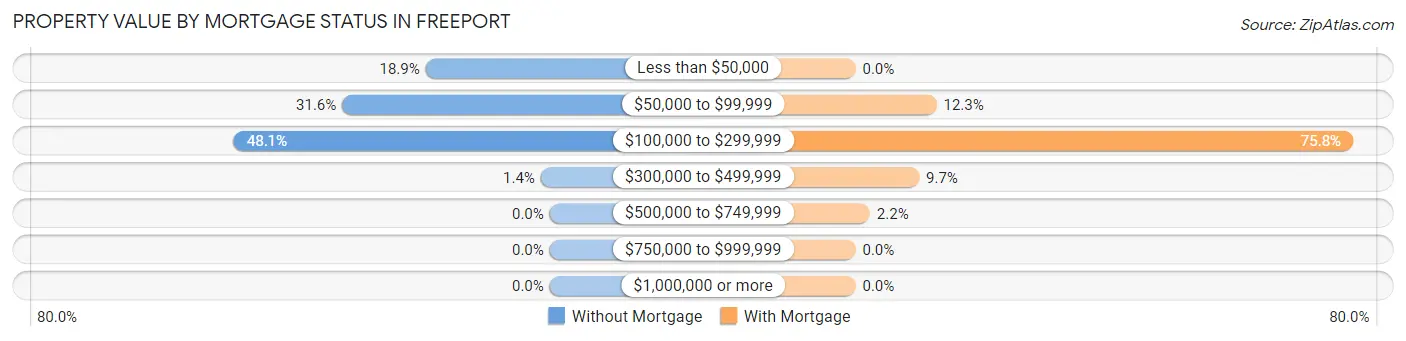
| Property Value | Without Mortgage | With Mortgage |
| Less than $50,000 | 320 (18.9%) | 0 (0.0%) |
| $50,000 to $99,999 | 535 (31.6%) | 79 (12.3%) |
| $100,000 to $299,999 | 814 (48.1%) | 485 (75.8%) |
| $300,000 to $499,999 | 23 (1.4%) | 62 (9.7%) |
| $500,000 to $749,999 | 0 (0.0%) | 14 (2.2%) |
| $750,000 to $999,999 | 0 (0.0%) | 0 (0.0%) |
| $1,000,000 or more | 0 (0.0%) | 0 (0.0%) |
| Total | 1,692 (100.0%) | 640 (100.0%) |
Household Income by Mortgage Status in Freeport
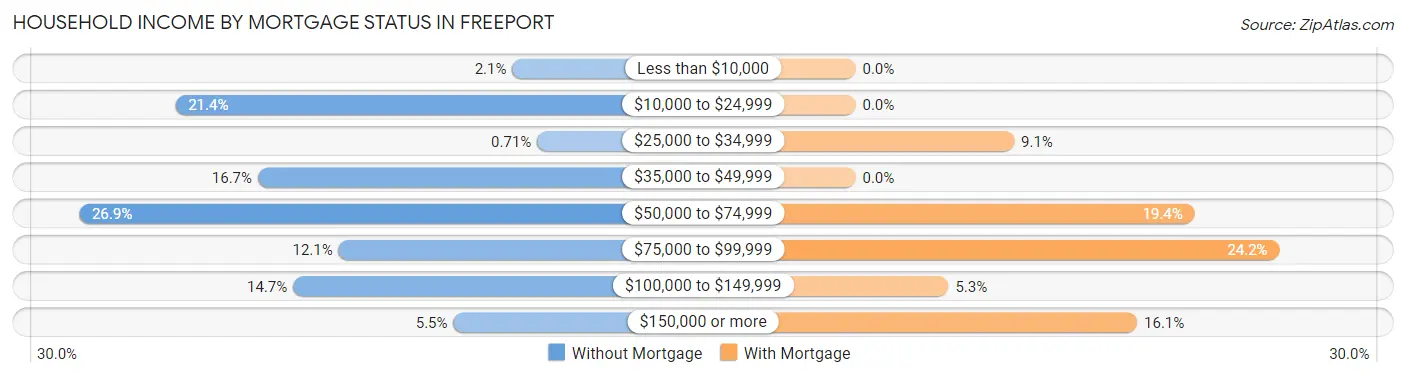
| Household Income | Without Mortgage | With Mortgage |
| Less than $10,000 | 36 (2.1%) | 0 (0.0%) |
| $10,000 to $24,999 | 362 (21.4%) | 0 (0.0%) |
| $25,000 to $34,999 | 12 (0.7%) | 58 (9.1%) |
| $35,000 to $49,999 | 282 (16.7%) | 0 (0.0%) |
| $50,000 to $74,999 | 455 (26.9%) | 124 (19.4%) |
| $75,000 to $99,999 | 204 (12.1%) | 155 (24.2%) |
| $100,000 to $149,999 | 248 (14.7%) | 34 (5.3%) |
| $150,000 or more | 93 (5.5%) | 103 (16.1%) |
| Total | 1,692 (100.0%) | 640 (100.0%) |
Property Value to Household Income Ratio in Freeport
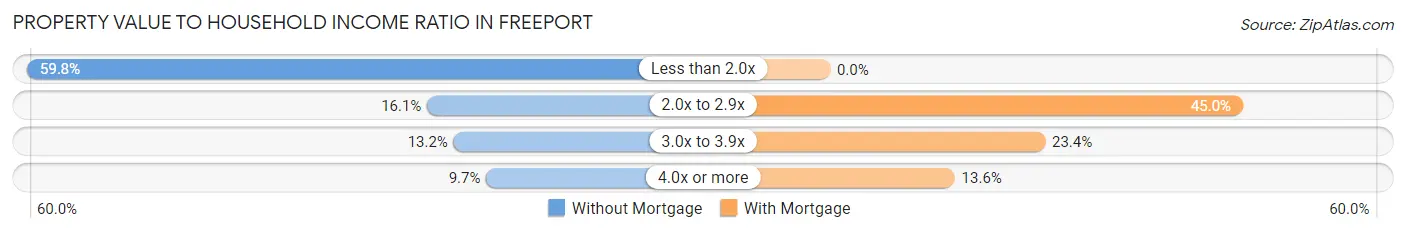
| Value-to-Income Ratio | Without Mortgage | With Mortgage |
| Less than 2.0x | 1,011 (59.8%) | 0 (0.0%) |
| 2.0x to 2.9x | 273 (16.1%) | 288 (45.0%) |
| 3.0x to 3.9x | 224 (13.2%) | 150 (23.4%) |
| 4.0x or more | 164 (9.7%) | 87 (13.6%) |
| Total | 1,692 (100.0%) | 640 (100.0%) |
Real Estate Taxes by Mortgage Status in Freeport
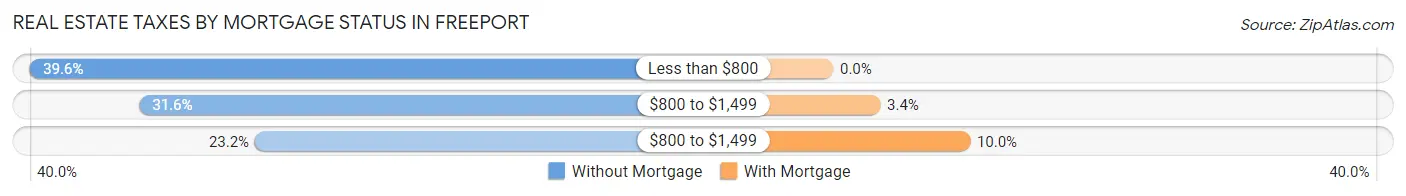
| Property Taxes | Without Mortgage | With Mortgage |
| Less than $800 | 670 (39.6%) | 0 (0.0%) |
| $800 to $1,499 | 535 (31.6%) | 22 (3.4%) |
| $800 to $1,499 | 392 (23.2%) | 64 (10.0%) |
| Total | 1,692 (100.0%) | 640 (100.0%) |
Health & Disability in Freeport
Health Insurance Coverage by Age in Freeport
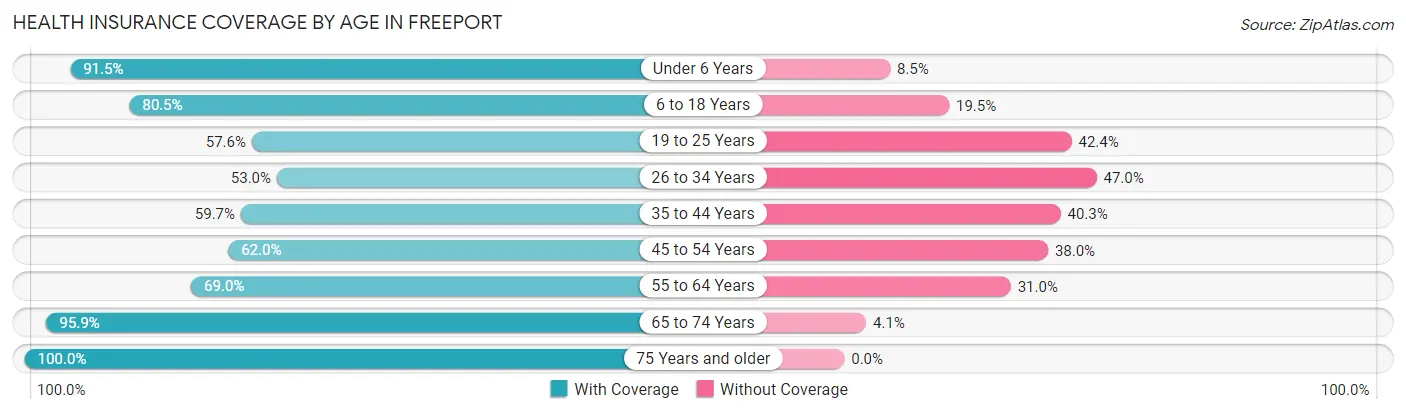
| Age Bracket | With Coverage | Without Coverage |
| Under 6 Years | 968 (91.5%) | 90 (8.5%) |
| 6 to 18 Years | 1,928 (80.5%) | 468 (19.5%) |
| 19 to 25 Years | 472 (57.6%) | 347 (42.4%) |
| 26 to 34 Years | 778 (53.0%) | 691 (47.0%) |
| 35 to 44 Years | 685 (59.7%) | 463 (40.3%) |
| 45 to 54 Years | 864 (62.0%) | 529 (38.0%) |
| 55 to 64 Years | 791 (69.0%) | 356 (31.0%) |
| 65 to 74 Years | 989 (95.9%) | 42 (4.1%) |
| 75 Years and older | 268 (100.0%) | 0 (0.0%) |
| Total | 7,743 (72.2%) | 2,986 (27.8%) |
Health Insurance Coverage by Citizenship Status in Freeport
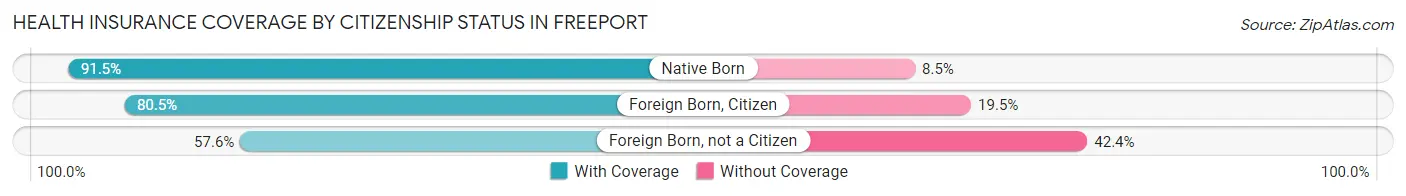
| Citizenship Status | With Coverage | Without Coverage |
| Native Born | 968 (91.5%) | 90 (8.5%) |
| Foreign Born, Citizen | 1,928 (80.5%) | 468 (19.5%) |
| Foreign Born, not a Citizen | 472 (57.6%) | 347 (42.4%) |
Health Insurance Coverage by Household Income in Freeport
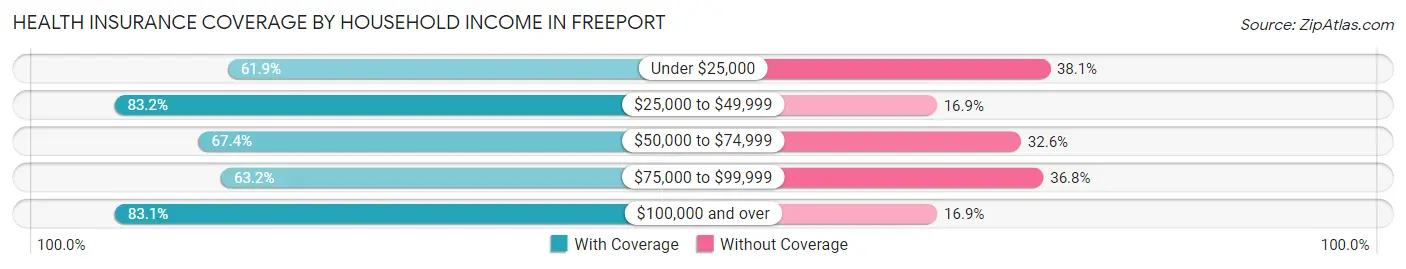
| Household Income | With Coverage | Without Coverage |
| Under $25,000 | 1,499 (61.9%) | 921 (38.1%) |
| $25,000 to $49,999 | 1,895 (83.2%) | 384 (16.9%) |
| $50,000 to $74,999 | 1,818 (67.4%) | 880 (32.6%) |
| $75,000 to $99,999 | 666 (63.2%) | 388 (36.8%) |
| $100,000 and over | 1,815 (83.1%) | 370 (16.9%) |
Public vs Private Health Insurance Coverage by Age in Freeport
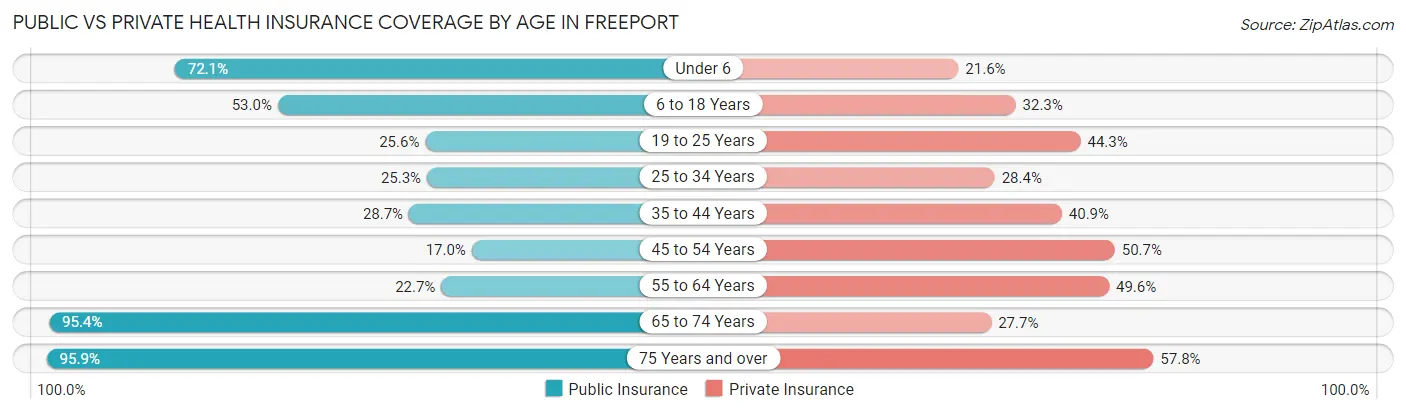
| Age Bracket | Public Insurance | Private Insurance |
| Under 6 | 763 (72.1%) | 229 (21.6%) |
| 6 to 18 Years | 1,270 (53.0%) | 773 (32.3%) |
| 19 to 25 Years | 210 (25.6%) | 363 (44.3%) |
| 25 to 34 Years | 372 (25.3%) | 417 (28.4%) |
| 35 to 44 Years | 329 (28.7%) | 469 (40.8%) |
| 45 to 54 Years | 237 (17.0%) | 706 (50.7%) |
| 55 to 64 Years | 260 (22.7%) | 569 (49.6%) |
| 65 to 74 Years | 984 (95.4%) | 286 (27.7%) |
| 75 Years and over | 257 (95.9%) | 155 (57.8%) |
| Total | 4,682 (43.6%) | 3,967 (37.0%) |
Disability Status by Sex by Age in Freeport
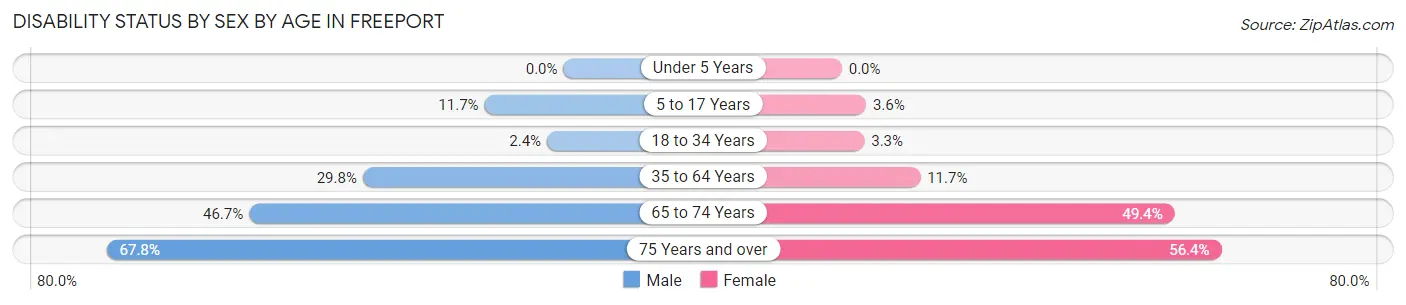
| Age Bracket | Male | Female |
| Under 5 Years | 0 (0.0%) | 0 (0.0%) |
| 5 to 17 Years | 162 (11.7%) | 44 (3.6%) |
| 18 to 34 Years | 22 (2.4%) | 48 (3.3%) |
| 35 to 64 Years | 544 (29.8%) | 217 (11.7%) |
| 65 to 74 Years | 245 (46.7%) | 250 (49.4%) |
| 75 Years and over | 59 (67.8%) | 102 (56.4%) |
Disability Class by Sex by Age in Freeport
Disability Class: Hearing Difficulty
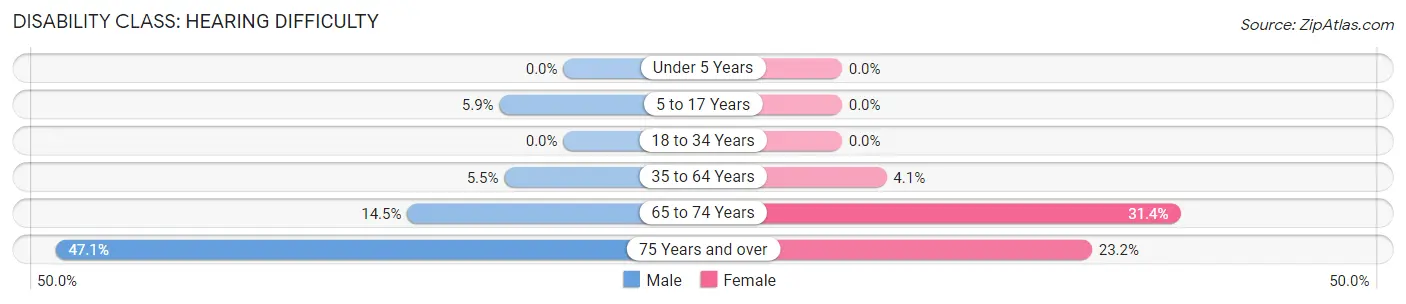
| Age Bracket | Male | Female |
| Under 5 Years | 0 (0.0%) | 0 (0.0%) |
| 5 to 17 Years | 82 (5.9%) | 0 (0.0%) |
| 18 to 34 Years | 0 (0.0%) | 0 (0.0%) |
| 35 to 64 Years | 100 (5.5%) | 77 (4.1%) |
| 65 to 74 Years | 76 (14.5%) | 159 (31.4%) |
| 75 Years and over | 41 (47.1%) | 42 (23.2%) |
Disability Class: Vision Difficulty
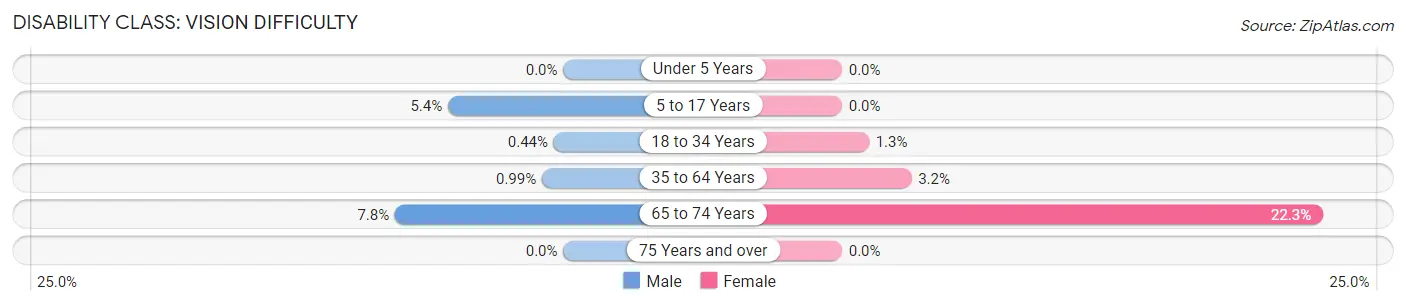
| Age Bracket | Male | Female |
| Under 5 Years | 0 (0.0%) | 0 (0.0%) |
| 5 to 17 Years | 74 (5.3%) | 0 (0.0%) |
| 18 to 34 Years | 4 (0.4%) | 18 (1.3%) |
| 35 to 64 Years | 18 (1.0%) | 60 (3.2%) |
| 65 to 74 Years | 41 (7.8%) | 113 (22.3%) |
| 75 Years and over | 0 (0.0%) | 0 (0.0%) |
Disability Class: Cognitive Difficulty
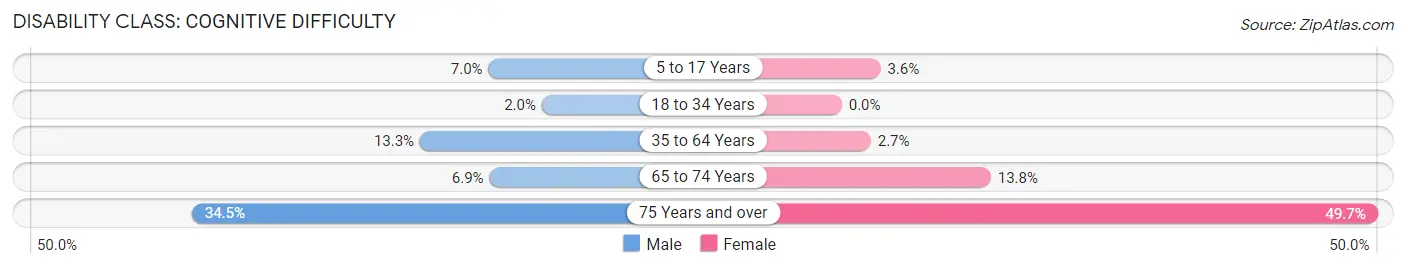
| Age Bracket | Male | Female |
| 5 to 17 Years | 96 (7.0%) | 44 (3.6%) |
| 18 to 34 Years | 18 (2.0%) | 0 (0.0%) |
| 35 to 64 Years | 243 (13.3%) | 50 (2.7%) |
| 65 to 74 Years | 36 (6.9%) | 70 (13.8%) |
| 75 Years and over | 30 (34.5%) | 90 (49.7%) |
Disability Class: Ambulatory Difficulty
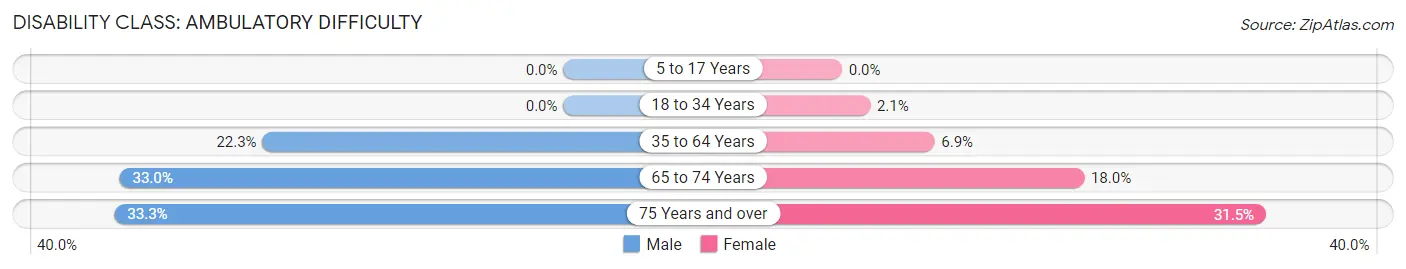
| Age Bracket | Male | Female |
| 5 to 17 Years | 0 (0.0%) | 0 (0.0%) |
| 18 to 34 Years | 0 (0.0%) | 30 (2.1%) |
| 35 to 64 Years | 408 (22.3%) | 128 (6.9%) |
| 65 to 74 Years | 173 (33.0%) | 91 (18.0%) |
| 75 Years and over | 29 (33.3%) | 57 (31.5%) |
Disability Class: Self-Care Difficulty
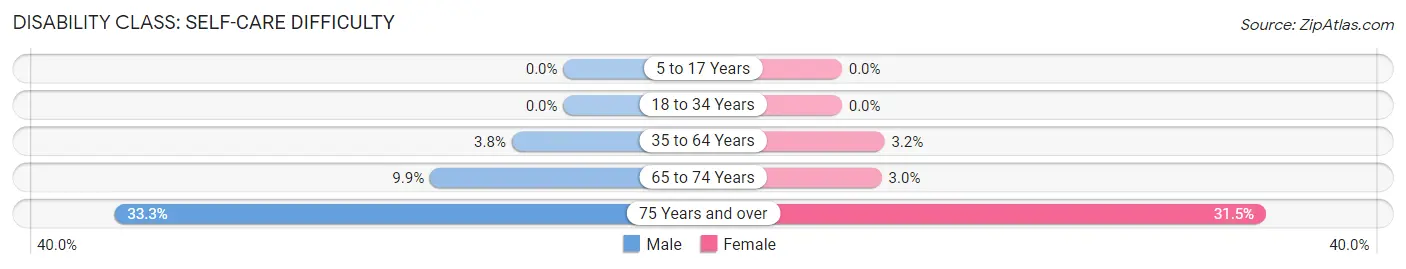
| Age Bracket | Male | Female |
| 5 to 17 Years | 0 (0.0%) | 0 (0.0%) |
| 18 to 34 Years | 0 (0.0%) | 0 (0.0%) |
| 35 to 64 Years | 70 (3.8%) | 59 (3.2%) |
| 65 to 74 Years | 52 (9.9%) | 15 (3.0%) |
| 75 Years and over | 29 (33.3%) | 57 (31.5%) |
Technology Access in Freeport
Computing Device Access in Freeport
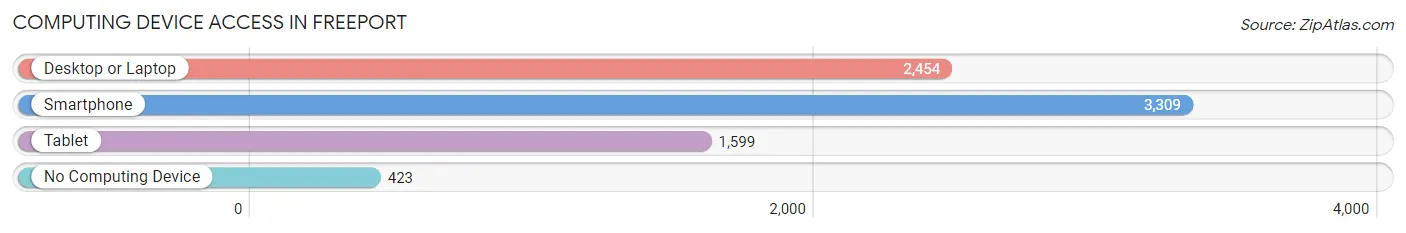
| Device Type | # Households | % Households |
| Desktop or Laptop | 2,454 | 61.1% |
| Smartphone | 3,309 | 82.3% |
| Tablet | 1,599 | 39.8% |
| No Computing Device | 423 | 10.5% |
| Total | 4,019 | 100.0% |
Internet Access in Freeport
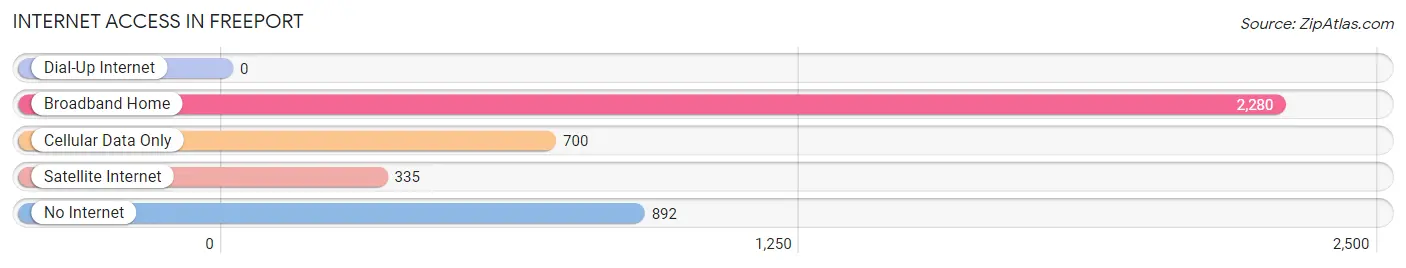
| Internet Type | # Households | % Households |
| Dial-Up Internet | 0 | 0.0% |
| Broadband Home | 2,280 | 56.7% |
| Cellular Data Only | 700 | 17.4% |
| Satellite Internet | 335 | 8.3% |
| No Internet | 892 | 22.2% |
| Total | 4,019 | 100.0% |
Freeport Summary
Freeport, Texas is a city located in Brazoria County, Texas, United States. It is situated along the Gulf of Mexico, approximately 50 miles south of Houston. The city is known for its deepwater port, which is the largest in the United States in terms of total tonnage. Freeport is also home to a large petrochemical industry, which has been a major contributor to the city’s economy since the 1950s.
History
The area that is now Freeport was first settled in 1822 by Stephen F. Austin and his colonists. The settlement was originally known as “Quintana”, after the nearby Quintana Island. In 1845, the settlement was renamed “Freeport”, after the nearby Freeport Bay. The city was officially incorporated in 1912.
In the early 1900s, Freeport began to develop its port facilities, which would eventually become the largest in the United States. The port was used to export cotton, lumber, and other goods. In the 1950s, the petrochemical industry began to move into the area, and Freeport quickly became a major center for the industry.
Geography
Freeport is located in Brazoria County, Texas, approximately 50 miles south of Houston. The city is situated along the Gulf of Mexico, and is bordered by the cities of Clute, Lake Jackson, and Angleton. The city covers an area of approximately 11.5 square miles, and has a population of 12,049 as of the 2010 census.
The climate in Freeport is classified as humid subtropical, with hot, humid summers and mild winters. The average annual temperature is 73°F, and the average annual precipitation is 48.5 inches.
Economy
Freeport’s economy is largely driven by the petrochemical industry, which has been a major contributor to the city’s economy since the 1950s. The city is home to several major petrochemical companies, including Dow Chemical, BASF, and Chevron Phillips. The city’s deepwater port is also a major contributor to the economy, as it is the largest in the United States in terms of total tonnage.
In addition to the petrochemical and port industries, Freeport is also home to several other industries, including tourism, fishing, and manufacturing. The city is also home to several educational institutions, including Brazosport College and the University of Houston-Clear Lake.
Demographics
As of the 2010 census, Freeport had a population of 12,049. The racial makeup of the city was 73.3% White, 11.2% African American, 0.7% Native American, 0.7% Asian, 0.1% Pacific Islander, 11.7% from other races, and 2.2% from two or more races. Hispanic or Latino of any race were 24.3% of the population.
The median income for a household in Freeport was $41,945, and the median income for a family was $50,945. The per capita income for the city was $20,945. About 14.3% of the population was below the poverty line.
Freeport is a diverse city with a rich history and a vibrant economy. The city’s deepwater port and petrochemical industry have been major contributors to the city’s economy for decades, and the city is home to several other industries as well. The city is also home to several educational institutions, and has a diverse population with a median income that is slightly above the national average.
Common Questions
What is Per Capita Income in Freeport?
Per Capita income in Freeport is $24,321.
What is the Median Family Income in Freeport?
Median Family Income in Freeport is $53,608.
What is the Median Household income in Freeport?
Median Household Income in Freeport is $50,704.
What is Income or Wage Gap in Freeport?
Income or Wage Gap in Freeport is 38.5%.
Women in Freeport earn 61.5 cents for every dollar earned by a man.
What is Inequality or Gini Index in Freeport?
Inequality or Gini Index in Freeport is 0.47.
What is the Total Population of Freeport?
Total Population of Freeport is 10,738.
What is the Total Male Population of Freeport?
Total Male Population of Freeport is 5,144.
What is the Total Female Population of Freeport?
Total Female Population of Freeport is 5,594.
What is the Ratio of Males per 100 Females in Freeport?
There are 91.96 Males per 100 Females in Freeport.
What is the Ratio of Females per 100 Males in Freeport?
There are 108.75 Females per 100 Males in Freeport.
What is the Median Population Age in Freeport?
Median Population Age in Freeport is 32.6 Years.
What is the Average Family Size in Freeport
Average Family Size in Freeport is 3.2 People.
What is the Average Household Size in Freeport
Average Household Size in Freeport is 2.6 People.
How Large is the Labor Force in Freeport?
There are 4,449 People in the Labor Forcein in Freeport.
What is the Percentage of People in the Labor Force in Freeport?
57.0% of People are in the Labor Force in Freeport.
What is the Unemployment Rate in Freeport?
Unemployment Rate in Freeport is 6.3%.