Cool, TX Map & Demographics
Cool Map
Cool Overview
$33,825
PER CAPITA INCOME
$55,250
AVG FAMILY INCOME
$55,250
AVG HOUSEHOLD INCOME
0.41
INEQUALITY / GINI INDEX
122
TOTAL POPULATION
62
MALE POPULATION
60
FEMALE POPULATION
103.33
MALES / 100 FEMALES
96.77
FEMALES / 100 MALES
52.8
MEDIAN AGE
2.7
AVG FAMILY SIZE
1.8
AVG HOUSEHOLD SIZE
65
LABOR FORCE [ PEOPLE ]
56.5%
PERCENT IN LABOR FORCE
Cool Area Codes
Income in Cool
Income Overview in Cool
Per Capita Income in Cool is $33,825, while median incomes of families and households are $55,250 and $55,250 respectively.
| Characteristic | Number | Measure |
| Per Capita Income | 122 | $33,825 |
| Median Family Income | 29 | $55,250 |
| Mean Family Income | 29 | $62,921 |
| Median Household Income | 67 | $55,250 |
| Mean Household Income | 67 | $60,048 |
| Income Deficit | 29 | $0 |
| Wage / Income Gap (%) | 122 | 0.00% |
| Wage / Income Gap ($) | 122 | 100.00¢ per $1 |
| Gini / Inequality Index | 122 | 0.41 |
Earnings by Sex in Cool
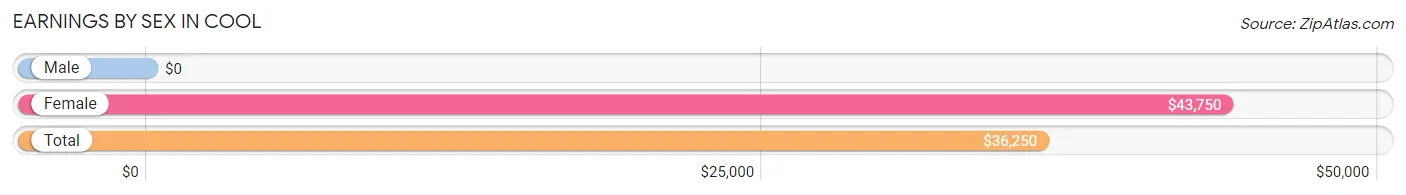
| Sex | Number | Average Earnings |
| Male | 34 (49.3%) | $0 |
| Female | 35 (50.7%) | $43,750 |
| Total | 69 (100.0%) | $36,250 |
Earnings by Sex by Income Bracket in Cool
The most common earnings brackets in Cool are $65,000 to $74,999 for men (8 | 23.5%) and $2,500 to $4,999 for women (6 | 17.1%).
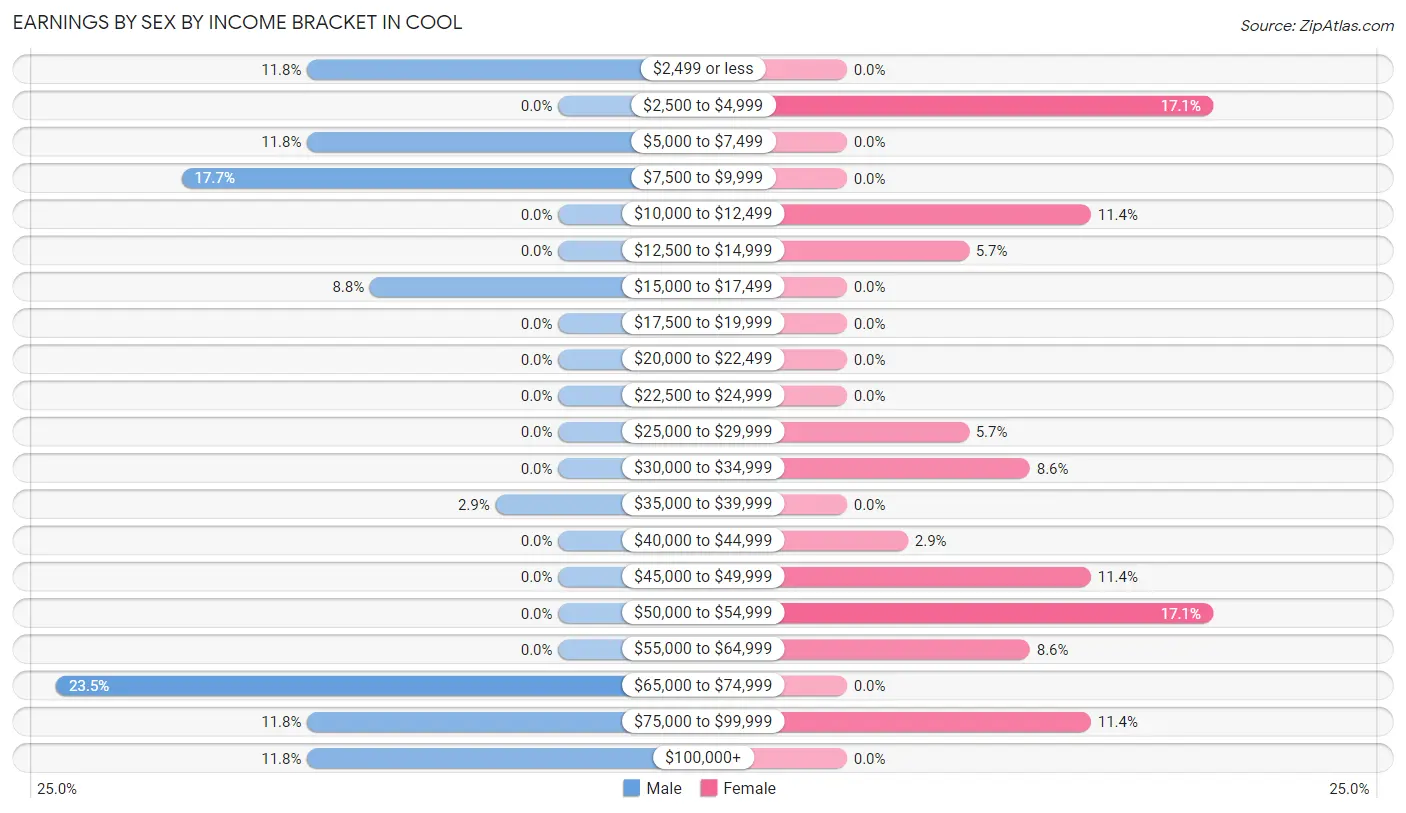
| Income | Male | Female |
| $2,499 or less | 4 (11.8%) | 0 (0.0%) |
| $2,500 to $4,999 | 0 (0.0%) | 6 (17.1%) |
| $5,000 to $7,499 | 4 (11.8%) | 0 (0.0%) |
| $7,500 to $9,999 | 6 (17.6%) | 0 (0.0%) |
| $10,000 to $12,499 | 0 (0.0%) | 4 (11.4%) |
| $12,500 to $14,999 | 0 (0.0%) | 2 (5.7%) |
| $15,000 to $17,499 | 3 (8.8%) | 0 (0.0%) |
| $17,500 to $19,999 | 0 (0.0%) | 0 (0.0%) |
| $20,000 to $22,499 | 0 (0.0%) | 0 (0.0%) |
| $22,500 to $24,999 | 0 (0.0%) | 0 (0.0%) |
| $25,000 to $29,999 | 0 (0.0%) | 2 (5.7%) |
| $30,000 to $34,999 | 0 (0.0%) | 3 (8.6%) |
| $35,000 to $39,999 | 1 (2.9%) | 0 (0.0%) |
| $40,000 to $44,999 | 0 (0.0%) | 1 (2.9%) |
| $45,000 to $49,999 | 0 (0.0%) | 4 (11.4%) |
| $50,000 to $54,999 | 0 (0.0%) | 6 (17.1%) |
| $55,000 to $64,999 | 0 (0.0%) | 3 (8.6%) |
| $65,000 to $74,999 | 8 (23.5%) | 0 (0.0%) |
| $75,000 to $99,999 | 4 (11.8%) | 4 (11.4%) |
| $100,000+ | 4 (11.8%) | 0 (0.0%) |
| Total | 34 (100.0%) | 35 (100.0%) |
Earnings by Sex by Educational Attainment in Cool
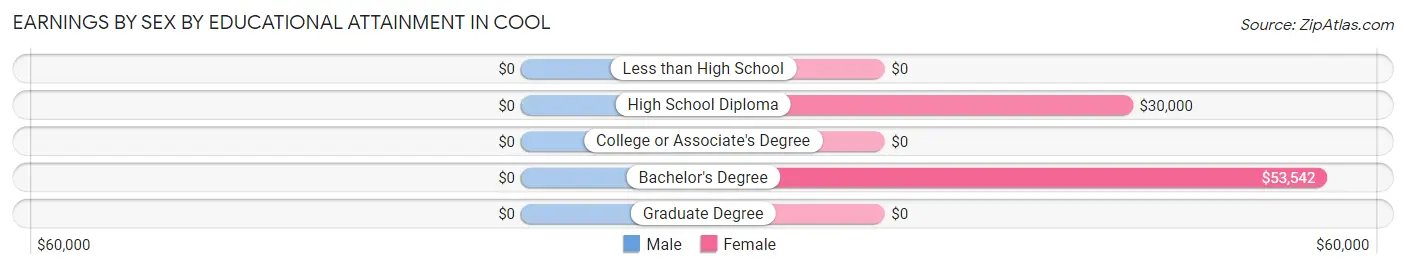
| Educational Attainment | Male Income | Female Income |
| Less than High School | - | - |
| High School Diploma | - | - |
| College or Associate's Degree | - | - |
| Bachelor's Degree | - | - |
| Graduate Degree | - | - |
| Total | - | - |
Family Income in Cool
Family Income Brackets in Cool
According to the Cool family income data, there are 7 families falling into the $15,000 to $24,999 income range, which is the most common income bracket and makes up 24.1% of all families.
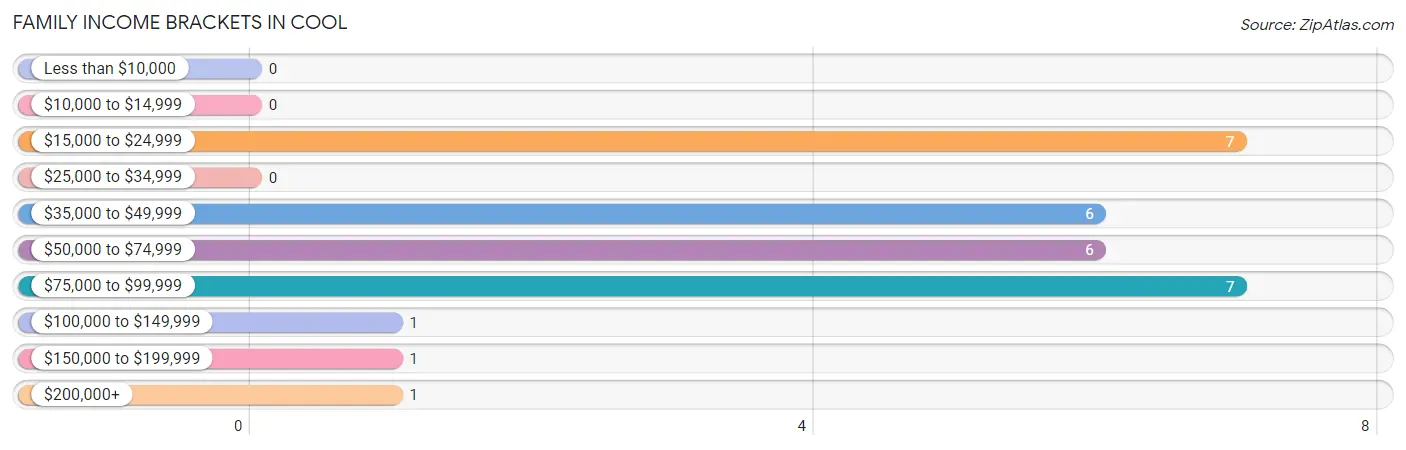
| Income Bracket | # Families | % Families |
| Less than $10,000 | 0 | 0.0% |
| $10,000 to $14,999 | 0 | 0.0% |
| $15,000 to $24,999 | 7 | 24.1% |
| $25,000 to $34,999 | 0 | 0.0% |
| $35,000 to $49,999 | 6 | 20.7% |
| $50,000 to $74,999 | 6 | 20.7% |
| $75,000 to $99,999 | 7 | 24.1% |
| $100,000 to $149,999 | 1 | 3.4% |
| $150,000 to $199,999 | 1 | 3.4% |
| $200,000+ | 1 | 3.4% |
Family Income by Famaliy Size in Cool
2-person families (13 | 44.8%) account for the highest median family income in Cool with $82,708 per family, while 2-person families (13 | 44.8%) have the highest median income of $41,354 per family member.
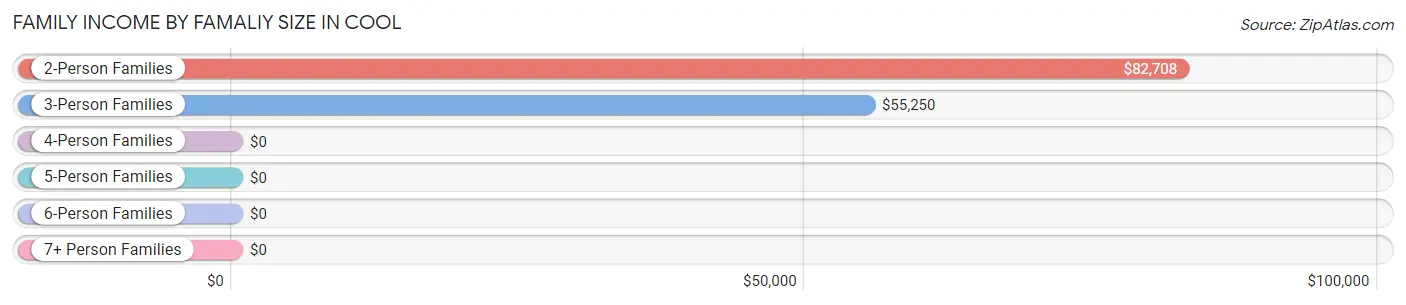
| Income Bracket | # Families | Median Income |
| 2-Person Families | 13 (44.8%) | $82,708 |
| 3-Person Families | 13 (44.8%) | $55,250 |
| 4-Person Families | 3 (10.3%) | $0 |
| 5-Person Families | 0 (0.0%) | $0 |
| 6-Person Families | 0 (0.0%) | $0 |
| 7+ Person Families | 0 (0.0%) | $0 |
| Total | 29 (100.0%) | $55,250 |
Family Income by Number of Earners in Cool
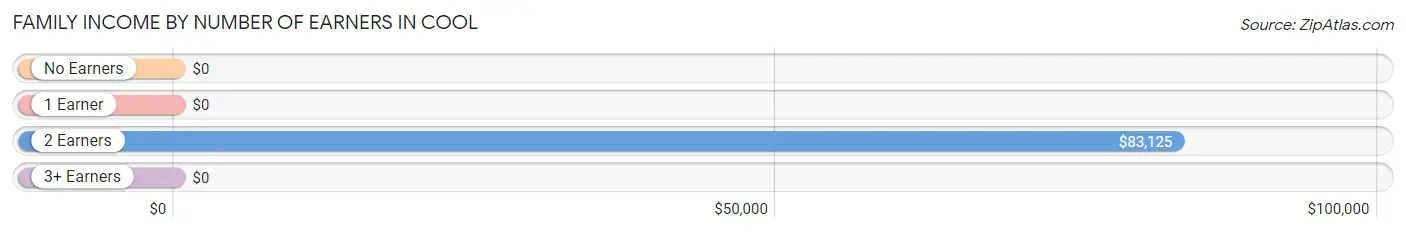
| Number of Earners | # Families | Median Income |
| No Earners | 11 (37.9%) | $0 |
| 1 Earner | 4 (13.8%) | $0 |
| 2 Earners | 8 (27.6%) | $83,125 |
| 3+ Earners | 6 (20.7%) | $0 |
| Total | 29 (100.0%) | $55,250 |
Household Income in Cool
Household Income Brackets in Cool
With 16 households falling in the category, the $50,000 to $74,999 income range is the most frequent in Cool, accounting for 23.9% of all households.
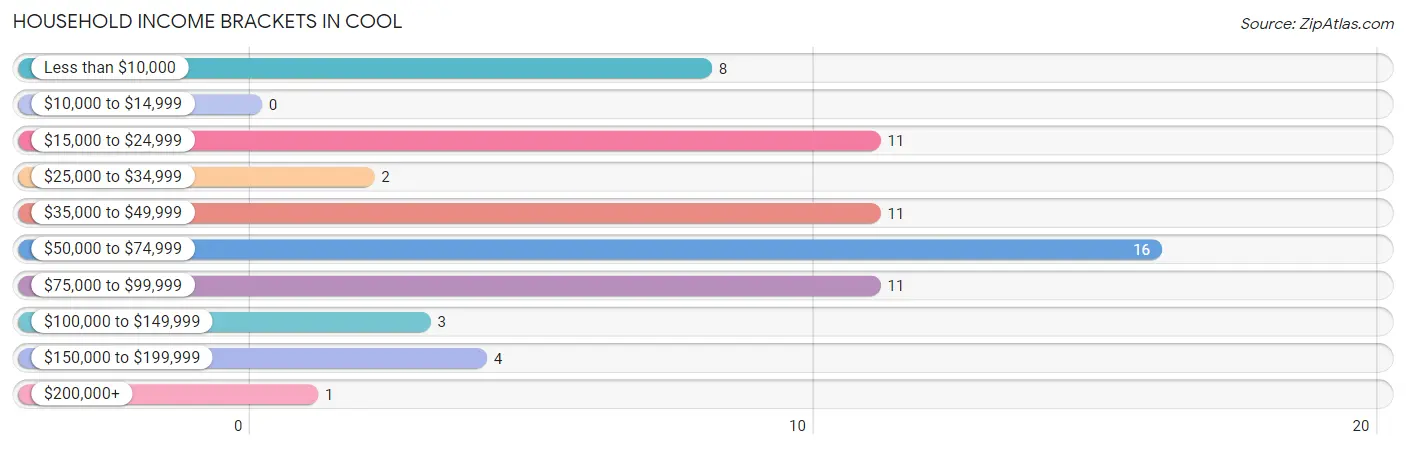
| Income Bracket | # Households | % Households |
| Less than $10,000 | 8 | 11.9% |
| $10,000 to $14,999 | 0 | 0.0% |
| $15,000 to $24,999 | 11 | 16.4% |
| $25,000 to $34,999 | 2 | 3.0% |
| $35,000 to $49,999 | 11 | 16.4% |
| $50,000 to $74,999 | 16 | 23.9% |
| $75,000 to $99,999 | 11 | 16.4% |
| $100,000 to $149,999 | 3 | 4.5% |
| $150,000 to $199,999 | 4 | 6.0% |
| $200,000+ | 1 | 1.5% |
Household Income by Householder Age in Cool
The median household income in Cool is $55,250, with the highest median household income of $59,688 found in the 25 to 44 years age bracket for the primary householder. A total of 17 households (25.4%) fall into this category. Meanwhile, the 15 to 24 years age bracket for the primary householder has the lowest median household income of $0, with 3 households (4.5%) in this group.
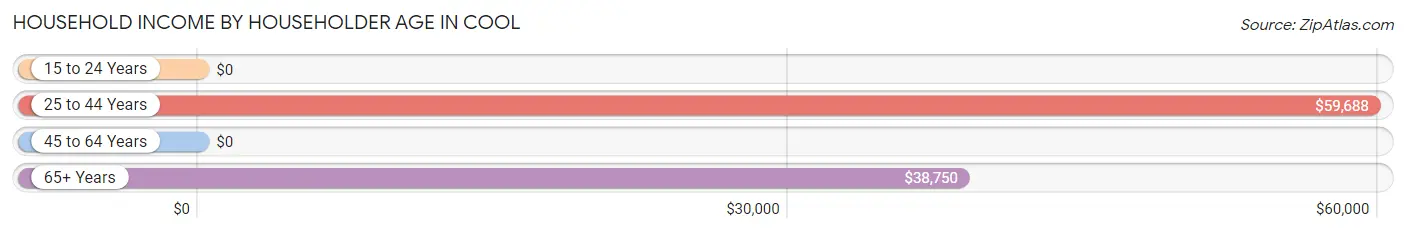
| Income Bracket | # Households | Median Income |
| 15 to 24 Years | 3 (4.5%) | $0 |
| 25 to 44 Years | 17 (25.4%) | $59,688 |
| 45 to 64 Years | 21 (31.3%) | $0 |
| 65+ Years | 26 (38.8%) | $38,750 |
| Total | 67 (100.0%) | $55,250 |
Poverty in Cool
Income Below Poverty by Sex and Age in Cool
With 12.9% poverty level for males and 18.3% for females among the residents of Cool, 25 to 34 year old males and 12 to 14 year old females are the most vulnerable to poverty, with 4 males (66.7%) and 1 females (100.0%) in their respective age groups living below the poverty level.
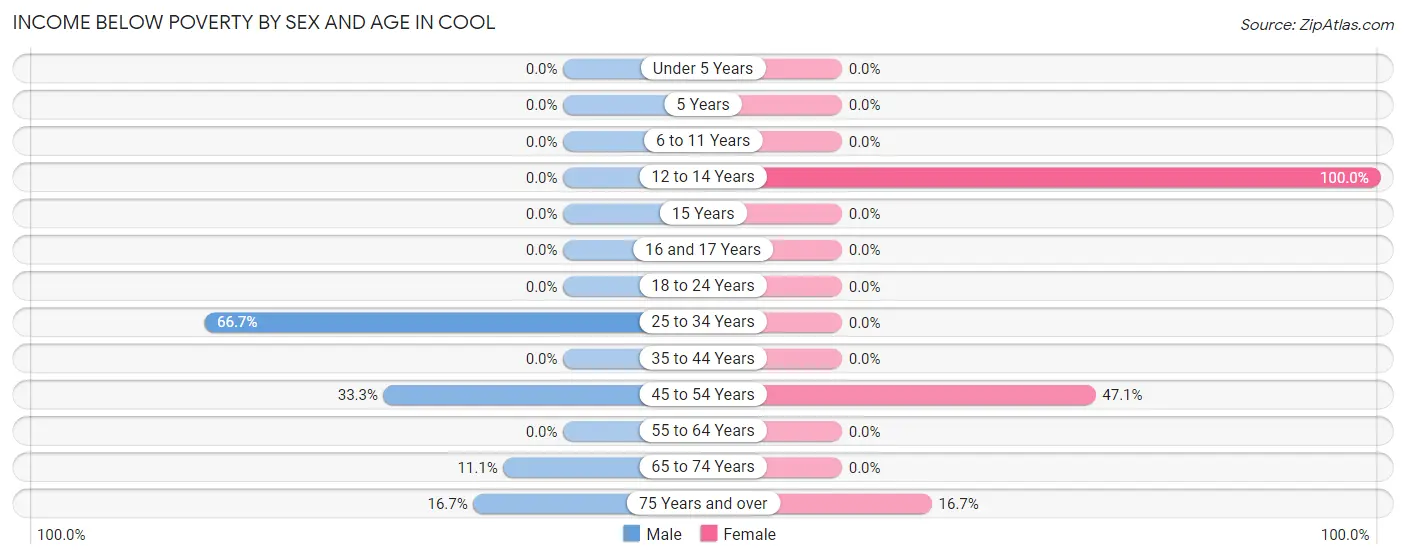
| Age Bracket | Male | Female |
| Under 5 Years | 0 (0.0%) | 0 (0.0%) |
| 5 Years | 0 (0.0%) | 0 (0.0%) |
| 6 to 11 Years | 0 (0.0%) | 0 (0.0%) |
| 12 to 14 Years | 0 (0.0%) | 1 (100.0%) |
| 15 Years | 0 (0.0%) | 0 (0.0%) |
| 16 and 17 Years | 0 (0.0%) | 0 (0.0%) |
| 18 to 24 Years | 0 (0.0%) | 0 (0.0%) |
| 25 to 34 Years | 4 (66.7%) | 0 (0.0%) |
| 35 to 44 Years | 0 (0.0%) | 0 (0.0%) |
| 45 to 54 Years | 2 (33.3%) | 8 (47.1%) |
| 55 to 64 Years | 0 (0.0%) | 0 (0.0%) |
| 65 to 74 Years | 1 (11.1%) | 0 (0.0%) |
| 75 Years and over | 1 (16.7%) | 2 (16.7%) |
| Total | 8 (12.9%) | 11 (18.3%) |
Income Above Poverty by Sex and Age in Cool
According to the poverty statistics in Cool, males aged 6 to 11 years and females aged under 5 years are the age groups that are most secure financially, with 100.0% of males and 100.0% of females in these age groups living above the poverty line.
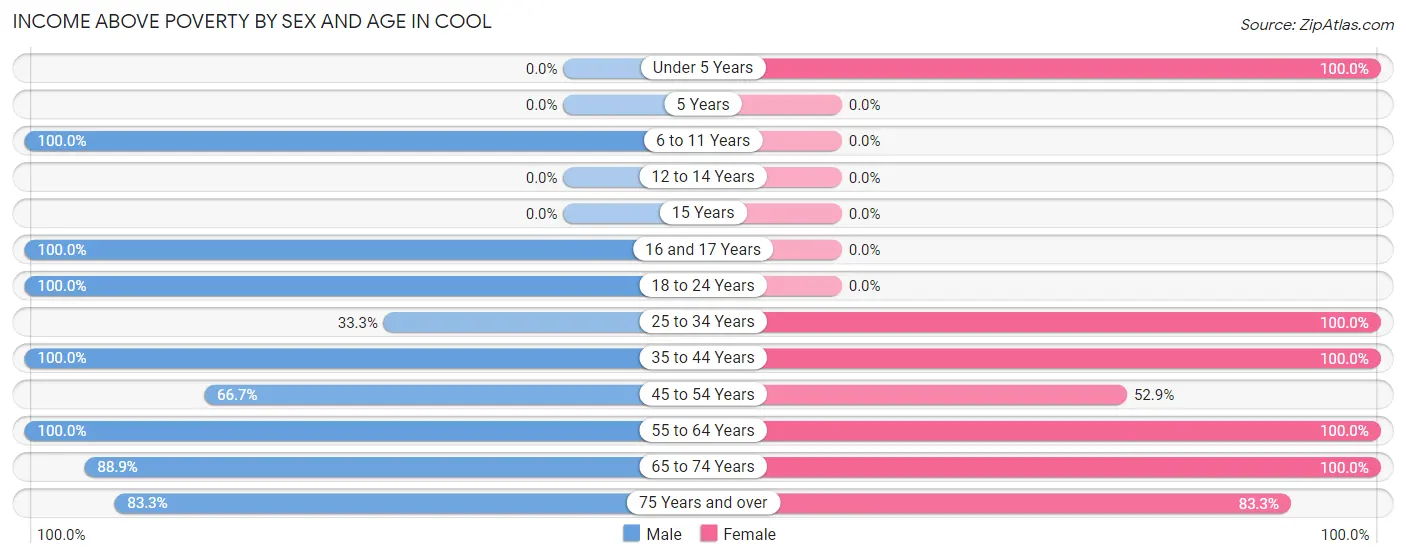
| Age Bracket | Male | Female |
| Under 5 Years | 0 (0.0%) | 3 (100.0%) |
| 5 Years | 0 (0.0%) | 0 (0.0%) |
| 6 to 11 Years | 3 (100.0%) | 0 (0.0%) |
| 12 to 14 Years | 0 (0.0%) | 0 (0.0%) |
| 15 Years | 0 (0.0%) | 0 (0.0%) |
| 16 and 17 Years | 2 (100.0%) | 0 (0.0%) |
| 18 to 24 Years | 6 (100.0%) | 0 (0.0%) |
| 25 to 34 Years | 2 (33.3%) | 8 (100.0%) |
| 35 to 44 Years | 14 (100.0%) | 6 (100.0%) |
| 45 to 54 Years | 4 (66.7%) | 9 (52.9%) |
| 55 to 64 Years | 10 (100.0%) | 4 (100.0%) |
| 65 to 74 Years | 8 (88.9%) | 9 (100.0%) |
| 75 Years and over | 5 (83.3%) | 10 (83.3%) |
| Total | 54 (87.1%) | 49 (81.7%) |
Income Below Poverty Among Married-Couple Families in Cool
The poverty statistics for married-couple families in Cool show that 11.1% or 3 of the total 27 families live below the poverty line. Families with 1 or 2 children have the highest poverty rate of 22.2%, comprising of 2 families. On the other hand, families with no children have the lowest poverty rate of 5.6%, which includes 1 families.
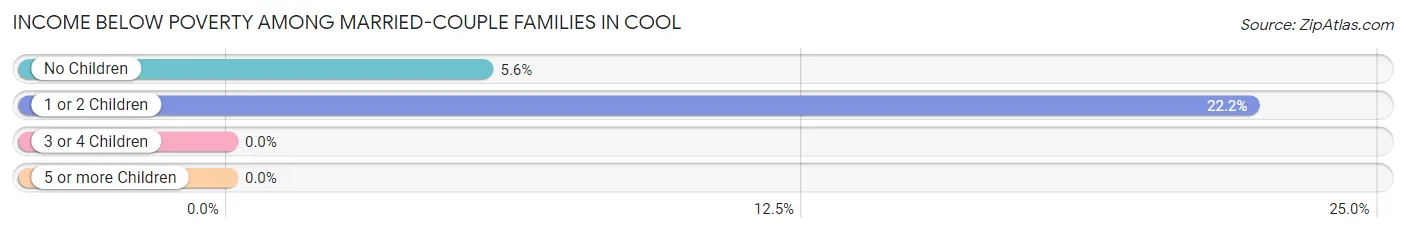
| Children | Above Poverty | Below Poverty |
| No Children | 17 (94.4%) | 1 (5.6%) |
| 1 or 2 Children | 7 (77.8%) | 2 (22.2%) |
| 3 or 4 Children | 0 (0.0%) | 0 (0.0%) |
| 5 or more Children | 0 (0.0%) | 0 (0.0%) |
| Total | 24 (88.9%) | 3 (11.1%) |
Income Below Poverty Among Single-Parent Households in Cool
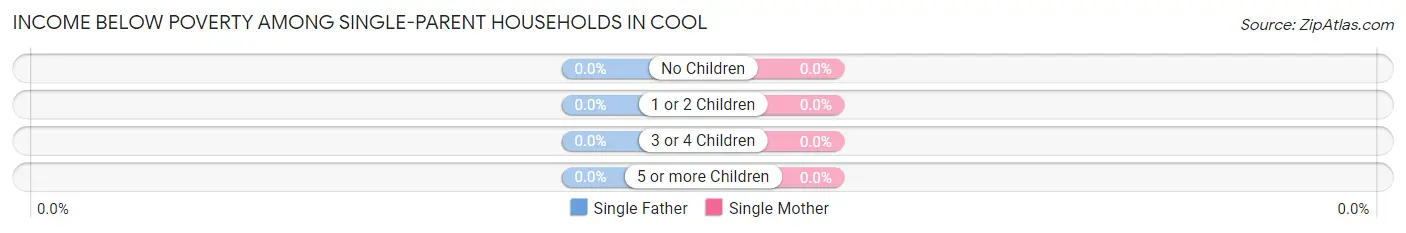
| Children | Single Father | Single Mother |
| No Children | 0 (0.0%) | 0 (0.0%) |
| 1 or 2 Children | 0 (0.0%) | 0 (0.0%) |
| 3 or 4 Children | 0 (0.0%) | 0 (0.0%) |
| 5 or more Children | 0 (0.0%) | 0 (0.0%) |
| Total | 0 (0.0%) | 0 (0.0%) |
Income Below Poverty Among Married-Couple vs Single-Parent Households in Cool
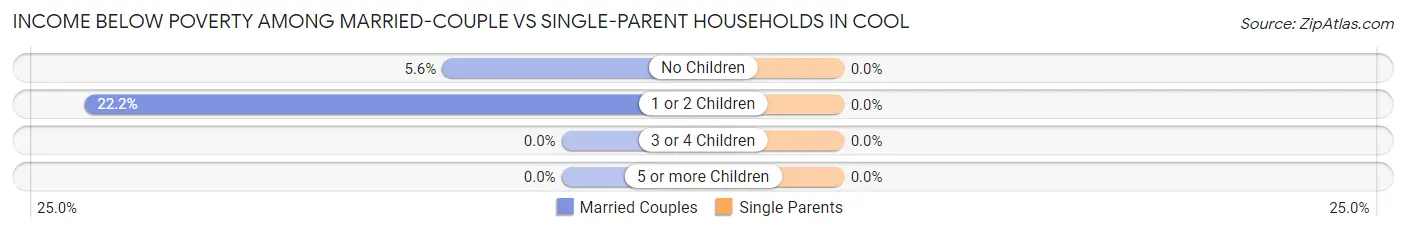
| Children | Married-Couple Families | Single-Parent Households |
| No Children | 1 (5.6%) | 0 (0.0%) |
| 1 or 2 Children | 2 (22.2%) | 0 (0.0%) |
| 3 or 4 Children | 0 (0.0%) | 0 (0.0%) |
| 5 or more Children | 0 (0.0%) | 0 (0.0%) |
| Total | 3 (11.1%) | 0 (0.0%) |
Race in Cool
The most populous races in Cool are White / Caucasian (122 | 100.0%), and Hispanic or Latino (11 | 9.0%).
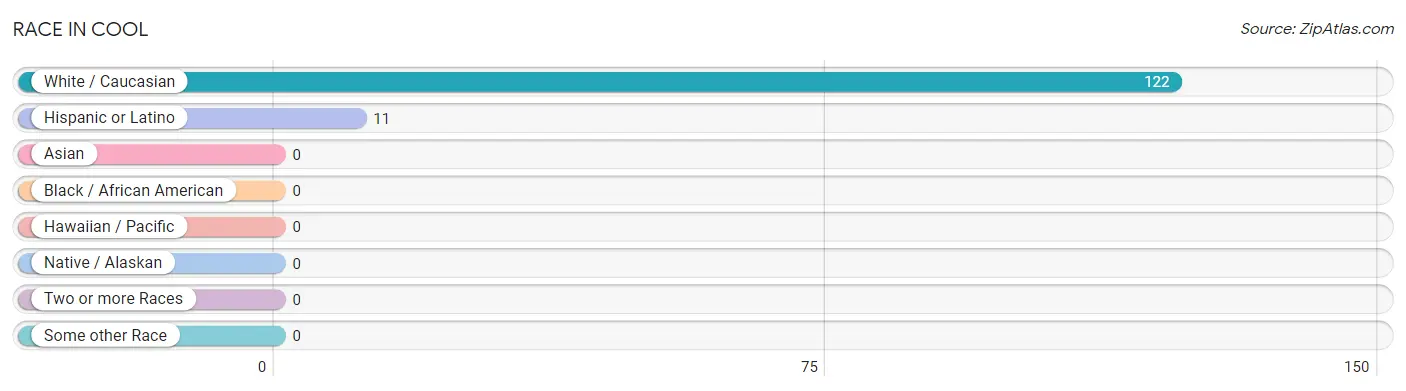
| Race | # Population | % Population |
| Asian | 0 | 0.0% |
| Black / African American | 0 | 0.0% |
| Hawaiian / Pacific | 0 | 0.0% |
| Hispanic or Latino | 11 | 9.0% |
| Native / Alaskan | 0 | 0.0% |
| White / Caucasian | 122 | 100.0% |
| Two or more Races | 0 | 0.0% |
| Some other Race | 0 | 0.0% |
| Total | 122 | 100.0% |
Ancestry in Cool
The most populous ancestries reported in Cool are English (38 | 31.1%), Mexican (11 | 9.0%), Irish (9 | 7.4%), Scotch-Irish (9 | 7.4%), and European (7 | 5.7%), together accounting for 60.7% of all Cool residents.
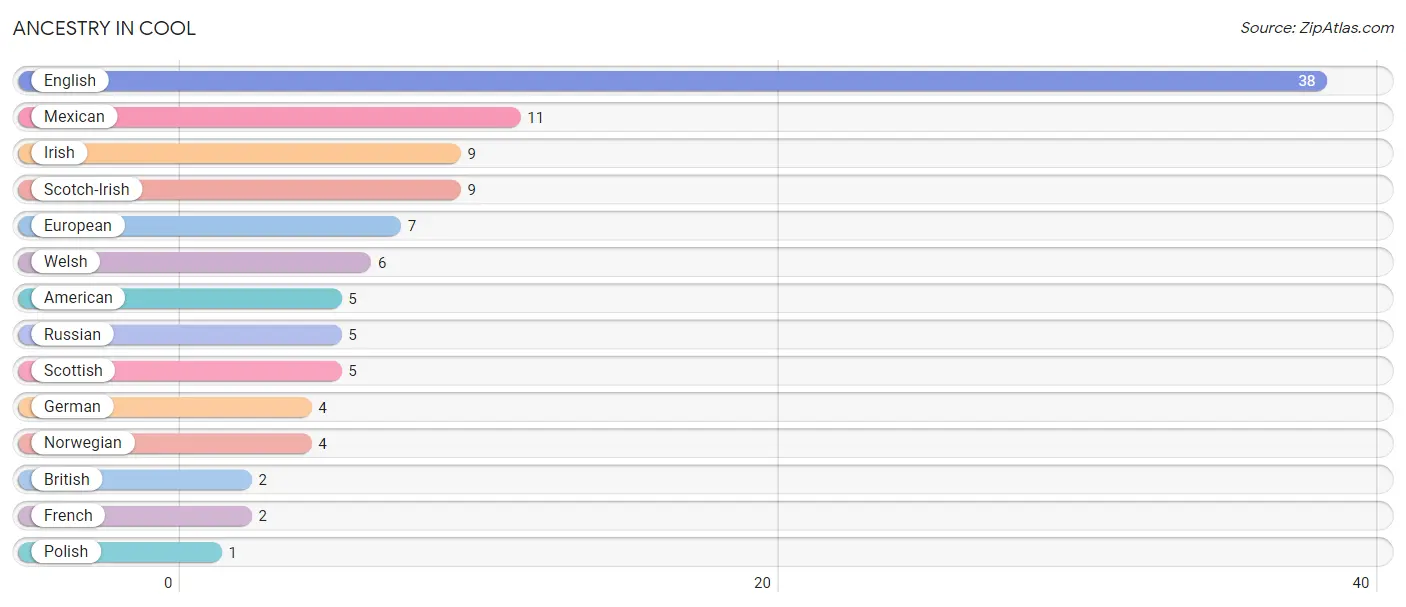
| Ancestry | # Population | % Population |
| American | 5 | 4.1% |
| British | 2 | 1.6% |
| English | 38 | 31.1% |
| European | 7 | 5.7% |
| French | 2 | 1.6% |
| German | 4 | 3.3% |
| Irish | 9 | 7.4% |
| Mexican | 11 | 9.0% |
| Norwegian | 4 | 3.3% |
| Polish | 1 | 0.8% |
| Russian | 5 | 4.1% |
| Scotch-Irish | 9 | 7.4% |
| Scottish | 5 | 4.1% |
| Welsh | 6 | 4.9% | View All 14 Rows |
Immigrants in Cool
The most numerous immigrant groups reported in Cool came from Central America (5 | 4.1%), Latin America (5 | 4.1%), and Mexico (5 | 4.1%), together accounting for 12.3% of all Cool residents.
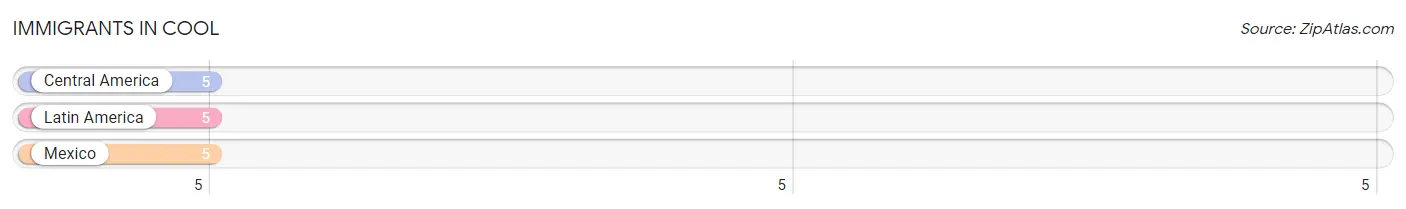
| Immigration Origin | # Population | % Population |
| Central America | 5 | 4.1% |
| Latin America | 5 | 4.1% |
| Mexico | 5 | 4.1% | View All 3 Rows |
Sex and Age in Cool
Sex and Age in Cool
The most populous age groups in Cool are 40 to 44 Years (11 | 17.7%) for men and 50 to 54 Years (15 | 25.0%) for women.
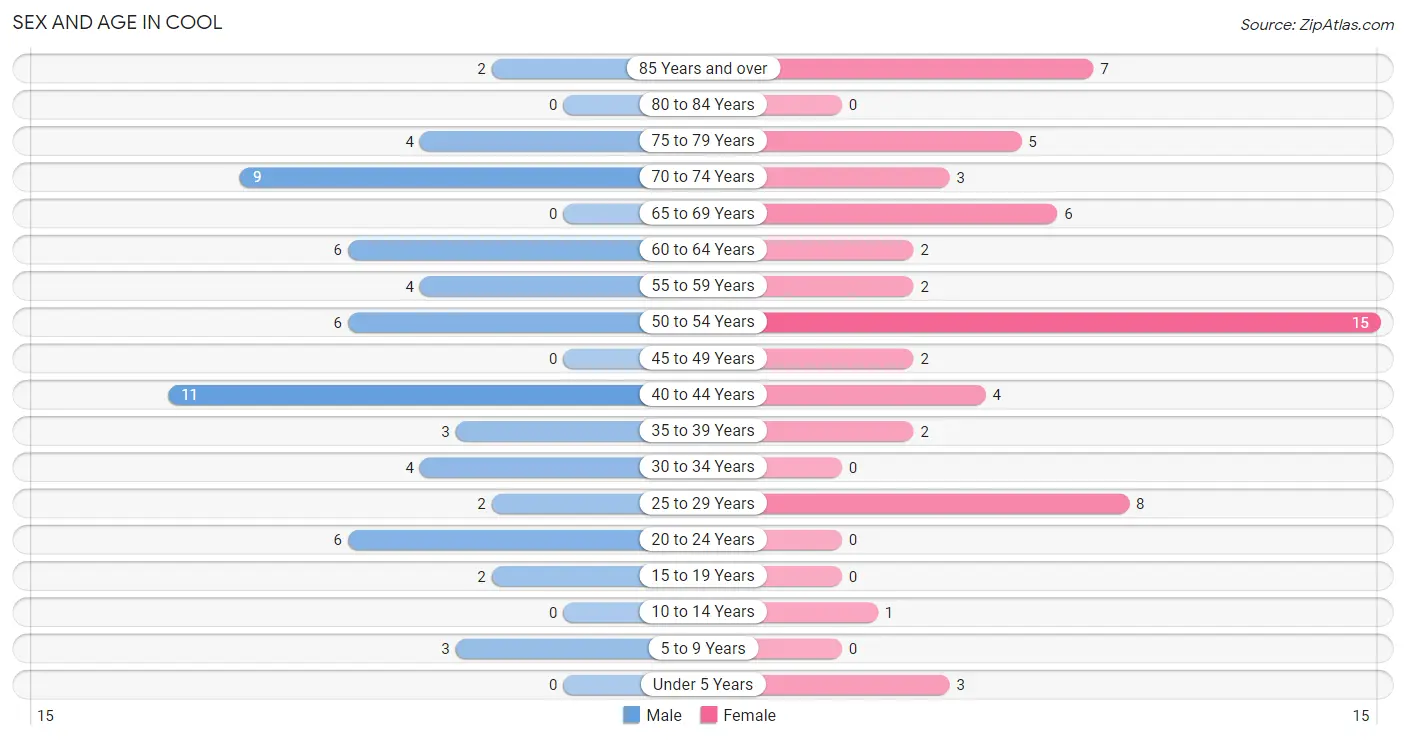
| Age Bracket | Male | Female |
| Under 5 Years | 0 (0.0%) | 3 (5.0%) |
| 5 to 9 Years | 3 (4.8%) | 0 (0.0%) |
| 10 to 14 Years | 0 (0.0%) | 1 (1.7%) |
| 15 to 19 Years | 2 (3.2%) | 0 (0.0%) |
| 20 to 24 Years | 6 (9.7%) | 0 (0.0%) |
| 25 to 29 Years | 2 (3.2%) | 8 (13.3%) |
| 30 to 34 Years | 4 (6.5%) | 0 (0.0%) |
| 35 to 39 Years | 3 (4.8%) | 2 (3.3%) |
| 40 to 44 Years | 11 (17.7%) | 4 (6.7%) |
| 45 to 49 Years | 0 (0.0%) | 2 (3.3%) |
| 50 to 54 Years | 6 (9.7%) | 15 (25.0%) |
| 55 to 59 Years | 4 (6.5%) | 2 (3.3%) |
| 60 to 64 Years | 6 (9.7%) | 2 (3.3%) |
| 65 to 69 Years | 0 (0.0%) | 6 (10.0%) |
| 70 to 74 Years | 9 (14.5%) | 3 (5.0%) |
| 75 to 79 Years | 4 (6.5%) | 5 (8.3%) |
| 80 to 84 Years | 0 (0.0%) | 0 (0.0%) |
| 85 Years and over | 2 (3.2%) | 7 (11.7%) |
| Total | 62 (100.0%) | 60 (100.0%) |
Families and Households in Cool
Median Family Size in Cool
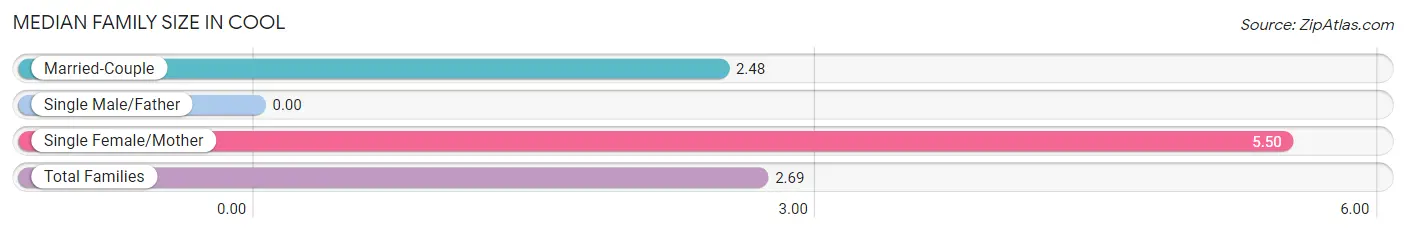
| Family Type | # Families | Family Size |
| Married-Couple | 27 (93.1%) | 2.48 |
| Single Male/Father | 0 (0.0%) | - |
| Single Female/Mother | 2 (6.9%) | 5.50 |
| Total Families | 29 (100.0%) | 2.69 |
Median Household Size in Cool
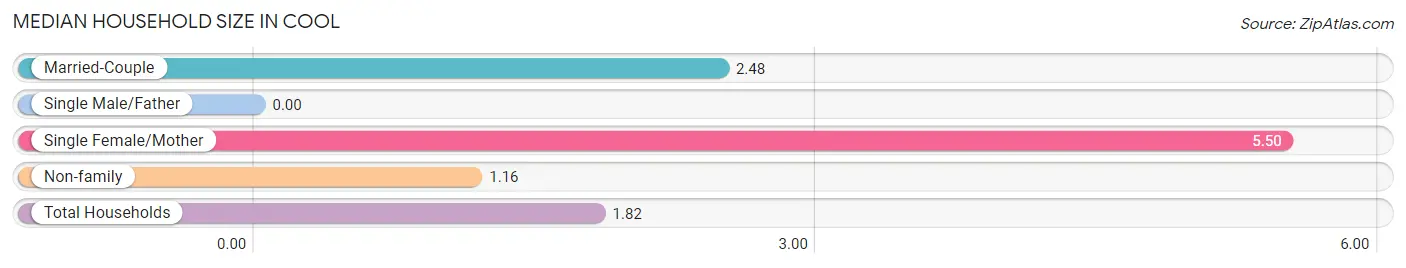
| Household Type | # Households | Household Size |
| Married-Couple | 27 (40.3%) | 2.48 |
| Single Male/Father | 0 (0.0%) | - |
| Single Female/Mother | 2 (3.0%) | 5.50 |
| Non-family | 38 (56.7%) | 1.16 |
| Total Households | 67 (100.0%) | 1.82 |
Household Size by Marriage Status in Cool
Out of a total of 67 households in Cool, 29 (43.3%) are family households, while 38 (56.7%) are nonfamily households. The most numerous type of family households are 2-person households, comprising 13, and the most common type of nonfamily households are 1-person households, comprising 32.
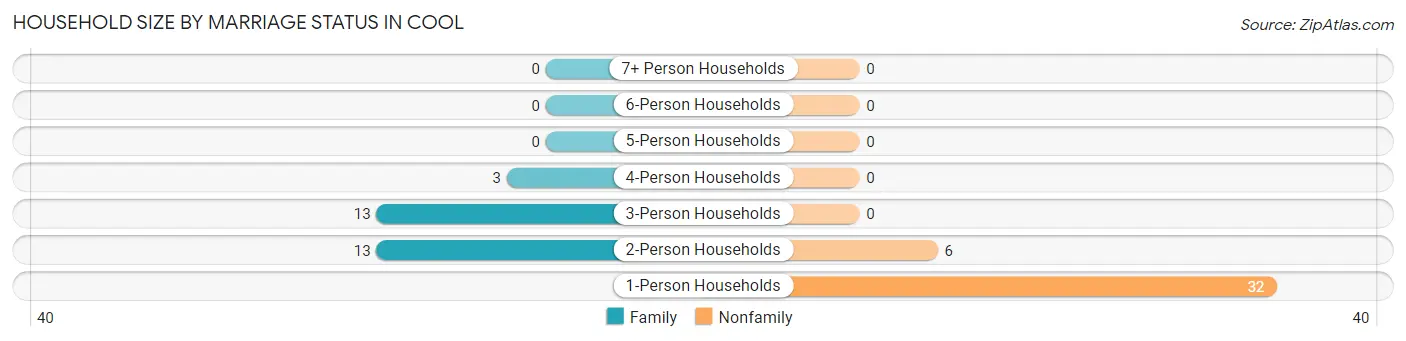
| Household Size | Family Households | Nonfamily Households |
| 1-Person Households | - | 32 (47.8%) |
| 2-Person Households | 13 (19.4%) | 6 (9.0%) |
| 3-Person Households | 13 (19.4%) | 0 (0.0%) |
| 4-Person Households | 3 (4.5%) | 0 (0.0%) |
| 5-Person Households | 0 (0.0%) | 0 (0.0%) |
| 6-Person Households | 0 (0.0%) | 0 (0.0%) |
| 7+ Person Households | 0 (0.0%) | 0 (0.0%) |
| Total | 29 (43.3%) | 38 (56.7%) |
Female Fertility in Cool
Fertility by Age in Cool
Average fertility rate in Cool is 43.0 births per 1,000 women. Women in the age bracket of 35 to 50 years have the highest fertility rate with 67.0 births per 1,000 women. Women in the age bracket of 35 to 50 years acount for 100.0% of all women with births.
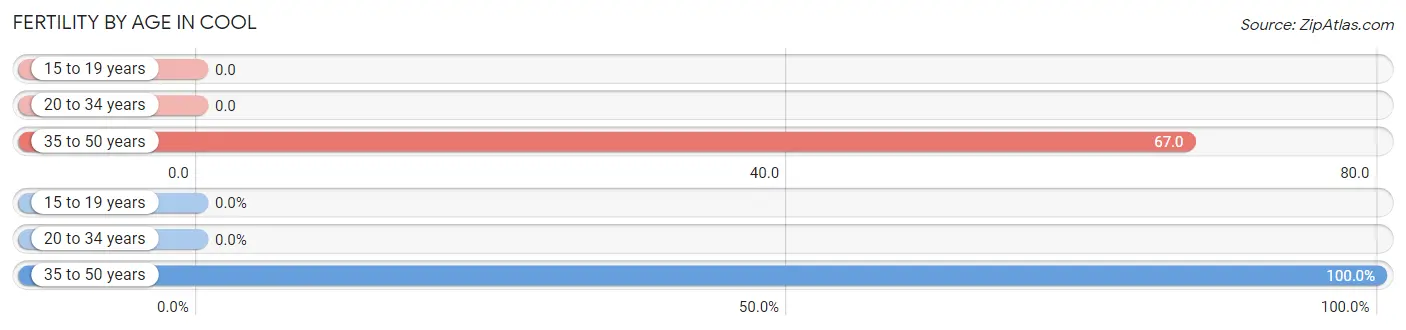
| Age Bracket | Women with Births | Births / 1,000 Women |
| 15 to 19 years | 0 (0.0%) | 0.0 |
| 20 to 34 years | 0 (0.0%) | 0.0 |
| 35 to 50 years | 1 (100.0%) | 67.0 |
| Total | 1 (100.0%) | 43.0 |
Fertility by Age by Marriage Status in Cool
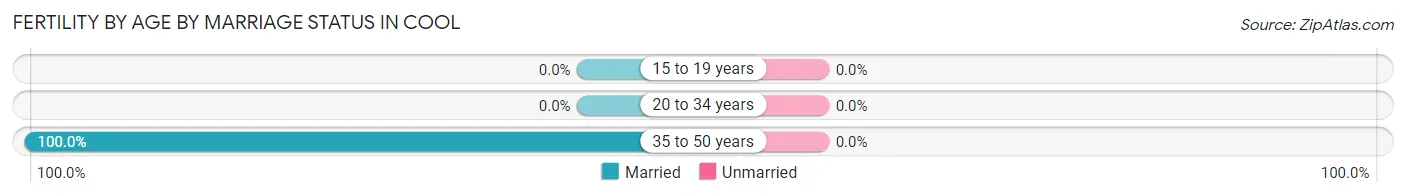
| Age Bracket | Married | Unmarried |
| 15 to 19 years | 0 (0.0%) | 0 (0.0%) |
| 20 to 34 years | 0 (0.0%) | 0 (0.0%) |
| 35 to 50 years | 1 (100.0%) | 0 (0.0%) |
| Total | 1 (100.0%) | 0 (0.0%) |
Fertility by Education in Cool
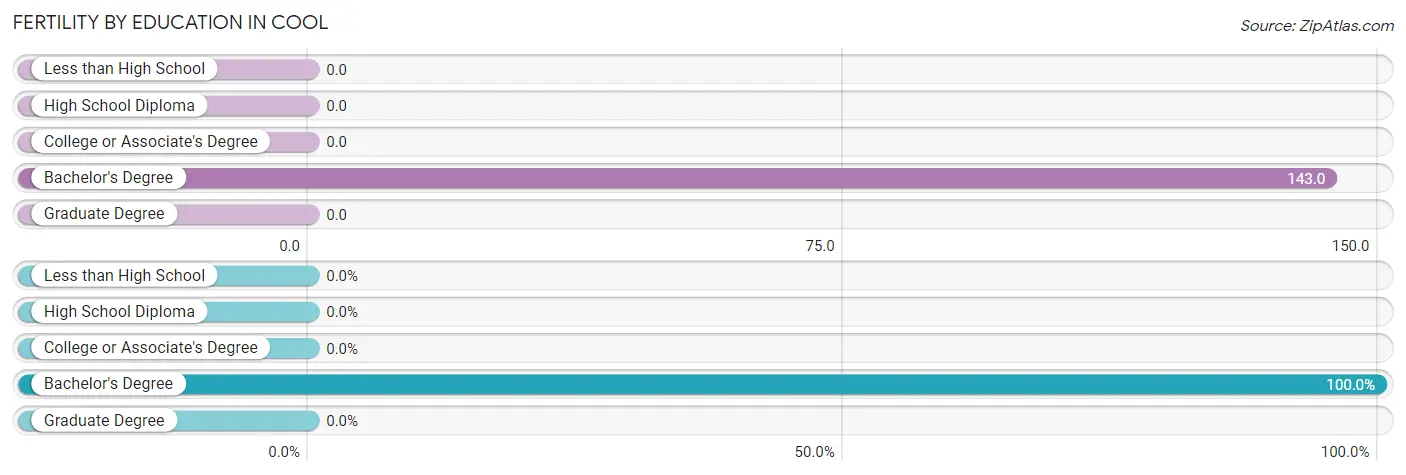
| Educational Attainment | Women with Births | Births / 1,000 Women |
| Less than High School | 0 (0.0%) | 0.0 |
| High School Diploma | 0 (0.0%) | 0.0 |
| College or Associate's Degree | 0 (0.0%) | 0.0 |
| Bachelor's Degree | 1 (100.0%) | 143.0 |
| Graduate Degree | 0 (0.0%) | 0.0 |
| Total | 1 (100.0%) | 43.0 |
Fertility by Education by Marriage Status in Cool
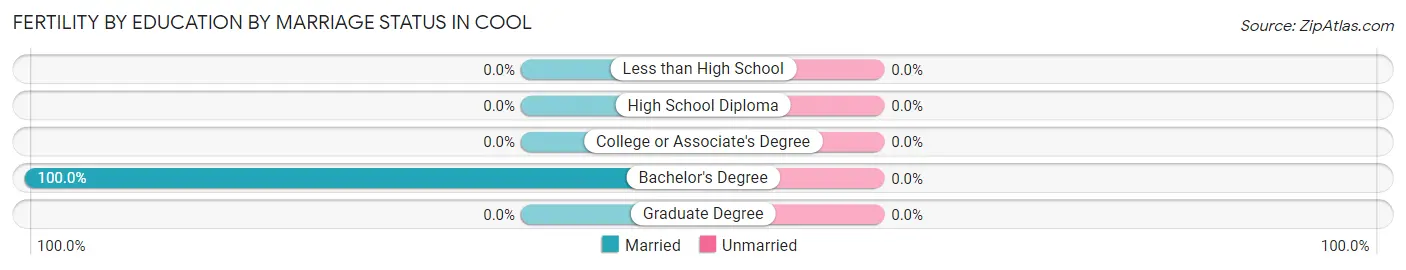
| Educational Attainment | Married | Unmarried |
| Less than High School | 0 (0.0%) | 0 (0.0%) |
| High School Diploma | 0 (0.0%) | 0 (0.0%) |
| College or Associate's Degree | 0 (0.0%) | 0 (0.0%) |
| Bachelor's Degree | 1 (100.0%) | 0 (0.0%) |
| Graduate Degree | 0 (0.0%) | 0 (0.0%) |
| Total | 1 (100.0%) | 0 (0.0%) |
Employment Characteristics in Cool
Employment by Class of Employer in Cool
Among the 65 employed individuals in Cool, private company employees (30 | 46.2%), self-employed (not incorporated) (17 | 26.2%), and not-for-profit organizations (8 | 12.3%) make up the most common classes of employment.
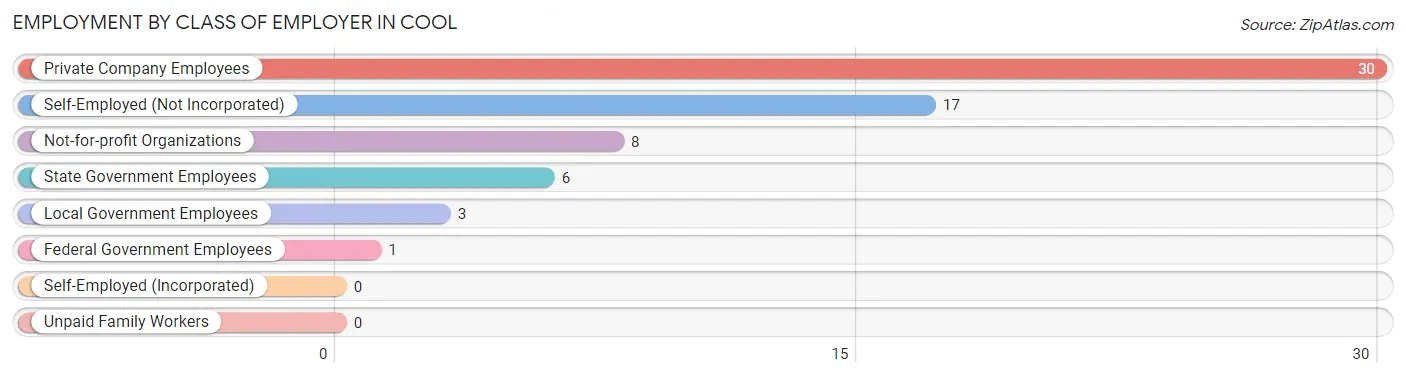
| Employer Class | # Employees | % Employees |
| Private Company Employees | 30 | 46.2% |
| Self-Employed (Incorporated) | 0 | 0.0% |
| Self-Employed (Not Incorporated) | 17 | 26.2% |
| Not-for-profit Organizations | 8 | 12.3% |
| Local Government Employees | 3 | 4.6% |
| State Government Employees | 6 | 9.2% |
| Federal Government Employees | 1 | 1.5% |
| Unpaid Family Workers | 0 | 0.0% |
| Total | 65 | 100.0% |
Employment Status by Age in Cool
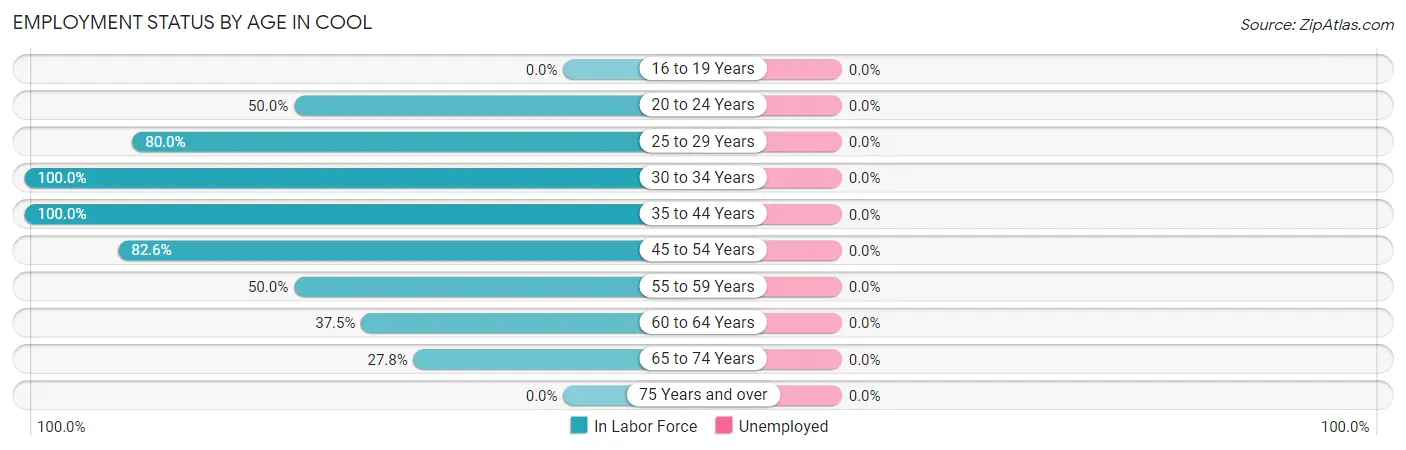
| Age Bracket | In Labor Force | Unemployed |
| 16 to 19 Years | 0 (0.0%) | 0 (0.0%) |
| 20 to 24 Years | 3 (50.0%) | 0 (0.0%) |
| 25 to 29 Years | 8 (80.0%) | 0 (0.0%) |
| 30 to 34 Years | 4 (100.0%) | 0 (0.0%) |
| 35 to 44 Years | 20 (100.0%) | 0 (0.0%) |
| 45 to 54 Years | 19 (82.6%) | 0 (0.0%) |
| 55 to 59 Years | 3 (50.0%) | 0 (0.0%) |
| 60 to 64 Years | 3 (37.5%) | 0 (0.0%) |
| 65 to 74 Years | 5 (27.8%) | 0 (0.0%) |
| 75 Years and over | 0 (0.0%) | 0 (0.0%) |
| Total | 65 (56.5%) | 0 (0.0%) |
Employment Status by Educational Attainment in Cool
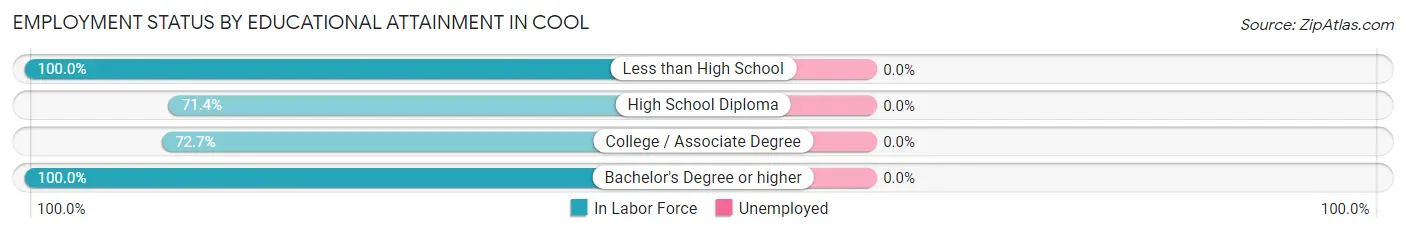
| Educational Attainment | In Labor Force | Unemployed |
| Less than High School | 8 (100.0%) | 0 (0.0%) |
| High School Diploma | 20 (71.4%) | 0 (0.0%) |
| College / Associate Degree | 16 (72.7%) | 0 (0.0%) |
| Bachelor's Degree or higher | 13 (100.0%) | 0 (0.0%) |
| Total | 57 (80.3%) | 0 (0.0%) |
Employment Occupations by Sex in Cool
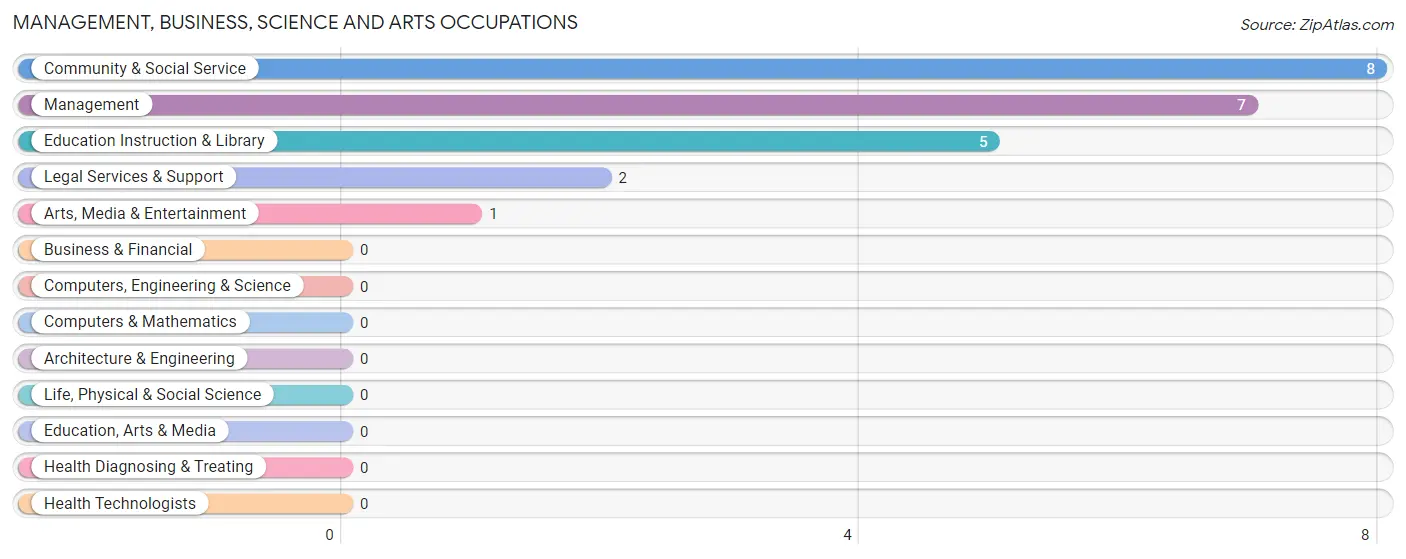
Management, Business, Science and Arts Occupations
The most common Management, Business, Science and Arts occupations in Cool are Community & Social Service (8 | 12.3%), Management (7 | 10.8%), Education Instruction & Library (5 | 7.7%), Legal Services & Support (2 | 3.1%), and Arts, Media & Entertainment (1 | 1.5%).
Management, Business, Science and Arts Occupations by Sex
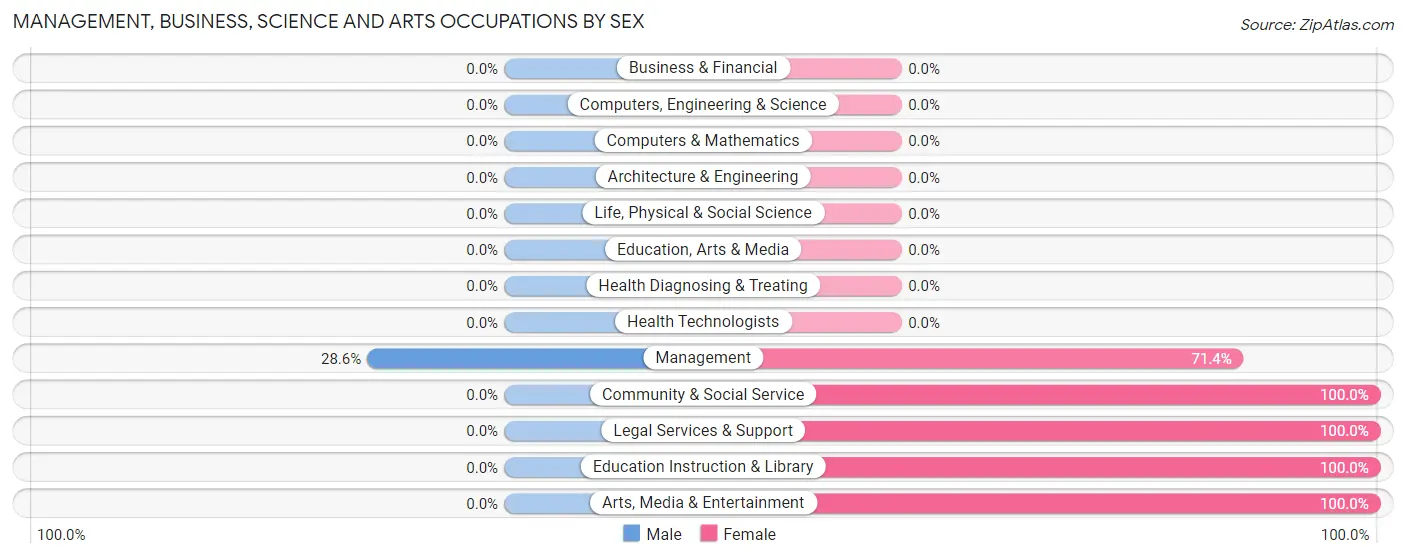
| Occupation | Male | Female |
| Management | 2 (28.6%) | 5 (71.4%) |
| Business & Financial | 0 (0.0%) | 0 (0.0%) |
| Computers, Engineering & Science | 0 (0.0%) | 0 (0.0%) |
| Computers & Mathematics | 0 (0.0%) | 0 (0.0%) |
| Architecture & Engineering | 0 (0.0%) | 0 (0.0%) |
| Life, Physical & Social Science | 0 (0.0%) | 0 (0.0%) |
| Community & Social Service | 0 (0.0%) | 8 (100.0%) |
| Education, Arts & Media | 0 (0.0%) | 0 (0.0%) |
| Legal Services & Support | 0 (0.0%) | 2 (100.0%) |
| Education Instruction & Library | 0 (0.0%) | 5 (100.0%) |
| Arts, Media & Entertainment | 0 (0.0%) | 1 (100.0%) |
| Health Diagnosing & Treating | 0 (0.0%) | 0 (0.0%) |
| Health Technologists | 0 (0.0%) | 0 (0.0%) |
| Total (Category) | 2 (13.3%) | 13 (86.7%) |
| Total (Overall) | 30 (46.2%) | 35 (53.8%) |
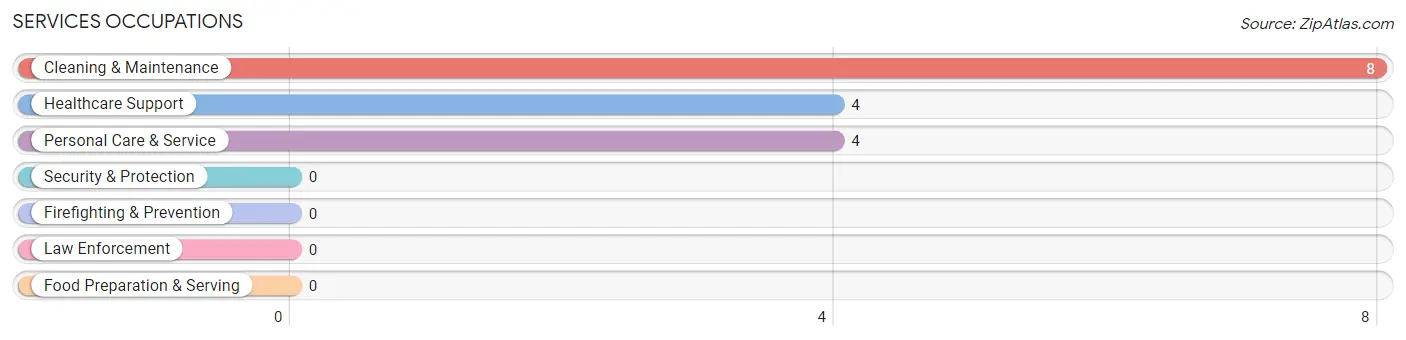
Services Occupations
The most common Services occupations in Cool are Cleaning & Maintenance (8 | 12.3%), Healthcare Support (4 | 6.1%), and Personal Care & Service (4 | 6.1%).
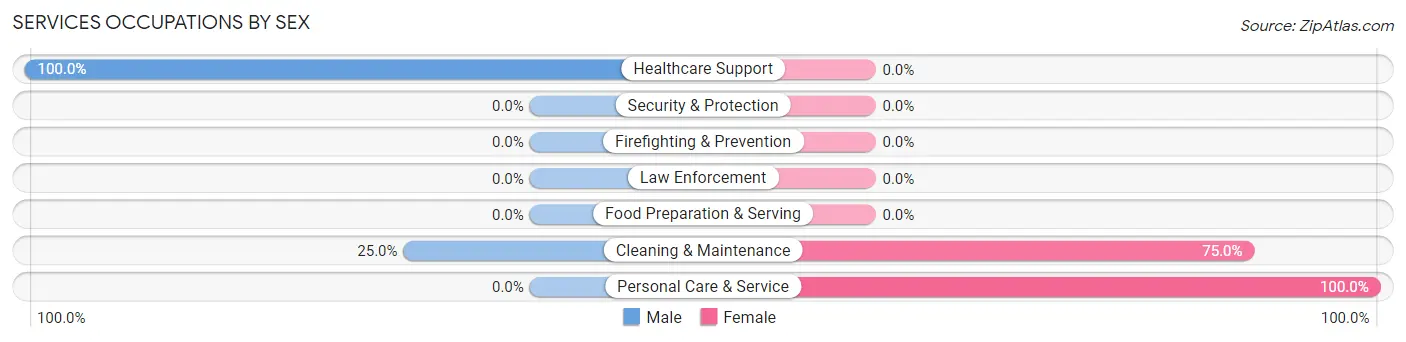
Services Occupations by Sex
Within the Services occupations in Cool, the most male-oriented occupations are Healthcare Support (100.0%), and Cleaning & Maintenance (25.0%), while the most female-oriented occupations are Personal Care & Service (100.0%), and Cleaning & Maintenance (75.0%).
| Occupation | Male | Female |
| Healthcare Support | 4 (100.0%) | 0 (0.0%) |
| Security & Protection | 0 (0.0%) | 0 (0.0%) |
| Firefighting & Prevention | 0 (0.0%) | 0 (0.0%) |
| Law Enforcement | 0 (0.0%) | 0 (0.0%) |
| Food Preparation & Serving | 0 (0.0%) | 0 (0.0%) |
| Cleaning & Maintenance | 2 (25.0%) | 6 (75.0%) |
| Personal Care & Service | 0 (0.0%) | 4 (100.0%) |
| Total (Category) | 6 (37.5%) | 10 (62.5%) |
| Total (Overall) | 30 (46.2%) | 35 (53.8%) |
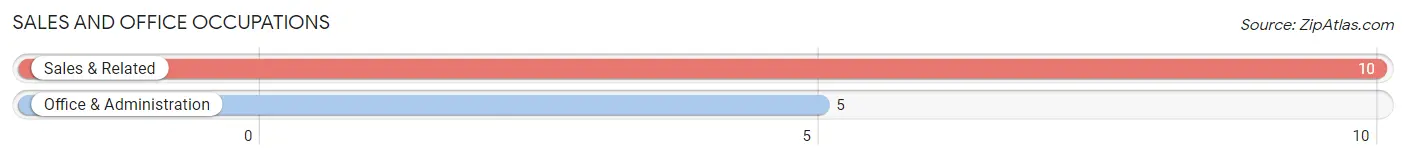
Sales and Office Occupations
The most common Sales and Office occupations in Cool are Sales & Related (10 | 15.4%), and Office & Administration (5 | 7.7%).
Sales and Office Occupations by Sex
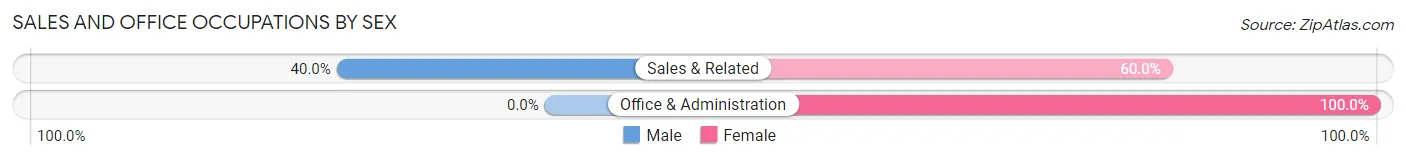
| Occupation | Male | Female |
| Sales & Related | 4 (40.0%) | 6 (60.0%) |
| Office & Administration | 0 (0.0%) | 5 (100.0%) |
| Total (Category) | 4 (26.7%) | 11 (73.3%) |
| Total (Overall) | 30 (46.2%) | 35 (53.8%) |
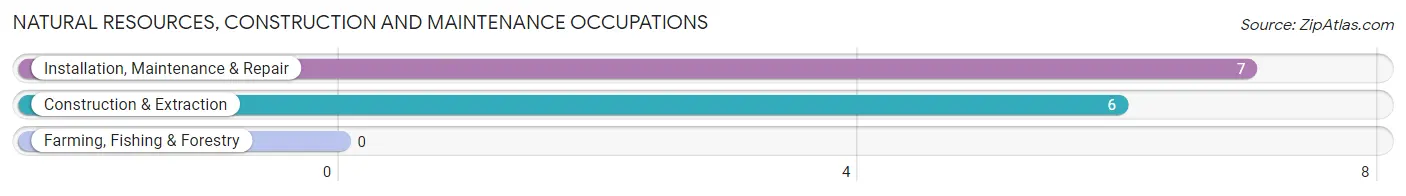
Natural Resources, Construction and Maintenance Occupations
The most common Natural Resources, Construction and Maintenance occupations in Cool are Installation, Maintenance & Repair (7 | 10.8%), and Construction & Extraction (6 | 9.2%).
Natural Resources, Construction and Maintenance Occupations by Sex
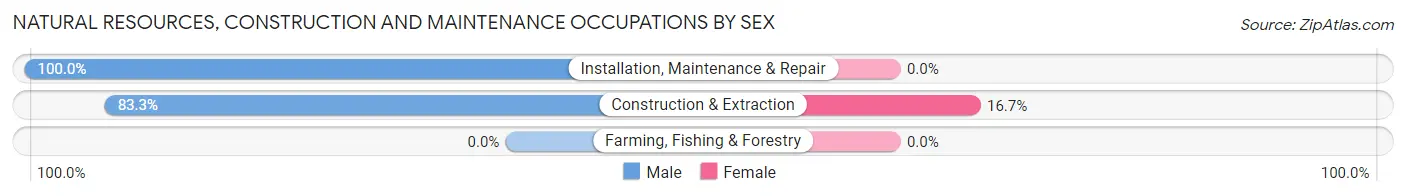
| Occupation | Male | Female |
| Farming, Fishing & Forestry | 0 (0.0%) | 0 (0.0%) |
| Construction & Extraction | 5 (83.3%) | 1 (16.7%) |
| Installation, Maintenance & Repair | 7 (100.0%) | 0 (0.0%) |
| Total (Category) | 12 (92.3%) | 1 (7.7%) |
| Total (Overall) | 30 (46.2%) | 35 (53.8%) |
Production, Transportation and Moving Occupations
The most common Production, Transportation and Moving occupations in Cool are Transportation (5 | 7.7%), and Material Moving (1 | 1.5%).
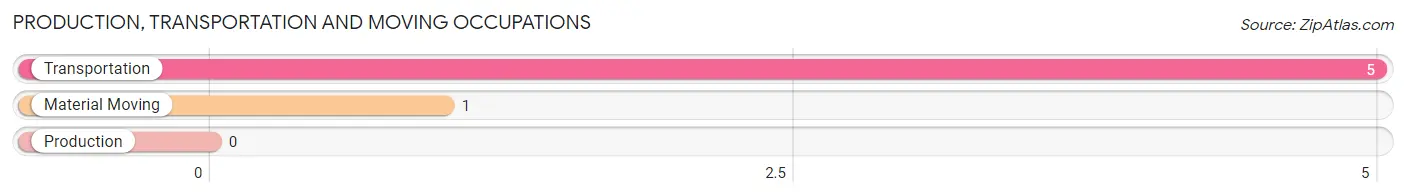
Production, Transportation and Moving Occupations by Sex
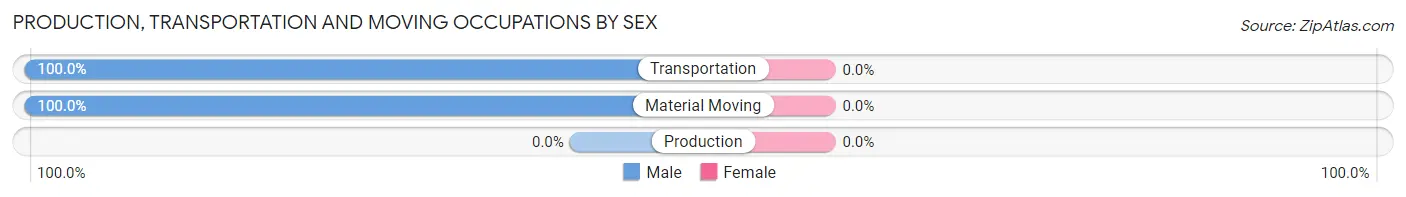
| Occupation | Male | Female |
| Production | 0 (0.0%) | 0 (0.0%) |
| Transportation | 5 (100.0%) | 0 (0.0%) |
| Material Moving | 1 (100.0%) | 0 (0.0%) |
| Total (Category) | 6 (100.0%) | 0 (0.0%) |
| Total (Overall) | 30 (46.2%) | 35 (53.8%) |
Employment Industries by Sex in Cool
Employment Industries in Cool
The major employment industries in Cool include Educational Services (13 | 20.0%), Retail Trade (7 | 10.8%), Construction (6 | 9.2%), Administrative & Support (6 | 9.2%), and Health Care & Social Assistance (6 | 9.2%).
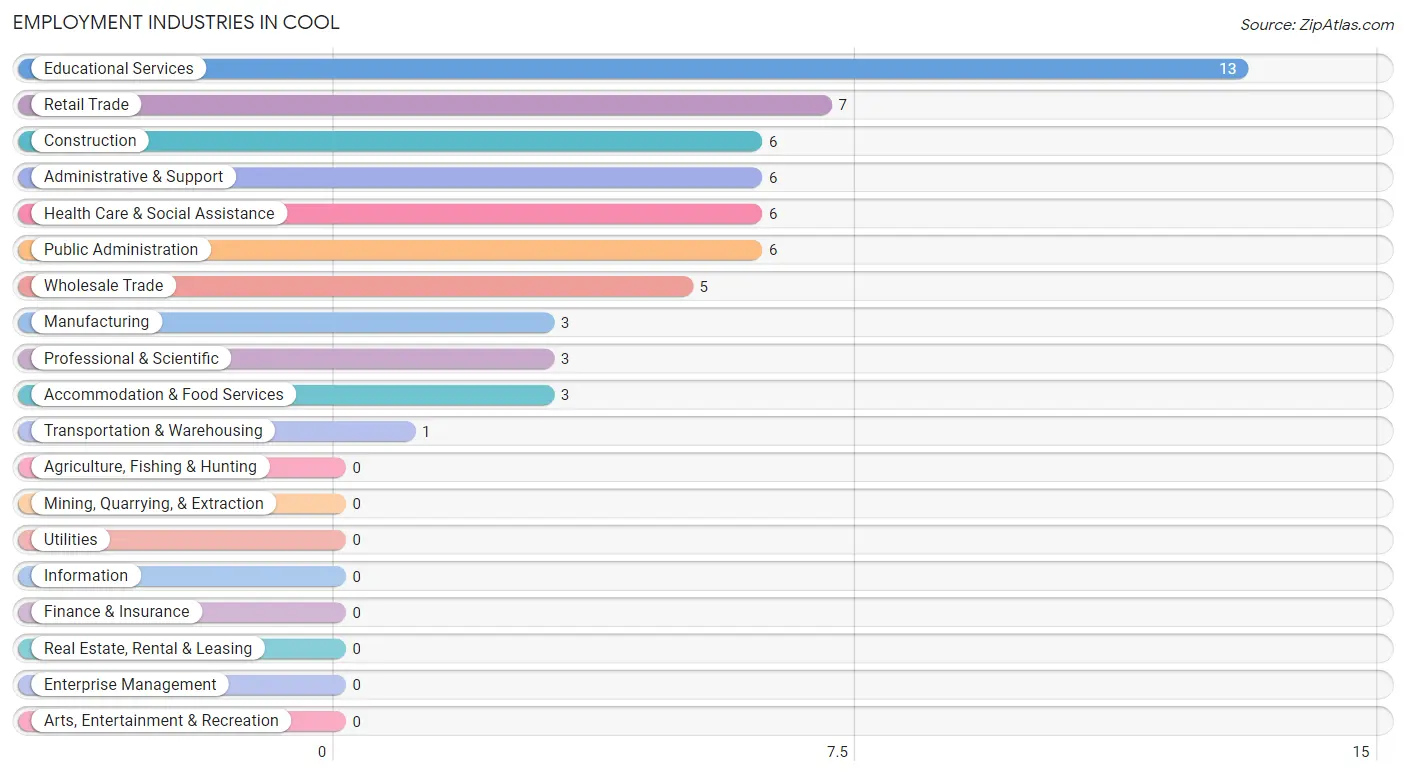
Employment Industries by Sex in Cool
The Cool industries that see more men than women are Manufacturing (100.0%), Wholesale Trade (100.0%), and Construction (83.3%), whereas the industries that tend to have a higher number of women are Transportation & Warehousing (100.0%), Professional & Scientific (100.0%), and Accommodation & Food Services (100.0%).
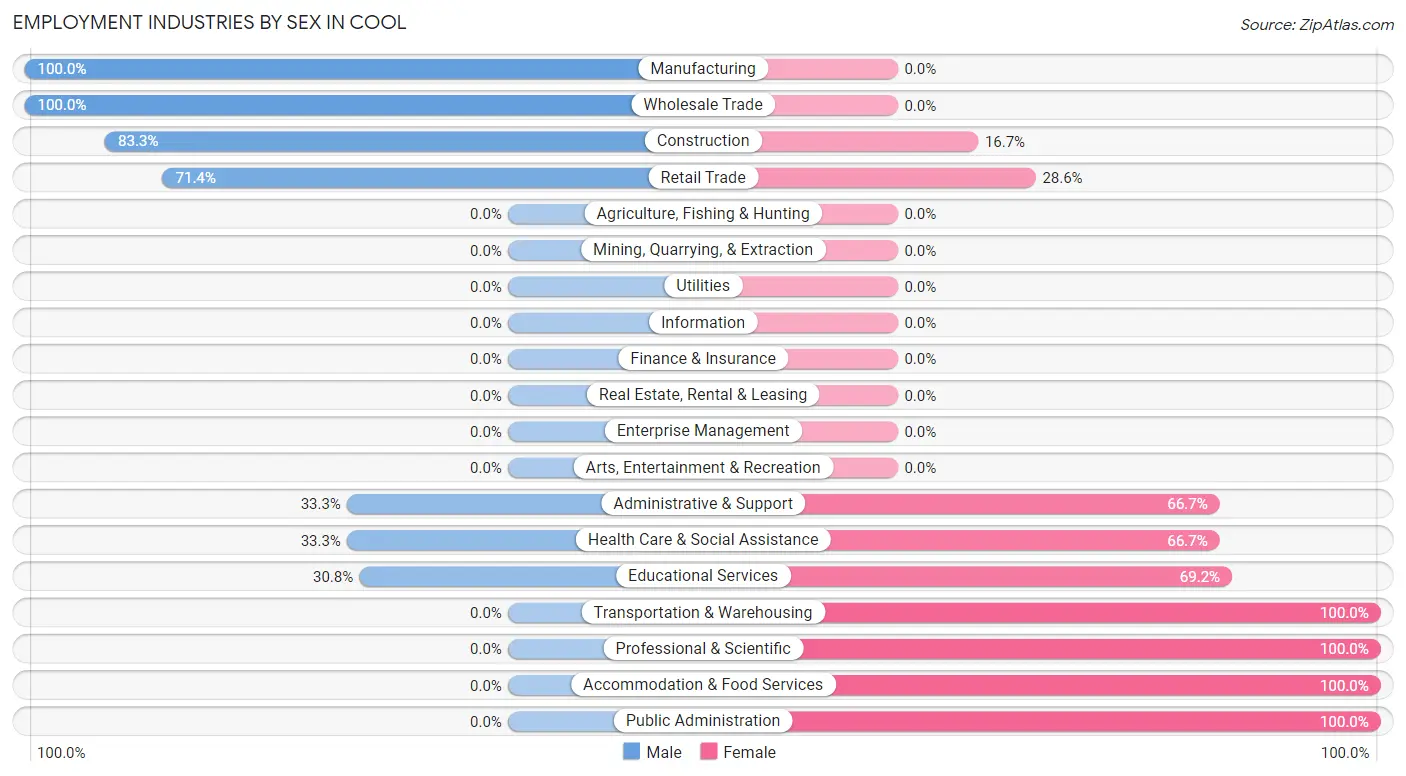
| Industry | Male | Female |
| Agriculture, Fishing & Hunting | 0 (0.0%) | 0 (0.0%) |
| Mining, Quarrying, & Extraction | 0 (0.0%) | 0 (0.0%) |
| Construction | 5 (83.3%) | 1 (16.7%) |
| Manufacturing | 3 (100.0%) | 0 (0.0%) |
| Wholesale Trade | 5 (100.0%) | 0 (0.0%) |
| Retail Trade | 5 (71.4%) | 2 (28.6%) |
| Transportation & Warehousing | 0 (0.0%) | 1 (100.0%) |
| Utilities | 0 (0.0%) | 0 (0.0%) |
| Information | 0 (0.0%) | 0 (0.0%) |
| Finance & Insurance | 0 (0.0%) | 0 (0.0%) |
| Real Estate, Rental & Leasing | 0 (0.0%) | 0 (0.0%) |
| Professional & Scientific | 0 (0.0%) | 3 (100.0%) |
| Enterprise Management | 0 (0.0%) | 0 (0.0%) |
| Administrative & Support | 2 (33.3%) | 4 (66.7%) |
| Educational Services | 4 (30.8%) | 9 (69.2%) |
| Health Care & Social Assistance | 2 (33.3%) | 4 (66.7%) |
| Arts, Entertainment & Recreation | 0 (0.0%) | 0 (0.0%) |
| Accommodation & Food Services | 0 (0.0%) | 3 (100.0%) |
| Public Administration | 0 (0.0%) | 6 (100.0%) |
| Total | 30 (46.2%) | 35 (53.8%) |
Education in Cool
School Enrollment in Cool
The most common levels of schooling among the 11 students in Cool are graduate / professional (5 | 45.5%), elementary school (3 | 27.3%), and high school (2 | 18.2%).
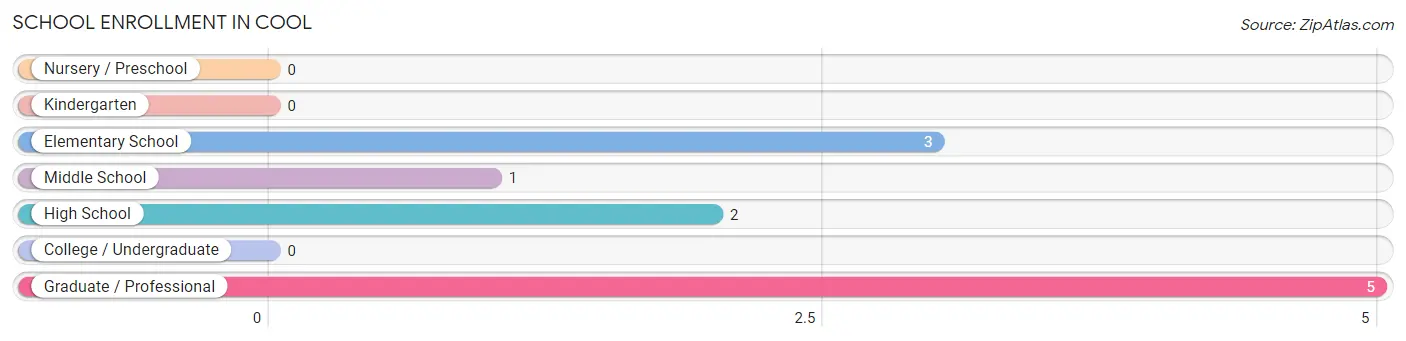
| School Level | # Students | % Students |
| Nursery / Preschool | 0 | 0.0% |
| Kindergarten | 0 | 0.0% |
| Elementary School | 3 | 27.3% |
| Middle School | 1 | 9.1% |
| High School | 2 | 18.2% |
| College / Undergraduate | 0 | 0.0% |
| Graduate / Professional | 5 | 45.5% |
| Total | 11 | 100.0% |
School Enrollment by Age by Funding Source in Cool
Out of a total of 11 students who are enrolled in schools in Cool, 8 (72.7%) attend a private institution, while the remaining 3 (27.3%) are enrolled in public schools. The age group of 5 to 9 year old has the highest likelihood of being enrolled in private schools, with 3 (100.0% in the age bracket) enrolled. Conversely, the age group of 15 to 17 year olds has the lowest likelihood of being enrolled in a private school, with 2 (100.0% in the age bracket) attending a public institution.
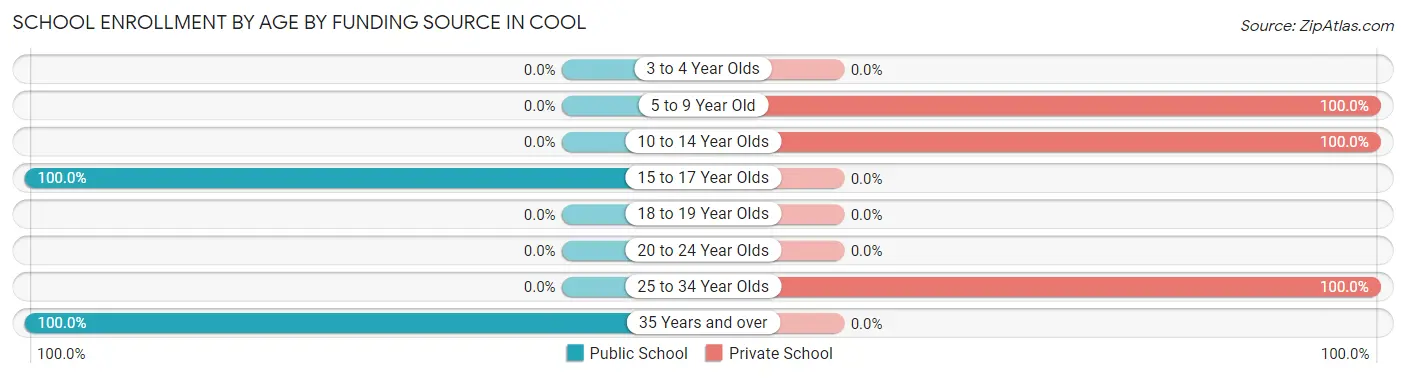
| Age Bracket | Public School | Private School |
| 3 to 4 Year Olds | 0 (0.0%) | 0 (0.0%) |
| 5 to 9 Year Old | 0 (0.0%) | 3 (100.0%) |
| 10 to 14 Year Olds | 0 (0.0%) | 1 (100.0%) |
| 15 to 17 Year Olds | 2 (100.0%) | 0 (0.0%) |
| 18 to 19 Year Olds | 0 (0.0%) | 0 (0.0%) |
| 20 to 24 Year Olds | 0 (0.0%) | 0 (0.0%) |
| 25 to 34 Year Olds | 0 (0.0%) | 4 (100.0%) |
| 35 Years and over | 1 (100.0%) | 0 (0.0%) |
| Total | 3 (27.3%) | 8 (72.7%) |
Educational Attainment by Field of Study in Cool
Engineering (5 | 25.0%), arts & humanities (4 | 20.0%), business (3 | 15.0%), education (3 | 15.0%), and computers & mathematics (2 | 10.0%) are the most common fields of study among 20 individuals in Cool who have obtained a bachelor's degree or higher.
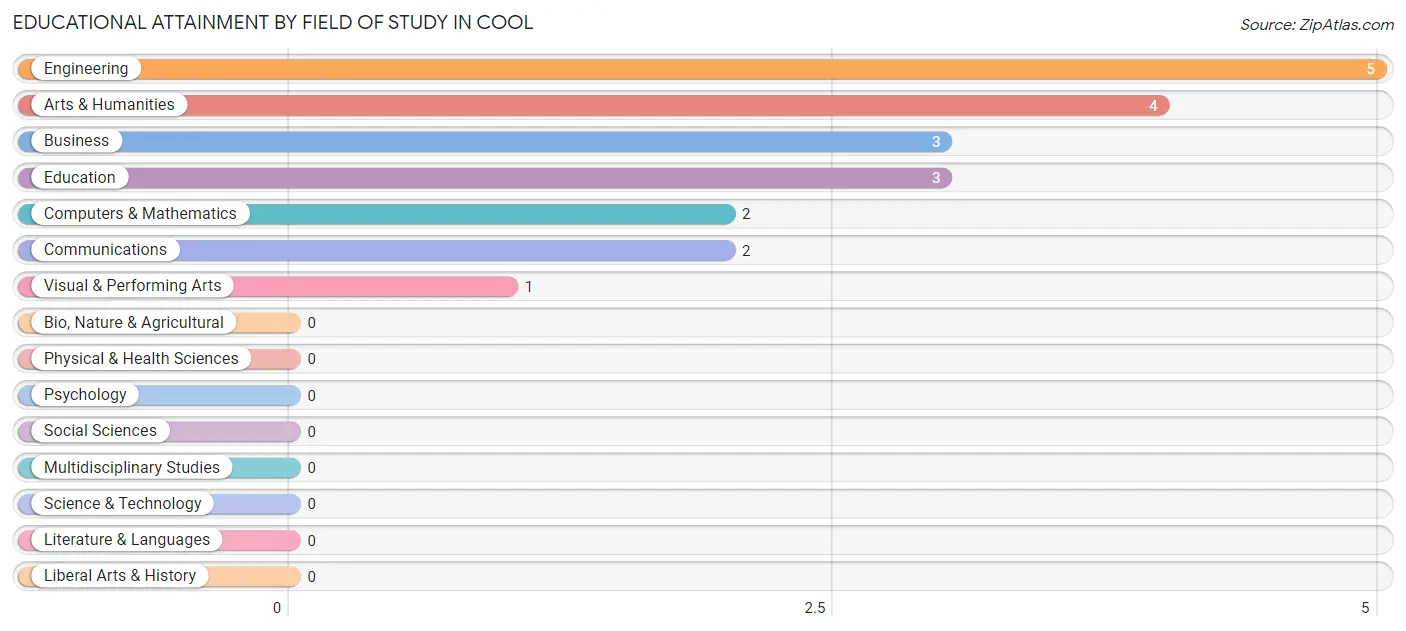
| Field of Study | # Graduates | % Graduates |
| Computers & Mathematics | 2 | 10.0% |
| Bio, Nature & Agricultural | 0 | 0.0% |
| Physical & Health Sciences | 0 | 0.0% |
| Psychology | 0 | 0.0% |
| Social Sciences | 0 | 0.0% |
| Engineering | 5 | 25.0% |
| Multidisciplinary Studies | 0 | 0.0% |
| Science & Technology | 0 | 0.0% |
| Business | 3 | 15.0% |
| Education | 3 | 15.0% |
| Literature & Languages | 0 | 0.0% |
| Liberal Arts & History | 0 | 0.0% |
| Visual & Performing Arts | 1 | 5.0% |
| Communications | 2 | 10.0% |
| Arts & Humanities | 4 | 20.0% |
| Total | 20 | 100.0% |
Transportation & Commute in Cool
Vehicle Availability by Sex in Cool
The most prevalent vehicle ownership categories in Cool are males with 3 vehicles (12, accounting for 40.0%) and females with 3 vehicles (13, making up 34.3%).
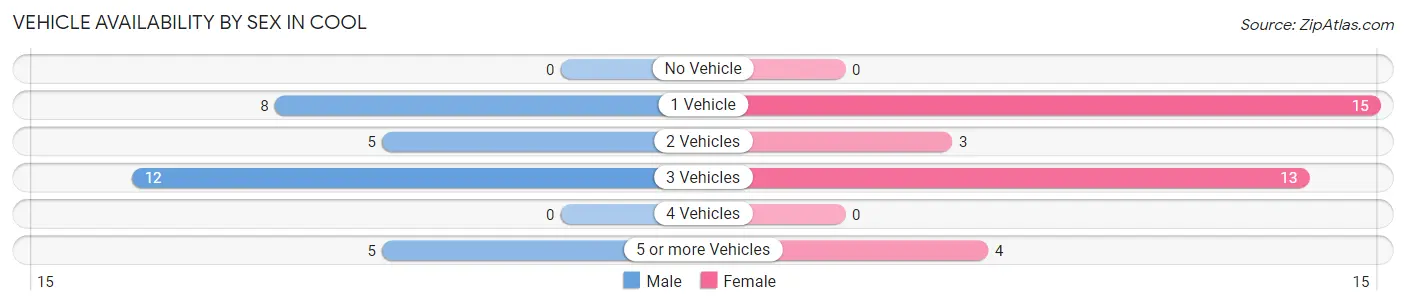
| Vehicles Available | Male | Female |
| No Vehicle | 0 (0.0%) | 0 (0.0%) |
| 1 Vehicle | 8 (26.7%) | 15 (42.9%) |
| 2 Vehicles | 5 (16.7%) | 3 (8.6%) |
| 3 Vehicles | 12 (40.0%) | 13 (37.1%) |
| 4 Vehicles | 0 (0.0%) | 0 (0.0%) |
| 5 or more Vehicles | 5 (16.7%) | 4 (11.4%) |
| Total | 30 (100.0%) | 35 (100.0%) |
Commute Time in Cool
The most frequently occuring commute durations in Cool are 30 to 34 minutes (16 commuters, 25.4%), 45 to 59 minutes (14 commuters, 22.2%), and 20 to 24 minutes (11 commuters, 17.5%).
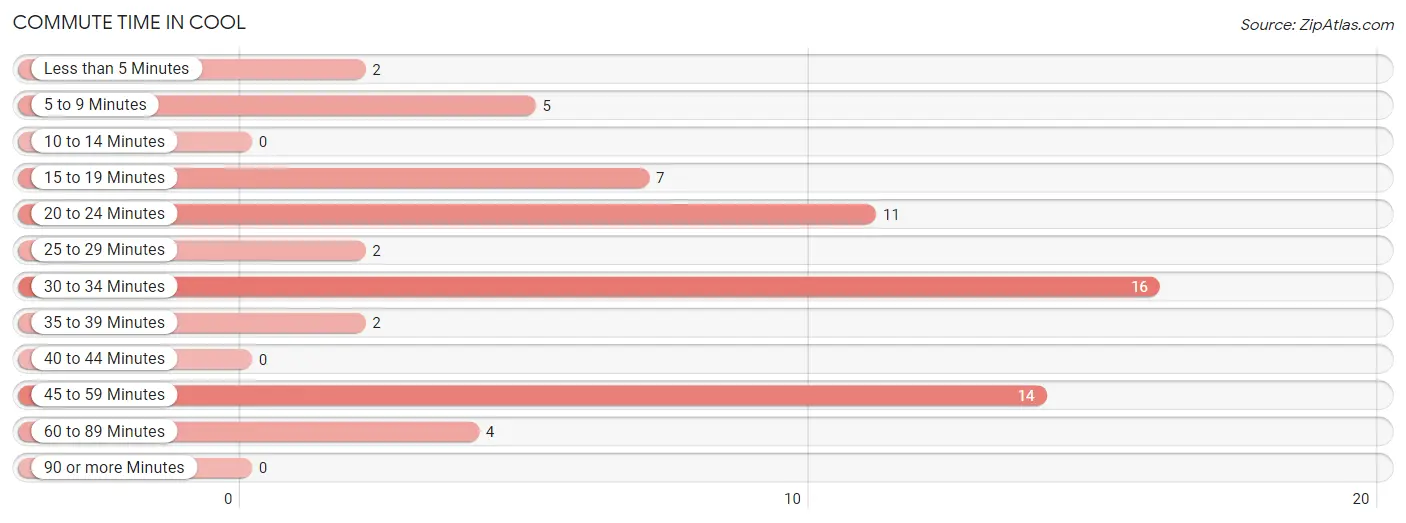
| Commute Time | # Commuters | % Commuters |
| Less than 5 Minutes | 2 | 3.2% |
| 5 to 9 Minutes | 5 | 7.9% |
| 10 to 14 Minutes | 0 | 0.0% |
| 15 to 19 Minutes | 7 | 11.1% |
| 20 to 24 Minutes | 11 | 17.5% |
| 25 to 29 Minutes | 2 | 3.2% |
| 30 to 34 Minutes | 16 | 25.4% |
| 35 to 39 Minutes | 2 | 3.2% |
| 40 to 44 Minutes | 0 | 0.0% |
| 45 to 59 Minutes | 14 | 22.2% |
| 60 to 89 Minutes | 4 | 6.4% |
| 90 or more Minutes | 0 | 0.0% |
Commute Time by Sex in Cool
The most common commute times in Cool are 45 to 59 minutes (8 commuters, 26.7%) for males and 20 to 24 minutes (11 commuters, 33.3%) for females.
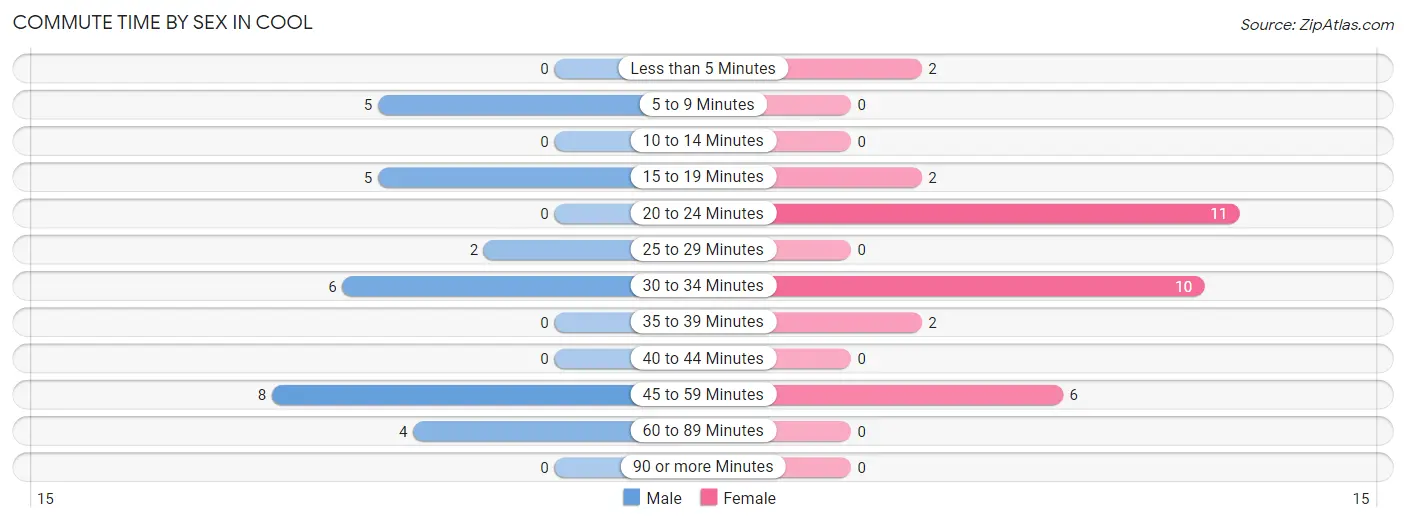
| Commute Time | Male | Female |
| Less than 5 Minutes | 0 (0.0%) | 2 (6.1%) |
| 5 to 9 Minutes | 5 (16.7%) | 0 (0.0%) |
| 10 to 14 Minutes | 0 (0.0%) | 0 (0.0%) |
| 15 to 19 Minutes | 5 (16.7%) | 2 (6.1%) |
| 20 to 24 Minutes | 0 (0.0%) | 11 (33.3%) |
| 25 to 29 Minutes | 2 (6.7%) | 0 (0.0%) |
| 30 to 34 Minutes | 6 (20.0%) | 10 (30.3%) |
| 35 to 39 Minutes | 0 (0.0%) | 2 (6.1%) |
| 40 to 44 Minutes | 0 (0.0%) | 0 (0.0%) |
| 45 to 59 Minutes | 8 (26.7%) | 6 (18.2%) |
| 60 to 89 Minutes | 4 (13.3%) | 0 (0.0%) |
| 90 or more Minutes | 0 (0.0%) | 0 (0.0%) |
Time of Departure to Work by Sex in Cool
The most frequent times of departure to work in Cool are 9:00 AM to 9:59 AM (10, 33.3%) for males and 7:00 AM to 7:29 AM (8, 24.2%) for females.

| Time of Departure | Male | Female |
| 12:00 AM to 4:59 AM | 5 (16.7%) | 0 (0.0%) |
| 5:00 AM to 5:29 AM | 2 (6.7%) | 0 (0.0%) |
| 5:30 AM to 5:59 AM | 0 (0.0%) | 0 (0.0%) |
| 6:00 AM to 6:29 AM | 5 (16.7%) | 6 (18.2%) |
| 6:30 AM to 6:59 AM | 0 (0.0%) | 0 (0.0%) |
| 7:00 AM to 7:29 AM | 2 (6.7%) | 8 (24.2%) |
| 7:30 AM to 7:59 AM | 0 (0.0%) | 5 (15.1%) |
| 8:00 AM to 8:29 AM | 6 (20.0%) | 3 (9.1%) |
| 8:30 AM to 8:59 AM | 0 (0.0%) | 6 (18.2%) |
| 9:00 AM to 9:59 AM | 10 (33.3%) | 0 (0.0%) |
| 10:00 AM to 10:59 AM | 0 (0.0%) | 5 (15.1%) |
| 11:00 AM to 11:59 AM | 0 (0.0%) | 0 (0.0%) |
| 12:00 PM to 3:59 PM | 0 (0.0%) | 0 (0.0%) |
| 4:00 PM to 11:59 PM | 0 (0.0%) | 0 (0.0%) |
| Total | 30 (100.0%) | 33 (100.0%) |
Housing Occupancy in Cool
Occupancy by Ownership in Cool
Of the total 67 dwellings in Cool, owner-occupied units account for 52 (77.6%), while renter-occupied units make up 15 (22.4%).
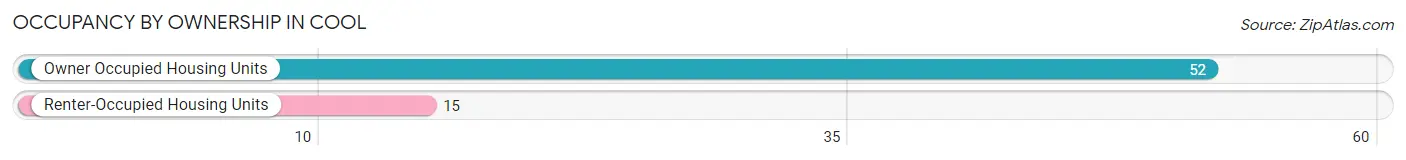
| Occupancy | # Housing Units | % Housing Units |
| Owner Occupied Housing Units | 52 | 77.6% |
| Renter-Occupied Housing Units | 15 | 22.4% |
| Total Occupied Housing Units | 67 | 100.0% |
Occupancy by Household Size in Cool
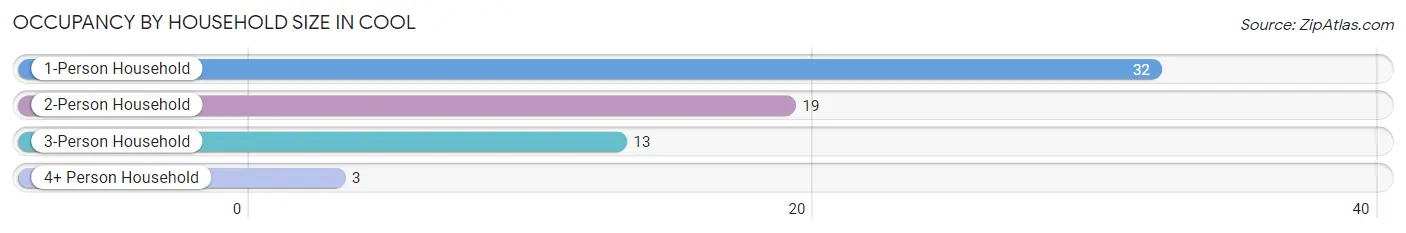
| Household Size | # Housing Units | % Housing Units |
| 1-Person Household | 32 | 47.8% |
| 2-Person Household | 19 | 28.4% |
| 3-Person Household | 13 | 19.4% |
| 4+ Person Household | 3 | 4.5% |
| Total Housing Units | 67 | 100.0% |
Occupancy by Ownership by Household Size in Cool
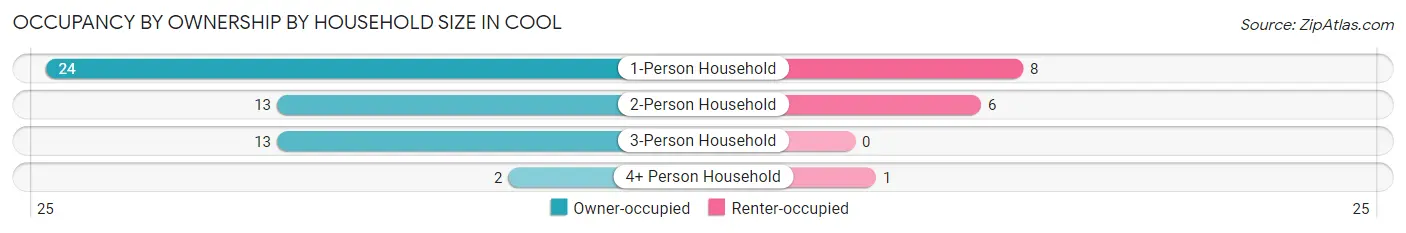
| Household Size | Owner-occupied | Renter-occupied |
| 1-Person Household | 24 (75.0%) | 8 (25.0%) |
| 2-Person Household | 13 (68.4%) | 6 (31.6%) |
| 3-Person Household | 13 (100.0%) | 0 (0.0%) |
| 4+ Person Household | 2 (66.7%) | 1 (33.3%) |
| Total Housing Units | 52 (77.6%) | 15 (22.4%) |
Occupancy by Educational Attainment in Cool
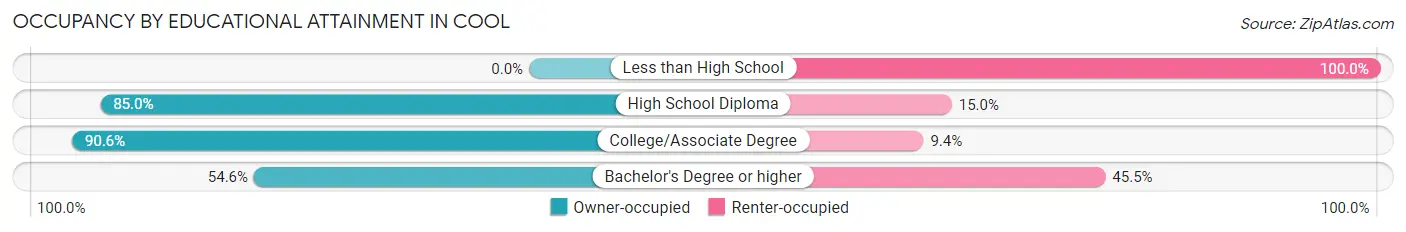
| Household Size | Owner-occupied | Renter-occupied |
| Less than High School | 0 (0.0%) | 4 (100.0%) |
| High School Diploma | 17 (85.0%) | 3 (15.0%) |
| College/Associate Degree | 29 (90.6%) | 3 (9.4%) |
| Bachelor's Degree or higher | 6 (54.5%) | 5 (45.5%) |
Occupancy by Age of Householder in Cool
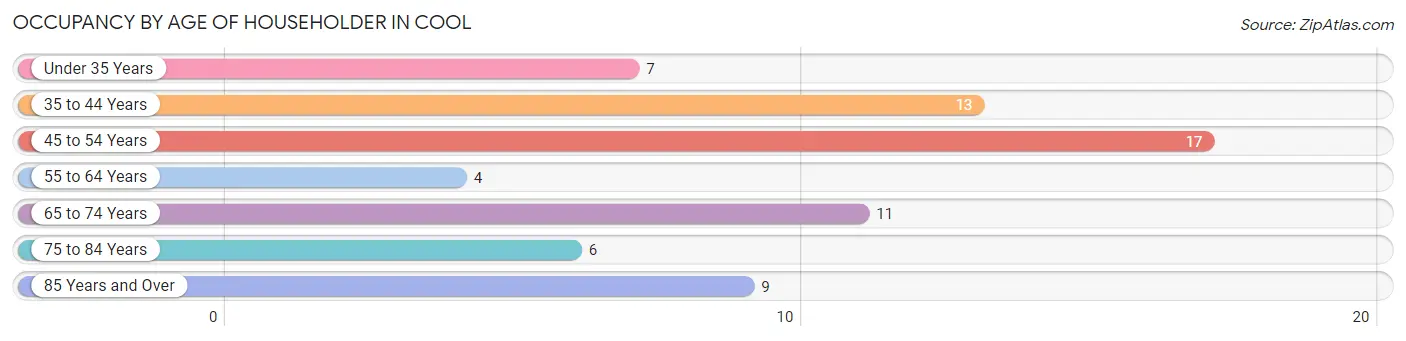
| Age Bracket | # Households | % Households |
| Under 35 Years | 7 | 10.4% |
| 35 to 44 Years | 13 | 19.4% |
| 45 to 54 Years | 17 | 25.4% |
| 55 to 64 Years | 4 | 6.0% |
| 65 to 74 Years | 11 | 16.4% |
| 75 to 84 Years | 6 | 9.0% |
| 85 Years and Over | 9 | 13.4% |
| Total | 67 | 100.0% |
Housing Finances in Cool
Median Income by Occupancy in Cool
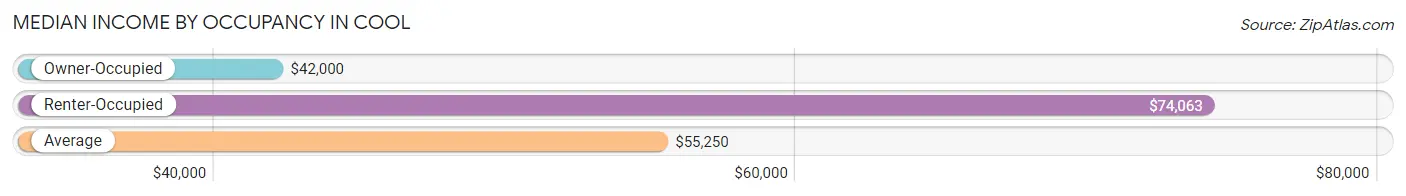
| Occupancy Type | # Households | Median Income |
| Owner-Occupied | 52 (77.6%) | $42,000 |
| Renter-Occupied | 15 (22.4%) | $74,063 |
| Average | 67 (100.0%) | $55,250 |
Occupancy by Householder Income Bracket in Cool
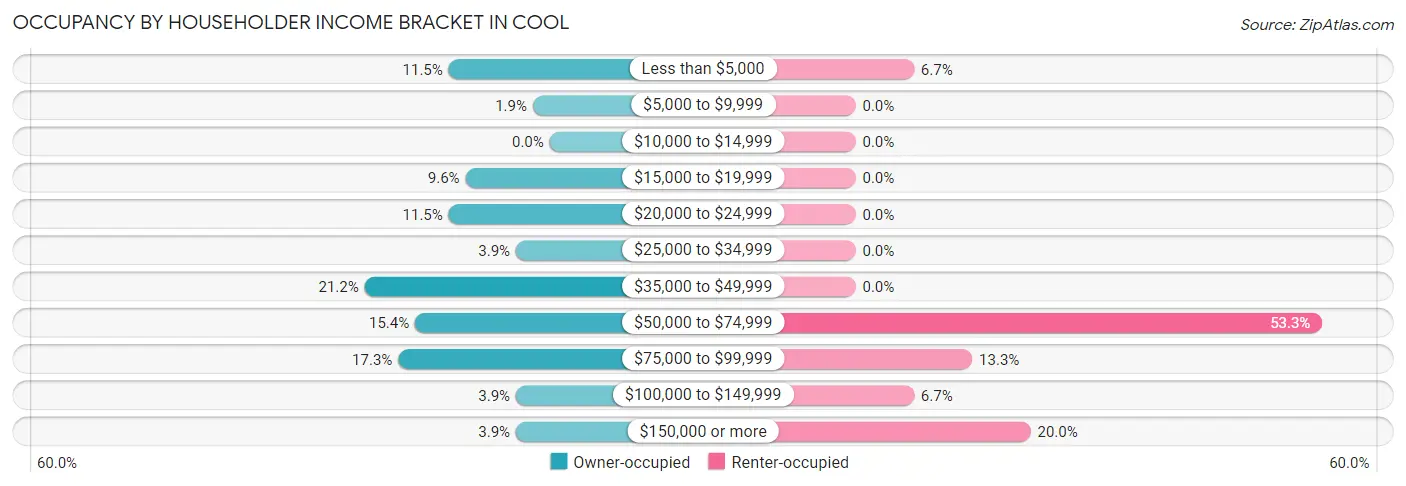
| Income Bracket | Owner-occupied | Renter-occupied |
| Less than $5,000 | 6 (11.5%) | 1 (6.7%) |
| $5,000 to $9,999 | 1 (1.9%) | 0 (0.0%) |
| $10,000 to $14,999 | 0 (0.0%) | 0 (0.0%) |
| $15,000 to $19,999 | 5 (9.6%) | 0 (0.0%) |
| $20,000 to $24,999 | 6 (11.5%) | 0 (0.0%) |
| $25,000 to $34,999 | 2 (3.8%) | 0 (0.0%) |
| $35,000 to $49,999 | 11 (21.1%) | 0 (0.0%) |
| $50,000 to $74,999 | 8 (15.4%) | 8 (53.3%) |
| $75,000 to $99,999 | 9 (17.3%) | 2 (13.3%) |
| $100,000 to $149,999 | 2 (3.8%) | 1 (6.7%) |
| $150,000 or more | 2 (3.8%) | 3 (20.0%) |
| Total | 52 (100.0%) | 15 (100.0%) |
Monthly Housing Cost Tiers in Cool
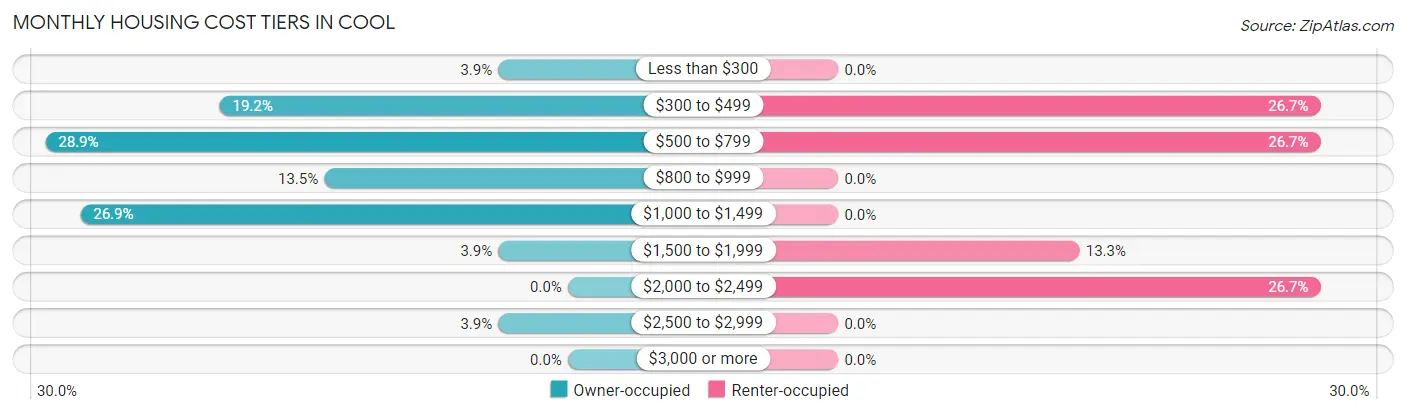
| Monthly Cost | Owner-occupied | Renter-occupied |
| Less than $300 | 2 (3.8%) | 0 (0.0%) |
| $300 to $499 | 10 (19.2%) | 4 (26.7%) |
| $500 to $799 | 15 (28.8%) | 4 (26.7%) |
| $800 to $999 | 7 (13.5%) | 0 (0.0%) |
| $1,000 to $1,499 | 14 (26.9%) | 0 (0.0%) |
| $1,500 to $1,999 | 2 (3.8%) | 2 (13.3%) |
| $2,000 to $2,499 | 0 (0.0%) | 4 (26.7%) |
| $2,500 to $2,999 | 2 (3.8%) | 0 (0.0%) |
| $3,000 or more | 0 (0.0%) | 0 (0.0%) |
| Total | 52 (100.0%) | 15 (100.0%) |
Physical Housing Characteristics in Cool
Housing Structures in Cool
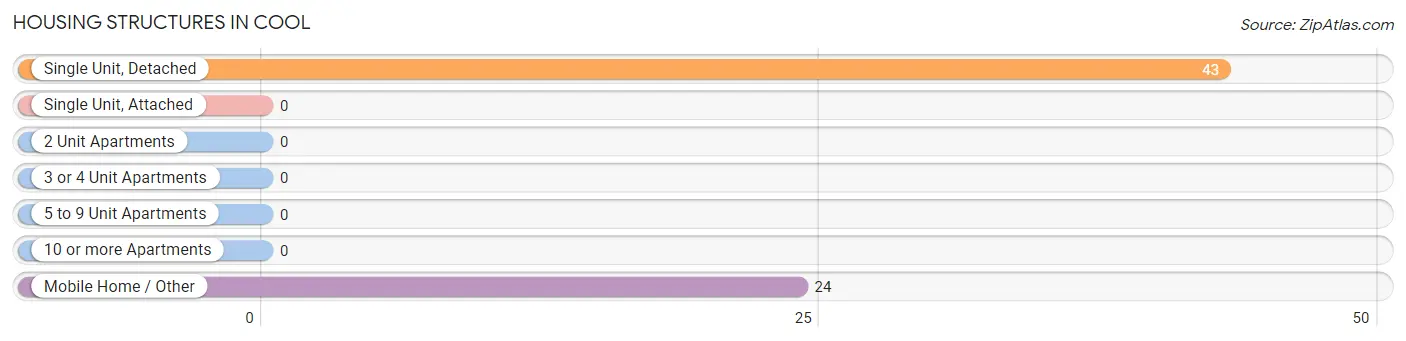
| Structure Type | # Housing Units | % Housing Units |
| Single Unit, Detached | 43 | 64.2% |
| Single Unit, Attached | 0 | 0.0% |
| 2 Unit Apartments | 0 | 0.0% |
| 3 or 4 Unit Apartments | 0 | 0.0% |
| 5 to 9 Unit Apartments | 0 | 0.0% |
| 10 or more Apartments | 0 | 0.0% |
| Mobile Home / Other | 24 | 35.8% |
| Total | 67 | 100.0% |
Housing Structures by Occupancy in Cool
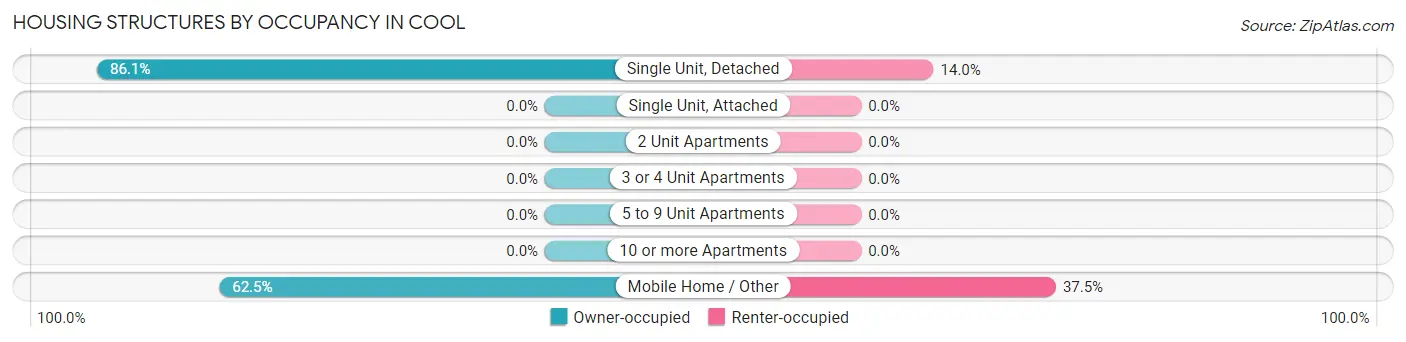
| Structure Type | Owner-occupied | Renter-occupied |
| Single Unit, Detached | 37 (86.1%) | 6 (14.0%) |
| Single Unit, Attached | 0 (0.0%) | 0 (0.0%) |
| 2 Unit Apartments | 0 (0.0%) | 0 (0.0%) |
| 3 or 4 Unit Apartments | 0 (0.0%) | 0 (0.0%) |
| 5 to 9 Unit Apartments | 0 (0.0%) | 0 (0.0%) |
| 10 or more Apartments | 0 (0.0%) | 0 (0.0%) |
| Mobile Home / Other | 15 (62.5%) | 9 (37.5%) |
| Total | 52 (77.6%) | 15 (22.4%) |
Housing Structures by Number of Rooms in Cool
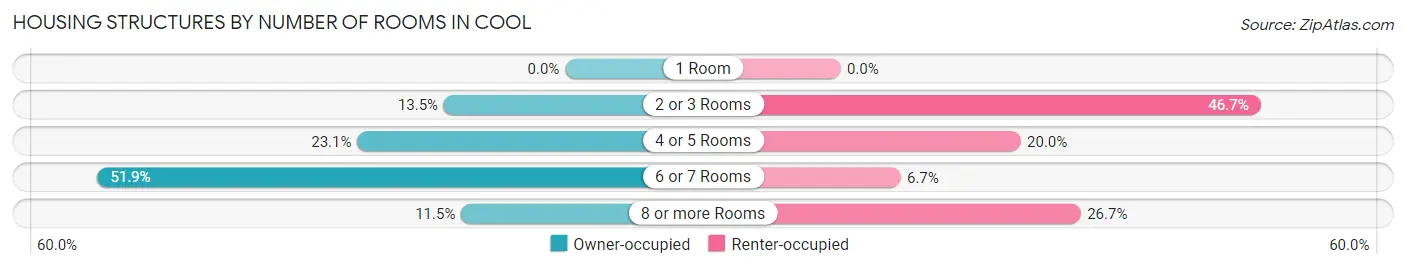
| Number of Rooms | Owner-occupied | Renter-occupied |
| 1 Room | 0 (0.0%) | 0 (0.0%) |
| 2 or 3 Rooms | 7 (13.5%) | 7 (46.7%) |
| 4 or 5 Rooms | 12 (23.1%) | 3 (20.0%) |
| 6 or 7 Rooms | 27 (51.9%) | 1 (6.7%) |
| 8 or more Rooms | 6 (11.5%) | 4 (26.7%) |
| Total | 52 (100.0%) | 15 (100.0%) |
Housing Structure by Heating Type in Cool
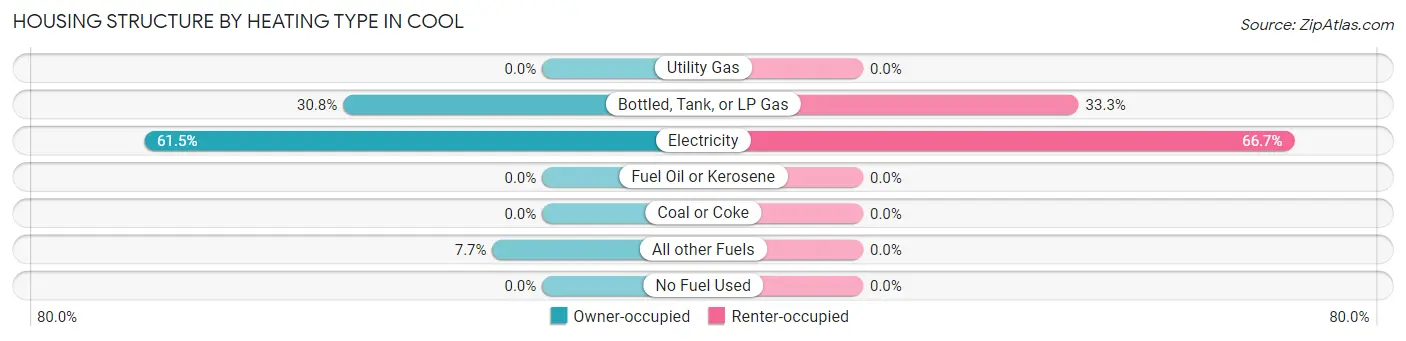
| Heating Type | Owner-occupied | Renter-occupied |
| Utility Gas | 0 (0.0%) | 0 (0.0%) |
| Bottled, Tank, or LP Gas | 16 (30.8%) | 5 (33.3%) |
| Electricity | 32 (61.5%) | 10 (66.7%) |
| Fuel Oil or Kerosene | 0 (0.0%) | 0 (0.0%) |
| Coal or Coke | 0 (0.0%) | 0 (0.0%) |
| All other Fuels | 4 (7.7%) | 0 (0.0%) |
| No Fuel Used | 0 (0.0%) | 0 (0.0%) |
| Total | 52 (100.0%) | 15 (100.0%) |
Household Vehicle Usage in Cool
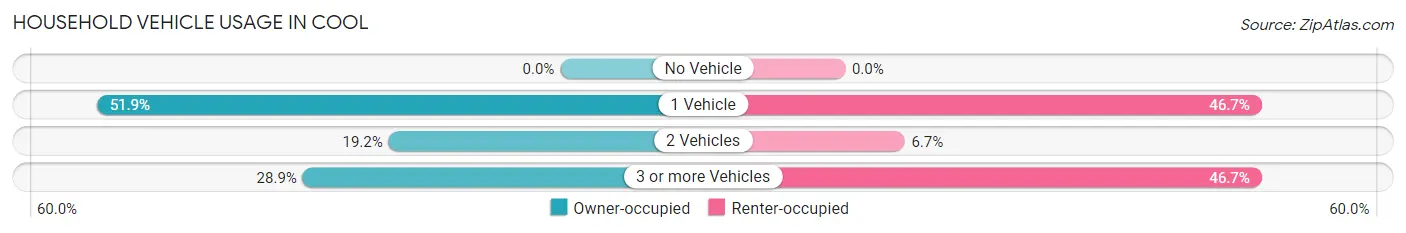
| Vehicles per Household | Owner-occupied | Renter-occupied |
| No Vehicle | 0 (0.0%) | 0 (0.0%) |
| 1 Vehicle | 27 (51.9%) | 7 (46.7%) |
| 2 Vehicles | 10 (19.2%) | 1 (6.7%) |
| 3 or more Vehicles | 15 (28.8%) | 7 (46.7%) |
| Total | 52 (100.0%) | 15 (100.0%) |
Real Estate & Mortgages in Cool
Real Estate and Mortgage Overview in Cool
| Characteristic | Without Mortgage | With Mortgage |
| Housing Units | 32 | 20 |
| Median Property Value | - | - |
| Median Household Income | $48,125 | $1 |
| Monthly Housing Costs | $580 | $0 |
| Real Estate Taxes | - | - |
Property Value by Mortgage Status in Cool
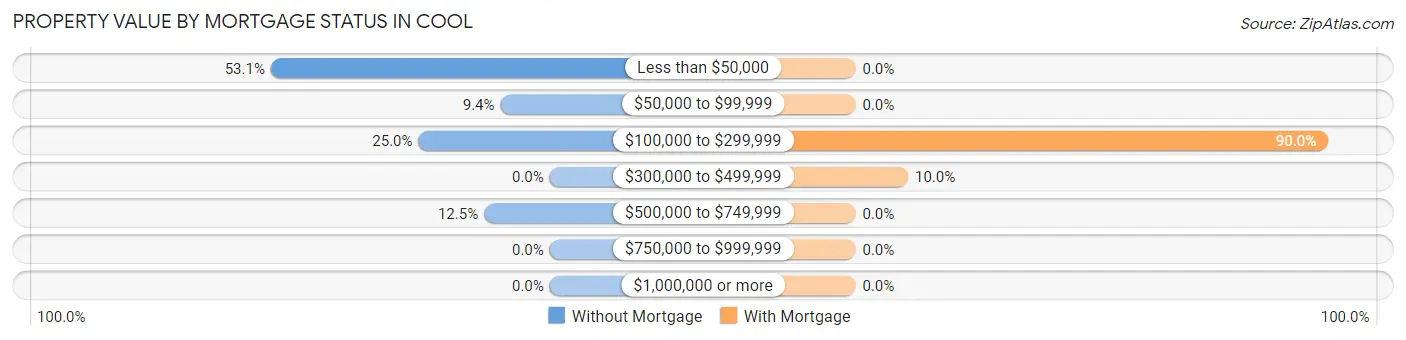
| Property Value | Without Mortgage | With Mortgage |
| Less than $50,000 | 17 (53.1%) | 0 (0.0%) |
| $50,000 to $99,999 | 3 (9.4%) | 0 (0.0%) |
| $100,000 to $299,999 | 8 (25.0%) | 18 (90.0%) |
| $300,000 to $499,999 | 0 (0.0%) | 2 (10.0%) |
| $500,000 to $749,999 | 4 (12.5%) | 0 (0.0%) |
| $750,000 to $999,999 | 0 (0.0%) | 0 (0.0%) |
| $1,000,000 or more | 0 (0.0%) | 0 (0.0%) |
| Total | 32 (100.0%) | 20 (100.0%) |
Household Income by Mortgage Status in Cool
| Household Income | Without Mortgage | With Mortgage |
| Less than $10,000 | 6 (18.8%) | 0 (0.0%) |
| $10,000 to $24,999 | 7 (21.9%) | 1 (5.0%) |
| $25,000 to $34,999 | 0 (0.0%) | 4 (20.0%) |
| $35,000 to $49,999 | 6 (18.8%) | 2 (10.0%) |
| $50,000 to $74,999 | 6 (18.8%) | 5 (25.0%) |
| $75,000 to $99,999 | 6 (18.8%) | 2 (10.0%) |
| $100,000 to $149,999 | 0 (0.0%) | 3 (15.0%) |
| $150,000 or more | 1 (3.1%) | 2 (10.0%) |
| Total | 32 (100.0%) | 20 (100.0%) |
Property Value to Household Income Ratio in Cool
| Value-to-Income Ratio | Without Mortgage | With Mortgage |
| Less than 2.0x | 13 (40.6%) | 41,500 (207,500.0%) |
| 2.0x to 2.9x | 6 (18.8%) | 6 (30.0%) |
| 3.0x to 3.9x | 8 (25.0%) | 2 (10.0%) |
| 4.0x or more | 5 (15.6%) | 0 (0.0%) |
| Total | 32 (100.0%) | 20 (100.0%) |
Real Estate Taxes by Mortgage Status in Cool
| Property Taxes | Without Mortgage | With Mortgage |
| Less than $800 | 11 (34.4%) | 0 (0.0%) |
| $800 to $1,499 | 4 (12.5%) | 0 (0.0%) |
| $800 to $1,499 | 11 (34.4%) | 8 (40.0%) |
| Total | 32 (100.0%) | 20 (100.0%) |
Health & Disability in Cool
Health Insurance Coverage by Age in Cool
| Age Bracket | With Coverage | Without Coverage |
| Under 6 Years | 3 (100.0%) | 0 (0.0%) |
| 6 to 18 Years | 6 (100.0%) | 0 (0.0%) |
| 19 to 25 Years | 0 (0.0%) | 6 (100.0%) |
| 26 to 34 Years | 5 (35.7%) | 9 (64.3%) |
| 35 to 44 Years | 20 (100.0%) | 0 (0.0%) |
| 45 to 54 Years | 14 (60.9%) | 9 (39.1%) |
| 55 to 64 Years | 6 (42.9%) | 8 (57.1%) |
| 65 to 74 Years | 18 (100.0%) | 0 (0.0%) |
| 75 Years and older | 18 (100.0%) | 0 (0.0%) |
| Total | 90 (73.8%) | 32 (26.2%) |
Health Insurance Coverage by Citizenship Status in Cool
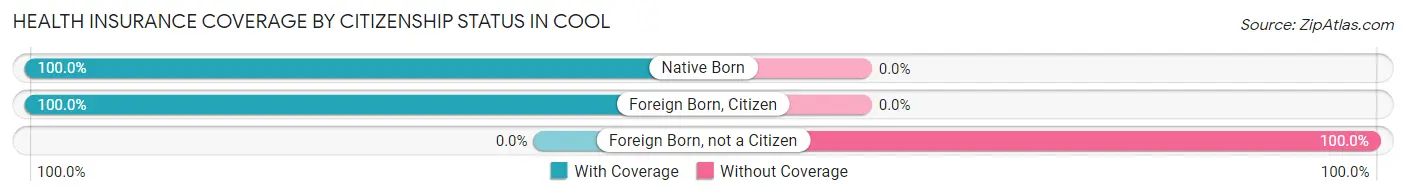
| Citizenship Status | With Coverage | Without Coverage |
| Native Born | 3 (100.0%) | 0 (0.0%) |
| Foreign Born, Citizen | 6 (100.0%) | 0 (0.0%) |
| Foreign Born, not a Citizen | 0 (0.0%) | 6 (100.0%) |
Health Insurance Coverage by Household Income in Cool
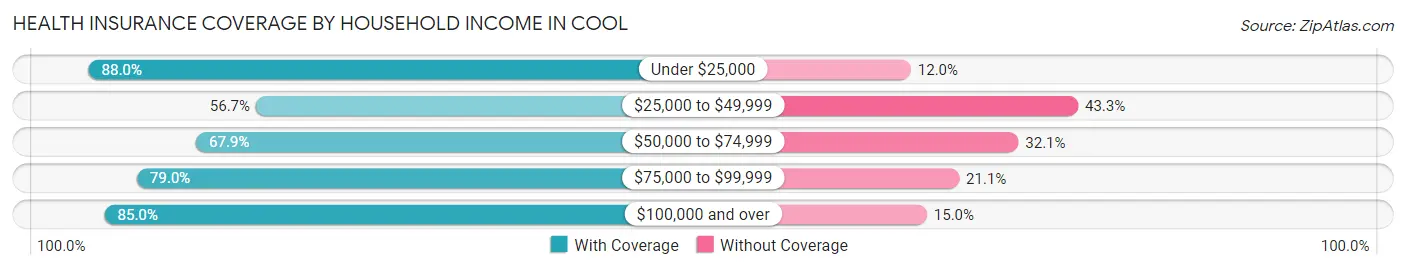
| Household Income | With Coverage | Without Coverage |
| Under $25,000 | 22 (88.0%) | 3 (12.0%) |
| $25,000 to $49,999 | 17 (56.7%) | 13 (43.3%) |
| $50,000 to $74,999 | 19 (67.9%) | 9 (32.1%) |
| $75,000 to $99,999 | 15 (78.9%) | 4 (21.0%) |
| $100,000 and over | 17 (85.0%) | 3 (15.0%) |
Public vs Private Health Insurance Coverage by Age in Cool
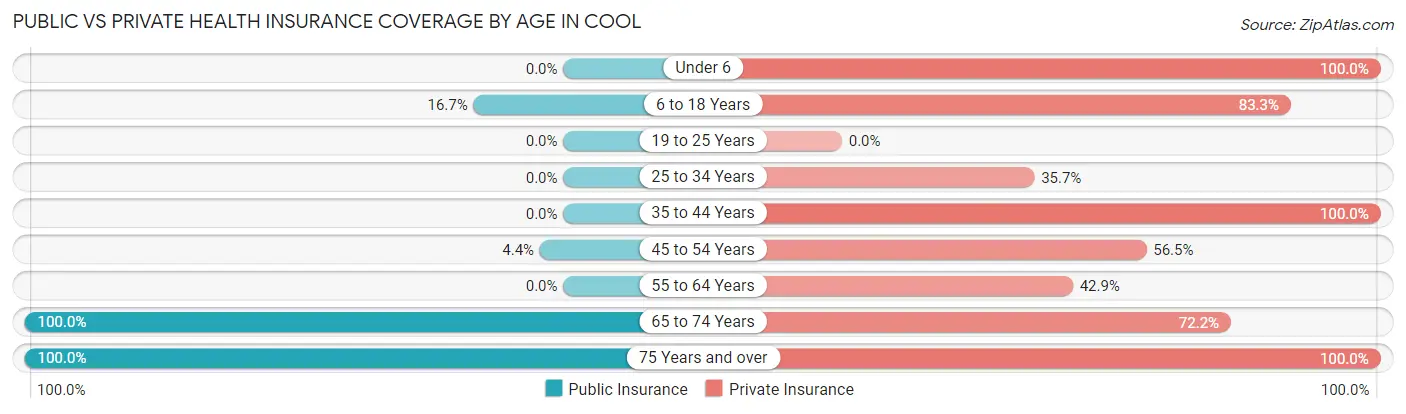
| Age Bracket | Public Insurance | Private Insurance |
| Under 6 | 0 (0.0%) | 3 (100.0%) |
| 6 to 18 Years | 1 (16.7%) | 5 (83.3%) |
| 19 to 25 Years | 0 (0.0%) | 0 (0.0%) |
| 25 to 34 Years | 0 (0.0%) | 5 (35.7%) |
| 35 to 44 Years | 0 (0.0%) | 20 (100.0%) |
| 45 to 54 Years | 1 (4.3%) | 13 (56.5%) |
| 55 to 64 Years | 0 (0.0%) | 6 (42.9%) |
| 65 to 74 Years | 18 (100.0%) | 13 (72.2%) |
| 75 Years and over | 18 (100.0%) | 18 (100.0%) |
| Total | 38 (31.1%) | 83 (68.0%) |
Disability Status by Sex by Age in Cool
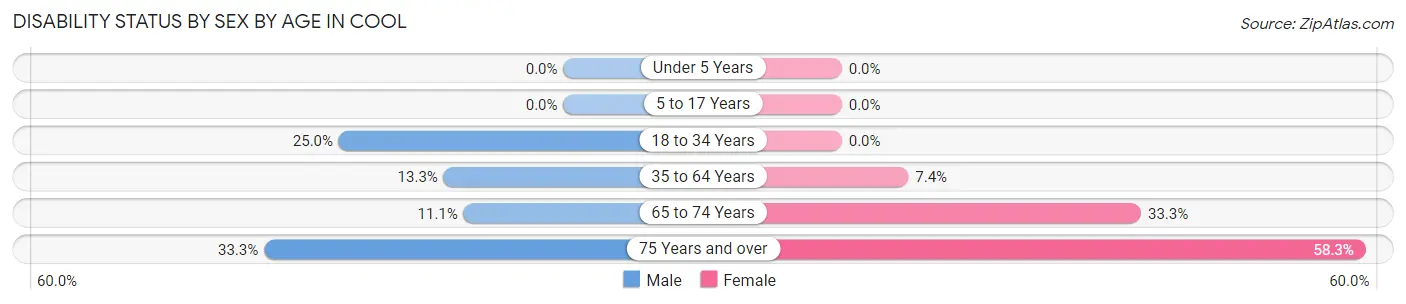
| Age Bracket | Male | Female |
| Under 5 Years | 0 (0.0%) | 0 (0.0%) |
| 5 to 17 Years | 0 (0.0%) | 0 (0.0%) |
| 18 to 34 Years | 3 (25.0%) | 0 (0.0%) |
| 35 to 64 Years | 4 (13.3%) | 2 (7.4%) |
| 65 to 74 Years | 1 (11.1%) | 3 (33.3%) |
| 75 Years and over | 2 (33.3%) | 7 (58.3%) |
Disability Class by Sex by Age in Cool
Disability Class: Hearing Difficulty
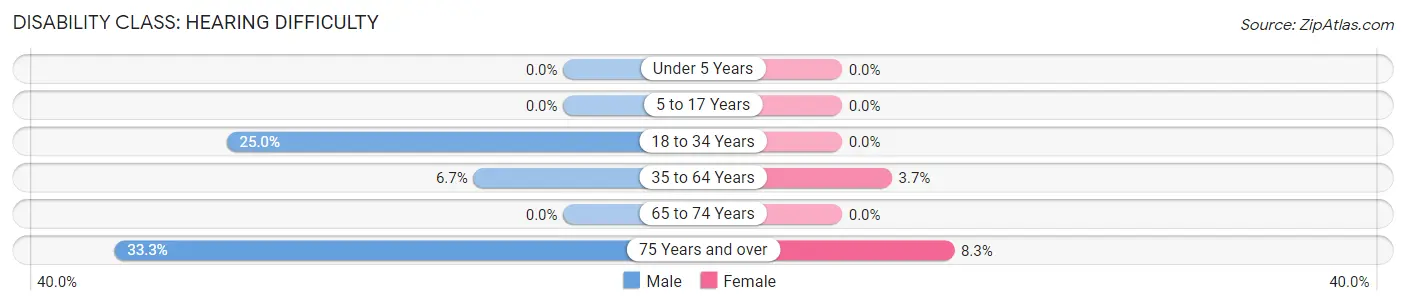
| Age Bracket | Male | Female |
| Under 5 Years | 0 (0.0%) | 0 (0.0%) |
| 5 to 17 Years | 0 (0.0%) | 0 (0.0%) |
| 18 to 34 Years | 3 (25.0%) | 0 (0.0%) |
| 35 to 64 Years | 2 (6.7%) | 1 (3.7%) |
| 65 to 74 Years | 0 (0.0%) | 0 (0.0%) |
| 75 Years and over | 2 (33.3%) | 1 (8.3%) |
Disability Class: Vision Difficulty
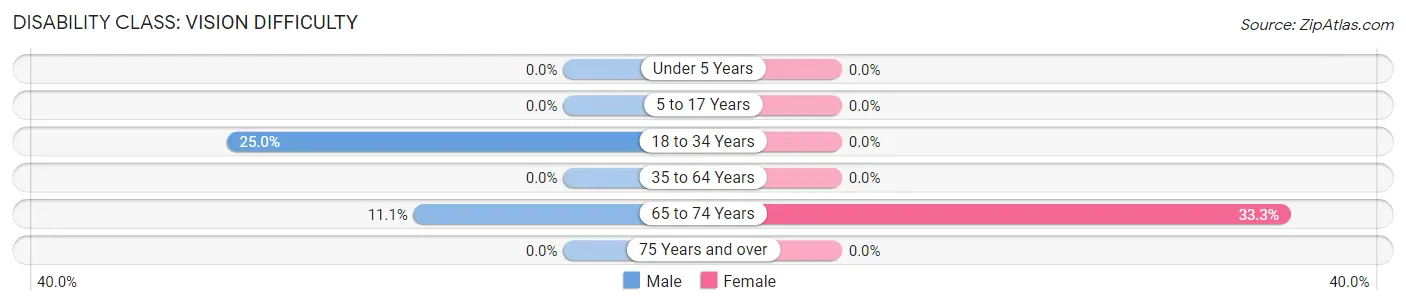
| Age Bracket | Male | Female |
| Under 5 Years | 0 (0.0%) | 0 (0.0%) |
| 5 to 17 Years | 0 (0.0%) | 0 (0.0%) |
| 18 to 34 Years | 3 (25.0%) | 0 (0.0%) |
| 35 to 64 Years | 0 (0.0%) | 0 (0.0%) |
| 65 to 74 Years | 1 (11.1%) | 3 (33.3%) |
| 75 Years and over | 0 (0.0%) | 0 (0.0%) |
Disability Class: Cognitive Difficulty
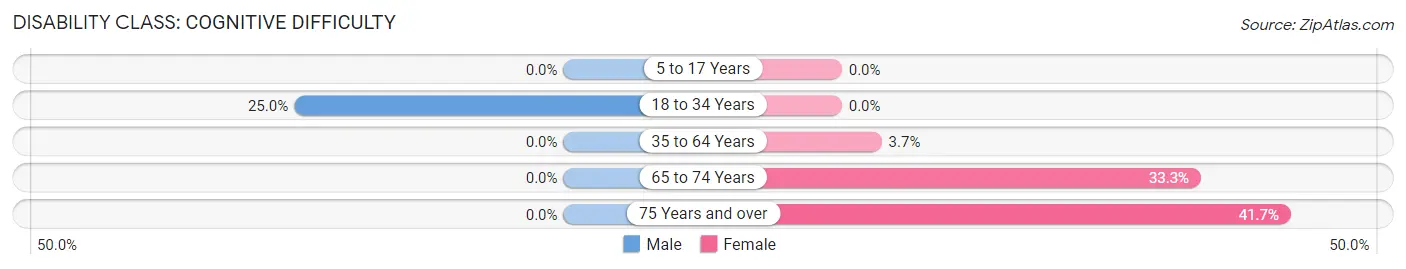
| Age Bracket | Male | Female |
| 5 to 17 Years | 0 (0.0%) | 0 (0.0%) |
| 18 to 34 Years | 3 (25.0%) | 0 (0.0%) |
| 35 to 64 Years | 0 (0.0%) | 1 (3.7%) |
| 65 to 74 Years | 0 (0.0%) | 3 (33.3%) |
| 75 Years and over | 0 (0.0%) | 5 (41.7%) |
Disability Class: Ambulatory Difficulty
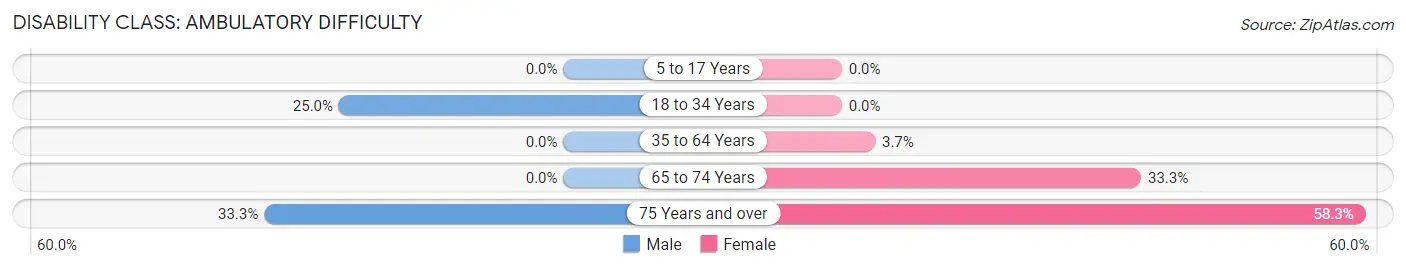
| Age Bracket | Male | Female |
| 5 to 17 Years | 0 (0.0%) | 0 (0.0%) |
| 18 to 34 Years | 3 (25.0%) | 0 (0.0%) |
| 35 to 64 Years | 0 (0.0%) | 1 (3.7%) |
| 65 to 74 Years | 0 (0.0%) | 3 (33.3%) |
| 75 Years and over | 2 (33.3%) | 7 (58.3%) |
Disability Class: Self-Care Difficulty
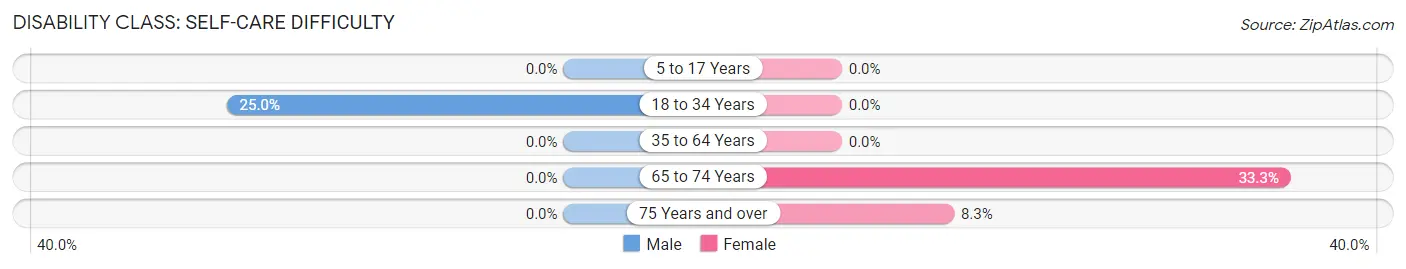
| Age Bracket | Male | Female |
| 5 to 17 Years | 0 (0.0%) | 0 (0.0%) |
| 18 to 34 Years | 3 (25.0%) | 0 (0.0%) |
| 35 to 64 Years | 0 (0.0%) | 0 (0.0%) |
| 65 to 74 Years | 0 (0.0%) | 3 (33.3%) |
| 75 Years and over | 0 (0.0%) | 1 (8.3%) |
Technology Access in Cool
Computing Device Access in Cool
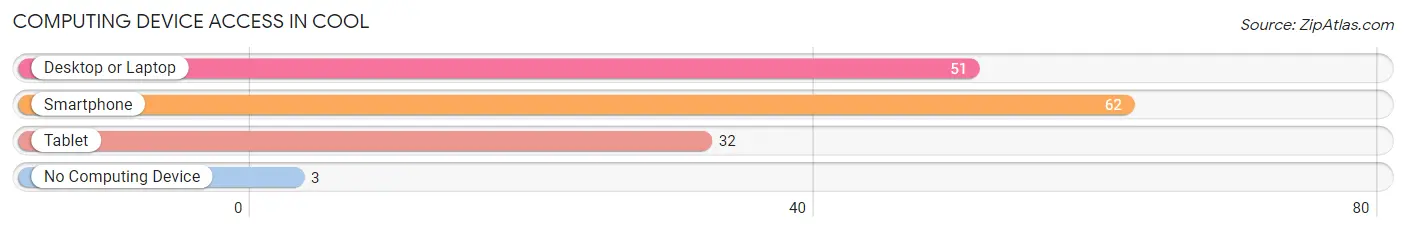
| Device Type | # Households | % Households |
| Desktop or Laptop | 51 | 76.1% |
| Smartphone | 62 | 92.5% |
| Tablet | 32 | 47.8% |
| No Computing Device | 3 | 4.5% |
| Total | 67 | 100.0% |
Internet Access in Cool
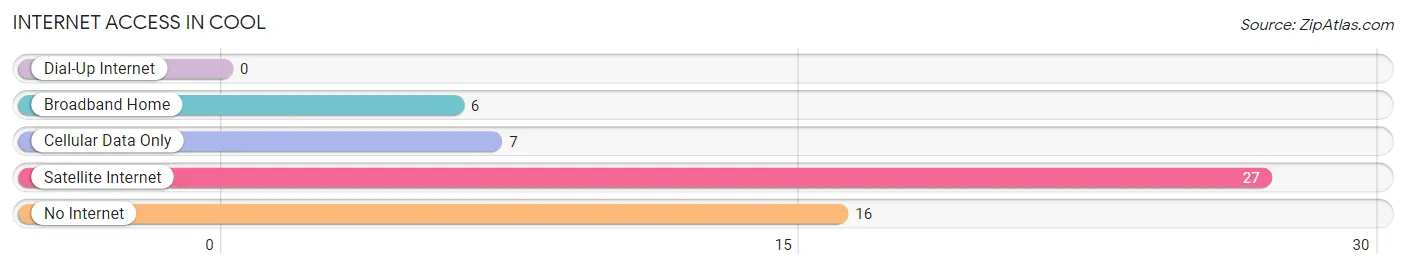
| Internet Type | # Households | % Households |
| Dial-Up Internet | 0 | 0.0% |
| Broadband Home | 6 | 9.0% |
| Cellular Data Only | 7 | 10.4% |
| Satellite Internet | 27 | 40.3% |
| No Internet | 16 | 23.9% |
| Total | 67 | 100.0% |
Cool Summary
Texas is a state located in the south-central region of the United States. It is the second largest state in the country, both in terms of population and land area. Texas is known for its diverse geography, ranging from the Gulf Coast in the southeast to the rugged mountains of the Big Bend region in the west. It is also home to a variety of cultures, including the Hispanic and Native American populations that have been present in the state for centuries.
Texas has a long and rich history, beginning with its first inhabitants, the Native Americans. The first Europeans to explore the area were Spanish explorers in the 16th century, who established a number of missions and settlements in the region. In 1821, Texas became part of Mexico, and in 1836, it declared its independence and became the Republic of Texas. After a brief period of independence, Texas was annexed by the United States in 1845.
Texas is a major agricultural state, with a large number of farms and ranches. The state is also a major producer of oil and natural gas, and is home to a number of large oil and gas companies. The state is also a major producer of livestock, and is home to a number of large cattle ranches.
The population of Texas in 2000 was 20,851,820, making it the second most populous state in the country. The largest cities in the state are Houston, San Antonio, Dallas, and Austin. The population of Texas is diverse, with a large Hispanic population, as well as African Americans, Native Americans, and other ethnic groups.
The economy of Texas is largely based on the energy industry, with oil and natural gas being the primary sources of revenue. The state is also a major producer of agricultural products, including cotton, wheat, and livestock. The state is also home to a number of large technology companies, such as Dell and Texas Instruments.
The geography of Texas is varied, with the Gulf Coast in the southeast, the rolling hills of the Hill Country in the central part of the state, and the rugged mountains of the Big Bend region in the west. The state is also home to a number of rivers, including the Rio Grande, which forms the border between Texas and Mexico.
Texas is a state with a rich cultural heritage, and is home to a number of different ethnic groups. The state is also home to a number of different religions, including Christianity, Judaism, and Islam. The state is also home to a number of different languages, including English, Spanish, and German.
Texas is a state with a strong sense of pride and identity, and is home to a number of different sports teams, including the Dallas Cowboys, the Houston Texans, and the San Antonio Spurs. The state is also home to a number of different universities, including the University of Texas, Texas A&M, and Baylor University.
Common Questions
What is Per Capita Income in Cool?
Per Capita income in Cool is $33,825.
What is the Median Family Income in Cool?
Median Family Income in Cool is $55,250.
What is the Median Household income in Cool?
Median Household Income in Cool is $55,250.
What is Inequality or Gini Index in Cool?
Inequality or Gini Index in Cool is 0.41.
What is the Total Population of Cool?
Total Population of Cool is 122.
What is the Total Male Population of Cool?
Total Male Population of Cool is 62.
What is the Total Female Population of Cool?
Total Female Population of Cool is 60.
What is the Ratio of Males per 100 Females in Cool?
There are 103.33 Males per 100 Females in Cool.
What is the Ratio of Females per 100 Males in Cool?
There are 96.77 Females per 100 Males in Cool.
What is the Median Population Age in Cool?
Median Population Age in Cool is 52.8 Years.
What is the Average Family Size in Cool
Average Family Size in Cool is 2.7 People.
What is the Average Household Size in Cool
Average Household Size in Cool is 1.8 People.
How Large is the Labor Force in Cool?
There are 65 People in the Labor Forcein in Cool.
What is the Percentage of People in the Labor Force in Cool?
56.5% of People are in the Labor Force in Cool.