Zip Codes with the Highest Percentage of Population with a Degree in Communications in El Paso, TX
RELATED REPORTS & OPTIONS
Communications
El Paso
Compare Zip Codes
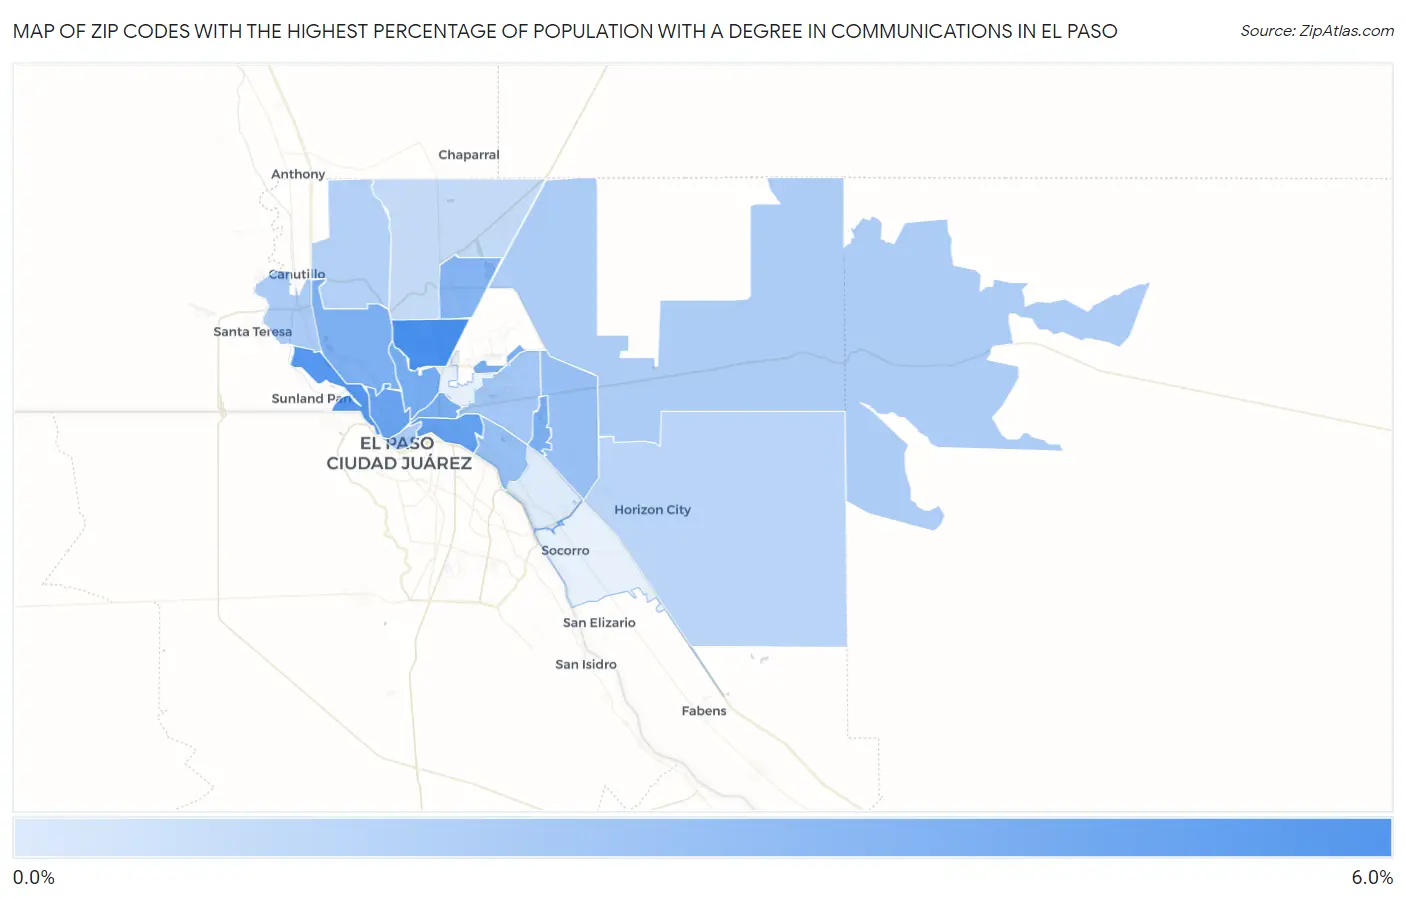
Map of Zip Codes with the Highest Percentage of Population with a Degree in Communications in El Paso
0.28%
5.1%
Zip Codes with the Highest Percentage of Population with a Degree in Communications in El Paso, TX
| Zip Code | % Graduates | vs State | vs National | |
| 1. | 79904 | 5.1% | 4.1%(+0.963)#328 | 4.1%(+0.918)#5,572 |
| 2. | 79922 | 4.6% | 4.1%(+0.522)#394 | 4.1%(+0.476)#6,658 |
| 3. | 79905 | 4.1% | 4.1%(+0.048)#471 | 4.1%(+0.002)#8,108 |
| 4. | 79902 | 4.0% | 4.1%(-0.079)#497 | 4.1%(-0.125)#8,534 |
| 5. | 79930 | 3.6% | 4.1%(-0.536)#590 | 4.1%(-0.582)#10,123 |
| 6. | 79903 | 3.5% | 4.1%(-0.580)#604 | 4.1%(-0.625)#10,286 |
| 7. | 79935 | 3.4% | 4.1%(-0.641)#616 | 4.1%(-0.687)#10,507 |
| 8. | 79908 | 3.4% | 4.1%(-0.641)#617 | 4.1%(-0.687)#10,513 |
| 9. | 79912 | 3.4% | 4.1%(-0.720)#639 | 4.1%(-0.766)#10,813 |
| 10. | 79924 | 3.0% | 4.1%(-1.05)#706 | 4.1%(-1.09)#12,030 |
| 11. | 79915 | 2.5% | 4.1%(-1.57)#831 | 4.1%(-1.61)#14,072 |
| 12. | 79936 | 2.4% | 4.1%(-1.67)#846 | 4.1%(-1.71)#14,408 |
| 13. | 79925 | 2.1% | 4.1%(-1.97)#903 | 4.1%(-2.01)#15,453 |
| 14. | 79932 | 1.8% | 4.1%(-2.24)#955 | 4.1%(-2.29)#16,411 |
| 15. | 79901 | 1.8% | 4.1%(-2.25)#957 | 4.1%(-2.29)#16,419 |
| 16. | 79938 | 1.8% | 4.1%(-2.27)#962 | 4.1%(-2.32)#16,521 |
| 17. | 79911 | 1.6% | 4.1%(-2.49)#1,009 | 4.1%(-2.53)#17,203 |
| 18. | 79928 | 1.4% | 4.1%(-2.74)#1,061 | 4.1%(-2.78)#17,978 |
| 19. | 79934 | 1.1% | 4.1%(-3.01)#1,104 | 4.1%(-3.06)#18,758 |
| 20. | 79907 | 0.28% | 4.1%(-3.81)#1,210 | 4.1%(-3.85)#20,445 |
1
Common Questions
What are the Top 10 Zip Codes with the Highest Percentage of Population with a Degree in Communications in El Paso, TX?
Top 10 Zip Codes with the Highest Percentage of Population with a Degree in Communications in El Paso, TX are:
What zip code has the Highest Percentage of Population with a Degree in Communications in El Paso, TX?
79904 has the Highest Percentage of Population with a Degree in Communications in El Paso, TX with 5.1%.
What is the Percentage of Population with a Degree in Communications in El Paso, TX?
Percentage of Population with a Degree in Communications in El Paso is 2.6%.
What is the Percentage of Population with a Degree in Communications in Texas?
Percentage of Population with a Degree in Communications in Texas is 4.1%.
What is the Percentage of Population with a Degree in Communications in the United States?
Percentage of Population with a Degree in Communications in the United States is 4.1%.