Llano Grande, TX Map & Demographics
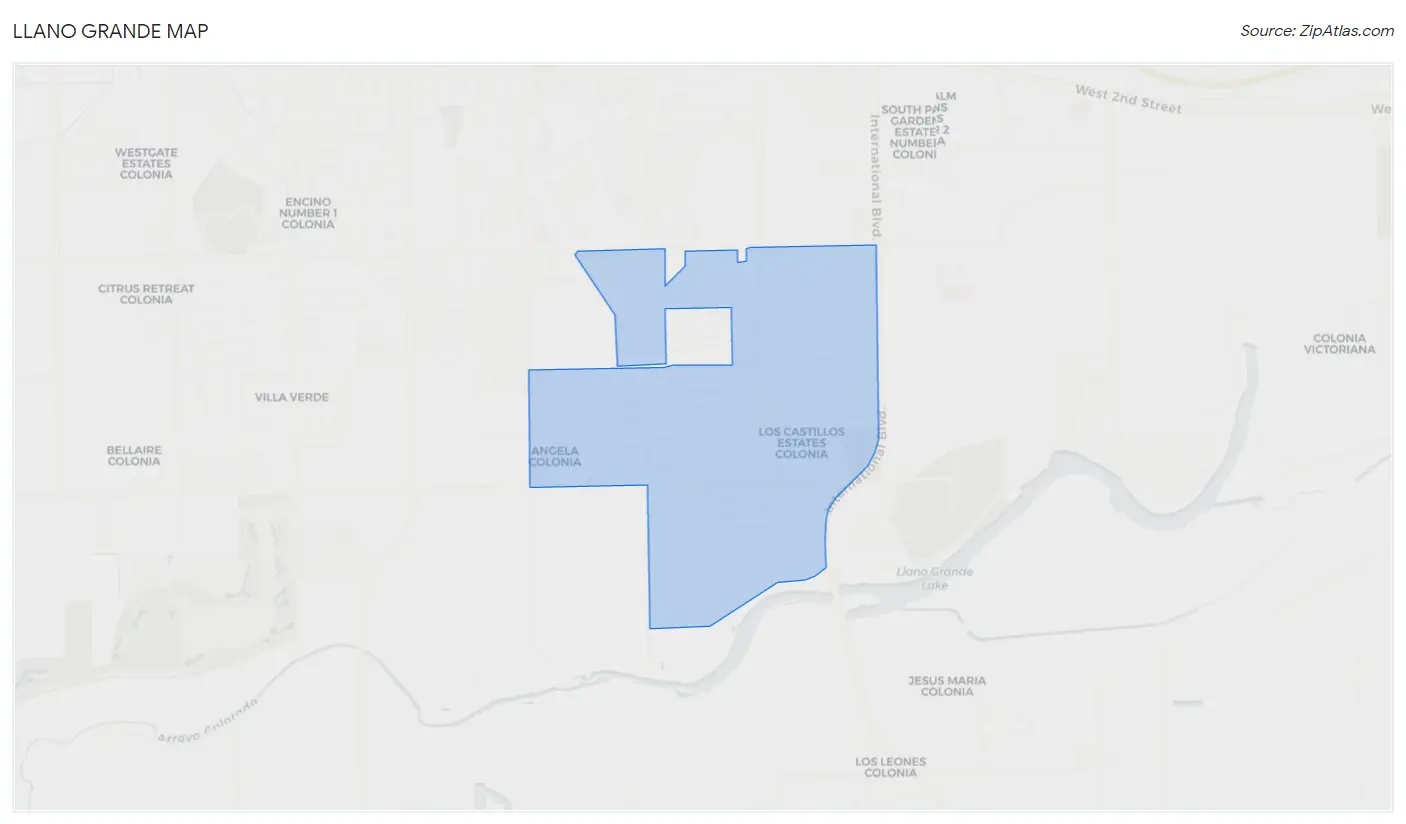
Llano Grande Map
Llano Grande Overview
$19,507
PER CAPITA INCOME
$58,656
AVG FAMILY INCOME
$36,615
AVG HOUSEHOLD INCOME
55.9%
WAGE / INCOME GAP [ % ]
44.1¢/ $1
WAGE / INCOME GAP [ $ ]
$8,711
FAMILY INCOME DEFICIT
0.39
INEQUALITY / GINI INDEX
2,065
TOTAL POPULATION
987
MALE POPULATION
1,078
FEMALE POPULATION
91.56
MALES / 100 FEMALES
109.22
FEMALES / 100 MALES
49.5
MEDIAN AGE
3.1
AVG FAMILY SIZE
2.5
AVG HOUSEHOLD SIZE
797
LABOR FORCE [ PEOPLE ]
47.1%
PERCENT IN LABOR FORCE
11.2%
UNEMPLOYMENT RATE
Income in Llano Grande
Income Overview in Llano Grande
Per Capita Income in Llano Grande is $19,507, while median incomes of families and households are $58,656 and $36,615 respectively.
| Characteristic | Number | Measure |
| Per Capita Income | 2,065 | $19,507 |
| Median Family Income | 579 | $58,656 |
| Mean Family Income | 579 | $55,914 |
| Median Household Income | 839 | $36,615 |
| Mean Household Income | 839 | $47,355 |
| Income Deficit | 579 | $8,711 |
| Wage / Income Gap (%) | 2,065 | 55.90% |
| Wage / Income Gap ($) | 2,065 | 44.10¢ per $1 |
| Gini / Inequality Index | 2,065 | 0.39 |
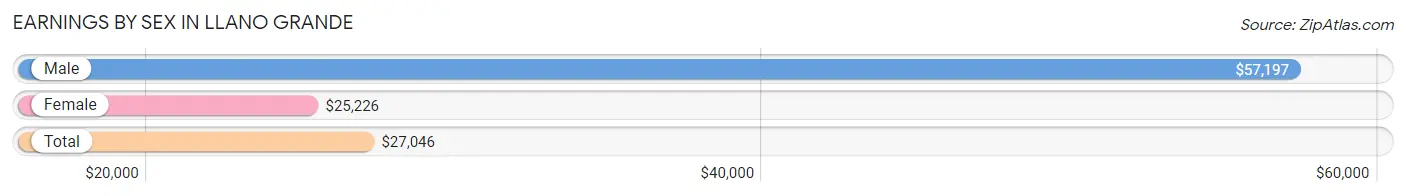
Earnings by Sex in Llano Grande
Average Earnings in Llano Grande are $27,046, $57,197 for men and $25,226 for women, a difference of 55.9%.
| Sex | Number | Average Earnings |
| Male | 342 (48.2%) | $57,197 |
| Female | 367 (51.8%) | $25,226 |
| Total | 709 (100.0%) | $27,046 |
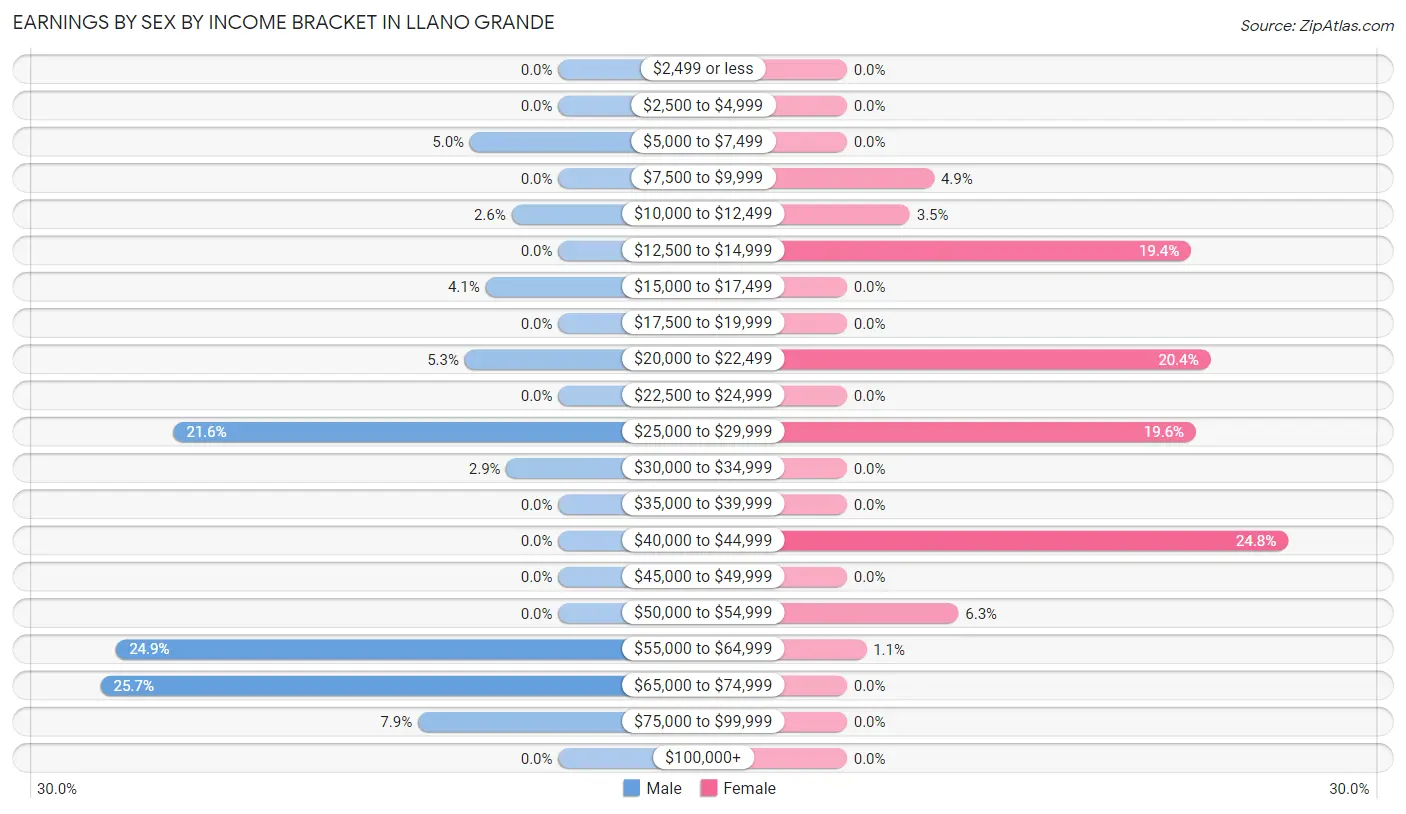
Earnings by Sex by Income Bracket in Llano Grande
The most common earnings brackets in Llano Grande are $65,000 to $74,999 for men (88 | 25.7%) and $40,000 to $44,999 for women (91 | 24.8%).
| Income | Male | Female |
| $2,499 or less | 0 (0.0%) | 0 (0.0%) |
| $2,500 to $4,999 | 0 (0.0%) | 0 (0.0%) |
| $5,000 to $7,499 | 17 (5.0%) | 0 (0.0%) |
| $7,500 to $9,999 | 0 (0.0%) | 18 (4.9%) |
| $10,000 to $12,499 | 9 (2.6%) | 13 (3.5%) |
| $12,500 to $14,999 | 0 (0.0%) | 71 (19.4%) |
| $15,000 to $17,499 | 14 (4.1%) | 0 (0.0%) |
| $17,500 to $19,999 | 0 (0.0%) | 0 (0.0%) |
| $20,000 to $22,499 | 18 (5.3%) | 75 (20.4%) |
| $22,500 to $24,999 | 0 (0.0%) | 0 (0.0%) |
| $25,000 to $29,999 | 74 (21.6%) | 72 (19.6%) |
| $30,000 to $34,999 | 10 (2.9%) | 0 (0.0%) |
| $35,000 to $39,999 | 0 (0.0%) | 0 (0.0%) |
| $40,000 to $44,999 | 0 (0.0%) | 91 (24.8%) |
| $45,000 to $49,999 | 0 (0.0%) | 0 (0.0%) |
| $50,000 to $54,999 | 0 (0.0%) | 23 (6.3%) |
| $55,000 to $64,999 | 85 (24.8%) | 4 (1.1%) |
| $65,000 to $74,999 | 88 (25.7%) | 0 (0.0%) |
| $75,000 to $99,999 | 27 (7.9%) | 0 (0.0%) |
| $100,000+ | 0 (0.0%) | 0 (0.0%) |
| Total | 342 (100.0%) | 367 (100.0%) |
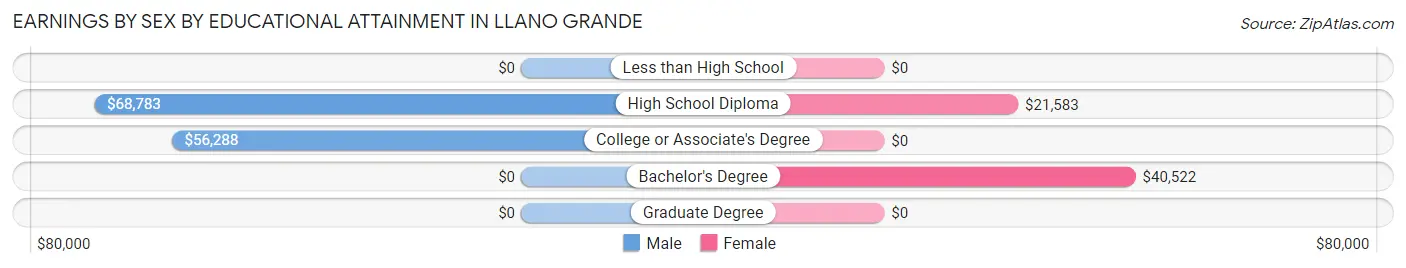
Earnings by Sex by Educational Attainment in Llano Grande
Average earnings in Llano Grande are $58,906 for men and $25,226 for women, a difference of 57.2%. Men with an educational attainment of high school diploma enjoy the highest average annual earnings of $68,783, while those with college or associate's degree education earn the least with $56,288. Women with an educational attainment of bachelor's degree earn the most with the average annual earnings of $40,522, while those with high school diploma education have the smallest earnings of $21,583.
| Educational Attainment | Male Income | Female Income |
| Less than High School | - | - |
| High School Diploma | $68,783 | $21,583 |
| College or Associate's Degree | $56,288 | $0 |
| Bachelor's Degree | - | - |
| Graduate Degree | - | - |
| Total | $58,906 | $25,226 |
Family Income in Llano Grande
Family Income Brackets in Llano Grande
According to the Llano Grande family income data, there are 162 families falling into the $75,000 to $99,999 income range, which is the most common income bracket and makes up 28.0% of all families.
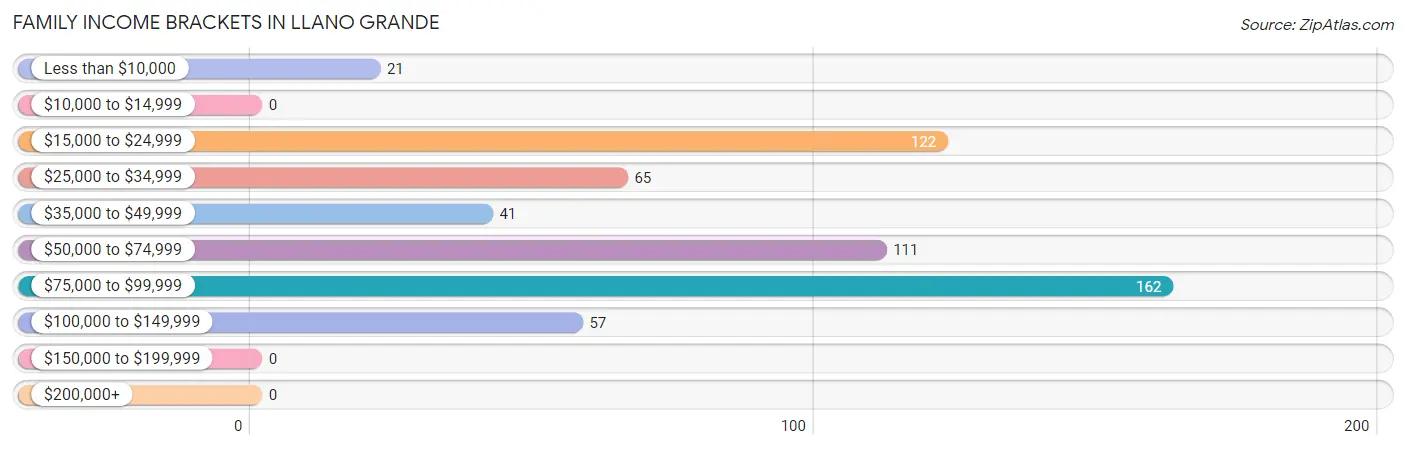
| Income Bracket | # Families | % Families |
| Less than $10,000 | 21 | 3.6% |
| $10,000 to $14,999 | 0 | 0.0% |
| $15,000 to $24,999 | 122 | 21.1% |
| $25,000 to $34,999 | 65 | 11.2% |
| $35,000 to $49,999 | 41 | 7.1% |
| $50,000 to $74,999 | 111 | 19.2% |
| $75,000 to $99,999 | 162 | 28.0% |
| $100,000 to $149,999 | 57 | 9.8% |
| $150,000 to $199,999 | 0 | 0.0% |
| $200,000+ | 0 | 0.0% |
Family Income by Famaliy Size in Llano Grande
4-person families (211 | 36.4%) account for the highest median family income in Llano Grande with $82,583 per family, while 4-person families (211 | 36.4%) have the highest median income of $20,646 per family member.
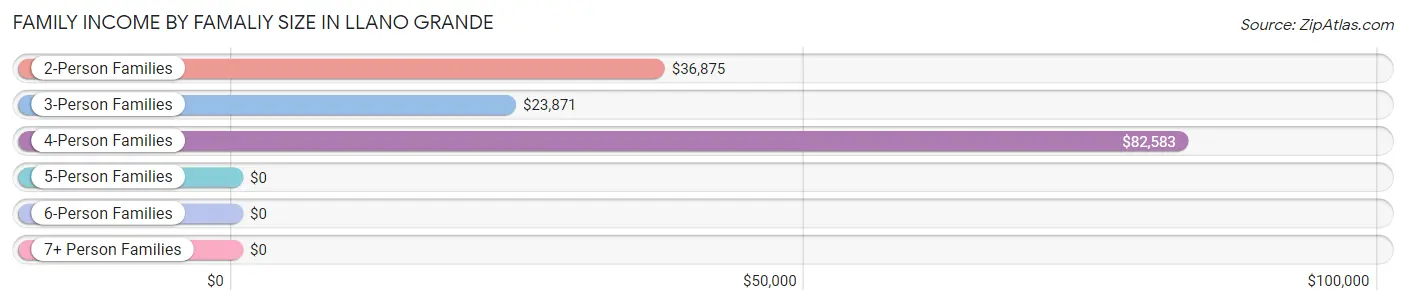
| Income Bracket | # Families | Median Income |
| 2-Person Families | 268 (46.3%) | $36,875 |
| 3-Person Families | 76 (13.1%) | $23,871 |
| 4-Person Families | 211 (36.4%) | $82,583 |
| 5-Person Families | 0 (0.0%) | $0 |
| 6-Person Families | 0 (0.0%) | $0 |
| 7+ Person Families | 24 (4.2%) | $0 |
| Total | 579 (100.0%) | $58,656 |
Family Income by Number of Earners in Llano Grande
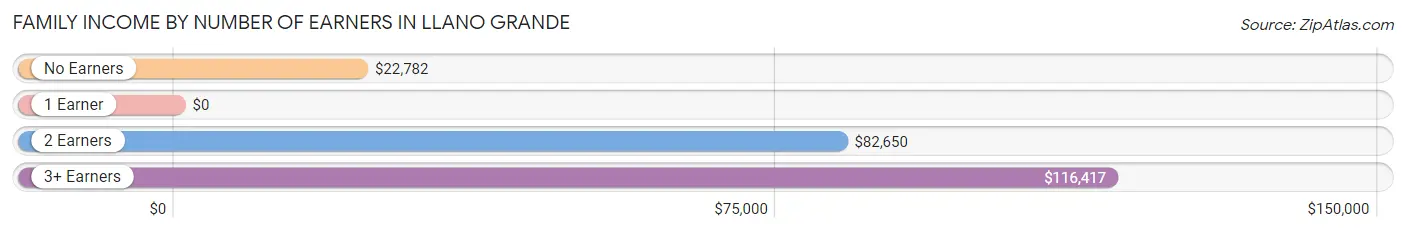
| Number of Earners | # Families | Median Income |
| No Earners | 219 (37.8%) | $22,782 |
| 1 Earner | 98 (16.9%) | $0 |
| 2 Earners | 231 (39.9%) | $82,650 |
| 3+ Earners | 31 (5.3%) | $116,417 |
| Total | 579 (100.0%) | $58,656 |
Household Income in Llano Grande
Household Income Brackets in Llano Grande
With 226 households falling in the category, the $75,000 to $99,999 income range is the most frequent in Llano Grande, accounting for 26.9% of all households.
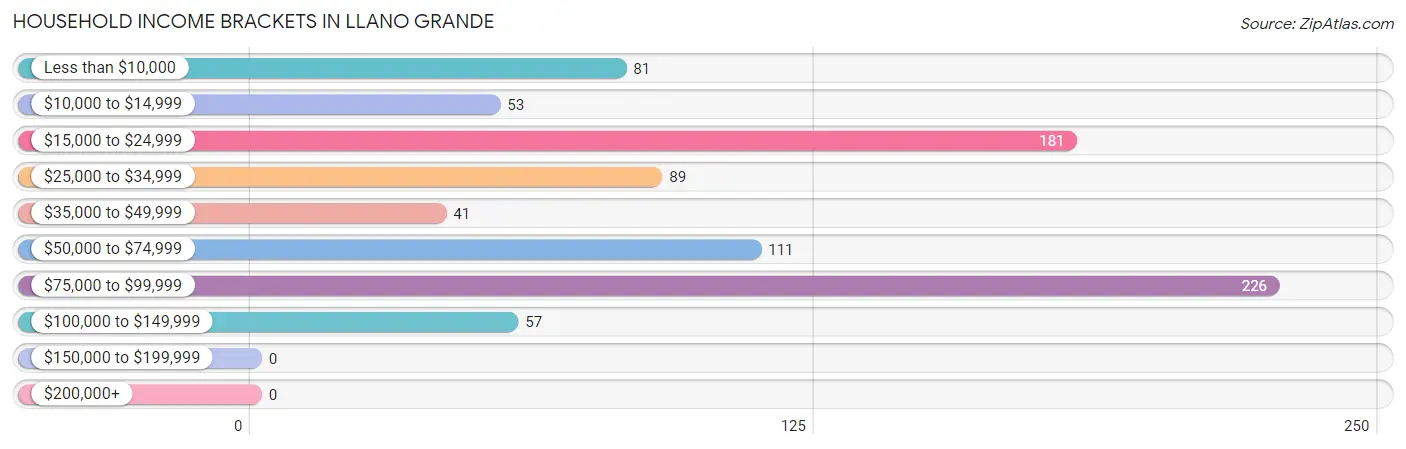
| Income Bracket | # Households | % Households |
| Less than $10,000 | 81 | 9.7% |
| $10,000 to $14,999 | 53 | 6.3% |
| $15,000 to $24,999 | 181 | 21.6% |
| $25,000 to $34,999 | 89 | 10.6% |
| $35,000 to $49,999 | 41 | 4.9% |
| $50,000 to $74,999 | 111 | 13.2% |
| $75,000 to $99,999 | 226 | 26.9% |
| $100,000 to $149,999 | 57 | 6.8% |
| $150,000 to $199,999 | 0 | 0.0% |
| $200,000+ | 0 | 0.0% |
Household Income by Householder Age in Llano Grande
The median household income in Llano Grande is $36,615, with the highest median household income of $63,611 found in the 45 to 64 years age bracket for the primary householder. A total of 394 households (47.0%) fall into this category.
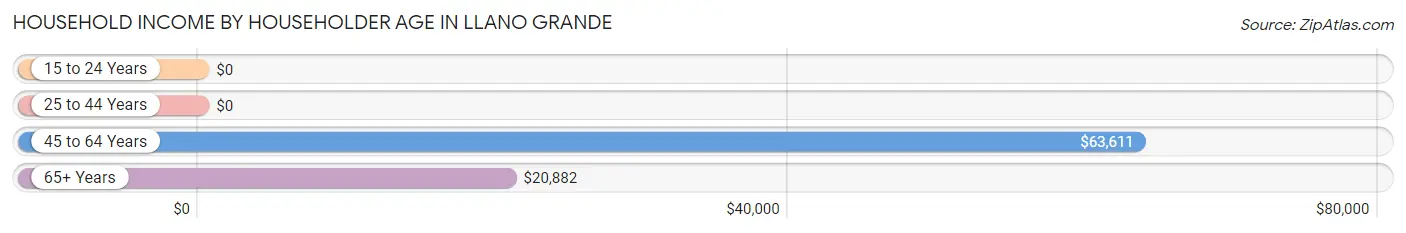
| Income Bracket | # Households | Median Income |
| 15 to 24 Years | 0 (0.0%) | $0 |
| 25 to 44 Years | 109 (13.0%) | $0 |
| 45 to 64 Years | 394 (47.0%) | $63,611 |
| 65+ Years | 336 (40.1%) | $20,882 |
| Total | 839 (100.0%) | $36,615 |
Poverty in Llano Grande
Income Below Poverty by Sex and Age in Llano Grande
With 7.8% poverty level for males and 25.8% for females among the residents of Llano Grande, 65 to 74 year old males and 5 year old females are the most vulnerable to poverty, with 48 males (38.7%) and 29 females (100.0%) in their respective age groups living below the poverty level.
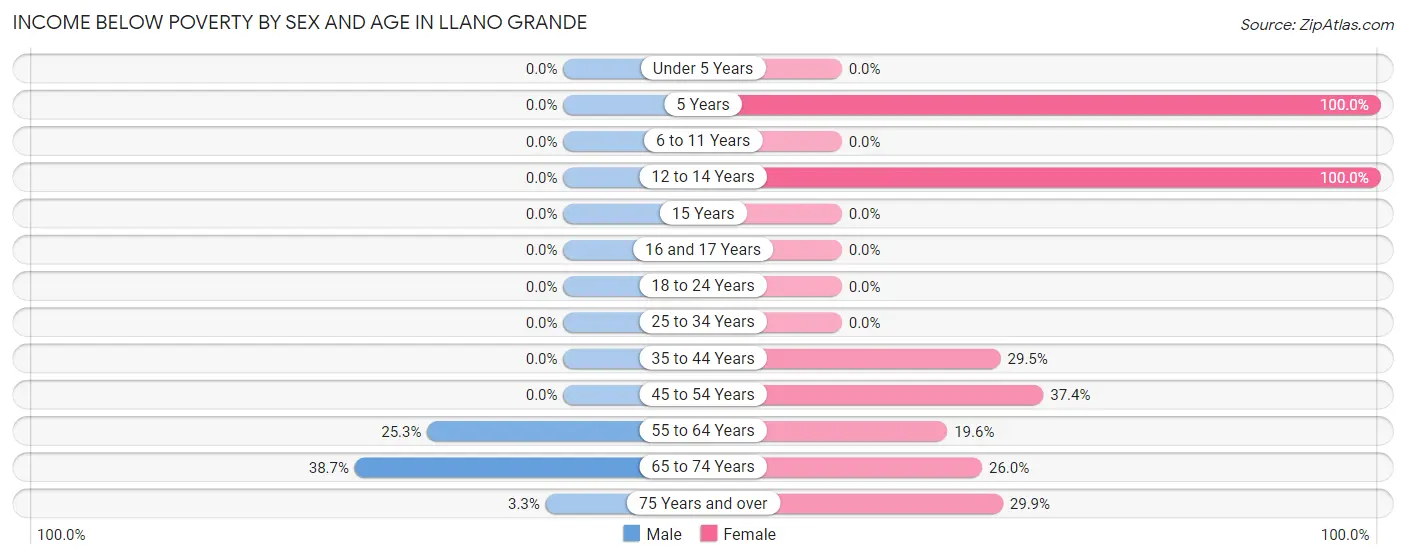
| Age Bracket | Male | Female |
| Under 5 Years | 0 (0.0%) | 0 (0.0%) |
| 5 Years | 0 (0.0%) | 29 (100.0%) |
| 6 to 11 Years | 0 (0.0%) | 0 (0.0%) |
| 12 to 14 Years | 0 (0.0%) | 23 (100.0%) |
| 15 Years | 0 (0.0%) | 0 (0.0%) |
| 16 and 17 Years | 0 (0.0%) | 0 (0.0%) |
| 18 to 24 Years | 0 (0.0%) | 0 (0.0%) |
| 25 to 34 Years | 0 (0.0%) | 0 (0.0%) |
| 35 to 44 Years | 0 (0.0%) | 51 (29.5%) |
| 45 to 54 Years | 0 (0.0%) | 46 (37.4%) |
| 55 to 64 Years | 24 (25.3%) | 27 (19.6%) |
| 65 to 74 Years | 48 (38.7%) | 44 (26.0%) |
| 75 Years and over | 5 (3.3%) | 58 (29.9%) |
| Total | 77 (7.8%) | 278 (25.8%) |
Income Above Poverty by Sex and Age in Llano Grande
According to the poverty statistics in Llano Grande, males aged under 5 years and females aged under 5 years are the age groups that are most secure financially, with 100.0% of males and 100.0% of females in these age groups living above the poverty line.
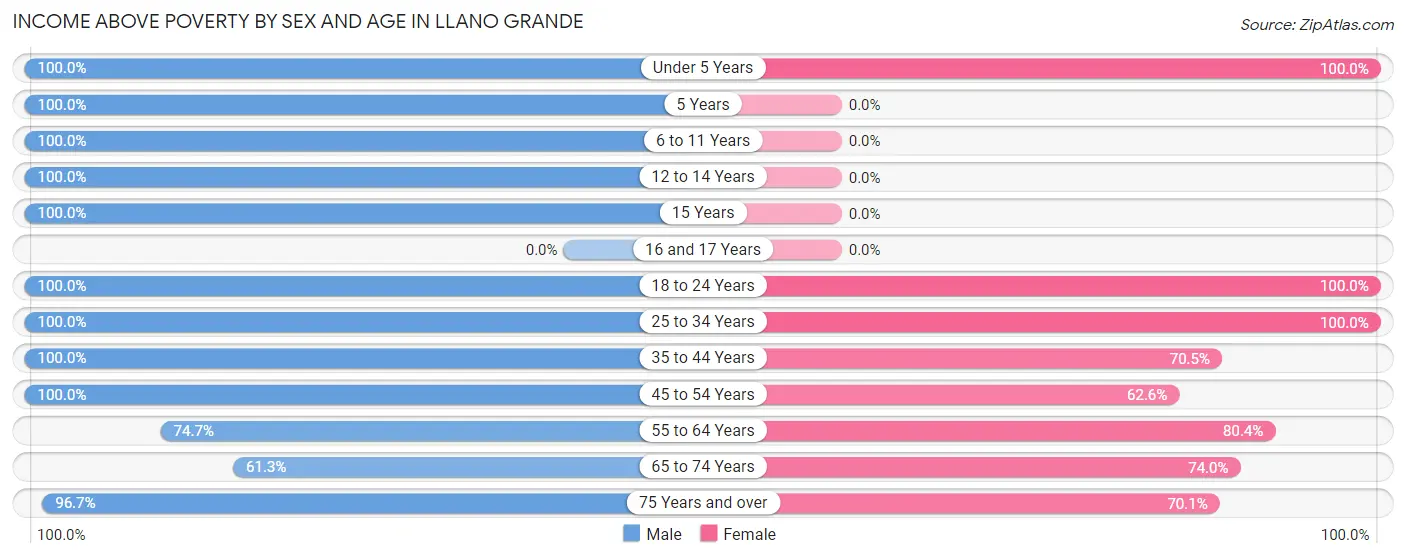
| Age Bracket | Male | Female |
| Under 5 Years | 84 (100.0%) | 24 (100.0%) |
| 5 Years | 41 (100.0%) | 0 (0.0%) |
| 6 to 11 Years | 134 (100.0%) | 0 (0.0%) |
| 12 to 14 Years | 4 (100.0%) | 0 (0.0%) |
| 15 Years | 33 (100.0%) | 0 (0.0%) |
| 16 and 17 Years | 0 (0.0%) | 0 (0.0%) |
| 18 to 24 Years | 53 (100.0%) | 13 (100.0%) |
| 25 to 34 Years | 63 (100.0%) | 192 (100.0%) |
| 35 to 44 Years | 33 (100.0%) | 122 (70.5%) |
| 45 to 54 Years | 171 (100.0%) | 77 (62.6%) |
| 55 to 64 Years | 71 (74.7%) | 111 (80.4%) |
| 65 to 74 Years | 76 (61.3%) | 125 (74.0%) |
| 75 Years and over | 147 (96.7%) | 136 (70.1%) |
| Total | 910 (92.2%) | 800 (74.2%) |
Income Below Poverty Among Married-Couple Families in Llano Grande
The poverty statistics for married-couple families in Llano Grande show that 17.6% or 72 of the total 409 families live below the poverty line. Families with 1 or 2 children have the highest poverty rate of 23.4%, comprising of 48 families. On the other hand, families with no children have the lowest poverty rate of 11.8%, which includes 24 families.
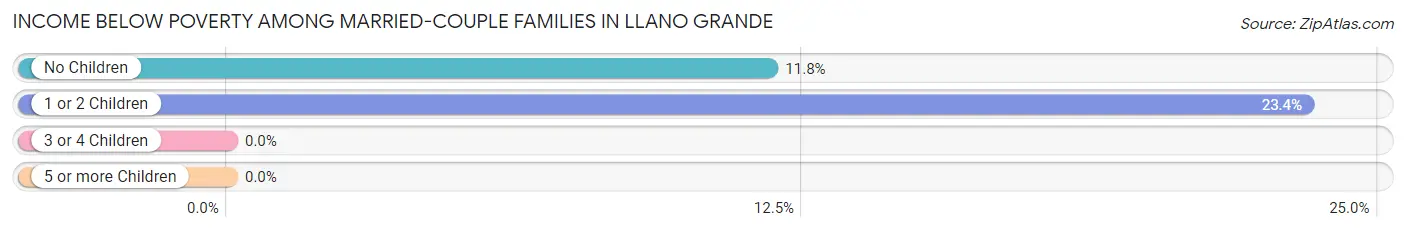
| Children | Above Poverty | Below Poverty |
| No Children | 180 (88.2%) | 24 (11.8%) |
| 1 or 2 Children | 157 (76.6%) | 48 (23.4%) |
| 3 or 4 Children | 0 (0.0%) | 0 (0.0%) |
| 5 or more Children | 0 (0.0%) | 0 (0.0%) |
| Total | 337 (82.4%) | 72 (17.6%) |
Income Below Poverty Among Single-Parent Households in Llano Grande
| Children | Single Father | Single Mother |
| No Children | 0 (0.0%) | 0 (0.0%) |
| 1 or 2 Children | 0 (0.0%) | 0 (0.0%) |
| 3 or 4 Children | 0 (0.0%) | 0 (0.0%) |
| 5 or more Children | 0 (0.0%) | 0 (0.0%) |
| Total | 0 (0.0%) | 0 (0.0%) |
Income Below Poverty Among Married-Couple vs Single-Parent Households in Llano Grande
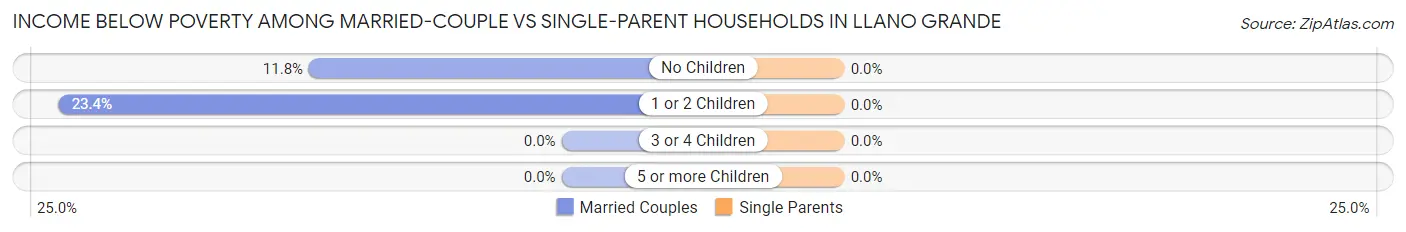
| Children | Married-Couple Families | Single-Parent Households |
| No Children | 24 (11.8%) | 0 (0.0%) |
| 1 or 2 Children | 48 (23.4%) | 0 (0.0%) |
| 3 or 4 Children | 0 (0.0%) | 0 (0.0%) |
| 5 or more Children | 0 (0.0%) | 0 (0.0%) |
| Total | 72 (17.6%) | 0 (0.0%) |
Race in Llano Grande
The most populous races in Llano Grande are Hispanic or Latino (1,770 | 85.7%), White / Caucasian (1,231 | 59.6%), and Two or more Races (565 | 27.4%).
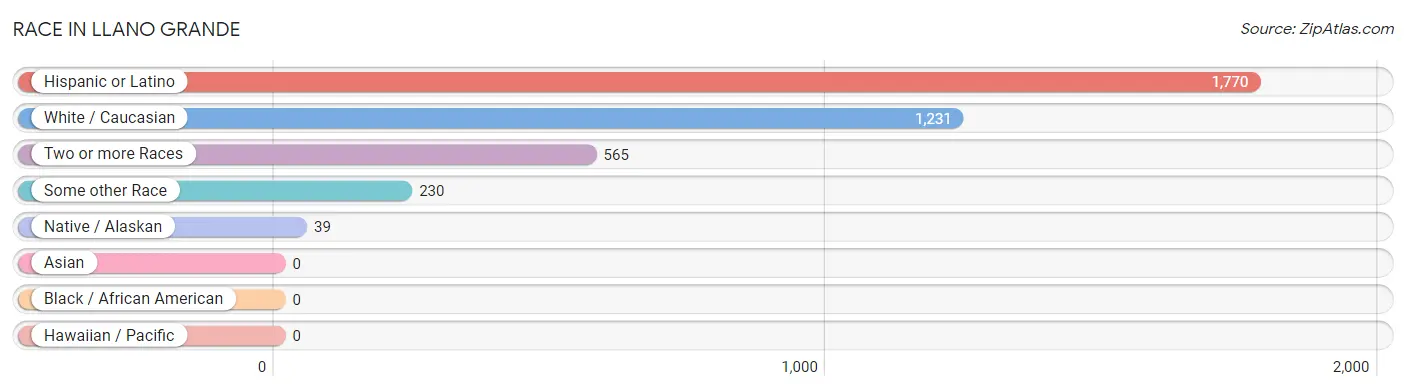
| Race | # Population | % Population |
| Asian | 0 | 0.0% |
| Black / African American | 0 | 0.0% |
| Hawaiian / Pacific | 0 | 0.0% |
| Hispanic or Latino | 1,770 | 85.7% |
| Native / Alaskan | 39 | 1.9% |
| White / Caucasian | 1,231 | 59.6% |
| Two or more Races | 565 | 27.4% |
| Some other Race | 230 | 11.1% |
| Total | 2,065 | 100.0% |
Ancestry in Llano Grande
The most populous ancestries reported in Llano Grande are Mexican (1,770 | 85.7%), German (115 | 5.6%), Irish (47 | 2.3%), American (37 | 1.8%), and Swedish (29 | 1.4%), together accounting for 96.8% of all Llano Grande residents.
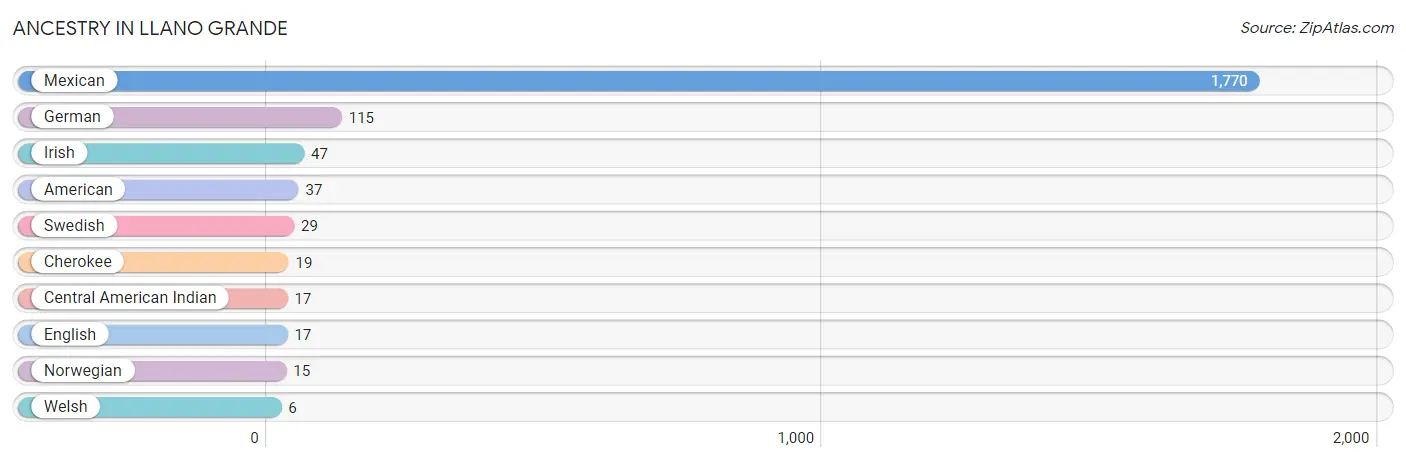
| Ancestry | # Population | % Population |
| American | 37 | 1.8% |
| Central American Indian | 17 | 0.8% |
| Cherokee | 19 | 0.9% |
| English | 17 | 0.8% |
| German | 115 | 5.6% |
| Irish | 47 | 2.3% |
| Mexican | 1,770 | 85.7% |
| Norwegian | 15 | 0.7% |
| Swedish | 29 | 1.4% |
| Welsh | 6 | 0.3% | View All 10 Rows |
Immigrants in Llano Grande
The most numerous immigrant groups reported in Llano Grande came from Central America (530 | 25.7%), Latin America (530 | 25.7%), and Mexico (530 | 25.7%), together accounting for 77.0% of all Llano Grande residents.
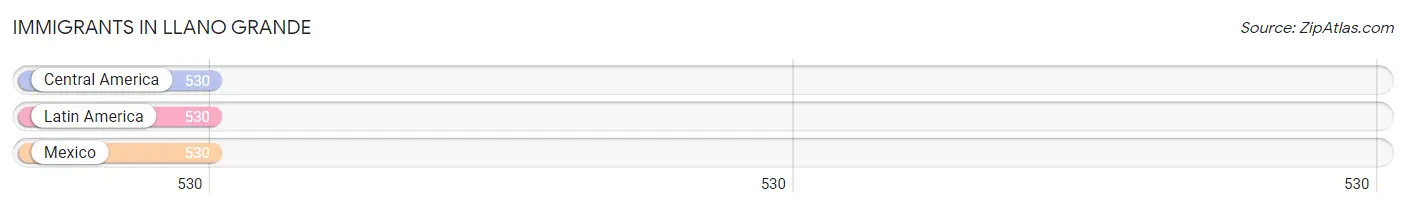
| Immigration Origin | # Population | % Population |
| Central America | 530 | 25.7% |
| Latin America | 530 | 25.7% |
| Mexico | 530 | 25.7% | View All 3 Rows |
Sex and Age in Llano Grande
Sex and Age in Llano Grande
The most populous age groups in Llano Grande are 45 to 49 Years (158 | 16.0%) for men and 25 to 29 Years (192 | 17.8%) for women.
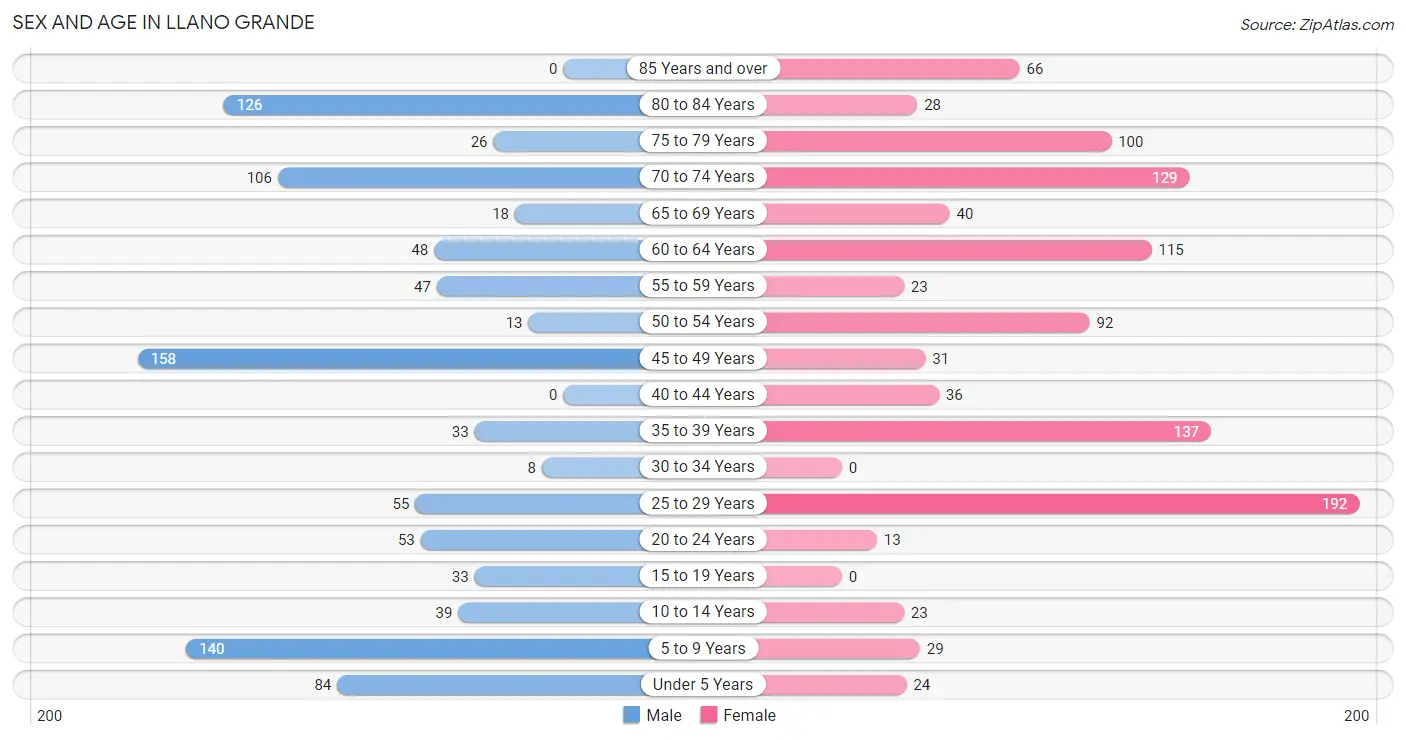
| Age Bracket | Male | Female |
| Under 5 Years | 84 (8.5%) | 24 (2.2%) |
| 5 to 9 Years | 140 (14.2%) | 29 (2.7%) |
| 10 to 14 Years | 39 (4.0%) | 23 (2.1%) |
| 15 to 19 Years | 33 (3.3%) | 0 (0.0%) |
| 20 to 24 Years | 53 (5.4%) | 13 (1.2%) |
| 25 to 29 Years | 55 (5.6%) | 192 (17.8%) |
| 30 to 34 Years | 8 (0.8%) | 0 (0.0%) |
| 35 to 39 Years | 33 (3.3%) | 137 (12.7%) |
| 40 to 44 Years | 0 (0.0%) | 36 (3.3%) |
| 45 to 49 Years | 158 (16.0%) | 31 (2.9%) |
| 50 to 54 Years | 13 (1.3%) | 92 (8.5%) |
| 55 to 59 Years | 47 (4.8%) | 23 (2.1%) |
| 60 to 64 Years | 48 (4.9%) | 115 (10.7%) |
| 65 to 69 Years | 18 (1.8%) | 40 (3.7%) |
| 70 to 74 Years | 106 (10.7%) | 129 (12.0%) |
| 75 to 79 Years | 26 (2.6%) | 100 (9.3%) |
| 80 to 84 Years | 126 (12.8%) | 28 (2.6%) |
| 85 Years and over | 0 (0.0%) | 66 (6.1%) |
| Total | 987 (100.0%) | 1,078 (100.0%) |
Families and Households in Llano Grande
Median Family Size in Llano Grande
The median family size in Llano Grande is 3.12 persons per family, with single male/father families (24 | 4.2%) accounting for the largest median family size of 3.5 persons per family. On the other hand, single female/mother families (146 | 25.2%) represent the smallest median family size with 2.58 persons per family.
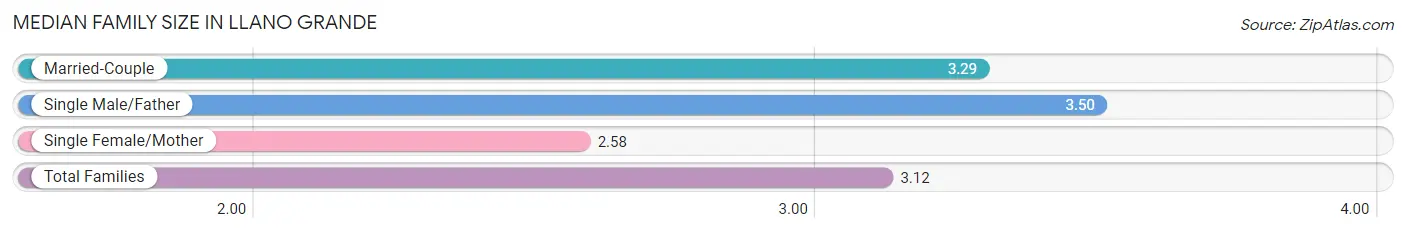
| Family Type | # Families | Family Size |
| Married-Couple | 409 (70.6%) | 3.29 |
| Single Male/Father | 24 (4.2%) | 3.50 |
| Single Female/Mother | 146 (25.2%) | 2.58 |
| Total Families | 579 (100.0%) | 3.12 |
Median Household Size in Llano Grande
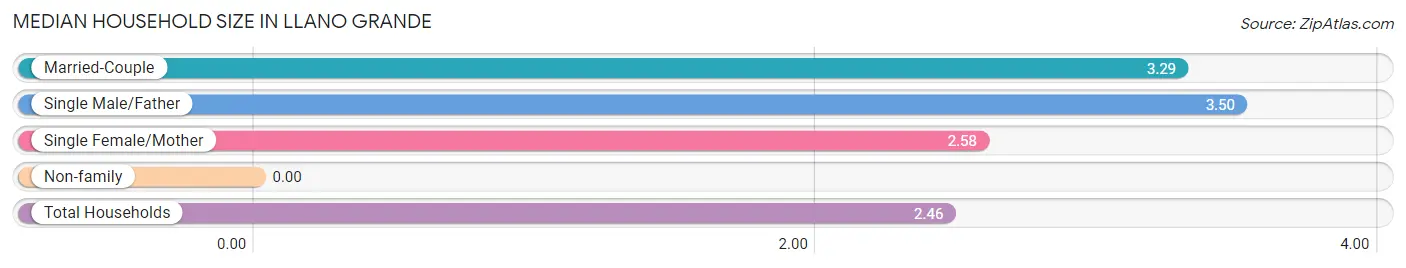
| Household Type | # Households | Household Size |
| Married-Couple | 409 (48.7%) | 3.29 |
| Single Male/Father | 24 (2.9%) | 3.50 |
| Single Female/Mother | 146 (17.4%) | 2.58 |
| Non-family | 260 (31.0%) | - |
| Total Households | 839 (100.0%) | 2.46 |
Household Size by Marriage Status in Llano Grande
Out of a total of 839 households in Llano Grande, 579 (69.0%) are family households, while 260 (31.0%) are nonfamily households. The most numerous type of family households are 2-person households, comprising 268, and the most common type of nonfamily households are 1-person households, comprising 260.
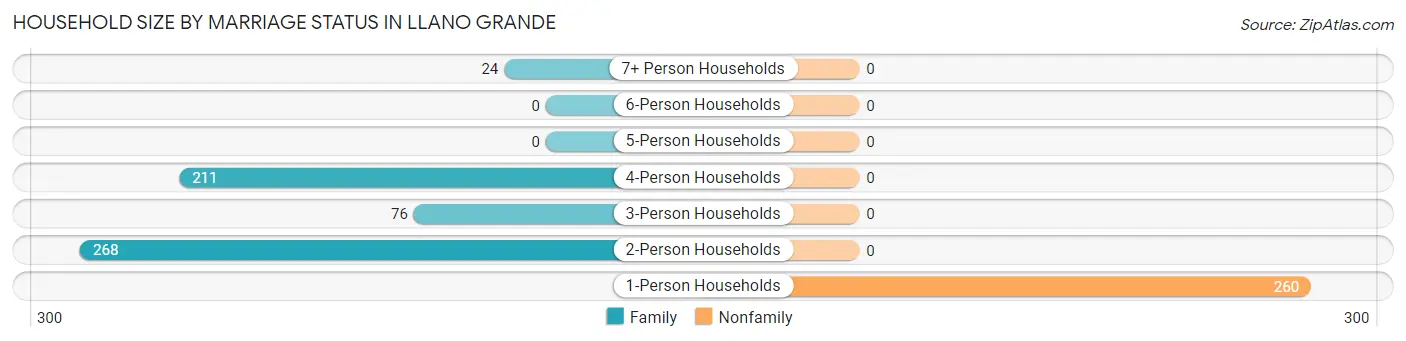
| Household Size | Family Households | Nonfamily Households |
| 1-Person Households | - | 260 (31.0%) |
| 2-Person Households | 268 (31.9%) | 0 (0.0%) |
| 3-Person Households | 76 (9.1%) | 0 (0.0%) |
| 4-Person Households | 211 (25.2%) | 0 (0.0%) |
| 5-Person Households | 0 (0.0%) | 0 (0.0%) |
| 6-Person Households | 0 (0.0%) | 0 (0.0%) |
| 7+ Person Households | 24 (2.9%) | 0 (0.0%) |
| Total | 579 (69.0%) | 260 (31.0%) |
Female Fertility in Llano Grande
Fertility by Age in Llano Grande
Average fertility rate in Llano Grande is 9.0 births per 1,000 women. Women in the age bracket of 35 to 50 years have the highest fertility rate with 18.0 births per 1,000 women. Women in the age bracket of 35 to 50 years acount for 100.0% of all women with births.
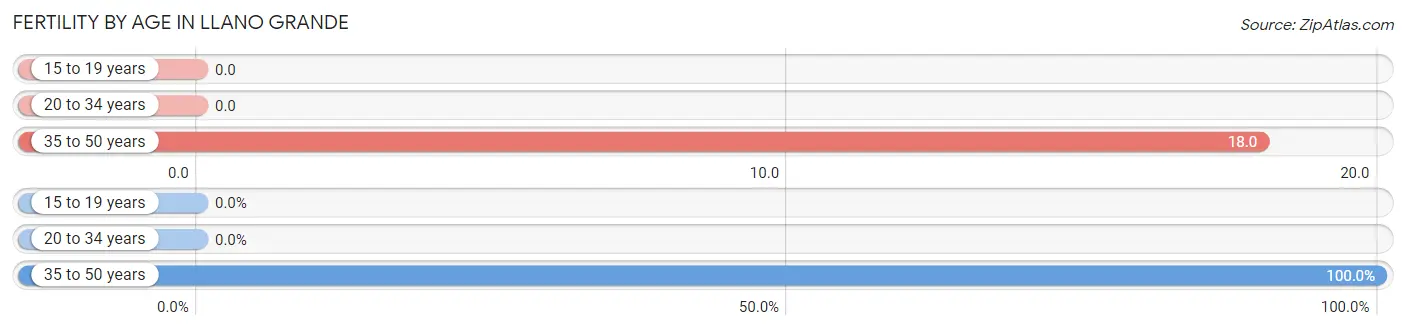
| Age Bracket | Women with Births | Births / 1,000 Women |
| 15 to 19 years | 0 (0.0%) | 0.0 |
| 20 to 34 years | 0 (0.0%) | 0.0 |
| 35 to 50 years | 4 (100.0%) | 18.0 |
| Total | 4 (100.0%) | 9.0 |
Fertility by Age by Marriage Status in Llano Grande
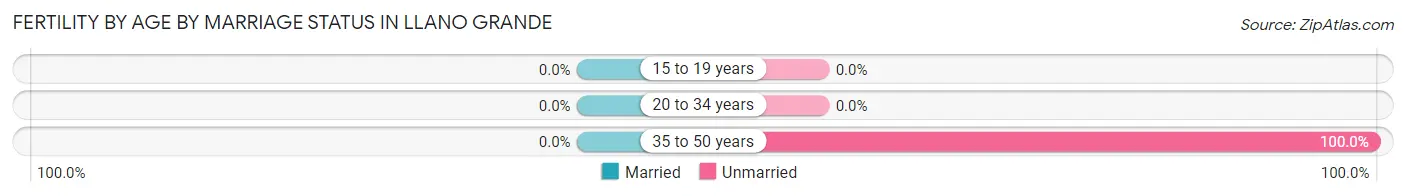
| Age Bracket | Married | Unmarried |
| 15 to 19 years | 0 (0.0%) | 0 (0.0%) |
| 20 to 34 years | 0 (0.0%) | 0 (0.0%) |
| 35 to 50 years | 0 (0.0%) | 4 (100.0%) |
| Total | 0 (0.0%) | 4 (100.0%) |
Fertility by Education in Llano Grande
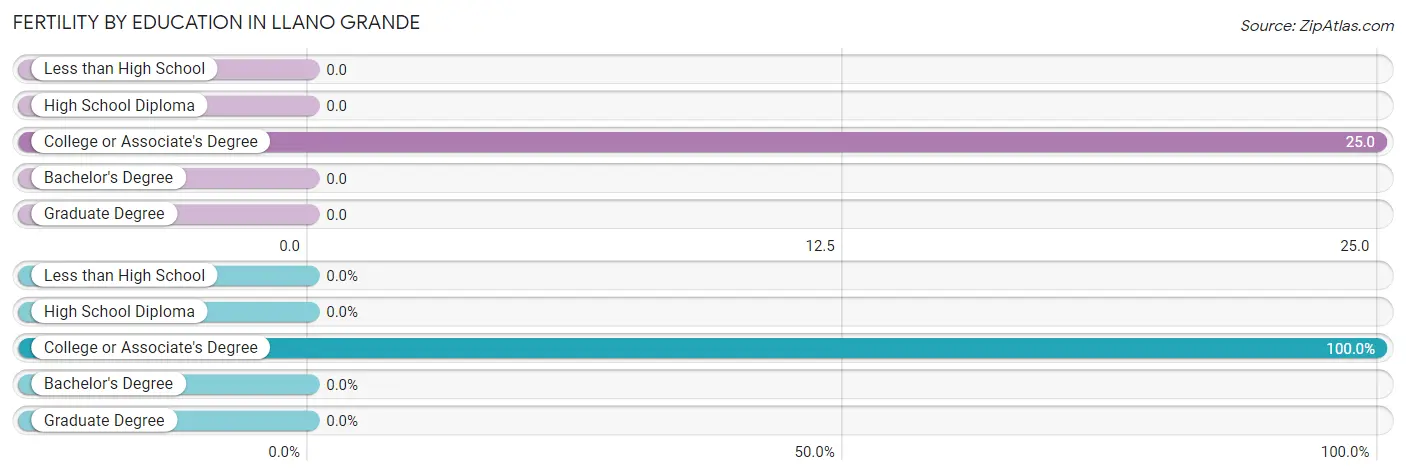
| Educational Attainment | Women with Births | Births / 1,000 Women |
| Less than High School | 0 (0.0%) | 0.0 |
| High School Diploma | 0 (0.0%) | 0.0 |
| College or Associate's Degree | 4 (100.0%) | 25.0 |
| Bachelor's Degree | 0 (0.0%) | 0.0 |
| Graduate Degree | 0 (0.0%) | 0.0 |
| Total | 4 (100.0%) | 9.0 |
Fertility by Education by Marriage Status in Llano Grande
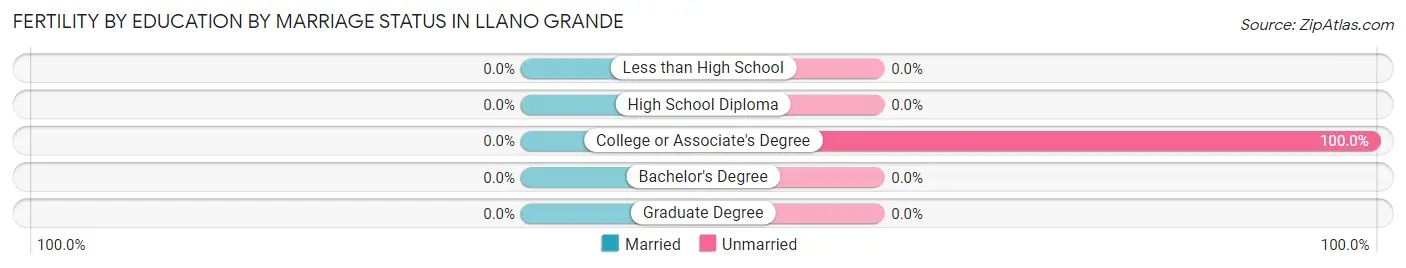
| Educational Attainment | Married | Unmarried |
| Less than High School | 0 (0.0%) | 0 (0.0%) |
| High School Diploma | 0 (0.0%) | 0 (0.0%) |
| College or Associate's Degree | 0 (0.0%) | 4 (100.0%) |
| Bachelor's Degree | 0 (0.0%) | 0 (0.0%) |
| Graduate Degree | 0 (0.0%) | 0 (0.0%) |
| Total | 0 (0.0%) | 4 (100.0%) |
Employment Characteristics in Llano Grande
Employment by Class of Employer in Llano Grande
Among the 709 employed individuals in Llano Grande, private company employees (458 | 64.6%), not-for-profit organizations (95 | 13.4%), and self-employed (not incorporated) (75 | 10.6%) make up the most common classes of employment.
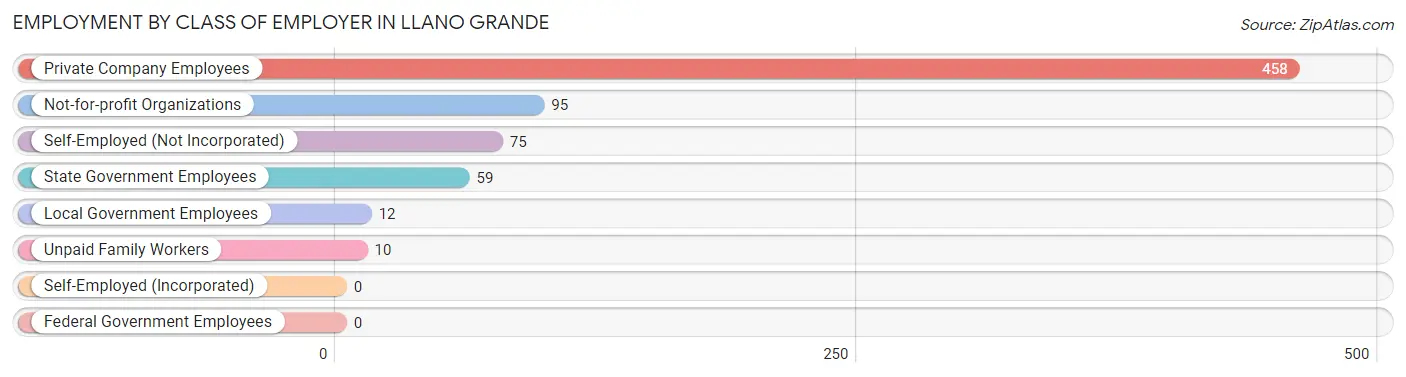
| Employer Class | # Employees | % Employees |
| Private Company Employees | 458 | 64.6% |
| Self-Employed (Incorporated) | 0 | 0.0% |
| Self-Employed (Not Incorporated) | 75 | 10.6% |
| Not-for-profit Organizations | 95 | 13.4% |
| Local Government Employees | 12 | 1.7% |
| State Government Employees | 59 | 8.3% |
| Federal Government Employees | 0 | 0.0% |
| Unpaid Family Workers | 10 | 1.4% |
| Total | 709 | 100.0% |
Employment Status by Age in Llano Grande
According to the labor force statistics for Llano Grande, out of the total population over 16 years of age (1,693), 47.1% or 797 individuals are in the labor force, with 11.2% or 89 of them unemployed. The age group with the highest labor force participation rate is 20 to 24 years, with 100.0% or 66 individuals in the labor force. Within the labor force, the 45 to 54 years age range has the highest percentage of unemployed individuals, with 22.5% or 46 of them being unemployed.
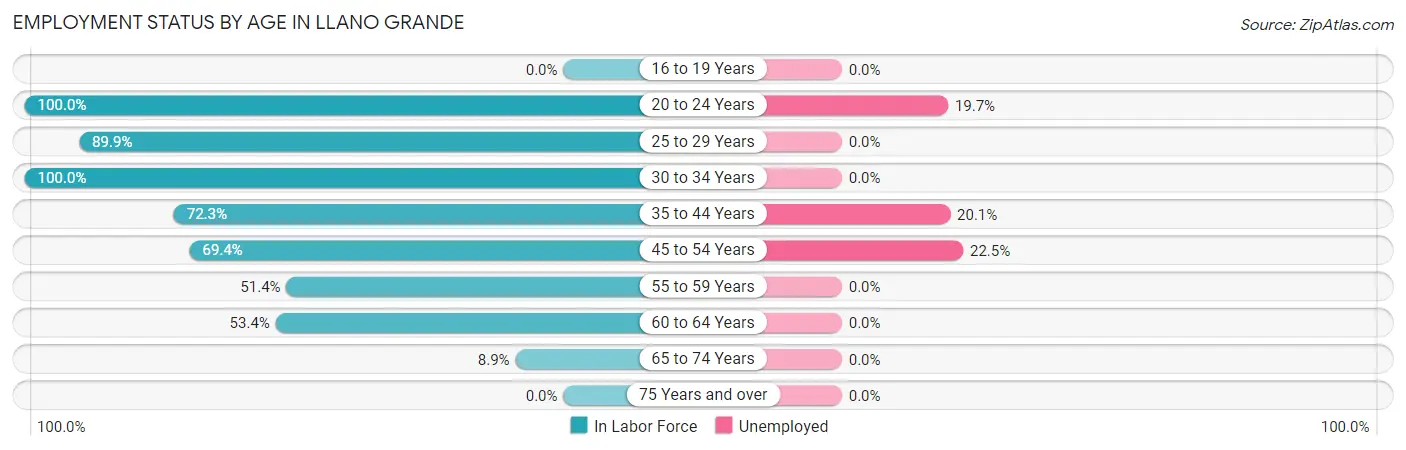
| Age Bracket | In Labor Force | Unemployed |
| 16 to 19 Years | 0 (0.0%) | 0 (0.0%) |
| 20 to 24 Years | 66 (100.0%) | 13 (19.7%) |
| 25 to 29 Years | 222 (89.9%) | 0 (0.0%) |
| 30 to 34 Years | 8 (100.0%) | 0 (0.0%) |
| 35 to 44 Years | 149 (72.3%) | 30 (20.1%) |
| 45 to 54 Years | 204 (69.4%) | 46 (22.5%) |
| 55 to 59 Years | 36 (51.4%) | 0 (0.0%) |
| 60 to 64 Years | 87 (53.4%) | 0 (0.0%) |
| 65 to 74 Years | 26 (8.9%) | 0 (0.0%) |
| 75 Years and over | 0 (0.0%) | 0 (0.0%) |
| Total | 797 (47.1%) | 89 (11.2%) |
Employment Status by Educational Attainment in Llano Grande
According to labor force statistics for Llano Grande, 71.5% of individuals (706) out of the total population between 25 and 64 years of age (988) are in the labor force, with 10.8% or 76 of them being unemployed. The group with the highest labor force participation rate are those with the educational attainment of bachelor's degree or higher, with 100.0% or 171 individuals in the labor force. Within the labor force, individuals with high school diploma education have the highest percentage of unemployment, with 18.0% or 46 of them being unemployed.
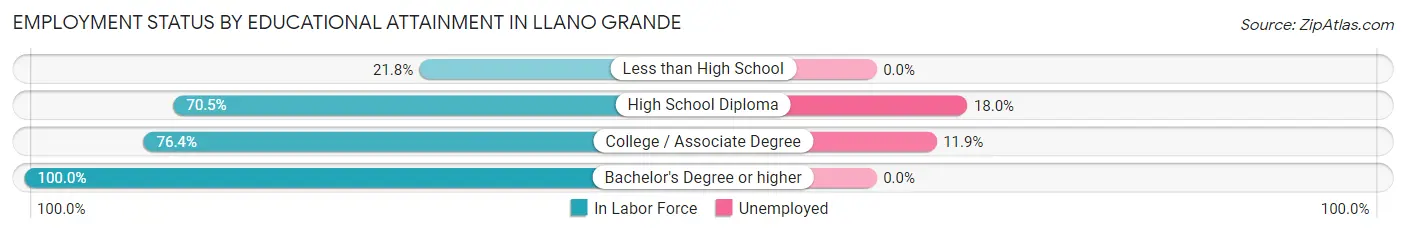
| Educational Attainment | In Labor Force | Unemployed |
| Less than High School | 27 (21.8%) | 0 (0.0%) |
| High School Diploma | 256 (70.5%) | 65 (18.0%) |
| College / Associate Degree | 252 (76.4%) | 39 (11.9%) |
| Bachelor's Degree or higher | 171 (100.0%) | 0 (0.0%) |
| Total | 706 (71.5%) | 107 (10.8%) |
Employment Occupations by Sex in Llano Grande
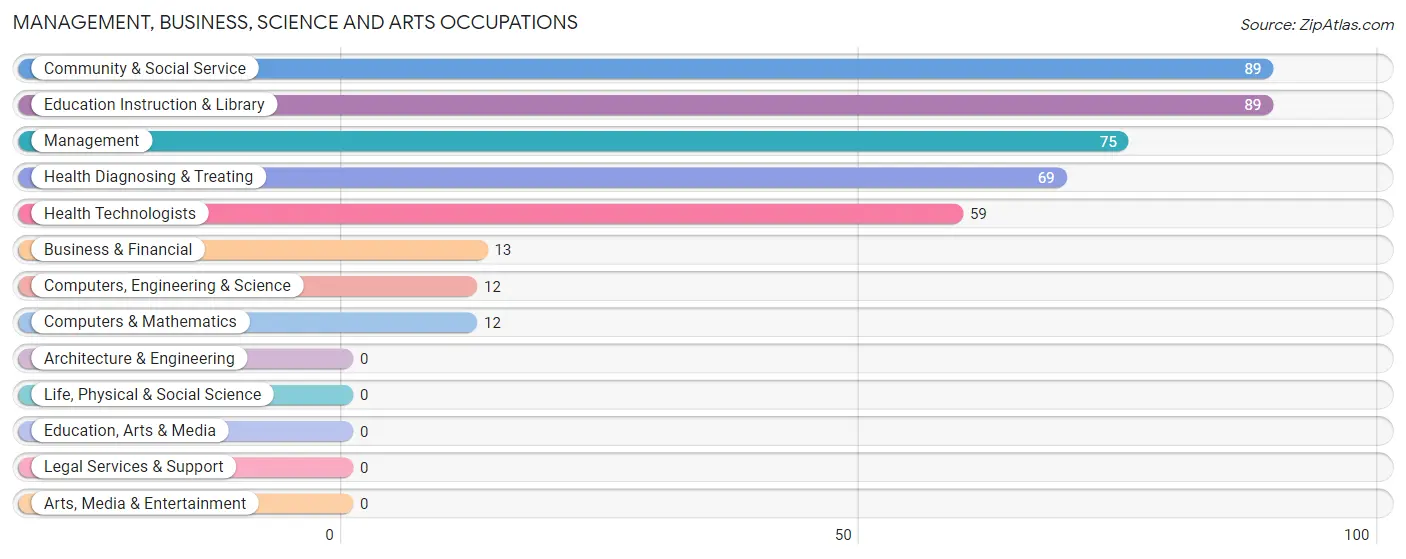
Management, Business, Science and Arts Occupations
The most common Management, Business, Science and Arts occupations in Llano Grande are Community & Social Service (89 | 12.6%), Education Instruction & Library (89 | 12.6%), Management (75 | 10.6%), Health Diagnosing & Treating (69 | 9.7%), and Health Technologists (59 | 8.3%).
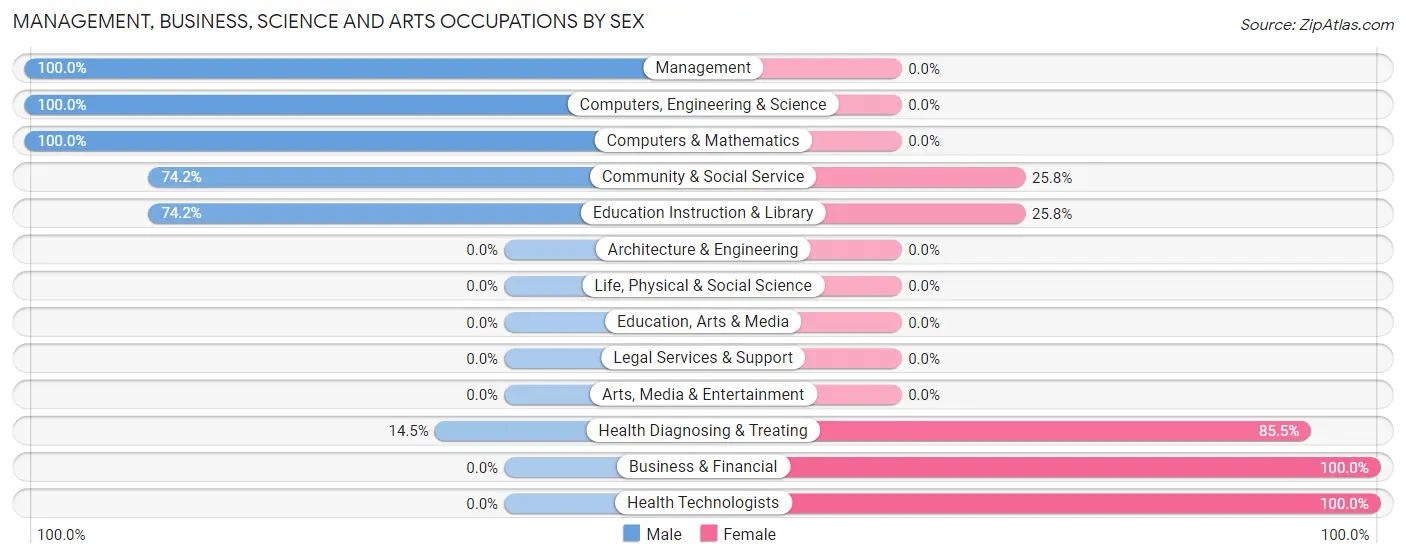
Management, Business, Science and Arts Occupations by Sex
Within the Management, Business, Science and Arts occupations in Llano Grande, the most male-oriented occupations are Management (100.0%), Computers, Engineering & Science (100.0%), and Computers & Mathematics (100.0%), while the most female-oriented occupations are Business & Financial (100.0%), Health Technologists (100.0%), and Health Diagnosing & Treating (85.5%).
| Occupation | Male | Female |
| Management | 75 (100.0%) | 0 (0.0%) |
| Business & Financial | 0 (0.0%) | 13 (100.0%) |
| Computers, Engineering & Science | 12 (100.0%) | 0 (0.0%) |
| Computers & Mathematics | 12 (100.0%) | 0 (0.0%) |
| Architecture & Engineering | 0 (0.0%) | 0 (0.0%) |
| Life, Physical & Social Science | 0 (0.0%) | 0 (0.0%) |
| Community & Social Service | 66 (74.2%) | 23 (25.8%) |
| Education, Arts & Media | 0 (0.0%) | 0 (0.0%) |
| Legal Services & Support | 0 (0.0%) | 0 (0.0%) |
| Education Instruction & Library | 66 (74.2%) | 23 (25.8%) |
| Arts, Media & Entertainment | 0 (0.0%) | 0 (0.0%) |
| Health Diagnosing & Treating | 10 (14.5%) | 59 (85.5%) |
| Health Technologists | 0 (0.0%) | 59 (100.0%) |
| Total (Category) | 163 (63.2%) | 95 (36.8%) |
| Total (Overall) | 342 (48.2%) | 367 (51.8%) |
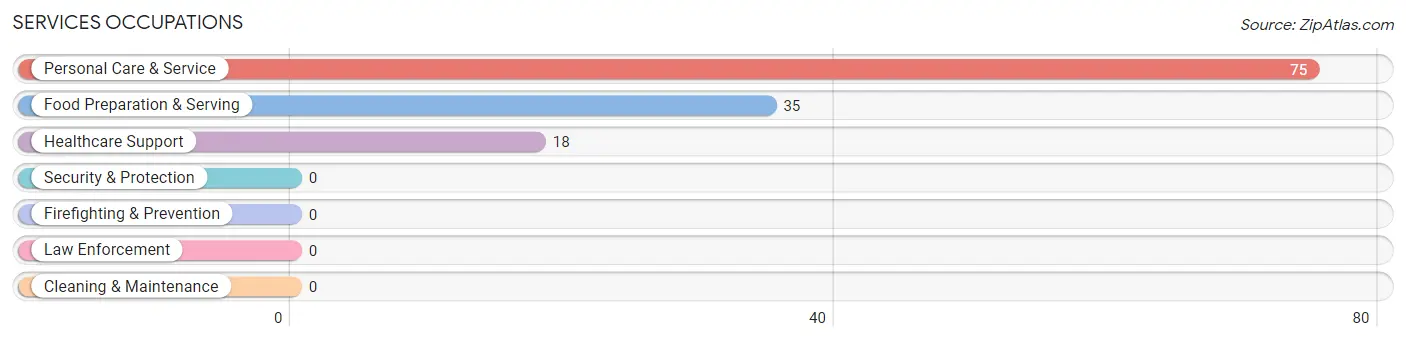
Services Occupations
The most common Services occupations in Llano Grande are Personal Care & Service (75 | 10.6%), Food Preparation & Serving (35 | 4.9%), and Healthcare Support (18 | 2.5%).
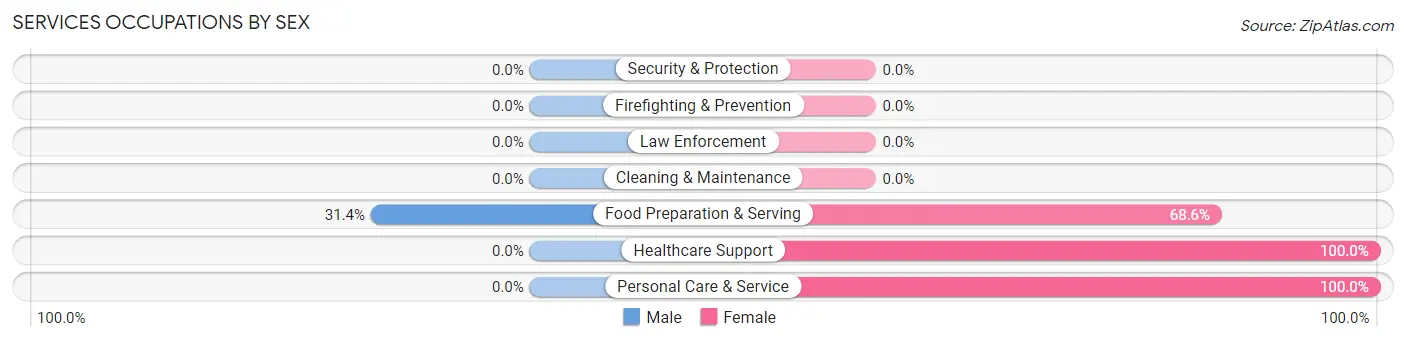
Services Occupations by Sex
| Occupation | Male | Female |
| Healthcare Support | 0 (0.0%) | 18 (100.0%) |
| Security & Protection | 0 (0.0%) | 0 (0.0%) |
| Firefighting & Prevention | 0 (0.0%) | 0 (0.0%) |
| Law Enforcement | 0 (0.0%) | 0 (0.0%) |
| Food Preparation & Serving | 11 (31.4%) | 24 (68.6%) |
| Cleaning & Maintenance | 0 (0.0%) | 0 (0.0%) |
| Personal Care & Service | 0 (0.0%) | 75 (100.0%) |
| Total (Category) | 11 (8.6%) | 117 (91.4%) |
| Total (Overall) | 342 (48.2%) | 367 (51.8%) |
Sales and Office Occupations
The most common Sales and Office occupations in Llano Grande are Office & Administration (119 | 16.8%), and Sales & Related (82 | 11.6%).

Sales and Office Occupations by Sex
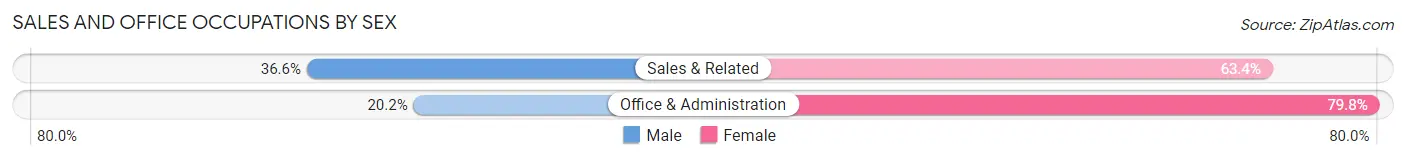
| Occupation | Male | Female |
| Sales & Related | 30 (36.6%) | 52 (63.4%) |
| Office & Administration | 24 (20.2%) | 95 (79.8%) |
| Total (Category) | 54 (26.9%) | 147 (73.1%) |
| Total (Overall) | 342 (48.2%) | 367 (51.8%) |
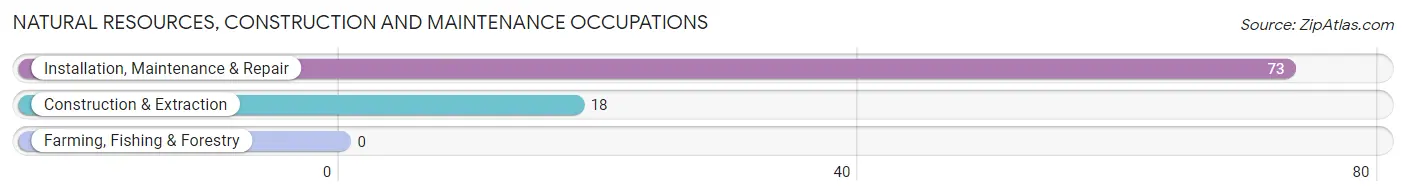
Natural Resources, Construction and Maintenance Occupations
The most common Natural Resources, Construction and Maintenance occupations in Llano Grande are Installation, Maintenance & Repair (73 | 10.3%), and Construction & Extraction (18 | 2.5%).
Natural Resources, Construction and Maintenance Occupations by Sex
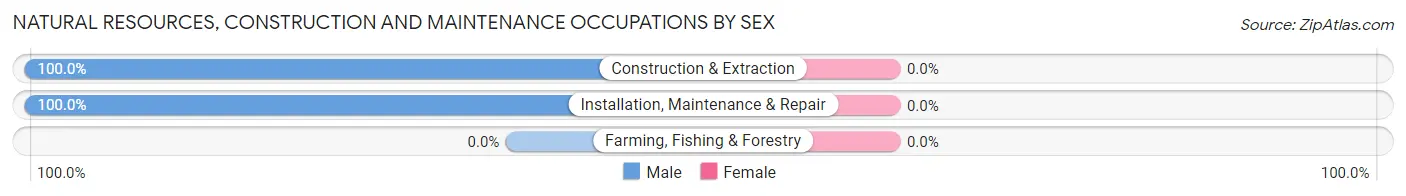
| Occupation | Male | Female |
| Farming, Fishing & Forestry | 0 (0.0%) | 0 (0.0%) |
| Construction & Extraction | 18 (100.0%) | 0 (0.0%) |
| Installation, Maintenance & Repair | 73 (100.0%) | 0 (0.0%) |
| Total (Category) | 91 (100.0%) | 0 (0.0%) |
| Total (Overall) | 342 (48.2%) | 367 (51.8%) |
Production, Transportation and Moving Occupations
The most common Production, Transportation and Moving occupations in Llano Grande are Material Moving (23 | 3.2%), and Production (8 | 1.1%).
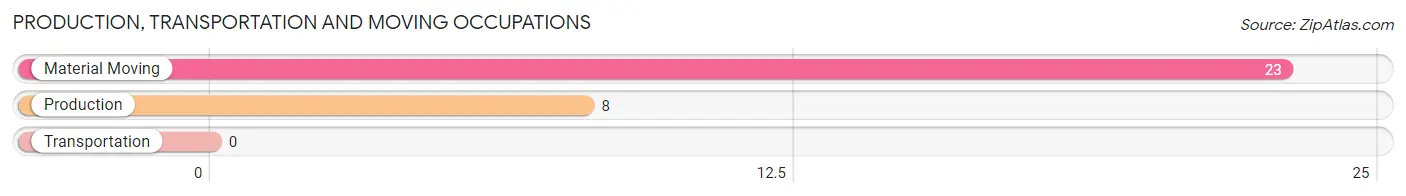
Production, Transportation and Moving Occupations by Sex
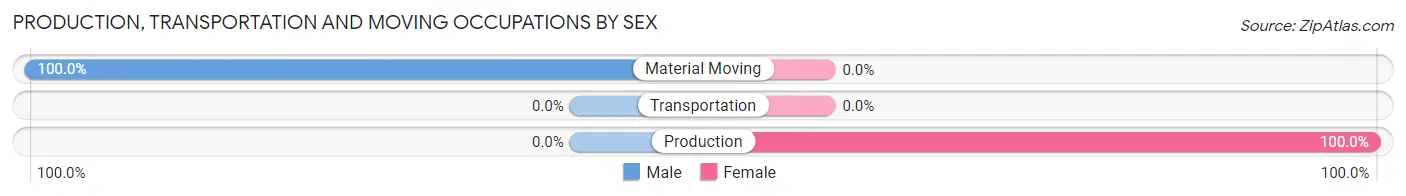
| Occupation | Male | Female |
| Production | 0 (0.0%) | 8 (100.0%) |
| Transportation | 0 (0.0%) | 0 (0.0%) |
| Material Moving | 23 (100.0%) | 0 (0.0%) |
| Total (Category) | 23 (74.2%) | 8 (25.8%) |
| Total (Overall) | 342 (48.2%) | 367 (51.8%) |
Employment Industries by Sex in Llano Grande
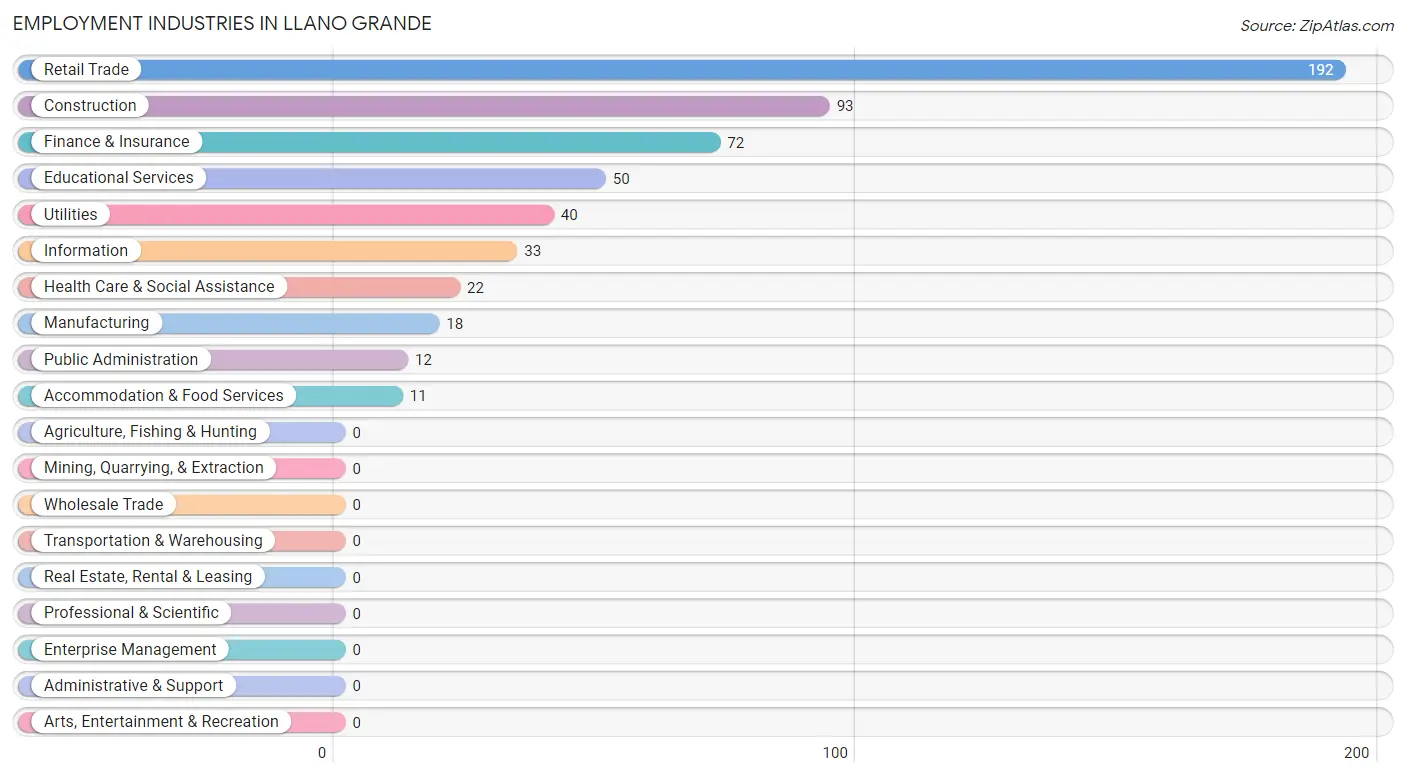
Employment Industries in Llano Grande
The major employment industries in Llano Grande include Retail Trade (192 | 27.1%), Construction (93 | 13.1%), Finance & Insurance (72 | 10.2%), Educational Services (50 | 7.0%), and Utilities (40 | 5.6%).
Employment Industries by Sex in Llano Grande
The Llano Grande industries that see more men than women are Construction (100.0%), Utilities (100.0%), and Information (100.0%), whereas the industries that tend to have a higher number of women are Finance & Insurance (100.0%), Health Care & Social Assistance (100.0%), and Educational Services (46.0%).
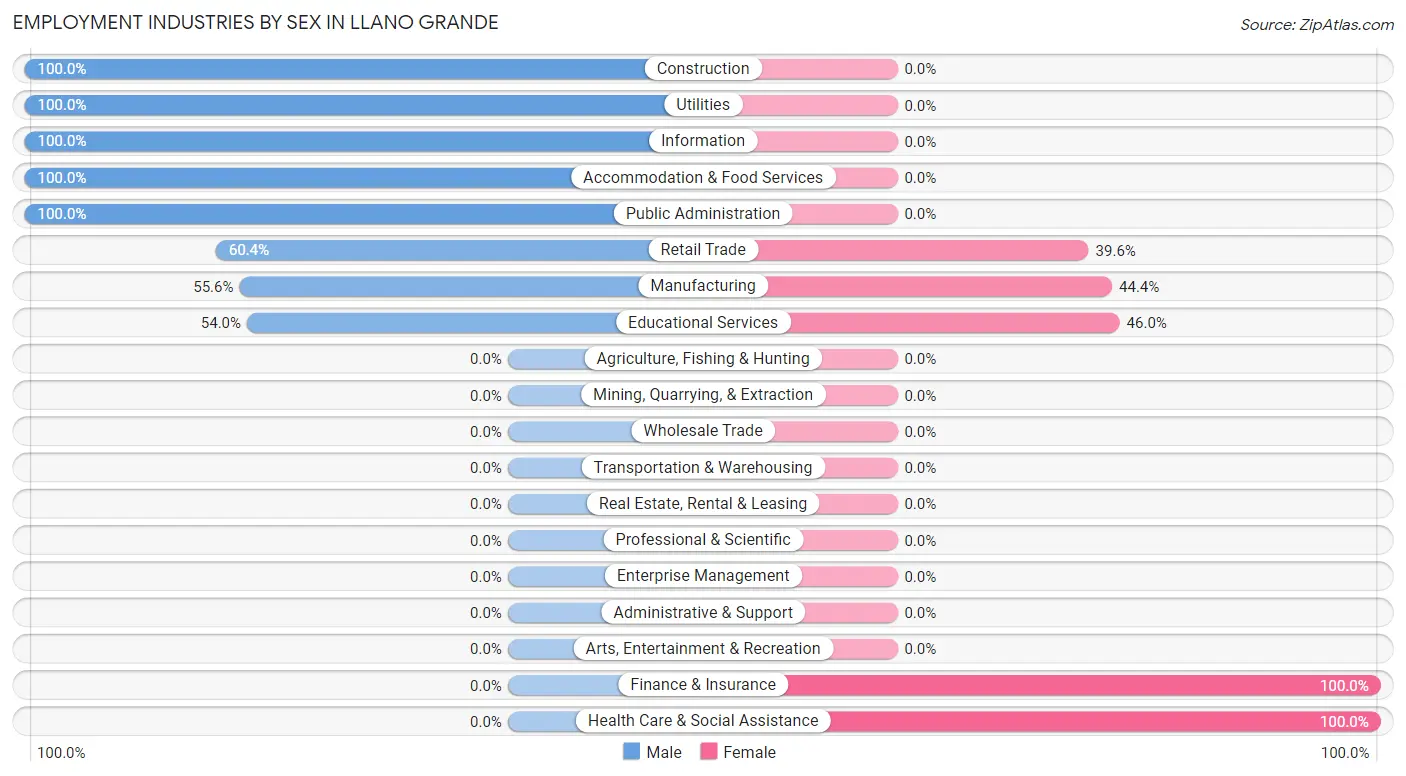
| Industry | Male | Female |
| Agriculture, Fishing & Hunting | 0 (0.0%) | 0 (0.0%) |
| Mining, Quarrying, & Extraction | 0 (0.0%) | 0 (0.0%) |
| Construction | 93 (100.0%) | 0 (0.0%) |
| Manufacturing | 10 (55.6%) | 8 (44.4%) |
| Wholesale Trade | 0 (0.0%) | 0 (0.0%) |
| Retail Trade | 116 (60.4%) | 76 (39.6%) |
| Transportation & Warehousing | 0 (0.0%) | 0 (0.0%) |
| Utilities | 40 (100.0%) | 0 (0.0%) |
| Information | 33 (100.0%) | 0 (0.0%) |
| Finance & Insurance | 0 (0.0%) | 72 (100.0%) |
| Real Estate, Rental & Leasing | 0 (0.0%) | 0 (0.0%) |
| Professional & Scientific | 0 (0.0%) | 0 (0.0%) |
| Enterprise Management | 0 (0.0%) | 0 (0.0%) |
| Administrative & Support | 0 (0.0%) | 0 (0.0%) |
| Educational Services | 27 (54.0%) | 23 (46.0%) |
| Health Care & Social Assistance | 0 (0.0%) | 22 (100.0%) |
| Arts, Entertainment & Recreation | 0 (0.0%) | 0 (0.0%) |
| Accommodation & Food Services | 11 (100.0%) | 0 (0.0%) |
| Public Administration | 12 (100.0%) | 0 (0.0%) |
| Total | 342 (48.2%) | 367 (51.8%) |
Education in Llano Grande
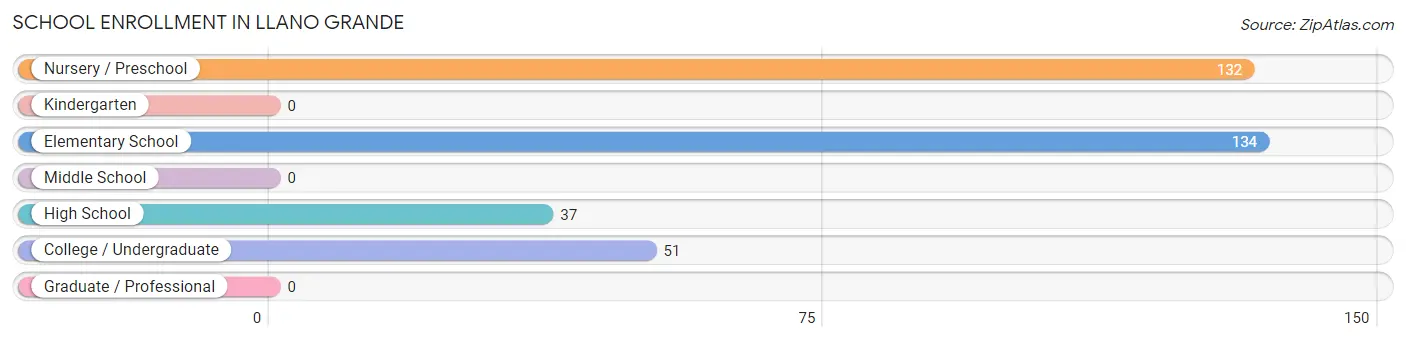
School Enrollment in Llano Grande
The most common levels of schooling among the 354 students in Llano Grande are elementary school (134 | 37.9%), nursery / preschool (132 | 37.3%), and college / undergraduate (51 | 14.4%).
| School Level | # Students | % Students |
| Nursery / Preschool | 132 | 37.3% |
| Kindergarten | 0 | 0.0% |
| Elementary School | 134 | 37.9% |
| Middle School | 0 | 0.0% |
| High School | 37 | 10.4% |
| College / Undergraduate | 51 | 14.4% |
| Graduate / Professional | 0 | 0.0% |
| Total | 354 | 100.0% |
School Enrollment by Age by Funding Source in Llano Grande
Out of a total of 354 students who are enrolled in schools in Llano Grande, 102 (28.8%) attend a private institution, while the remaining 252 (71.2%) are enrolled in public schools. The age group of 10 to 14 year olds has the highest likelihood of being enrolled in private schools, with 35 (89.7% in the age bracket) enrolled. Conversely, the age group of 5 to 9 year old has the lowest likelihood of being enrolled in a private school, with 140 (100.0% in the age bracket) attending a public institution.
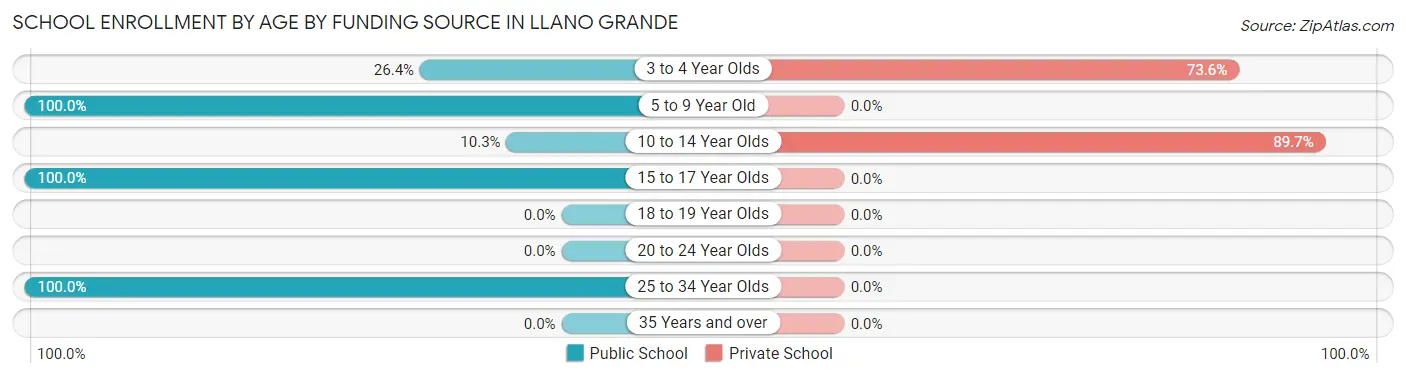
| Age Bracket | Public School | Private School |
| 3 to 4 Year Olds | 24 (26.4%) | 67 (73.6%) |
| 5 to 9 Year Old | 140 (100.0%) | 0 (0.0%) |
| 10 to 14 Year Olds | 4 (10.3%) | 35 (89.7%) |
| 15 to 17 Year Olds | 33 (100.0%) | 0 (0.0%) |
| 18 to 19 Year Olds | 0 (0.0%) | 0 (0.0%) |
| 20 to 24 Year Olds | 0 (0.0%) | 0 (0.0%) |
| 25 to 34 Year Olds | 51 (100.0%) | 0 (0.0%) |
| 35 Years and over | 0 (0.0%) | 0 (0.0%) |
| Total | 252 (71.2%) | 102 (28.8%) |
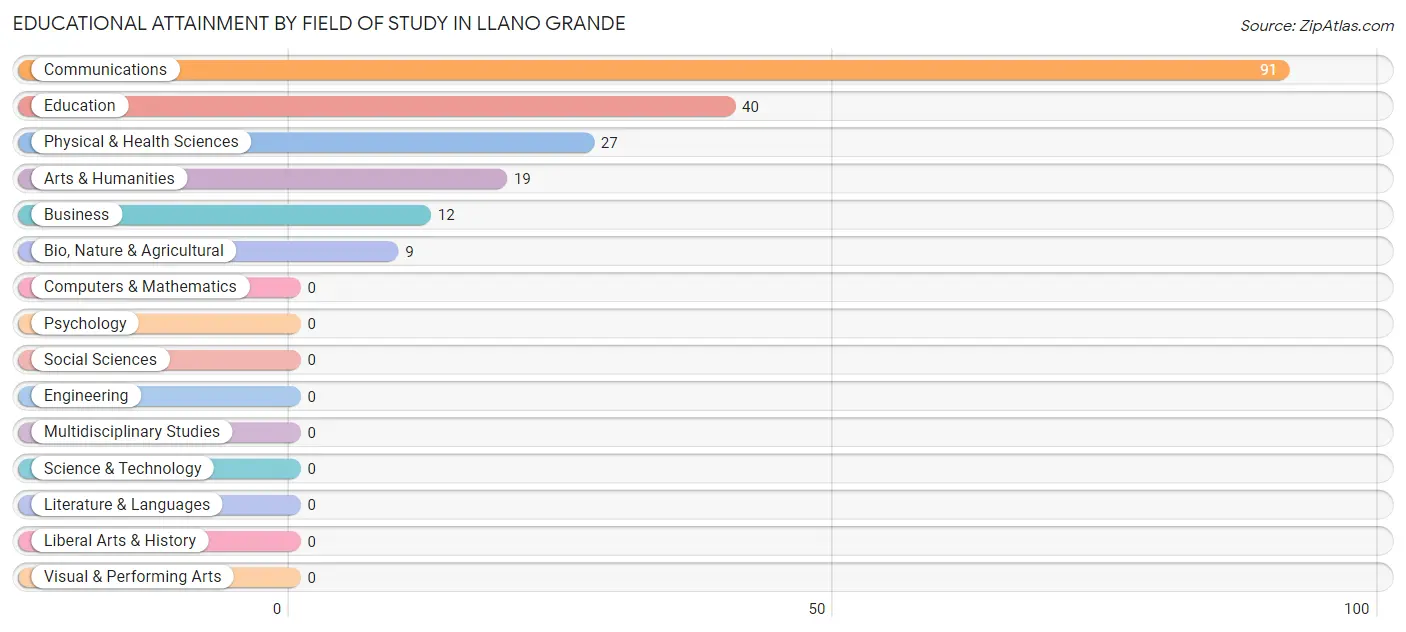
Educational Attainment by Field of Study in Llano Grande
Communications (91 | 46.0%), education (40 | 20.2%), physical & health sciences (27 | 13.6%), arts & humanities (19 | 9.6%), and business (12 | 6.1%) are the most common fields of study among 198 individuals in Llano Grande who have obtained a bachelor's degree or higher.
| Field of Study | # Graduates | % Graduates |
| Computers & Mathematics | 0 | 0.0% |
| Bio, Nature & Agricultural | 9 | 4.5% |
| Physical & Health Sciences | 27 | 13.6% |
| Psychology | 0 | 0.0% |
| Social Sciences | 0 | 0.0% |
| Engineering | 0 | 0.0% |
| Multidisciplinary Studies | 0 | 0.0% |
| Science & Technology | 0 | 0.0% |
| Business | 12 | 6.1% |
| Education | 40 | 20.2% |
| Literature & Languages | 0 | 0.0% |
| Liberal Arts & History | 0 | 0.0% |
| Visual & Performing Arts | 0 | 0.0% |
| Communications | 91 | 46.0% |
| Arts & Humanities | 19 | 9.6% |
| Total | 198 | 100.0% |
Transportation & Commute in Llano Grande
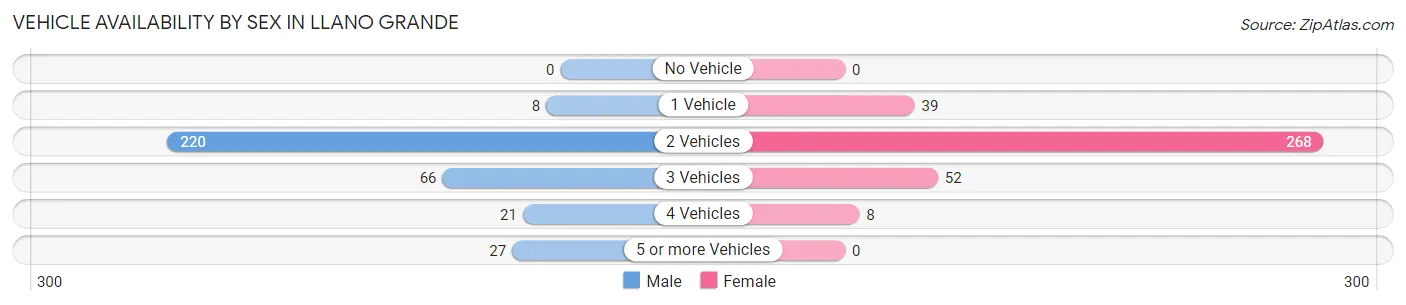
Vehicle Availability by Sex in Llano Grande
The most prevalent vehicle ownership categories in Llano Grande are males with 2 vehicles (220, accounting for 64.3%) and females with 2 vehicles (268, making up 60.0%).
| Vehicles Available | Male | Female |
| No Vehicle | 0 (0.0%) | 0 (0.0%) |
| 1 Vehicle | 8 (2.3%) | 39 (10.6%) |
| 2 Vehicles | 220 (64.3%) | 268 (73.0%) |
| 3 Vehicles | 66 (19.3%) | 52 (14.2%) |
| 4 Vehicles | 21 (6.1%) | 8 (2.2%) |
| 5 or more Vehicles | 27 (7.9%) | 0 (0.0%) |
| Total | 342 (100.0%) | 367 (100.0%) |
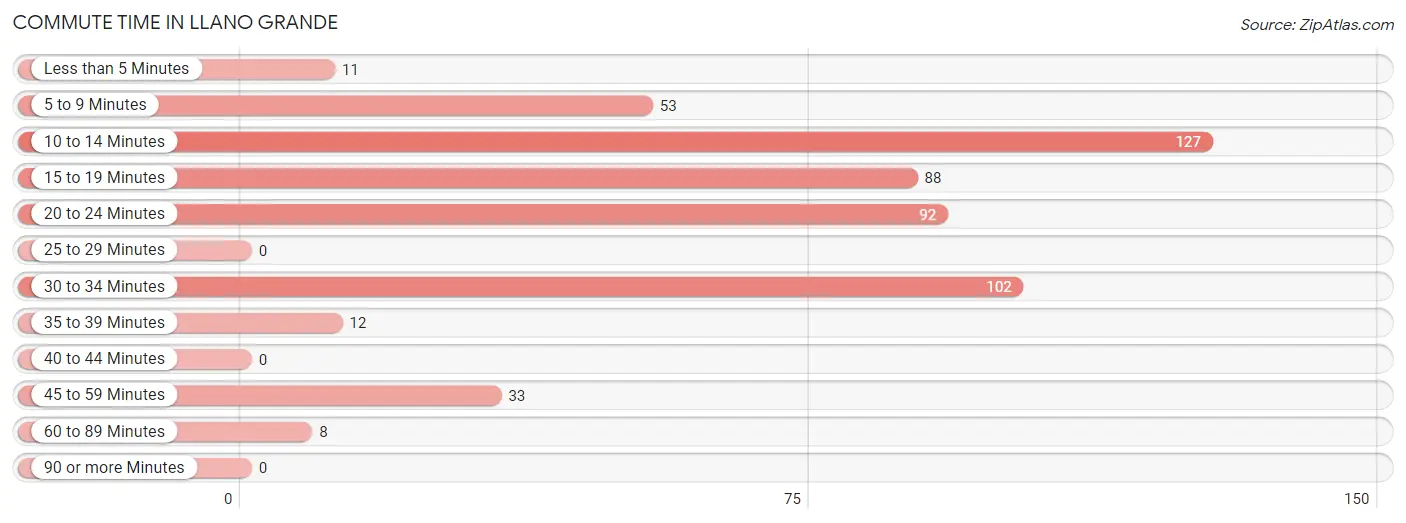
Commute Time in Llano Grande
The most frequently occuring commute durations in Llano Grande are 10 to 14 minutes (127 commuters, 24.1%), 30 to 34 minutes (102 commuters, 19.4%), and 20 to 24 minutes (92 commuters, 17.5%).
| Commute Time | # Commuters | % Commuters |
| Less than 5 Minutes | 11 | 2.1% |
| 5 to 9 Minutes | 53 | 10.1% |
| 10 to 14 Minutes | 127 | 24.1% |
| 15 to 19 Minutes | 88 | 16.7% |
| 20 to 24 Minutes | 92 | 17.5% |
| 25 to 29 Minutes | 0 | 0.0% |
| 30 to 34 Minutes | 102 | 19.4% |
| 35 to 39 Minutes | 12 | 2.3% |
| 40 to 44 Minutes | 0 | 0.0% |
| 45 to 59 Minutes | 33 | 6.3% |
| 60 to 89 Minutes | 8 | 1.5% |
| 90 or more Minutes | 0 | 0.0% |
Commute Time by Sex in Llano Grande
The most common commute times in Llano Grande are 20 to 24 minutes (92 commuters, 27.7%) for males and 15 to 19 minutes (75 commuters, 38.7%) for females.
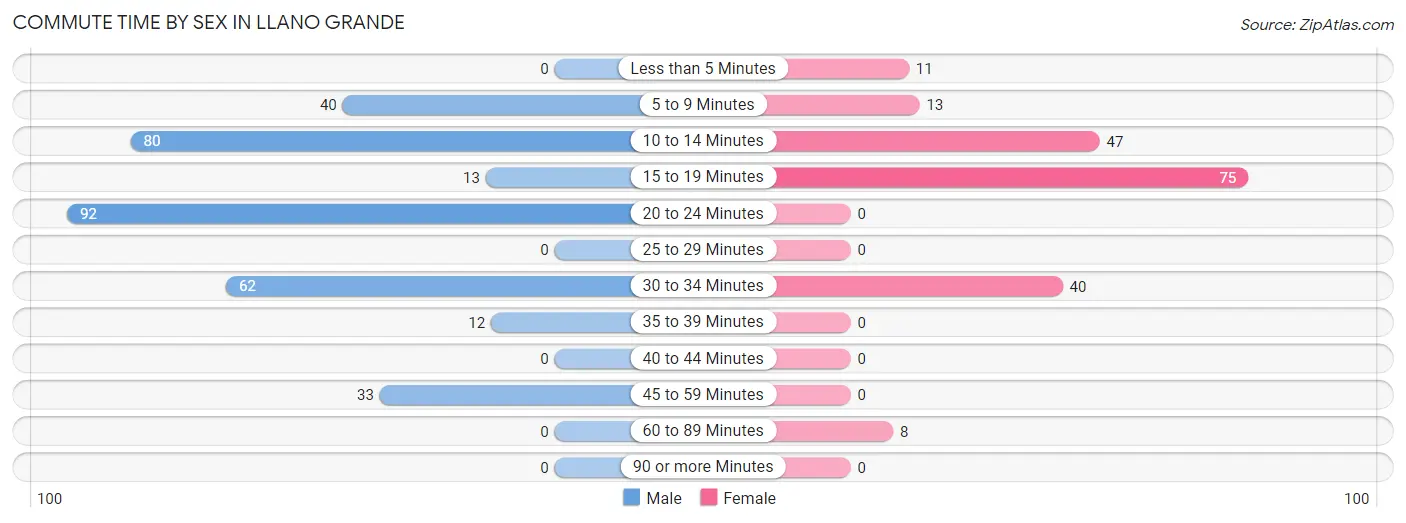
| Commute Time | Male | Female |
| Less than 5 Minutes | 0 (0.0%) | 11 (5.7%) |
| 5 to 9 Minutes | 40 (12.0%) | 13 (6.7%) |
| 10 to 14 Minutes | 80 (24.1%) | 47 (24.2%) |
| 15 to 19 Minutes | 13 (3.9%) | 75 (38.7%) |
| 20 to 24 Minutes | 92 (27.7%) | 0 (0.0%) |
| 25 to 29 Minutes | 0 (0.0%) | 0 (0.0%) |
| 30 to 34 Minutes | 62 (18.7%) | 40 (20.6%) |
| 35 to 39 Minutes | 12 (3.6%) | 0 (0.0%) |
| 40 to 44 Minutes | 0 (0.0%) | 0 (0.0%) |
| 45 to 59 Minutes | 33 (9.9%) | 0 (0.0%) |
| 60 to 89 Minutes | 0 (0.0%) | 8 (4.1%) |
| 90 or more Minutes | 0 (0.0%) | 0 (0.0%) |
Time of Departure to Work by Sex in Llano Grande
The most frequent times of departure to work in Llano Grande are 8:00 AM to 8:29 AM (75, 22.6%) for males and 8:30 AM to 8:59 AM (75, 38.7%) for females.
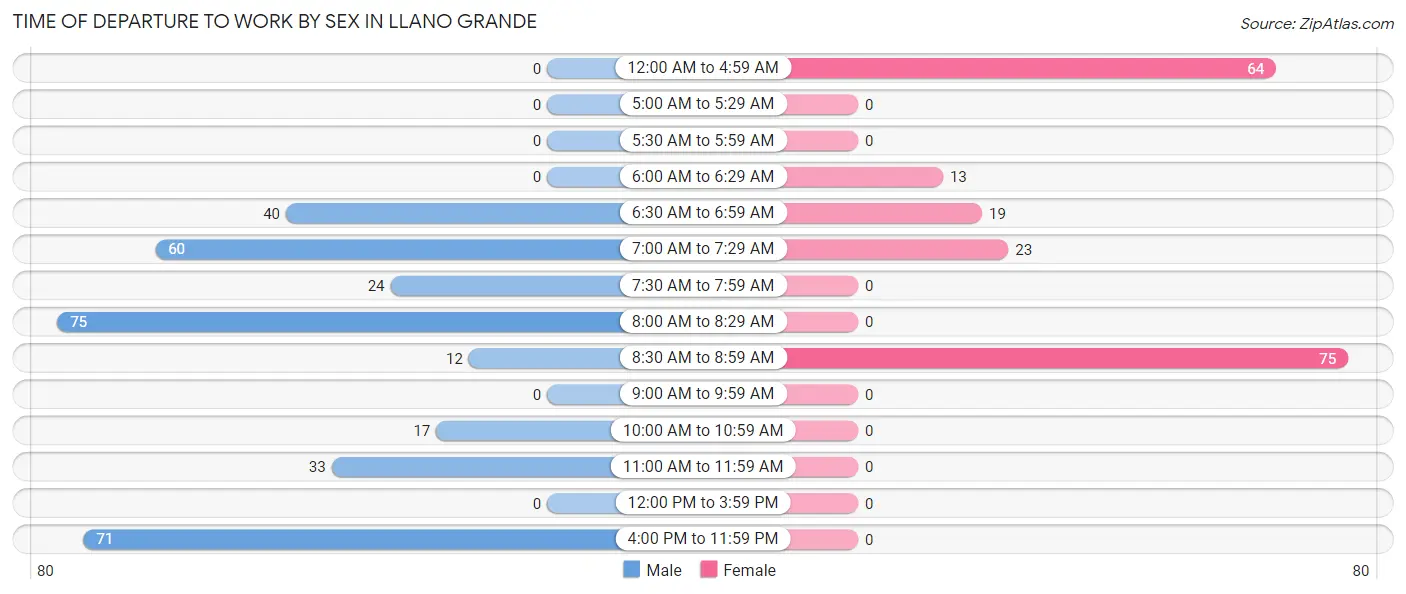
| Time of Departure | Male | Female |
| 12:00 AM to 4:59 AM | 0 (0.0%) | 64 (33.0%) |
| 5:00 AM to 5:29 AM | 0 (0.0%) | 0 (0.0%) |
| 5:30 AM to 5:59 AM | 0 (0.0%) | 0 (0.0%) |
| 6:00 AM to 6:29 AM | 0 (0.0%) | 13 (6.7%) |
| 6:30 AM to 6:59 AM | 40 (12.0%) | 19 (9.8%) |
| 7:00 AM to 7:29 AM | 60 (18.1%) | 23 (11.9%) |
| 7:30 AM to 7:59 AM | 24 (7.2%) | 0 (0.0%) |
| 8:00 AM to 8:29 AM | 75 (22.6%) | 0 (0.0%) |
| 8:30 AM to 8:59 AM | 12 (3.6%) | 75 (38.7%) |
| 9:00 AM to 9:59 AM | 0 (0.0%) | 0 (0.0%) |
| 10:00 AM to 10:59 AM | 17 (5.1%) | 0 (0.0%) |
| 11:00 AM to 11:59 AM | 33 (9.9%) | 0 (0.0%) |
| 12:00 PM to 3:59 PM | 0 (0.0%) | 0 (0.0%) |
| 4:00 PM to 11:59 PM | 71 (21.4%) | 0 (0.0%) |
| Total | 332 (100.0%) | 194 (100.0%) |
Housing Occupancy in Llano Grande
Occupancy by Ownership in Llano Grande
Of the total 839 dwellings in Llano Grande, owner-occupied units account for 744 (88.7%), while renter-occupied units make up 95 (11.3%).
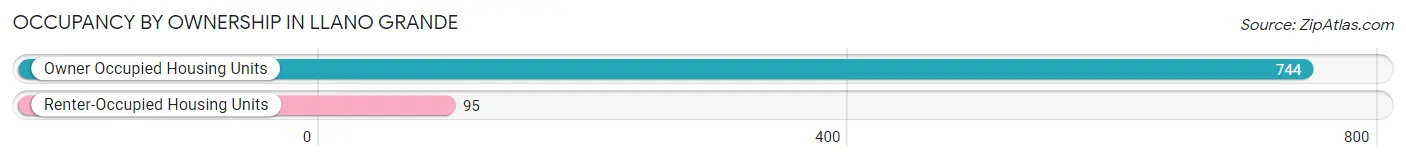
| Occupancy | # Housing Units | % Housing Units |
| Owner Occupied Housing Units | 744 | 88.7% |
| Renter-Occupied Housing Units | 95 | 11.3% |
| Total Occupied Housing Units | 839 | 100.0% |
Occupancy by Household Size in Llano Grande
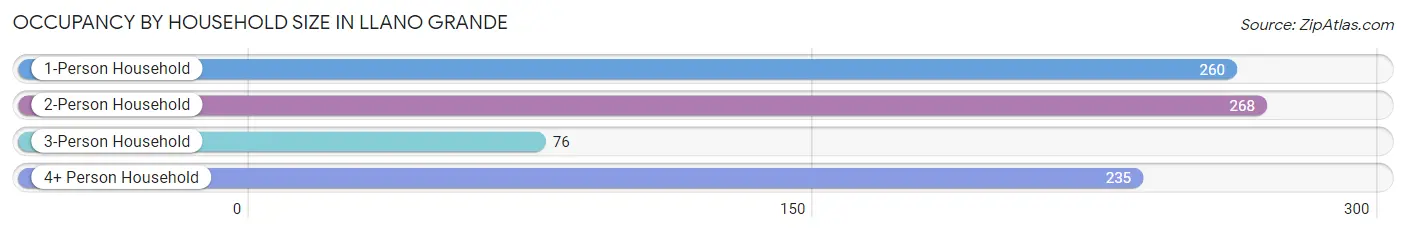
| Household Size | # Housing Units | % Housing Units |
| 1-Person Household | 260 | 31.0% |
| 2-Person Household | 268 | 31.9% |
| 3-Person Household | 76 | 9.1% |
| 4+ Person Household | 235 | 28.0% |
| Total Housing Units | 839 | 100.0% |
Occupancy by Ownership by Household Size in Llano Grande
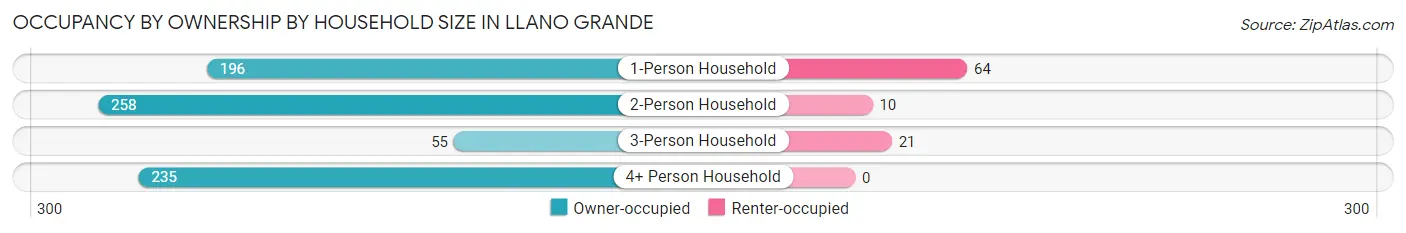
| Household Size | Owner-occupied | Renter-occupied |
| 1-Person Household | 196 (75.4%) | 64 (24.6%) |
| 2-Person Household | 258 (96.3%) | 10 (3.7%) |
| 3-Person Household | 55 (72.4%) | 21 (27.6%) |
| 4+ Person Household | 235 (100.0%) | 0 (0.0%) |
| Total Housing Units | 744 (88.7%) | 95 (11.3%) |
Occupancy by Educational Attainment in Llano Grande
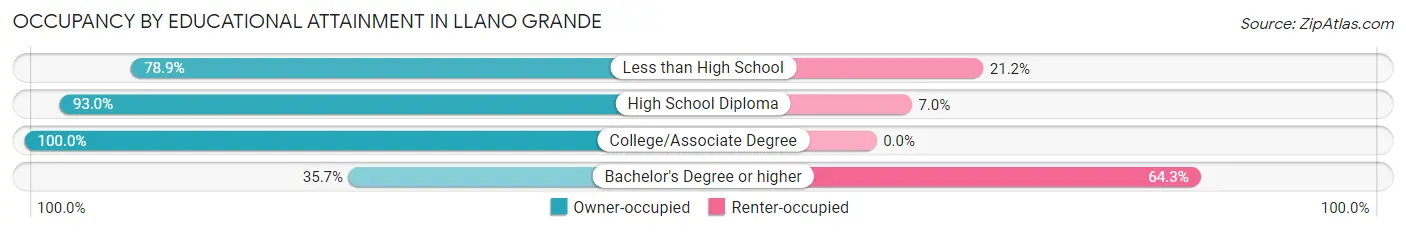
| Household Size | Owner-occupied | Renter-occupied |
| Less than High School | 164 (78.8%) | 44 (21.1%) |
| High School Diploma | 319 (93.0%) | 24 (7.0%) |
| College/Associate Degree | 246 (100.0%) | 0 (0.0%) |
| Bachelor's Degree or higher | 15 (35.7%) | 27 (64.3%) |
Occupancy by Age of Householder in Llano Grande
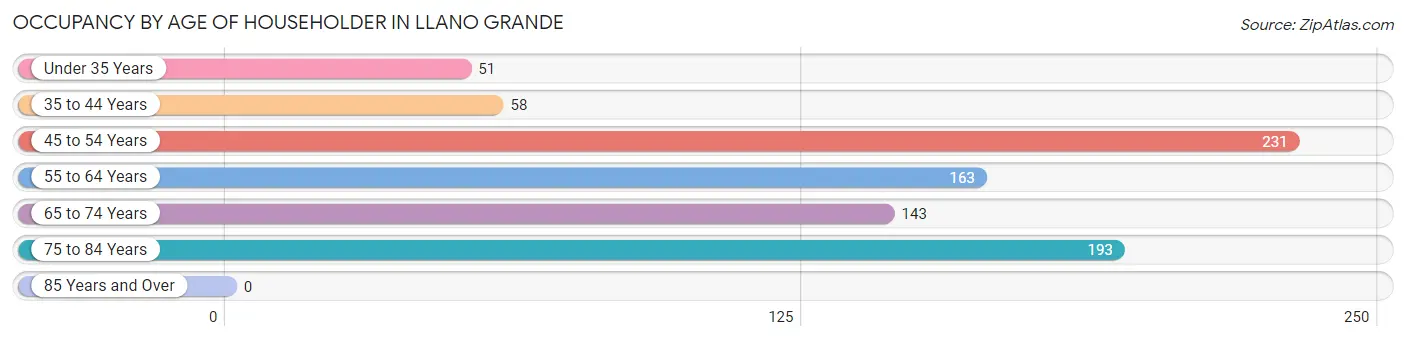
| Age Bracket | # Households | % Households |
| Under 35 Years | 51 | 6.1% |
| 35 to 44 Years | 58 | 6.9% |
| 45 to 54 Years | 231 | 27.5% |
| 55 to 64 Years | 163 | 19.4% |
| 65 to 74 Years | 143 | 17.0% |
| 75 to 84 Years | 193 | 23.0% |
| 85 Years and Over | 0 | 0.0% |
| Total | 839 | 100.0% |
Housing Finances in Llano Grande
Median Income by Occupancy in Llano Grande
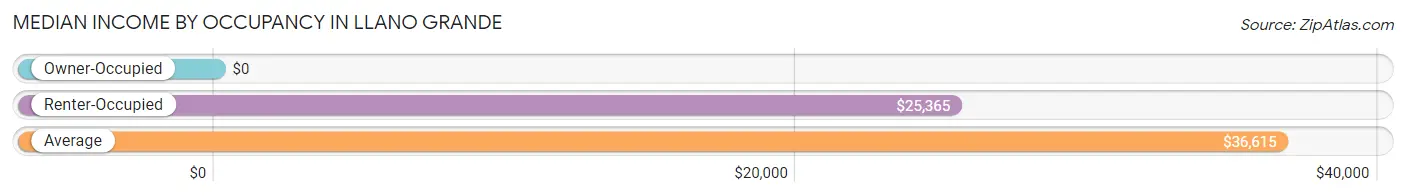
| Occupancy Type | # Households | Median Income |
| Owner-Occupied | 744 (88.7%) | $0 |
| Renter-Occupied | 95 (11.3%) | $25,365 |
| Average | 839 (100.0%) | $36,615 |
Occupancy by Householder Income Bracket in Llano Grande
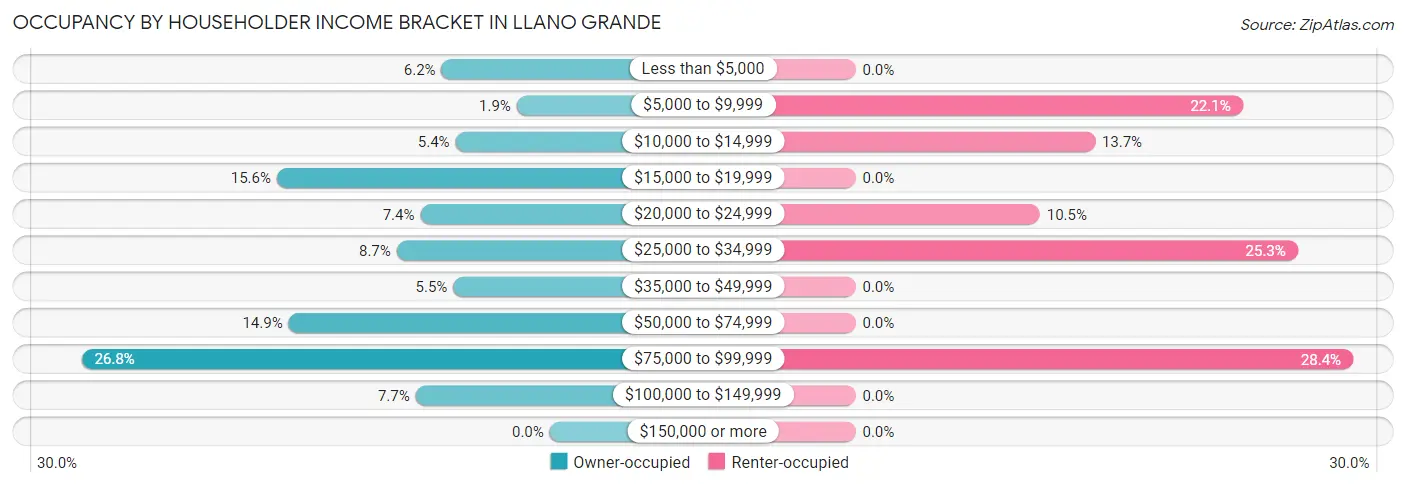
| Income Bracket | Owner-occupied | Renter-occupied |
| Less than $5,000 | 46 (6.2%) | 0 (0.0%) |
| $5,000 to $9,999 | 14 (1.9%) | 21 (22.1%) |
| $10,000 to $14,999 | 40 (5.4%) | 13 (13.7%) |
| $15,000 to $19,999 | 116 (15.6%) | 0 (0.0%) |
| $20,000 to $24,999 | 55 (7.4%) | 10 (10.5%) |
| $25,000 to $34,999 | 65 (8.7%) | 24 (25.3%) |
| $35,000 to $49,999 | 41 (5.5%) | 0 (0.0%) |
| $50,000 to $74,999 | 111 (14.9%) | 0 (0.0%) |
| $75,000 to $99,999 | 199 (26.8%) | 27 (28.4%) |
| $100,000 to $149,999 | 57 (7.7%) | 0 (0.0%) |
| $150,000 or more | 0 (0.0%) | 0 (0.0%) |
| Total | 744 (100.0%) | 95 (100.0%) |
Monthly Housing Cost Tiers in Llano Grande
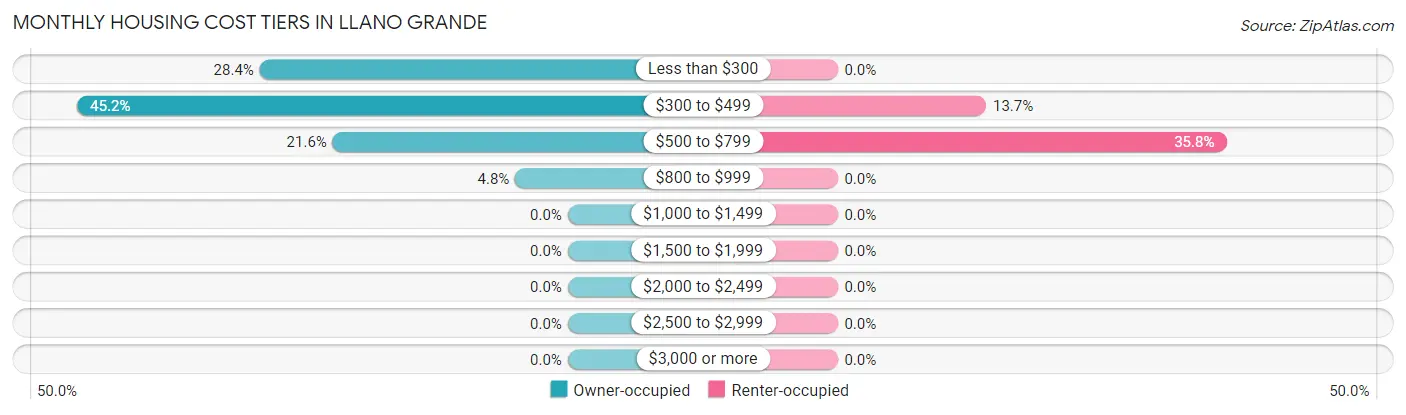
| Monthly Cost | Owner-occupied | Renter-occupied |
| Less than $300 | 211 (28.4%) | 0 (0.0%) |
| $300 to $499 | 336 (45.2%) | 13 (13.7%) |
| $500 to $799 | 161 (21.6%) | 34 (35.8%) |
| $800 to $999 | 36 (4.8%) | 0 (0.0%) |
| $1,000 to $1,499 | 0 (0.0%) | 0 (0.0%) |
| $1,500 to $1,999 | 0 (0.0%) | 0 (0.0%) |
| $2,000 to $2,499 | 0 (0.0%) | 0 (0.0%) |
| $2,500 to $2,999 | 0 (0.0%) | 0 (0.0%) |
| $3,000 or more | 0 (0.0%) | 0 (0.0%) |
| Total | 744 (100.0%) | 95 (100.0%) |
Physical Housing Characteristics in Llano Grande
Housing Structures in Llano Grande
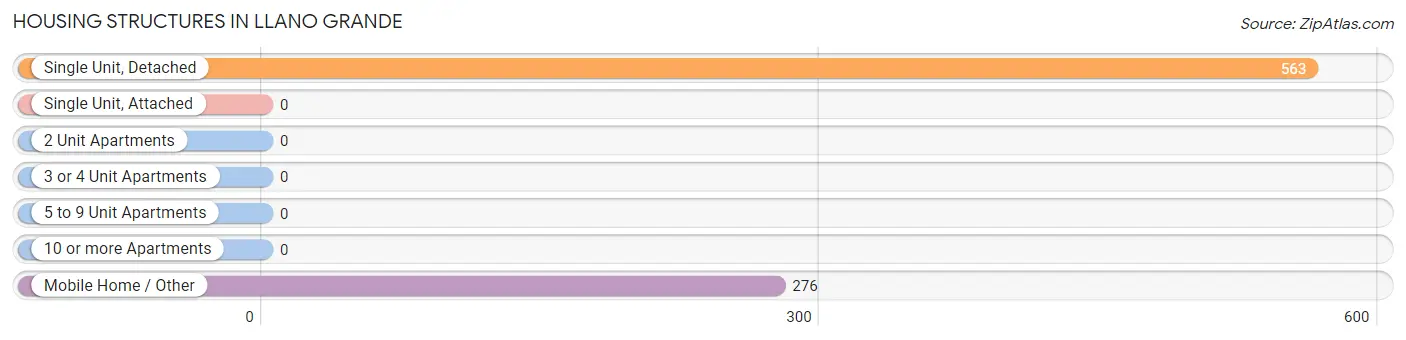
| Structure Type | # Housing Units | % Housing Units |
| Single Unit, Detached | 563 | 67.1% |
| Single Unit, Attached | 0 | 0.0% |
| 2 Unit Apartments | 0 | 0.0% |
| 3 or 4 Unit Apartments | 0 | 0.0% |
| 5 to 9 Unit Apartments | 0 | 0.0% |
| 10 or more Apartments | 0 | 0.0% |
| Mobile Home / Other | 276 | 32.9% |
| Total | 839 | 100.0% |
Housing Structures by Occupancy in Llano Grande
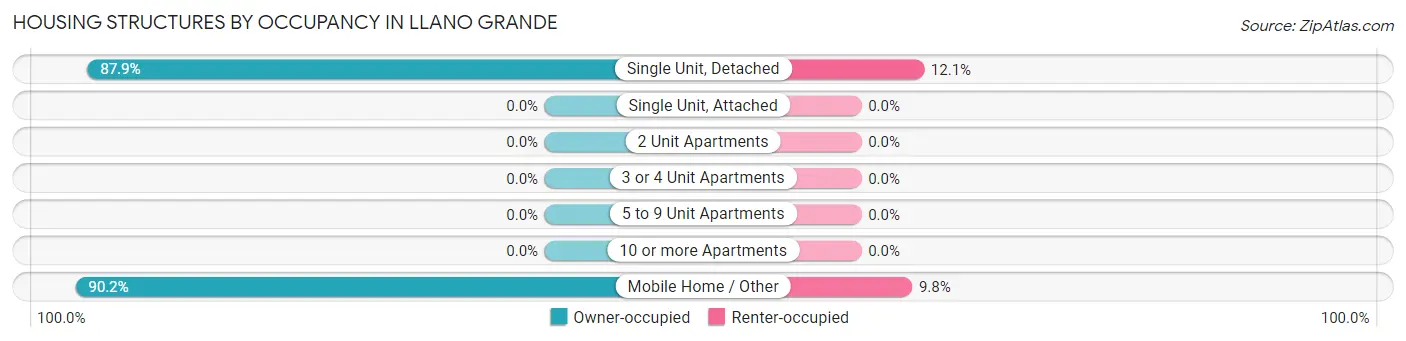
| Structure Type | Owner-occupied | Renter-occupied |
| Single Unit, Detached | 495 (87.9%) | 68 (12.1%) |
| Single Unit, Attached | 0 (0.0%) | 0 (0.0%) |
| 2 Unit Apartments | 0 (0.0%) | 0 (0.0%) |
| 3 or 4 Unit Apartments | 0 (0.0%) | 0 (0.0%) |
| 5 to 9 Unit Apartments | 0 (0.0%) | 0 (0.0%) |
| 10 or more Apartments | 0 (0.0%) | 0 (0.0%) |
| Mobile Home / Other | 249 (90.2%) | 27 (9.8%) |
| Total | 744 (88.7%) | 95 (11.3%) |
Housing Structures by Number of Rooms in Llano Grande
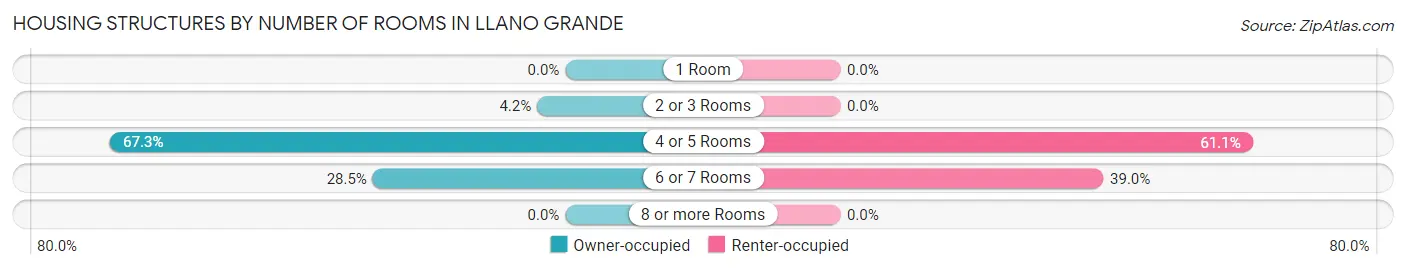
| Number of Rooms | Owner-occupied | Renter-occupied |
| 1 Room | 0 (0.0%) | 0 (0.0%) |
| 2 or 3 Rooms | 31 (4.2%) | 0 (0.0%) |
| 4 or 5 Rooms | 501 (67.3%) | 58 (61.1%) |
| 6 or 7 Rooms | 212 (28.5%) | 37 (39.0%) |
| 8 or more Rooms | 0 (0.0%) | 0 (0.0%) |
| Total | 744 (100.0%) | 95 (100.0%) |
Housing Structure by Heating Type in Llano Grande
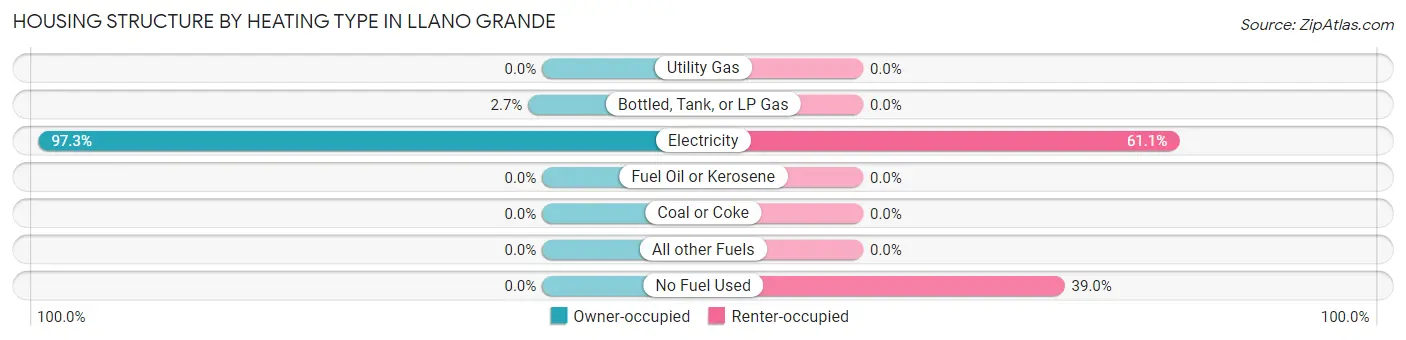
| Heating Type | Owner-occupied | Renter-occupied |
| Utility Gas | 0 (0.0%) | 0 (0.0%) |
| Bottled, Tank, or LP Gas | 20 (2.7%) | 0 (0.0%) |
| Electricity | 724 (97.3%) | 58 (61.1%) |
| Fuel Oil or Kerosene | 0 (0.0%) | 0 (0.0%) |
| Coal or Coke | 0 (0.0%) | 0 (0.0%) |
| All other Fuels | 0 (0.0%) | 0 (0.0%) |
| No Fuel Used | 0 (0.0%) | 37 (39.0%) |
| Total | 744 (100.0%) | 95 (100.0%) |
Household Vehicle Usage in Llano Grande
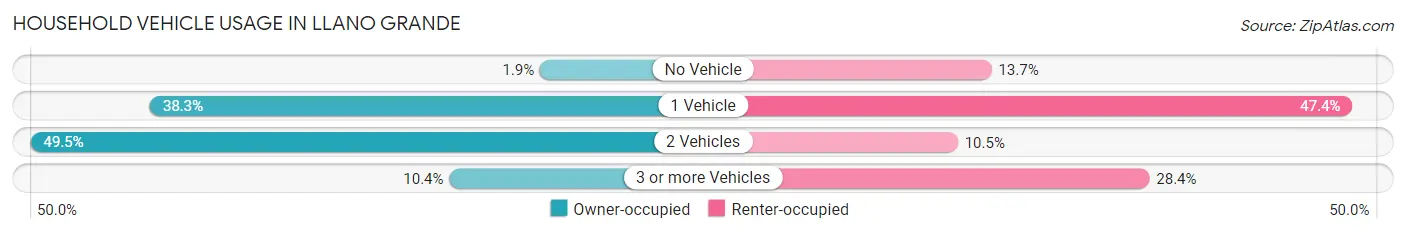
| Vehicles per Household | Owner-occupied | Renter-occupied |
| No Vehicle | 14 (1.9%) | 13 (13.7%) |
| 1 Vehicle | 285 (38.3%) | 45 (47.4%) |
| 2 Vehicles | 368 (49.5%) | 10 (10.5%) |
| 3 or more Vehicles | 77 (10.3%) | 27 (28.4%) |
| Total | 744 (100.0%) | 95 (100.0%) |
Real Estate & Mortgages in Llano Grande
Real Estate and Mortgage Overview in Llano Grande
| Characteristic | Without Mortgage | With Mortgage |
| Housing Units | 704 | 40 |
| Median Property Value | $62,100 | $0 |
| Median Household Income | $36,667 | $0 |
| Monthly Housing Costs | $339 | $0 |
| Real Estate Taxes | $1,023 | $0 |
Property Value by Mortgage Status in Llano Grande
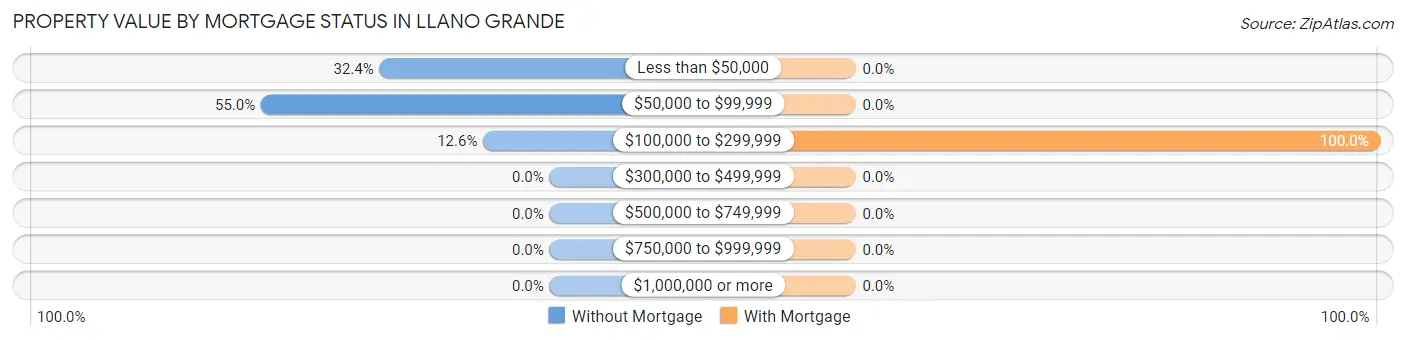
| Property Value | Without Mortgage | With Mortgage |
| Less than $50,000 | 228 (32.4%) | 0 (0.0%) |
| $50,000 to $99,999 | 387 (55.0%) | 0 (0.0%) |
| $100,000 to $299,999 | 89 (12.6%) | 40 (100.0%) |
| $300,000 to $499,999 | 0 (0.0%) | 0 (0.0%) |
| $500,000 to $749,999 | 0 (0.0%) | 0 (0.0%) |
| $750,000 to $999,999 | 0 (0.0%) | 0 (0.0%) |
| $1,000,000 or more | 0 (0.0%) | 0 (0.0%) |
| Total | 704 (100.0%) | 40 (100.0%) |
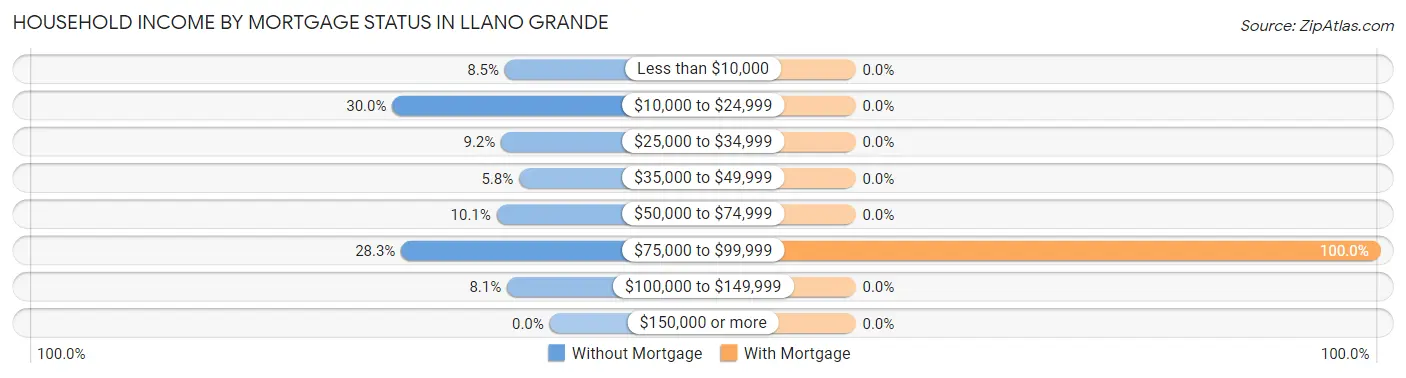
Household Income by Mortgage Status in Llano Grande
| Household Income | Without Mortgage | With Mortgage |
| Less than $10,000 | 60 (8.5%) | 0 (0.0%) |
| $10,000 to $24,999 | 211 (30.0%) | 0 (0.0%) |
| $25,000 to $34,999 | 65 (9.2%) | 0 (0.0%) |
| $35,000 to $49,999 | 41 (5.8%) | 0 (0.0%) |
| $50,000 to $74,999 | 71 (10.1%) | 0 (0.0%) |
| $75,000 to $99,999 | 199 (28.3%) | 40 (100.0%) |
| $100,000 to $149,999 | 57 (8.1%) | 0 (0.0%) |
| $150,000 or more | 0 (0.0%) | 0 (0.0%) |
| Total | 704 (100.0%) | 40 (100.0%) |
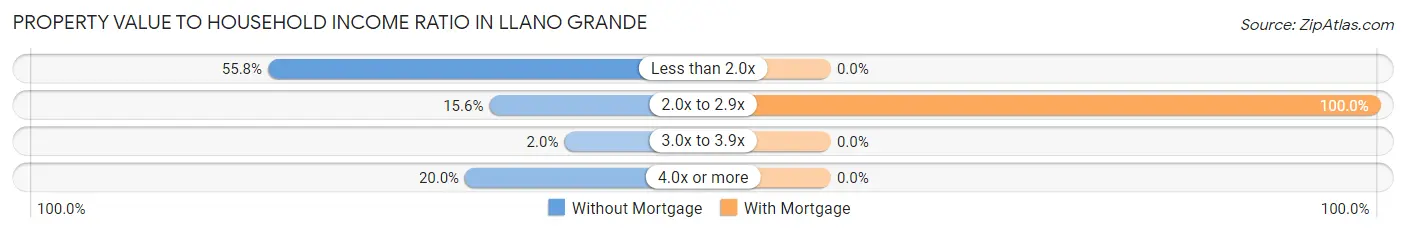
Property Value to Household Income Ratio in Llano Grande
| Value-to-Income Ratio | Without Mortgage | With Mortgage |
| Less than 2.0x | 393 (55.8%) | 0 (0.0%) |
| 2.0x to 2.9x | 110 (15.6%) | 40 (100.0%) |
| 3.0x to 3.9x | 14 (2.0%) | 0 (0.0%) |
| 4.0x or more | 141 (20.0%) | 0 (0.0%) |
| Total | 704 (100.0%) | 40 (100.0%) |
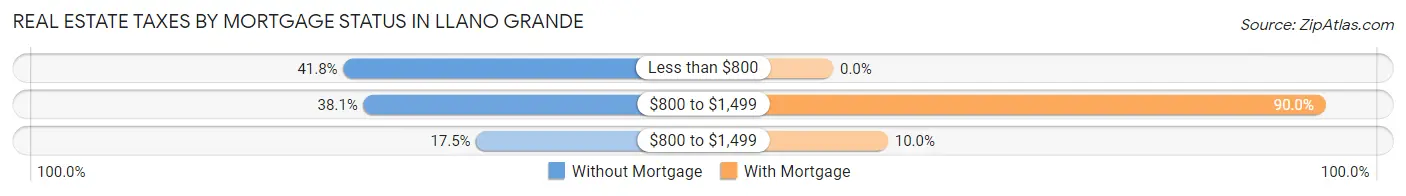
Real Estate Taxes by Mortgage Status in Llano Grande
| Property Taxes | Without Mortgage | With Mortgage |
| Less than $800 | 294 (41.8%) | 0 (0.0%) |
| $800 to $1,499 | 268 (38.1%) | 36 (90.0%) |
| $800 to $1,499 | 123 (17.5%) | 4 (10.0%) |
| Total | 704 (100.0%) | 40 (100.0%) |
Health & Disability in Llano Grande
Health Insurance Coverage by Age in Llano Grande
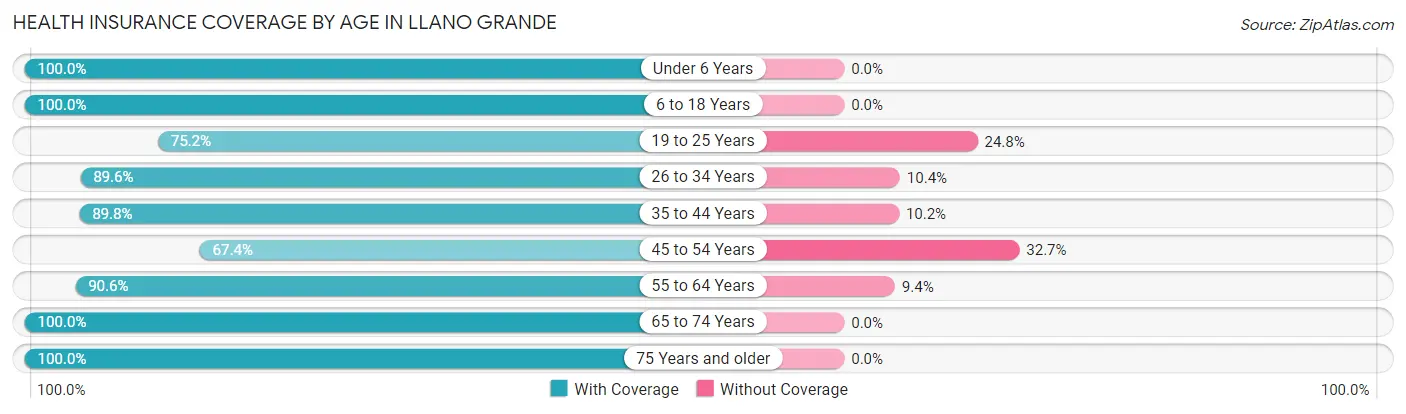
| Age Bracket | With Coverage | Without Coverage |
| Under 6 Years | 178 (100.0%) | 0 (0.0%) |
| 6 to 18 Years | 194 (100.0%) | 0 (0.0%) |
| 19 to 25 Years | 118 (75.2%) | 39 (24.8%) |
| 26 to 34 Years | 147 (89.6%) | 17 (10.4%) |
| 35 to 44 Years | 185 (89.8%) | 21 (10.2%) |
| 45 to 54 Years | 198 (67.3%) | 96 (32.7%) |
| 55 to 64 Years | 211 (90.6%) | 22 (9.4%) |
| 65 to 74 Years | 293 (100.0%) | 0 (0.0%) |
| 75 Years and older | 346 (100.0%) | 0 (0.0%) |
| Total | 1,870 (90.6%) | 195 (9.4%) |
Health Insurance Coverage by Citizenship Status in Llano Grande

| Citizenship Status | With Coverage | Without Coverage |
| Native Born | 178 (100.0%) | 0 (0.0%) |
| Foreign Born, Citizen | 194 (100.0%) | 0 (0.0%) |
| Foreign Born, not a Citizen | 118 (75.2%) | 39 (24.8%) |
Health Insurance Coverage by Household Income in Llano Grande
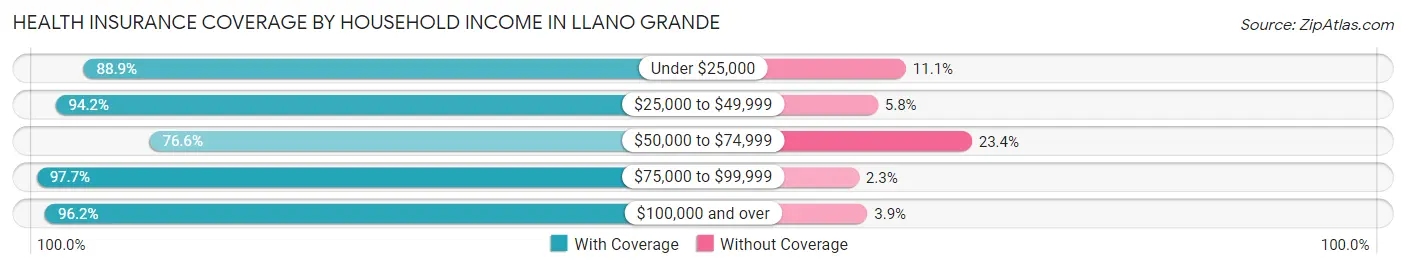
| Household Income | With Coverage | Without Coverage |
| Under $25,000 | 538 (88.9%) | 67 (11.1%) |
| $25,000 to $49,999 | 275 (94.2%) | 17 (5.8%) |
| $50,000 to $74,999 | 291 (76.6%) | 89 (23.4%) |
| $75,000 to $99,999 | 516 (97.7%) | 12 (2.3%) |
| $100,000 and over | 250 (96.2%) | 10 (3.8%) |
Public vs Private Health Insurance Coverage by Age in Llano Grande
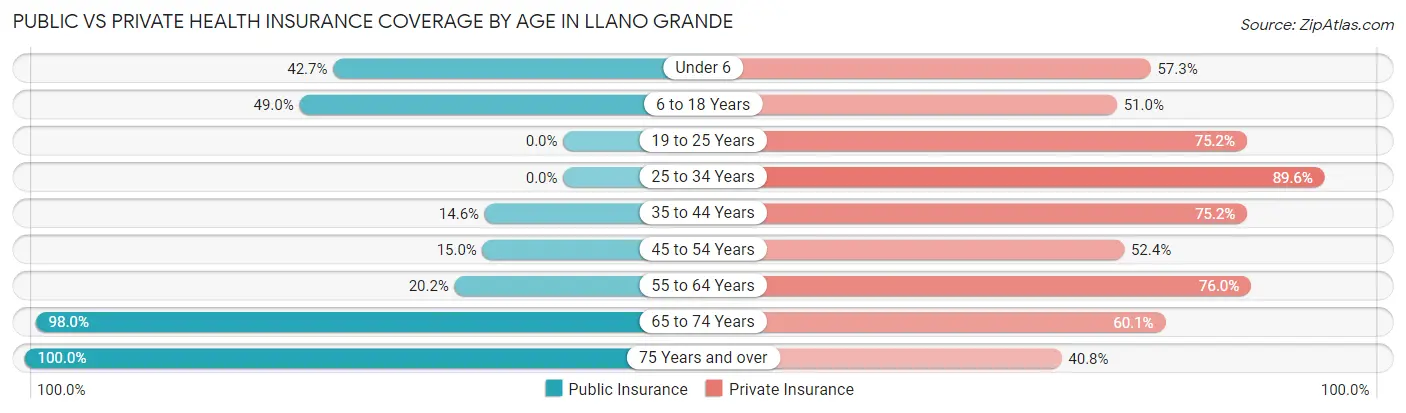
| Age Bracket | Public Insurance | Private Insurance |
| Under 6 | 76 (42.7%) | 102 (57.3%) |
| 6 to 18 Years | 95 (49.0%) | 99 (51.0%) |
| 19 to 25 Years | 0 (0.0%) | 118 (75.2%) |
| 25 to 34 Years | 0 (0.0%) | 147 (89.6%) |
| 35 to 44 Years | 30 (14.6%) | 155 (75.2%) |
| 45 to 54 Years | 44 (15.0%) | 154 (52.4%) |
| 55 to 64 Years | 47 (20.2%) | 177 (76.0%) |
| 65 to 74 Years | 287 (98.0%) | 176 (60.1%) |
| 75 Years and over | 346 (100.0%) | 141 (40.7%) |
| Total | 925 (44.8%) | 1,269 (61.5%) |
Disability Status by Sex by Age in Llano Grande
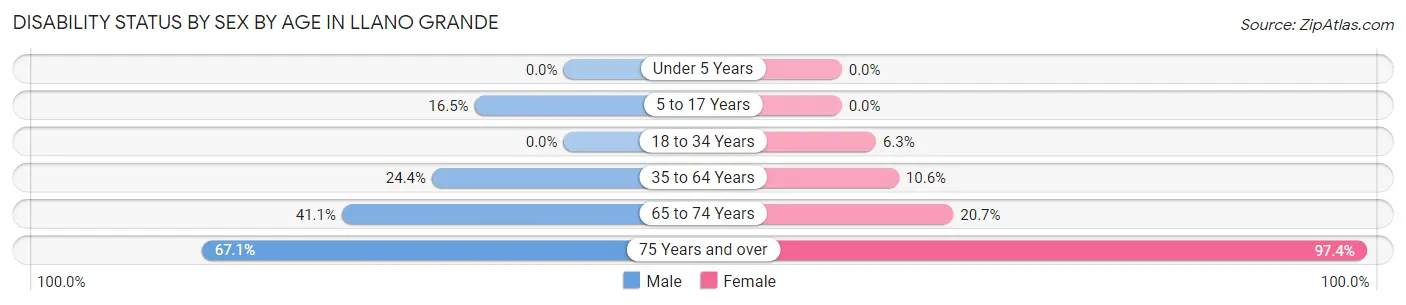
| Age Bracket | Male | Female |
| Under 5 Years | 0 (0.0%) | 0 (0.0%) |
| 5 to 17 Years | 35 (16.5%) | 0 (0.0%) |
| 18 to 34 Years | 0 (0.0%) | 13 (6.3%) |
| 35 to 64 Years | 73 (24.4%) | 46 (10.6%) |
| 65 to 74 Years | 51 (41.1%) | 35 (20.7%) |
| 75 Years and over | 102 (67.1%) | 189 (97.4%) |
Disability Class by Sex by Age in Llano Grande
Disability Class: Hearing Difficulty
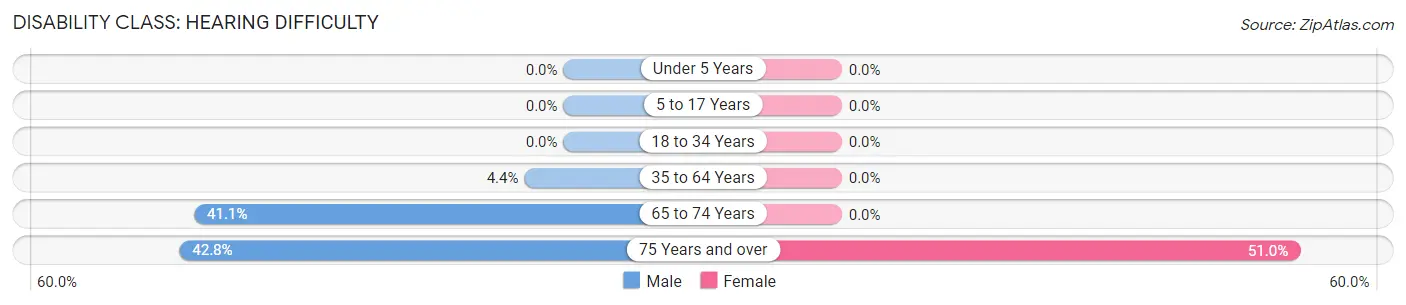
| Age Bracket | Male | Female |
| Under 5 Years | 0 (0.0%) | 0 (0.0%) |
| 5 to 17 Years | 0 (0.0%) | 0 (0.0%) |
| 18 to 34 Years | 0 (0.0%) | 0 (0.0%) |
| 35 to 64 Years | 13 (4.3%) | 0 (0.0%) |
| 65 to 74 Years | 51 (41.1%) | 0 (0.0%) |
| 75 Years and over | 65 (42.8%) | 99 (51.0%) |
Disability Class: Vision Difficulty
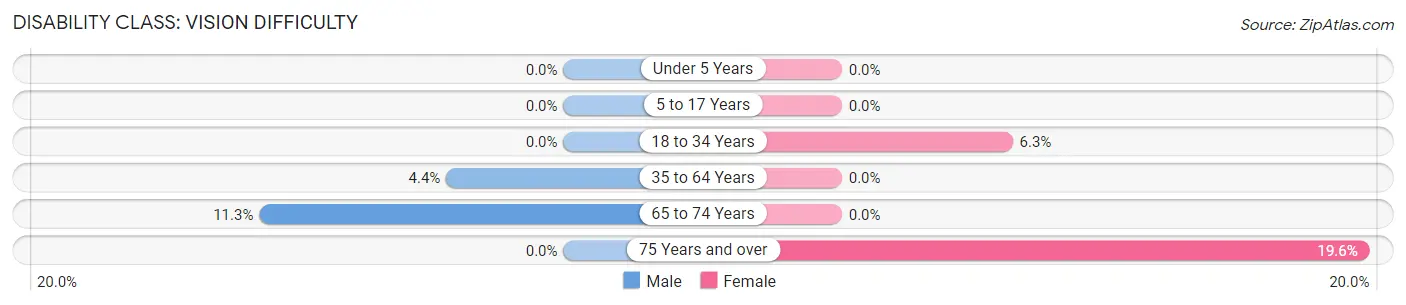
| Age Bracket | Male | Female |
| Under 5 Years | 0 (0.0%) | 0 (0.0%) |
| 5 to 17 Years | 0 (0.0%) | 0 (0.0%) |
| 18 to 34 Years | 0 (0.0%) | 13 (6.3%) |
| 35 to 64 Years | 13 (4.3%) | 0 (0.0%) |
| 65 to 74 Years | 14 (11.3%) | 0 (0.0%) |
| 75 Years and over | 0 (0.0%) | 38 (19.6%) |
Disability Class: Cognitive Difficulty
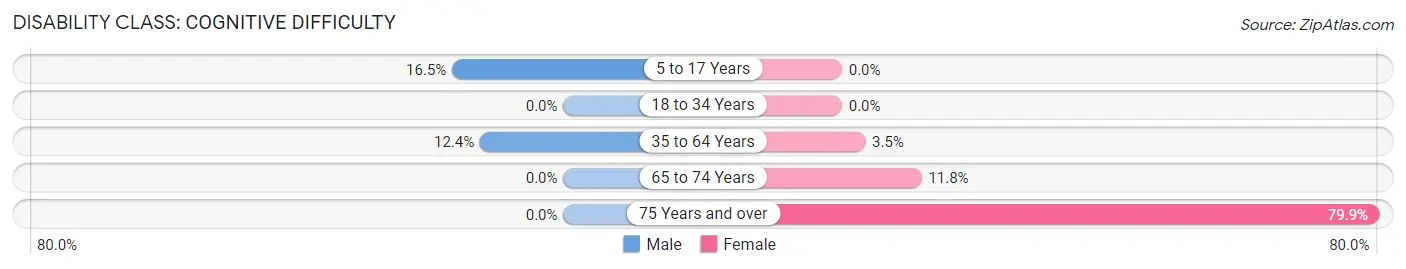
| Age Bracket | Male | Female |
| 5 to 17 Years | 35 (16.5%) | 0 (0.0%) |
| 18 to 34 Years | 0 (0.0%) | 0 (0.0%) |
| 35 to 64 Years | 37 (12.4%) | 15 (3.5%) |
| 65 to 74 Years | 0 (0.0%) | 20 (11.8%) |
| 75 Years and over | 0 (0.0%) | 155 (79.9%) |
Disability Class: Ambulatory Difficulty
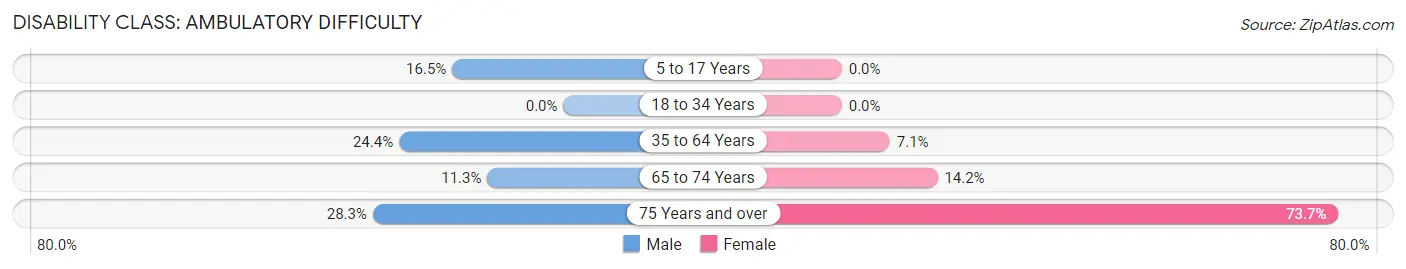
| Age Bracket | Male | Female |
| 5 to 17 Years | 35 (16.5%) | 0 (0.0%) |
| 18 to 34 Years | 0 (0.0%) | 0 (0.0%) |
| 35 to 64 Years | 73 (24.4%) | 31 (7.1%) |
| 65 to 74 Years | 14 (11.3%) | 24 (14.2%) |
| 75 Years and over | 43 (28.3%) | 143 (73.7%) |
Disability Class: Self-Care Difficulty
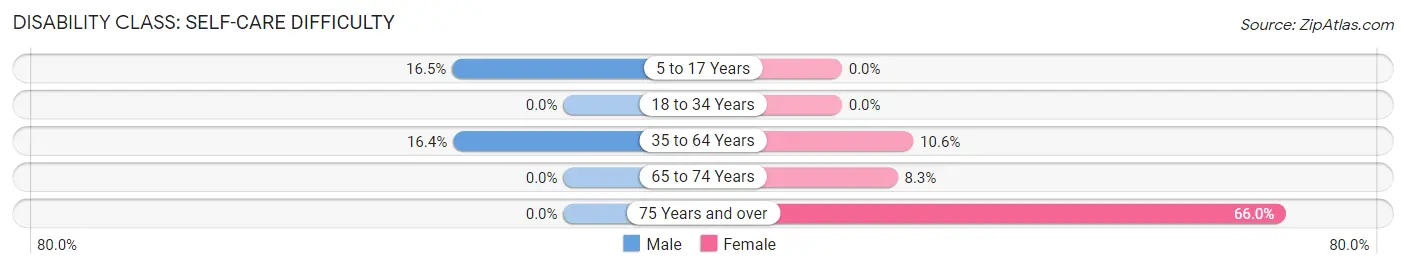
| Age Bracket | Male | Female |
| 5 to 17 Years | 35 (16.5%) | 0 (0.0%) |
| 18 to 34 Years | 0 (0.0%) | 0 (0.0%) |
| 35 to 64 Years | 49 (16.4%) | 46 (10.6%) |
| 65 to 74 Years | 0 (0.0%) | 14 (8.3%) |
| 75 Years and over | 0 (0.0%) | 128 (66.0%) |
Technology Access in Llano Grande
Computing Device Access in Llano Grande
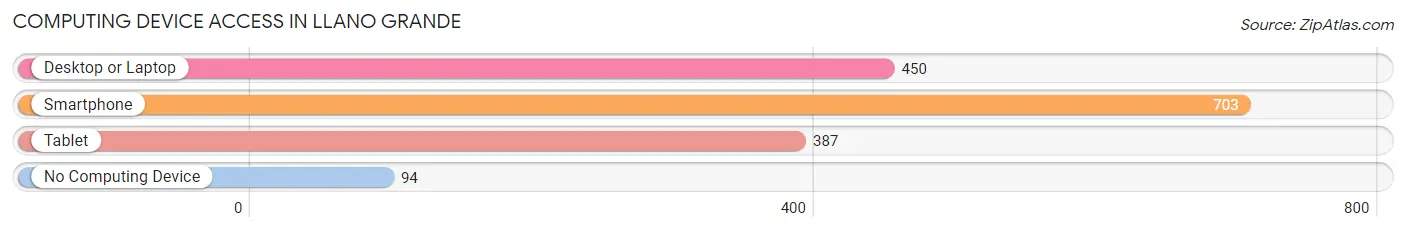
| Device Type | # Households | % Households |
| Desktop or Laptop | 450 | 53.6% |
| Smartphone | 703 | 83.8% |
| Tablet | 387 | 46.1% |
| No Computing Device | 94 | 11.2% |
| Total | 839 | 100.0% |
Internet Access in Llano Grande
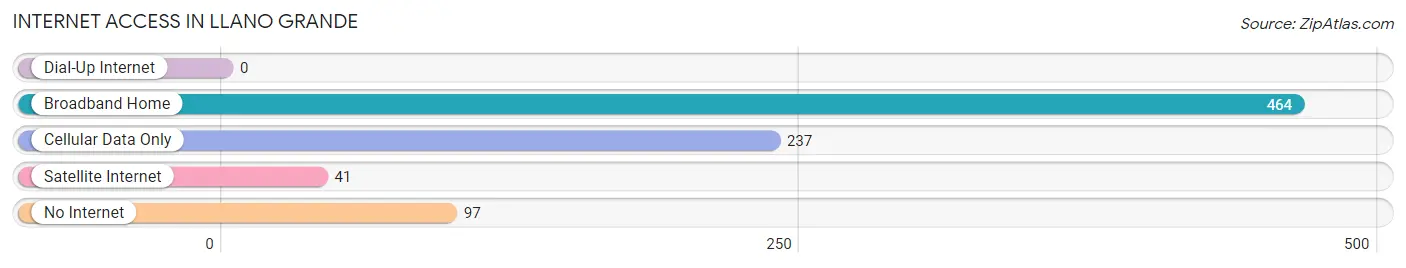
| Internet Type | # Households | % Households |
| Dial-Up Internet | 0 | 0.0% |
| Broadband Home | 464 | 55.3% |
| Cellular Data Only | 237 | 28.2% |
| Satellite Internet | 41 | 4.9% |
| No Internet | 97 | 11.6% |
| Total | 839 | 100.0% |
Llano Grande Summary
Llano Grande is a small unincorporated community located in Hidalgo County, Texas. It is situated about 10 miles south of the city of Edinburg and about 20 miles west of the city of McAllen. The population of Llano Grande was estimated to be around 1,000 people in 2020.
History
Llano Grande was founded in the late 19th century by Mexican immigrants who were looking for a place to settle and start a new life. The area was originally known as El Llano Grande, which translates to “The Big Plain” in English. The name was chosen because of the vast open plains that surrounded the area.
The first settlers of Llano Grande were mostly farmers and ranchers who were looking to make a living off the land. They grew crops such as corn, beans, and cotton, and raised livestock such as cattle and horses. The area was also known for its abundance of wild game, which provided the settlers with a steady source of food.
In the early 20th century, Llano Grande began to grow and develop. The town was incorporated in 1915 and the first post office was established in 1916. The town also had a school, a church, and a general store.
Geography
Llano Grande is located in the Rio Grande Valley of South Texas. The area is characterized by flat plains and rolling hills. The climate is subtropical, with hot summers and mild winters. The average annual temperature is around 75 degrees Fahrenheit.
The area is known for its fertile soil, which is ideal for growing crops such as corn, beans, and cotton. The area is also known for its abundance of wildlife, including deer, javelina, and wild turkeys.
Economy
The economy of Llano Grande is largely based on agriculture. The area is known for its production of corn, beans, and cotton. The area is also known for its production of livestock, such as cattle and horses.
In recent years, the economy of Llano Grande has diversified. The area is now home to several businesses, including restaurants, retail stores, and auto repair shops. The area is also home to several manufacturing plants, which produce a variety of products such as furniture, clothing, and electronics.
Demographics
As of 2020, the population of Llano Grande was estimated to be around 1,000 people. The majority of the population is of Hispanic or Latino descent. The median household income is around $30,000 per year. The median age is around 30 years old.
The area is served by the Edinburg Consolidated Independent School District. The area is also home to several churches, including the First Baptist Church of Llano Grande and the Iglesia Bautista de Llano Grande.
Conclusion
Llano Grande is a small unincorporated community located in Hidalgo County, Texas. It was founded in the late 19th century by Mexican immigrants who were looking for a place to settle and start a new life. The area is characterized by flat plains and rolling hills, and the climate is subtropical. The economy of Llano Grande is largely based on agriculture, and the area is also home to several businesses. The population of Llano Grande was estimated to be around 1,000 people in 2020.
Common Questions
What is Per Capita Income in Llano Grande?
Per Capita income in Llano Grande is $19,507.
What is the Median Family Income in Llano Grande?
Median Family Income in Llano Grande is $58,656.
What is the Median Household income in Llano Grande?
Median Household Income in Llano Grande is $36,615.
What is Income or Wage Gap in Llano Grande?
Income or Wage Gap in Llano Grande is 55.9%.
Women in Llano Grande earn 44.1 cents for every dollar earned by a man.
What is Family Income Deficit in Llano Grande?
Family Income Deficit in Llano Grande is $8,711.
Families that are below poverty line in Llano Grande earn $8,711 less on average than the poverty threshold level.
What is Inequality or Gini Index in Llano Grande?
Inequality or Gini Index in Llano Grande is 0.39.
What is the Total Population of Llano Grande?
Total Population of Llano Grande is 2,065.
What is the Total Male Population of Llano Grande?
Total Male Population of Llano Grande is 987.
What is the Total Female Population of Llano Grande?
Total Female Population of Llano Grande is 1,078.
What is the Ratio of Males per 100 Females in Llano Grande?
There are 91.56 Males per 100 Females in Llano Grande.
What is the Ratio of Females per 100 Males in Llano Grande?
There are 109.22 Females per 100 Males in Llano Grande.
What is the Median Population Age in Llano Grande?
Median Population Age in Llano Grande is 49.5 Years.
What is the Average Family Size in Llano Grande
Average Family Size in Llano Grande is 3.1 People.
What is the Average Household Size in Llano Grande
Average Household Size in Llano Grande is 2.5 People.
How Large is the Labor Force in Llano Grande?
There are 797 People in the Labor Forcein in Llano Grande.
What is the Percentage of People in the Labor Force in Llano Grande?
47.1% of People are in the Labor Force in Llano Grande.
What is the Unemployment Rate in Llano Grande?
Unemployment Rate in Llano Grande is 11.2%.