Lakeport, TX Map & Demographics
Lakeport Map
Lakeport Overview
$23,755
PER CAPITA INCOME
$57,708
AVG FAMILY INCOME
$61,607
AVG HOUSEHOLD INCOME
6.1%
WAGE / INCOME GAP [ % ]
93.9¢/ $1
WAGE / INCOME GAP [ $ ]
0.39
INEQUALITY / GINI INDEX
1,097
TOTAL POPULATION
552
MALE POPULATION
545
FEMALE POPULATION
101.28
MALES / 100 FEMALES
98.73
FEMALES / 100 MALES
30.1
MEDIAN AGE
3.3
AVG FAMILY SIZE
2.9
AVG HOUSEHOLD SIZE
494
LABOR FORCE [ PEOPLE ]
64.5%
PERCENT IN LABOR FORCE
2.4%
UNEMPLOYMENT RATE
Income in Lakeport
Income Overview in Lakeport
Per Capita Income in Lakeport is $23,755, while median incomes of families and households are $57,708 and $61,607 respectively.
| Characteristic | Number | Measure |
| Per Capita Income | 1,097 | $23,755 |
| Median Family Income | 289 | $57,708 |
| Mean Family Income | 289 | $68,003 |
| Median Household Income | 374 | $61,607 |
| Mean Household Income | 374 | $69,747 |
| Income Deficit | 289 | $0 |
| Wage / Income Gap (%) | 1,097 | 6.08% |
| Wage / Income Gap ($) | 1,097 | 93.92¢ per $1 |
| Gini / Inequality Index | 1,097 | 0.39 |
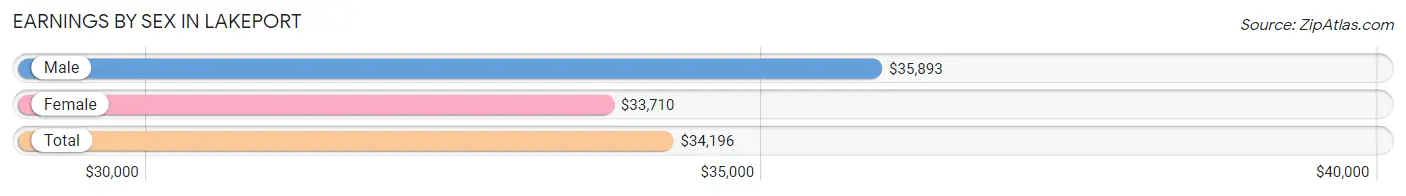
Earnings by Sex in Lakeport
Average Earnings in Lakeport are $34,196, $35,893 for men and $33,710 for women, a difference of 6.1%.
| Sex | Number | Average Earnings |
| Male | 275 (51.4%) | $35,893 |
| Female | 260 (48.6%) | $33,710 |
| Total | 535 (100.0%) | $34,196 |
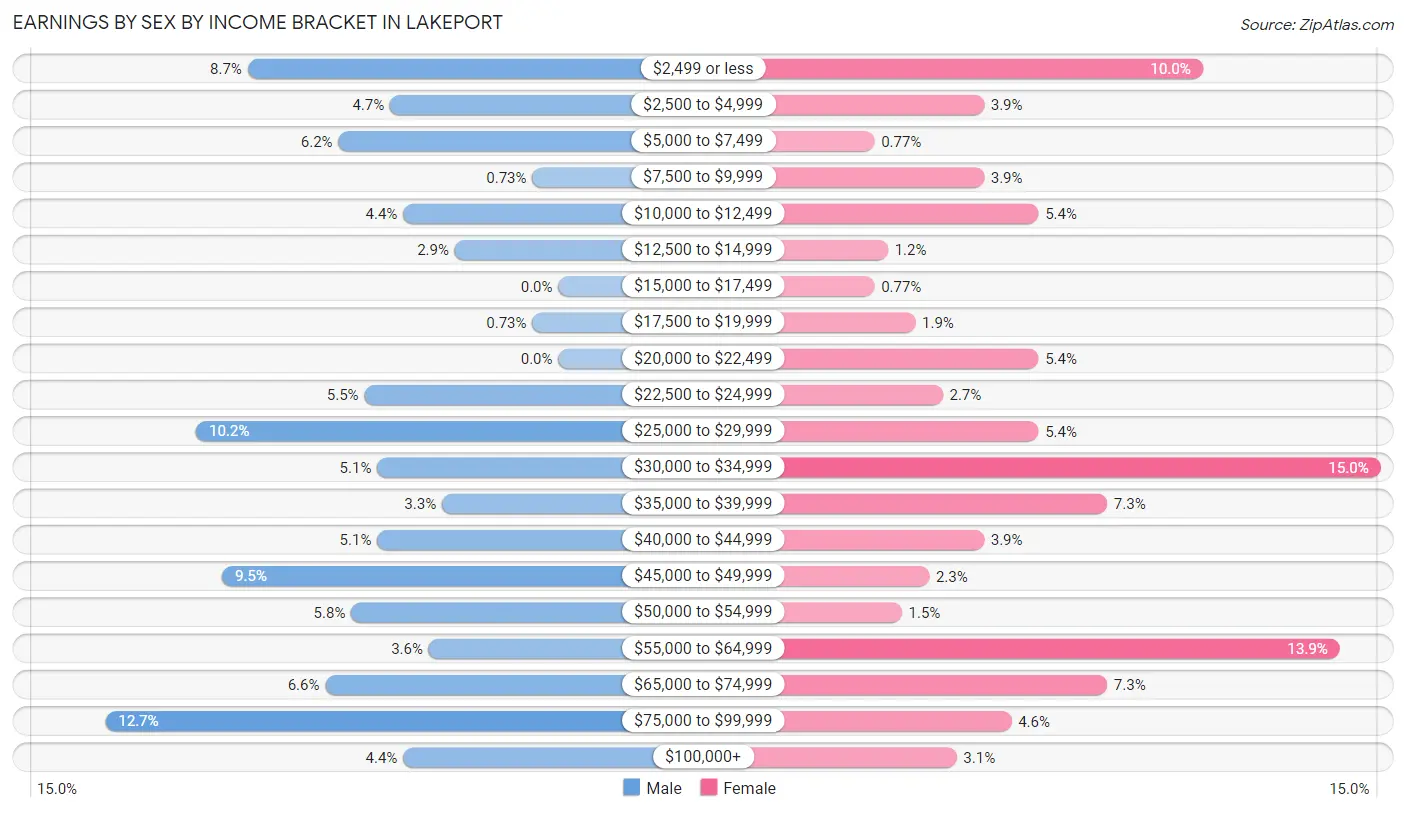
Earnings by Sex by Income Bracket in Lakeport
The most common earnings brackets in Lakeport are $75,000 to $99,999 for men (35 | 12.7%) and $30,000 to $34,999 for women (39 | 15.0%).
| Income | Male | Female |
| $2,499 or less | 24 (8.7%) | 26 (10.0%) |
| $2,500 to $4,999 | 13 (4.7%) | 10 (3.8%) |
| $5,000 to $7,499 | 17 (6.2%) | 2 (0.8%) |
| $7,500 to $9,999 | 2 (0.7%) | 10 (3.8%) |
| $10,000 to $12,499 | 12 (4.4%) | 14 (5.4%) |
| $12,500 to $14,999 | 8 (2.9%) | 3 (1.1%) |
| $15,000 to $17,499 | 0 (0.0%) | 2 (0.8%) |
| $17,500 to $19,999 | 2 (0.7%) | 5 (1.9%) |
| $20,000 to $22,499 | 0 (0.0%) | 14 (5.4%) |
| $22,500 to $24,999 | 15 (5.4%) | 7 (2.7%) |
| $25,000 to $29,999 | 28 (10.2%) | 14 (5.4%) |
| $30,000 to $34,999 | 14 (5.1%) | 39 (15.0%) |
| $35,000 to $39,999 | 9 (3.3%) | 19 (7.3%) |
| $40,000 to $44,999 | 14 (5.1%) | 10 (3.8%) |
| $45,000 to $49,999 | 26 (9.5%) | 6 (2.3%) |
| $50,000 to $54,999 | 16 (5.8%) | 4 (1.5%) |
| $55,000 to $64,999 | 10 (3.6%) | 36 (13.9%) |
| $65,000 to $74,999 | 18 (6.6%) | 19 (7.3%) |
| $75,000 to $99,999 | 35 (12.7%) | 12 (4.6%) |
| $100,000+ | 12 (4.4%) | 8 (3.1%) |
| Total | 275 (100.0%) | 260 (100.0%) |
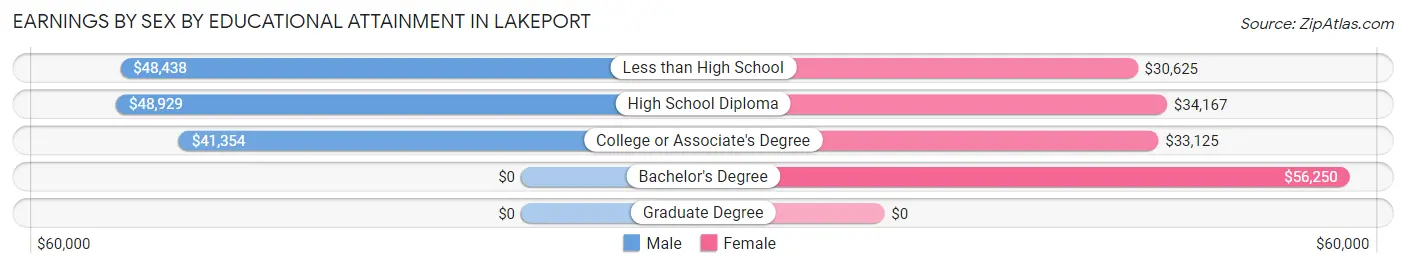
Earnings by Sex by Educational Attainment in Lakeport
Average earnings in Lakeport are $48,466 for men and $34,556 for women, a difference of 28.7%. Men with an educational attainment of high school diploma enjoy the highest average annual earnings of $48,929, while those with college or associate's degree education earn the least with $41,354. Women with an educational attainment of bachelor's degree earn the most with the average annual earnings of $56,250, while those with less than high school education have the smallest earnings of $30,625.
| Educational Attainment | Male Income | Female Income |
| Less than High School | $48,438 | $30,625 |
| High School Diploma | $48,929 | $34,167 |
| College or Associate's Degree | $41,354 | $33,125 |
| Bachelor's Degree | - | - |
| Graduate Degree | - | - |
| Total | $48,466 | $34,556 |
Family Income in Lakeport
Family Income Brackets in Lakeport
According to the Lakeport family income data, there are 49 families falling into the $50,000 to $74,999 income range, which is the most common income bracket and makes up 17.0% of all families.
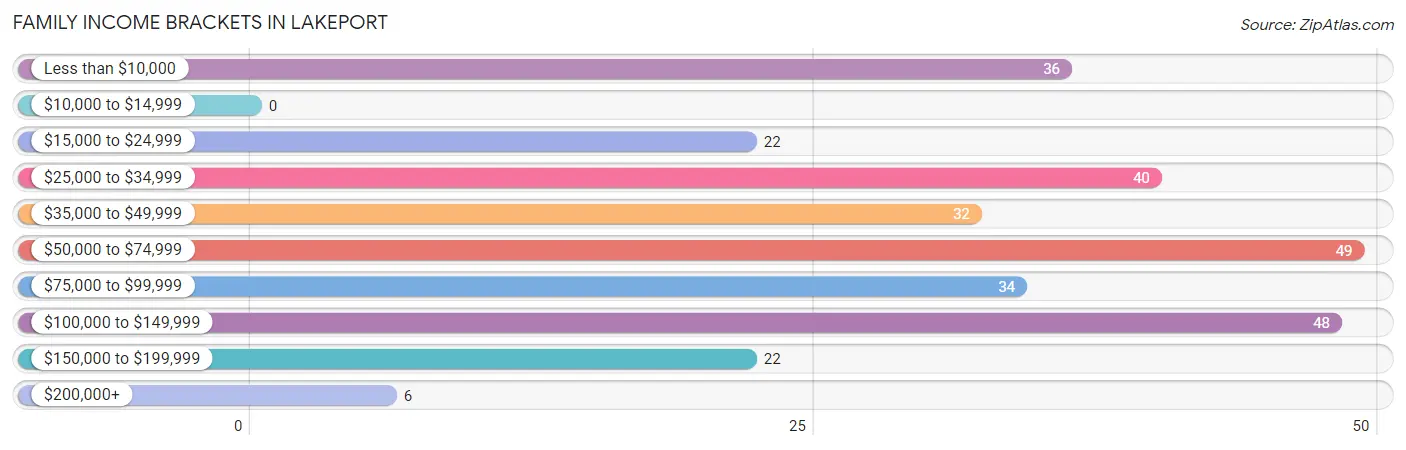
| Income Bracket | # Families | % Families |
| Less than $10,000 | 36 | 12.5% |
| $10,000 to $14,999 | 0 | 0.0% |
| $15,000 to $24,999 | 22 | 7.6% |
| $25,000 to $34,999 | 40 | 13.8% |
| $35,000 to $49,999 | 32 | 11.1% |
| $50,000 to $74,999 | 49 | 17.0% |
| $75,000 to $99,999 | 34 | 11.8% |
| $100,000 to $149,999 | 48 | 16.6% |
| $150,000 to $199,999 | 22 | 7.6% |
| $200,000+ | 6 | 2.1% |
Family Income by Famaliy Size in Lakeport
3-person families (44 | 15.2%) account for the highest median family income in Lakeport with $78,333 per family, while 3-person families (44 | 15.2%) have the highest median income of $26,111 per family member.
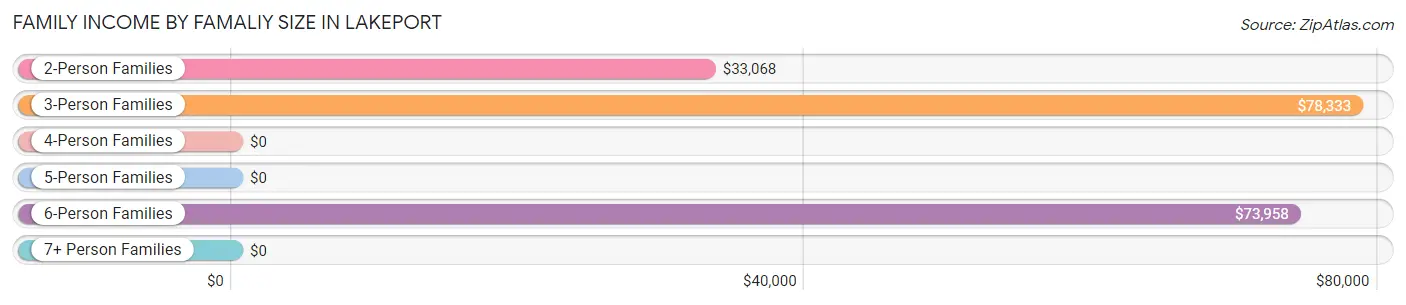
| Income Bracket | # Families | Median Income |
| 2-Person Families | 127 (43.9%) | $33,068 |
| 3-Person Families | 44 (15.2%) | $78,333 |
| 4-Person Families | 69 (23.9%) | $0 |
| 5-Person Families | 34 (11.8%) | $0 |
| 6-Person Families | 15 (5.2%) | $73,958 |
| 7+ Person Families | 0 (0.0%) | $0 |
| Total | 289 (100.0%) | $57,708 |
Family Income by Number of Earners in Lakeport
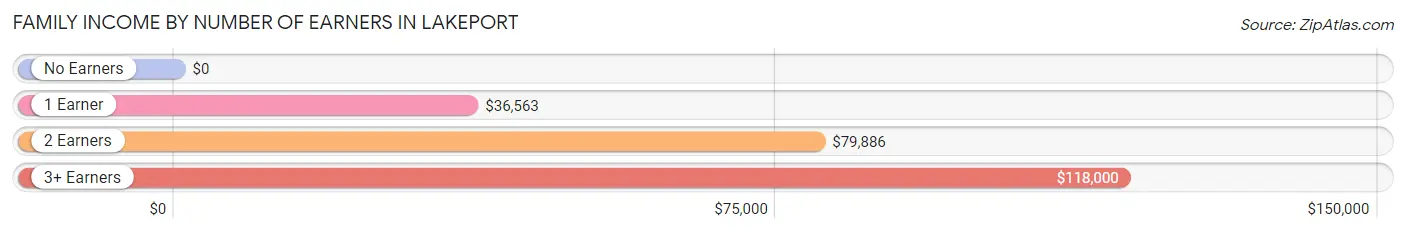
| Number of Earners | # Families | Median Income |
| No Earners | 58 (20.1%) | $0 |
| 1 Earner | 102 (35.3%) | $36,563 |
| 2 Earners | 91 (31.5%) | $79,886 |
| 3+ Earners | 38 (13.2%) | $118,000 |
| Total | 289 (100.0%) | $57,708 |
Household Income in Lakeport
Household Income Brackets in Lakeport
With 72 households falling in the category, the $50,000 to $74,999 income range is the most frequent in Lakeport, accounting for 19.3% of all households. In contrast, only 8 households (2.1%) fall into the $10,000 to $14,999 income bracket, making it the least populous group.
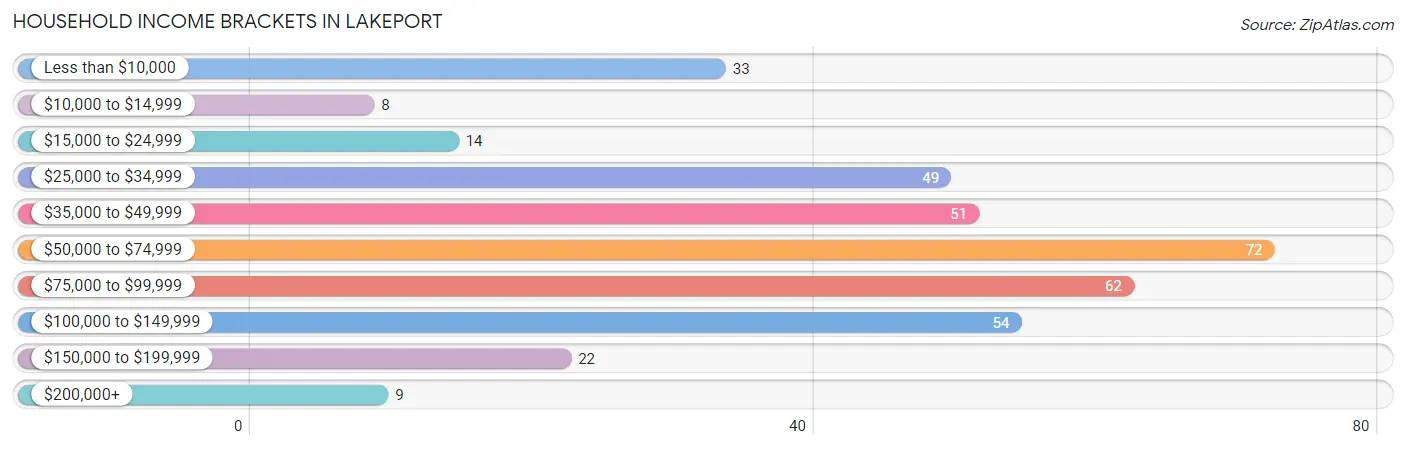
| Income Bracket | # Households | % Households |
| Less than $10,000 | 33 | 8.8% |
| $10,000 to $14,999 | 8 | 2.1% |
| $15,000 to $24,999 | 14 | 3.7% |
| $25,000 to $34,999 | 49 | 13.1% |
| $35,000 to $49,999 | 51 | 13.6% |
| $50,000 to $74,999 | 72 | 19.3% |
| $75,000 to $99,999 | 62 | 16.6% |
| $100,000 to $149,999 | 54 | 14.4% |
| $150,000 to $199,999 | 22 | 5.9% |
| $200,000+ | 9 | 2.4% |
Household Income by Householder Age in Lakeport
The median household income in Lakeport is $61,607, with the highest median household income of $74,063 found in the 25 to 44 years age bracket for the primary householder. A total of 138 households (36.9%) fall into this category. Meanwhile, the 15 to 24 years age bracket for the primary householder has the lowest median household income of $0, with 6 households (1.6%) in this group.
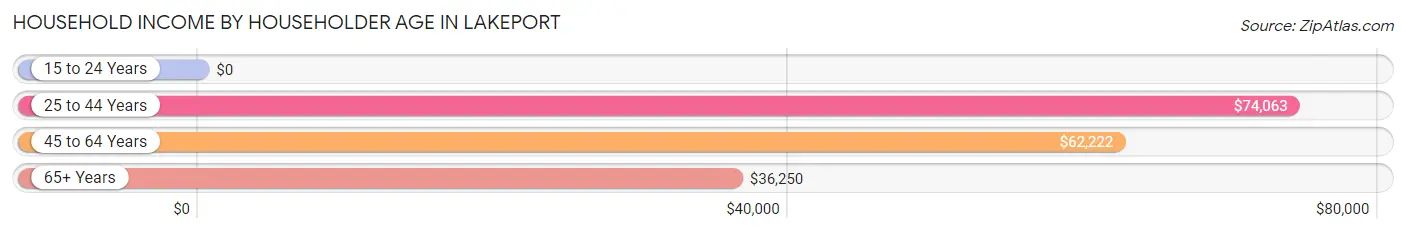
| Income Bracket | # Households | Median Income |
| 15 to 24 Years | 6 (1.6%) | $0 |
| 25 to 44 Years | 138 (36.9%) | $74,063 |
| 45 to 64 Years | 160 (42.8%) | $62,222 |
| 65+ Years | 70 (18.7%) | $36,250 |
| Total | 374 (100.0%) | $61,607 |
Poverty in Lakeport
Income Below Poverty by Sex and Age in Lakeport
With 14.5% poverty level for males and 18.9% for females among the residents of Lakeport, 18 to 24 year old males and 16 and 17 year old females are the most vulnerable to poverty, with 16 males (41.0%) and 12 females (85.7%) in their respective age groups living below the poverty level.
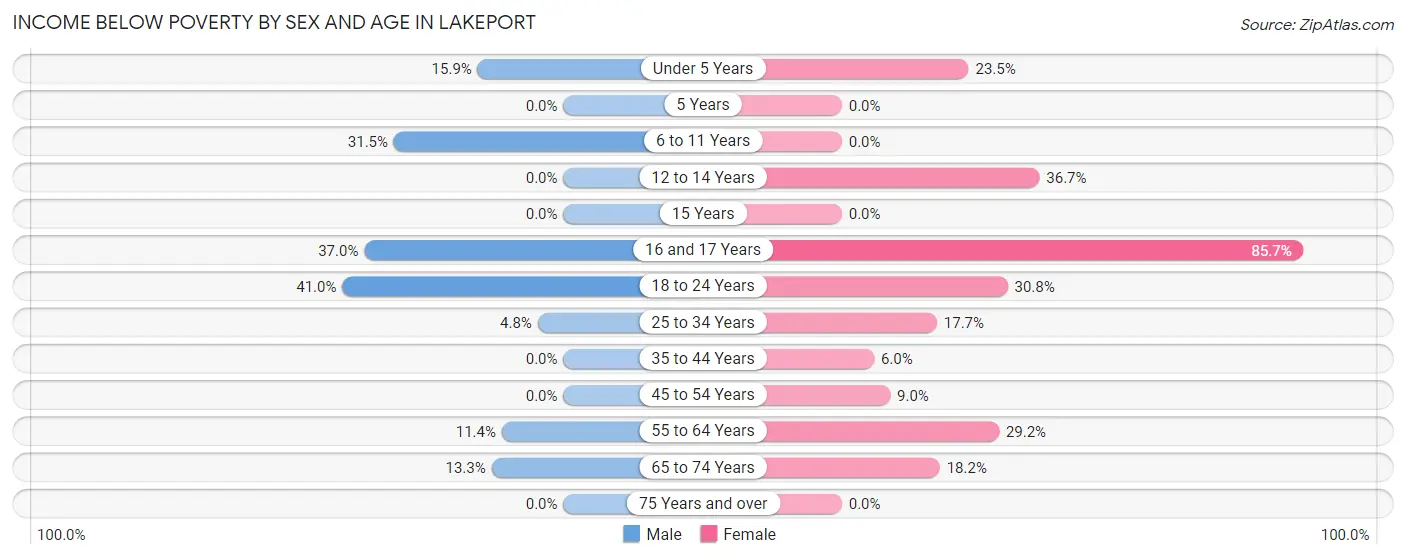
| Age Bracket | Male | Female |
| Under 5 Years | 7 (15.9%) | 16 (23.5%) |
| 5 Years | 0 (0.0%) | 0 (0.0%) |
| 6 to 11 Years | 28 (31.5%) | 0 (0.0%) |
| 12 to 14 Years | 0 (0.0%) | 11 (36.7%) |
| 15 Years | 0 (0.0%) | 0 (0.0%) |
| 16 and 17 Years | 17 (37.0%) | 12 (85.7%) |
| 18 to 24 Years | 16 (41.0%) | 12 (30.8%) |
| 25 to 34 Years | 4 (4.8%) | 12 (17.6%) |
| 35 to 44 Years | 0 (0.0%) | 4 (6.0%) |
| 45 to 54 Years | 0 (0.0%) | 7 (9.0%) |
| 55 to 64 Years | 4 (11.4%) | 21 (29.2%) |
| 65 to 74 Years | 4 (13.3%) | 8 (18.2%) |
| 75 Years and over | 0 (0.0%) | 0 (0.0%) |
| Total | 80 (14.5%) | 103 (18.9%) |
Income Above Poverty by Sex and Age in Lakeport
According to the poverty statistics in Lakeport, males aged 5 years and females aged 5 years are the age groups that are most secure financially, with 100.0% of males and 100.0% of females in these age groups living above the poverty line.
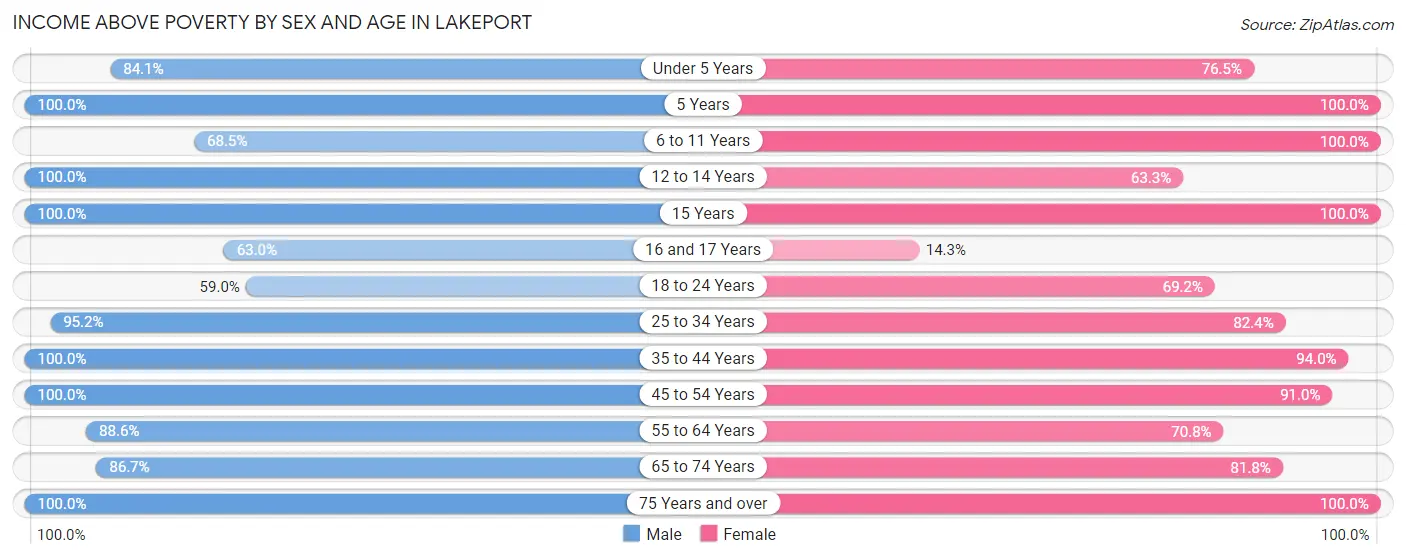
| Age Bracket | Male | Female |
| Under 5 Years | 37 (84.1%) | 52 (76.5%) |
| 5 Years | 2 (100.0%) | 4 (100.0%) |
| 6 to 11 Years | 61 (68.5%) | 21 (100.0%) |
| 12 to 14 Years | 44 (100.0%) | 19 (63.3%) |
| 15 Years | 11 (100.0%) | 18 (100.0%) |
| 16 and 17 Years | 29 (63.0%) | 2 (14.3%) |
| 18 to 24 Years | 23 (59.0%) | 27 (69.2%) |
| 25 to 34 Years | 80 (95.2%) | 56 (82.4%) |
| 35 to 44 Years | 63 (100.0%) | 63 (94.0%) |
| 45 to 54 Years | 48 (100.0%) | 71 (91.0%) |
| 55 to 64 Years | 31 (88.6%) | 51 (70.8%) |
| 65 to 74 Years | 26 (86.7%) | 36 (81.8%) |
| 75 Years and over | 17 (100.0%) | 22 (100.0%) |
| Total | 472 (85.5%) | 442 (81.1%) |
Income Below Poverty Among Married-Couple Families in Lakeport
The poverty statistics for married-couple families in Lakeport show that 1.3% or 2 of the total 152 families live below the poverty line. Families with no children have the highest poverty rate of 2.4%, comprising of 2 families. On the other hand, families with 1 or 2 children have the lowest poverty rate of 0.0%, which includes 0 families.
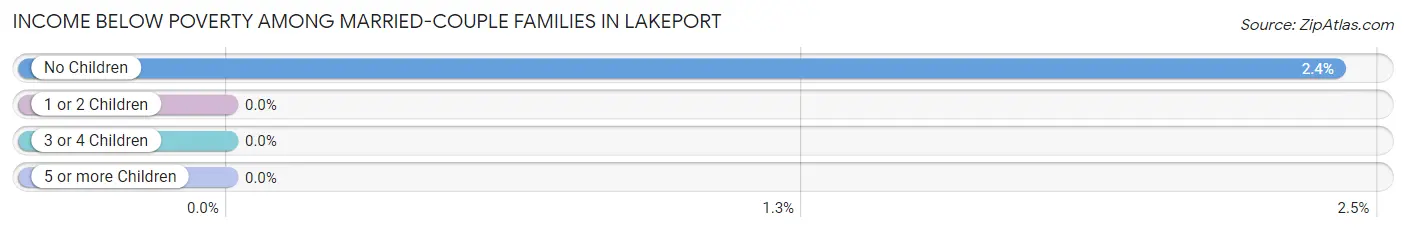
| Children | Above Poverty | Below Poverty |
| No Children | 81 (97.6%) | 2 (2.4%) |
| 1 or 2 Children | 56 (100.0%) | 0 (0.0%) |
| 3 or 4 Children | 13 (100.0%) | 0 (0.0%) |
| 5 or more Children | 0 (0.0%) | 0 (0.0%) |
| Total | 150 (98.7%) | 2 (1.3%) |
Income Below Poverty Among Single-Parent Households in Lakeport
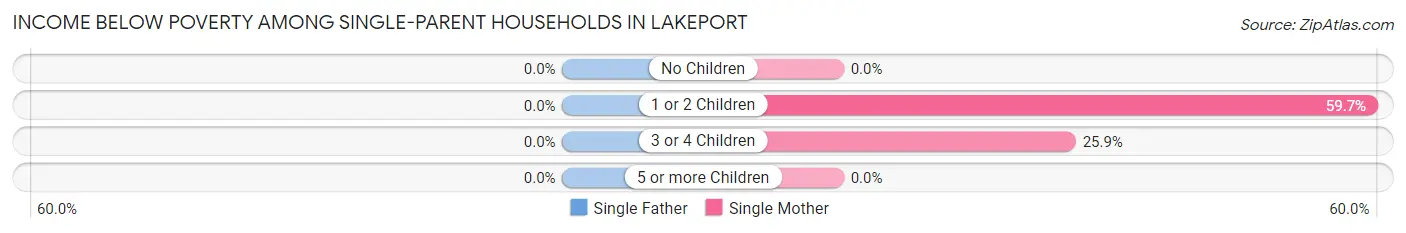
| Children | Single Father | Single Mother |
| No Children | 0 (0.0%) | 0 (0.0%) |
| 1 or 2 Children | 0 (0.0%) | 40 (59.7%) |
| 3 or 4 Children | 0 (0.0%) | 7 (25.9%) |
| 5 or more Children | 0 (0.0%) | 0 (0.0%) |
| Total | 0 (0.0%) | 47 (41.6%) |
Income Below Poverty Among Married-Couple vs Single-Parent Households in Lakeport
The poverty data for Lakeport shows that 2 of the married-couple family households (1.3%) and 47 of the single-parent households (34.3%) are living below the poverty level. Within the married-couple family households, those with no children have the highest poverty rate, with 2 households (2.4%) falling below the poverty line. Among the single-parent households, those with 1 or 2 children have the highest poverty rate, with 40 household (51.9%) living below poverty.
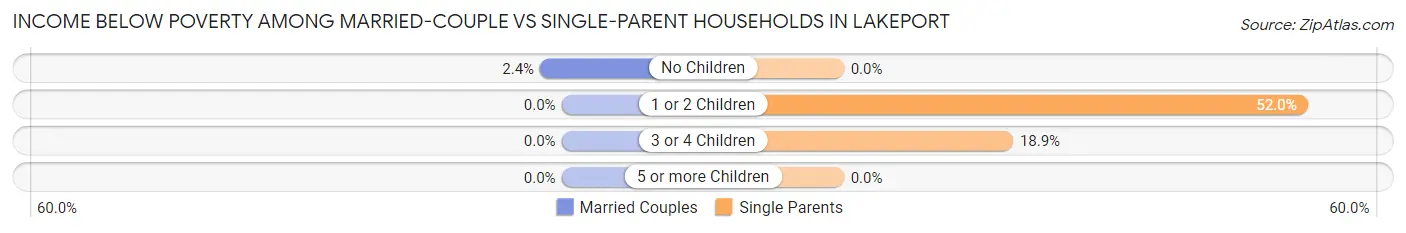
| Children | Married-Couple Families | Single-Parent Households |
| No Children | 2 (2.4%) | 0 (0.0%) |
| 1 or 2 Children | 0 (0.0%) | 40 (51.9%) |
| 3 or 4 Children | 0 (0.0%) | 7 (18.9%) |
| 5 or more Children | 0 (0.0%) | 0 (0.0%) |
| Total | 2 (1.3%) | 47 (34.3%) |
Race in Lakeport
The most populous races in Lakeport are Black / African American (620 | 56.5%), Hispanic or Latino (253 | 23.1%), and White / Caucasian (247 | 22.5%).
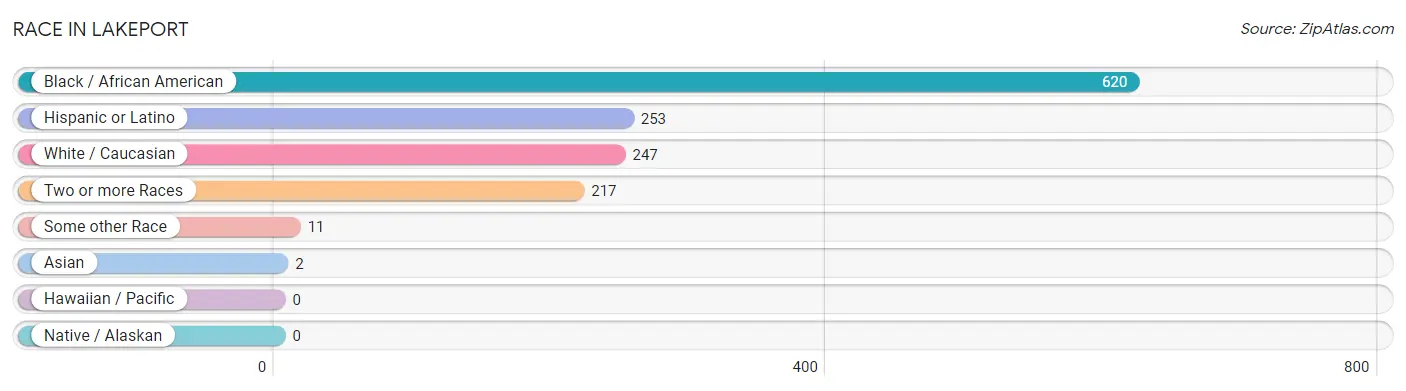
| Race | # Population | % Population |
| Asian | 2 | 0.2% |
| Black / African American | 620 | 56.5% |
| Hawaiian / Pacific | 0 | 0.0% |
| Hispanic or Latino | 253 | 23.1% |
| Native / Alaskan | 0 | 0.0% |
| White / Caucasian | 247 | 22.5% |
| Two or more Races | 217 | 19.8% |
| Some other Race | 11 | 1.0% |
| Total | 1,097 | 100.0% |
Ancestry in Lakeport
The most populous ancestries reported in Lakeport are Mexican (211 | 19.2%), American (69 | 6.3%), German (60 | 5.5%), Central American (42 | 3.8%), and Salvadoran (25 | 2.3%), together accounting for 37.1% of all Lakeport residents.
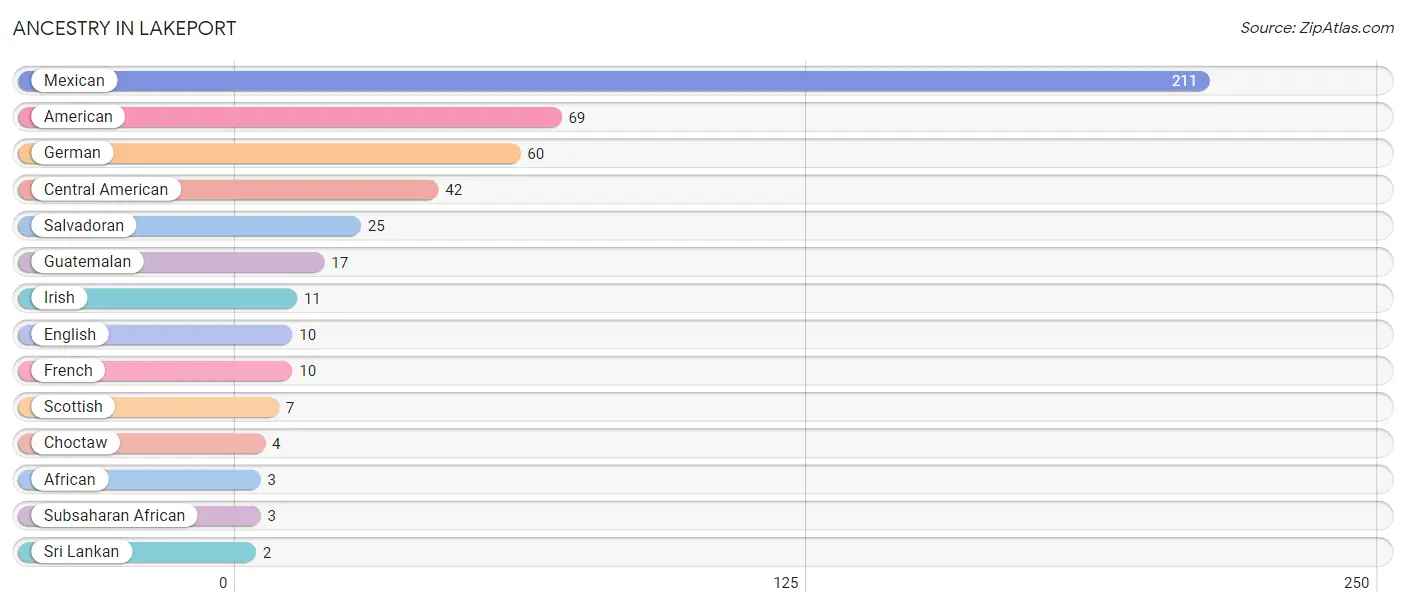
| Ancestry | # Population | % Population |
| African | 3 | 0.3% |
| American | 69 | 6.3% |
| Central American | 42 | 3.8% |
| Choctaw | 4 | 0.4% |
| English | 10 | 0.9% |
| French | 10 | 0.9% |
| German | 60 | 5.5% |
| Guatemalan | 17 | 1.5% |
| Irish | 11 | 1.0% |
| Mexican | 211 | 19.2% |
| Salvadoran | 25 | 2.3% |
| Scottish | 7 | 0.6% |
| Sri Lankan | 2 | 0.2% |
| Subsaharan African | 3 | 0.3% | View All 14 Rows |
Immigrants in Lakeport
The most numerous immigrant groups reported in Lakeport came from Central America (81 | 7.4%), Latin America (81 | 7.4%), Mexico (40 | 3.6%), El Salvador (25 | 2.3%), and Guatemala (16 | 1.5%), together accounting for 22.2% of all Lakeport residents.
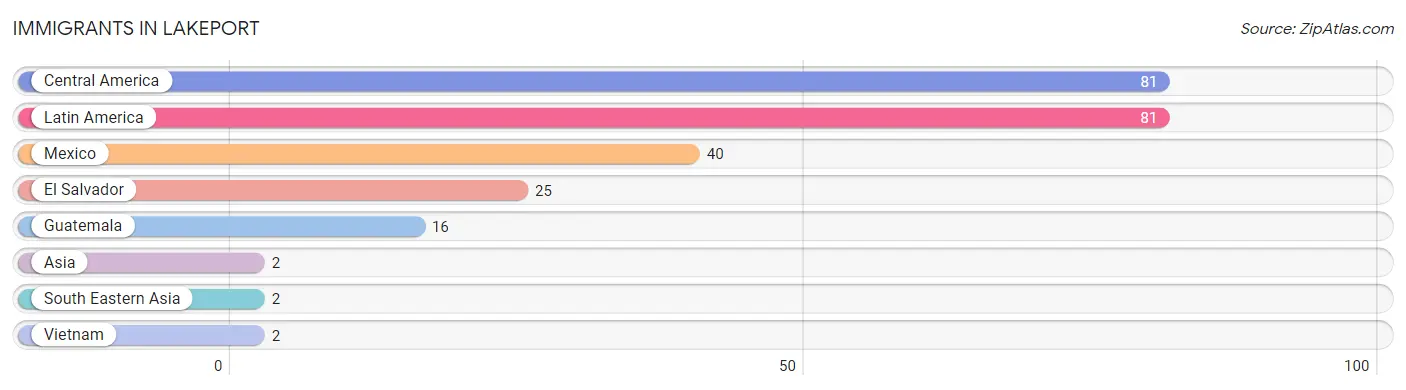
| Immigration Origin | # Population | % Population |
| Asia | 2 | 0.2% |
| Central America | 81 | 7.4% |
| El Salvador | 25 | 2.3% |
| Guatemala | 16 | 1.5% |
| Latin America | 81 | 7.4% |
| Mexico | 40 | 3.6% |
| South Eastern Asia | 2 | 0.2% |
| Vietnam | 2 | 0.2% | View All 8 Rows |
Sex and Age in Lakeport
Sex and Age in Lakeport
The most populous age groups in Lakeport are 10 to 14 Years (90 | 16.3%) for men and Under 5 Years (68 | 12.5%) for women.
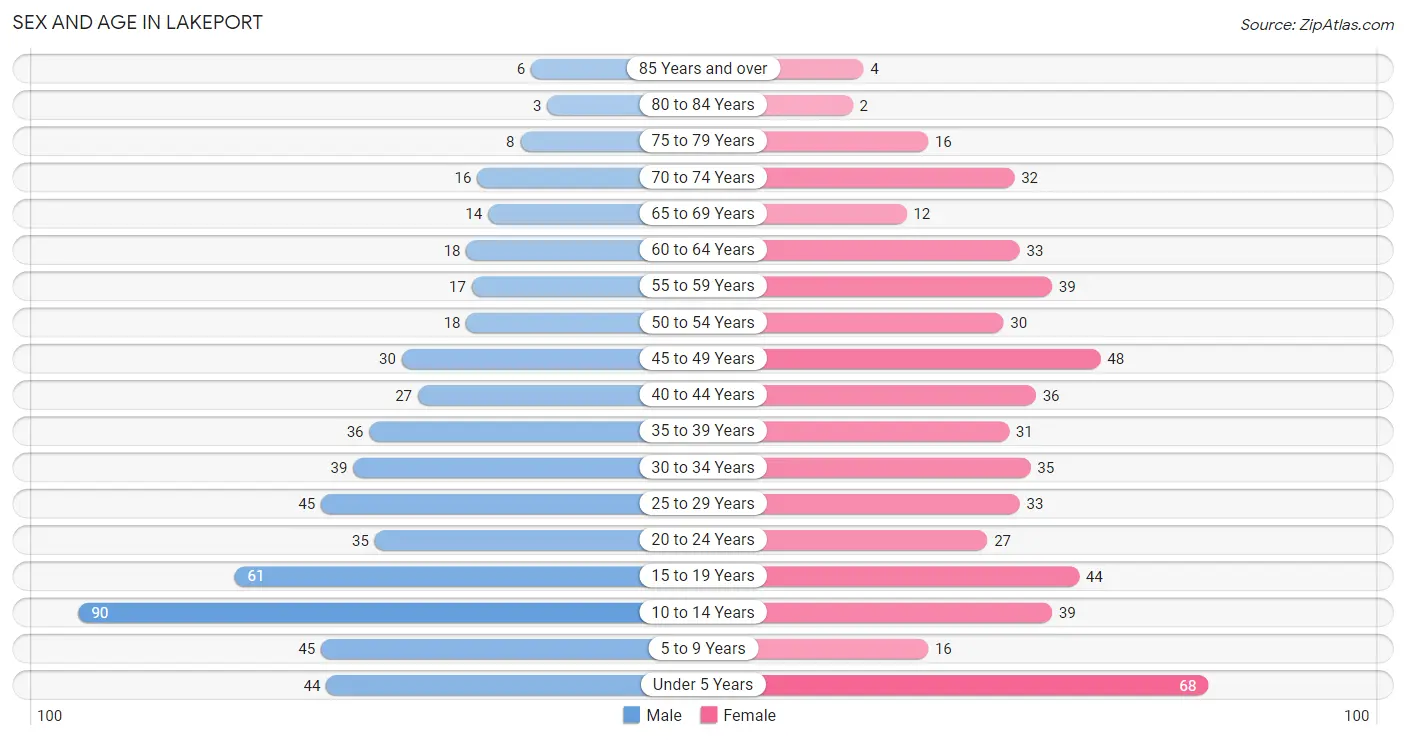
| Age Bracket | Male | Female |
| Under 5 Years | 44 (8.0%) | 68 (12.5%) |
| 5 to 9 Years | 45 (8.2%) | 16 (2.9%) |
| 10 to 14 Years | 90 (16.3%) | 39 (7.2%) |
| 15 to 19 Years | 61 (11.1%) | 44 (8.1%) |
| 20 to 24 Years | 35 (6.3%) | 27 (5.0%) |
| 25 to 29 Years | 45 (8.2%) | 33 (6.1%) |
| 30 to 34 Years | 39 (7.1%) | 35 (6.4%) |
| 35 to 39 Years | 36 (6.5%) | 31 (5.7%) |
| 40 to 44 Years | 27 (4.9%) | 36 (6.6%) |
| 45 to 49 Years | 30 (5.4%) | 48 (8.8%) |
| 50 to 54 Years | 18 (3.3%) | 30 (5.5%) |
| 55 to 59 Years | 17 (3.1%) | 39 (7.2%) |
| 60 to 64 Years | 18 (3.3%) | 33 (6.1%) |
| 65 to 69 Years | 14 (2.5%) | 12 (2.2%) |
| 70 to 74 Years | 16 (2.9%) | 32 (5.9%) |
| 75 to 79 Years | 8 (1.5%) | 16 (2.9%) |
| 80 to 84 Years | 3 (0.5%) | 2 (0.4%) |
| 85 Years and over | 6 (1.1%) | 4 (0.7%) |
| Total | 552 (100.0%) | 545 (100.0%) |
Families and Households in Lakeport
Median Family Size in Lakeport
The median family size in Lakeport is 3.30 persons per family, with single male/father families (24 | 8.3%) accounting for the largest median family size of 3.79 persons per family. On the other hand, single female/mother families (113 | 39.1%) represent the smallest median family size with 3.04 persons per family.
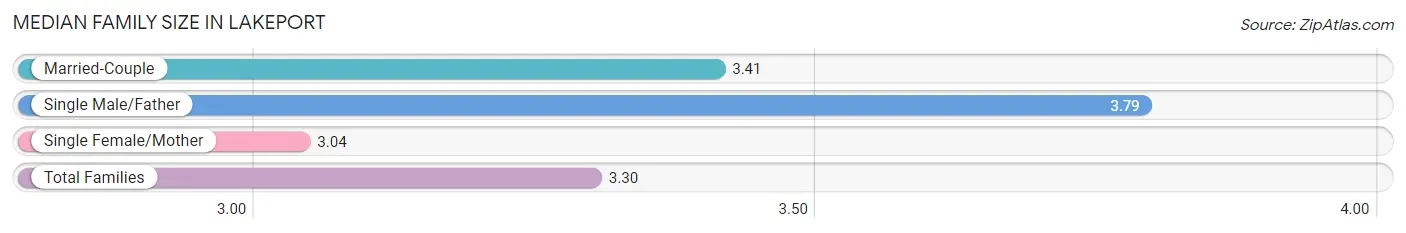
| Family Type | # Families | Family Size |
| Married-Couple | 152 (52.6%) | 3.41 |
| Single Male/Father | 24 (8.3%) | 3.79 |
| Single Female/Mother | 113 (39.1%) | 3.04 |
| Total Families | 289 (100.0%) | 3.30 |
Median Household Size in Lakeport
The median household size in Lakeport is 2.93 persons per household, with single male/father households (24 | 6.4%) accounting for the largest median household size of 4.58 persons per household. non-family households (85 | 22.7%) represent the smallest median household size with 1.26 persons per household.
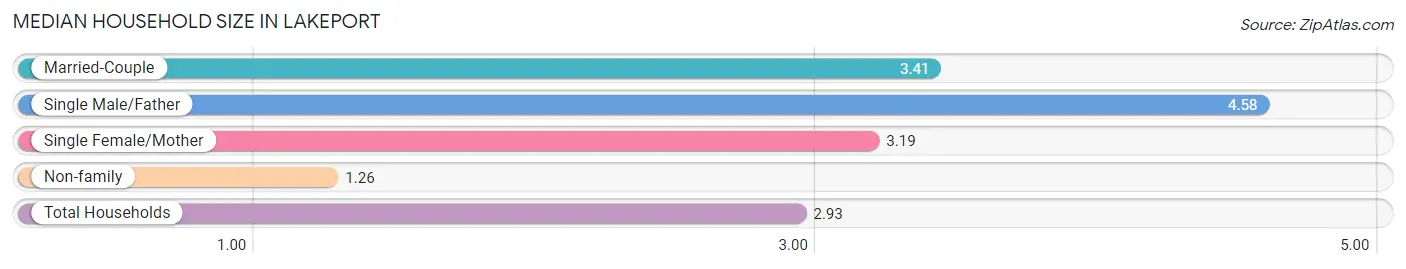
| Household Type | # Households | Household Size |
| Married-Couple | 152 (40.6%) | 3.41 |
| Single Male/Father | 24 (6.4%) | 4.58 |
| Single Female/Mother | 113 (30.2%) | 3.19 |
| Non-family | 85 (22.7%) | 1.26 |
| Total Households | 374 (100.0%) | 2.93 |
Household Size by Marriage Status in Lakeport
Out of a total of 374 households in Lakeport, 289 (77.3%) are family households, while 85 (22.7%) are nonfamily households. The most numerous type of family households are 2-person households, comprising 115, and the most common type of nonfamily households are 1-person households, comprising 63.
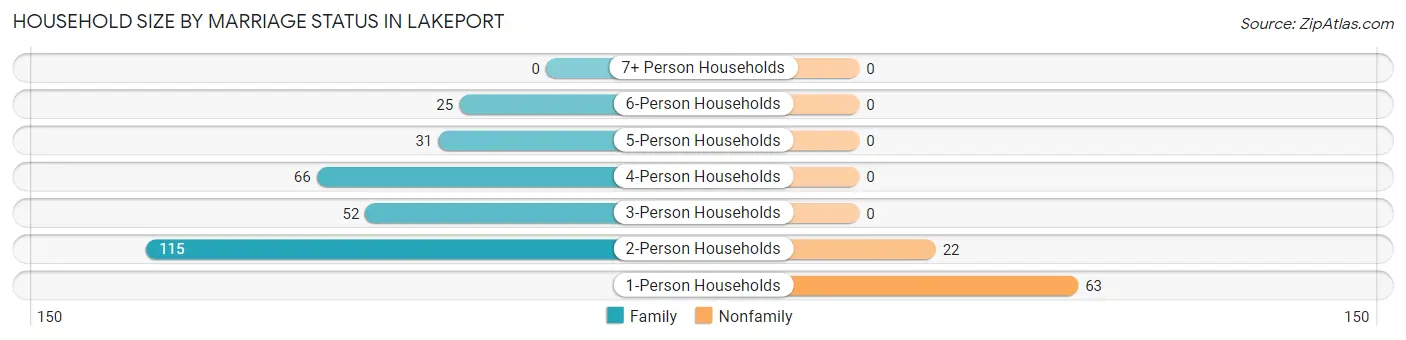
| Household Size | Family Households | Nonfamily Households |
| 1-Person Households | - | 63 (16.8%) |
| 2-Person Households | 115 (30.7%) | 22 (5.9%) |
| 3-Person Households | 52 (13.9%) | 0 (0.0%) |
| 4-Person Households | 66 (17.6%) | 0 (0.0%) |
| 5-Person Households | 31 (8.3%) | 0 (0.0%) |
| 6-Person Households | 25 (6.7%) | 0 (0.0%) |
| 7+ Person Households | 0 (0.0%) | 0 (0.0%) |
| Total | 289 (77.3%) | 85 (22.7%) |
Female Fertility in Lakeport
Fertility by Age in Lakeport
Average fertility rate in Lakeport is 67.0 births per 1,000 women. Women in the age bracket of 20 to 34 years have the highest fertility rate with 158.0 births per 1,000 women. Women in the age bracket of 20 to 34 years acount for 88.2% of all women with births.
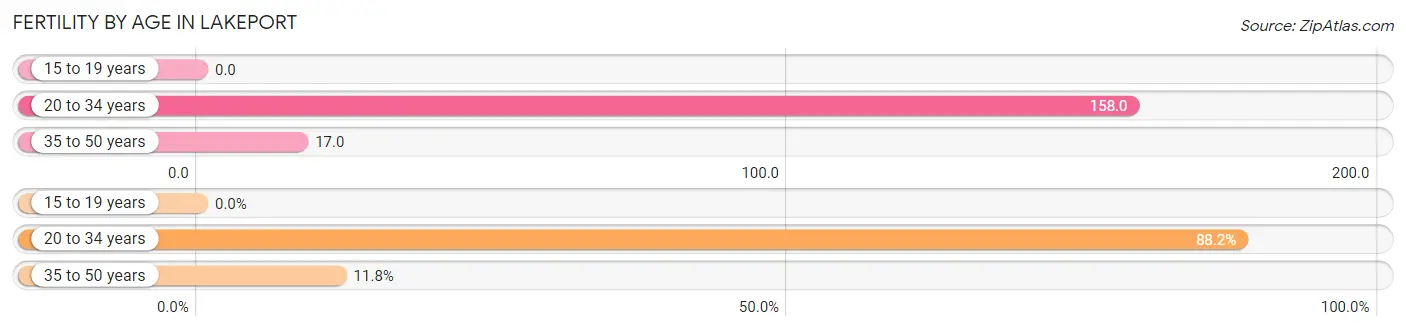
| Age Bracket | Women with Births | Births / 1,000 Women |
| 15 to 19 years | 0 (0.0%) | 0.0 |
| 20 to 34 years | 15 (88.2%) | 158.0 |
| 35 to 50 years | 2 (11.8%) | 17.0 |
| Total | 17 (100.0%) | 67.0 |
Fertility by Age by Marriage Status in Lakeport
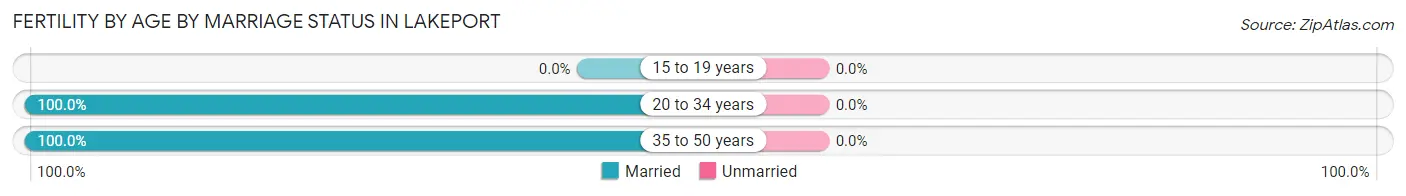
| Age Bracket | Married | Unmarried |
| 15 to 19 years | 0 (0.0%) | 0 (0.0%) |
| 20 to 34 years | 15 (100.0%) | 0 (0.0%) |
| 35 to 50 years | 2 (100.0%) | 0 (0.0%) |
| Total | 17 (100.0%) | 0 (0.0%) |
Fertility by Education in Lakeport
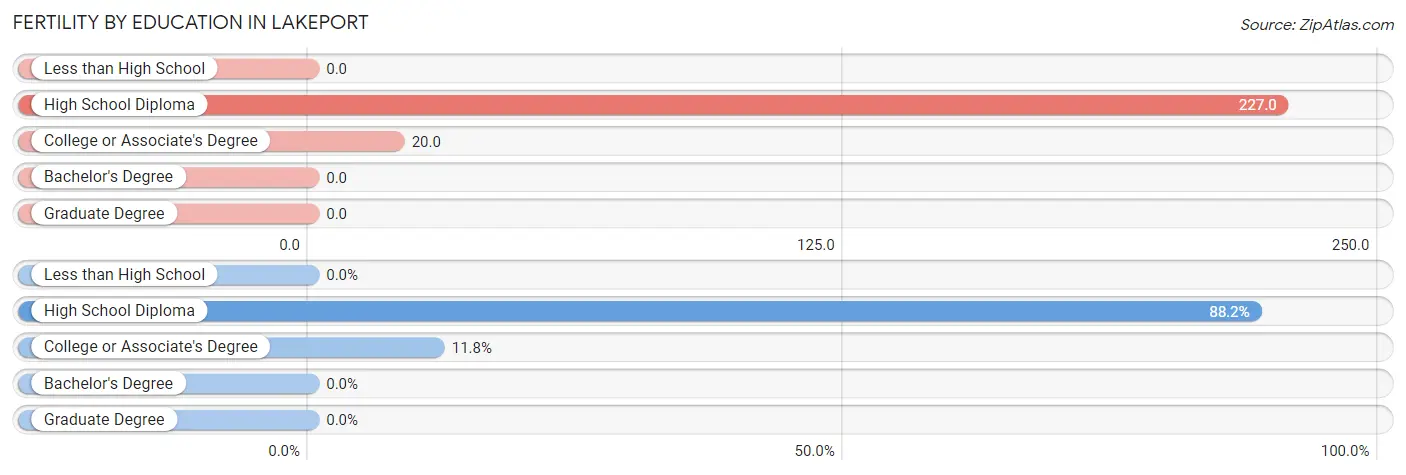
| Educational Attainment | Women with Births | Births / 1,000 Women |
| Less than High School | 0 (0.0%) | 0.0 |
| High School Diploma | 15 (88.2%) | 227.0 |
| College or Associate's Degree | 2 (11.8%) | 20.0 |
| Bachelor's Degree | 0 (0.0%) | 0.0 |
| Graduate Degree | 0 (0.0%) | 0.0 |
| Total | 17 (100.0%) | 67.0 |
Fertility by Education by Marriage Status in Lakeport
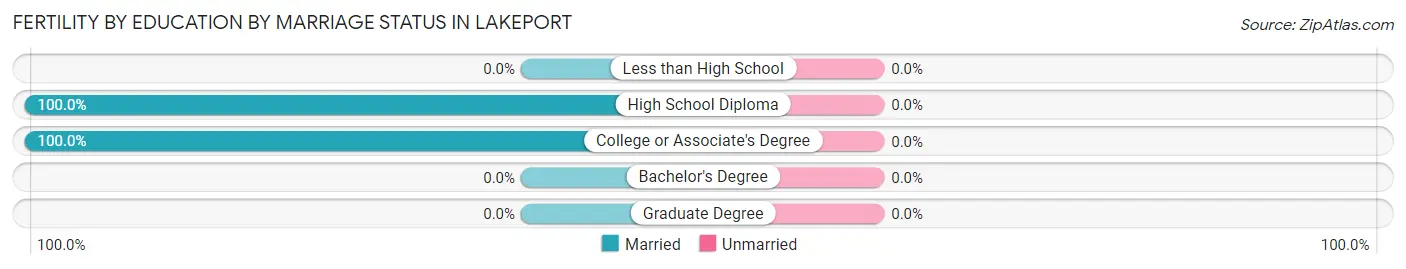
| Educational Attainment | Married | Unmarried |
| Less than High School | 0 (0.0%) | 0 (0.0%) |
| High School Diploma | 15 (100.0%) | 0 (0.0%) |
| College or Associate's Degree | 2 (100.0%) | 0 (0.0%) |
| Bachelor's Degree | 0 (0.0%) | 0 (0.0%) |
| Graduate Degree | 0 (0.0%) | 0 (0.0%) |
| Total | 17 (100.0%) | 0 (0.0%) |
Employment Characteristics in Lakeport
Employment by Class of Employer in Lakeport
Among the 467 employed individuals in Lakeport, private company employees (338 | 72.4%), state government employees (37 | 7.9%), and self-employed (not incorporated) (29 | 6.2%) make up the most common classes of employment.
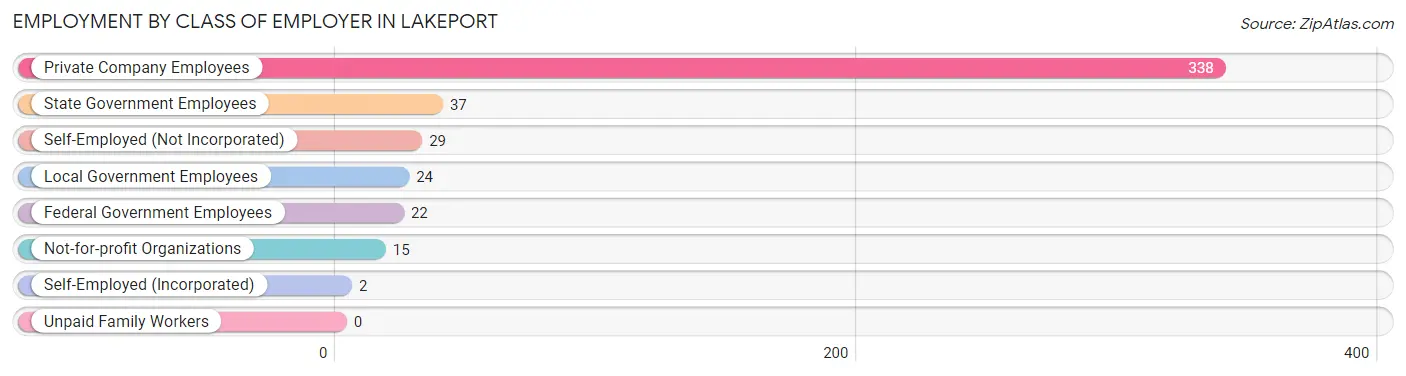
| Employer Class | # Employees | % Employees |
| Private Company Employees | 338 | 72.4% |
| Self-Employed (Incorporated) | 2 | 0.4% |
| Self-Employed (Not Incorporated) | 29 | 6.2% |
| Not-for-profit Organizations | 15 | 3.2% |
| Local Government Employees | 24 | 5.1% |
| State Government Employees | 37 | 7.9% |
| Federal Government Employees | 22 | 4.7% |
| Unpaid Family Workers | 0 | 0.0% |
| Total | 467 | 100.0% |
Employment Status by Age in Lakeport
According to the labor force statistics for Lakeport, out of the total population over 16 years of age (766), 64.5% or 494 individuals are in the labor force, with 2.4% or 12 of them unemployed. The age group with the highest labor force participation rate is 25 to 29 years, with 96.2% or 75 individuals in the labor force. Within the labor force, the 60 to 64 years age range has the highest percentage of unemployed individuals, with 8.3% or 2 of them being unemployed.
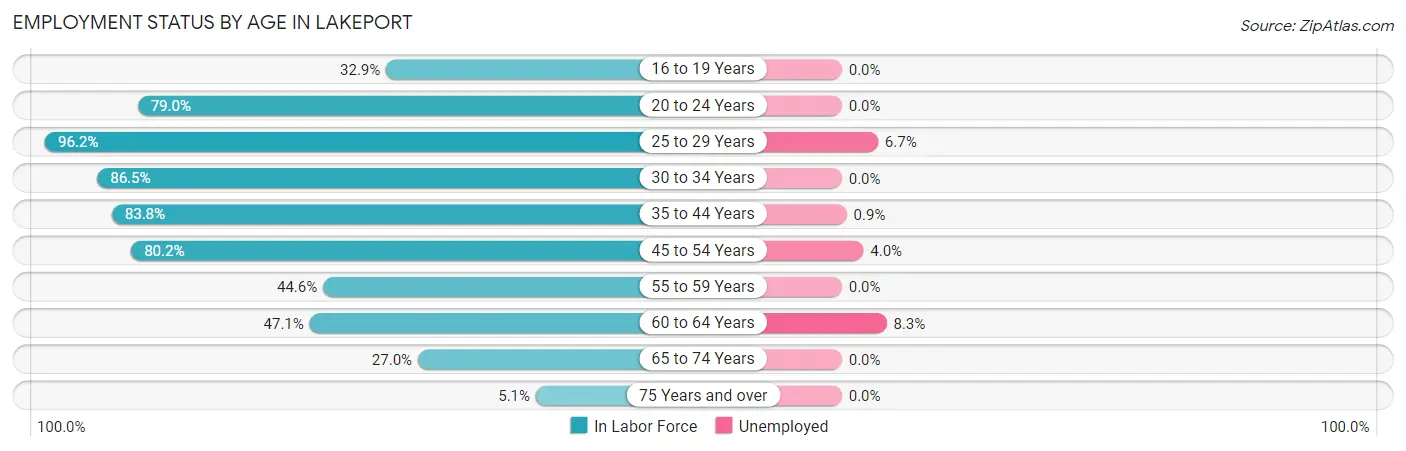
| Age Bracket | In Labor Force | Unemployed |
| 16 to 19 Years | 25 (32.9%) | 0 (0.0%) |
| 20 to 24 Years | 49 (79.0%) | 0 (0.0%) |
| 25 to 29 Years | 75 (96.2%) | 5 (6.7%) |
| 30 to 34 Years | 64 (86.5%) | 0 (0.0%) |
| 35 to 44 Years | 109 (83.8%) | 1 (0.9%) |
| 45 to 54 Years | 101 (80.2%) | 4 (4.0%) |
| 55 to 59 Years | 25 (44.6%) | 0 (0.0%) |
| 60 to 64 Years | 24 (47.1%) | 2 (8.3%) |
| 65 to 74 Years | 20 (27.0%) | 0 (0.0%) |
| 75 Years and over | 2 (5.1%) | 0 (0.0%) |
| Total | 494 (64.5%) | 12 (2.4%) |
Employment Status by Educational Attainment in Lakeport
According to labor force statistics for Lakeport, 77.3% of individuals (398) out of the total population between 25 and 64 years of age (515) are in the labor force, with 3.0% or 12 of them being unemployed. The group with the highest labor force participation rate are those with the educational attainment of less than high school, with 87.5% or 42 individuals in the labor force. Within the labor force, individuals with bachelor's degree or higher education have the highest percentage of unemployment, with 11.1% or 7 of them being unemployed.
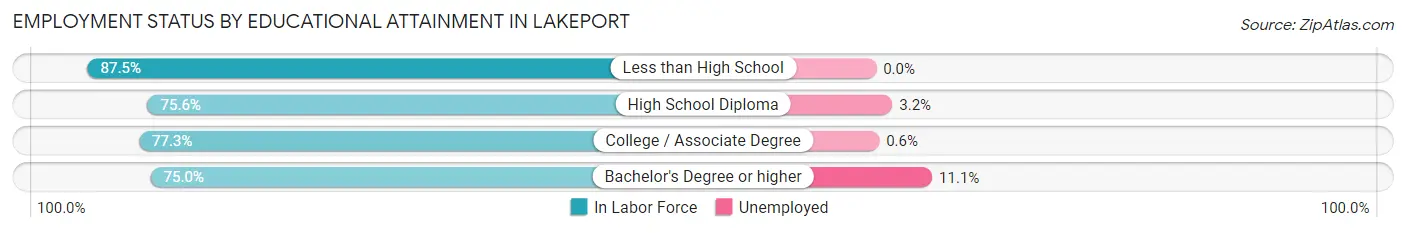
| Educational Attainment | In Labor Force | Unemployed |
| Less than High School | 42 (87.5%) | 0 (0.0%) |
| High School Diploma | 130 (75.6%) | 6 (3.2%) |
| College / Associate Degree | 163 (77.3%) | 1 (0.6%) |
| Bachelor's Degree or higher | 63 (75.0%) | 9 (11.1%) |
| Total | 398 (77.3%) | 15 (3.0%) |
Employment Occupations by Sex in Lakeport
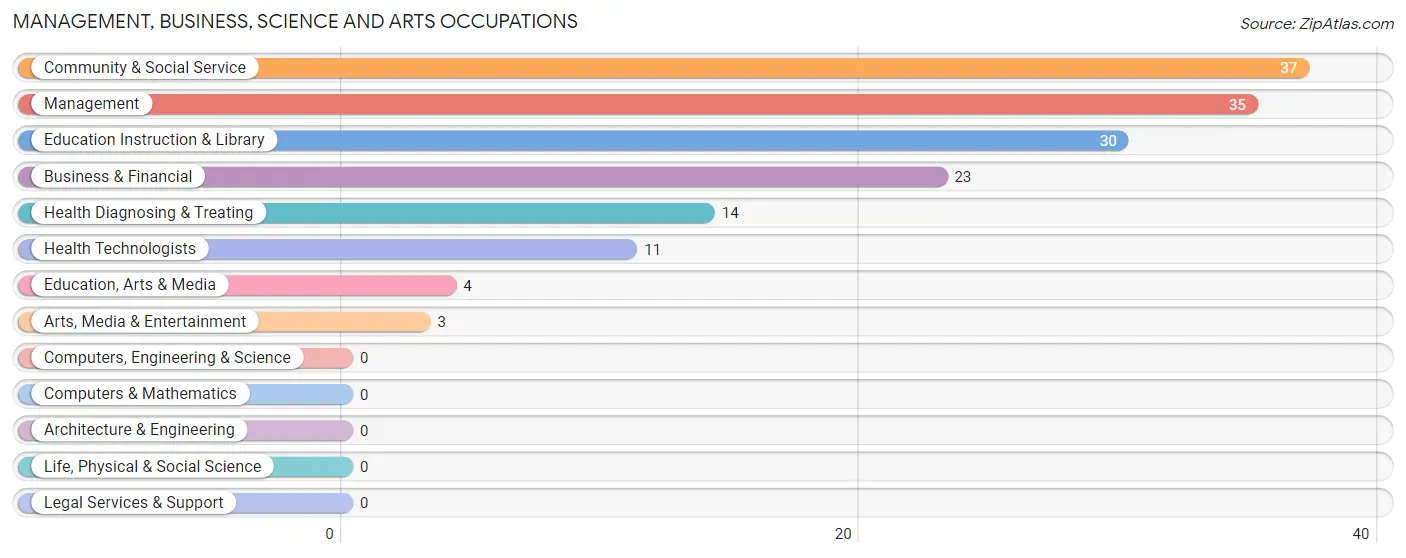
Management, Business, Science and Arts Occupations
The most common Management, Business, Science and Arts occupations in Lakeport are Community & Social Service (37 | 7.7%), Management (35 | 7.3%), Education Instruction & Library (30 | 6.3%), Business & Financial (23 | 4.8%), and Health Diagnosing & Treating (14 | 2.9%).
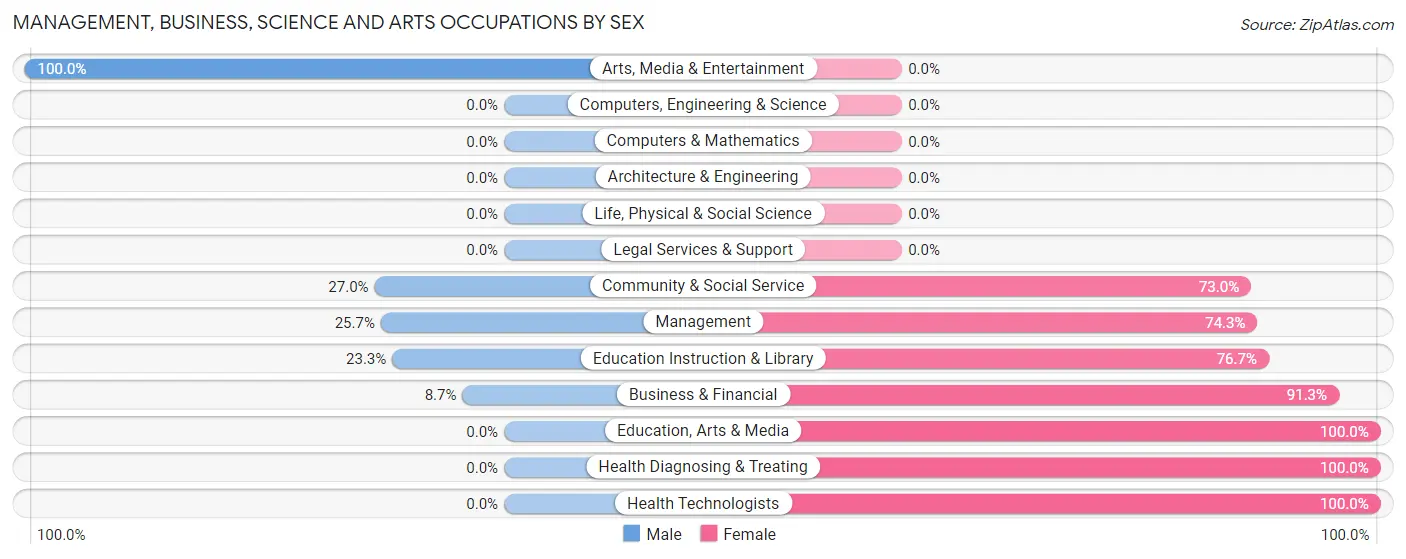
Management, Business, Science and Arts Occupations by Sex
Within the Management, Business, Science and Arts occupations in Lakeport, the most male-oriented occupations are Arts, Media & Entertainment (100.0%), Community & Social Service (27.0%), and Management (25.7%), while the most female-oriented occupations are Education, Arts & Media (100.0%), Health Diagnosing & Treating (100.0%), and Health Technologists (100.0%).
| Occupation | Male | Female |
| Management | 9 (25.7%) | 26 (74.3%) |
| Business & Financial | 2 (8.7%) | 21 (91.3%) |
| Computers, Engineering & Science | 0 (0.0%) | 0 (0.0%) |
| Computers & Mathematics | 0 (0.0%) | 0 (0.0%) |
| Architecture & Engineering | 0 (0.0%) | 0 (0.0%) |
| Life, Physical & Social Science | 0 (0.0%) | 0 (0.0%) |
| Community & Social Service | 10 (27.0%) | 27 (73.0%) |
| Education, Arts & Media | 0 (0.0%) | 4 (100.0%) |
| Legal Services & Support | 0 (0.0%) | 0 (0.0%) |
| Education Instruction & Library | 7 (23.3%) | 23 (76.7%) |
| Arts, Media & Entertainment | 3 (100.0%) | 0 (0.0%) |
| Health Diagnosing & Treating | 0 (0.0%) | 14 (100.0%) |
| Health Technologists | 0 (0.0%) | 11 (100.0%) |
| Total (Category) | 21 (19.3%) | 88 (80.7%) |
| Total (Overall) | 241 (50.4%) | 237 (49.6%) |
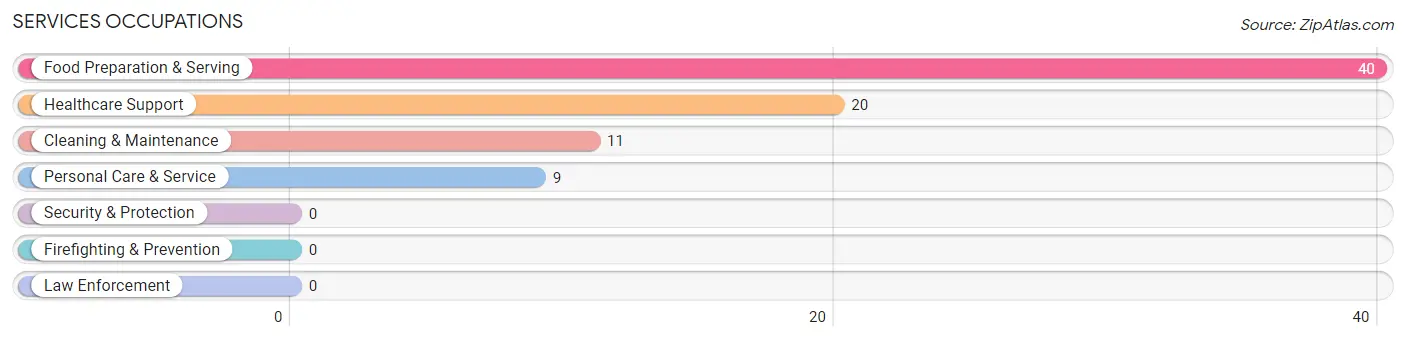
Services Occupations
The most common Services occupations in Lakeport are Food Preparation & Serving (40 | 8.4%), Healthcare Support (20 | 4.2%), Cleaning & Maintenance (11 | 2.3%), and Personal Care & Service (9 | 1.9%).
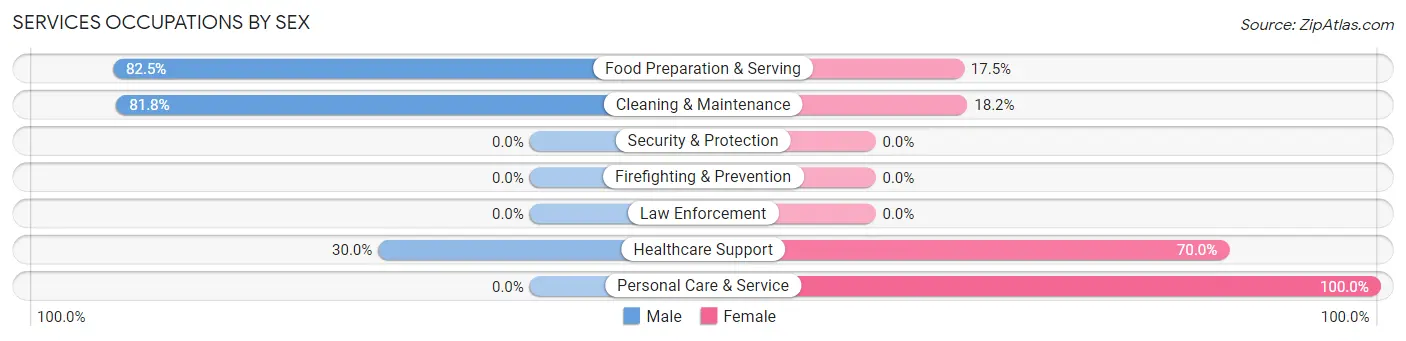
Services Occupations by Sex
Within the Services occupations in Lakeport, the most male-oriented occupations are Food Preparation & Serving (82.5%), Cleaning & Maintenance (81.8%), and Healthcare Support (30.0%), while the most female-oriented occupations are Personal Care & Service (100.0%), Healthcare Support (70.0%), and Cleaning & Maintenance (18.2%).
| Occupation | Male | Female |
| Healthcare Support | 6 (30.0%) | 14 (70.0%) |
| Security & Protection | 0 (0.0%) | 0 (0.0%) |
| Firefighting & Prevention | 0 (0.0%) | 0 (0.0%) |
| Law Enforcement | 0 (0.0%) | 0 (0.0%) |
| Food Preparation & Serving | 33 (82.5%) | 7 (17.5%) |
| Cleaning & Maintenance | 9 (81.8%) | 2 (18.2%) |
| Personal Care & Service | 0 (0.0%) | 9 (100.0%) |
| Total (Category) | 48 (60.0%) | 32 (40.0%) |
| Total (Overall) | 241 (50.4%) | 237 (49.6%) |
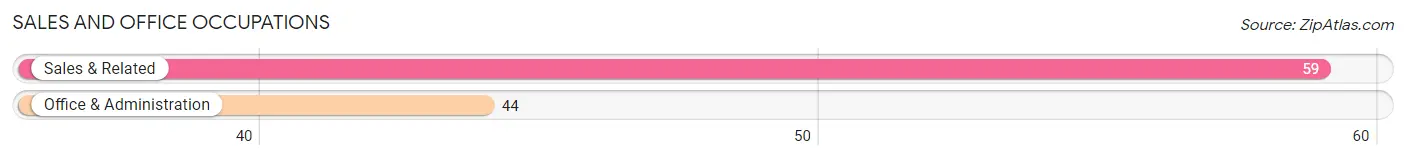
Sales and Office Occupations
The most common Sales and Office occupations in Lakeport are Sales & Related (59 | 12.3%), and Office & Administration (44 | 9.2%).
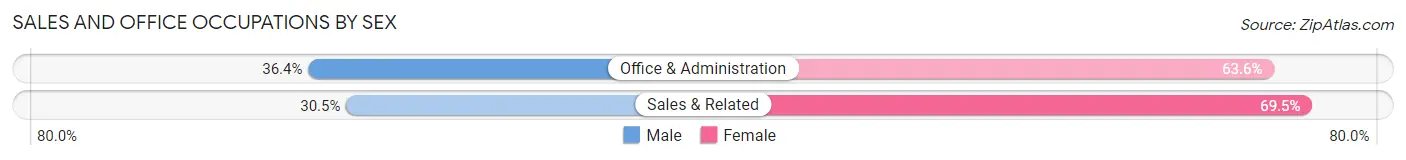
Sales and Office Occupations by Sex
| Occupation | Male | Female |
| Sales & Related | 18 (30.5%) | 41 (69.5%) |
| Office & Administration | 16 (36.4%) | 28 (63.6%) |
| Total (Category) | 34 (33.0%) | 69 (67.0%) |
| Total (Overall) | 241 (50.4%) | 237 (49.6%) |
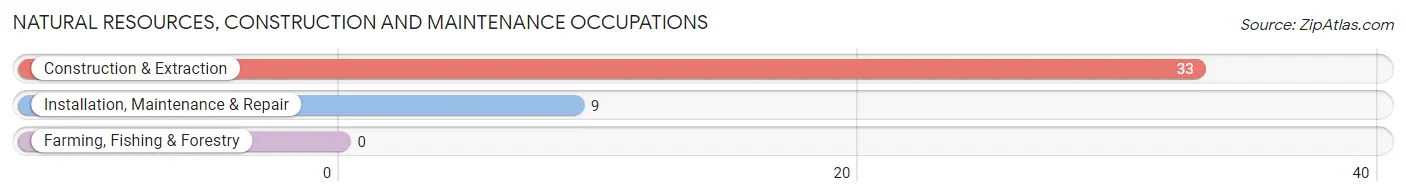
Natural Resources, Construction and Maintenance Occupations
The most common Natural Resources, Construction and Maintenance occupations in Lakeport are Construction & Extraction (33 | 6.9%), and Installation, Maintenance & Repair (9 | 1.9%).
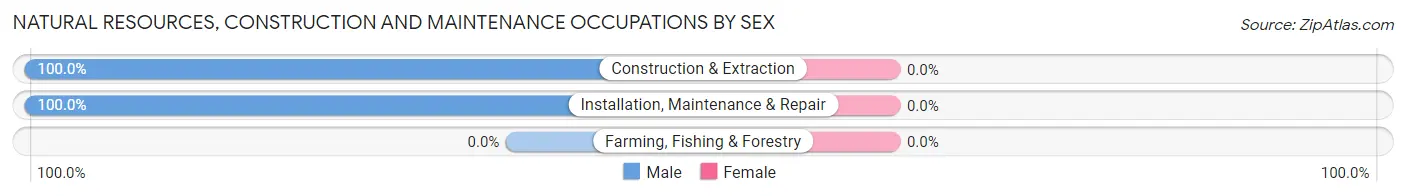
Natural Resources, Construction and Maintenance Occupations by Sex
| Occupation | Male | Female |
| Farming, Fishing & Forestry | 0 (0.0%) | 0 (0.0%) |
| Construction & Extraction | 33 (100.0%) | 0 (0.0%) |
| Installation, Maintenance & Repair | 9 (100.0%) | 0 (0.0%) |
| Total (Category) | 42 (100.0%) | 0 (0.0%) |
| Total (Overall) | 241 (50.4%) | 237 (49.6%) |
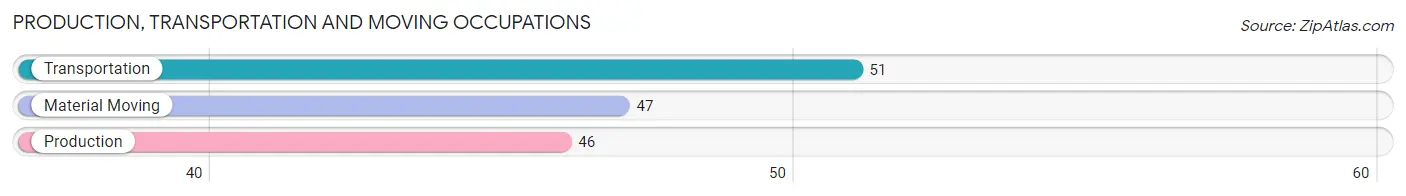
Production, Transportation and Moving Occupations
The most common Production, Transportation and Moving occupations in Lakeport are Transportation (51 | 10.7%), Material Moving (47 | 9.8%), and Production (46 | 9.6%).
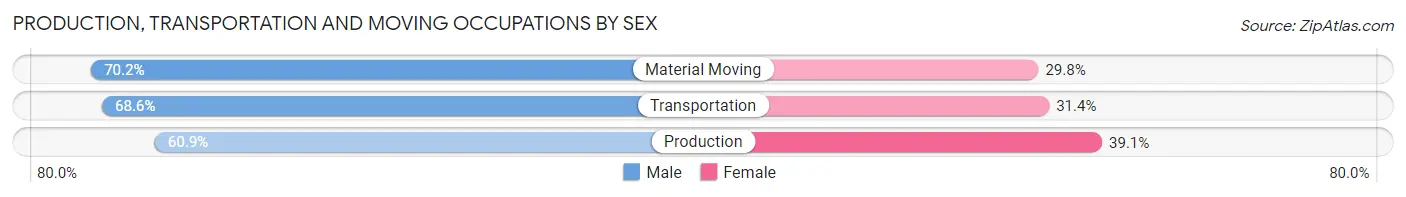
Production, Transportation and Moving Occupations by Sex
| Occupation | Male | Female |
| Production | 28 (60.9%) | 18 (39.1%) |
| Transportation | 35 (68.6%) | 16 (31.4%) |
| Material Moving | 33 (70.2%) | 14 (29.8%) |
| Total (Category) | 96 (66.7%) | 48 (33.3%) |
| Total (Overall) | 241 (50.4%) | 237 (49.6%) |
Employment Industries by Sex in Lakeport
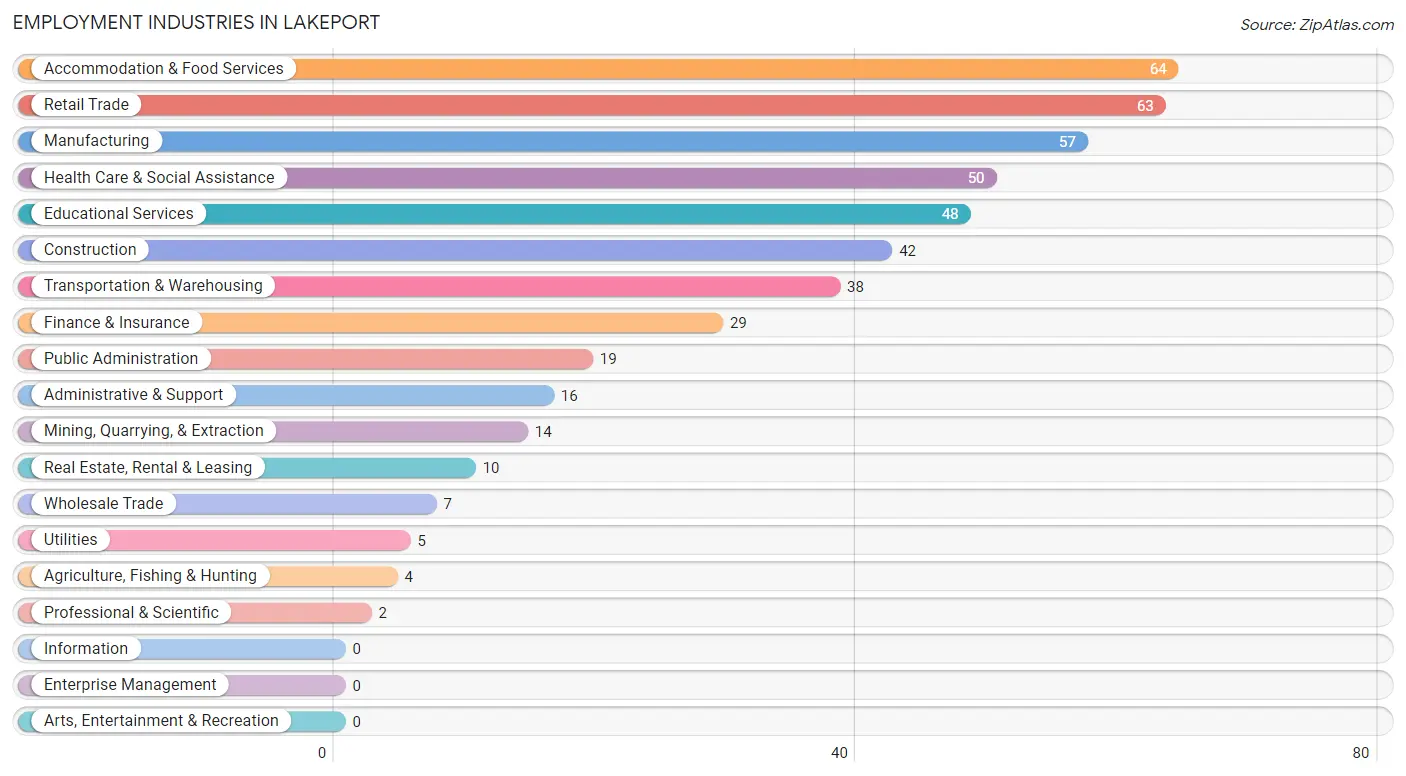
Employment Industries in Lakeport
The major employment industries in Lakeport include Accommodation & Food Services (64 | 13.4%), Retail Trade (63 | 13.2%), Manufacturing (57 | 11.9%), Health Care & Social Assistance (50 | 10.5%), and Educational Services (48 | 10.0%).
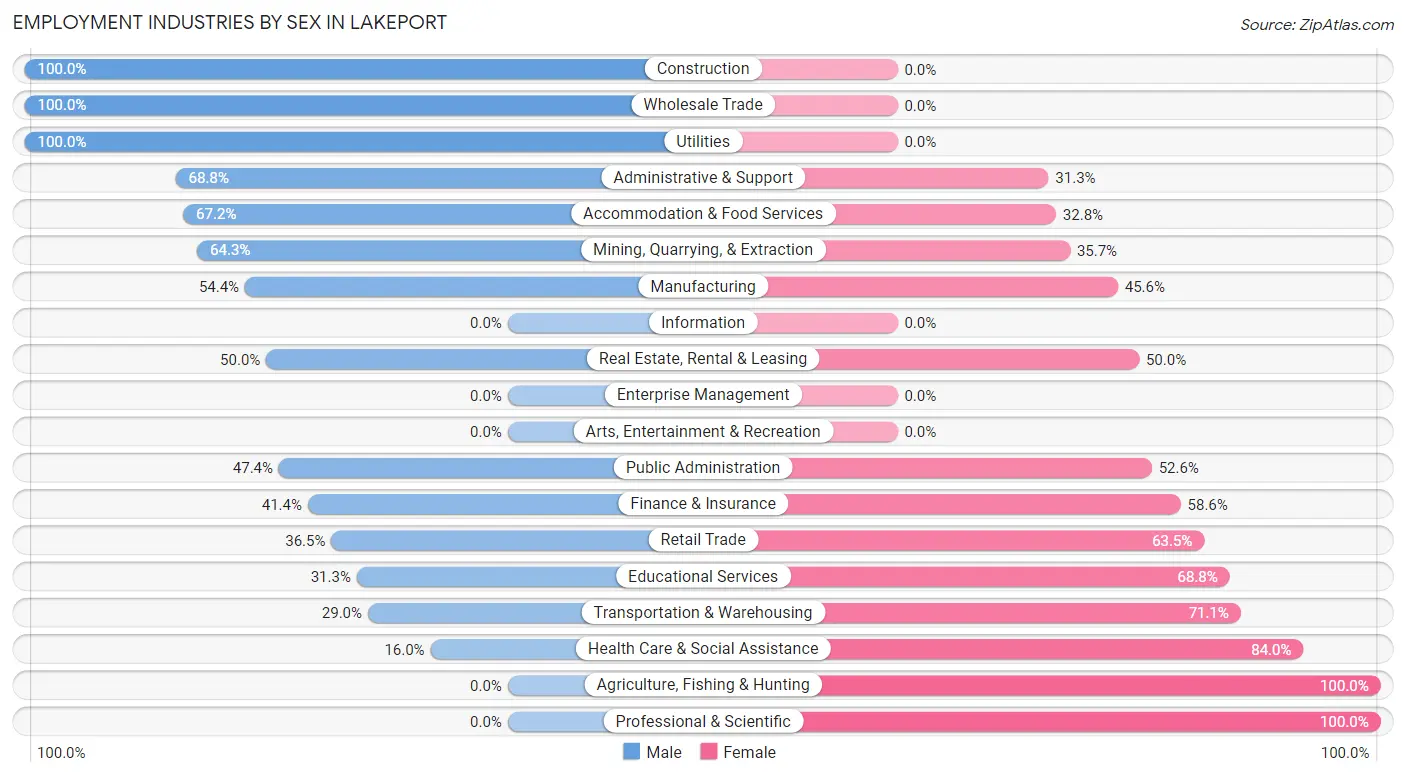
Employment Industries by Sex in Lakeport
The Lakeport industries that see more men than women are Construction (100.0%), Wholesale Trade (100.0%), and Utilities (100.0%), whereas the industries that tend to have a higher number of women are Agriculture, Fishing & Hunting (100.0%), Professional & Scientific (100.0%), and Health Care & Social Assistance (84.0%).
| Industry | Male | Female |
| Agriculture, Fishing & Hunting | 0 (0.0%) | 4 (100.0%) |
| Mining, Quarrying, & Extraction | 9 (64.3%) | 5 (35.7%) |
| Construction | 42 (100.0%) | 0 (0.0%) |
| Manufacturing | 31 (54.4%) | 26 (45.6%) |
| Wholesale Trade | 7 (100.0%) | 0 (0.0%) |
| Retail Trade | 23 (36.5%) | 40 (63.5%) |
| Transportation & Warehousing | 11 (28.9%) | 27 (71.1%) |
| Utilities | 5 (100.0%) | 0 (0.0%) |
| Information | 0 (0.0%) | 0 (0.0%) |
| Finance & Insurance | 12 (41.4%) | 17 (58.6%) |
| Real Estate, Rental & Leasing | 5 (50.0%) | 5 (50.0%) |
| Professional & Scientific | 0 (0.0%) | 2 (100.0%) |
| Enterprise Management | 0 (0.0%) | 0 (0.0%) |
| Administrative & Support | 11 (68.8%) | 5 (31.2%) |
| Educational Services | 15 (31.2%) | 33 (68.8%) |
| Health Care & Social Assistance | 8 (16.0%) | 42 (84.0%) |
| Arts, Entertainment & Recreation | 0 (0.0%) | 0 (0.0%) |
| Accommodation & Food Services | 43 (67.2%) | 21 (32.8%) |
| Public Administration | 9 (47.4%) | 10 (52.6%) |
| Total | 241 (50.4%) | 237 (49.6%) |
Education in Lakeport
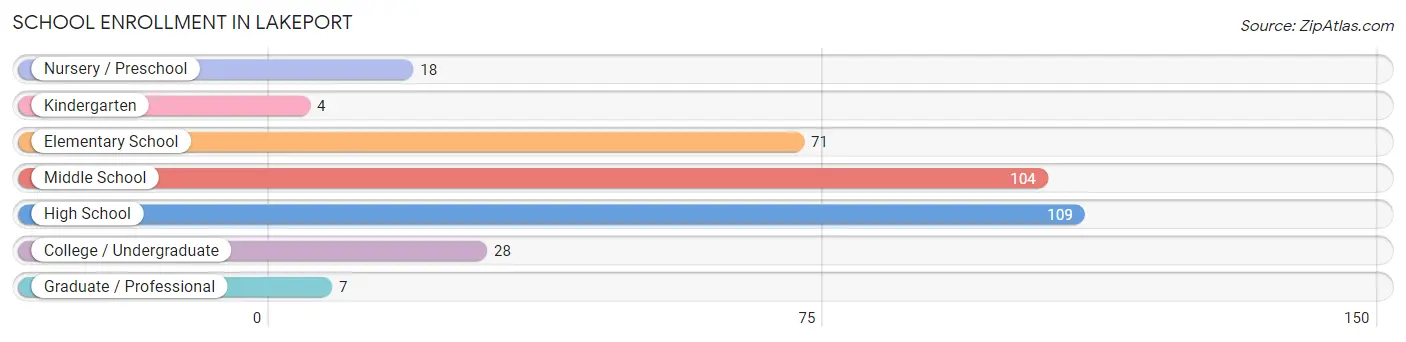
School Enrollment in Lakeport
The most common levels of schooling among the 341 students in Lakeport are high school (109 | 32.0%), middle school (104 | 30.5%), and elementary school (71 | 20.8%).
| School Level | # Students | % Students |
| Nursery / Preschool | 18 | 5.3% |
| Kindergarten | 4 | 1.2% |
| Elementary School | 71 | 20.8% |
| Middle School | 104 | 30.5% |
| High School | 109 | 32.0% |
| College / Undergraduate | 28 | 8.2% |
| Graduate / Professional | 7 | 2.1% |
| Total | 341 | 100.0% |
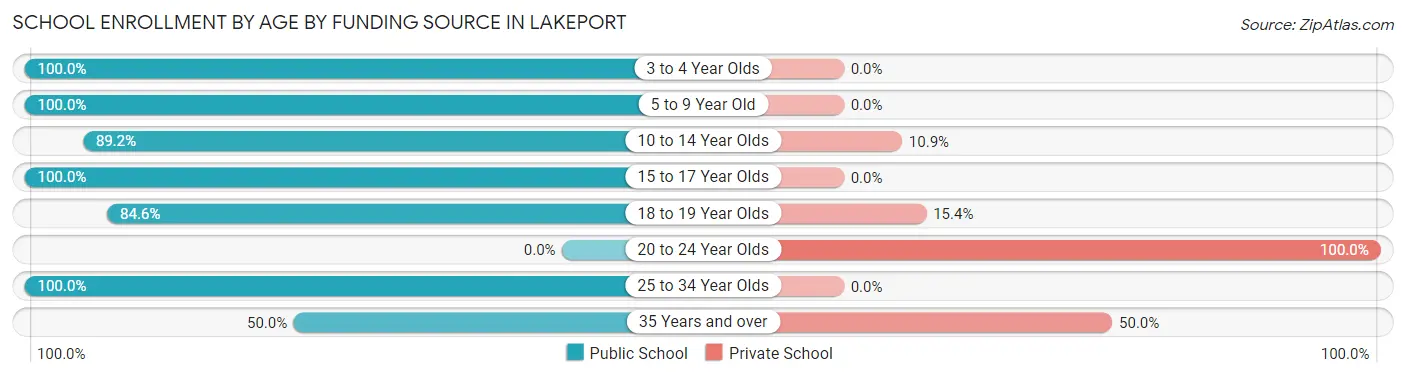
School Enrollment by Age by Funding Source in Lakeport
Out of a total of 341 students who are enrolled in schools in Lakeport, 38 (11.1%) attend a private institution, while the remaining 303 (88.9%) are enrolled in public schools. The age group of 20 to 24 year olds has the highest likelihood of being enrolled in private schools, with 18 (100.0% in the age bracket) enrolled. Conversely, the age group of 3 to 4 year olds has the lowest likelihood of being enrolled in a private school, with 18 (100.0% in the age bracket) attending a public institution.
| Age Bracket | Public School | Private School |
| 3 to 4 Year Olds | 18 (100.0%) | 0 (0.0%) |
| 5 to 9 Year Old | 59 (100.0%) | 0 (0.0%) |
| 10 to 14 Year Olds | 115 (89.1%) | 14 (10.8%) |
| 15 to 17 Year Olds | 89 (100.0%) | 0 (0.0%) |
| 18 to 19 Year Olds | 11 (84.6%) | 2 (15.4%) |
| 20 to 24 Year Olds | 0 (0.0%) | 18 (100.0%) |
| 25 to 34 Year Olds | 7 (100.0%) | 0 (0.0%) |
| 35 Years and over | 4 (50.0%) | 4 (50.0%) |
| Total | 303 (88.9%) | 38 (11.1%) |
Educational Attainment by Field of Study in Lakeport
Business (31 | 33.0%), education (28 | 29.8%), science & technology (17 | 18.1%), communications (7 | 7.4%), and engineering (5 | 5.3%) are the most common fields of study among 94 individuals in Lakeport who have obtained a bachelor's degree or higher.
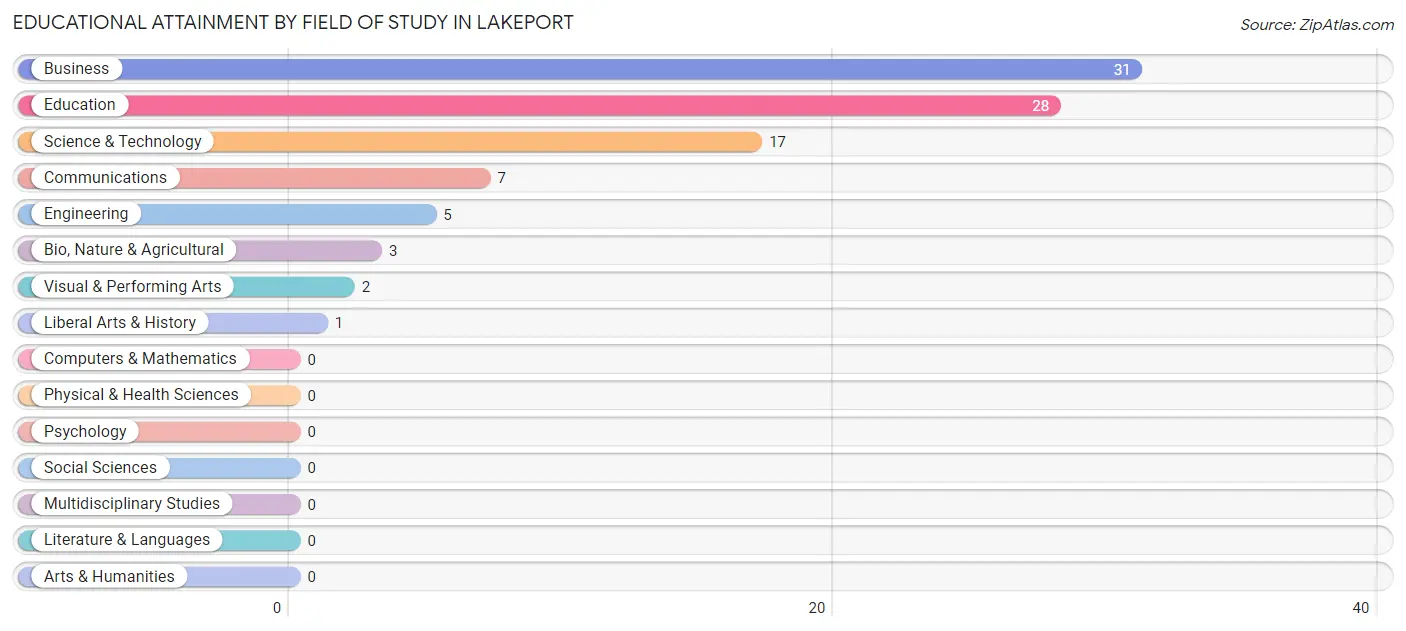
| Field of Study | # Graduates | % Graduates |
| Computers & Mathematics | 0 | 0.0% |
| Bio, Nature & Agricultural | 3 | 3.2% |
| Physical & Health Sciences | 0 | 0.0% |
| Psychology | 0 | 0.0% |
| Social Sciences | 0 | 0.0% |
| Engineering | 5 | 5.3% |
| Multidisciplinary Studies | 0 | 0.0% |
| Science & Technology | 17 | 18.1% |
| Business | 31 | 33.0% |
| Education | 28 | 29.8% |
| Literature & Languages | 0 | 0.0% |
| Liberal Arts & History | 1 | 1.1% |
| Visual & Performing Arts | 2 | 2.1% |
| Communications | 7 | 7.4% |
| Arts & Humanities | 0 | 0.0% |
| Total | 94 | 100.0% |
Transportation & Commute in Lakeport
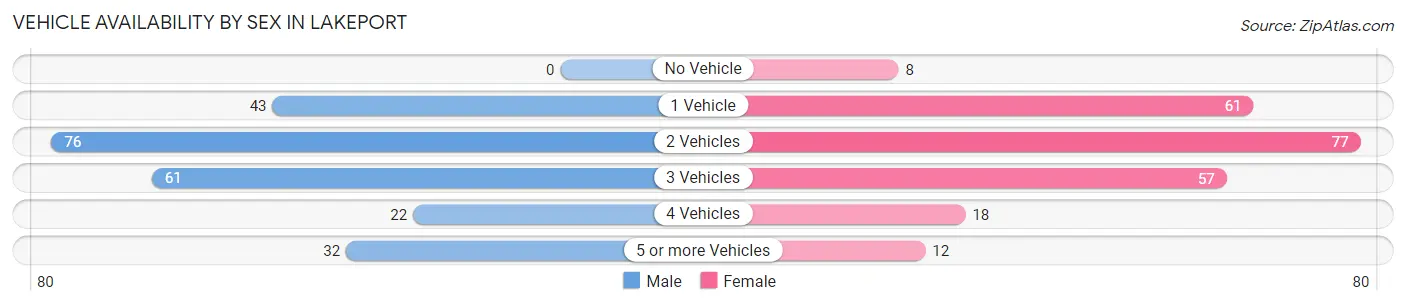
Vehicle Availability by Sex in Lakeport
The most prevalent vehicle ownership categories in Lakeport are males with 2 vehicles (76, accounting for 32.5%) and females with 2 vehicles (77, making up 32.6%).
| Vehicles Available | Male | Female |
| No Vehicle | 0 (0.0%) | 8 (3.4%) |
| 1 Vehicle | 43 (18.4%) | 61 (26.2%) |
| 2 Vehicles | 76 (32.5%) | 77 (33.1%) |
| 3 Vehicles | 61 (26.1%) | 57 (24.5%) |
| 4 Vehicles | 22 (9.4%) | 18 (7.7%) |
| 5 or more Vehicles | 32 (13.7%) | 12 (5.1%) |
| Total | 234 (100.0%) | 233 (100.0%) |
Commute Time in Lakeport
The most frequently occuring commute durations in Lakeport are 20 to 24 minutes (119 commuters, 26.8%), 30 to 34 minutes (83 commuters, 18.7%), and 15 to 19 minutes (79 commuters, 17.8%).
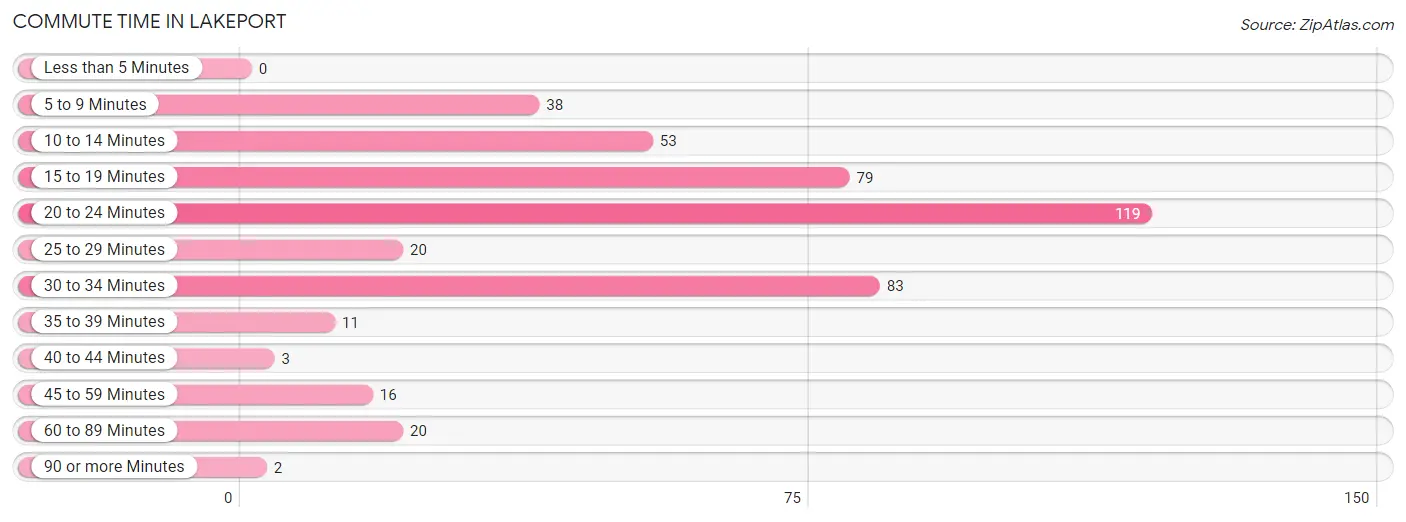
| Commute Time | # Commuters | % Commuters |
| Less than 5 Minutes | 0 | 0.0% |
| 5 to 9 Minutes | 38 | 8.6% |
| 10 to 14 Minutes | 53 | 11.9% |
| 15 to 19 Minutes | 79 | 17.8% |
| 20 to 24 Minutes | 119 | 26.8% |
| 25 to 29 Minutes | 20 | 4.5% |
| 30 to 34 Minutes | 83 | 18.7% |
| 35 to 39 Minutes | 11 | 2.5% |
| 40 to 44 Minutes | 3 | 0.7% |
| 45 to 59 Minutes | 16 | 3.6% |
| 60 to 89 Minutes | 20 | 4.5% |
| 90 or more Minutes | 2 | 0.4% |
Commute Time by Sex in Lakeport
The most common commute times in Lakeport are 30 to 34 minutes (61 commuters, 27.1%) for males and 20 to 24 minutes (65 commuters, 29.7%) for females.
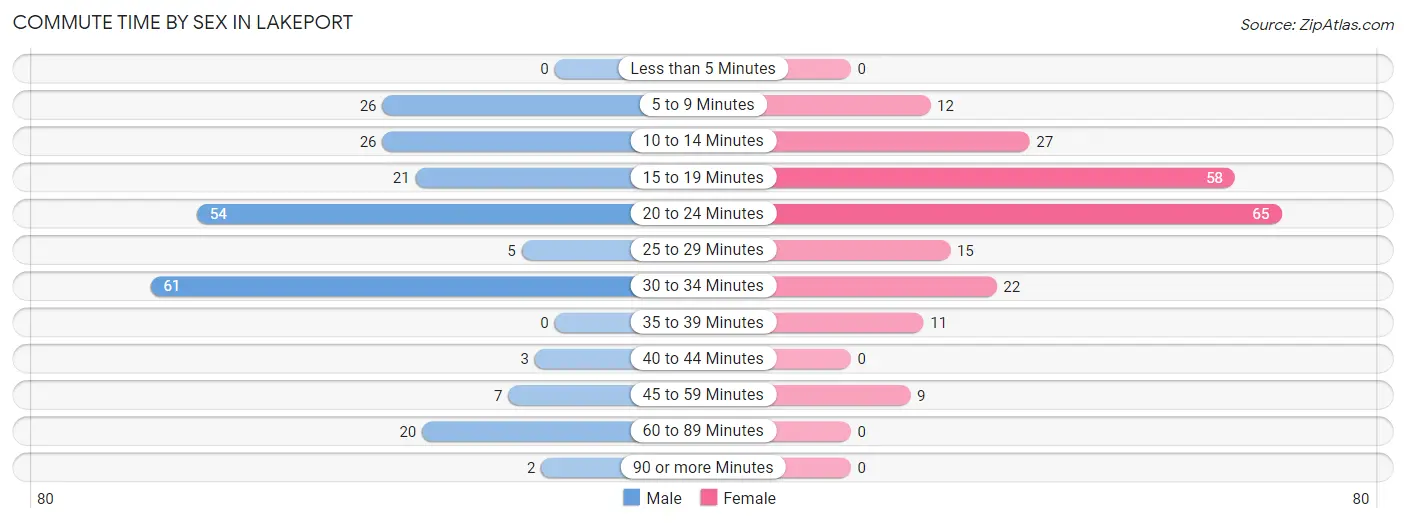
| Commute Time | Male | Female |
| Less than 5 Minutes | 0 (0.0%) | 0 (0.0%) |
| 5 to 9 Minutes | 26 (11.6%) | 12 (5.5%) |
| 10 to 14 Minutes | 26 (11.6%) | 27 (12.3%) |
| 15 to 19 Minutes | 21 (9.3%) | 58 (26.5%) |
| 20 to 24 Minutes | 54 (24.0%) | 65 (29.7%) |
| 25 to 29 Minutes | 5 (2.2%) | 15 (6.9%) |
| 30 to 34 Minutes | 61 (27.1%) | 22 (10.1%) |
| 35 to 39 Minutes | 0 (0.0%) | 11 (5.0%) |
| 40 to 44 Minutes | 3 (1.3%) | 0 (0.0%) |
| 45 to 59 Minutes | 7 (3.1%) | 9 (4.1%) |
| 60 to 89 Minutes | 20 (8.9%) | 0 (0.0%) |
| 90 or more Minutes | 2 (0.9%) | 0 (0.0%) |
Time of Departure to Work by Sex in Lakeport
The most frequent times of departure to work in Lakeport are 6:30 AM to 6:59 AM (51, 22.7%) for males and 7:00 AM to 7:29 AM (45, 20.5%) for females.
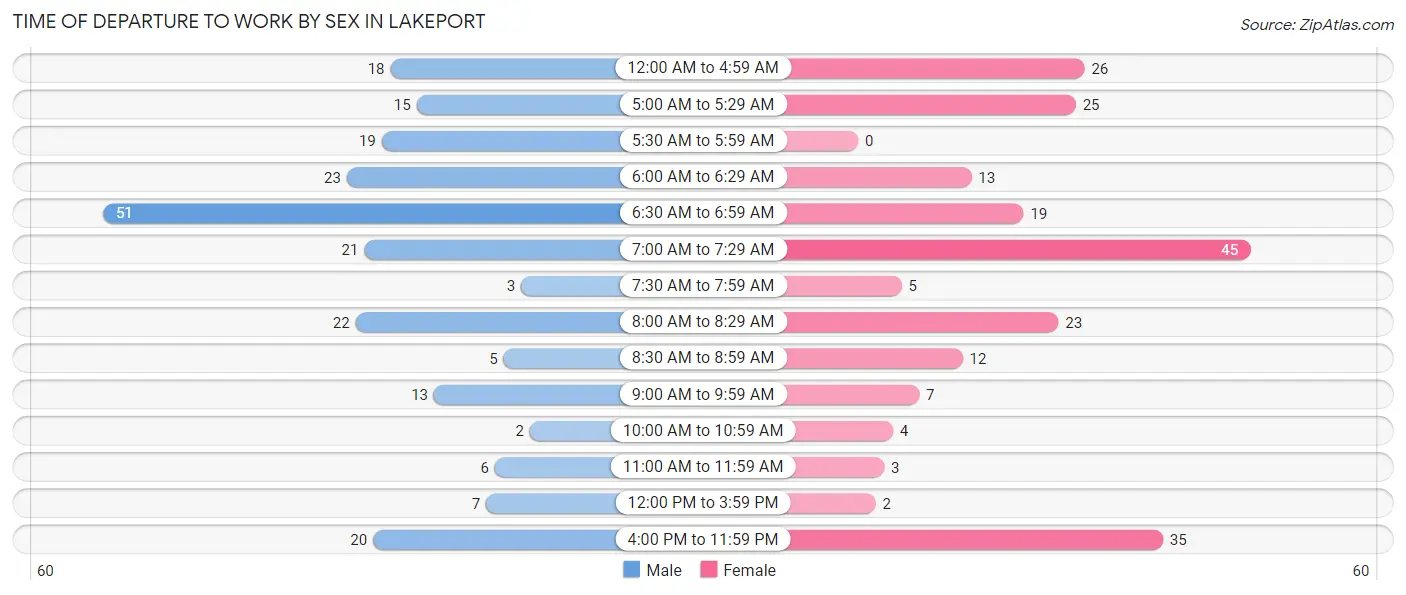
| Time of Departure | Male | Female |
| 12:00 AM to 4:59 AM | 18 (8.0%) | 26 (11.9%) |
| 5:00 AM to 5:29 AM | 15 (6.7%) | 25 (11.4%) |
| 5:30 AM to 5:59 AM | 19 (8.4%) | 0 (0.0%) |
| 6:00 AM to 6:29 AM | 23 (10.2%) | 13 (5.9%) |
| 6:30 AM to 6:59 AM | 51 (22.7%) | 19 (8.7%) |
| 7:00 AM to 7:29 AM | 21 (9.3%) | 45 (20.5%) |
| 7:30 AM to 7:59 AM | 3 (1.3%) | 5 (2.3%) |
| 8:00 AM to 8:29 AM | 22 (9.8%) | 23 (10.5%) |
| 8:30 AM to 8:59 AM | 5 (2.2%) | 12 (5.5%) |
| 9:00 AM to 9:59 AM | 13 (5.8%) | 7 (3.2%) |
| 10:00 AM to 10:59 AM | 2 (0.9%) | 4 (1.8%) |
| 11:00 AM to 11:59 AM | 6 (2.7%) | 3 (1.4%) |
| 12:00 PM to 3:59 PM | 7 (3.1%) | 2 (0.9%) |
| 4:00 PM to 11:59 PM | 20 (8.9%) | 35 (16.0%) |
| Total | 225 (100.0%) | 219 (100.0%) |
Housing Occupancy in Lakeport
Occupancy by Ownership in Lakeport
Of the total 374 dwellings in Lakeport, owner-occupied units account for 299 (79.9%), while renter-occupied units make up 75 (20.1%).
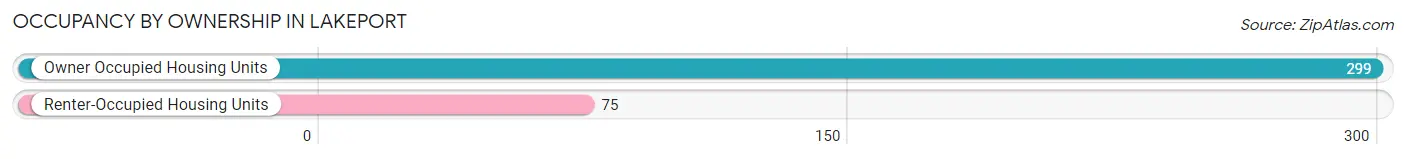
| Occupancy | # Housing Units | % Housing Units |
| Owner Occupied Housing Units | 299 | 79.9% |
| Renter-Occupied Housing Units | 75 | 20.1% |
| Total Occupied Housing Units | 374 | 100.0% |
Occupancy by Household Size in Lakeport
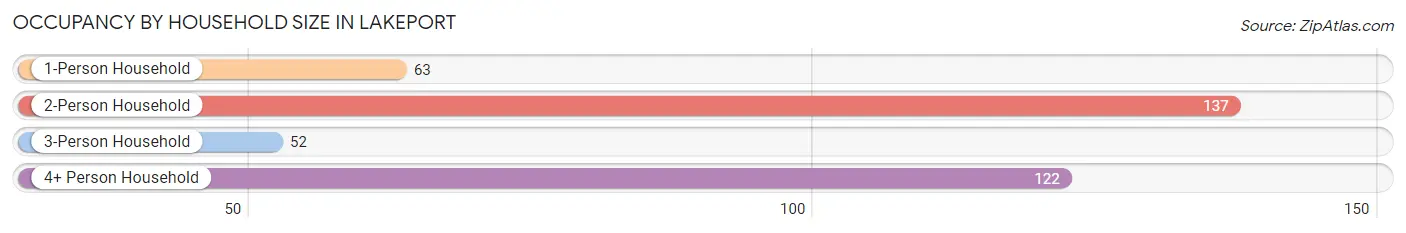
| Household Size | # Housing Units | % Housing Units |
| 1-Person Household | 63 | 16.8% |
| 2-Person Household | 137 | 36.6% |
| 3-Person Household | 52 | 13.9% |
| 4+ Person Household | 122 | 32.6% |
| Total Housing Units | 374 | 100.0% |
Occupancy by Ownership by Household Size in Lakeport
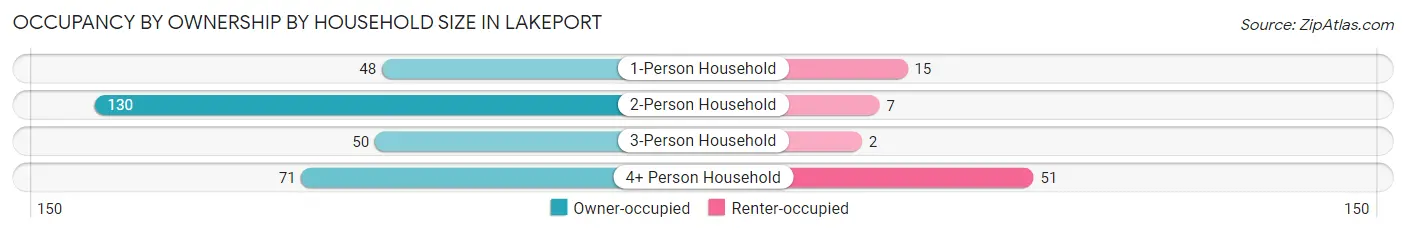
| Household Size | Owner-occupied | Renter-occupied |
| 1-Person Household | 48 (76.2%) | 15 (23.8%) |
| 2-Person Household | 130 (94.9%) | 7 (5.1%) |
| 3-Person Household | 50 (96.2%) | 2 (3.8%) |
| 4+ Person Household | 71 (58.2%) | 51 (41.8%) |
| Total Housing Units | 299 (79.9%) | 75 (20.1%) |
Occupancy by Educational Attainment in Lakeport
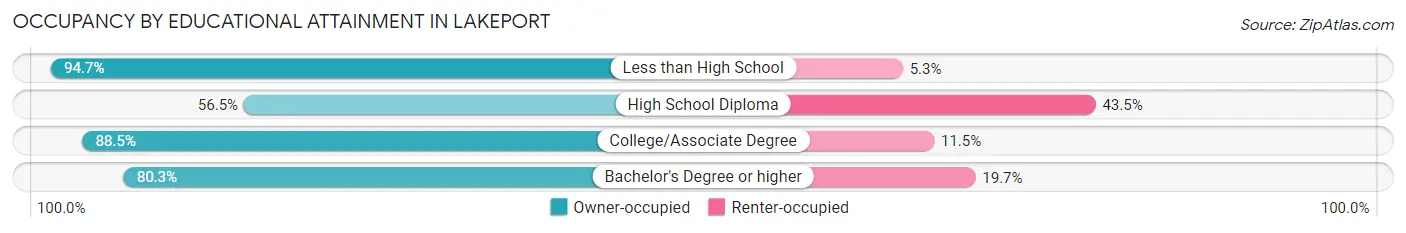
| Household Size | Owner-occupied | Renter-occupied |
| Less than High School | 36 (94.7%) | 2 (5.3%) |
| High School Diploma | 52 (56.5%) | 40 (43.5%) |
| College/Associate Degree | 162 (88.5%) | 21 (11.5%) |
| Bachelor's Degree or higher | 49 (80.3%) | 12 (19.7%) |
Occupancy by Age of Householder in Lakeport
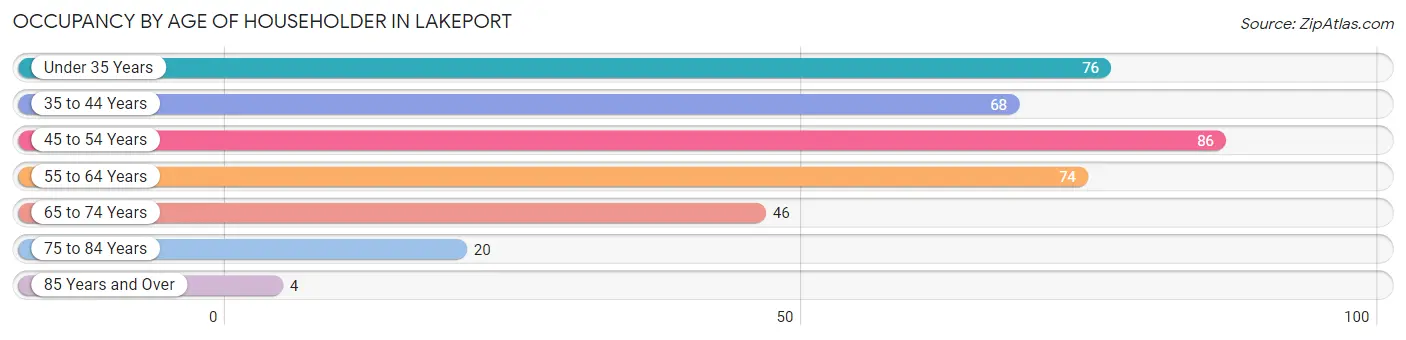
| Age Bracket | # Households | % Households |
| Under 35 Years | 76 | 20.3% |
| 35 to 44 Years | 68 | 18.2% |
| 45 to 54 Years | 86 | 23.0% |
| 55 to 64 Years | 74 | 19.8% |
| 65 to 74 Years | 46 | 12.3% |
| 75 to 84 Years | 20 | 5.3% |
| 85 Years and Over | 4 | 1.1% |
| Total | 374 | 100.0% |
Housing Finances in Lakeport
Median Income by Occupancy in Lakeport
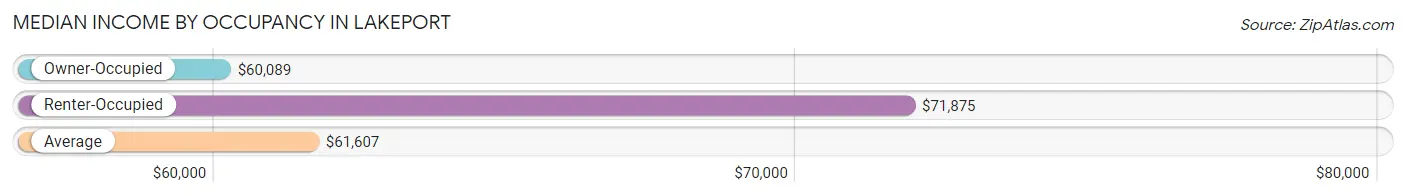
| Occupancy Type | # Households | Median Income |
| Owner-Occupied | 299 (79.9%) | $60,089 |
| Renter-Occupied | 75 (20.1%) | $71,875 |
| Average | 374 (100.0%) | $61,607 |
Occupancy by Householder Income Bracket in Lakeport
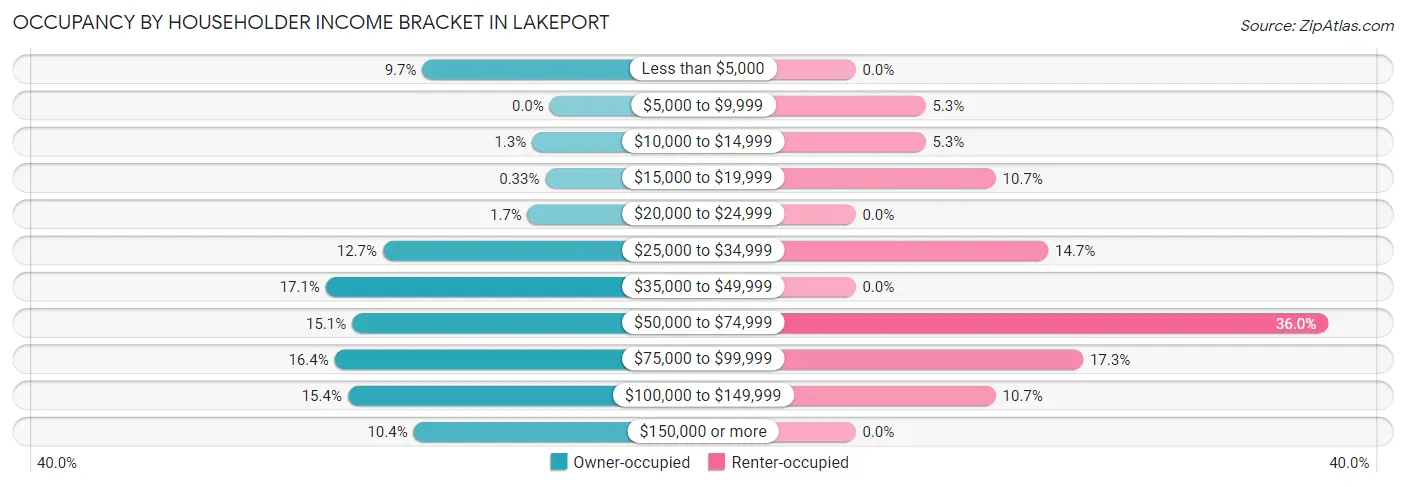
| Income Bracket | Owner-occupied | Renter-occupied |
| Less than $5,000 | 29 (9.7%) | 0 (0.0%) |
| $5,000 to $9,999 | 0 (0.0%) | 4 (5.3%) |
| $10,000 to $14,999 | 4 (1.3%) | 4 (5.3%) |
| $15,000 to $19,999 | 1 (0.3%) | 8 (10.7%) |
| $20,000 to $24,999 | 5 (1.7%) | 0 (0.0%) |
| $25,000 to $34,999 | 38 (12.7%) | 11 (14.7%) |
| $35,000 to $49,999 | 51 (17.1%) | 0 (0.0%) |
| $50,000 to $74,999 | 45 (15.0%) | 27 (36.0%) |
| $75,000 to $99,999 | 49 (16.4%) | 13 (17.3%) |
| $100,000 to $149,999 | 46 (15.4%) | 8 (10.7%) |
| $150,000 or more | 31 (10.4%) | 0 (0.0%) |
| Total | 299 (100.0%) | 75 (100.0%) |
Monthly Housing Cost Tiers in Lakeport
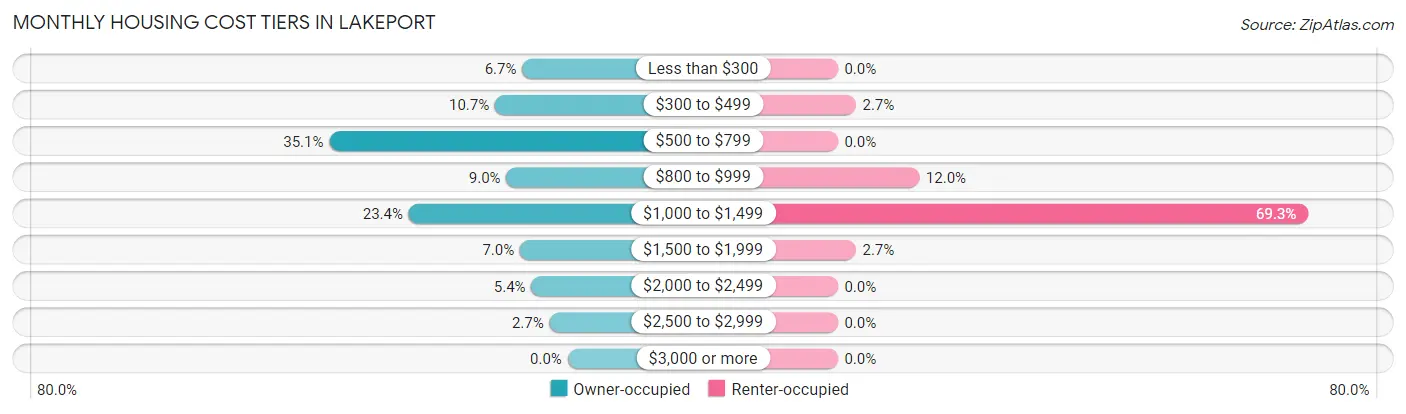
| Monthly Cost | Owner-occupied | Renter-occupied |
| Less than $300 | 20 (6.7%) | 0 (0.0%) |
| $300 to $499 | 32 (10.7%) | 2 (2.7%) |
| $500 to $799 | 105 (35.1%) | 0 (0.0%) |
| $800 to $999 | 27 (9.0%) | 9 (12.0%) |
| $1,000 to $1,499 | 70 (23.4%) | 52 (69.3%) |
| $1,500 to $1,999 | 21 (7.0%) | 2 (2.7%) |
| $2,000 to $2,499 | 16 (5.3%) | 0 (0.0%) |
| $2,500 to $2,999 | 8 (2.7%) | 0 (0.0%) |
| $3,000 or more | 0 (0.0%) | 0 (0.0%) |
| Total | 299 (100.0%) | 75 (100.0%) |
Physical Housing Characteristics in Lakeport
Housing Structures in Lakeport
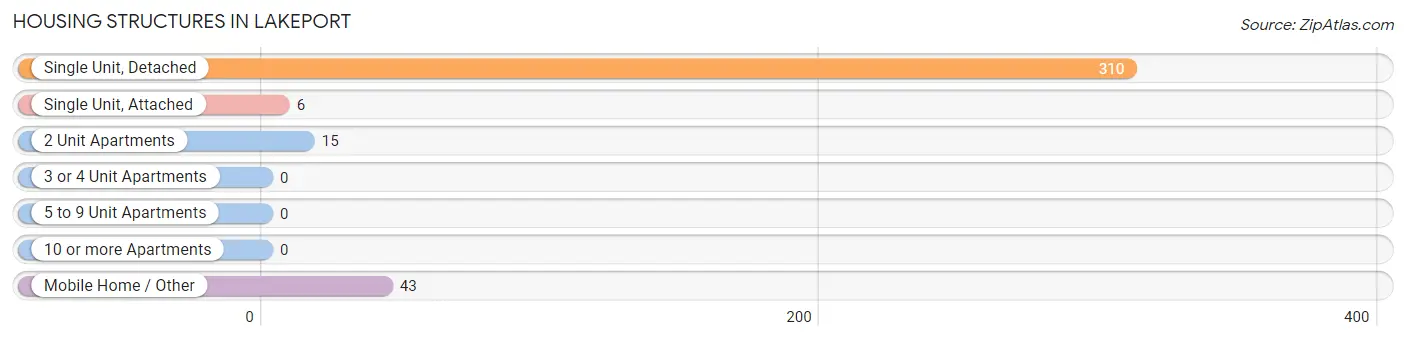
| Structure Type | # Housing Units | % Housing Units |
| Single Unit, Detached | 310 | 82.9% |
| Single Unit, Attached | 6 | 1.6% |
| 2 Unit Apartments | 15 | 4.0% |
| 3 or 4 Unit Apartments | 0 | 0.0% |
| 5 to 9 Unit Apartments | 0 | 0.0% |
| 10 or more Apartments | 0 | 0.0% |
| Mobile Home / Other | 43 | 11.5% |
| Total | 374 | 100.0% |
Housing Structures by Occupancy in Lakeport
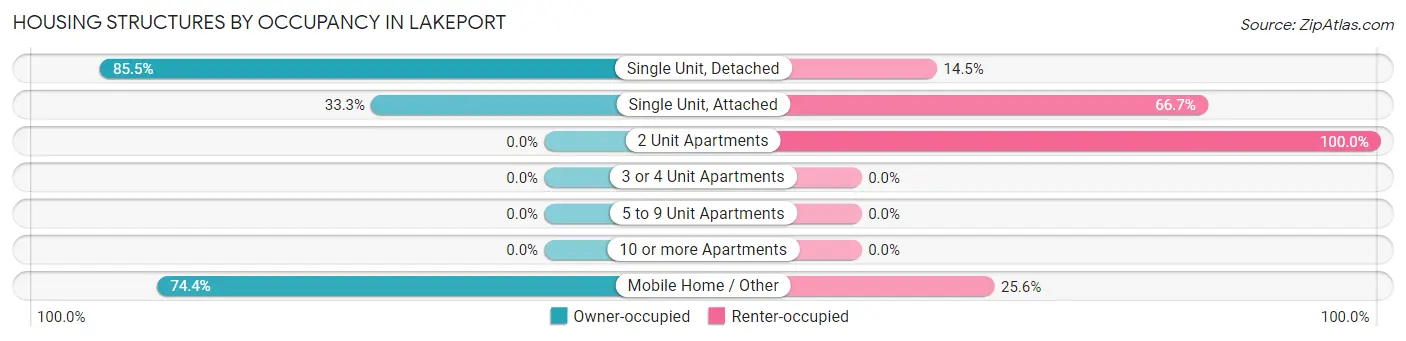
| Structure Type | Owner-occupied | Renter-occupied |
| Single Unit, Detached | 265 (85.5%) | 45 (14.5%) |
| Single Unit, Attached | 2 (33.3%) | 4 (66.7%) |
| 2 Unit Apartments | 0 (0.0%) | 15 (100.0%) |
| 3 or 4 Unit Apartments | 0 (0.0%) | 0 (0.0%) |
| 5 to 9 Unit Apartments | 0 (0.0%) | 0 (0.0%) |
| 10 or more Apartments | 0 (0.0%) | 0 (0.0%) |
| Mobile Home / Other | 32 (74.4%) | 11 (25.6%) |
| Total | 299 (79.9%) | 75 (20.1%) |
Housing Structures by Number of Rooms in Lakeport
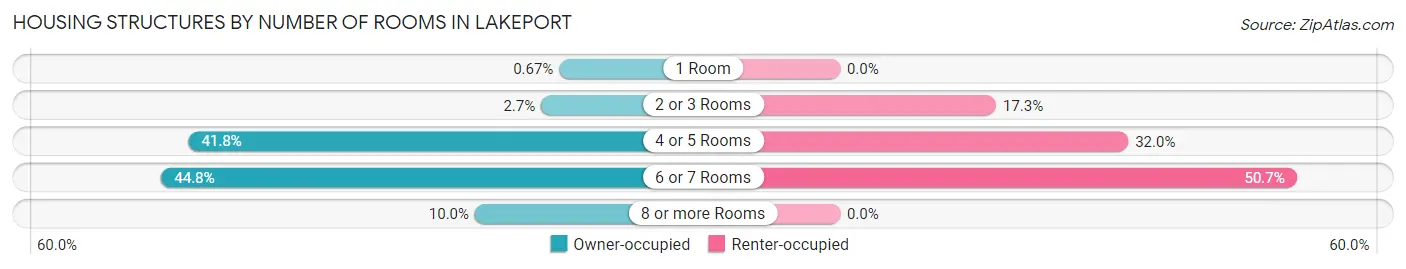
| Number of Rooms | Owner-occupied | Renter-occupied |
| 1 Room | 2 (0.7%) | 0 (0.0%) |
| 2 or 3 Rooms | 8 (2.7%) | 13 (17.3%) |
| 4 or 5 Rooms | 125 (41.8%) | 24 (32.0%) |
| 6 or 7 Rooms | 134 (44.8%) | 38 (50.7%) |
| 8 or more Rooms | 30 (10.0%) | 0 (0.0%) |
| Total | 299 (100.0%) | 75 (100.0%) |
Housing Structure by Heating Type in Lakeport
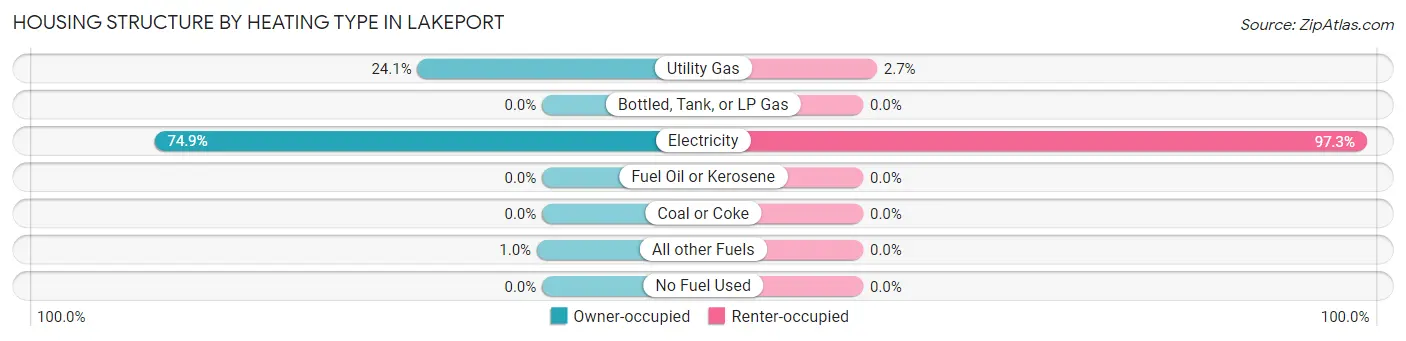
| Heating Type | Owner-occupied | Renter-occupied |
| Utility Gas | 72 (24.1%) | 2 (2.7%) |
| Bottled, Tank, or LP Gas | 0 (0.0%) | 0 (0.0%) |
| Electricity | 224 (74.9%) | 73 (97.3%) |
| Fuel Oil or Kerosene | 0 (0.0%) | 0 (0.0%) |
| Coal or Coke | 0 (0.0%) | 0 (0.0%) |
| All other Fuels | 3 (1.0%) | 0 (0.0%) |
| No Fuel Used | 0 (0.0%) | 0 (0.0%) |
| Total | 299 (100.0%) | 75 (100.0%) |
Household Vehicle Usage in Lakeport
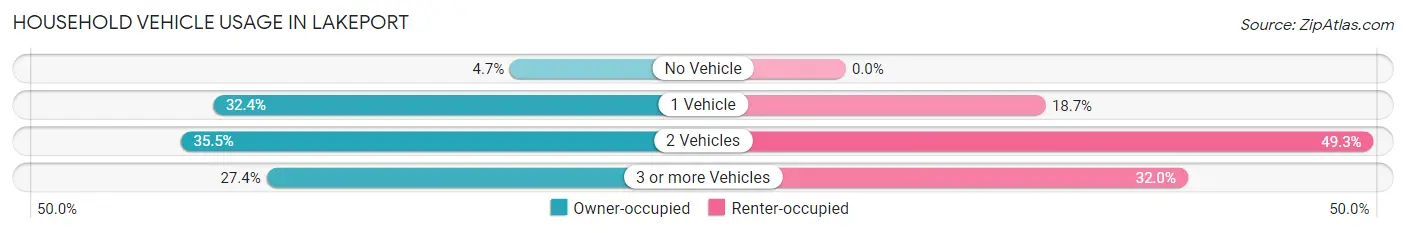
| Vehicles per Household | Owner-occupied | Renter-occupied |
| No Vehicle | 14 (4.7%) | 0 (0.0%) |
| 1 Vehicle | 97 (32.4%) | 14 (18.7%) |
| 2 Vehicles | 106 (35.4%) | 37 (49.3%) |
| 3 or more Vehicles | 82 (27.4%) | 24 (32.0%) |
| Total | 299 (100.0%) | 75 (100.0%) |
Real Estate & Mortgages in Lakeport
Real Estate and Mortgage Overview in Lakeport
| Characteristic | Without Mortgage | With Mortgage |
| Housing Units | 144 | 155 |
| Median Property Value | $108,500 | $124,700 |
| Median Household Income | $59,375 | $28 |
| Monthly Housing Costs | $541 | $0 |
| Real Estate Taxes | $1,828 | $0 |
Property Value by Mortgage Status in Lakeport
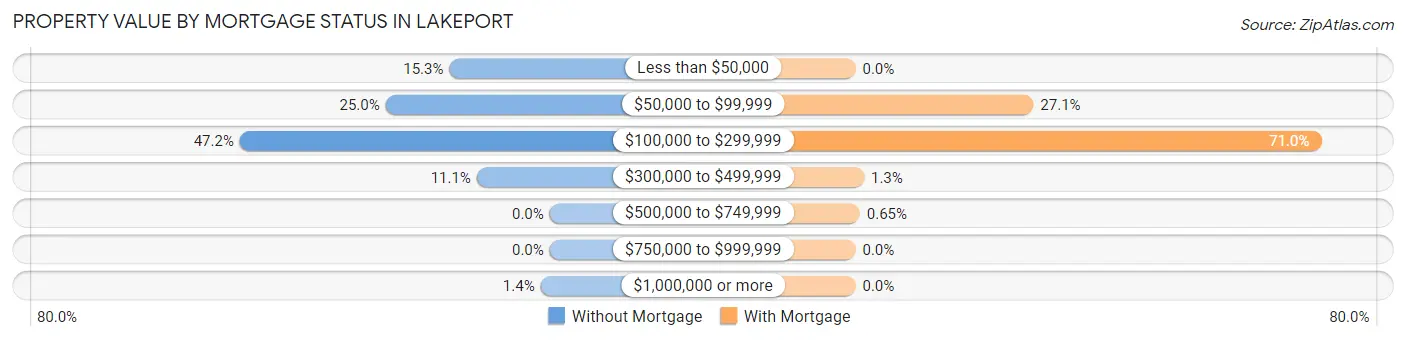
| Property Value | Without Mortgage | With Mortgage |
| Less than $50,000 | 22 (15.3%) | 0 (0.0%) |
| $50,000 to $99,999 | 36 (25.0%) | 42 (27.1%) |
| $100,000 to $299,999 | 68 (47.2%) | 110 (71.0%) |
| $300,000 to $499,999 | 16 (11.1%) | 2 (1.3%) |
| $500,000 to $749,999 | 0 (0.0%) | 1 (0.6%) |
| $750,000 to $999,999 | 0 (0.0%) | 0 (0.0%) |
| $1,000,000 or more | 2 (1.4%) | 0 (0.0%) |
| Total | 144 (100.0%) | 155 (100.0%) |
Household Income by Mortgage Status in Lakeport
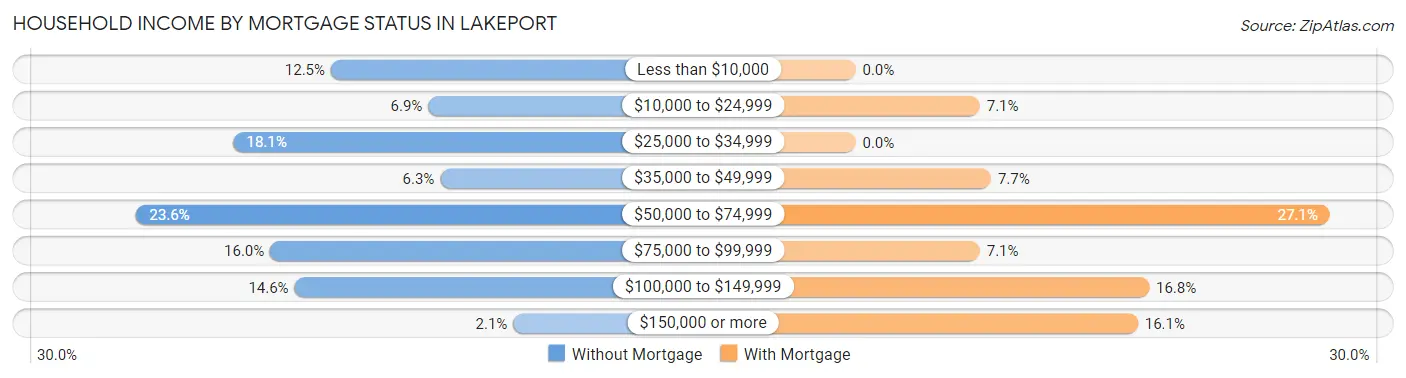
| Household Income | Without Mortgage | With Mortgage |
| Less than $10,000 | 18 (12.5%) | 0 (0.0%) |
| $10,000 to $24,999 | 10 (6.9%) | 11 (7.1%) |
| $25,000 to $34,999 | 26 (18.1%) | 0 (0.0%) |
| $35,000 to $49,999 | 9 (6.2%) | 12 (7.7%) |
| $50,000 to $74,999 | 34 (23.6%) | 42 (27.1%) |
| $75,000 to $99,999 | 23 (16.0%) | 11 (7.1%) |
| $100,000 to $149,999 | 21 (14.6%) | 26 (16.8%) |
| $150,000 or more | 3 (2.1%) | 25 (16.1%) |
| Total | 144 (100.0%) | 155 (100.0%) |
Property Value to Household Income Ratio in Lakeport
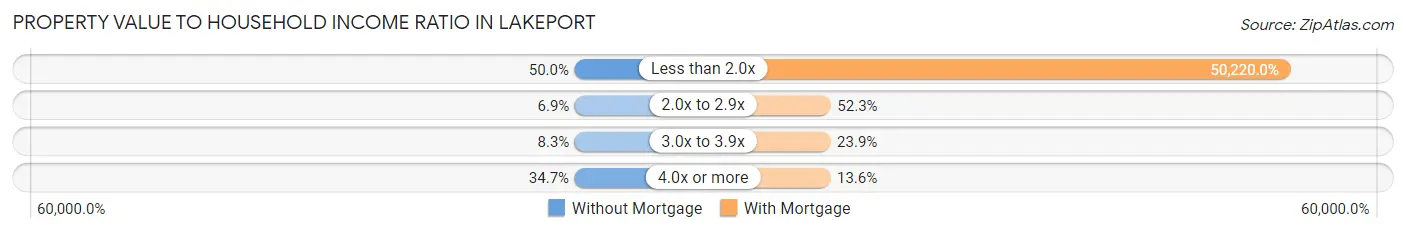
| Value-to-Income Ratio | Without Mortgage | With Mortgage |
| Less than 2.0x | 72 (50.0%) | 77,841 (50,220.0%) |
| 2.0x to 2.9x | 10 (6.9%) | 81 (52.3%) |
| 3.0x to 3.9x | 12 (8.3%) | 37 (23.9%) |
| 4.0x or more | 50 (34.7%) | 21 (13.6%) |
| Total | 144 (100.0%) | 155 (100.0%) |
Real Estate Taxes by Mortgage Status in Lakeport
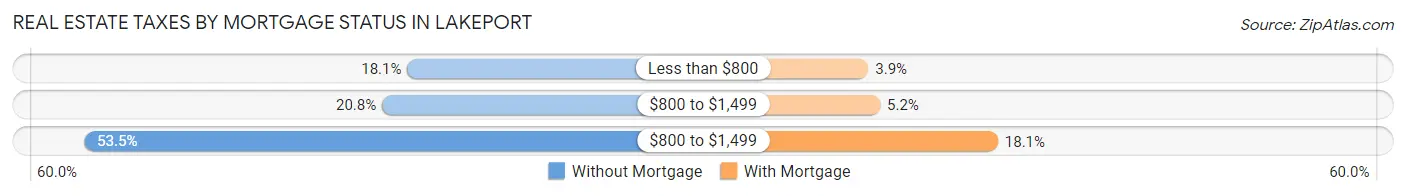
| Property Taxes | Without Mortgage | With Mortgage |
| Less than $800 | 26 (18.1%) | 6 (3.9%) |
| $800 to $1,499 | 30 (20.8%) | 8 (5.2%) |
| $800 to $1,499 | 77 (53.5%) | 28 (18.1%) |
| Total | 144 (100.0%) | 155 (100.0%) |
Health & Disability in Lakeport
Health Insurance Coverage by Age in Lakeport
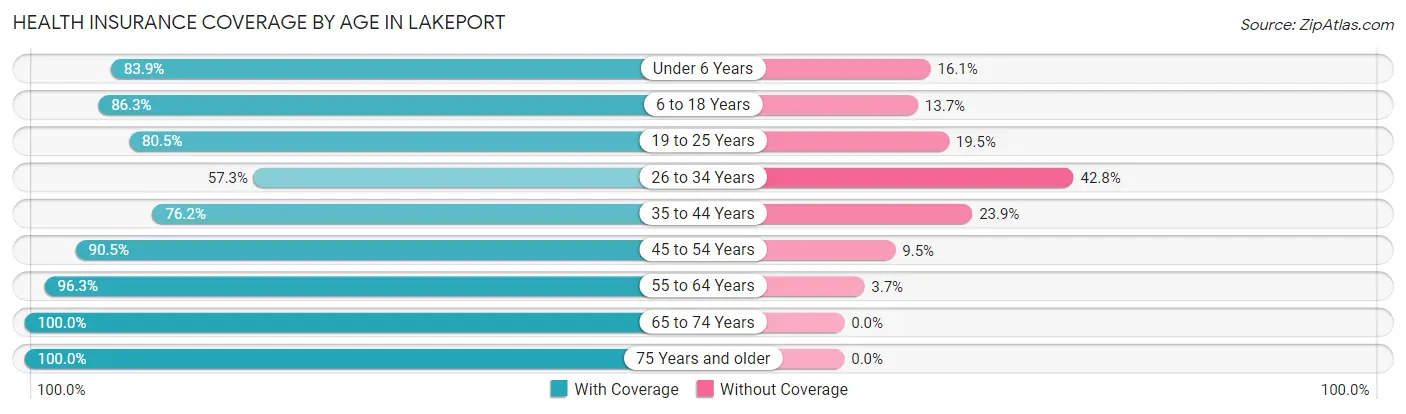
| Age Bracket | With Coverage | Without Coverage |
| Under 6 Years | 99 (83.9%) | 19 (16.1%) |
| 6 to 18 Years | 245 (86.3%) | 39 (13.7%) |
| 19 to 25 Years | 62 (80.5%) | 15 (19.5%) |
| 26 to 34 Years | 79 (57.3%) | 59 (42.7%) |
| 35 to 44 Years | 99 (76.1%) | 31 (23.8%) |
| 45 to 54 Years | 114 (90.5%) | 12 (9.5%) |
| 55 to 64 Years | 103 (96.3%) | 4 (3.7%) |
| 65 to 74 Years | 74 (100.0%) | 0 (0.0%) |
| 75 Years and older | 39 (100.0%) | 0 (0.0%) |
| Total | 914 (83.6%) | 179 (16.4%) |
Health Insurance Coverage by Citizenship Status in Lakeport

| Citizenship Status | With Coverage | Without Coverage |
| Native Born | 99 (83.9%) | 19 (16.1%) |
| Foreign Born, Citizen | 245 (86.3%) | 39 (13.7%) |
| Foreign Born, not a Citizen | 62 (80.5%) | 15 (19.5%) |
Health Insurance Coverage by Household Income in Lakeport
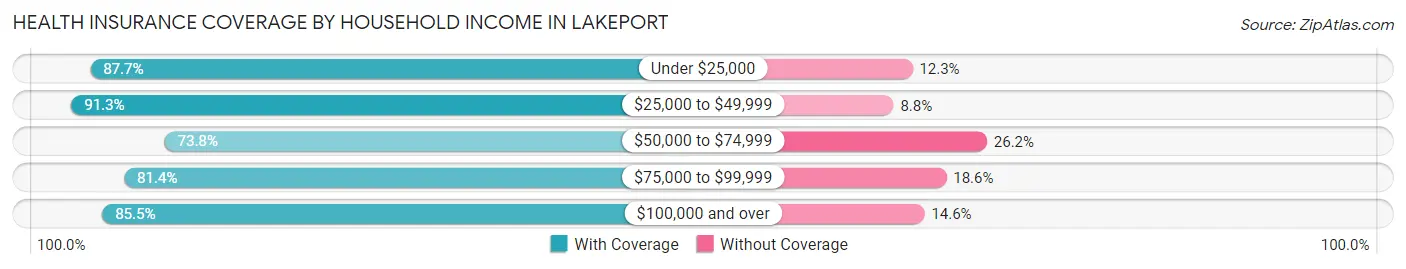
| Household Income | With Coverage | Without Coverage |
| Under $25,000 | 107 (87.7%) | 15 (12.3%) |
| $25,000 to $49,999 | 240 (91.2%) | 23 (8.7%) |
| $50,000 to $74,999 | 194 (73.8%) | 69 (26.2%) |
| $75,000 to $99,999 | 144 (81.4%) | 33 (18.6%) |
| $100,000 and over | 229 (85.5%) | 39 (14.5%) |
Public vs Private Health Insurance Coverage by Age in Lakeport
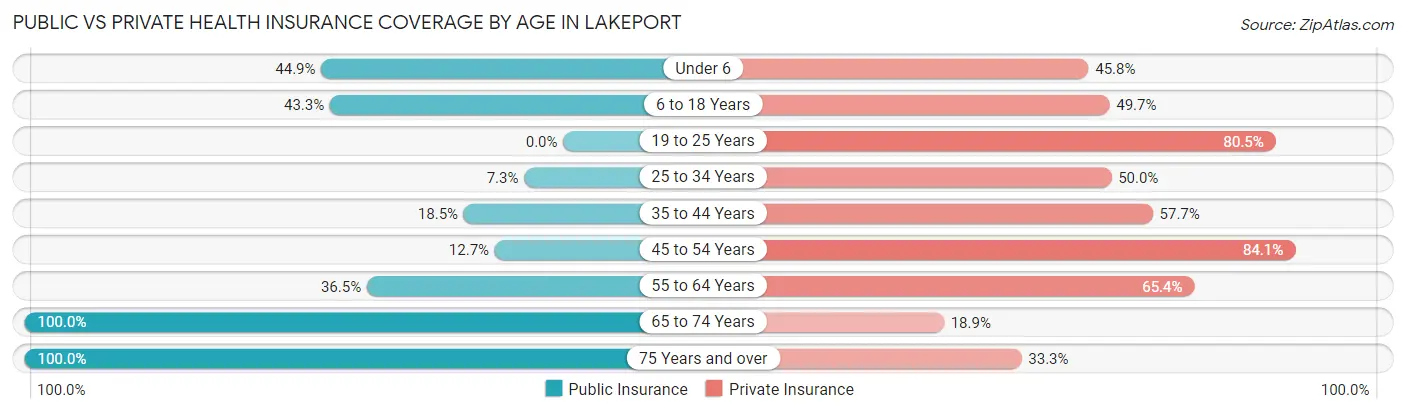
| Age Bracket | Public Insurance | Private Insurance |
| Under 6 | 53 (44.9%) | 54 (45.8%) |
| 6 to 18 Years | 123 (43.3%) | 141 (49.6%) |
| 19 to 25 Years | 0 (0.0%) | 62 (80.5%) |
| 25 to 34 Years | 10 (7.2%) | 69 (50.0%) |
| 35 to 44 Years | 24 (18.5%) | 75 (57.7%) |
| 45 to 54 Years | 16 (12.7%) | 106 (84.1%) |
| 55 to 64 Years | 39 (36.4%) | 70 (65.4%) |
| 65 to 74 Years | 74 (100.0%) | 14 (18.9%) |
| 75 Years and over | 39 (100.0%) | 13 (33.3%) |
| Total | 378 (34.6%) | 604 (55.3%) |
Disability Status by Sex by Age in Lakeport
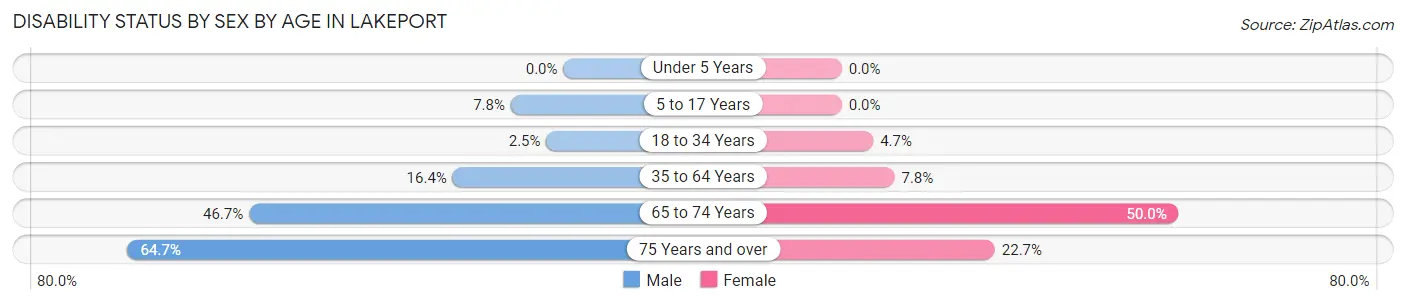
| Age Bracket | Male | Female |
| Under 5 Years | 0 (0.0%) | 0 (0.0%) |
| 5 to 17 Years | 15 (7.8%) | 0 (0.0%) |
| 18 to 34 Years | 3 (2.5%) | 5 (4.7%) |
| 35 to 64 Years | 24 (16.4%) | 17 (7.8%) |
| 65 to 74 Years | 14 (46.7%) | 22 (50.0%) |
| 75 Years and over | 11 (64.7%) | 5 (22.7%) |
Disability Class by Sex by Age in Lakeport
Disability Class: Hearing Difficulty
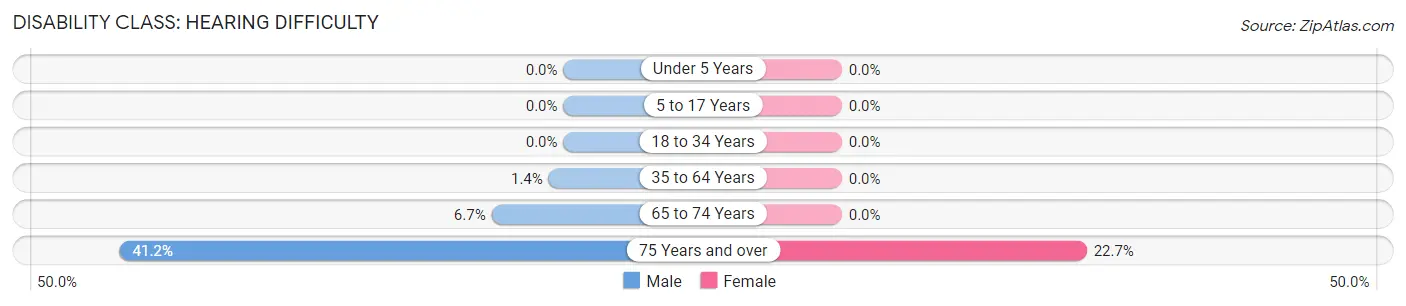
| Age Bracket | Male | Female |
| Under 5 Years | 0 (0.0%) | 0 (0.0%) |
| 5 to 17 Years | 0 (0.0%) | 0 (0.0%) |
| 18 to 34 Years | 0 (0.0%) | 0 (0.0%) |
| 35 to 64 Years | 2 (1.4%) | 0 (0.0%) |
| 65 to 74 Years | 2 (6.7%) | 0 (0.0%) |
| 75 Years and over | 7 (41.2%) | 5 (22.7%) |
Disability Class: Vision Difficulty
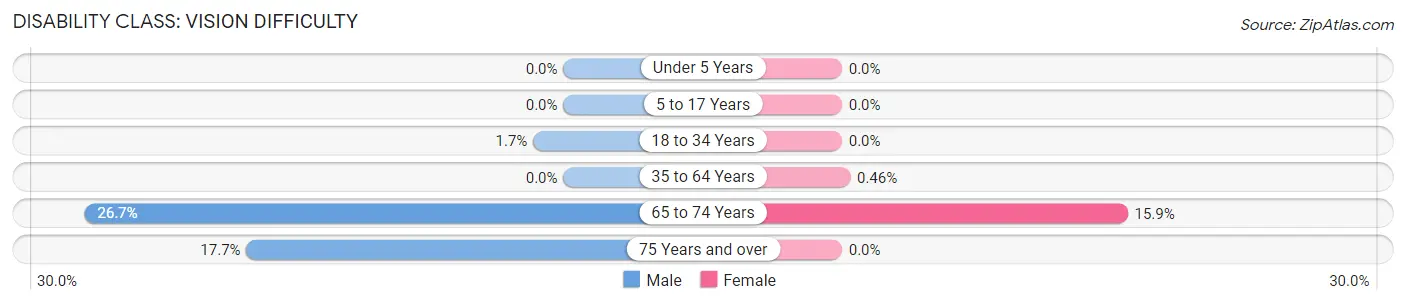
| Age Bracket | Male | Female |
| Under 5 Years | 0 (0.0%) | 0 (0.0%) |
| 5 to 17 Years | 0 (0.0%) | 0 (0.0%) |
| 18 to 34 Years | 2 (1.7%) | 0 (0.0%) |
| 35 to 64 Years | 0 (0.0%) | 1 (0.5%) |
| 65 to 74 Years | 8 (26.7%) | 7 (15.9%) |
| 75 Years and over | 3 (17.6%) | 0 (0.0%) |
Disability Class: Cognitive Difficulty
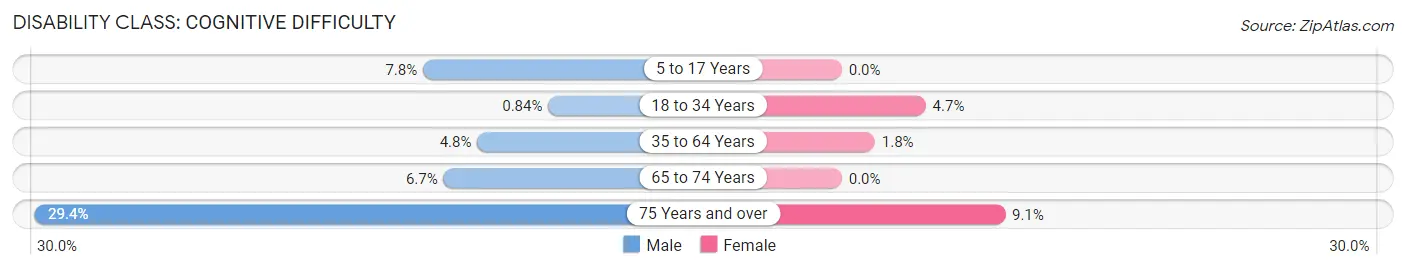
| Age Bracket | Male | Female |
| 5 to 17 Years | 15 (7.8%) | 0 (0.0%) |
| 18 to 34 Years | 1 (0.8%) | 5 (4.7%) |
| 35 to 64 Years | 7 (4.8%) | 4 (1.8%) |
| 65 to 74 Years | 2 (6.7%) | 0 (0.0%) |
| 75 Years and over | 5 (29.4%) | 2 (9.1%) |
Disability Class: Ambulatory Difficulty
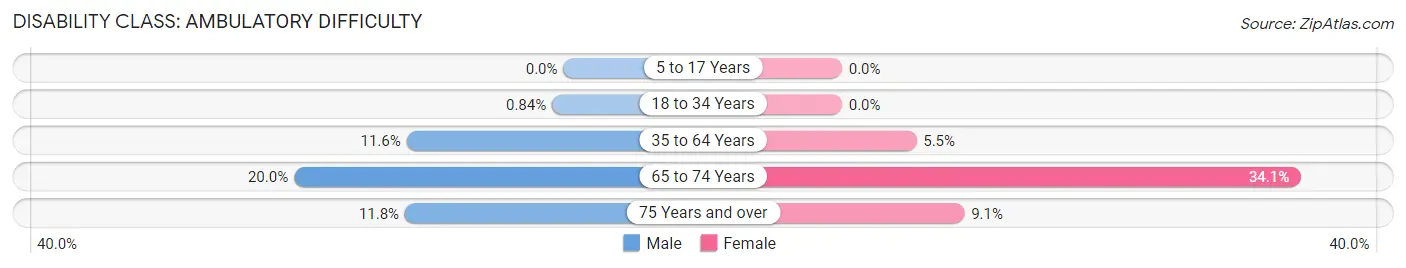
| Age Bracket | Male | Female |
| 5 to 17 Years | 0 (0.0%) | 0 (0.0%) |
| 18 to 34 Years | 1 (0.8%) | 0 (0.0%) |
| 35 to 64 Years | 17 (11.6%) | 12 (5.5%) |
| 65 to 74 Years | 6 (20.0%) | 15 (34.1%) |
| 75 Years and over | 2 (11.8%) | 2 (9.1%) |
Disability Class: Self-Care Difficulty
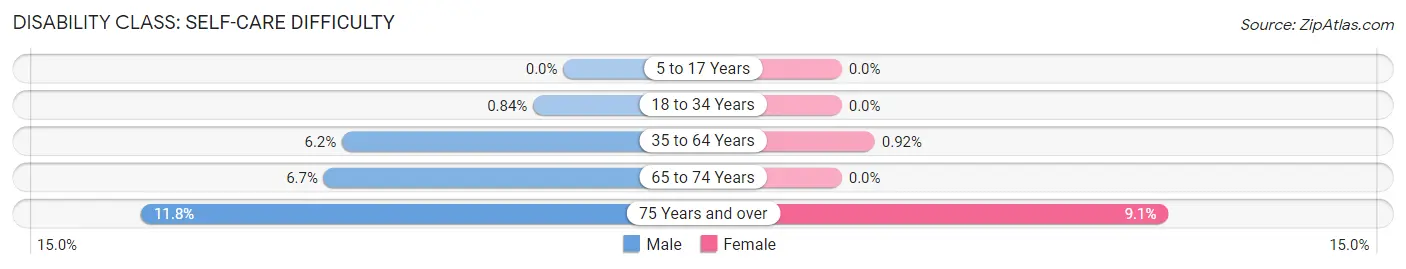
| Age Bracket | Male | Female |
| 5 to 17 Years | 0 (0.0%) | 0 (0.0%) |
| 18 to 34 Years | 1 (0.8%) | 0 (0.0%) |
| 35 to 64 Years | 9 (6.2%) | 2 (0.9%) |
| 65 to 74 Years | 2 (6.7%) | 0 (0.0%) |
| 75 Years and over | 2 (11.8%) | 2 (9.1%) |
Technology Access in Lakeport
Computing Device Access in Lakeport
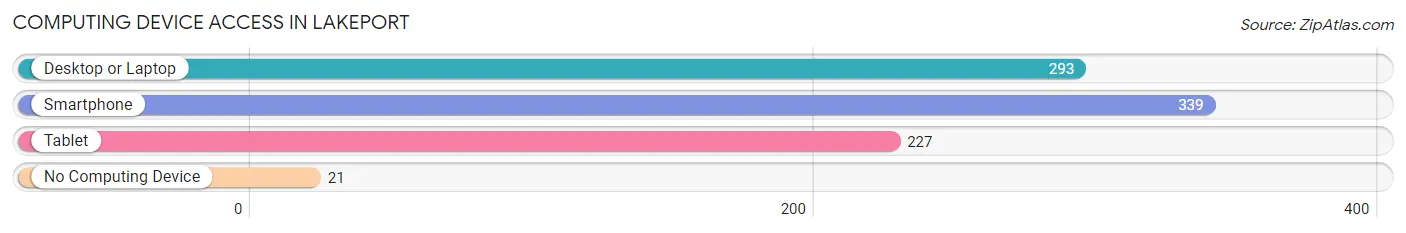
| Device Type | # Households | % Households |
| Desktop or Laptop | 293 | 78.3% |
| Smartphone | 339 | 90.6% |
| Tablet | 227 | 60.7% |
| No Computing Device | 21 | 5.6% |
| Total | 374 | 100.0% |
Internet Access in Lakeport
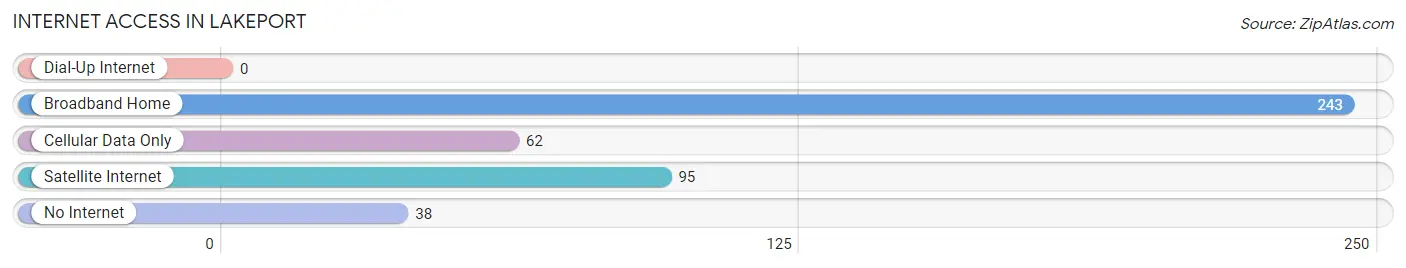
| Internet Type | # Households | % Households |
| Dial-Up Internet | 0 | 0.0% |
| Broadband Home | 243 | 65.0% |
| Cellular Data Only | 62 | 16.6% |
| Satellite Internet | 95 | 25.4% |
| No Internet | 38 | 10.2% |
| Total | 374 | 100.0% |
Lakeport Summary
Lakeport is a small town located in Harrison County, Texas, United States. It is situated on the western shore of Lake O' the Pines, a large reservoir on the Sulphur River. The town was founded in the late 19th century and has a population of approximately 500 people.
History
The area around Lakeport was first settled in the late 19th century by settlers from the nearby town of Marshall. The town was originally known as "Lakeport Landing" and was a popular spot for steamboat traffic. In 1891, the town was officially incorporated and renamed Lakeport.
The town grew steadily throughout the early 20th century, and by the 1950s, it had become a popular tourist destination. The town was home to several resorts, including the Lakeport Inn, which was a popular spot for fishing and boating.
In the late 1960s, the town began to decline as the popularity of the lake began to wane. The resorts closed and the population began to decline. In the 1980s, the town was revitalized with the construction of a new marina and the opening of a new restaurant.
Geography
Lakeport is located in Harrison County, Texas, on the western shore of Lake O' the Pines. The town is situated on the banks of the Sulphur River, which flows into the lake. The town is surrounded by rolling hills and forests, and is located approximately 30 miles east of Marshall, Texas.
The climate in Lakeport is humid subtropical, with hot summers and mild winters. The average annual temperature is around 70 degrees Fahrenheit, and the average annual precipitation is around 40 inches.
Economy
The economy of Lakeport is largely based on tourism and recreation. The town is home to several resorts and marinas, which attract visitors from all over the region. The town is also home to several restaurants and bars, which cater to both locals and visitors.
The town is also home to several small businesses, including a grocery store, a hardware store, and a gas station. The town is also home to a post office and a library.
Demographics
As of the 2010 census, the population of Lakeport was 498. The racial makeup of the town was 97.2% White, 0.2% African American, 0.4% Native American, 0.2% Asian, 0.2% from other races, and 1.9% from two or more races. Hispanic or Latino of any race were 1.2% of the population.
The median income for a household in the town was $31,250, and the median income for a family was $37,500. The per capita income for the town was $17,845. About 11.2% of families and 14.2% of the population were below the poverty line, including 18.2% of those under age 18 and 8.3% of those age 65 or over.
Common Questions
What is Per Capita Income in Lakeport?
Per Capita income in Lakeport is $23,755.
What is the Median Family Income in Lakeport?
Median Family Income in Lakeport is $57,708.
What is the Median Household income in Lakeport?
Median Household Income in Lakeport is $61,607.
What is Income or Wage Gap in Lakeport?
Income or Wage Gap in Lakeport is 6.1%.
Women in Lakeport earn 93.9 cents for every dollar earned by a man.
What is Inequality or Gini Index in Lakeport?
Inequality or Gini Index in Lakeport is 0.39.
What is the Total Population of Lakeport?
Total Population of Lakeport is 1,097.
What is the Total Male Population of Lakeport?
Total Male Population of Lakeport is 552.
What is the Total Female Population of Lakeport?
Total Female Population of Lakeport is 545.
What is the Ratio of Males per 100 Females in Lakeport?
There are 101.28 Males per 100 Females in Lakeport.
What is the Ratio of Females per 100 Males in Lakeport?
There are 98.73 Females per 100 Males in Lakeport.
What is the Median Population Age in Lakeport?
Median Population Age in Lakeport is 30.1 Years.
What is the Average Family Size in Lakeport
Average Family Size in Lakeport is 3.3 People.
What is the Average Household Size in Lakeport
Average Household Size in Lakeport is 2.9 People.
How Large is the Labor Force in Lakeport?
There are 494 People in the Labor Forcein in Lakeport.
What is the Percentage of People in the Labor Force in Lakeport?
64.5% of People are in the Labor Force in Lakeport.
What is the Unemployment Rate in Lakeport?
Unemployment Rate in Lakeport is 2.4%.