Grape Creek, TX Map & Demographics
Grape Creek Map
Grape Creek Overview
$22,704
PER CAPITA INCOME
$64,100
AVG FAMILY INCOME
$49,191
AVG HOUSEHOLD INCOME
0.6%
WAGE / INCOME GAP [ % ]
99.4¢/ $1
WAGE / INCOME GAP [ $ ]
$11,015
FAMILY INCOME DEFICIT
0.42
INEQUALITY / GINI INDEX
4,391
TOTAL POPULATION
2,194
MALE POPULATION
2,197
FEMALE POPULATION
99.86
MALES / 100 FEMALES
100.14
FEMALES / 100 MALES
33.6
MEDIAN AGE
3.7
AVG FAMILY SIZE
3.0
AVG HOUSEHOLD SIZE
1,854
LABOR FORCE [ PEOPLE ]
61.3%
PERCENT IN LABOR FORCE
1.3%
UNEMPLOYMENT RATE
Grape Creek Area Codes
Income in Grape Creek
Income Overview in Grape Creek
Per Capita Income in Grape Creek is $22,704, while median incomes of families and households are $64,100 and $49,191 respectively.
| Characteristic | Number | Measure |
| Per Capita Income | 4,391 | $22,704 |
| Median Family Income | 1,034 | $64,100 |
| Mean Family Income | 1,034 | $70,297 |
| Median Household Income | 1,467 | $49,191 |
| Mean Household Income | 1,467 | $65,602 |
| Income Deficit | 1,034 | $11,015 |
| Wage / Income Gap (%) | 4,391 | 0.60% |
| Wage / Income Gap ($) | 4,391 | 99.40¢ per $1 |
| Gini / Inequality Index | 4,391 | 0.42 |
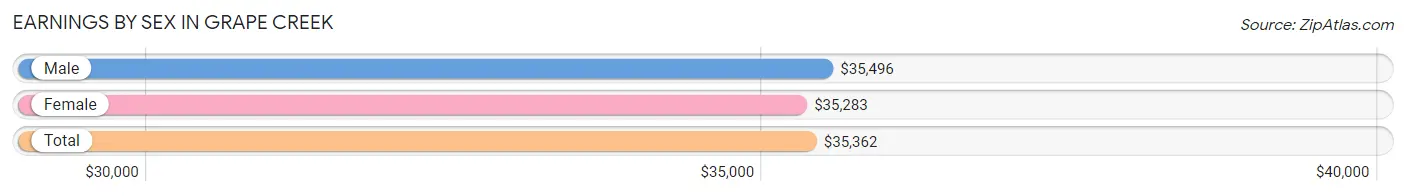
Earnings by Sex in Grape Creek
Average Earnings in Grape Creek are $35,362, $35,496 for men and $35,283 for women, a difference of 0.6%.
| Sex | Number | Average Earnings |
| Male | 997 (50.6%) | $35,496 |
| Female | 974 (49.4%) | $35,283 |
| Total | 1,971 (100.0%) | $35,362 |
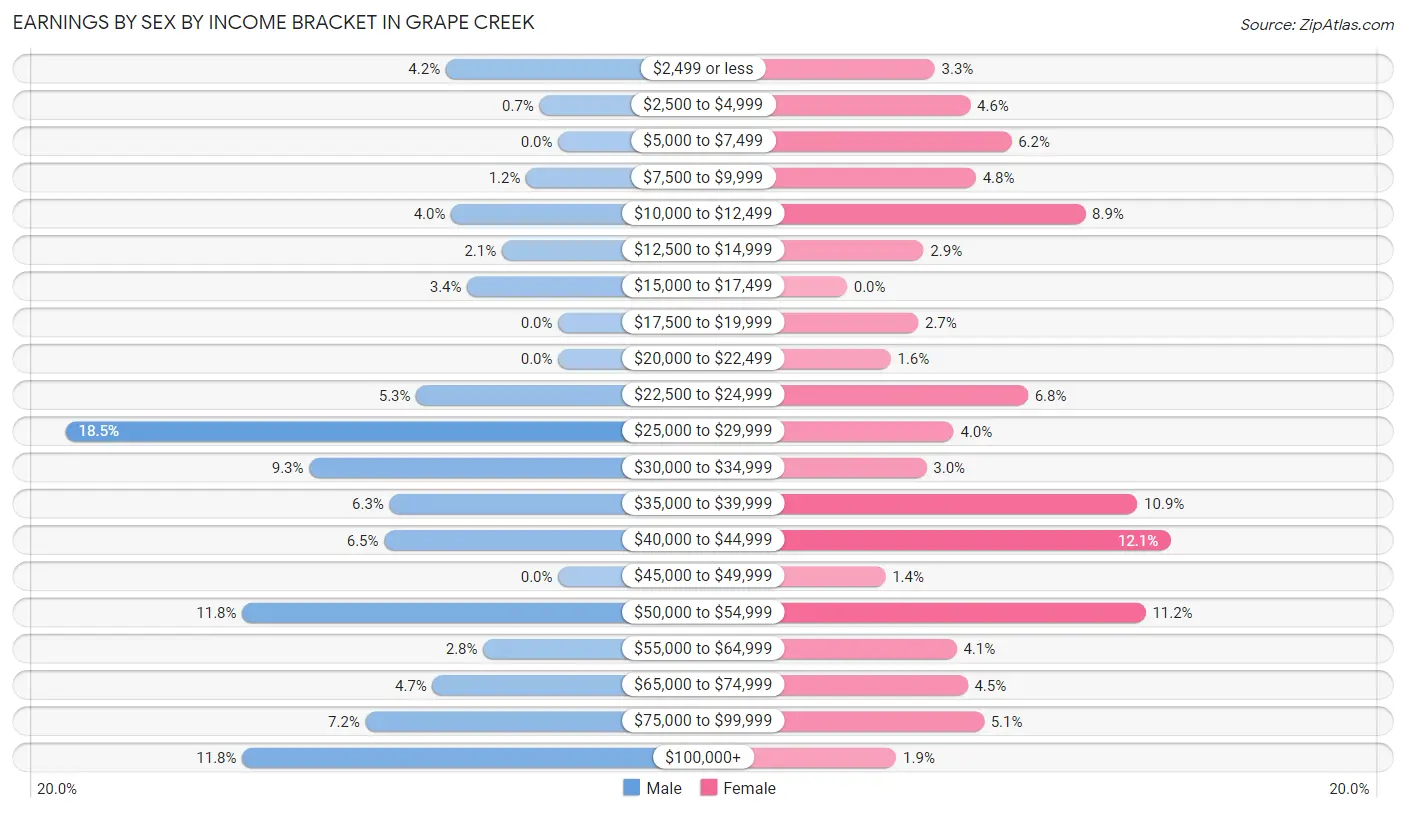
Earnings by Sex by Income Bracket in Grape Creek
The most common earnings brackets in Grape Creek are $25,000 to $29,999 for men (184 | 18.5%) and $40,000 to $44,999 for women (118 | 12.1%).
| Income | Male | Female |
| $2,499 or less | 42 (4.2%) | 32 (3.3%) |
| $2,500 to $4,999 | 7 (0.7%) | 45 (4.6%) |
| $5,000 to $7,499 | 0 (0.0%) | 60 (6.2%) |
| $7,500 to $9,999 | 12 (1.2%) | 47 (4.8%) |
| $10,000 to $12,499 | 40 (4.0%) | 87 (8.9%) |
| $12,500 to $14,999 | 21 (2.1%) | 28 (2.9%) |
| $15,000 to $17,499 | 34 (3.4%) | 0 (0.0%) |
| $17,500 to $19,999 | 0 (0.0%) | 26 (2.7%) |
| $20,000 to $22,499 | 0 (0.0%) | 16 (1.6%) |
| $22,500 to $24,999 | 53 (5.3%) | 66 (6.8%) |
| $25,000 to $29,999 | 184 (18.5%) | 39 (4.0%) |
| $30,000 to $34,999 | 93 (9.3%) | 29 (3.0%) |
| $35,000 to $39,999 | 63 (6.3%) | 106 (10.9%) |
| $40,000 to $44,999 | 65 (6.5%) | 118 (12.1%) |
| $45,000 to $49,999 | 0 (0.0%) | 14 (1.4%) |
| $50,000 to $54,999 | 118 (11.8%) | 109 (11.2%) |
| $55,000 to $64,999 | 28 (2.8%) | 40 (4.1%) |
| $65,000 to $74,999 | 47 (4.7%) | 44 (4.5%) |
| $75,000 to $99,999 | 72 (7.2%) | 50 (5.1%) |
| $100,000+ | 118 (11.8%) | 18 (1.8%) |
| Total | 997 (100.0%) | 974 (100.0%) |
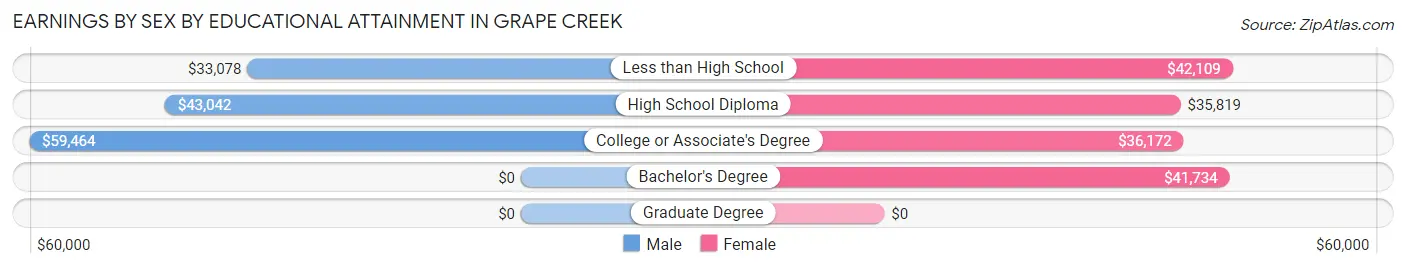
Earnings by Sex by Educational Attainment in Grape Creek
Average earnings in Grape Creek are $36,008 for men and $36,769 for women, a difference of 2.1%. Men with an educational attainment of college or associate's degree enjoy the highest average annual earnings of $59,464, while those with less than high school education earn the least with $33,078. Women with an educational attainment of less than high school earn the most with the average annual earnings of $42,109, while those with high school diploma education have the smallest earnings of $35,819.
| Educational Attainment | Male Income | Female Income |
| Less than High School | $33,078 | $42,109 |
| High School Diploma | $43,042 | $35,819 |
| College or Associate's Degree | $59,464 | $36,172 |
| Bachelor's Degree | - | - |
| Graduate Degree | - | - |
| Total | $36,008 | $36,769 |
Family Income in Grape Creek
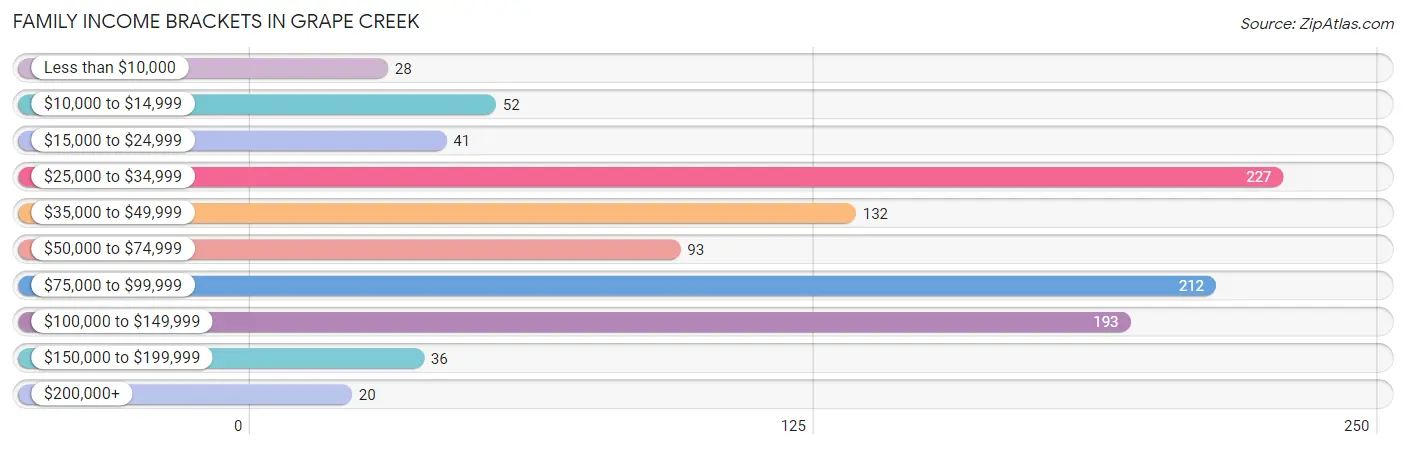
Family Income Brackets in Grape Creek
According to the Grape Creek family income data, there are 227 families falling into the $25,000 to $34,999 income range, which is the most common income bracket and makes up 22.0% of all families. Conversely, the $200,000+ income bracket is the least frequent group with only 20 families (1.9%) belonging to this category.
| Income Bracket | # Families | % Families |
| Less than $10,000 | 28 | 2.7% |
| $10,000 to $14,999 | 52 | 5.0% |
| $15,000 to $24,999 | 41 | 4.0% |
| $25,000 to $34,999 | 227 | 22.0% |
| $35,000 to $49,999 | 132 | 12.8% |
| $50,000 to $74,999 | 93 | 9.0% |
| $75,000 to $99,999 | 212 | 20.5% |
| $100,000 to $149,999 | 193 | 18.7% |
| $150,000 to $199,999 | 36 | 3.5% |
| $200,000+ | 20 | 1.9% |
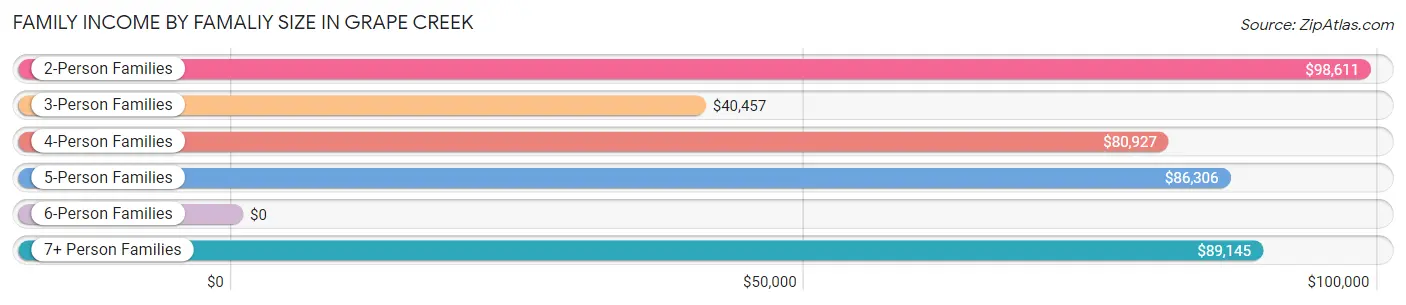
Family Income by Famaliy Size in Grape Creek
2-person families (362 | 35.0%) account for the highest median family income in Grape Creek with $98,611 per family, while 2-person families (362 | 35.0%) have the highest median income of $49,306 per family member.
| Income Bracket | # Families | Median Income |
| 2-Person Families | 362 (35.0%) | $98,611 |
| 3-Person Families | 273 (26.4%) | $40,457 |
| 4-Person Families | 115 (11.1%) | $80,927 |
| 5-Person Families | 111 (10.7%) | $86,306 |
| 6-Person Families | 122 (11.8%) | $0 |
| 7+ Person Families | 51 (4.9%) | $89,145 |
| Total | 1,034 (100.0%) | $64,100 |
Family Income by Number of Earners in Grape Creek
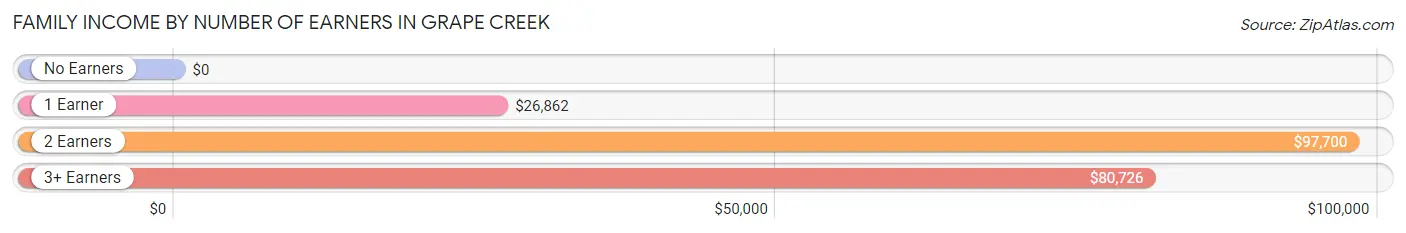
| Number of Earners | # Families | Median Income |
| No Earners | 96 (9.3%) | $0 |
| 1 Earner | 426 (41.2%) | $26,862 |
| 2 Earners | 430 (41.6%) | $97,700 |
| 3+ Earners | 82 (7.9%) | $80,726 |
| Total | 1,034 (100.0%) | $64,100 |
Household Income in Grape Creek
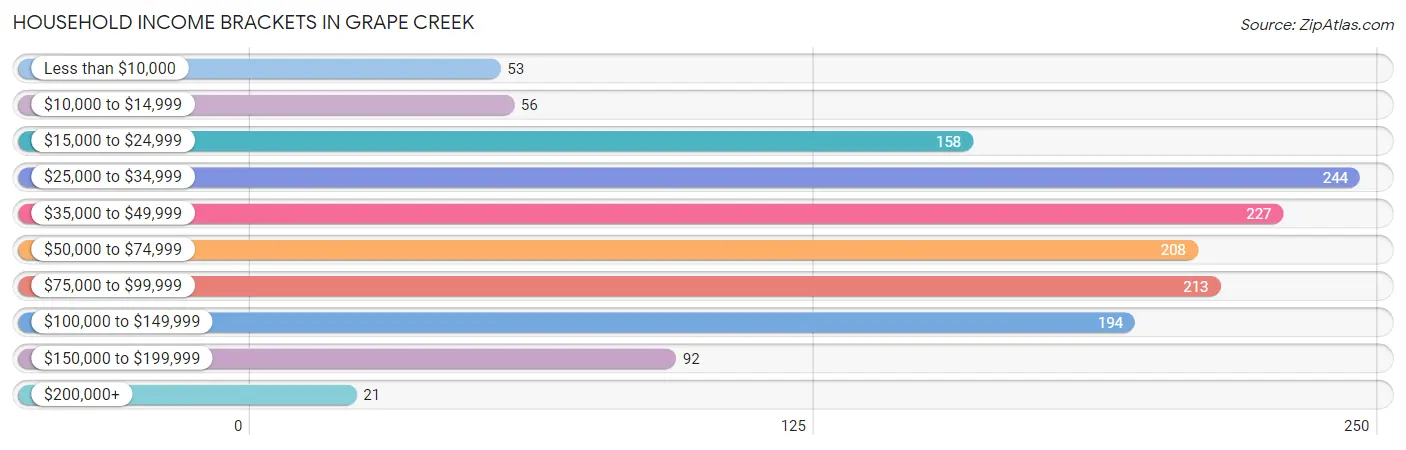
Household Income Brackets in Grape Creek
With 244 households falling in the category, the $25,000 to $34,999 income range is the most frequent in Grape Creek, accounting for 16.6% of all households. In contrast, only 21 households (1.4%) fall into the $200,000+ income bracket, making it the least populous group.
| Income Bracket | # Households | % Households |
| Less than $10,000 | 53 | 3.6% |
| $10,000 to $14,999 | 56 | 3.8% |
| $15,000 to $24,999 | 158 | 10.8% |
| $25,000 to $34,999 | 244 | 16.6% |
| $35,000 to $49,999 | 227 | 15.5% |
| $50,000 to $74,999 | 208 | 14.2% |
| $75,000 to $99,999 | 213 | 14.5% |
| $100,000 to $149,999 | 194 | 13.2% |
| $150,000 to $199,999 | 92 | 6.3% |
| $200,000+ | 21 | 1.4% |
Household Income by Householder Age in Grape Creek
The median household income in Grape Creek is $49,191, with the highest median household income of $77,500 found in the 45 to 64 years age bracket for the primary householder. A total of 618 households (42.1%) fall into this category. Meanwhile, the 15 to 24 years age bracket for the primary householder has the lowest median household income of $0, with 32 households (2.2%) in this group.
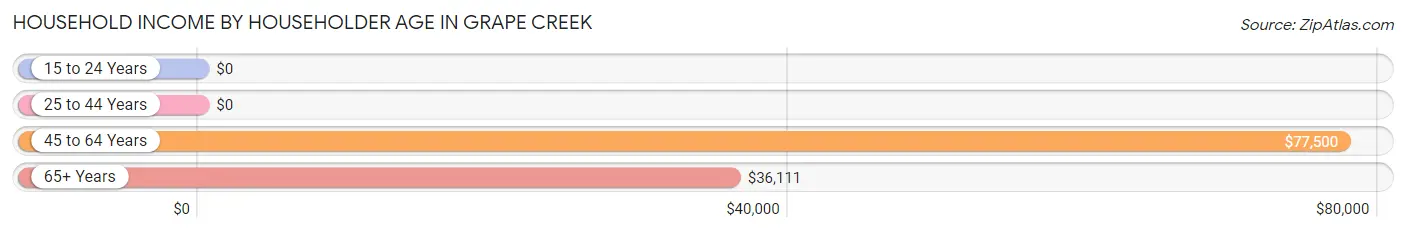
| Income Bracket | # Households | Median Income |
| 15 to 24 Years | 32 (2.2%) | $0 |
| 25 to 44 Years | 475 (32.4%) | $0 |
| 45 to 64 Years | 618 (42.1%) | $77,500 |
| 65+ Years | 342 (23.3%) | $36,111 |
| Total | 1,467 (100.0%) | $49,191 |
Poverty in Grape Creek
Income Below Poverty by Sex and Age in Grape Creek
With 23.5% poverty level for males and 30.1% for females among the residents of Grape Creek, 5 year old males and under 5 year old females are the most vulnerable to poverty, with 23 males (100.0%) and 160 females (77.3%) in their respective age groups living below the poverty level.
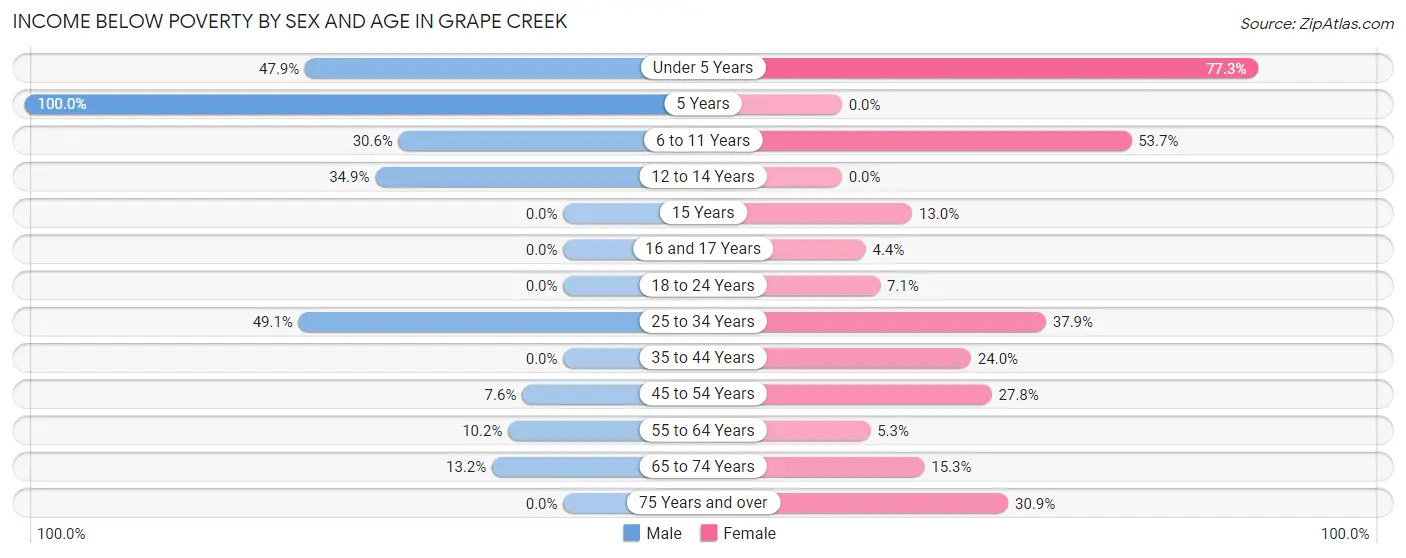
| Age Bracket | Male | Female |
| Under 5 Years | 185 (47.9%) | 160 (77.3%) |
| 5 Years | 23 (100.0%) | 0 (0.0%) |
| 6 to 11 Years | 99 (30.6%) | 130 (53.7%) |
| 12 to 14 Years | 22 (34.9%) | 0 (0.0%) |
| 15 Years | 0 (0.0%) | 3 (13.0%) |
| 16 and 17 Years | 0 (0.0%) | 3 (4.4%) |
| 18 to 24 Years | 0 (0.0%) | 9 (7.1%) |
| 25 to 34 Years | 111 (49.1%) | 175 (37.9%) |
| 35 to 44 Years | 0 (0.0%) | 70 (24.0%) |
| 45 to 54 Years | 18 (7.6%) | 52 (27.8%) |
| 55 to 64 Years | 31 (10.2%) | 16 (5.3%) |
| 65 to 74 Years | 27 (13.2%) | 19 (15.3%) |
| 75 Years and over | 0 (0.0%) | 25 (30.9%) |
| Total | 516 (23.5%) | 662 (30.1%) |
Income Above Poverty by Sex and Age in Grape Creek
According to the poverty statistics in Grape Creek, males aged 15 years and females aged 5 years are the age groups that are most secure financially, with 100.0% of males and 100.0% of females in these age groups living above the poverty line.
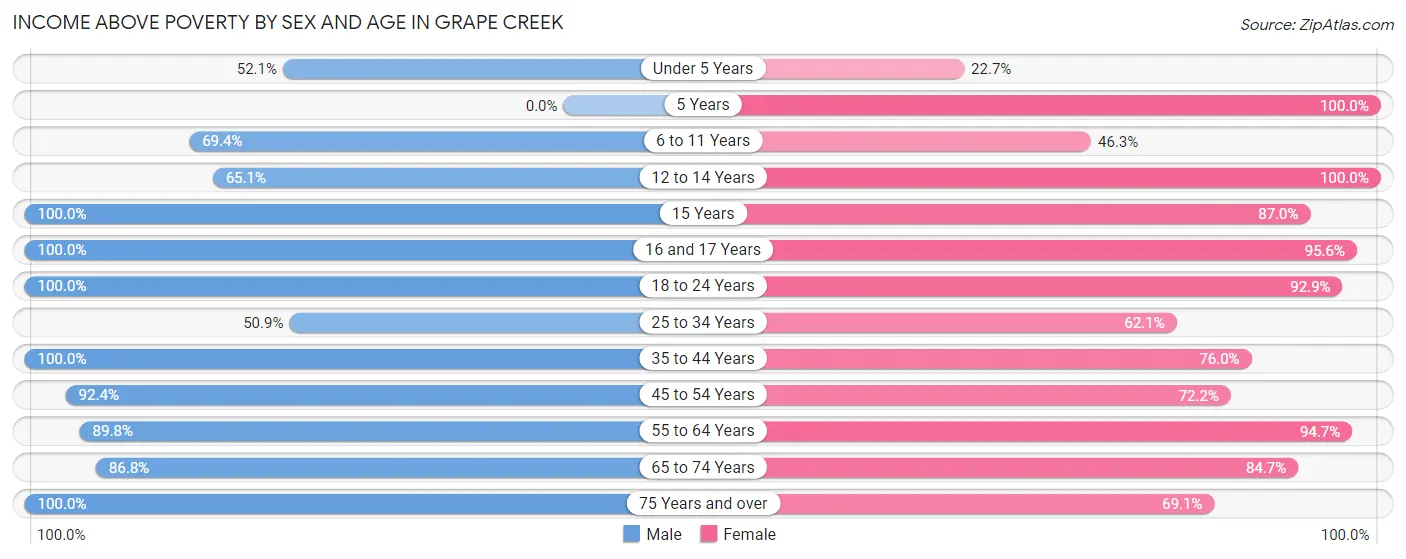
| Age Bracket | Male | Female |
| Under 5 Years | 201 (52.1%) | 47 (22.7%) |
| 5 Years | 0 (0.0%) | 6 (100.0%) |
| 6 to 11 Years | 225 (69.4%) | 112 (46.3%) |
| 12 to 14 Years | 41 (65.1%) | 75 (100.0%) |
| 15 Years | 18 (100.0%) | 20 (87.0%) |
| 16 and 17 Years | 45 (100.0%) | 65 (95.6%) |
| 18 to 24 Years | 75 (100.0%) | 118 (92.9%) |
| 25 to 34 Years | 115 (50.9%) | 287 (62.1%) |
| 35 to 44 Years | 211 (100.0%) | 222 (76.0%) |
| 45 to 54 Years | 218 (92.4%) | 135 (72.2%) |
| 55 to 64 Years | 272 (89.8%) | 287 (94.7%) |
| 65 to 74 Years | 177 (86.8%) | 105 (84.7%) |
| 75 Years and over | 80 (100.0%) | 56 (69.1%) |
| Total | 1,678 (76.5%) | 1,535 (69.9%) |
Income Below Poverty Among Married-Couple Families in Grape Creek
The poverty statistics for married-couple families in Grape Creek show that 20.5% or 163 of the total 794 families live below the poverty line. Families with 3 or 4 children have the highest poverty rate of 81.3%, comprising of 122 families. On the other hand, families with 5 or more children have the lowest poverty rate of 0.0%, which includes 0 families.
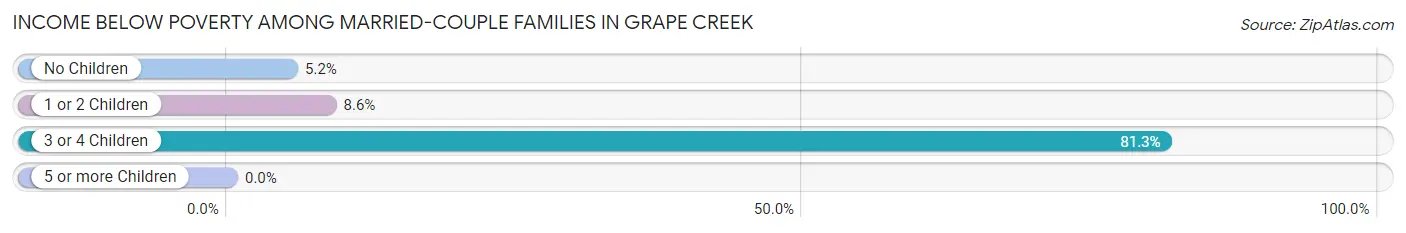
| Children | Above Poverty | Below Poverty |
| No Children | 326 (94.8%) | 18 (5.2%) |
| 1 or 2 Children | 245 (91.4%) | 23 (8.6%) |
| 3 or 4 Children | 28 (18.7%) | 122 (81.3%) |
| 5 or more Children | 32 (100.0%) | 0 (0.0%) |
| Total | 631 (79.5%) | 163 (20.5%) |
Income Below Poverty Among Single-Parent Households in Grape Creek
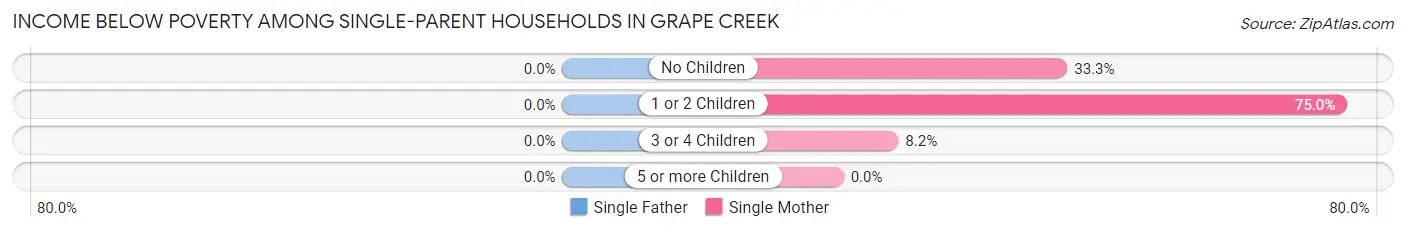
| Children | Single Father | Single Mother |
| No Children | 0 (0.0%) | 25 (33.3%) |
| 1 or 2 Children | 0 (0.0%) | 51 (75.0%) |
| 3 or 4 Children | 0 (0.0%) | 4 (8.2%) |
| 5 or more Children | 0 (0.0%) | 0 (0.0%) |
| Total | 0 (0.0%) | 80 (41.7%) |
Income Below Poverty Among Married-Couple vs Single-Parent Households in Grape Creek
The poverty data for Grape Creek shows that 163 of the married-couple family households (20.5%) and 80 of the single-parent households (33.3%) are living below the poverty level. Within the married-couple family households, those with 3 or 4 children have the highest poverty rate, with 122 households (81.3%) falling below the poverty line. Among the single-parent households, those with 1 or 2 children have the highest poverty rate, with 51 household (48.1%) living below poverty.
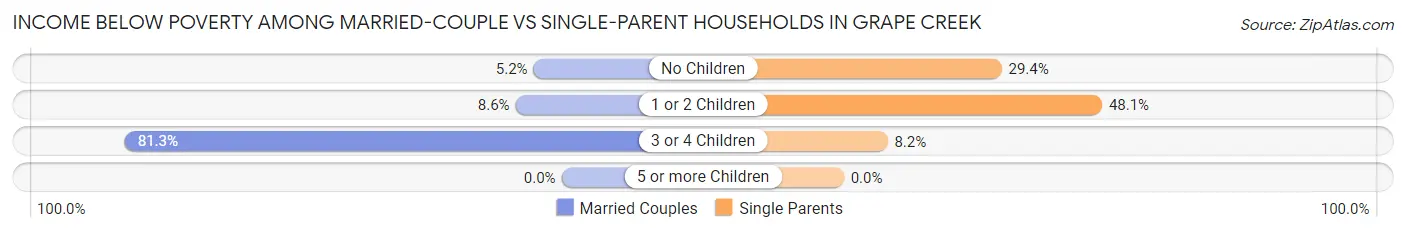
| Children | Married-Couple Families | Single-Parent Households |
| No Children | 18 (5.2%) | 25 (29.4%) |
| 1 or 2 Children | 23 (8.6%) | 51 (48.1%) |
| 3 or 4 Children | 122 (81.3%) | 4 (8.2%) |
| 5 or more Children | 0 (0.0%) | 0 (0.0%) |
| Total | 163 (20.5%) | 80 (33.3%) |
Race in Grape Creek
The most populous races in Grape Creek are White / Caucasian (3,193 | 72.7%), Hispanic or Latino (2,079 | 47.3%), and Two or more Races (1,163 | 26.5%).

| Race | # Population | % Population |
| Asian | 0 | 0.0% |
| Black / African American | 0 | 0.0% |
| Hawaiian / Pacific | 0 | 0.0% |
| Hispanic or Latino | 2,079 | 47.3% |
| Native / Alaskan | 0 | 0.0% |
| White / Caucasian | 3,193 | 72.7% |
| Two or more Races | 1,163 | 26.5% |
| Some other Race | 35 | 0.8% |
| Total | 4,391 | 100.0% |
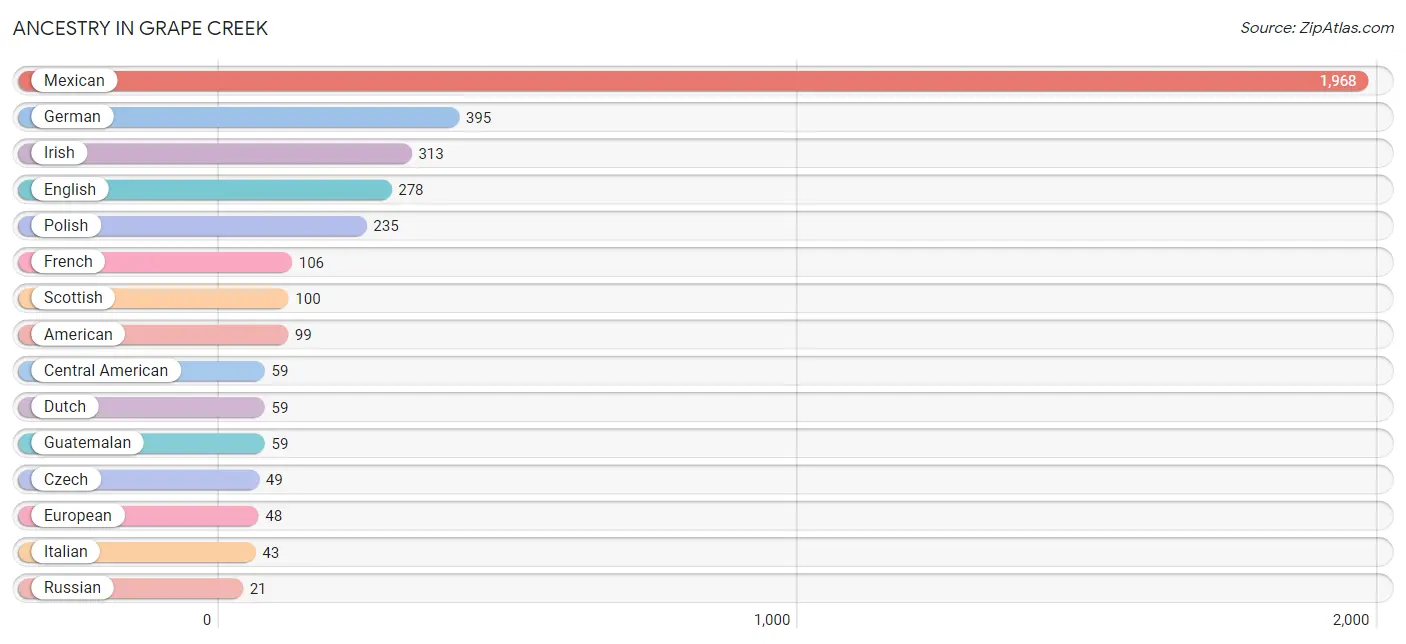
Ancestry in Grape Creek
The most populous ancestries reported in Grape Creek are Mexican (1,968 | 44.8%), German (395 | 9.0%), Irish (313 | 7.1%), English (278 | 6.3%), and Polish (235 | 5.3%), together accounting for 72.6% of all Grape Creek residents.
| Ancestry | # Population | % Population |
| American | 99 | 2.2% |
| British | 16 | 0.4% |
| Central American | 59 | 1.3% |
| Czech | 49 | 1.1% |
| Czechoslovakian | 4 | 0.1% |
| Dutch | 59 | 1.3% |
| English | 278 | 6.3% |
| European | 48 | 1.1% |
| French | 106 | 2.4% |
| German | 395 | 9.0% |
| Guatemalan | 59 | 1.3% |
| Irish | 313 | 7.1% |
| Italian | 43 | 1.0% |
| Mexican | 1,968 | 44.8% |
| Native Hawaiian | 9 | 0.2% |
| Norwegian | 11 | 0.3% |
| Polish | 235 | 5.3% |
| Russian | 21 | 0.5% |
| Scotch-Irish | 14 | 0.3% |
| Scottish | 100 | 2.3% | View All 20 Rows |
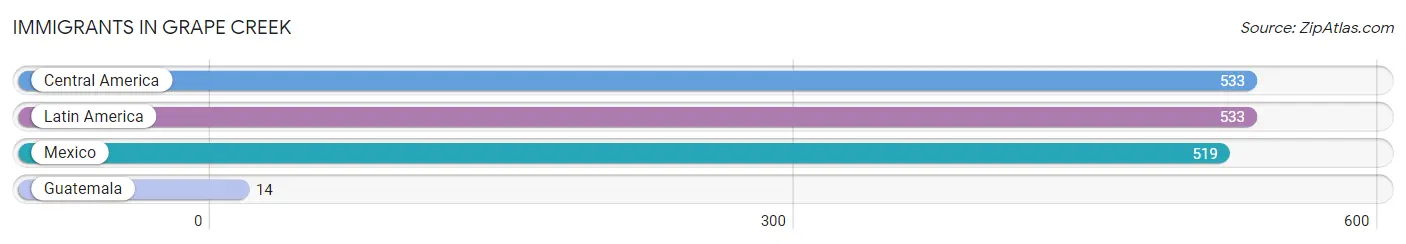
Immigrants in Grape Creek
The most numerous immigrant groups reported in Grape Creek came from Central America (533 | 12.1%), Latin America (533 | 12.1%), Mexico (519 | 11.8%), and Guatemala (14 | 0.3%), together accounting for 36.4% of all Grape Creek residents.
| Immigration Origin | # Population | % Population |
| Central America | 533 | 12.1% |
| Guatemala | 14 | 0.3% |
| Latin America | 533 | 12.1% |
| Mexico | 519 | 11.8% | View All 4 Rows |
Sex and Age in Grape Creek
Sex and Age in Grape Creek
The most populous age groups in Grape Creek are Under 5 Years (386 | 17.6%) for men and 30 to 34 Years (381 | 17.3%) for women.
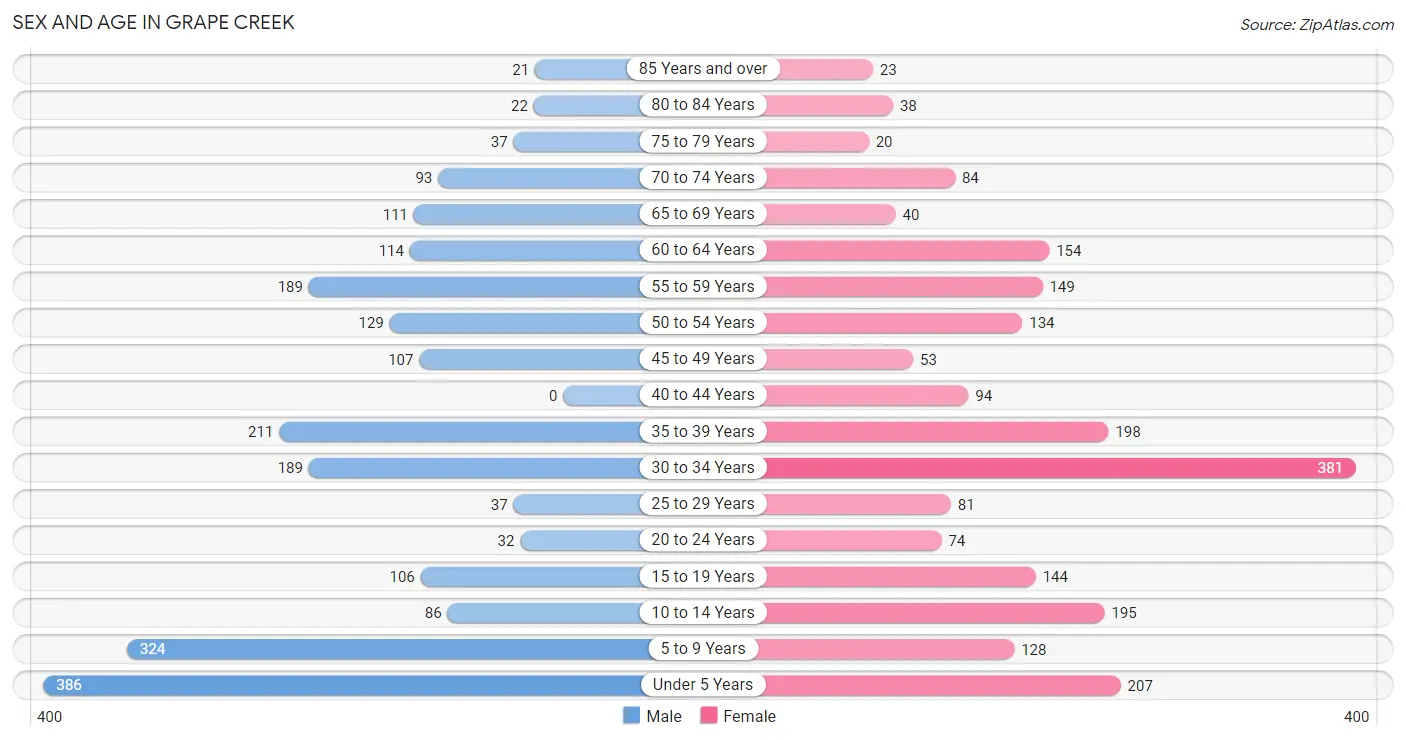
| Age Bracket | Male | Female |
| Under 5 Years | 386 (17.6%) | 207 (9.4%) |
| 5 to 9 Years | 324 (14.8%) | 128 (5.8%) |
| 10 to 14 Years | 86 (3.9%) | 195 (8.9%) |
| 15 to 19 Years | 106 (4.8%) | 144 (6.6%) |
| 20 to 24 Years | 32 (1.5%) | 74 (3.4%) |
| 25 to 29 Years | 37 (1.7%) | 81 (3.7%) |
| 30 to 34 Years | 189 (8.6%) | 381 (17.3%) |
| 35 to 39 Years | 211 (9.6%) | 198 (9.0%) |
| 40 to 44 Years | 0 (0.0%) | 94 (4.3%) |
| 45 to 49 Years | 107 (4.9%) | 53 (2.4%) |
| 50 to 54 Years | 129 (5.9%) | 134 (6.1%) |
| 55 to 59 Years | 189 (8.6%) | 149 (6.8%) |
| 60 to 64 Years | 114 (5.2%) | 154 (7.0%) |
| 65 to 69 Years | 111 (5.1%) | 40 (1.8%) |
| 70 to 74 Years | 93 (4.2%) | 84 (3.8%) |
| 75 to 79 Years | 37 (1.7%) | 20 (0.9%) |
| 80 to 84 Years | 22 (1.0%) | 38 (1.7%) |
| 85 Years and over | 21 (1.0%) | 23 (1.1%) |
| Total | 2,194 (100.0%) | 2,197 (100.0%) |
Families and Households in Grape Creek
Median Family Size in Grape Creek
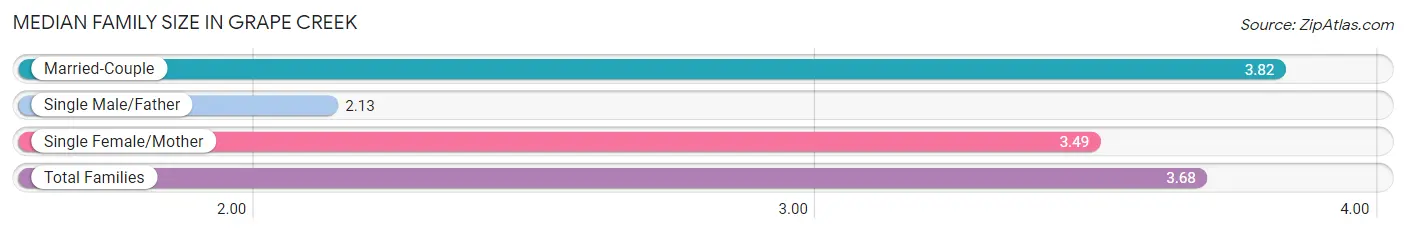
The median family size in Grape Creek is 3.68 persons per family, with married-couple families (794 | 76.8%) accounting for the largest median family size of 3.82 persons per family. On the other hand, single male/father families (48 | 4.6%) represent the smallest median family size with 2.13 persons per family.
| Family Type | # Families | Family Size |
| Married-Couple | 794 (76.8%) | 3.82 |
| Single Male/Father | 48 (4.6%) | 2.13 |
| Single Female/Mother | 192 (18.6%) | 3.49 |
| Total Families | 1,034 (100.0%) | 3.68 |
Median Household Size in Grape Creek
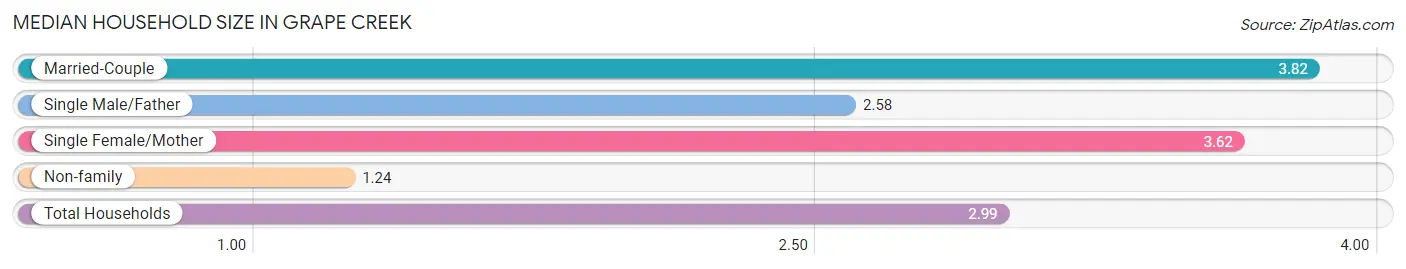
The median household size in Grape Creek is 2.99 persons per household, with married-couple households (794 | 54.1%) accounting for the largest median household size of 3.82 persons per household. non-family households (433 | 29.5%) represent the smallest median household size with 1.24 persons per household.
| Household Type | # Households | Household Size |
| Married-Couple | 794 (54.1%) | 3.82 |
| Single Male/Father | 48 (3.3%) | 2.58 |
| Single Female/Mother | 192 (13.1%) | 3.62 |
| Non-family | 433 (29.5%) | 1.24 |
| Total Households | 1,467 (100.0%) | 2.99 |
Household Size by Marriage Status in Grape Creek
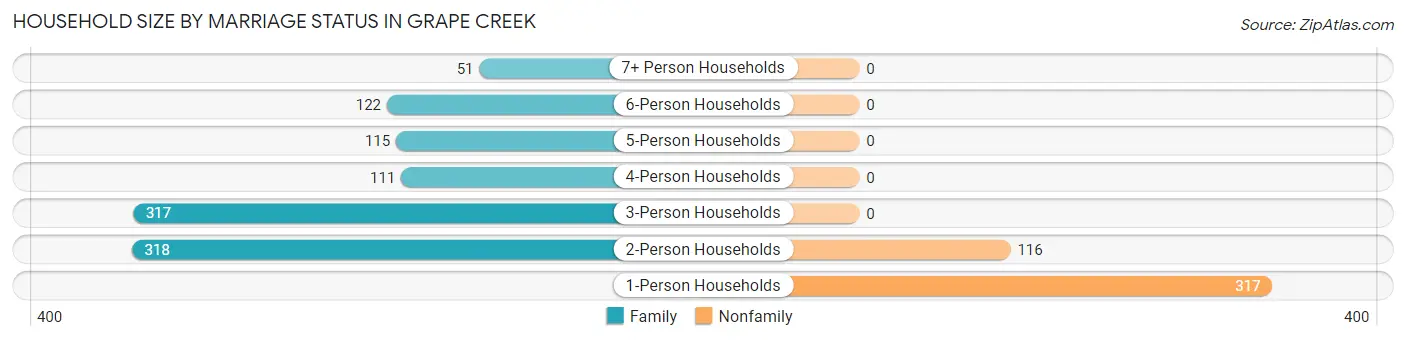
Out of a total of 1,467 households in Grape Creek, 1,034 (70.5%) are family households, while 433 (29.5%) are nonfamily households. The most numerous type of family households are 2-person households, comprising 318, and the most common type of nonfamily households are 1-person households, comprising 317.
| Household Size | Family Households | Nonfamily Households |
| 1-Person Households | - | 317 (21.6%) |
| 2-Person Households | 318 (21.7%) | 116 (7.9%) |
| 3-Person Households | 317 (21.6%) | 0 (0.0%) |
| 4-Person Households | 111 (7.6%) | 0 (0.0%) |
| 5-Person Households | 115 (7.8%) | 0 (0.0%) |
| 6-Person Households | 122 (8.3%) | 0 (0.0%) |
| 7+ Person Households | 51 (3.5%) | 0 (0.0%) |
| Total | 1,034 (70.5%) | 433 (29.5%) |
Female Fertility in Grape Creek
Fertility by Age in Grape Creek
Average fertility rate in Grape Creek is 25.0 births per 1,000 women. Women in the age bracket of 20 to 34 years have the highest fertility rate with 43.0 births per 1,000 women. Women in the age bracket of 20 to 34 years acount for 85.2% of all women with births.
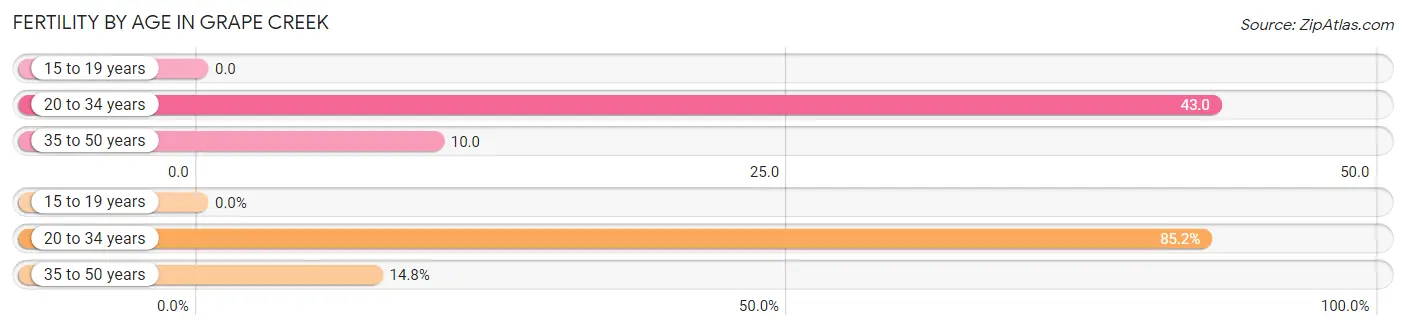
| Age Bracket | Women with Births | Births / 1,000 Women |
| 15 to 19 years | 0 (0.0%) | 0.0 |
| 20 to 34 years | 23 (85.2%) | 43.0 |
| 35 to 50 years | 4 (14.8%) | 10.0 |
| Total | 27 (100.0%) | 25.0 |
Fertility by Age by Marriage Status in Grape Creek
55.6% of women with births (27) in Grape Creek are married. The highest percentage of unmarried women with births falls into 20 to 34 years age bracket with 52.2% of them unmarried at the time of birth, while the lowest percentage of unmarried women with births belong to 35 to 50 years age bracket with 0.0% of them unmarried.
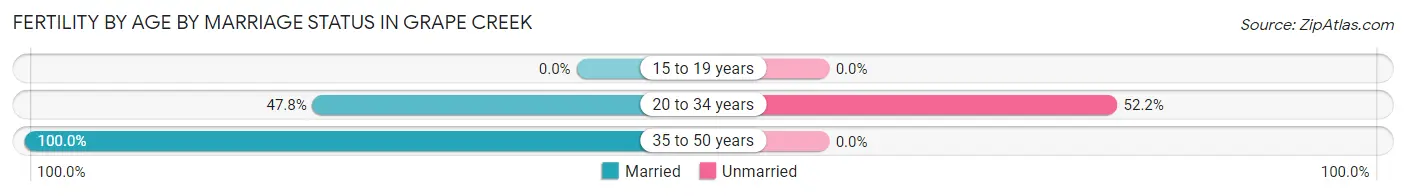
| Age Bracket | Married | Unmarried |
| 15 to 19 years | 0 (0.0%) | 0 (0.0%) |
| 20 to 34 years | 11 (47.8%) | 12 (52.2%) |
| 35 to 50 years | 4 (100.0%) | 0 (0.0%) |
| Total | 15 (55.6%) | 12 (44.4%) |
Fertility by Education in Grape Creek
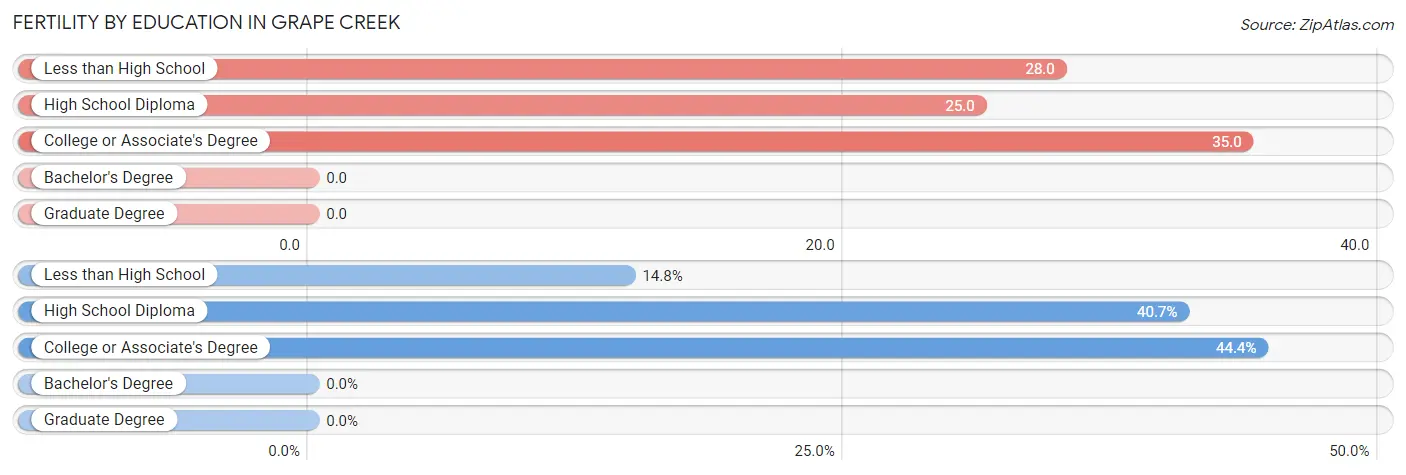
| Educational Attainment | Women with Births | Births / 1,000 Women |
| Less than High School | 4 (14.8%) | 28.0 |
| High School Diploma | 11 (40.7%) | 25.0 |
| College or Associate's Degree | 12 (44.4%) | 35.0 |
| Bachelor's Degree | 0 (0.0%) | 0.0 |
| Graduate Degree | 0 (0.0%) | 0.0 |
| Total | 27 (100.0%) | 25.0 |
Fertility by Education by Marriage Status in Grape Creek
44.4% of women with births in Grape Creek are unmarried. Women with the educational attainment of less than high school are most likely to be married with 100.0% of them married at childbirth, while women with the educational attainment of college or associate's degree are least likely to be married with 100.0% of them unmarried at childbirth.
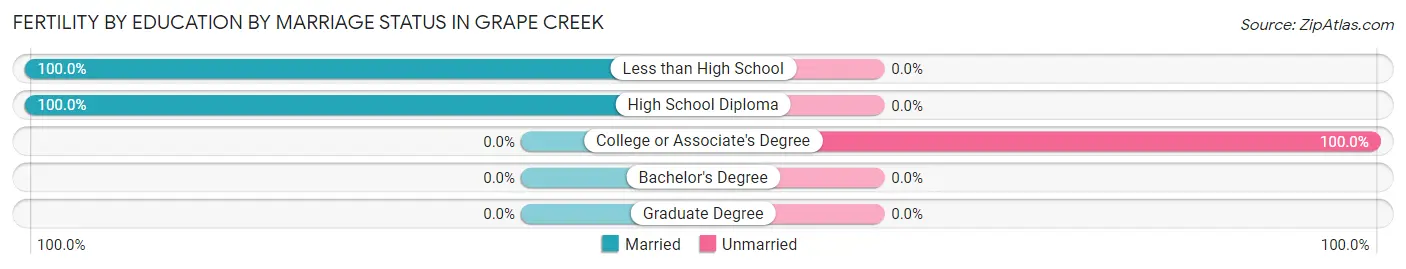
| Educational Attainment | Married | Unmarried |
| Less than High School | 4 (100.0%) | 0 (0.0%) |
| High School Diploma | 11 (100.0%) | 0 (0.0%) |
| College or Associate's Degree | 0 (0.0%) | 12 (100.0%) |
| Bachelor's Degree | 0 (0.0%) | 0 (0.0%) |
| Graduate Degree | 0 (0.0%) | 0 (0.0%) |
| Total | 15 (55.6%) | 12 (44.4%) |
Employment Characteristics in Grape Creek
Employment by Class of Employer in Grape Creek
Among the 1,814 employed individuals in Grape Creek, private company employees (1,131 | 62.4%), local government employees (264 | 14.5%), and not-for-profit organizations (119 | 6.6%) make up the most common classes of employment.
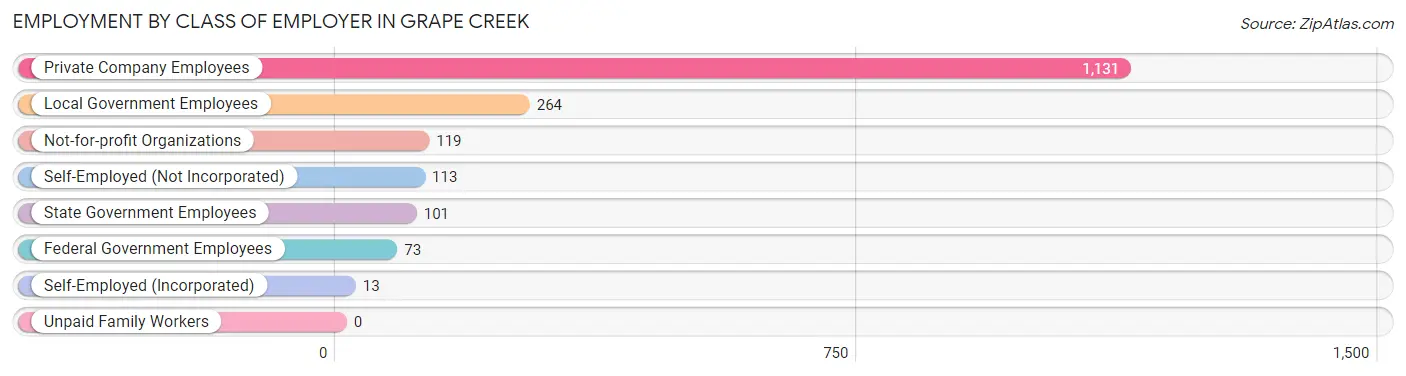
| Employer Class | # Employees | % Employees |
| Private Company Employees | 1,131 | 62.4% |
| Self-Employed (Incorporated) | 13 | 0.7% |
| Self-Employed (Not Incorporated) | 113 | 6.2% |
| Not-for-profit Organizations | 119 | 6.6% |
| Local Government Employees | 264 | 14.5% |
| State Government Employees | 101 | 5.6% |
| Federal Government Employees | 73 | 4.0% |
| Unpaid Family Workers | 0 | 0.0% |
| Total | 1,814 | 100.0% |
Employment Status by Age in Grape Creek
According to the labor force statistics for Grape Creek, out of the total population over 16 years of age (3,024), 61.3% or 1,854 individuals are in the labor force, with 1.3% or 24 of them unemployed. The age group with the highest labor force participation rate is 55 to 59 years, with 88.8% or 300 individuals in the labor force. Within the labor force, the 55 to 59 years age range has the highest percentage of unemployed individuals, with 3.7% or 11 of them being unemployed.
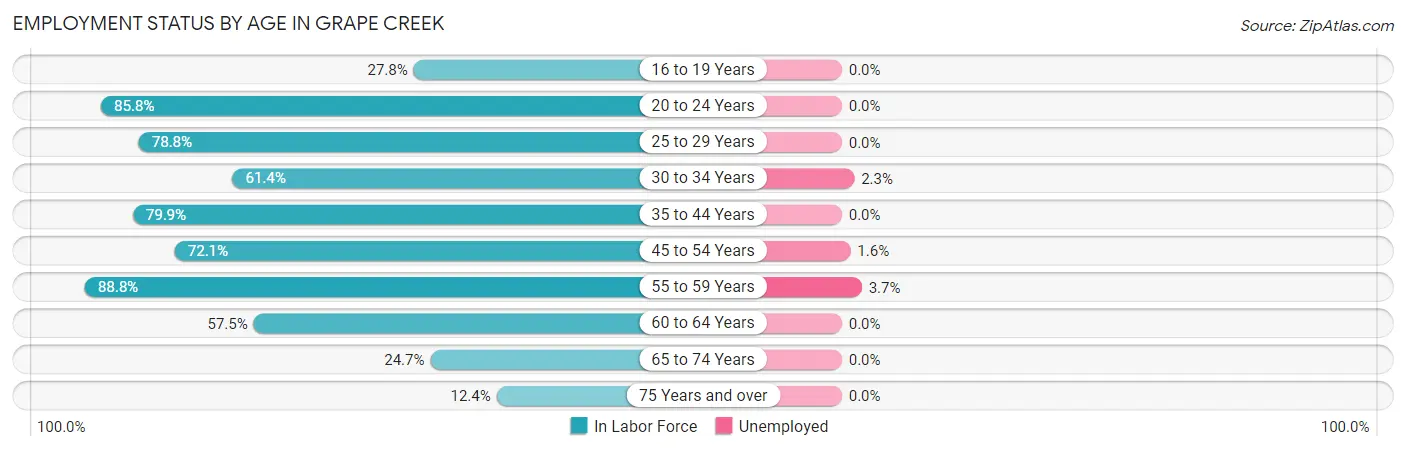
| Age Bracket | In Labor Force | Unemployed |
| 16 to 19 Years | 58 (27.8%) | 0 (0.0%) |
| 20 to 24 Years | 91 (85.8%) | 0 (0.0%) |
| 25 to 29 Years | 93 (78.8%) | 0 (0.0%) |
| 30 to 34 Years | 350 (61.4%) | 8 (2.3%) |
| 35 to 44 Years | 402 (79.9%) | 0 (0.0%) |
| 45 to 54 Years | 305 (72.1%) | 5 (1.6%) |
| 55 to 59 Years | 300 (88.8%) | 11 (3.7%) |
| 60 to 64 Years | 154 (57.5%) | 0 (0.0%) |
| 65 to 74 Years | 81 (24.7%) | 0 (0.0%) |
| 75 Years and over | 20 (12.4%) | 0 (0.0%) |
| Total | 1,854 (61.3%) | 24 (1.3%) |
Employment Status by Educational Attainment in Grape Creek
According to labor force statistics for Grape Creek, 72.3% of individuals (1,605) out of the total population between 25 and 64 years of age (2,220) are in the labor force, with 1.5% or 24 of them being unemployed. The group with the highest labor force participation rate are those with the educational attainment of bachelor's degree or higher, with 96.3% or 421 individuals in the labor force. Within the labor force, individuals with high school diploma education have the highest percentage of unemployment, with 4.0% or 19 of them being unemployed.
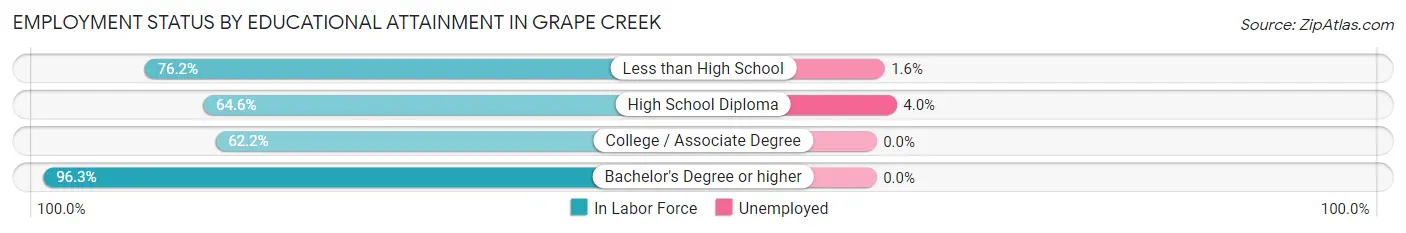
| Educational Attainment | In Labor Force | Unemployed |
| Less than High School | 308 (76.2%) | 6 (1.6%) |
| High School Diploma | 470 (64.6%) | 29 (4.0%) |
| College / Associate Degree | 405 (62.2%) | 0 (0.0%) |
| Bachelor's Degree or higher | 421 (96.3%) | 0 (0.0%) |
| Total | 1,605 (72.3%) | 33 (1.5%) |
Employment Occupations by Sex in Grape Creek
Management, Business, Science and Arts Occupations
The most common Management, Business, Science and Arts occupations in Grape Creek are Health Diagnosing & Treating (247 | 13.5%), Community & Social Service (190 | 10.4%), Management (183 | 10.0%), Education Instruction & Library (141 | 7.7%), and Education, Arts & Media (49 | 2.7%).
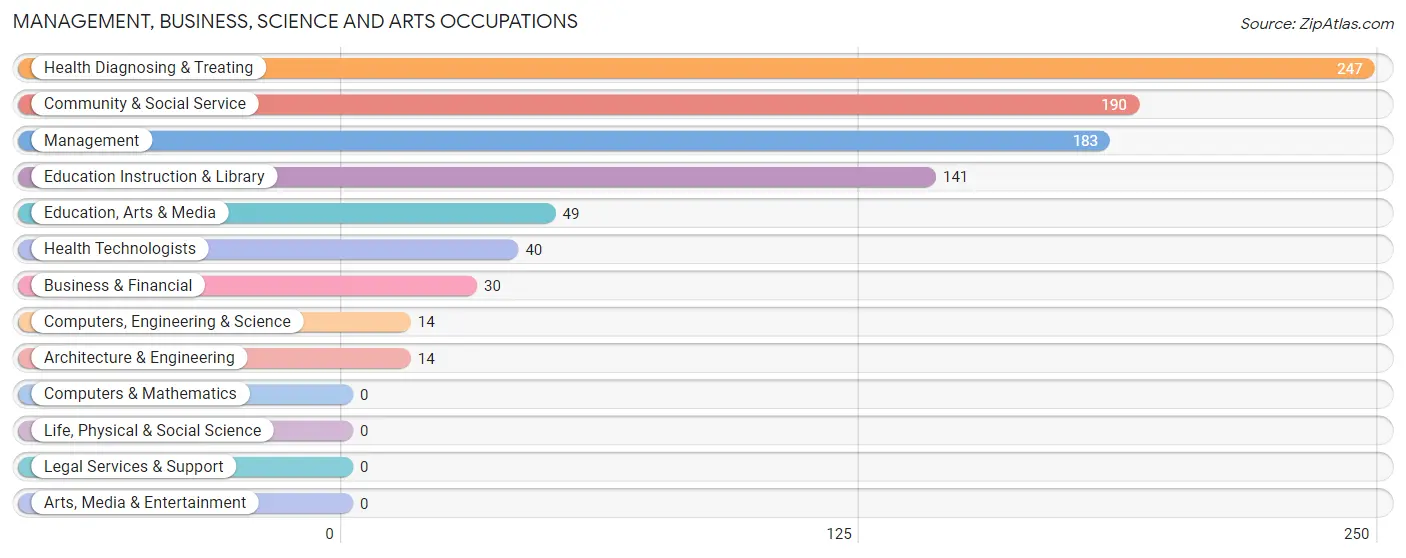
Management, Business, Science and Arts Occupations by Sex
Within the Management, Business, Science and Arts occupations in Grape Creek, the most male-oriented occupations are Computers, Engineering & Science (100.0%), Architecture & Engineering (100.0%), and Management (79.2%), while the most female-oriented occupations are Health Technologists (100.0%), Education, Arts & Media (83.7%), and Community & Social Service (64.2%).
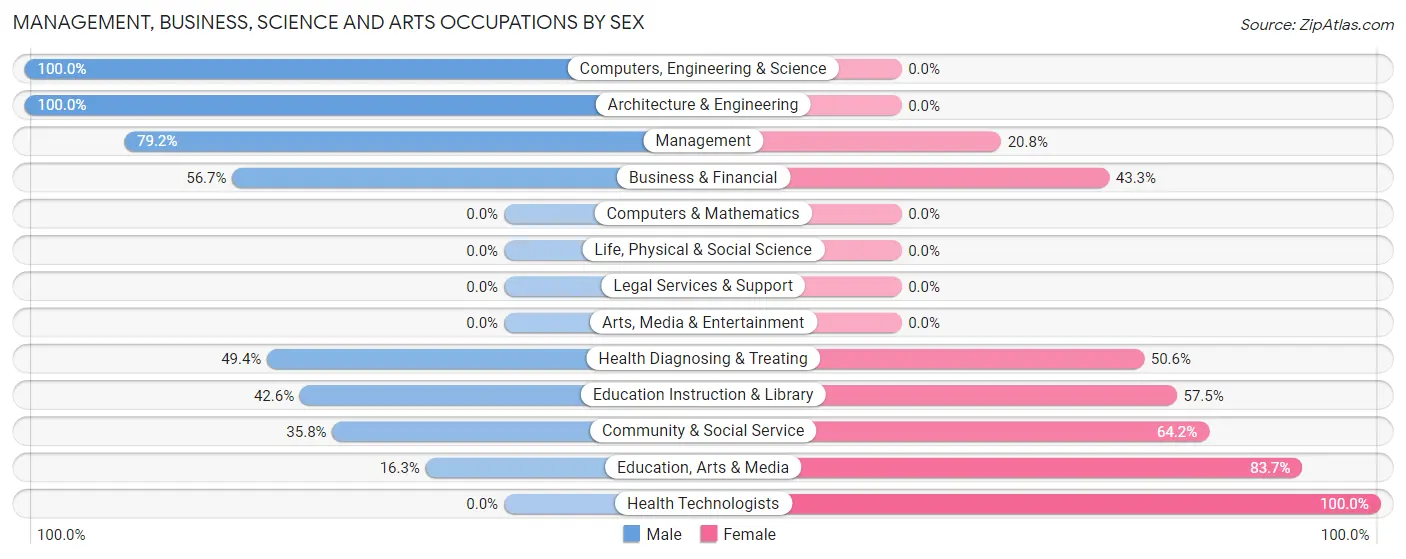
| Occupation | Male | Female |
| Management | 145 (79.2%) | 38 (20.8%) |
| Business & Financial | 17 (56.7%) | 13 (43.3%) |
| Computers, Engineering & Science | 14 (100.0%) | 0 (0.0%) |
| Computers & Mathematics | 0 (0.0%) | 0 (0.0%) |
| Architecture & Engineering | 14 (100.0%) | 0 (0.0%) |
| Life, Physical & Social Science | 0 (0.0%) | 0 (0.0%) |
| Community & Social Service | 68 (35.8%) | 122 (64.2%) |
| Education, Arts & Media | 8 (16.3%) | 41 (83.7%) |
| Legal Services & Support | 0 (0.0%) | 0 (0.0%) |
| Education Instruction & Library | 60 (42.5%) | 81 (57.5%) |
| Arts, Media & Entertainment | 0 (0.0%) | 0 (0.0%) |
| Health Diagnosing & Treating | 122 (49.4%) | 125 (50.6%) |
| Health Technologists | 0 (0.0%) | 40 (100.0%) |
| Total (Category) | 366 (55.1%) | 298 (44.9%) |
| Total (Overall) | 932 (50.9%) | 898 (49.1%) |
Services Occupations
The most common Services occupations in Grape Creek are Food Preparation & Serving (220 | 12.0%), Cleaning & Maintenance (113 | 6.2%), Healthcare Support (41 | 2.2%), Security & Protection (21 | 1.1%), and Law Enforcement (21 | 1.1%).
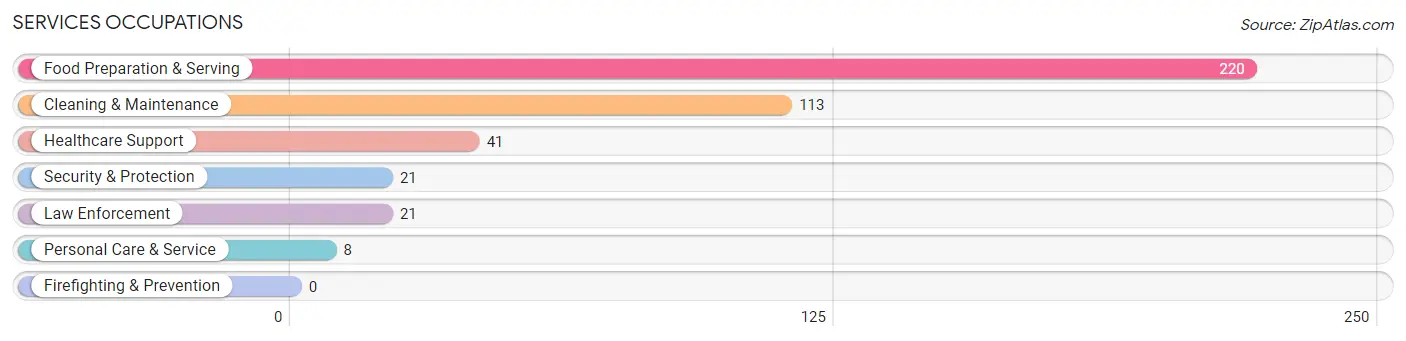
Services Occupations by Sex
Within the Services occupations in Grape Creek, the most male-oriented occupations are Security & Protection (100.0%), Law Enforcement (100.0%), and Personal Care & Service (100.0%), while the most female-oriented occupations are Healthcare Support (100.0%), Food Preparation & Serving (100.0%), and Cleaning & Maintenance (53.1%).
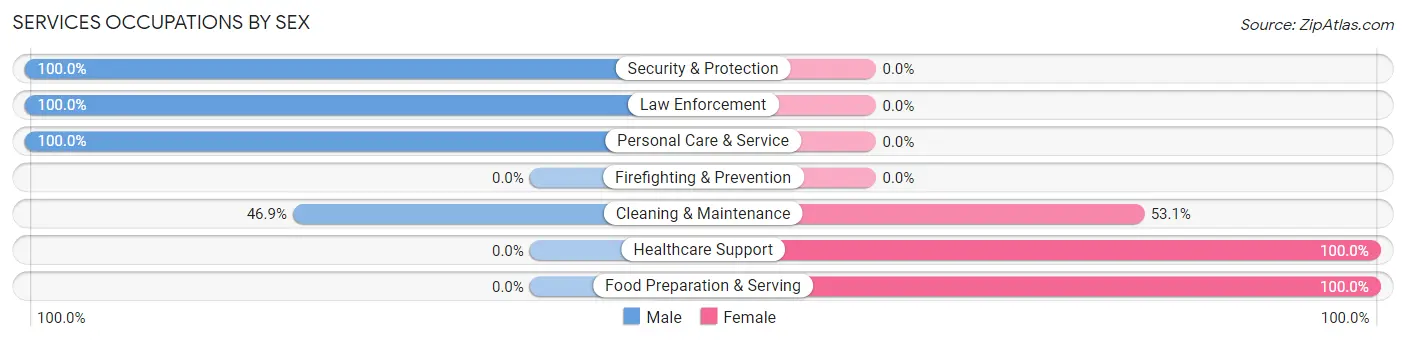
| Occupation | Male | Female |
| Healthcare Support | 0 (0.0%) | 41 (100.0%) |
| Security & Protection | 21 (100.0%) | 0 (0.0%) |
| Firefighting & Prevention | 0 (0.0%) | 0 (0.0%) |
| Law Enforcement | 21 (100.0%) | 0 (0.0%) |
| Food Preparation & Serving | 0 (0.0%) | 220 (100.0%) |
| Cleaning & Maintenance | 53 (46.9%) | 60 (53.1%) |
| Personal Care & Service | 8 (100.0%) | 0 (0.0%) |
| Total (Category) | 82 (20.3%) | 321 (79.6%) |
| Total (Overall) | 932 (50.9%) | 898 (49.1%) |
Sales and Office Occupations
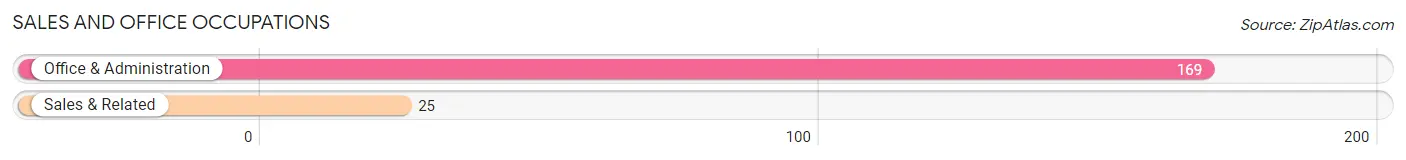
The most common Sales and Office occupations in Grape Creek are Office & Administration (169 | 9.2%), and Sales & Related (25 | 1.4%).
Sales and Office Occupations by Sex
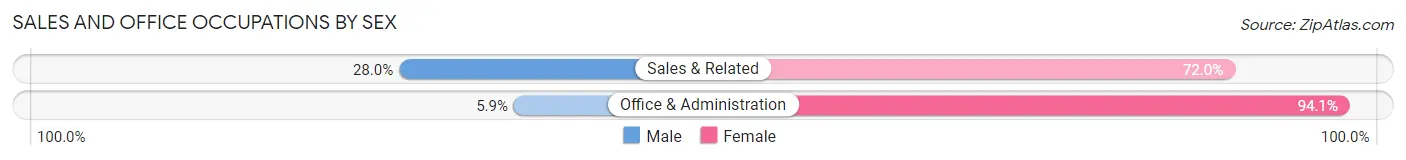
| Occupation | Male | Female |
| Sales & Related | 7 (28.0%) | 18 (72.0%) |
| Office & Administration | 10 (5.9%) | 159 (94.1%) |
| Total (Category) | 17 (8.8%) | 177 (91.2%) |
| Total (Overall) | 932 (50.9%) | 898 (49.1%) |
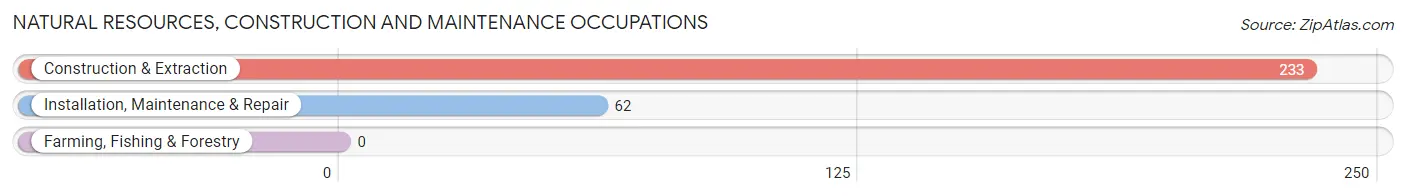
Natural Resources, Construction and Maintenance Occupations
The most common Natural Resources, Construction and Maintenance occupations in Grape Creek are Construction & Extraction (233 | 12.7%), and Installation, Maintenance & Repair (62 | 3.4%).
Natural Resources, Construction and Maintenance Occupations by Sex
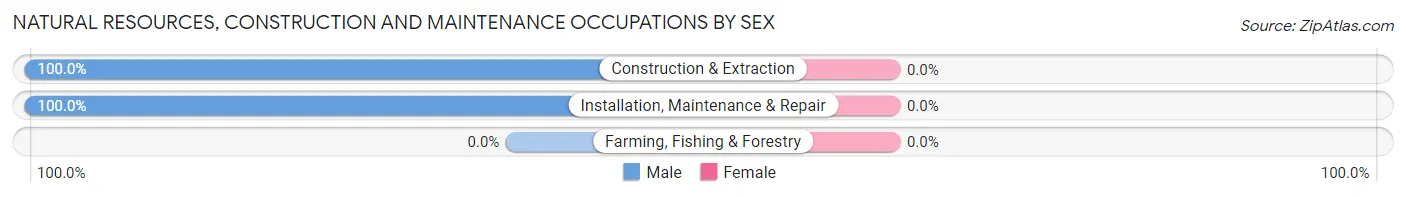
| Occupation | Male | Female |
| Farming, Fishing & Forestry | 0 (0.0%) | 0 (0.0%) |
| Construction & Extraction | 233 (100.0%) | 0 (0.0%) |
| Installation, Maintenance & Repair | 62 (100.0%) | 0 (0.0%) |
| Total (Category) | 295 (100.0%) | 0 (0.0%) |
| Total (Overall) | 932 (50.9%) | 898 (49.1%) |
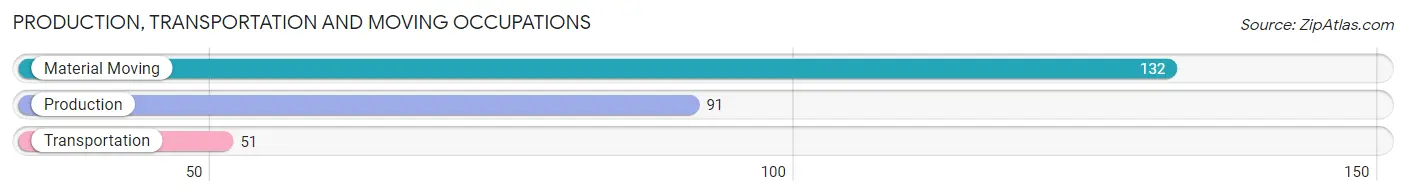
Production, Transportation and Moving Occupations
The most common Production, Transportation and Moving occupations in Grape Creek are Material Moving (132 | 7.2%), Production (91 | 5.0%), and Transportation (51 | 2.8%).
Production, Transportation and Moving Occupations by Sex
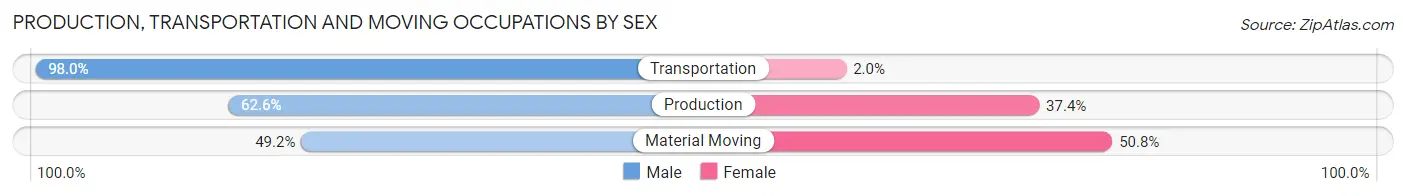
| Occupation | Male | Female |
| Production | 57 (62.6%) | 34 (37.4%) |
| Transportation | 50 (98.0%) | 1 (2.0%) |
| Material Moving | 65 (49.2%) | 67 (50.8%) |
| Total (Category) | 172 (62.8%) | 102 (37.2%) |
| Total (Overall) | 932 (50.9%) | 898 (49.1%) |
Employment Industries by Sex in Grape Creek
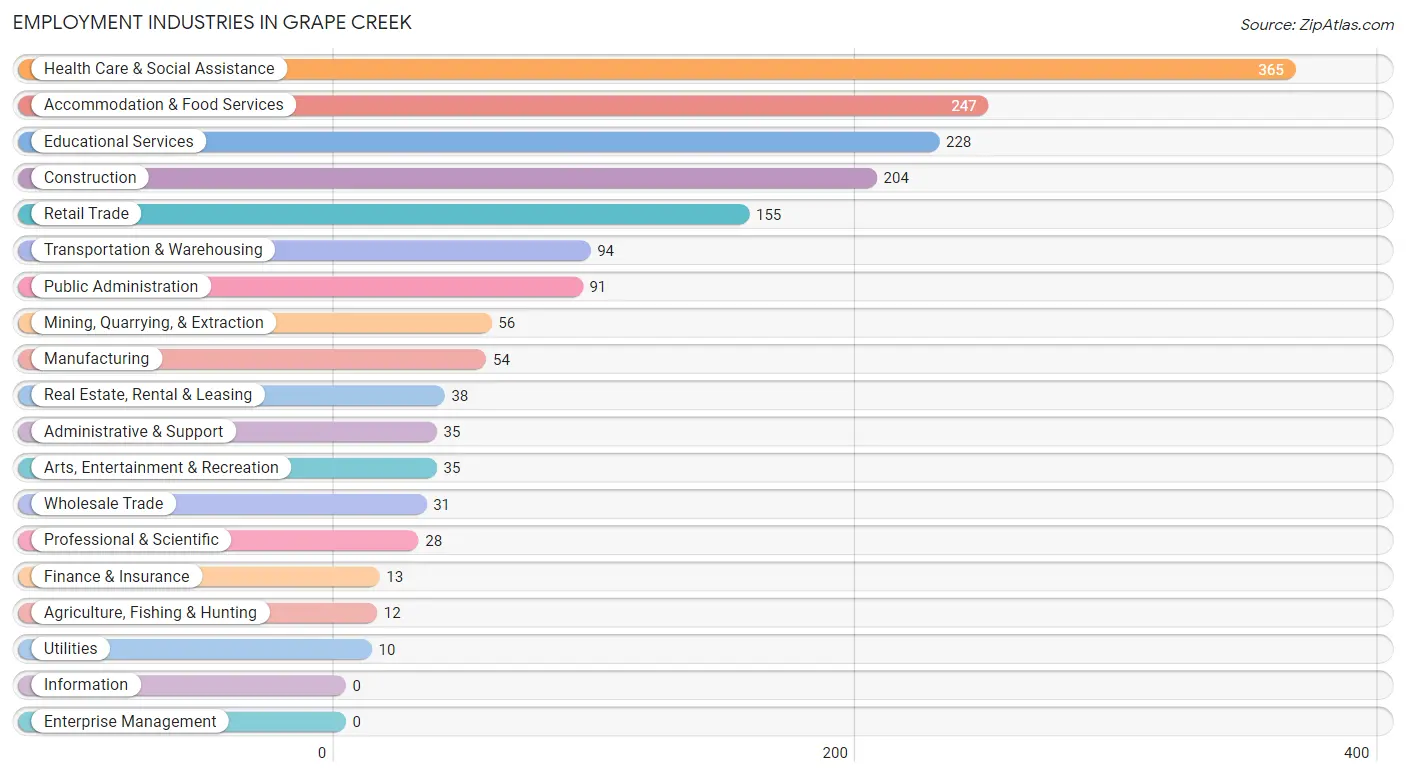
Employment Industries in Grape Creek
The major employment industries in Grape Creek include Health Care & Social Assistance (365 | 20.0%), Accommodation & Food Services (247 | 13.5%), Educational Services (228 | 12.5%), Construction (204 | 11.2%), and Retail Trade (155 | 8.5%).
Employment Industries by Sex in Grape Creek
The Grape Creek industries that see more men than women are Agriculture, Fishing & Hunting (100.0%), Mining, Quarrying, & Extraction (100.0%), and Construction (100.0%), whereas the industries that tend to have a higher number of women are Finance & Insurance (100.0%), Real Estate, Rental & Leasing (100.0%), and Accommodation & Food Services (87.0%).
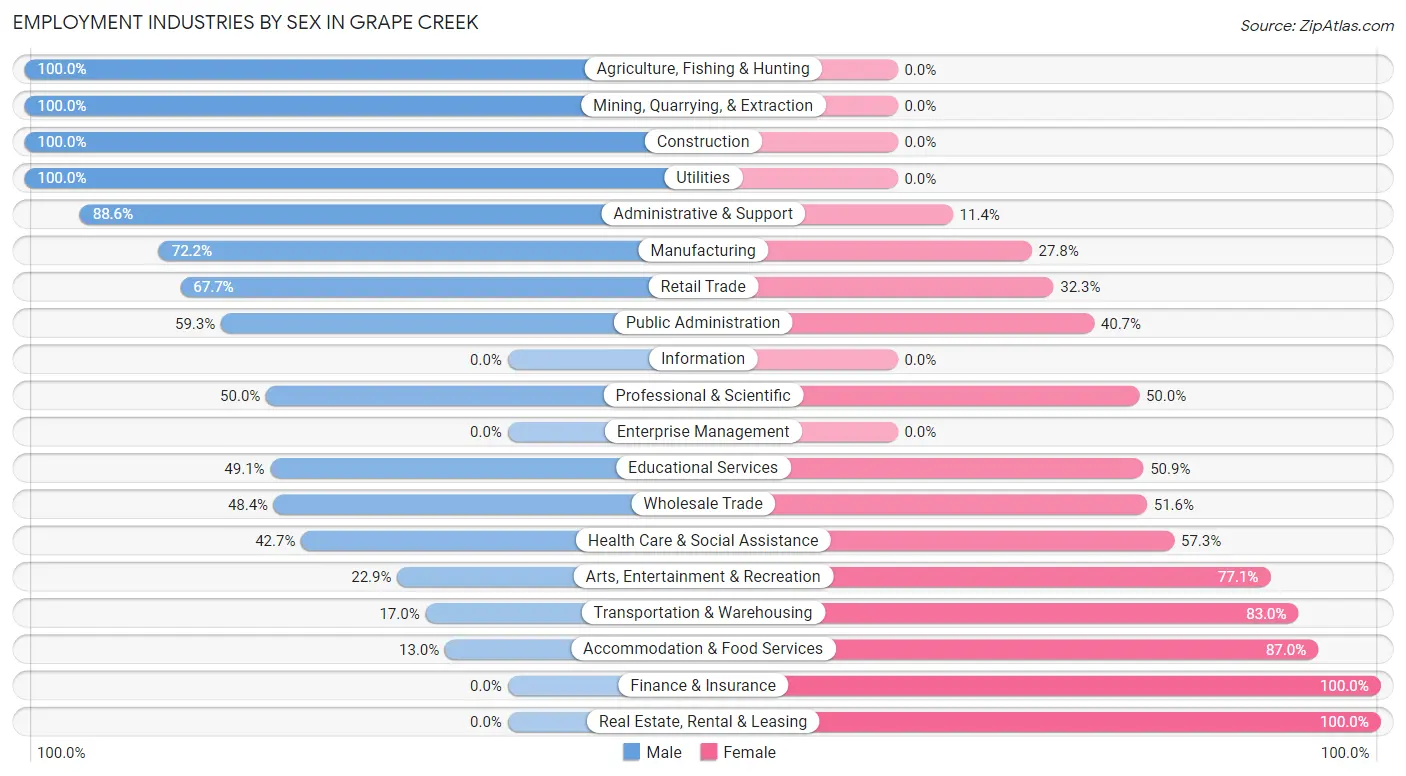
| Industry | Male | Female |
| Agriculture, Fishing & Hunting | 12 (100.0%) | 0 (0.0%) |
| Mining, Quarrying, & Extraction | 56 (100.0%) | 0 (0.0%) |
| Construction | 204 (100.0%) | 0 (0.0%) |
| Manufacturing | 39 (72.2%) | 15 (27.8%) |
| Wholesale Trade | 15 (48.4%) | 16 (51.6%) |
| Retail Trade | 105 (67.7%) | 50 (32.3%) |
| Transportation & Warehousing | 16 (17.0%) | 78 (83.0%) |
| Utilities | 10 (100.0%) | 0 (0.0%) |
| Information | 0 (0.0%) | 0 (0.0%) |
| Finance & Insurance | 0 (0.0%) | 13 (100.0%) |
| Real Estate, Rental & Leasing | 0 (0.0%) | 38 (100.0%) |
| Professional & Scientific | 14 (50.0%) | 14 (50.0%) |
| Enterprise Management | 0 (0.0%) | 0 (0.0%) |
| Administrative & Support | 31 (88.6%) | 4 (11.4%) |
| Educational Services | 112 (49.1%) | 116 (50.9%) |
| Health Care & Social Assistance | 156 (42.7%) | 209 (57.3%) |
| Arts, Entertainment & Recreation | 8 (22.9%) | 27 (77.1%) |
| Accommodation & Food Services | 32 (13.0%) | 215 (87.0%) |
| Public Administration | 54 (59.3%) | 37 (40.7%) |
| Total | 932 (50.9%) | 898 (49.1%) |
Education in Grape Creek
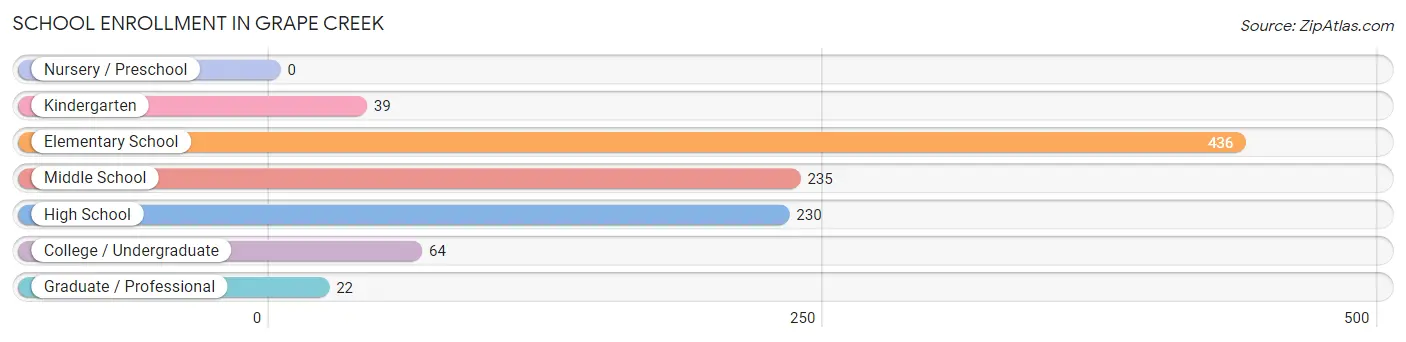
School Enrollment in Grape Creek
The most common levels of schooling among the 1,026 students in Grape Creek are elementary school (436 | 42.5%), middle school (235 | 22.9%), and high school (230 | 22.4%).
| School Level | # Students | % Students |
| Nursery / Preschool | 0 | 0.0% |
| Kindergarten | 39 | 3.8% |
| Elementary School | 436 | 42.5% |
| Middle School | 235 | 22.9% |
| High School | 230 | 22.4% |
| College / Undergraduate | 64 | 6.2% |
| Graduate / Professional | 22 | 2.1% |
| Total | 1,026 | 100.0% |
School Enrollment by Age by Funding Source in Grape Creek
Out of a total of 1,026 students who are enrolled in schools in Grape Creek, 41 (4.0%) attend a private institution, while the remaining 985 (96.0%) are enrolled in public schools. The age group of 35 years and over has the highest likelihood of being enrolled in private schools, with 10 (21.3% in the age bracket) enrolled. Conversely, the age group of 18 to 19 year olds has the lowest likelihood of being enrolled in a private school, with 96 (100.0% in the age bracket) attending a public institution.
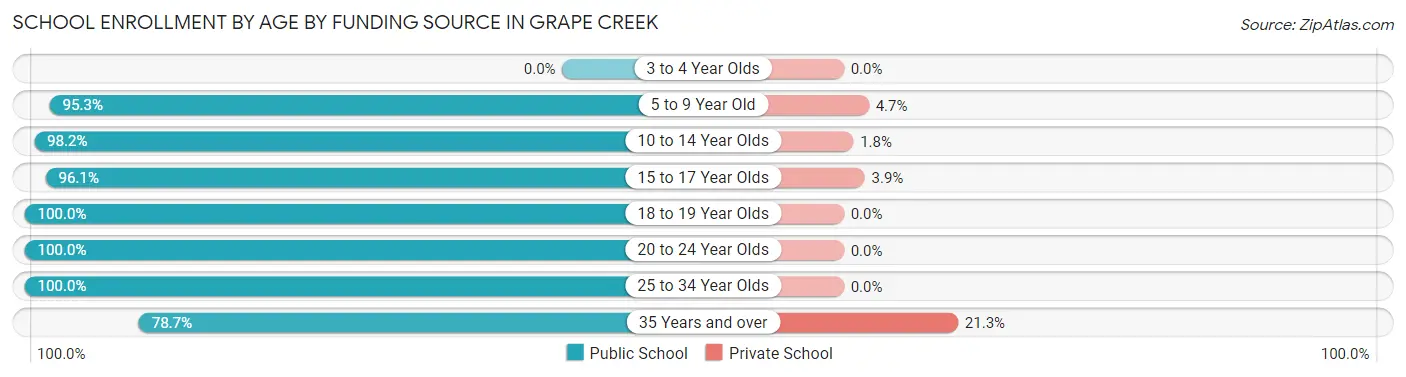
| Age Bracket | Public School | Private School |
| 3 to 4 Year Olds | 0 (0.0%) | 0 (0.0%) |
| 5 to 9 Year Old | 409 (95.3%) | 20 (4.7%) |
| 10 to 14 Year Olds | 276 (98.2%) | 5 (1.8%) |
| 15 to 17 Year Olds | 148 (96.1%) | 6 (3.9%) |
| 18 to 19 Year Olds | 96 (100.0%) | 0 (0.0%) |
| 20 to 24 Year Olds | 12 (100.0%) | 0 (0.0%) |
| 25 to 34 Year Olds | 7 (100.0%) | 0 (0.0%) |
| 35 Years and over | 37 (78.7%) | 10 (21.3%) |
| Total | 985 (96.0%) | 41 (4.0%) |
Educational Attainment by Field of Study in Grape Creek
Bio, nature & agricultural (148 | 25.1%), education (64 | 10.9%), business (61 | 10.4%), visual & performing arts (58 | 9.9%), and science & technology (49 | 8.3%) are the most common fields of study among 589 individuals in Grape Creek who have obtained a bachelor's degree or higher.
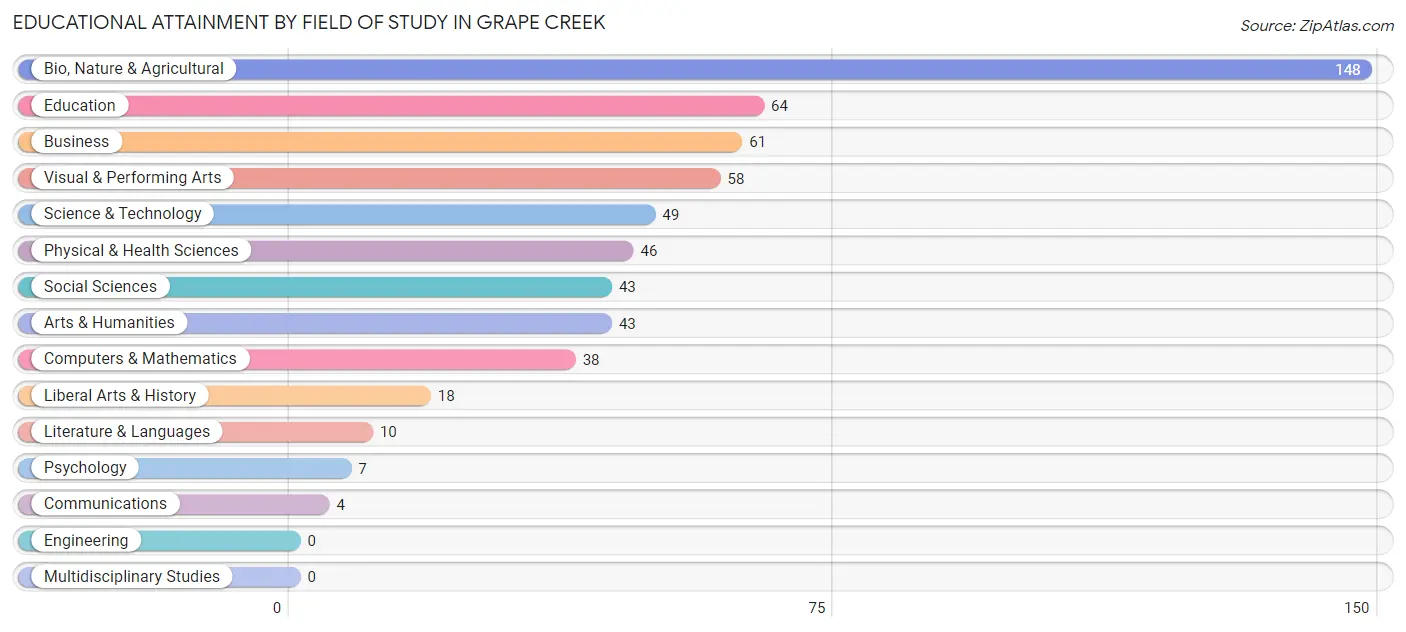
| Field of Study | # Graduates | % Graduates |
| Computers & Mathematics | 38 | 6.5% |
| Bio, Nature & Agricultural | 148 | 25.1% |
| Physical & Health Sciences | 46 | 7.8% |
| Psychology | 7 | 1.2% |
| Social Sciences | 43 | 7.3% |
| Engineering | 0 | 0.0% |
| Multidisciplinary Studies | 0 | 0.0% |
| Science & Technology | 49 | 8.3% |
| Business | 61 | 10.4% |
| Education | 64 | 10.9% |
| Literature & Languages | 10 | 1.7% |
| Liberal Arts & History | 18 | 3.1% |
| Visual & Performing Arts | 58 | 9.9% |
| Communications | 4 | 0.7% |
| Arts & Humanities | 43 | 7.3% |
| Total | 589 | 100.0% |
Transportation & Commute in Grape Creek
Vehicle Availability by Sex in Grape Creek
The most prevalent vehicle ownership categories in Grape Creek are males with 2 vehicles (463, accounting for 49.7%) and females with 2 vehicles (467, making up 52.5%).
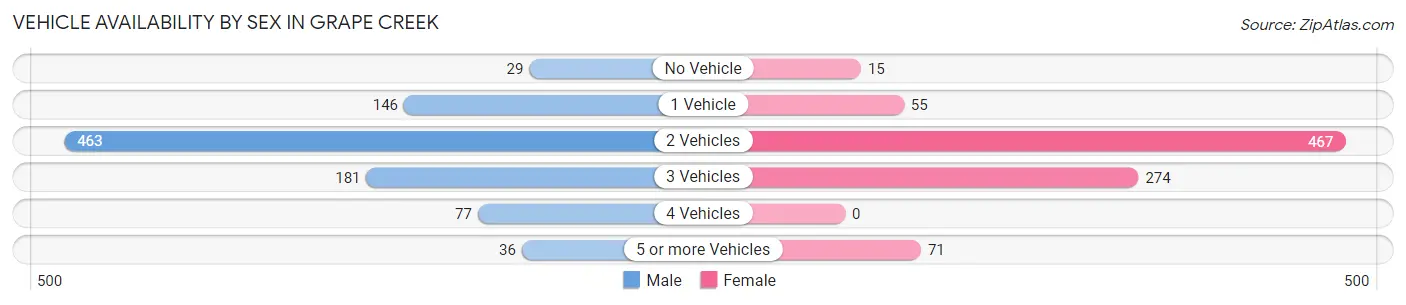
| Vehicles Available | Male | Female |
| No Vehicle | 29 (3.1%) | 15 (1.7%) |
| 1 Vehicle | 146 (15.7%) | 55 (6.2%) |
| 2 Vehicles | 463 (49.7%) | 467 (52.9%) |
| 3 Vehicles | 181 (19.4%) | 274 (31.1%) |
| 4 Vehicles | 77 (8.3%) | 0 (0.0%) |
| 5 or more Vehicles | 36 (3.9%) | 71 (8.1%) |
| Total | 932 (100.0%) | 882 (100.0%) |
Commute Time in Grape Creek
The most frequently occuring commute durations in Grape Creek are 20 to 24 minutes (340 commuters, 19.4%), 30 to 34 minutes (327 commuters, 18.7%), and 15 to 19 minutes (243 commuters, 13.9%).
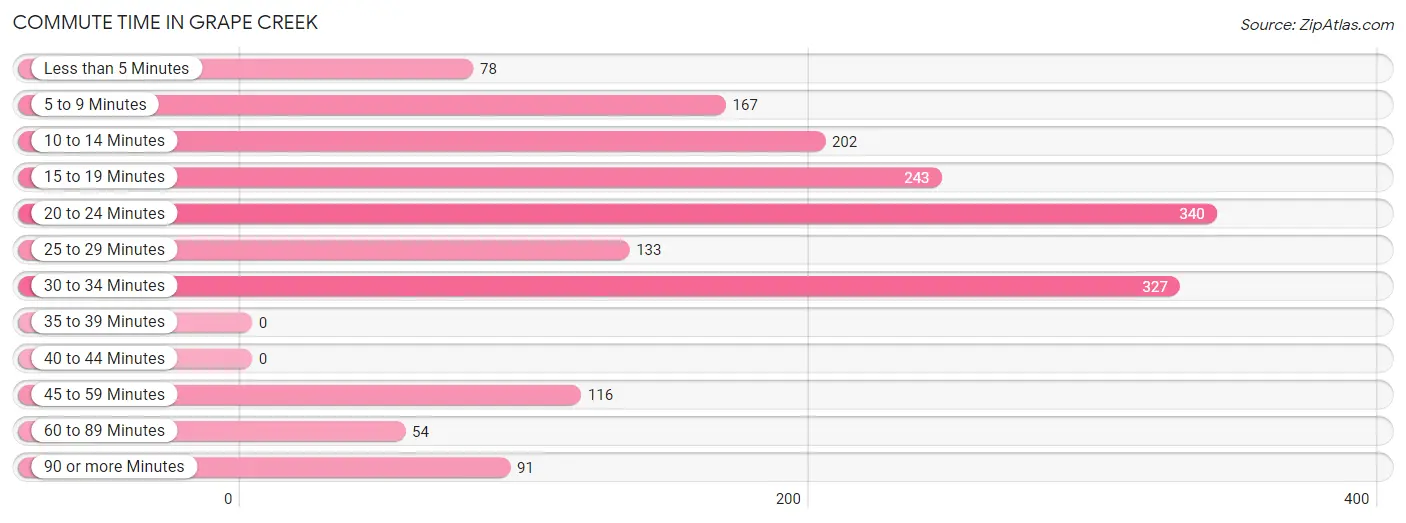
| Commute Time | # Commuters | % Commuters |
| Less than 5 Minutes | 78 | 4.4% |
| 5 to 9 Minutes | 167 | 9.5% |
| 10 to 14 Minutes | 202 | 11.5% |
| 15 to 19 Minutes | 243 | 13.9% |
| 20 to 24 Minutes | 340 | 19.4% |
| 25 to 29 Minutes | 133 | 7.6% |
| 30 to 34 Minutes | 327 | 18.7% |
| 35 to 39 Minutes | 0 | 0.0% |
| 40 to 44 Minutes | 0 | 0.0% |
| 45 to 59 Minutes | 116 | 6.6% |
| 60 to 89 Minutes | 54 | 3.1% |
| 90 or more Minutes | 91 | 5.2% |
Commute Time by Sex in Grape Creek
The most common commute times in Grape Creek are 20 to 24 minutes (186 commuters, 20.5%) for males and 10 to 14 minutes (197 commuters, 23.3%) for females.
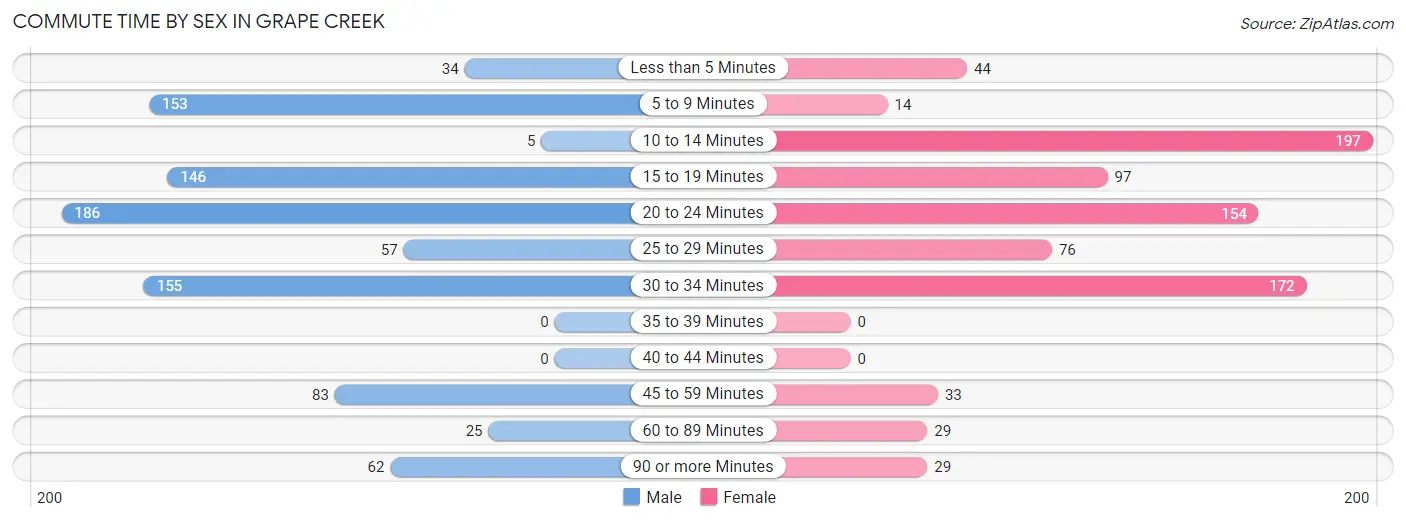
| Commute Time | Male | Female |
| Less than 5 Minutes | 34 (3.7%) | 44 (5.2%) |
| 5 to 9 Minutes | 153 (16.9%) | 14 (1.7%) |
| 10 to 14 Minutes | 5 (0.5%) | 197 (23.3%) |
| 15 to 19 Minutes | 146 (16.1%) | 97 (11.5%) |
| 20 to 24 Minutes | 186 (20.5%) | 154 (18.2%) |
| 25 to 29 Minutes | 57 (6.3%) | 76 (9.0%) |
| 30 to 34 Minutes | 155 (17.1%) | 172 (20.4%) |
| 35 to 39 Minutes | 0 (0.0%) | 0 (0.0%) |
| 40 to 44 Minutes | 0 (0.0%) | 0 (0.0%) |
| 45 to 59 Minutes | 83 (9.2%) | 33 (3.9%) |
| 60 to 89 Minutes | 25 (2.8%) | 29 (3.4%) |
| 90 or more Minutes | 62 (6.8%) | 29 (3.4%) |
Time of Departure to Work by Sex in Grape Creek
The most frequent times of departure to work in Grape Creek are 7:00 AM to 7:29 AM (385, 42.5%) for males and 7:30 AM to 7:59 AM (171, 20.2%) for females.
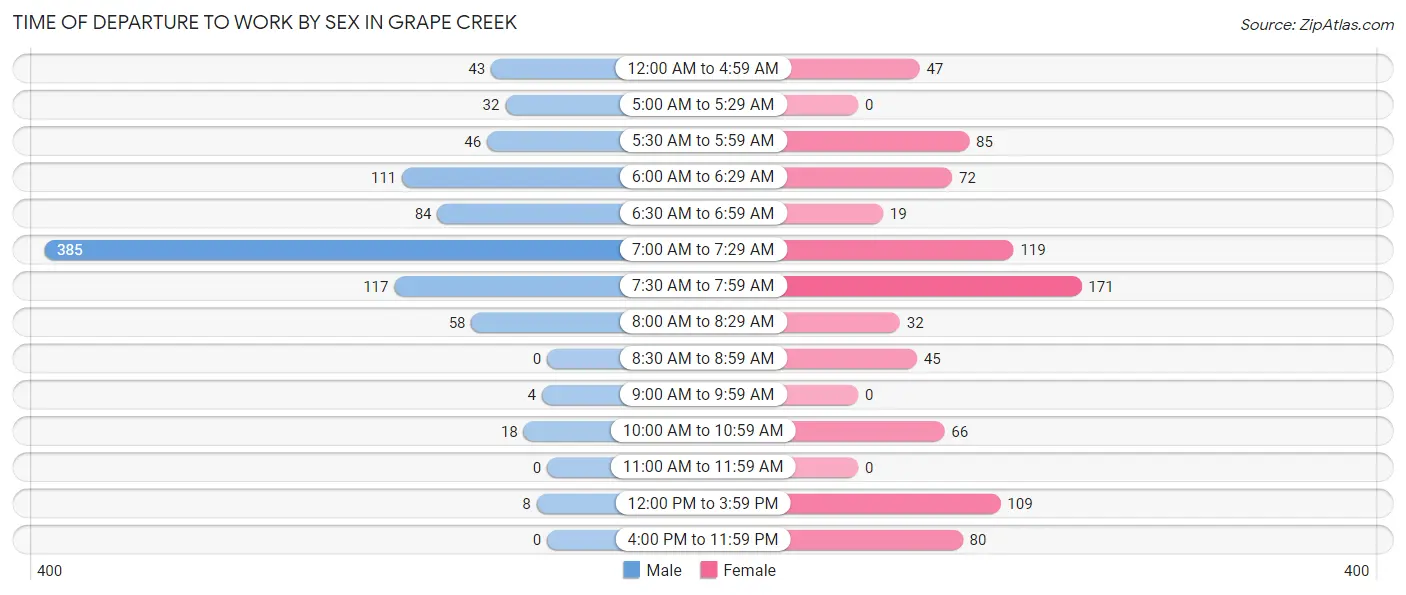
| Time of Departure | Male | Female |
| 12:00 AM to 4:59 AM | 43 (4.8%) | 47 (5.6%) |
| 5:00 AM to 5:29 AM | 32 (3.5%) | 0 (0.0%) |
| 5:30 AM to 5:59 AM | 46 (5.1%) | 85 (10.1%) |
| 6:00 AM to 6:29 AM | 111 (12.2%) | 72 (8.5%) |
| 6:30 AM to 6:59 AM | 84 (9.3%) | 19 (2.2%) |
| 7:00 AM to 7:29 AM | 385 (42.5%) | 119 (14.1%) |
| 7:30 AM to 7:59 AM | 117 (12.9%) | 171 (20.2%) |
| 8:00 AM to 8:29 AM | 58 (6.4%) | 32 (3.8%) |
| 8:30 AM to 8:59 AM | 0 (0.0%) | 45 (5.3%) |
| 9:00 AM to 9:59 AM | 4 (0.4%) | 0 (0.0%) |
| 10:00 AM to 10:59 AM | 18 (2.0%) | 66 (7.8%) |
| 11:00 AM to 11:59 AM | 0 (0.0%) | 0 (0.0%) |
| 12:00 PM to 3:59 PM | 8 (0.9%) | 109 (12.9%) |
| 4:00 PM to 11:59 PM | 0 (0.0%) | 80 (9.5%) |
| Total | 906 (100.0%) | 845 (100.0%) |
Housing Occupancy in Grape Creek
Occupancy by Ownership in Grape Creek
Of the total 1,467 dwellings in Grape Creek, owner-occupied units account for 1,166 (79.5%), while renter-occupied units make up 301 (20.5%).
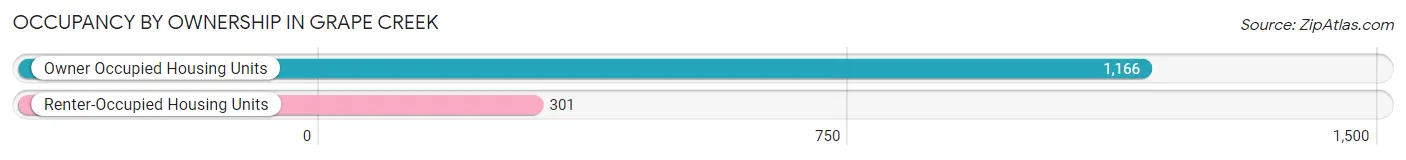
| Occupancy | # Housing Units | % Housing Units |
| Owner Occupied Housing Units | 1,166 | 79.5% |
| Renter-Occupied Housing Units | 301 | 20.5% |
| Total Occupied Housing Units | 1,467 | 100.0% |
Occupancy by Household Size in Grape Creek
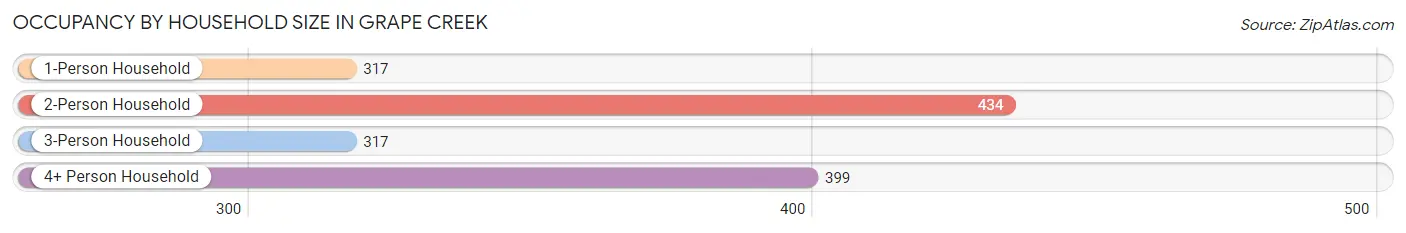
| Household Size | # Housing Units | % Housing Units |
| 1-Person Household | 317 | 21.6% |
| 2-Person Household | 434 | 29.6% |
| 3-Person Household | 317 | 21.6% |
| 4+ Person Household | 399 | 27.2% |
| Total Housing Units | 1,467 | 100.0% |
Occupancy by Ownership by Household Size in Grape Creek
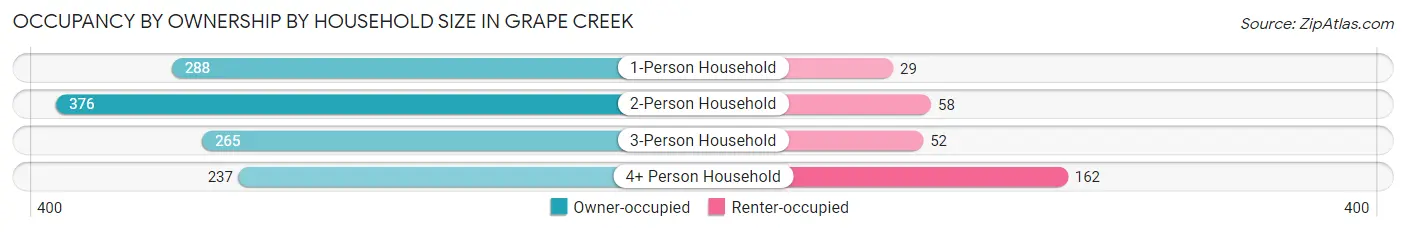
| Household Size | Owner-occupied | Renter-occupied |
| 1-Person Household | 288 (90.8%) | 29 (9.1%) |
| 2-Person Household | 376 (86.6%) | 58 (13.4%) |
| 3-Person Household | 265 (83.6%) | 52 (16.4%) |
| 4+ Person Household | 237 (59.4%) | 162 (40.6%) |
| Total Housing Units | 1,166 (79.5%) | 301 (20.5%) |
Occupancy by Educational Attainment in Grape Creek
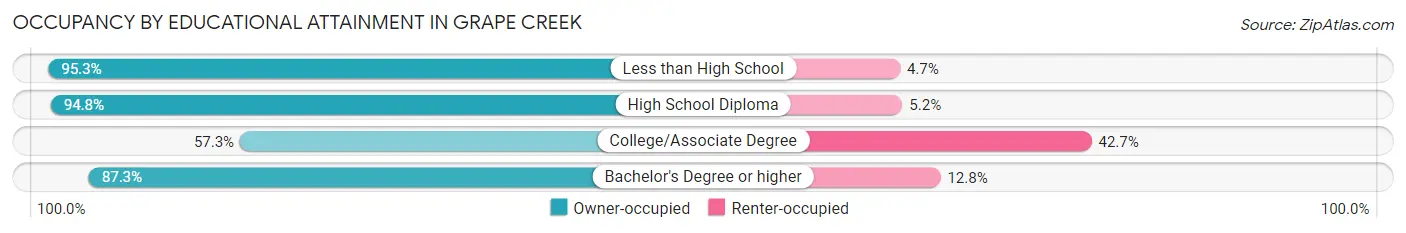
| Household Size | Owner-occupied | Renter-occupied |
| Less than High School | 283 (95.3%) | 14 (4.7%) |
| High School Diploma | 383 (94.8%) | 21 (5.2%) |
| College/Associate Degree | 322 (57.3%) | 240 (42.7%) |
| Bachelor's Degree or higher | 178 (87.3%) | 26 (12.8%) |
Occupancy by Age of Householder in Grape Creek
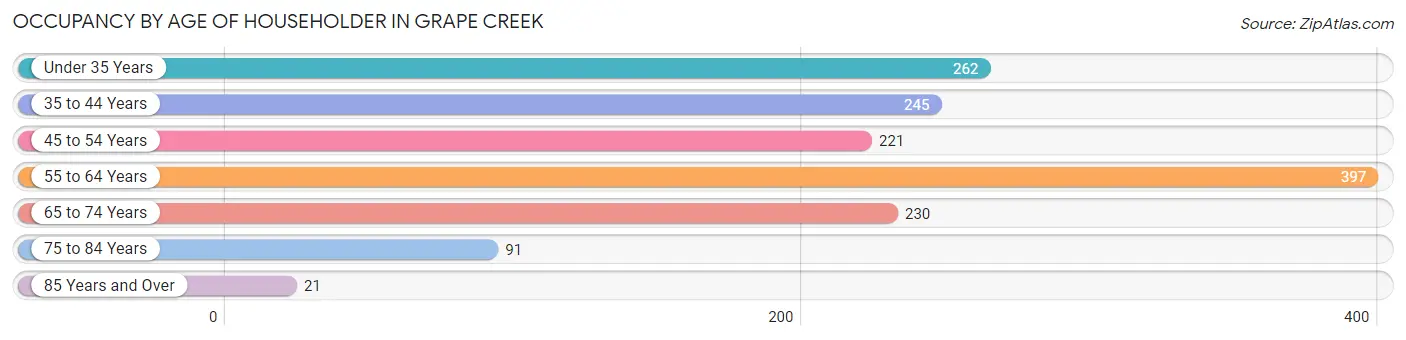
| Age Bracket | # Households | % Households |
| Under 35 Years | 262 | 17.9% |
| 35 to 44 Years | 245 | 16.7% |
| 45 to 54 Years | 221 | 15.1% |
| 55 to 64 Years | 397 | 27.1% |
| 65 to 74 Years | 230 | 15.7% |
| 75 to 84 Years | 91 | 6.2% |
| 85 Years and Over | 21 | 1.4% |
| Total | 1,467 | 100.0% |
Housing Finances in Grape Creek
Median Income by Occupancy in Grape Creek
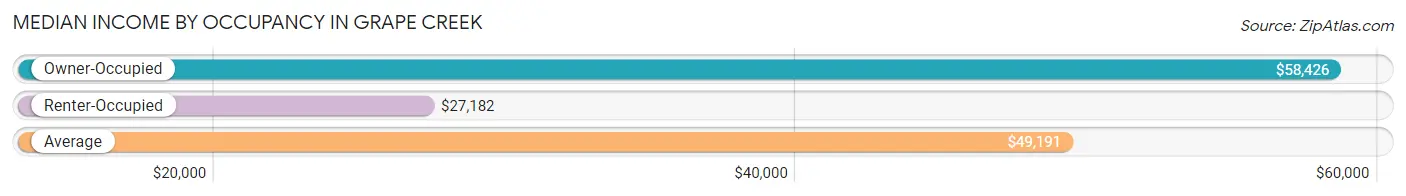
| Occupancy Type | # Households | Median Income |
| Owner-Occupied | 1,166 (79.5%) | $58,426 |
| Renter-Occupied | 301 (20.5%) | $27,182 |
| Average | 1,467 (100.0%) | $49,191 |
Occupancy by Householder Income Bracket in Grape Creek
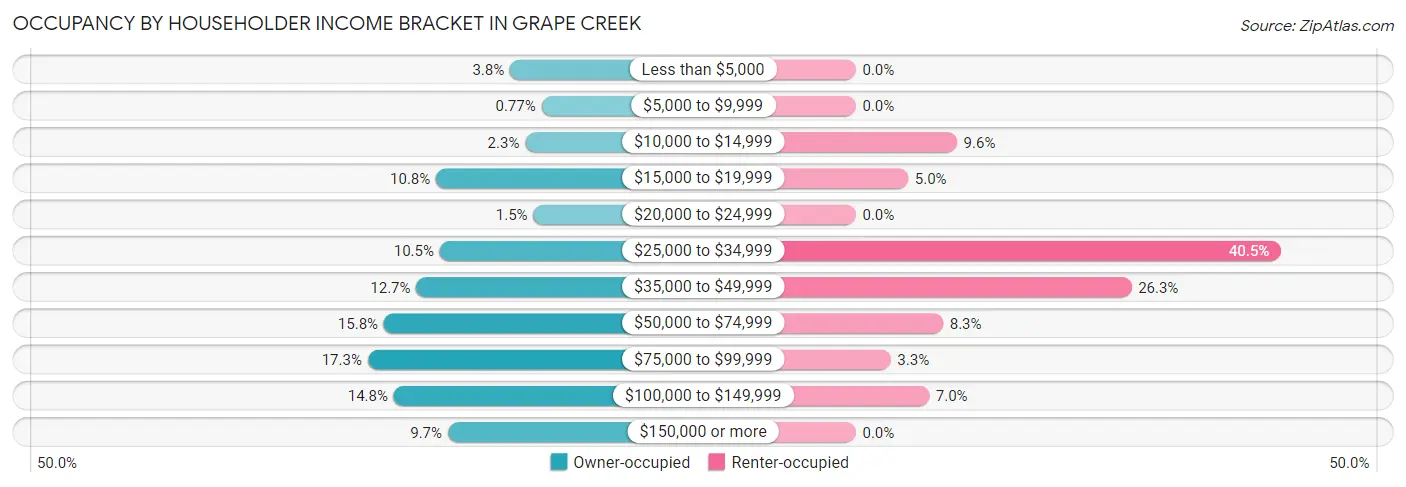
| Income Bracket | Owner-occupied | Renter-occupied |
| Less than $5,000 | 44 (3.8%) | 0 (0.0%) |
| $5,000 to $9,999 | 9 (0.8%) | 0 (0.0%) |
| $10,000 to $14,999 | 27 (2.3%) | 29 (9.6%) |
| $15,000 to $19,999 | 126 (10.8%) | 15 (5.0%) |
| $20,000 to $24,999 | 18 (1.5%) | 0 (0.0%) |
| $25,000 to $34,999 | 122 (10.5%) | 122 (40.5%) |
| $35,000 to $49,999 | 148 (12.7%) | 79 (26.3%) |
| $50,000 to $74,999 | 184 (15.8%) | 25 (8.3%) |
| $75,000 to $99,999 | 202 (17.3%) | 10 (3.3%) |
| $100,000 to $149,999 | 173 (14.8%) | 21 (7.0%) |
| $150,000 or more | 113 (9.7%) | 0 (0.0%) |
| Total | 1,166 (100.0%) | 301 (100.0%) |
Monthly Housing Cost Tiers in Grape Creek
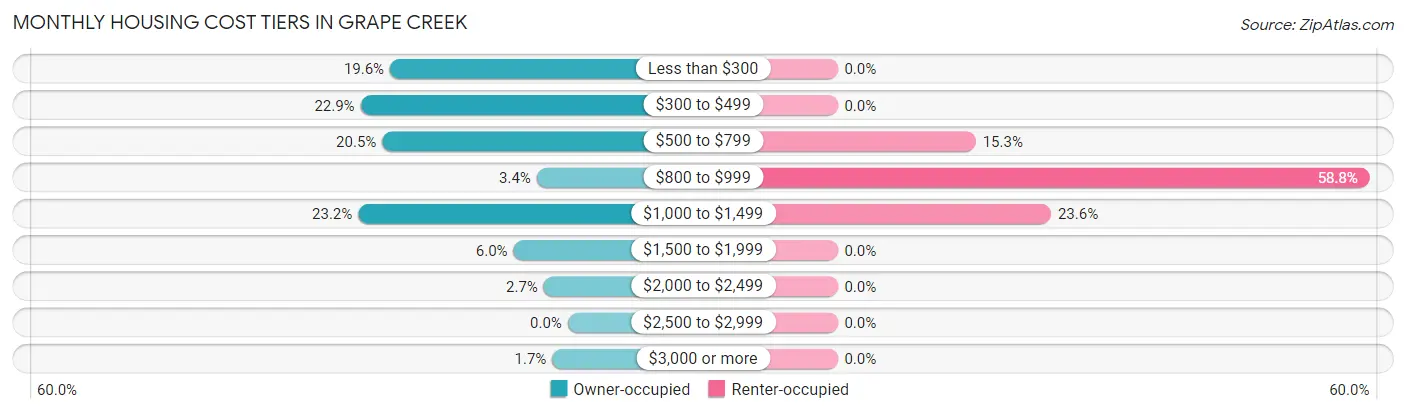
| Monthly Cost | Owner-occupied | Renter-occupied |
| Less than $300 | 229 (19.6%) | 0 (0.0%) |
| $300 to $499 | 267 (22.9%) | 0 (0.0%) |
| $500 to $799 | 239 (20.5%) | 46 (15.3%) |
| $800 to $999 | 40 (3.4%) | 177 (58.8%) |
| $1,000 to $1,499 | 270 (23.2%) | 71 (23.6%) |
| $1,500 to $1,999 | 70 (6.0%) | 0 (0.0%) |
| $2,000 to $2,499 | 31 (2.7%) | 0 (0.0%) |
| $2,500 to $2,999 | 0 (0.0%) | 0 (0.0%) |
| $3,000 or more | 20 (1.7%) | 0 (0.0%) |
| Total | 1,166 (100.0%) | 301 (100.0%) |
Physical Housing Characteristics in Grape Creek
Housing Structures in Grape Creek
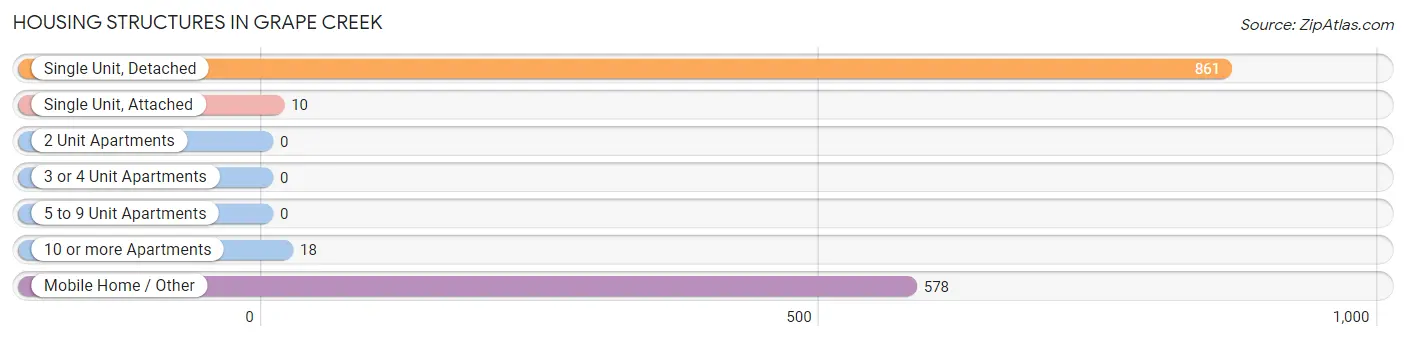
| Structure Type | # Housing Units | % Housing Units |
| Single Unit, Detached | 861 | 58.7% |
| Single Unit, Attached | 10 | 0.7% |
| 2 Unit Apartments | 0 | 0.0% |
| 3 or 4 Unit Apartments | 0 | 0.0% |
| 5 to 9 Unit Apartments | 0 | 0.0% |
| 10 or more Apartments | 18 | 1.2% |
| Mobile Home / Other | 578 | 39.4% |
| Total | 1,467 | 100.0% |
Housing Structures by Occupancy in Grape Creek
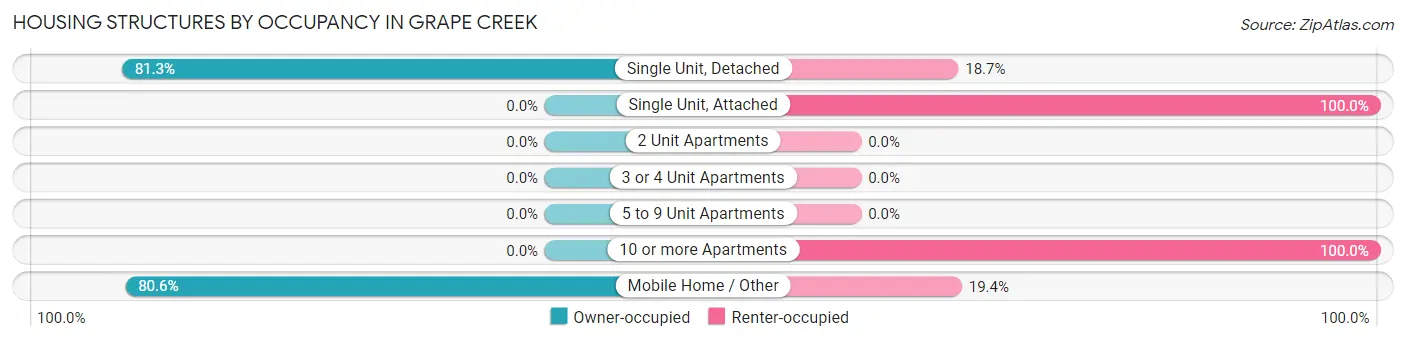
| Structure Type | Owner-occupied | Renter-occupied |
| Single Unit, Detached | 700 (81.3%) | 161 (18.7%) |
| Single Unit, Attached | 0 (0.0%) | 10 (100.0%) |
| 2 Unit Apartments | 0 (0.0%) | 0 (0.0%) |
| 3 or 4 Unit Apartments | 0 (0.0%) | 0 (0.0%) |
| 5 to 9 Unit Apartments | 0 (0.0%) | 0 (0.0%) |
| 10 or more Apartments | 0 (0.0%) | 18 (100.0%) |
| Mobile Home / Other | 466 (80.6%) | 112 (19.4%) |
| Total | 1,166 (79.5%) | 301 (20.5%) |
Housing Structures by Number of Rooms in Grape Creek
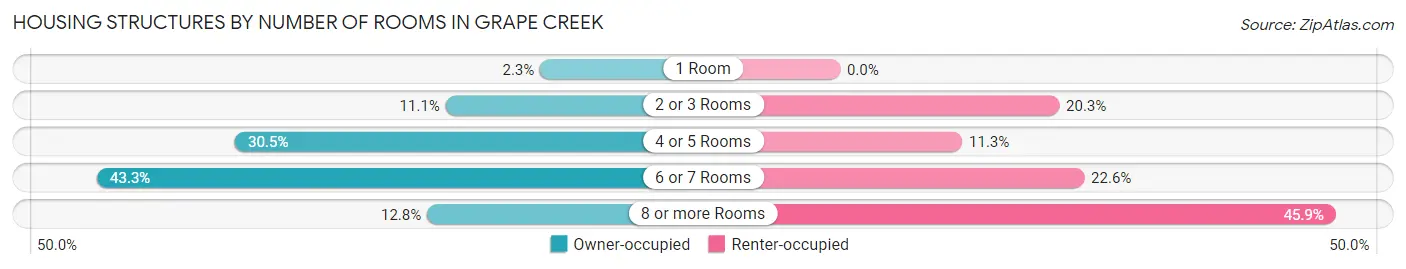
| Number of Rooms | Owner-occupied | Renter-occupied |
| 1 Room | 27 (2.3%) | 0 (0.0%) |
| 2 or 3 Rooms | 129 (11.1%) | 61 (20.3%) |
| 4 or 5 Rooms | 356 (30.5%) | 34 (11.3%) |
| 6 or 7 Rooms | 505 (43.3%) | 68 (22.6%) |
| 8 or more Rooms | 149 (12.8%) | 138 (45.9%) |
| Total | 1,166 (100.0%) | 301 (100.0%) |
Housing Structure by Heating Type in Grape Creek
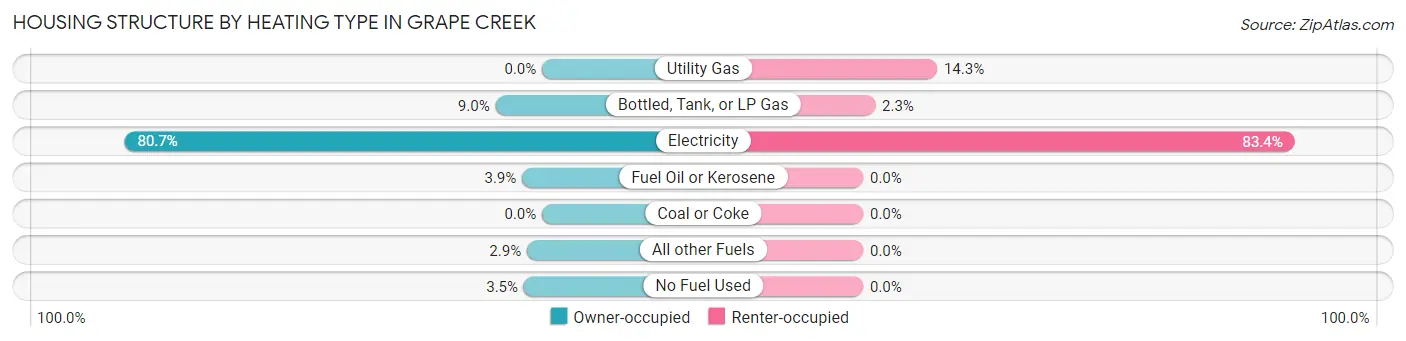
| Heating Type | Owner-occupied | Renter-occupied |
| Utility Gas | 0 (0.0%) | 43 (14.3%) |
| Bottled, Tank, or LP Gas | 105 (9.0%) | 7 (2.3%) |
| Electricity | 941 (80.7%) | 251 (83.4%) |
| Fuel Oil or Kerosene | 45 (3.9%) | 0 (0.0%) |
| Coal or Coke | 0 (0.0%) | 0 (0.0%) |
| All other Fuels | 34 (2.9%) | 0 (0.0%) |
| No Fuel Used | 41 (3.5%) | 0 (0.0%) |
| Total | 1,166 (100.0%) | 301 (100.0%) |
Household Vehicle Usage in Grape Creek
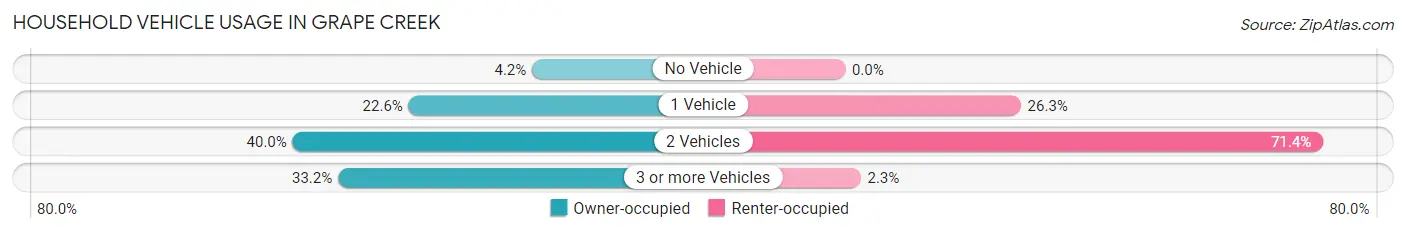
| Vehicles per Household | Owner-occupied | Renter-occupied |
| No Vehicle | 49 (4.2%) | 0 (0.0%) |
| 1 Vehicle | 264 (22.6%) | 79 (26.3%) |
| 2 Vehicles | 466 (40.0%) | 215 (71.4%) |
| 3 or more Vehicles | 387 (33.2%) | 7 (2.3%) |
| Total | 1,166 (100.0%) | 301 (100.0%) |
Real Estate & Mortgages in Grape Creek
Real Estate and Mortgage Overview in Grape Creek
| Characteristic | Without Mortgage | With Mortgage |
| Housing Units | 665 | 501 |
| Median Property Value | $103,000 | $180,000 |
| Median Household Income | $47,574 | $64 |
| Monthly Housing Costs | $371 | $20 |
| Real Estate Taxes | $660 | $53 |
Property Value by Mortgage Status in Grape Creek
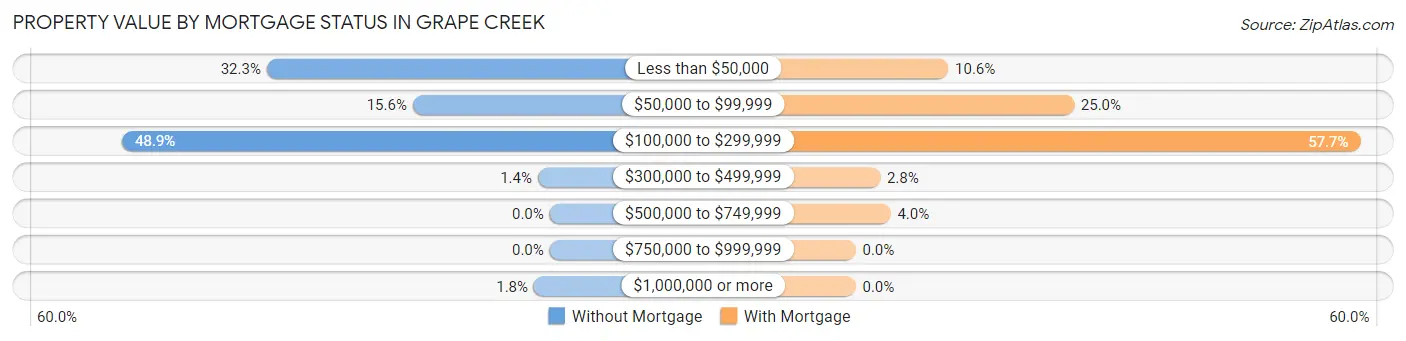
| Property Value | Without Mortgage | With Mortgage |
| Less than $50,000 | 215 (32.3%) | 53 (10.6%) |
| $50,000 to $99,999 | 104 (15.6%) | 125 (24.9%) |
| $100,000 to $299,999 | 325 (48.9%) | 289 (57.7%) |
| $300,000 to $499,999 | 9 (1.3%) | 14 (2.8%) |
| $500,000 to $749,999 | 0 (0.0%) | 20 (4.0%) |
| $750,000 to $999,999 | 0 (0.0%) | 0 (0.0%) |
| $1,000,000 or more | 12 (1.8%) | 0 (0.0%) |
| Total | 665 (100.0%) | 501 (100.0%) |
Household Income by Mortgage Status in Grape Creek
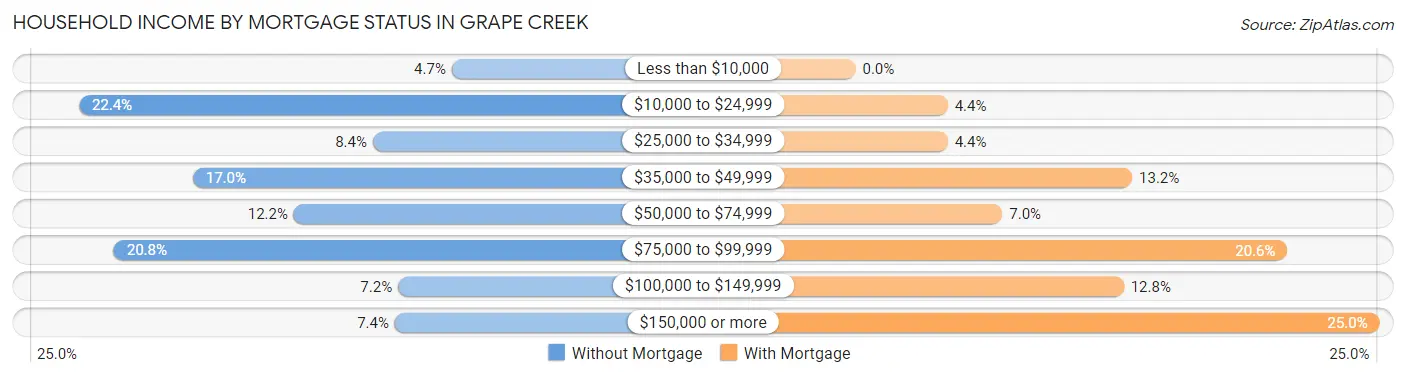
| Household Income | Without Mortgage | With Mortgage |
| Less than $10,000 | 31 (4.7%) | 0 (0.0%) |
| $10,000 to $24,999 | 149 (22.4%) | 22 (4.4%) |
| $25,000 to $34,999 | 56 (8.4%) | 22 (4.4%) |
| $35,000 to $49,999 | 113 (17.0%) | 66 (13.2%) |
| $50,000 to $74,999 | 81 (12.2%) | 35 (7.0%) |
| $75,000 to $99,999 | 138 (20.7%) | 103 (20.6%) |
| $100,000 to $149,999 | 48 (7.2%) | 64 (12.8%) |
| $150,000 or more | 49 (7.4%) | 125 (24.9%) |
| Total | 665 (100.0%) | 501 (100.0%) |
Property Value to Household Income Ratio in Grape Creek
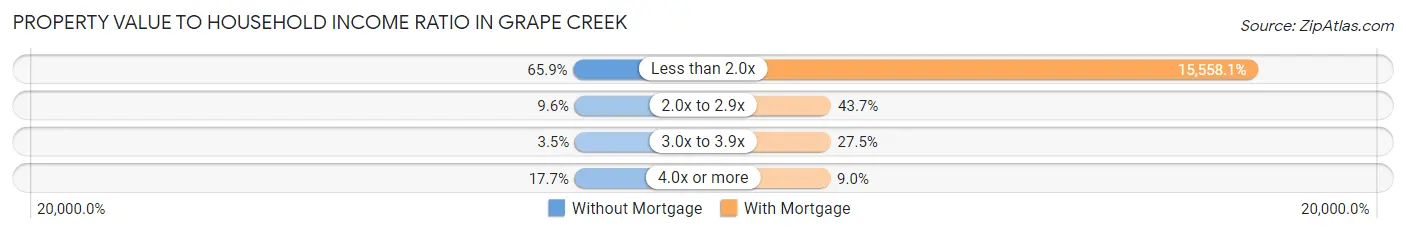
| Value-to-Income Ratio | Without Mortgage | With Mortgage |
| Less than 2.0x | 438 (65.9%) | 77,946 (15,558.1%) |
| 2.0x to 2.9x | 64 (9.6%) | 219 (43.7%) |
| 3.0x to 3.9x | 23 (3.5%) | 138 (27.5%) |
| 4.0x or more | 118 (17.7%) | 45 (9.0%) |
| Total | 665 (100.0%) | 501 (100.0%) |
Real Estate Taxes by Mortgage Status in Grape Creek
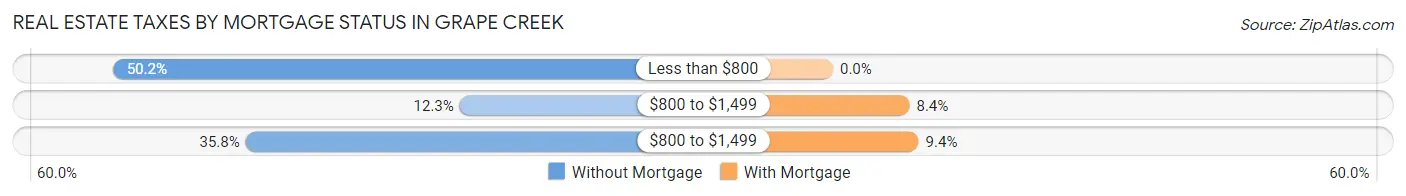
| Property Taxes | Without Mortgage | With Mortgage |
| Less than $800 | 334 (50.2%) | 0 (0.0%) |
| $800 to $1,499 | 82 (12.3%) | 42 (8.4%) |
| $800 to $1,499 | 238 (35.8%) | 47 (9.4%) |
| Total | 665 (100.0%) | 501 (100.0%) |
Health & Disability in Grape Creek
Health Insurance Coverage by Age in Grape Creek
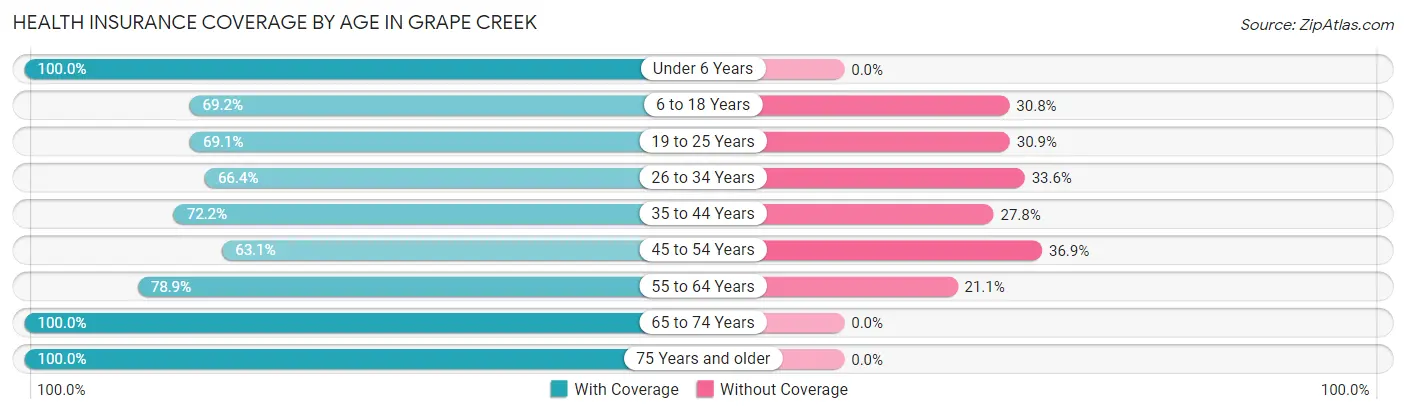
| Age Bracket | With Coverage | Without Coverage |
| Under 6 Years | 622 (100.0%) | 0 (0.0%) |
| 6 to 18 Years | 654 (69.2%) | 291 (30.8%) |
| 19 to 25 Years | 103 (69.1%) | 46 (30.9%) |
| 26 to 34 Years | 434 (66.4%) | 220 (33.6%) |
| 35 to 44 Years | 363 (72.2%) | 140 (27.8%) |
| 45 to 54 Years | 267 (63.1%) | 156 (36.9%) |
| 55 to 64 Years | 478 (78.9%) | 128 (21.1%) |
| 65 to 74 Years | 328 (100.0%) | 0 (0.0%) |
| 75 Years and older | 161 (100.0%) | 0 (0.0%) |
| Total | 3,410 (77.7%) | 981 (22.3%) |
Health Insurance Coverage by Citizenship Status in Grape Creek
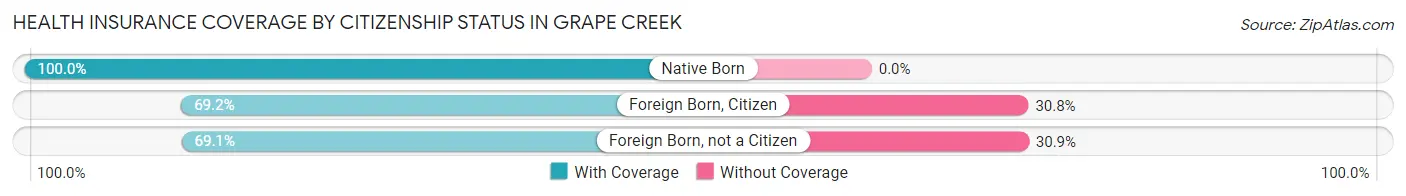
| Citizenship Status | With Coverage | Without Coverage |
| Native Born | 622 (100.0%) | 0 (0.0%) |
| Foreign Born, Citizen | 654 (69.2%) | 291 (30.8%) |
| Foreign Born, not a Citizen | 103 (69.1%) | 46 (30.9%) |
Health Insurance Coverage by Household Income in Grape Creek
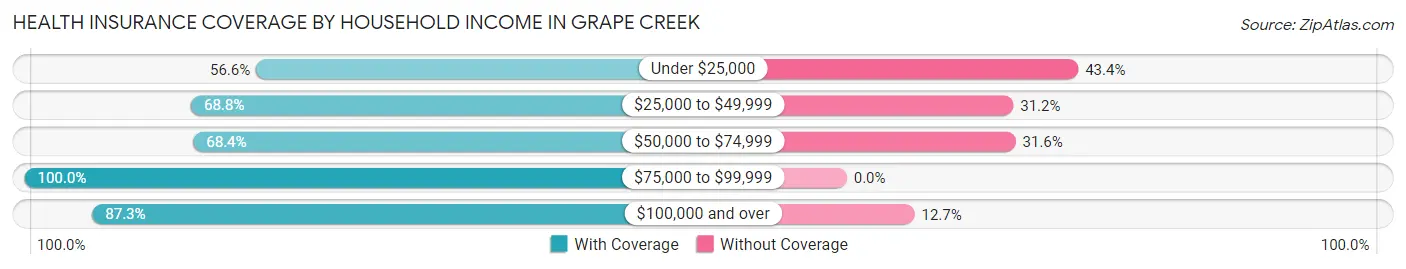
| Household Income | With Coverage | Without Coverage |
| Under $25,000 | 273 (56.6%) | 209 (43.4%) |
| $25,000 to $49,999 | 1,103 (68.8%) | 500 (31.2%) |
| $50,000 to $74,999 | 348 (68.4%) | 161 (31.6%) |
| $75,000 to $99,999 | 923 (100.0%) | 0 (0.0%) |
| $100,000 and over | 763 (87.3%) | 111 (12.7%) |
Public vs Private Health Insurance Coverage by Age in Grape Creek
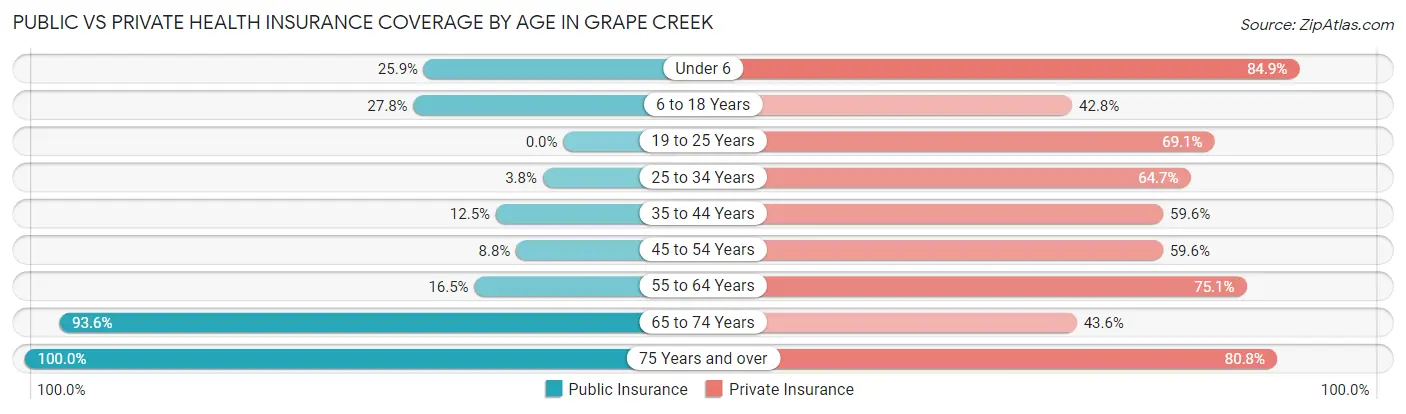
| Age Bracket | Public Insurance | Private Insurance |
| Under 6 | 161 (25.9%) | 528 (84.9%) |
| 6 to 18 Years | 263 (27.8%) | 404 (42.7%) |
| 19 to 25 Years | 0 (0.0%) | 103 (69.1%) |
| 25 to 34 Years | 25 (3.8%) | 423 (64.7%) |
| 35 to 44 Years | 63 (12.5%) | 300 (59.6%) |
| 45 to 54 Years | 37 (8.7%) | 252 (59.6%) |
| 55 to 64 Years | 100 (16.5%) | 455 (75.1%) |
| 65 to 74 Years | 307 (93.6%) | 143 (43.6%) |
| 75 Years and over | 161 (100.0%) | 130 (80.7%) |
| Total | 1,117 (25.4%) | 2,738 (62.4%) |
Disability Status by Sex by Age in Grape Creek
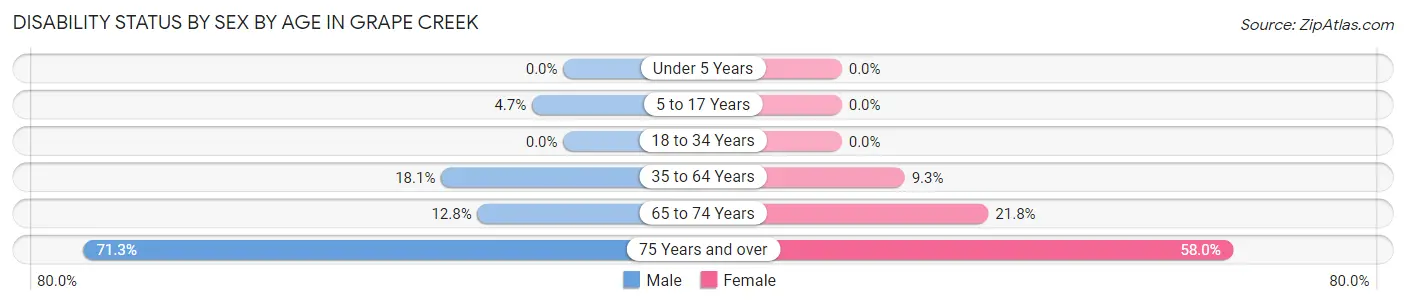
| Age Bracket | Male | Female |
| Under 5 Years | 0 (0.0%) | 0 (0.0%) |
| 5 to 17 Years | 22 (4.6%) | 0 (0.0%) |
| 18 to 34 Years | 0 (0.0%) | 0 (0.0%) |
| 35 to 64 Years | 136 (18.1%) | 73 (9.3%) |
| 65 to 74 Years | 26 (12.8%) | 27 (21.8%) |
| 75 Years and over | 57 (71.3%) | 47 (58.0%) |
Disability Class by Sex by Age in Grape Creek
Disability Class: Hearing Difficulty
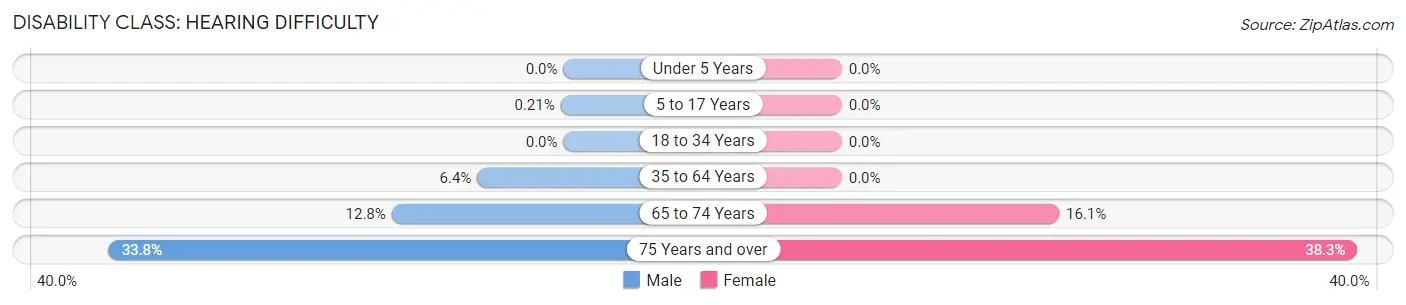
| Age Bracket | Male | Female |
| Under 5 Years | 0 (0.0%) | 0 (0.0%) |
| 5 to 17 Years | 1 (0.2%) | 0 (0.0%) |
| 18 to 34 Years | 0 (0.0%) | 0 (0.0%) |
| 35 to 64 Years | 48 (6.4%) | 0 (0.0%) |
| 65 to 74 Years | 26 (12.8%) | 20 (16.1%) |
| 75 Years and over | 27 (33.8%) | 31 (38.3%) |
Disability Class: Vision Difficulty
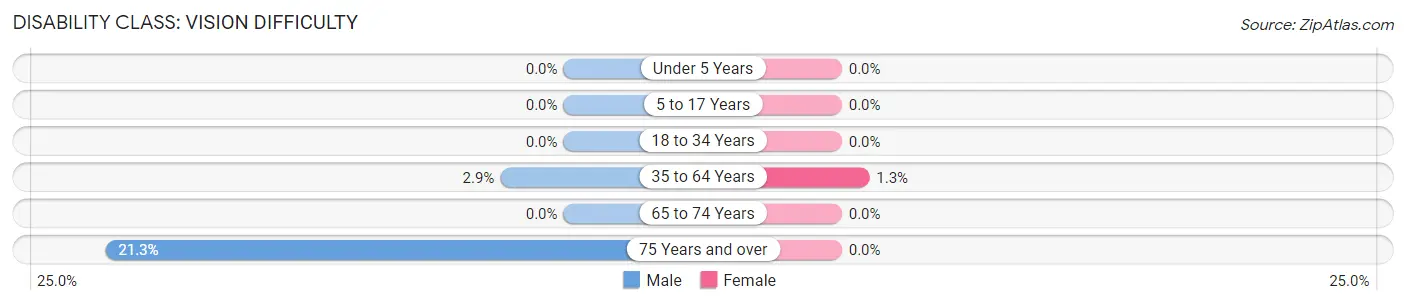
| Age Bracket | Male | Female |
| Under 5 Years | 0 (0.0%) | 0 (0.0%) |
| 5 to 17 Years | 0 (0.0%) | 0 (0.0%) |
| 18 to 34 Years | 0 (0.0%) | 0 (0.0%) |
| 35 to 64 Years | 22 (2.9%) | 10 (1.3%) |
| 65 to 74 Years | 0 (0.0%) | 0 (0.0%) |
| 75 Years and over | 17 (21.2%) | 0 (0.0%) |
Disability Class: Cognitive Difficulty
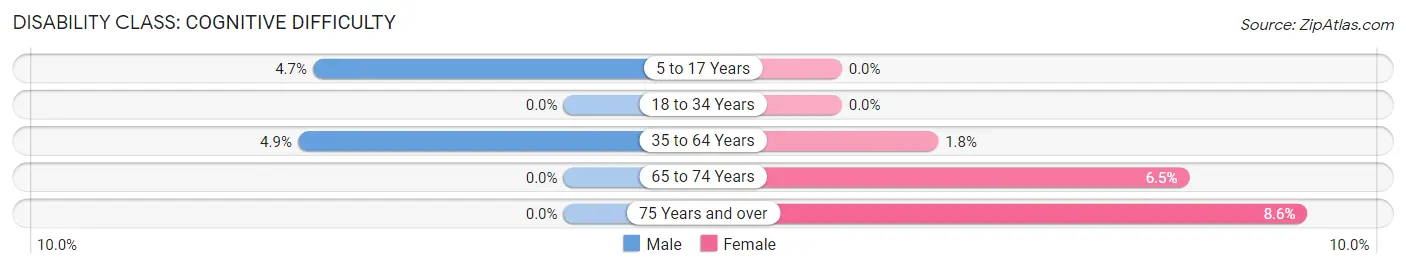
| Age Bracket | Male | Female |
| 5 to 17 Years | 22 (4.6%) | 0 (0.0%) |
| 18 to 34 Years | 0 (0.0%) | 0 (0.0%) |
| 35 to 64 Years | 37 (4.9%) | 14 (1.8%) |
| 65 to 74 Years | 0 (0.0%) | 8 (6.5%) |
| 75 Years and over | 0 (0.0%) | 7 (8.6%) |
Disability Class: Ambulatory Difficulty
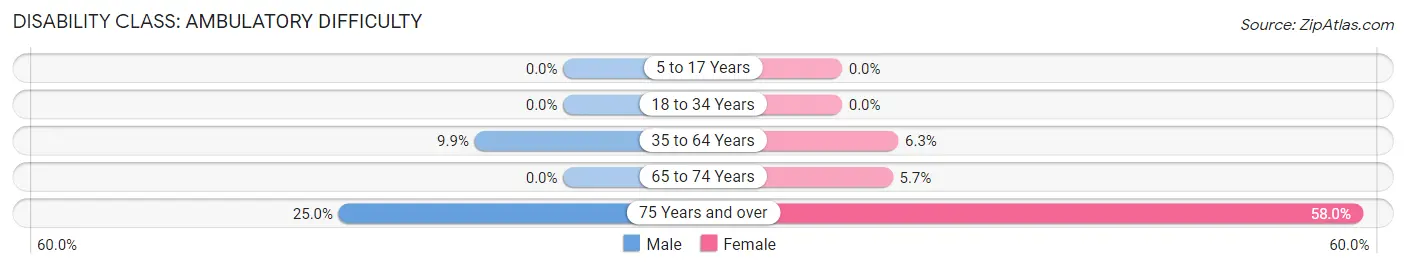
| Age Bracket | Male | Female |
| 5 to 17 Years | 0 (0.0%) | 0 (0.0%) |
| 18 to 34 Years | 0 (0.0%) | 0 (0.0%) |
| 35 to 64 Years | 74 (9.9%) | 49 (6.3%) |
| 65 to 74 Years | 0 (0.0%) | 7 (5.7%) |
| 75 Years and over | 20 (25.0%) | 47 (58.0%) |
Disability Class: Self-Care Difficulty
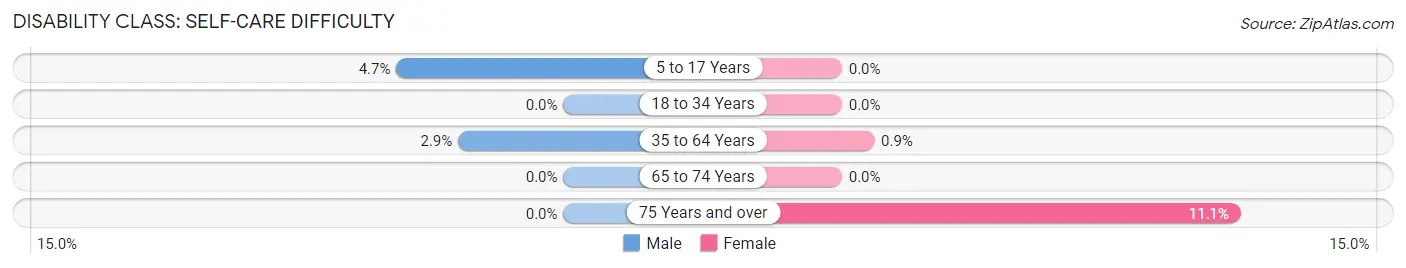
| Age Bracket | Male | Female |
| 5 to 17 Years | 22 (4.6%) | 0 (0.0%) |
| 18 to 34 Years | 0 (0.0%) | 0 (0.0%) |
| 35 to 64 Years | 22 (2.9%) | 7 (0.9%) |
| 65 to 74 Years | 0 (0.0%) | 0 (0.0%) |
| 75 Years and over | 0 (0.0%) | 9 (11.1%) |
Technology Access in Grape Creek
Computing Device Access in Grape Creek
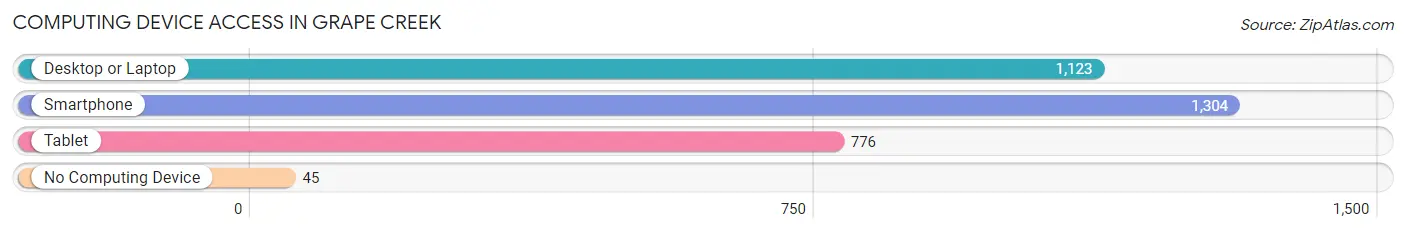
| Device Type | # Households | % Households |
| Desktop or Laptop | 1,123 | 76.5% |
| Smartphone | 1,304 | 88.9% |
| Tablet | 776 | 52.9% |
| No Computing Device | 45 | 3.1% |
| Total | 1,467 | 100.0% |
Internet Access in Grape Creek
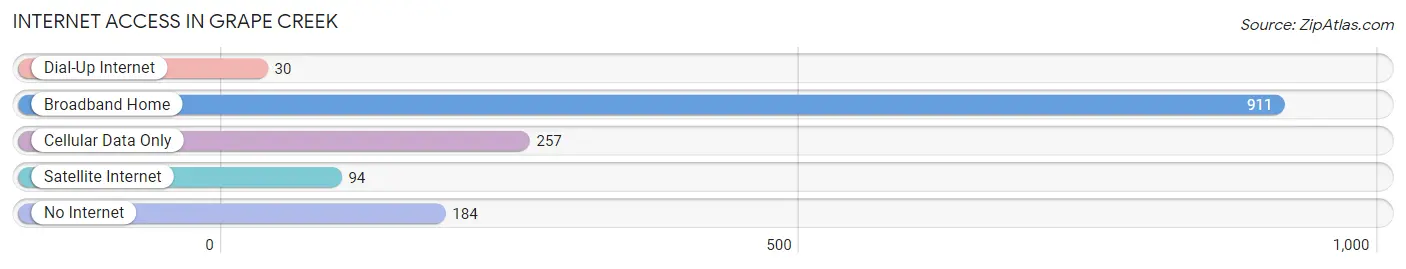
| Internet Type | # Households | % Households |
| Dial-Up Internet | 30 | 2.0% |
| Broadband Home | 911 | 62.1% |
| Cellular Data Only | 257 | 17.5% |
| Satellite Internet | 94 | 6.4% |
| No Internet | 184 | 12.5% |
| Total | 1,467 | 100.0% |
Grape Creek Summary
Grape Creek is a small unincorporated community located in Tom Green County, Texas. It is situated about 10 miles south of San Angelo and is part of the San Angelo Metropolitan Statistical Area. The population of Grape Creek was estimated to be 1,845 in 2019.
History
Grape Creek was first settled in the late 1800s by German immigrants who were attracted to the area by its fertile soil and abundant water supply. The town was originally called “Grapeville” and was later changed to “Grape Creek” in honor of the creek that runs through the area. The first post office was established in 1891 and the town was officially incorporated in 1909.
Geography
Grape Creek is located in the Concho Valley region of Texas, which is characterized by rolling hills and grassy plains. The town is situated on the banks of Grape Creek, which is a tributary of the Concho River. The climate in Grape Creek is semi-arid, with hot summers and mild winters.
Economy
Grape Creek’s economy is largely based on agriculture and ranching. The town is home to several farms and ranches, which produce a variety of crops including cotton, corn, wheat, and hay. The town also has a few small businesses, including a grocery store, a hardware store, and a few restaurants.
Demographics
Grape Creek is a predominantly white community, with the majority of the population being of German descent. The median household income in Grape Creek is $45,000, and the median home value is $125,000. The town has a low unemployment rate of 3.2%.
Conclusion
Grape Creek is a small unincorporated community located in Tom Green County, Texas. It is situated about 10 miles south of San Angelo and is part of the San Angelo Metropolitan Statistical Area. The town was first settled in the late 1800s by German immigrants and was officially incorporated in 1909. Grape Creek’s economy is largely based on agriculture and ranching, and the town has a predominantly white population with a median household income of $45,000.
Common Questions
What is Per Capita Income in Grape Creek?
Per Capita income in Grape Creek is $22,704.
What is the Median Family Income in Grape Creek?
Median Family Income in Grape Creek is $64,100.
What is the Median Household income in Grape Creek?
Median Household Income in Grape Creek is $49,191.
What is Income or Wage Gap in Grape Creek?
Income or Wage Gap in Grape Creek is 0.6%.
Women in Grape Creek earn 99.4 cents for every dollar earned by a man.
What is Family Income Deficit in Grape Creek?
Family Income Deficit in Grape Creek is $11,015.
Families that are below poverty line in Grape Creek earn $11,015 less on average than the poverty threshold level.
What is Inequality or Gini Index in Grape Creek?
Inequality or Gini Index in Grape Creek is 0.42.
What is the Total Population of Grape Creek?
Total Population of Grape Creek is 4,391.
What is the Total Male Population of Grape Creek?
Total Male Population of Grape Creek is 2,194.
What is the Total Female Population of Grape Creek?
Total Female Population of Grape Creek is 2,197.
What is the Ratio of Males per 100 Females in Grape Creek?
There are 99.86 Males per 100 Females in Grape Creek.
What is the Ratio of Females per 100 Males in Grape Creek?
There are 100.14 Females per 100 Males in Grape Creek.
What is the Median Population Age in Grape Creek?
Median Population Age in Grape Creek is 33.6 Years.
What is the Average Family Size in Grape Creek
Average Family Size in Grape Creek is 3.7 People.
What is the Average Household Size in Grape Creek
Average Household Size in Grape Creek is 3.0 People.
How Large is the Labor Force in Grape Creek?
There are 1,854 People in the Labor Forcein in Grape Creek.
What is the Percentage of People in the Labor Force in Grape Creek?
61.3% of People are in the Labor Force in Grape Creek.
What is the Unemployment Rate in Grape Creek?
Unemployment Rate in Grape Creek is 1.3%.