Mount Pleasant, TX Map & Demographics
Mount Pleasant Map
Mount Pleasant Overview
$22,858
PER CAPITA INCOME
$65,836
AVG FAMILY INCOME
$51,689
AVG HOUSEHOLD INCOME
40.5%
WAGE / INCOME GAP [ % ]
59.5¢/ $1
WAGE / INCOME GAP [ $ ]
0.44
INEQUALITY / GINI INDEX
16,065
TOTAL POPULATION
8,069
MALE POPULATION
7,996
FEMALE POPULATION
100.91
MALES / 100 FEMALES
99.10
FEMALES / 100 MALES
30.4
MEDIAN AGE
3.6
AVG FAMILY SIZE
2.9
AVG HOUSEHOLD SIZE
7,538
LABOR FORCE [ PEOPLE ]
64.7%
PERCENT IN LABOR FORCE
3.5%
UNEMPLOYMENT RATE
Mount Pleasant Zip Codes
Income in Mount Pleasant
Income Overview in Mount Pleasant
Per Capita Income in Mount Pleasant is $22,858, while median incomes of families and households are $65,836 and $51,689 respectively.
| Characteristic | Number | Measure |
| Per Capita Income | 16,065 | $22,858 |
| Median Family Income | 3,653 | $65,836 |
| Mean Family Income | 3,653 | $78,294 |
| Median Household Income | 5,418 | $51,689 |
| Mean Household Income | 5,418 | $67,114 |
| Income Deficit | 3,653 | $0 |
| Wage / Income Gap (%) | 16,065 | 40.47% |
| Wage / Income Gap ($) | 16,065 | 59.53¢ per $1 |
| Gini / Inequality Index | 16,065 | 0.44 |
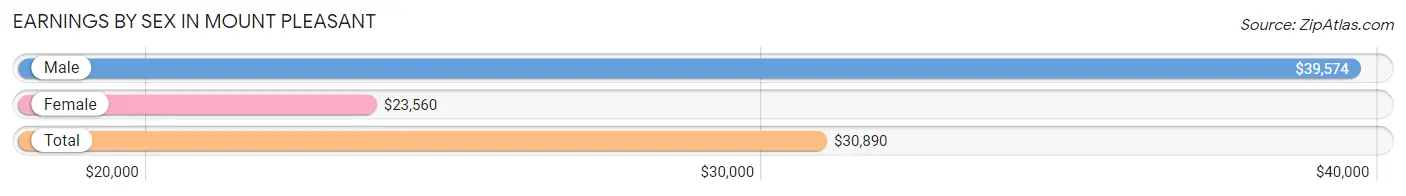
Earnings by Sex in Mount Pleasant
Average Earnings in Mount Pleasant are $30,890, $39,574 for men and $23,560 for women, a difference of 40.5%.
| Sex | Number | Average Earnings |
| Male | 4,205 (55.6%) | $39,574 |
| Female | 3,355 (44.4%) | $23,560 |
| Total | 7,560 (100.0%) | $30,890 |
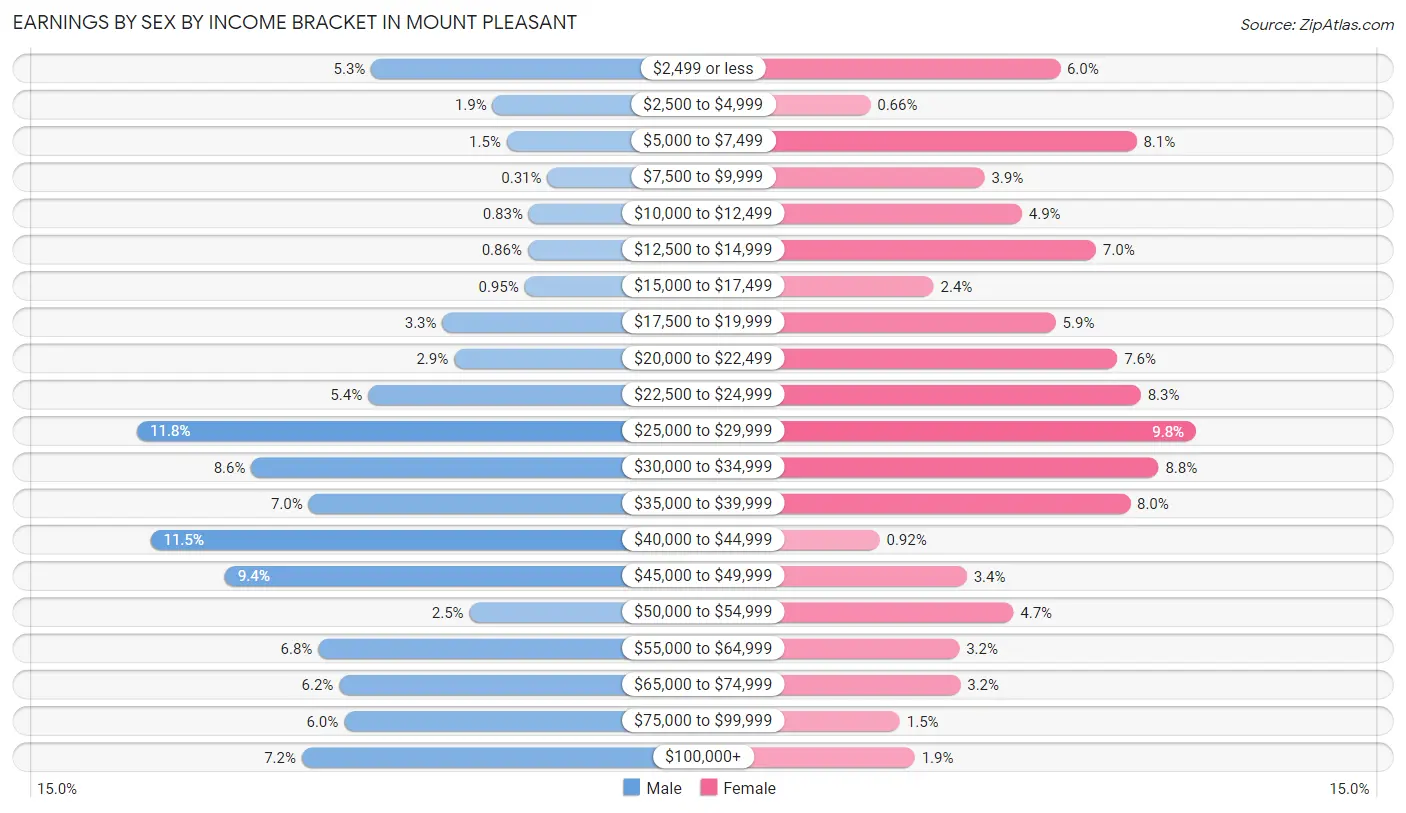
Earnings by Sex by Income Bracket in Mount Pleasant
The most common earnings brackets in Mount Pleasant are $25,000 to $29,999 for men (498 | 11.8%) and $25,000 to $29,999 for women (329 | 9.8%).
| Income | Male | Female |
| $2,499 or less | 221 (5.3%) | 201 (6.0%) |
| $2,500 to $4,999 | 78 (1.8%) | 22 (0.7%) |
| $5,000 to $7,499 | 61 (1.5%) | 273 (8.1%) |
| $7,500 to $9,999 | 13 (0.3%) | 130 (3.9%) |
| $10,000 to $12,499 | 35 (0.8%) | 165 (4.9%) |
| $12,500 to $14,999 | 36 (0.9%) | 235 (7.0%) |
| $15,000 to $17,499 | 40 (0.9%) | 82 (2.4%) |
| $17,500 to $19,999 | 137 (3.3%) | 197 (5.9%) |
| $20,000 to $22,499 | 123 (2.9%) | 255 (7.6%) |
| $22,500 to $24,999 | 225 (5.3%) | 277 (8.3%) |
| $25,000 to $29,999 | 498 (11.8%) | 329 (9.8%) |
| $30,000 to $34,999 | 363 (8.6%) | 294 (8.8%) |
| $35,000 to $39,999 | 295 (7.0%) | 267 (8.0%) |
| $40,000 to $44,999 | 482 (11.5%) | 31 (0.9%) |
| $45,000 to $49,999 | 394 (9.4%) | 113 (3.4%) |
| $50,000 to $54,999 | 105 (2.5%) | 157 (4.7%) |
| $55,000 to $64,999 | 284 (6.8%) | 106 (3.2%) |
| $65,000 to $74,999 | 259 (6.2%) | 107 (3.2%) |
| $75,000 to $99,999 | 253 (6.0%) | 50 (1.5%) |
| $100,000+ | 303 (7.2%) | 64 (1.9%) |
| Total | 4,205 (100.0%) | 3,355 (100.0%) |
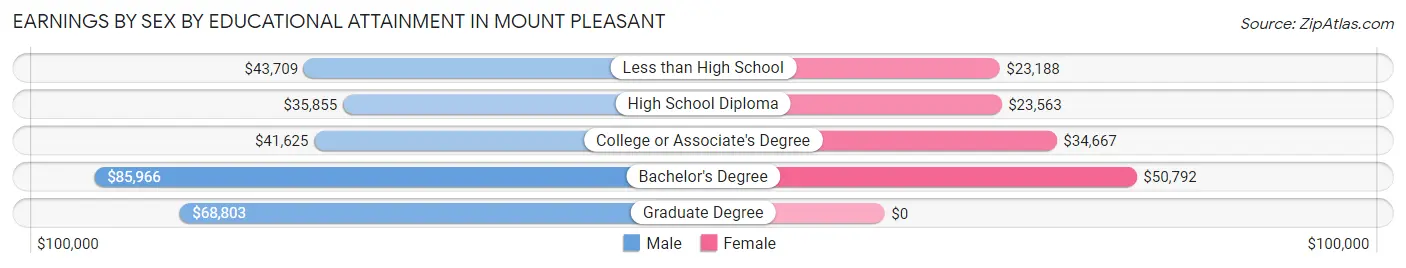
Earnings by Sex by Educational Attainment in Mount Pleasant
Average earnings in Mount Pleasant are $43,628 for men and $26,729 for women, a difference of 38.7%. Men with an educational attainment of bachelor's degree enjoy the highest average annual earnings of $85,966, while those with high school diploma education earn the least with $35,855. Women with an educational attainment of bachelor's degree earn the most with the average annual earnings of $50,792, while those with less than high school education have the smallest earnings of $23,188.
| Educational Attainment | Male Income | Female Income |
| Less than High School | $43,709 | $23,188 |
| High School Diploma | $35,855 | $23,563 |
| College or Associate's Degree | $41,625 | $34,667 |
| Bachelor's Degree | $85,966 | $50,792 |
| Graduate Degree | $68,803 | $0 |
| Total | $43,628 | $26,729 |
Family Income in Mount Pleasant
Family Income Brackets in Mount Pleasant
According to the Mount Pleasant family income data, there are 654 families falling into the $50,000 to $74,999 income range, which is the most common income bracket and makes up 17.9% of all families. Conversely, the $10,000 to $14,999 income bracket is the least frequent group with only 37 families (1.0%) belonging to this category.
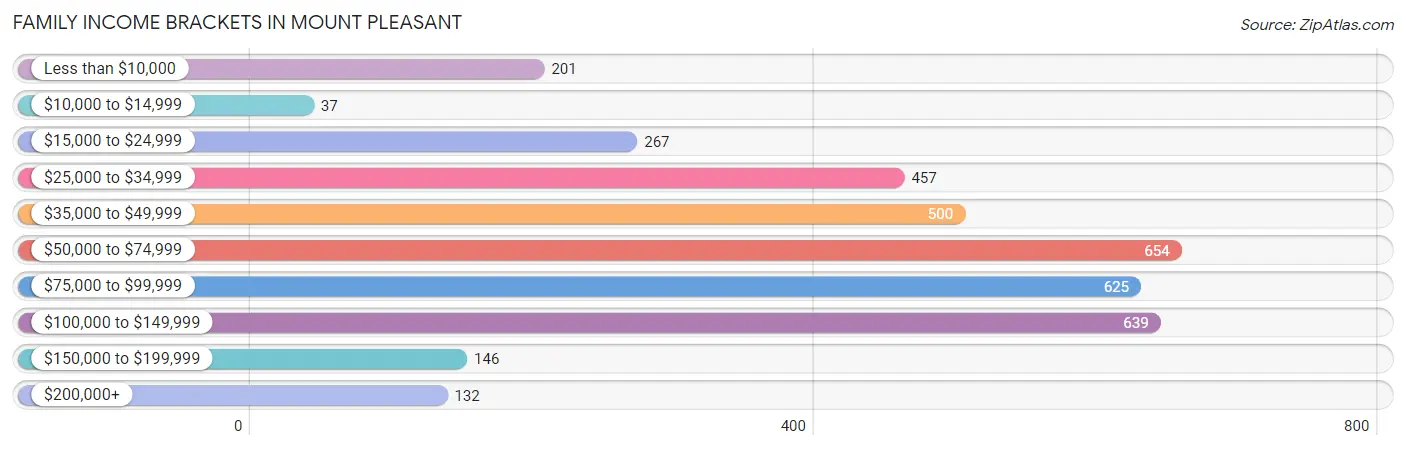
| Income Bracket | # Families | % Families |
| Less than $10,000 | 201 | 5.5% |
| $10,000 to $14,999 | 37 | 1.0% |
| $15,000 to $24,999 | 267 | 7.3% |
| $25,000 to $34,999 | 457 | 12.5% |
| $35,000 to $49,999 | 500 | 13.7% |
| $50,000 to $74,999 | 654 | 17.9% |
| $75,000 to $99,999 | 625 | 17.1% |
| $100,000 to $149,999 | 639 | 17.5% |
| $150,000 to $199,999 | 146 | 4.0% |
| $200,000+ | 132 | 3.6% |
Family Income by Famaliy Size in Mount Pleasant
7+ person families (245 | 6.7%) account for the highest median family income in Mount Pleasant with $115,352 per family, while 3-person families (755 | 20.7%) have the highest median income of $26,875 per family member.
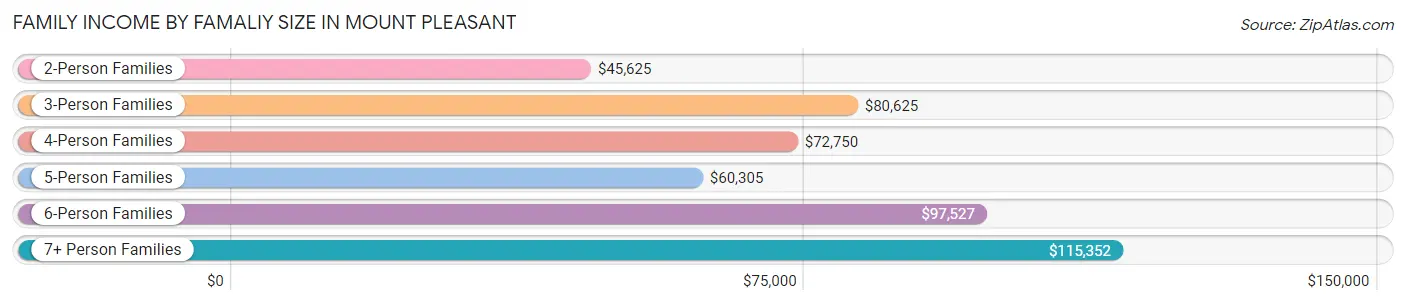
| Income Bracket | # Families | Median Income |
| 2-Person Families | 1,352 (37.0%) | $45,625 |
| 3-Person Families | 755 (20.7%) | $80,625 |
| 4-Person Families | 714 (19.6%) | $72,750 |
| 5-Person Families | 338 (9.2%) | $60,305 |
| 6-Person Families | 249 (6.8%) | $97,527 |
| 7+ Person Families | 245 (6.7%) | $115,352 |
| Total | 3,653 (100.0%) | $65,836 |
Family Income by Number of Earners in Mount Pleasant
The median family income in Mount Pleasant is $65,836, with families comprising 3+ earners (627) having the highest median family income of $99,814, while families with no earners (551) have the lowest median family income of $30,087, accounting for 17.2% and 15.1% of families, respectively.
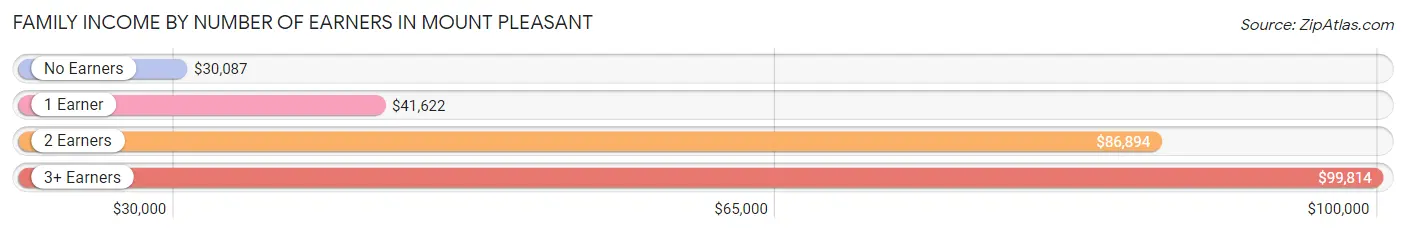
| Number of Earners | # Families | Median Income |
| No Earners | 551 (15.1%) | $30,087 |
| 1 Earner | 1,211 (33.2%) | $41,622 |
| 2 Earners | 1,264 (34.6%) | $86,894 |
| 3+ Earners | 627 (17.2%) | $99,814 |
| Total | 3,653 (100.0%) | $65,836 |
Household Income in Mount Pleasant
Household Income Brackets in Mount Pleasant
With 959 households falling in the category, the $50,000 to $74,999 income range is the most frequent in Mount Pleasant, accounting for 17.7% of all households. In contrast, only 135 households (2.5%) fall into the $200,000+ income bracket, making it the least populous group.
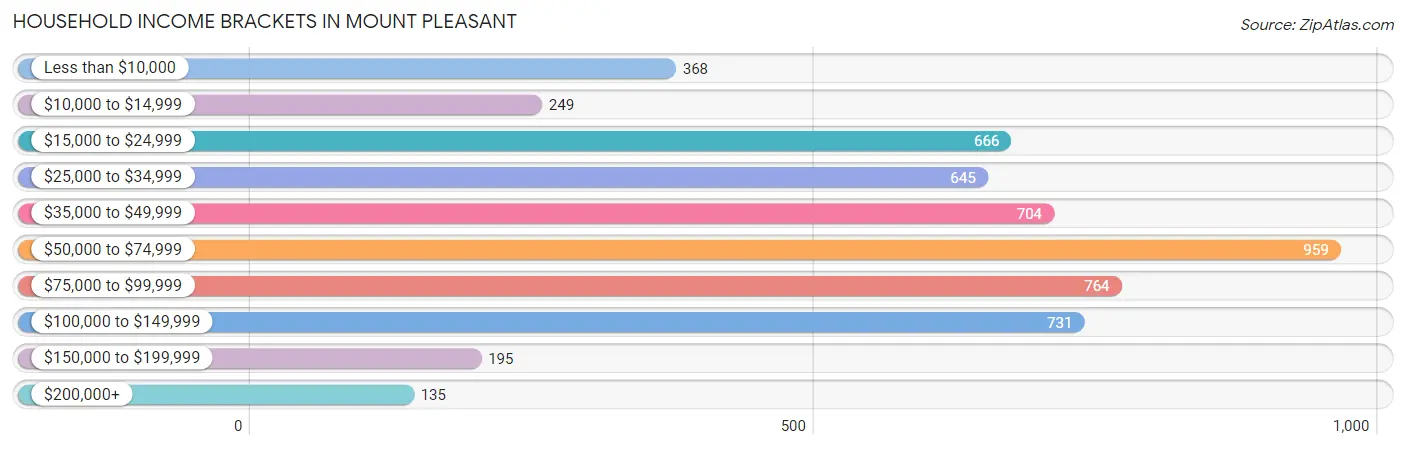
| Income Bracket | # Households | % Households |
| Less than $10,000 | 368 | 6.8% |
| $10,000 to $14,999 | 249 | 4.6% |
| $15,000 to $24,999 | 666 | 12.3% |
| $25,000 to $34,999 | 645 | 11.9% |
| $35,000 to $49,999 | 704 | 13.0% |
| $50,000 to $74,999 | 959 | 17.7% |
| $75,000 to $99,999 | 764 | 14.1% |
| $100,000 to $149,999 | 731 | 13.5% |
| $150,000 to $199,999 | 195 | 3.6% |
| $200,000+ | 135 | 2.5% |
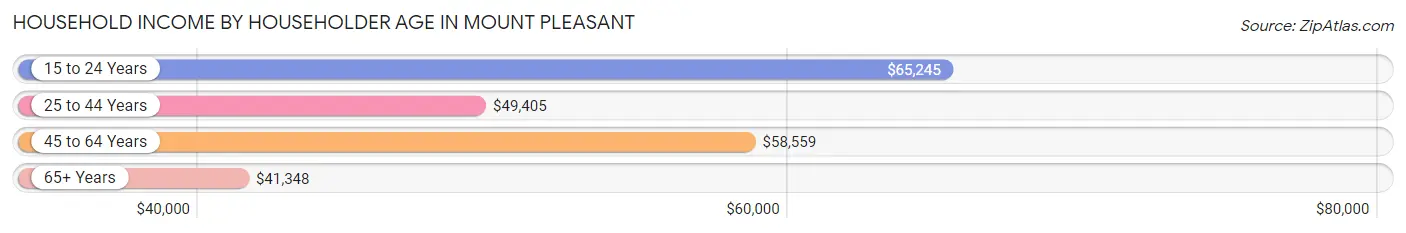
Household Income by Householder Age in Mount Pleasant
The median household income in Mount Pleasant is $51,689, with the highest median household income of $65,245 found in the 15 to 24 years age bracket for the primary householder. A total of 402 households (7.4%) fall into this category. Meanwhile, the 65+ years age bracket for the primary householder has the lowest median household income of $41,348, with 1,063 households (19.6%) in this group.
| Income Bracket | # Households | Median Income |
| 15 to 24 Years | 402 (7.4%) | $65,245 |
| 25 to 44 Years | 1,884 (34.8%) | $49,405 |
| 45 to 64 Years | 2,069 (38.2%) | $58,559 |
| 65+ Years | 1,063 (19.6%) | $41,348 |
| Total | 5,418 (100.0%) | $51,689 |
Poverty in Mount Pleasant
Income Below Poverty by Sex and Age in Mount Pleasant
With 13.0% poverty level for males and 18.2% for females among the residents of Mount Pleasant, 15 year old males and 15 year old females are the most vulnerable to poverty, with 54 males (28.4%) and 68 females (36.8%) in their respective age groups living below the poverty level.
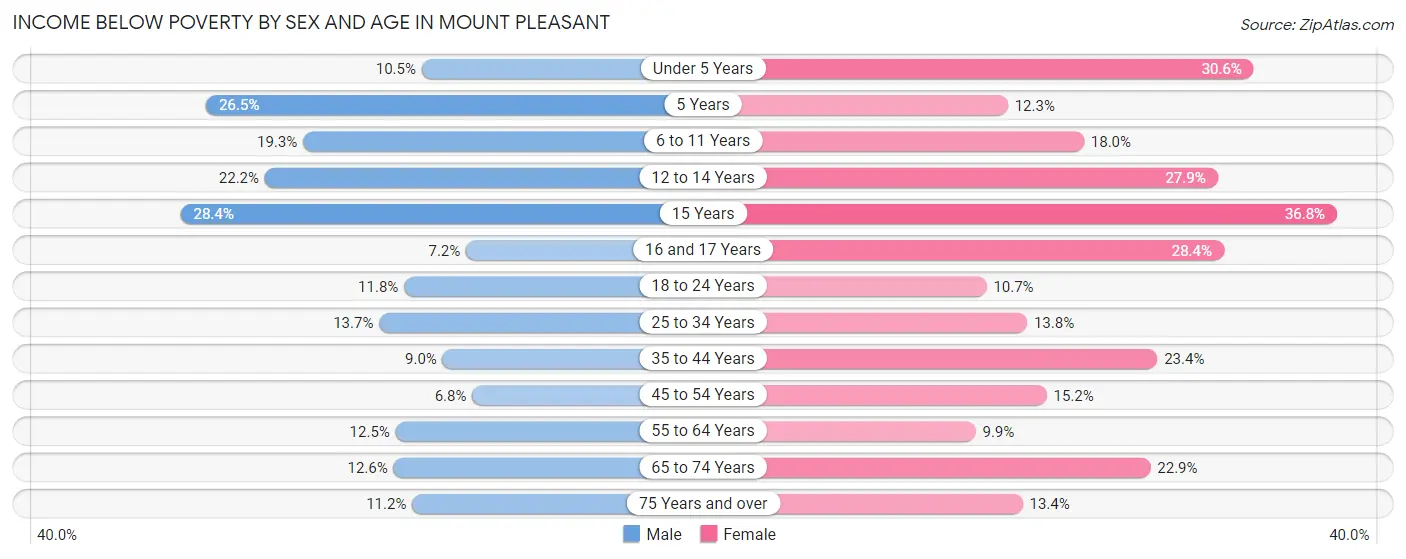
| Age Bracket | Male | Female |
| Under 5 Years | 64 (10.5%) | 178 (30.6%) |
| 5 Years | 26 (26.5%) | 17 (12.3%) |
| 6 to 11 Years | 202 (19.3%) | 124 (18.0%) |
| 12 to 14 Years | 86 (22.2%) | 106 (27.9%) |
| 15 Years | 54 (28.4%) | 68 (36.8%) |
| 16 and 17 Years | 19 (7.2%) | 78 (28.4%) |
| 18 to 24 Years | 113 (11.8%) | 92 (10.7%) |
| 25 to 34 Years | 148 (13.7%) | 164 (13.8%) |
| 35 to 44 Years | 72 (9.0%) | 193 (23.4%) |
| 45 to 54 Years | 75 (6.8%) | 145 (15.2%) |
| 55 to 64 Years | 90 (12.4%) | 75 (9.9%) |
| 65 to 74 Years | 59 (12.6%) | 129 (22.9%) |
| 75 Years and over | 22 (11.2%) | 53 (13.4%) |
| Total | 1,030 (13.0%) | 1,422 (18.2%) |
Income Above Poverty by Sex and Age in Mount Pleasant
According to the poverty statistics in Mount Pleasant, males aged 45 to 54 years and females aged 55 to 64 years are the age groups that are most secure financially, with 93.2% of males and 90.1% of females in these age groups living above the poverty line.
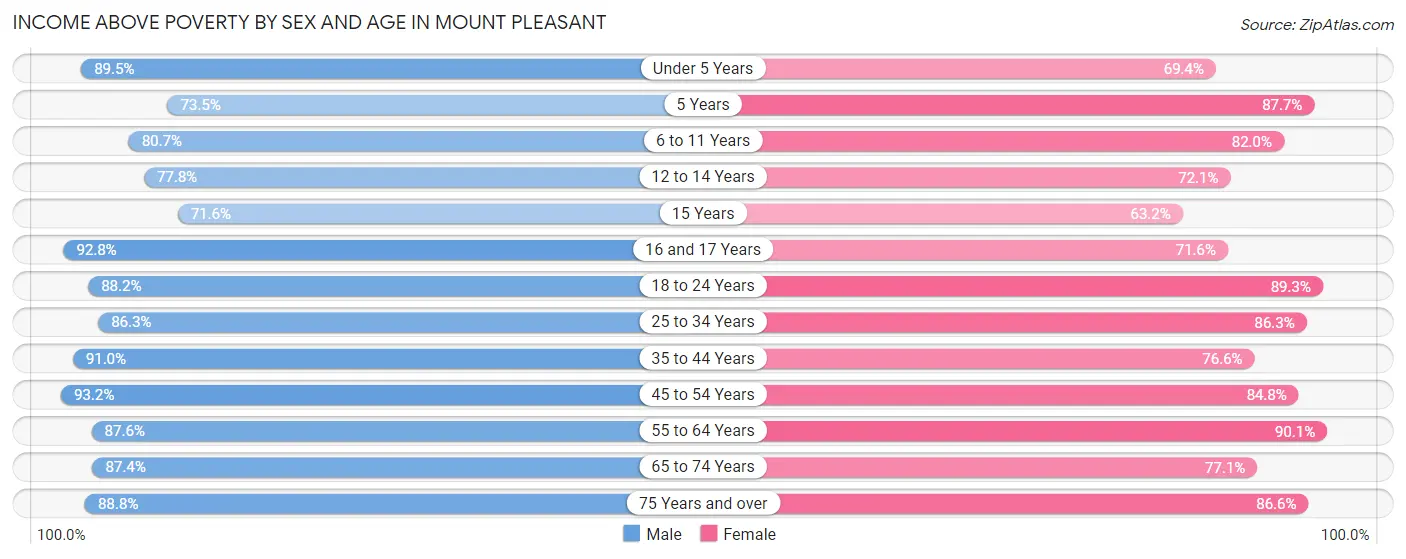
| Age Bracket | Male | Female |
| Under 5 Years | 545 (89.5%) | 404 (69.4%) |
| 5 Years | 72 (73.5%) | 121 (87.7%) |
| 6 to 11 Years | 843 (80.7%) | 566 (82.0%) |
| 12 to 14 Years | 302 (77.8%) | 274 (72.1%) |
| 15 Years | 136 (71.6%) | 117 (63.2%) |
| 16 and 17 Years | 244 (92.8%) | 197 (71.6%) |
| 18 to 24 Years | 843 (88.2%) | 765 (89.3%) |
| 25 to 34 Years | 935 (86.3%) | 1,029 (86.3%) |
| 35 to 44 Years | 732 (91.0%) | 631 (76.6%) |
| 45 to 54 Years | 1,034 (93.2%) | 809 (84.8%) |
| 55 to 64 Years | 633 (87.5%) | 680 (90.1%) |
| 65 to 74 Years | 409 (87.4%) | 434 (77.1%) |
| 75 Years and over | 174 (88.8%) | 342 (86.6%) |
| Total | 6,902 (87.0%) | 6,369 (81.8%) |
Income Below Poverty Among Married-Couple Families in Mount Pleasant
The poverty statistics for married-couple families in Mount Pleasant show that 6.9% or 161 of the total 2,352 families live below the poverty line. Families with 5 or more children have the highest poverty rate of 25.9%, comprising of 15 families. On the other hand, families with 1 or 2 children have the lowest poverty rate of 5.9%, which includes 45 families.
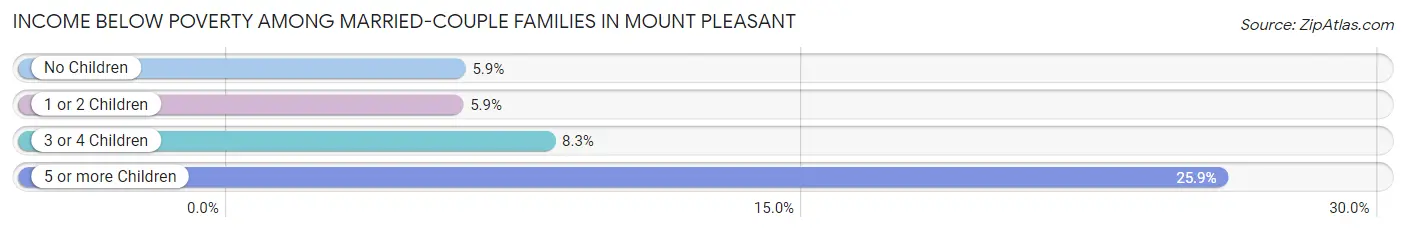
| Children | Above Poverty | Below Poverty |
| No Children | 1,029 (94.1%) | 65 (5.9%) |
| 1 or 2 Children | 720 (94.1%) | 45 (5.9%) |
| 3 or 4 Children | 399 (91.7%) | 36 (8.3%) |
| 5 or more Children | 43 (74.1%) | 15 (25.9%) |
| Total | 2,191 (93.1%) | 161 (6.9%) |
Income Below Poverty Among Single-Parent Households in Mount Pleasant
According to the poverty data in Mount Pleasant, 6.8% or 31 single-father households and 33.8% or 285 single-mother households are living below the poverty line. Among single-father households, those with 1 or 2 children have the highest poverty rate, with 31 households (12.3%) experiencing poverty. Likewise, among single-mother households, those with 3 or 4 children have the highest poverty rate, with 60 households (83.3%) falling below the poverty line.
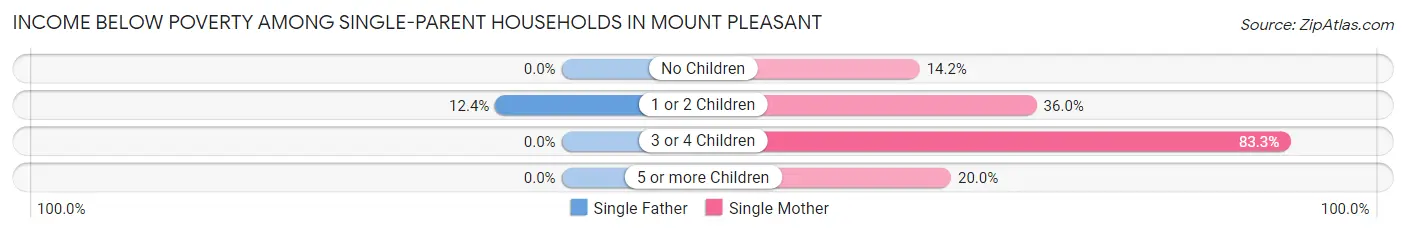
| Children | Single Father | Single Mother |
| No Children | 0 (0.0%) | 31 (14.2%) |
| 1 or 2 Children | 31 (12.3%) | 188 (35.9%) |
| 3 or 4 Children | 0 (0.0%) | 60 (83.3%) |
| 5 or more Children | 0 (0.0%) | 6 (20.0%) |
| Total | 31 (6.8%) | 285 (33.8%) |
Income Below Poverty Among Married-Couple vs Single-Parent Households in Mount Pleasant
The poverty data for Mount Pleasant shows that 161 of the married-couple family households (6.9%) and 316 of the single-parent households (24.3%) are living below the poverty level. Within the married-couple family households, those with 5 or more children have the highest poverty rate, with 15 households (25.9%) falling below the poverty line. Among the single-parent households, those with 3 or 4 children have the highest poverty rate, with 60 household (52.2%) living below poverty.
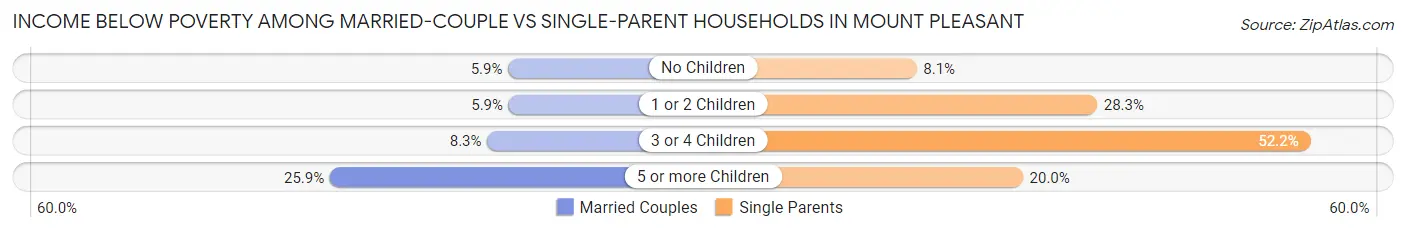
| Children | Married-Couple Families | Single-Parent Households |
| No Children | 65 (5.9%) | 31 (8.1%) |
| 1 or 2 Children | 45 (5.9%) | 219 (28.3%) |
| 3 or 4 Children | 36 (8.3%) | 60 (52.2%) |
| 5 or more Children | 15 (25.9%) | 6 (20.0%) |
| Total | 161 (6.9%) | 316 (24.3%) |
Race in Mount Pleasant
The most populous races in Mount Pleasant are White / Caucasian (8,519 | 53.0%), Hispanic or Latino (8,388 | 52.2%), and Two or more Races (2,425 | 15.1%).
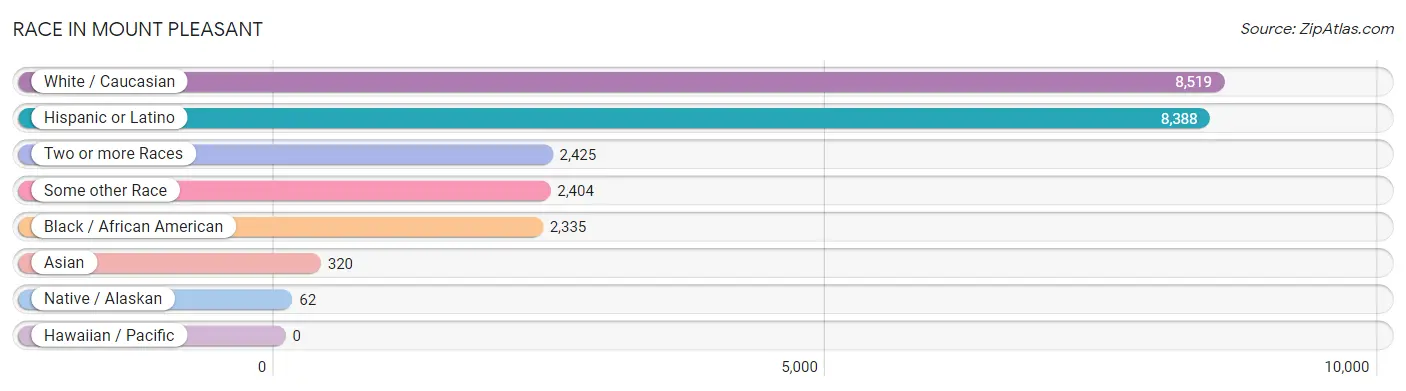
| Race | # Population | % Population |
| Asian | 320 | 2.0% |
| Black / African American | 2,335 | 14.5% |
| Hawaiian / Pacific | 0 | 0.0% |
| Hispanic or Latino | 8,388 | 52.2% |
| Native / Alaskan | 62 | 0.4% |
| White / Caucasian | 8,519 | 53.0% |
| Two or more Races | 2,425 | 15.1% |
| Some other Race | 2,404 | 15.0% |
| Total | 16,065 | 100.0% |
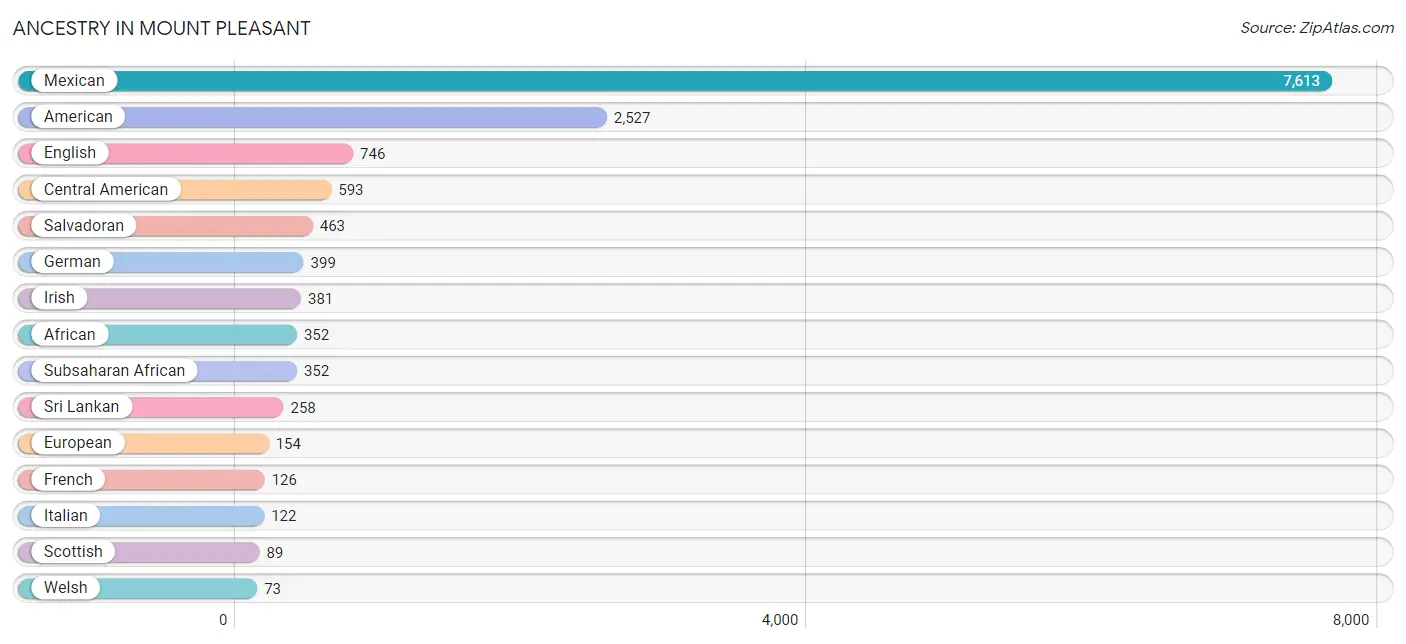
Ancestry in Mount Pleasant
The most populous ancestries reported in Mount Pleasant are Mexican (7,613 | 47.4%), American (2,527 | 15.7%), English (746 | 4.6%), Central American (593 | 3.7%), and Salvadoran (463 | 2.9%), together accounting for 74.3% of all Mount Pleasant residents.
| Ancestry | # Population | % Population |
| African | 352 | 2.2% |
| American | 2,527 | 15.7% |
| Australian | 9 | 0.1% |
| Austrian | 23 | 0.1% |
| Bhutanese | 5 | 0.0% |
| British | 24 | 0.2% |
| Cajun | 22 | 0.1% |
| Central American | 593 | 3.7% |
| Cherokee | 51 | 0.3% |
| Costa Rican | 11 | 0.1% |
| Croatian | 16 | 0.1% |
| Dutch | 29 | 0.2% |
| English | 746 | 4.6% |
| Estonian | 5 | 0.0% |
| European | 154 | 1.0% |
| French | 126 | 0.8% |
| German | 399 | 2.5% |
| Guatemalan | 68 | 0.4% |
| Honduran | 51 | 0.3% |
| Irish | 381 | 2.4% |
| Italian | 122 | 0.8% |
| Korean | 57 | 0.4% |
| Mexican | 7,613 | 47.4% |
| Mexican American Indian | 34 | 0.2% |
| Navajo | 25 | 0.2% |
| Northern European | 25 | 0.2% |
| Polish | 19 | 0.1% |
| Puerto Rican | 45 | 0.3% |
| Russian | 25 | 0.2% |
| Salvadoran | 463 | 2.9% |
| Scotch-Irish | 50 | 0.3% |
| Scottish | 89 | 0.5% |
| Slovak | 4 | 0.0% |
| Spaniard | 58 | 0.4% |
| Sri Lankan | 258 | 1.6% |
| Subsaharan African | 352 | 2.2% |
| Swedish | 19 | 0.1% |
| Swiss | 27 | 0.2% |
| Ukrainian | 4 | 0.0% |
| Welsh | 73 | 0.4% | View All 40 Rows |
Immigrants in Mount Pleasant
The most numerous immigrant groups reported in Mount Pleasant came from Central America (3,254 | 20.3%), Latin America (3,254 | 20.3%), Mexico (3,073 | 19.1%), Asia (263 | 1.6%), and South Eastern Asia (201 | 1.3%), together accounting for 62.5% of all Mount Pleasant residents.
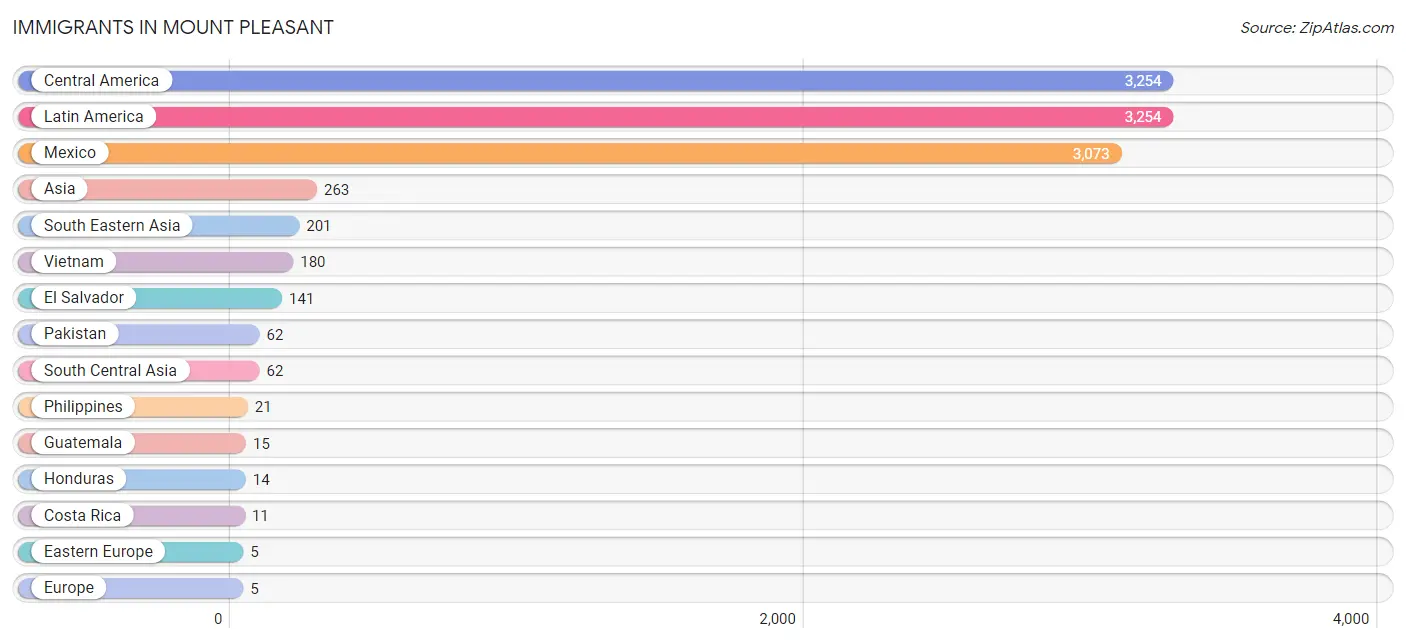
| Immigration Origin | # Population | % Population |
| Asia | 263 | 1.6% |
| Canada | 4 | 0.0% |
| Central America | 3,254 | 20.3% |
| Costa Rica | 11 | 0.1% |
| Eastern Europe | 5 | 0.0% |
| El Salvador | 141 | 0.9% |
| Europe | 5 | 0.0% |
| Guatemala | 15 | 0.1% |
| Honduras | 14 | 0.1% |
| Latin America | 3,254 | 20.3% |
| Mexico | 3,073 | 19.1% |
| Pakistan | 62 | 0.4% |
| Philippines | 21 | 0.1% |
| South Central Asia | 62 | 0.4% |
| South Eastern Asia | 201 | 1.3% |
| Vietnam | 180 | 1.1% | View All 16 Rows |
Sex and Age in Mount Pleasant
Sex and Age in Mount Pleasant
The most populous age groups in Mount Pleasant are 10 to 14 Years (768 | 9.5%) for men and 20 to 24 Years (677 | 8.5%) for women.
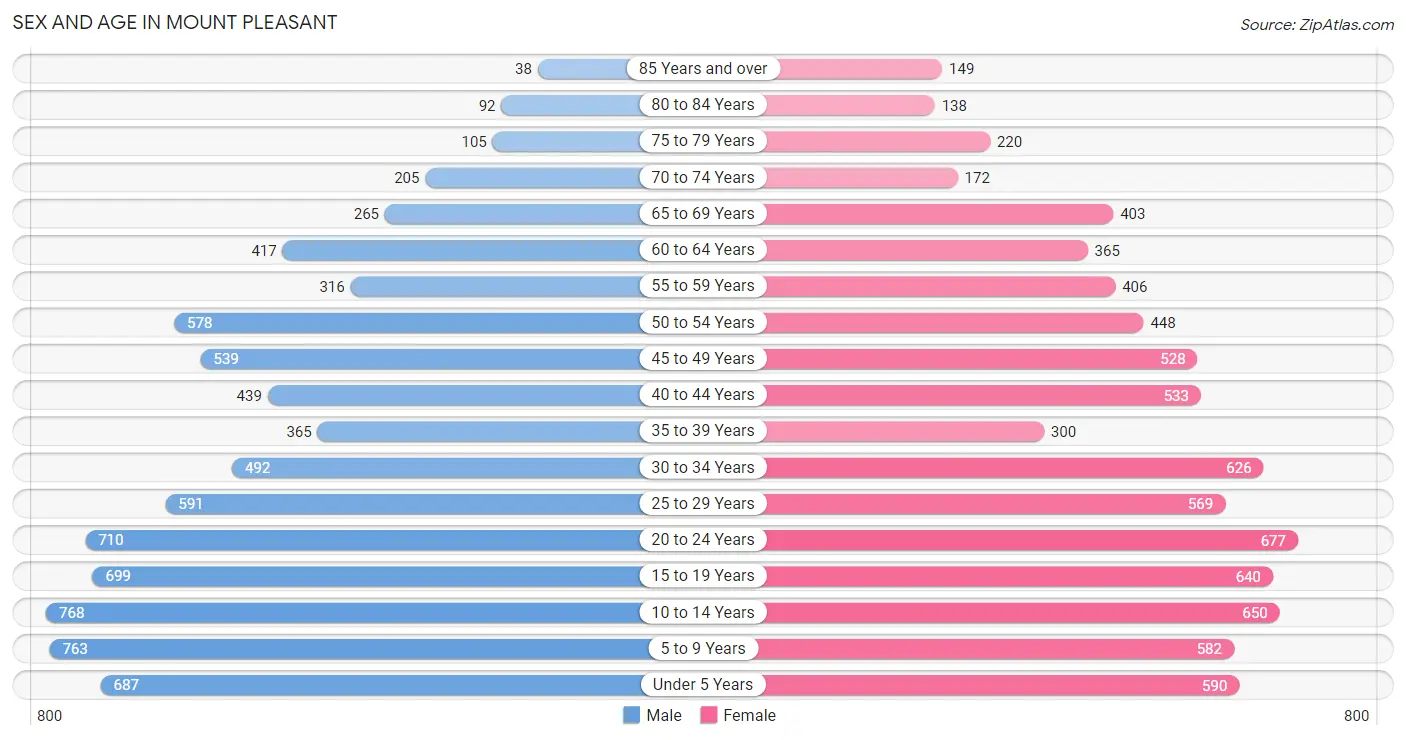
| Age Bracket | Male | Female |
| Under 5 Years | 687 (8.5%) | 590 (7.4%) |
| 5 to 9 Years | 763 (9.5%) | 582 (7.3%) |
| 10 to 14 Years | 768 (9.5%) | 650 (8.1%) |
| 15 to 19 Years | 699 (8.7%) | 640 (8.0%) |
| 20 to 24 Years | 710 (8.8%) | 677 (8.5%) |
| 25 to 29 Years | 591 (7.3%) | 569 (7.1%) |
| 30 to 34 Years | 492 (6.1%) | 626 (7.8%) |
| 35 to 39 Years | 365 (4.5%) | 300 (3.7%) |
| 40 to 44 Years | 439 (5.4%) | 533 (6.7%) |
| 45 to 49 Years | 539 (6.7%) | 528 (6.6%) |
| 50 to 54 Years | 578 (7.2%) | 448 (5.6%) |
| 55 to 59 Years | 316 (3.9%) | 406 (5.1%) |
| 60 to 64 Years | 417 (5.2%) | 365 (4.6%) |
| 65 to 69 Years | 265 (3.3%) | 403 (5.0%) |
| 70 to 74 Years | 205 (2.5%) | 172 (2.1%) |
| 75 to 79 Years | 105 (1.3%) | 220 (2.8%) |
| 80 to 84 Years | 92 (1.1%) | 138 (1.7%) |
| 85 Years and over | 38 (0.5%) | 149 (1.9%) |
| Total | 8,069 (100.0%) | 7,996 (100.0%) |
Families and Households in Mount Pleasant
Median Family Size in Mount Pleasant
The median family size in Mount Pleasant is 3.64 persons per family, with married-couple families (2,352 | 64.4%) accounting for the largest median family size of 3.85 persons per family. On the other hand, single male/father families (457 | 12.5%) represent the smallest median family size with 2.68 persons per family.
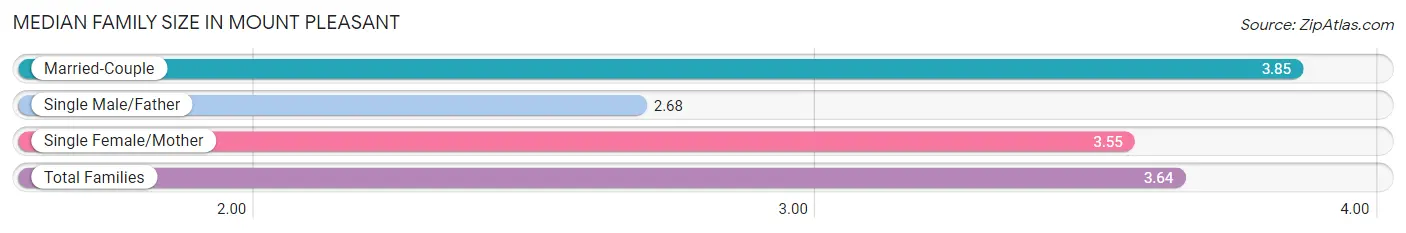
| Family Type | # Families | Family Size |
| Married-Couple | 2,352 (64.4%) | 3.85 |
| Single Male/Father | 457 (12.5%) | 2.68 |
| Single Female/Mother | 844 (23.1%) | 3.55 |
| Total Families | 3,653 (100.0%) | 3.64 |
Median Household Size in Mount Pleasant
The median household size in Mount Pleasant is 2.92 persons per household, with married-couple households (2,352 | 43.4%) accounting for the largest median household size of 3.87 persons per household. non-family households (1,765 | 32.6%) represent the smallest median household size with 1.28 persons per household.
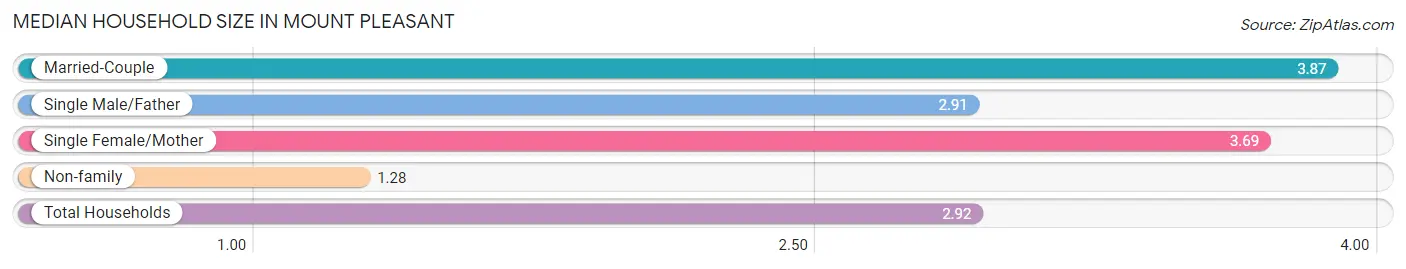
| Household Type | # Households | Household Size |
| Married-Couple | 2,352 (43.4%) | 3.87 |
| Single Male/Father | 457 (8.4%) | 2.91 |
| Single Female/Mother | 844 (15.6%) | 3.69 |
| Non-family | 1,765 (32.6%) | 1.28 |
| Total Households | 5,418 (100.0%) | 2.92 |
Household Size by Marriage Status in Mount Pleasant
Out of a total of 5,418 households in Mount Pleasant, 3,653 (67.4%) are family households, while 1,765 (32.6%) are nonfamily households. The most numerous type of family households are 2-person households, comprising 1,279, and the most common type of nonfamily households are 1-person households, comprising 1,479.
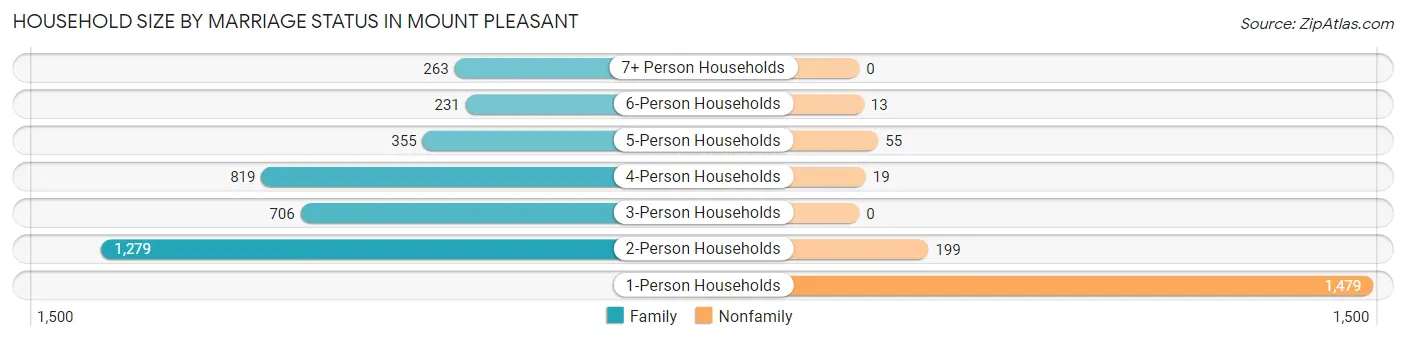
| Household Size | Family Households | Nonfamily Households |
| 1-Person Households | - | 1,479 (27.3%) |
| 2-Person Households | 1,279 (23.6%) | 199 (3.7%) |
| 3-Person Households | 706 (13.0%) | 0 (0.0%) |
| 4-Person Households | 819 (15.1%) | 19 (0.4%) |
| 5-Person Households | 355 (6.6%) | 55 (1.0%) |
| 6-Person Households | 231 (4.3%) | 13 (0.2%) |
| 7+ Person Households | 263 (4.9%) | 0 (0.0%) |
| Total | 3,653 (67.4%) | 1,765 (32.6%) |
Female Fertility in Mount Pleasant
Fertility by Age in Mount Pleasant
Average fertility rate in Mount Pleasant is 88.0 births per 1,000 women. Women in the age bracket of 20 to 34 years have the highest fertility rate with 174.0 births per 1,000 women. Women in the age bracket of 20 to 34 years acount for 92.6% of all women with births.
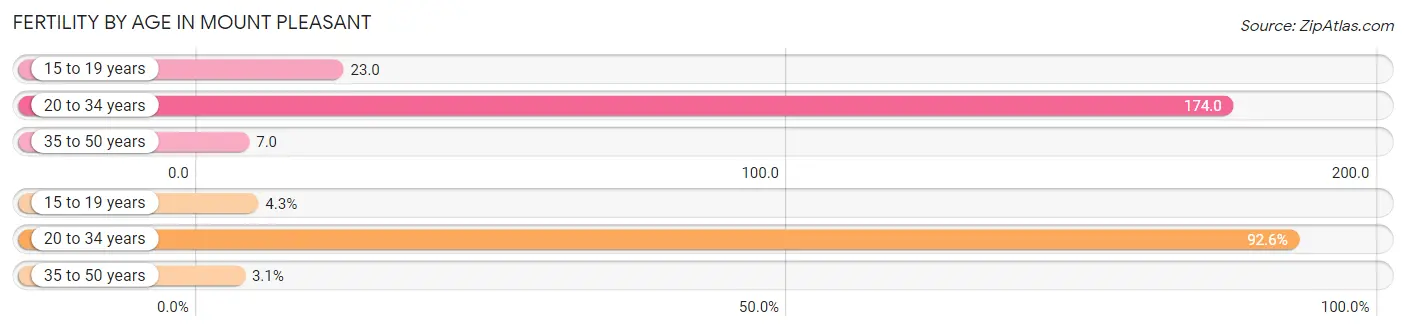
| Age Bracket | Women with Births | Births / 1,000 Women |
| 15 to 19 years | 15 (4.3%) | 23.0 |
| 20 to 34 years | 325 (92.6%) | 174.0 |
| 35 to 50 years | 11 (3.1%) | 7.0 |
| Total | 351 (100.0%) | 88.0 |
Fertility by Age by Marriage Status in Mount Pleasant
46.2% of women with births (351) in Mount Pleasant are married. The highest percentage of unmarried women with births falls into 15 to 19 years age bracket with 100.0% of them unmarried at the time of birth, while the lowest percentage of unmarried women with births belong to 35 to 50 years age bracket with 0.0% of them unmarried.
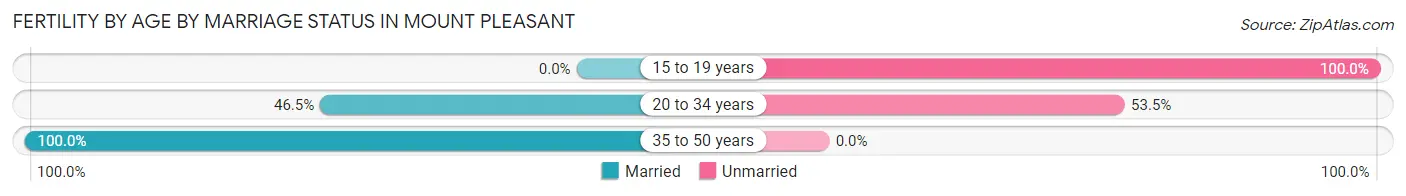
| Age Bracket | Married | Unmarried |
| 15 to 19 years | 0 (0.0%) | 15 (100.0%) |
| 20 to 34 years | 151 (46.5%) | 174 (53.5%) |
| 35 to 50 years | 11 (100.0%) | 0 (0.0%) |
| Total | 162 (46.2%) | 189 (53.8%) |
Fertility by Education in Mount Pleasant
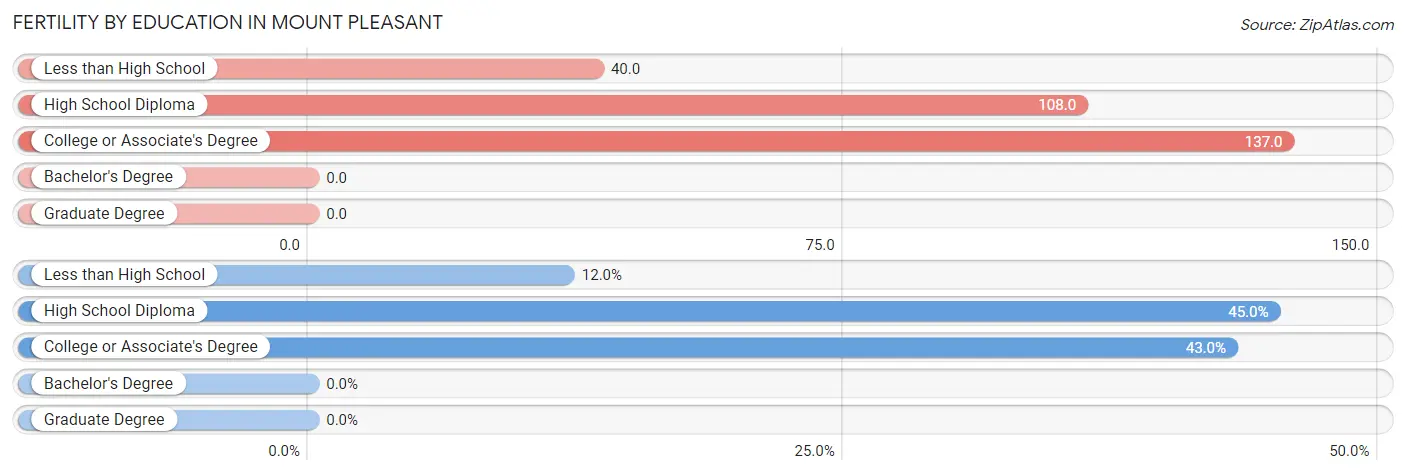
| Educational Attainment | Women with Births | Births / 1,000 Women |
| Less than High School | 42 (12.0%) | 40.0 |
| High School Diploma | 158 (45.0%) | 108.0 |
| College or Associate's Degree | 151 (43.0%) | 137.0 |
| Bachelor's Degree | 0 (0.0%) | 0.0 |
| Graduate Degree | 0 (0.0%) | 0.0 |
| Total | 351 (100.0%) | 88.0 |
Fertility by Education by Marriage Status in Mount Pleasant
53.8% of women with births in Mount Pleasant are unmarried. Women with the educational attainment of less than high school are most likely to be married with 64.3% of them married at childbirth, while women with the educational attainment of college or associate's degree are least likely to be married with 68.9% of them unmarried at childbirth.
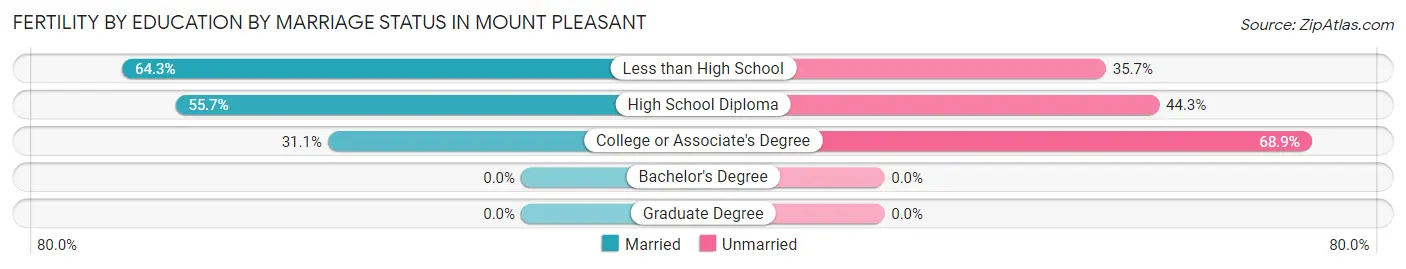
| Educational Attainment | Married | Unmarried |
| Less than High School | 27 (64.3%) | 15 (35.7%) |
| High School Diploma | 88 (55.7%) | 70 (44.3%) |
| College or Associate's Degree | 47 (31.1%) | 104 (68.9%) |
| Bachelor's Degree | 0 (0.0%) | 0 (0.0%) |
| Graduate Degree | 0 (0.0%) | 0 (0.0%) |
| Total | 162 (46.2%) | 189 (53.8%) |
Employment Characteristics in Mount Pleasant
Employment by Class of Employer in Mount Pleasant
Among the 7,143 employed individuals in Mount Pleasant, private company employees (5,570 | 78.0%), local government employees (554 | 7.8%), and self-employed (not incorporated) (283 | 4.0%) make up the most common classes of employment.
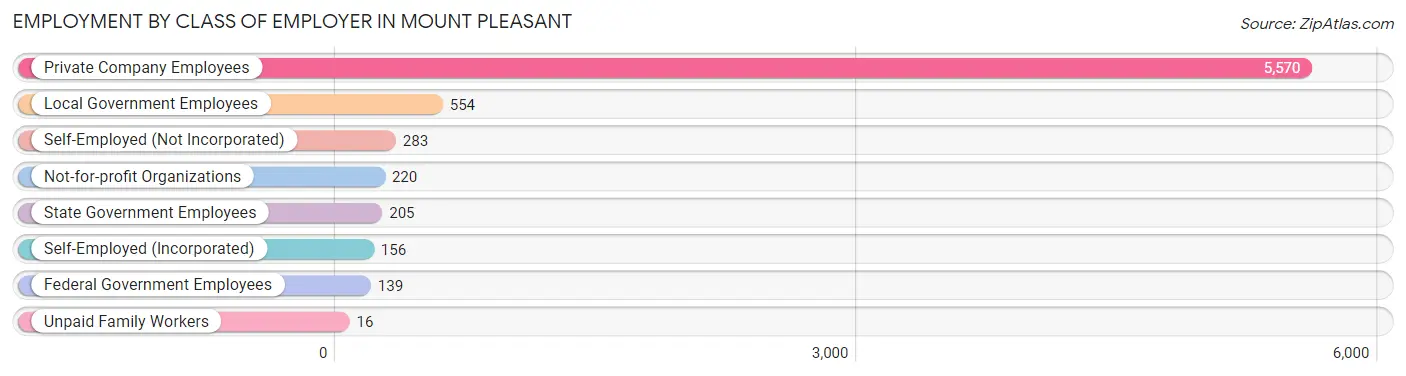
| Employer Class | # Employees | % Employees |
| Private Company Employees | 5,570 | 78.0% |
| Self-Employed (Incorporated) | 156 | 2.2% |
| Self-Employed (Not Incorporated) | 283 | 4.0% |
| Not-for-profit Organizations | 220 | 3.1% |
| Local Government Employees | 554 | 7.8% |
| State Government Employees | 205 | 2.9% |
| Federal Government Employees | 139 | 1.9% |
| Unpaid Family Workers | 16 | 0.2% |
| Total | 7,143 | 100.0% |
Employment Status by Age in Mount Pleasant
According to the labor force statistics for Mount Pleasant, out of the total population over 16 years of age (11,650), 64.7% or 7,538 individuals are in the labor force, with 3.5% or 264 of them unemployed. The age group with the highest labor force participation rate is 20 to 24 years, with 85.4% or 1,184 individuals in the labor force. Within the labor force, the 16 to 19 years age range has the highest percentage of unemployed individuals, with 32.7% or 98 of them being unemployed.
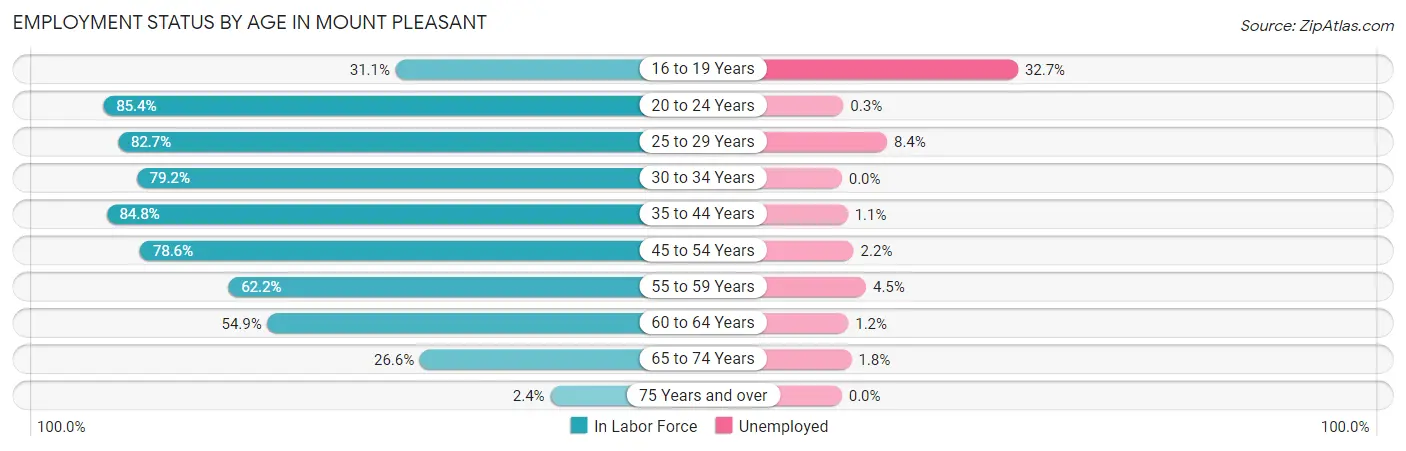
| Age Bracket | In Labor Force | Unemployed |
| 16 to 19 Years | 300 (31.1%) | 98 (32.7%) |
| 20 to 24 Years | 1,184 (85.4%) | 4 (0.3%) |
| 25 to 29 Years | 959 (82.7%) | 81 (8.4%) |
| 30 to 34 Years | 885 (79.2%) | 0 (0.0%) |
| 35 to 44 Years | 1,388 (84.8%) | 15 (1.1%) |
| 45 to 54 Years | 1,645 (78.6%) | 36 (2.2%) |
| 55 to 59 Years | 449 (62.2%) | 20 (4.5%) |
| 60 to 64 Years | 429 (54.9%) | 5 (1.2%) |
| 65 to 74 Years | 278 (26.6%) | 5 (1.8%) |
| 75 Years and over | 18 (2.4%) | 0 (0.0%) |
| Total | 7,538 (64.7%) | 264 (3.5%) |
Employment Status by Educational Attainment in Mount Pleasant
According to labor force statistics for Mount Pleasant, 76.6% of individuals (5,754) out of the total population between 25 and 64 years of age (7,512) are in the labor force, with 2.7% or 155 of them being unemployed. The group with the highest labor force participation rate are those with the educational attainment of less than high school, with 80.7% or 1,494 individuals in the labor force. Within the labor force, individuals with college / associate degree education have the highest percentage of unemployment, with 5.0% or 70 of them being unemployed.
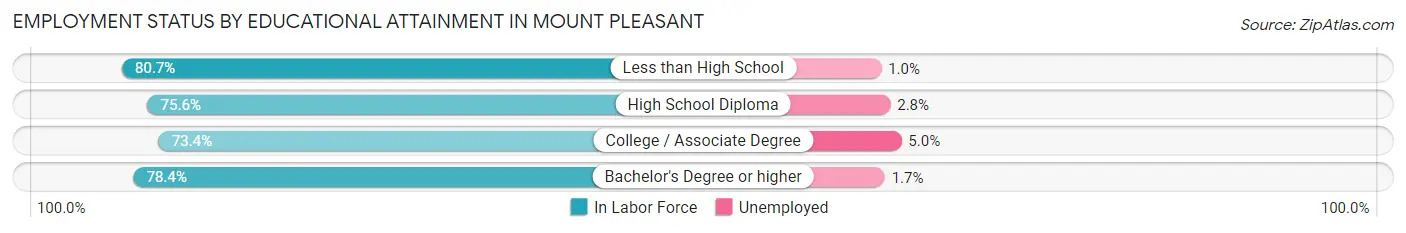
| Educational Attainment | In Labor Force | Unemployed |
| Less than High School | 1,494 (80.7%) | 19 (1.0%) |
| High School Diploma | 2,177 (75.6%) | 81 (2.8%) |
| College / Associate Degree | 1,390 (73.4%) | 95 (5.0%) |
| Bachelor's Degree or higher | 696 (78.4%) | 15 (1.7%) |
| Total | 5,754 (76.6%) | 203 (2.7%) |
Employment Occupations by Sex in Mount Pleasant
Management, Business, Science and Arts Occupations
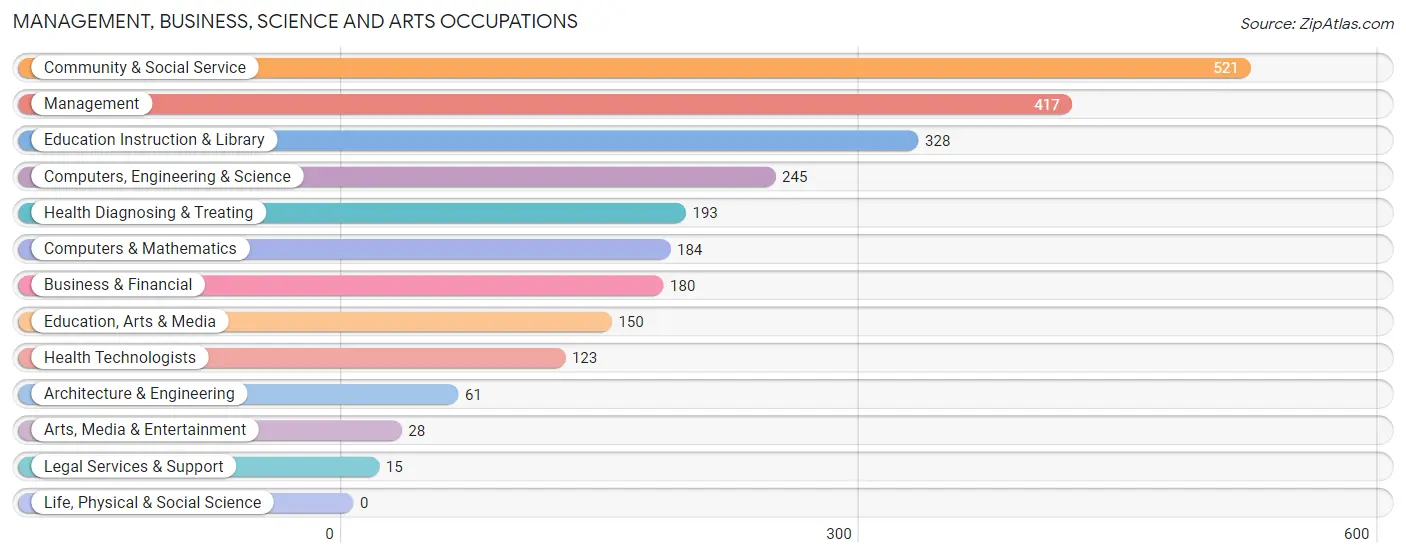
The most common Management, Business, Science and Arts occupations in Mount Pleasant are Community & Social Service (521 | 7.2%), Management (417 | 5.7%), Education Instruction & Library (328 | 4.5%), Computers, Engineering & Science (245 | 3.4%), and Health Diagnosing & Treating (193 | 2.6%).
Management, Business, Science and Arts Occupations by Sex
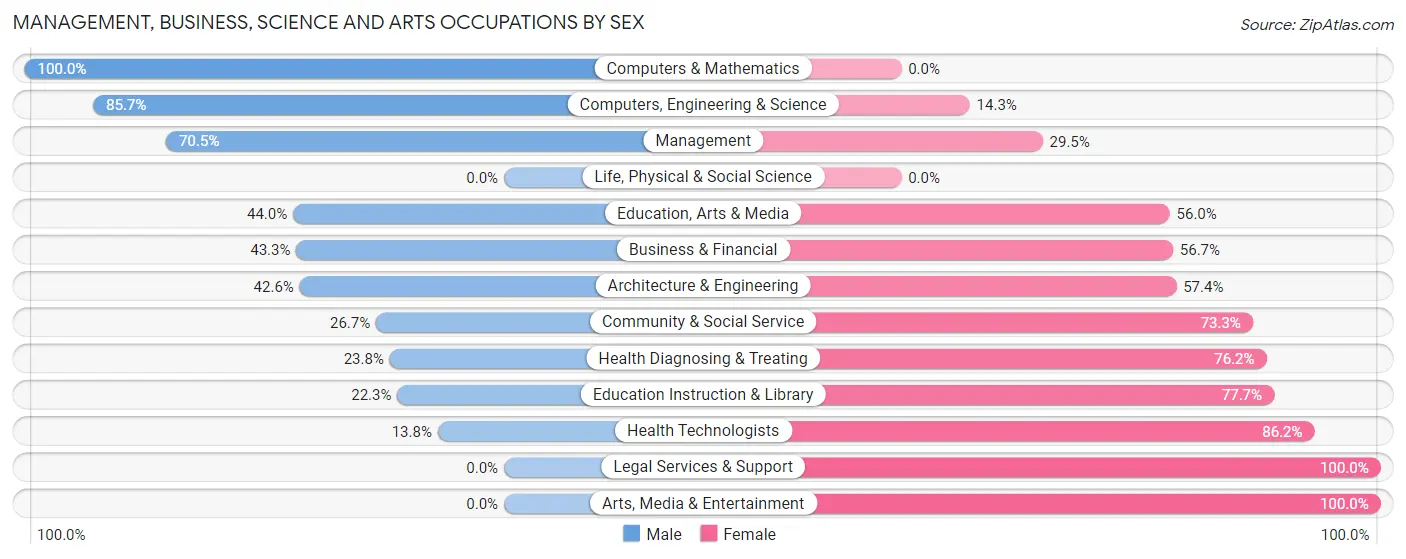
Within the Management, Business, Science and Arts occupations in Mount Pleasant, the most male-oriented occupations are Computers & Mathematics (100.0%), Computers, Engineering & Science (85.7%), and Management (70.5%), while the most female-oriented occupations are Legal Services & Support (100.0%), Arts, Media & Entertainment (100.0%), and Health Technologists (86.2%).
| Occupation | Male | Female |
| Management | 294 (70.5%) | 123 (29.5%) |
| Business & Financial | 78 (43.3%) | 102 (56.7%) |
| Computers, Engineering & Science | 210 (85.7%) | 35 (14.3%) |
| Computers & Mathematics | 184 (100.0%) | 0 (0.0%) |
| Architecture & Engineering | 26 (42.6%) | 35 (57.4%) |
| Life, Physical & Social Science | 0 (0.0%) | 0 (0.0%) |
| Community & Social Service | 139 (26.7%) | 382 (73.3%) |
| Education, Arts & Media | 66 (44.0%) | 84 (56.0%) |
| Legal Services & Support | 0 (0.0%) | 15 (100.0%) |
| Education Instruction & Library | 73 (22.3%) | 255 (77.7%) |
| Arts, Media & Entertainment | 0 (0.0%) | 28 (100.0%) |
| Health Diagnosing & Treating | 46 (23.8%) | 147 (76.2%) |
| Health Technologists | 17 (13.8%) | 106 (86.2%) |
| Total (Category) | 767 (49.3%) | 789 (50.7%) |
| Total (Overall) | 4,079 (56.1%) | 3,195 (43.9%) |
Services Occupations
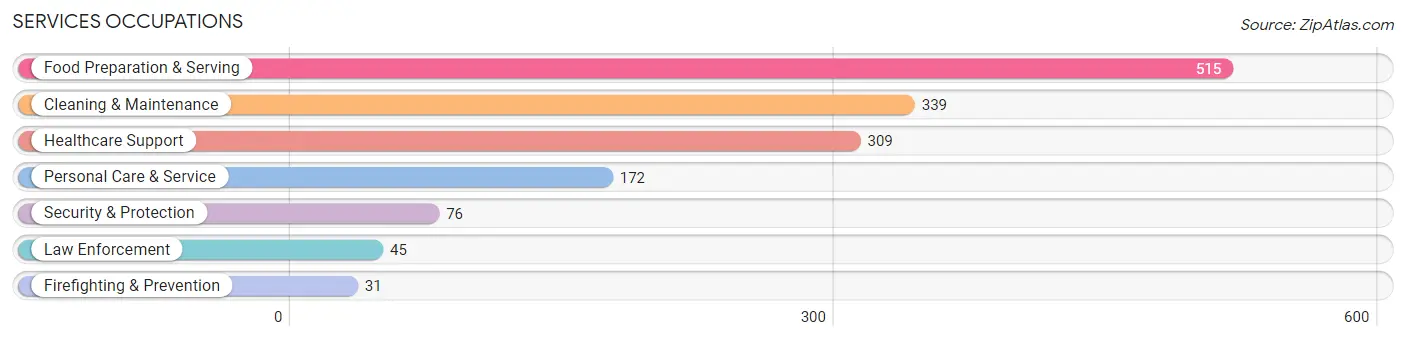
The most common Services occupations in Mount Pleasant are Food Preparation & Serving (515 | 7.1%), Cleaning & Maintenance (339 | 4.7%), Healthcare Support (309 | 4.3%), Personal Care & Service (172 | 2.4%), and Security & Protection (76 | 1.0%).
Services Occupations by Sex
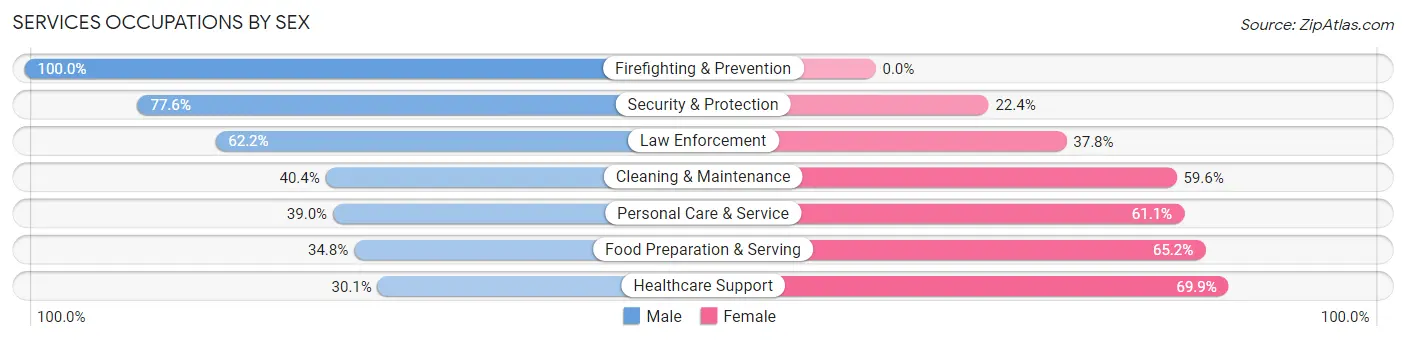
Within the Services occupations in Mount Pleasant, the most male-oriented occupations are Firefighting & Prevention (100.0%), Security & Protection (77.6%), and Law Enforcement (62.2%), while the most female-oriented occupations are Healthcare Support (69.9%), Food Preparation & Serving (65.2%), and Personal Care & Service (61.1%).
| Occupation | Male | Female |
| Healthcare Support | 93 (30.1%) | 216 (69.9%) |
| Security & Protection | 59 (77.6%) | 17 (22.4%) |
| Firefighting & Prevention | 31 (100.0%) | 0 (0.0%) |
| Law Enforcement | 28 (62.2%) | 17 (37.8%) |
| Food Preparation & Serving | 179 (34.8%) | 336 (65.2%) |
| Cleaning & Maintenance | 137 (40.4%) | 202 (59.6%) |
| Personal Care & Service | 67 (39.0%) | 105 (61.1%) |
| Total (Category) | 535 (37.9%) | 876 (62.1%) |
| Total (Overall) | 4,079 (56.1%) | 3,195 (43.9%) |
Sales and Office Occupations
The most common Sales and Office occupations in Mount Pleasant are Sales & Related (764 | 10.5%), and Office & Administration (551 | 7.6%).
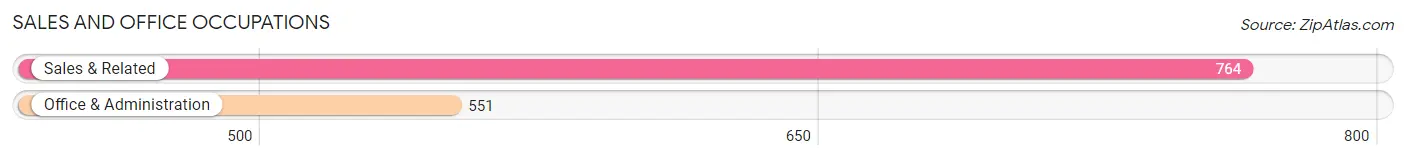
Sales and Office Occupations by Sex
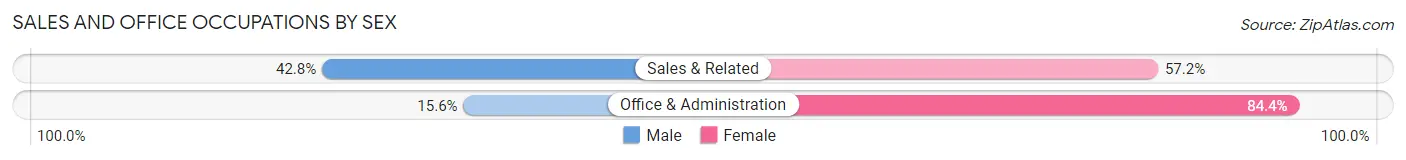
| Occupation | Male | Female |
| Sales & Related | 327 (42.8%) | 437 (57.2%) |
| Office & Administration | 86 (15.6%) | 465 (84.4%) |
| Total (Category) | 413 (31.4%) | 902 (68.6%) |
| Total (Overall) | 4,079 (56.1%) | 3,195 (43.9%) |
Natural Resources, Construction and Maintenance Occupations
The most common Natural Resources, Construction and Maintenance occupations in Mount Pleasant are Construction & Extraction (302 | 4.2%), Installation, Maintenance & Repair (198 | 2.7%), and Farming, Fishing & Forestry (66 | 0.9%).
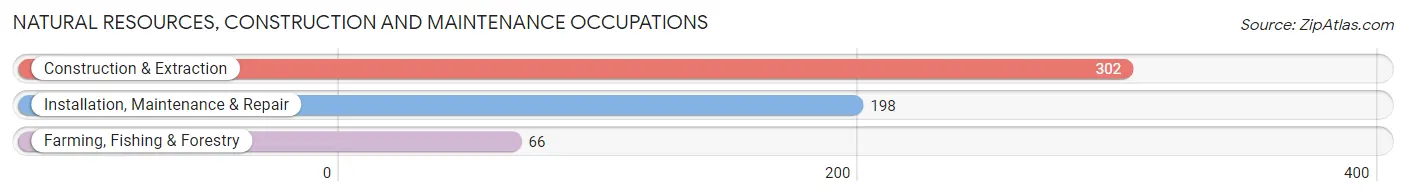
Natural Resources, Construction and Maintenance Occupations by Sex
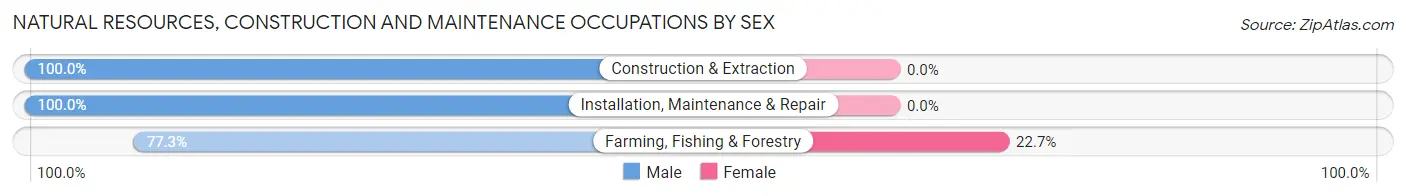
| Occupation | Male | Female |
| Farming, Fishing & Forestry | 51 (77.3%) | 15 (22.7%) |
| Construction & Extraction | 302 (100.0%) | 0 (0.0%) |
| Installation, Maintenance & Repair | 198 (100.0%) | 0 (0.0%) |
| Total (Category) | 551 (97.4%) | 15 (2.6%) |
| Total (Overall) | 4,079 (56.1%) | 3,195 (43.9%) |
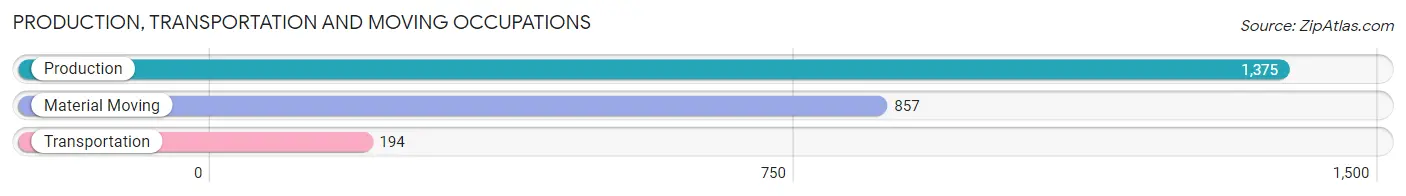
Production, Transportation and Moving Occupations
The most common Production, Transportation and Moving occupations in Mount Pleasant are Production (1,375 | 18.9%), Material Moving (857 | 11.8%), and Transportation (194 | 2.7%).
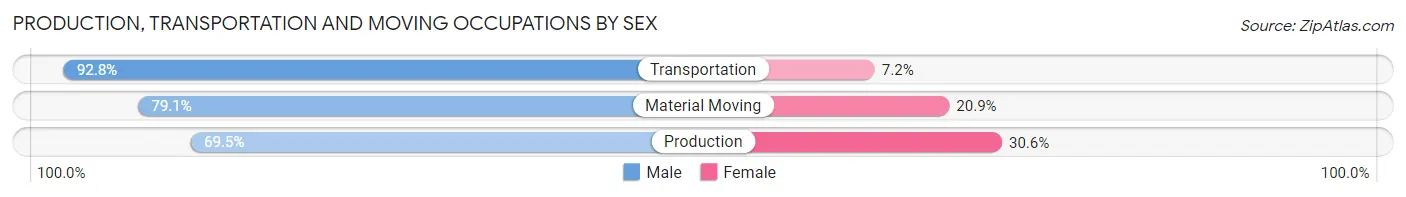
Production, Transportation and Moving Occupations by Sex
| Occupation | Male | Female |
| Production | 955 (69.5%) | 420 (30.5%) |
| Transportation | 180 (92.8%) | 14 (7.2%) |
| Material Moving | 678 (79.1%) | 179 (20.9%) |
| Total (Category) | 1,813 (74.7%) | 613 (25.3%) |
| Total (Overall) | 4,079 (56.1%) | 3,195 (43.9%) |
Employment Industries by Sex in Mount Pleasant
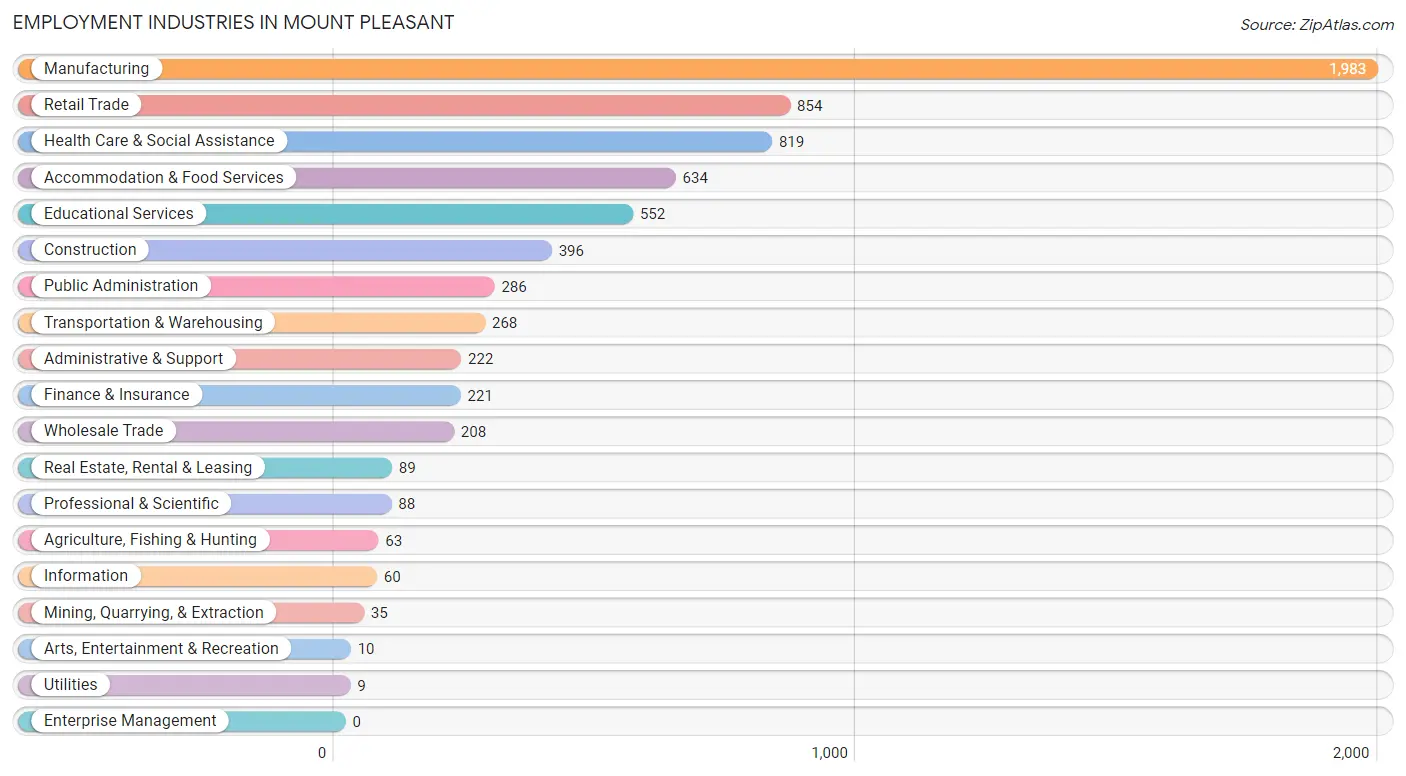
Employment Industries in Mount Pleasant
The major employment industries in Mount Pleasant include Manufacturing (1,983 | 27.3%), Retail Trade (854 | 11.7%), Health Care & Social Assistance (819 | 11.3%), Accommodation & Food Services (634 | 8.7%), and Educational Services (552 | 7.6%).
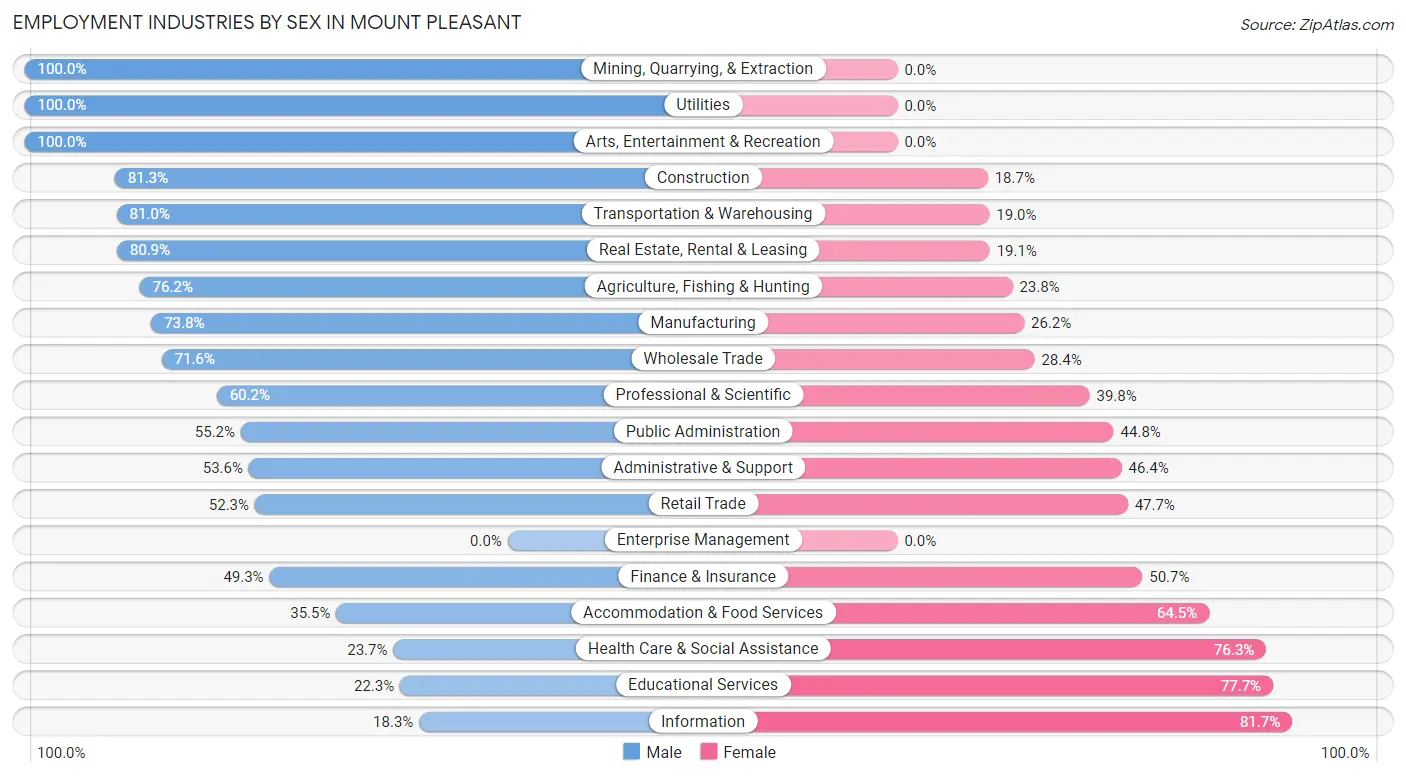
Employment Industries by Sex in Mount Pleasant
The Mount Pleasant industries that see more men than women are Mining, Quarrying, & Extraction (100.0%), Utilities (100.0%), and Arts, Entertainment & Recreation (100.0%), whereas the industries that tend to have a higher number of women are Information (81.7%), Educational Services (77.7%), and Health Care & Social Assistance (76.3%).
| Industry | Male | Female |
| Agriculture, Fishing & Hunting | 48 (76.2%) | 15 (23.8%) |
| Mining, Quarrying, & Extraction | 35 (100.0%) | 0 (0.0%) |
| Construction | 322 (81.3%) | 74 (18.7%) |
| Manufacturing | 1,463 (73.8%) | 520 (26.2%) |
| Wholesale Trade | 149 (71.6%) | 59 (28.4%) |
| Retail Trade | 447 (52.3%) | 407 (47.7%) |
| Transportation & Warehousing | 217 (81.0%) | 51 (19.0%) |
| Utilities | 9 (100.0%) | 0 (0.0%) |
| Information | 11 (18.3%) | 49 (81.7%) |
| Finance & Insurance | 109 (49.3%) | 112 (50.7%) |
| Real Estate, Rental & Leasing | 72 (80.9%) | 17 (19.1%) |
| Professional & Scientific | 53 (60.2%) | 35 (39.8%) |
| Enterprise Management | 0 (0.0%) | 0 (0.0%) |
| Administrative & Support | 119 (53.6%) | 103 (46.4%) |
| Educational Services | 123 (22.3%) | 429 (77.7%) |
| Health Care & Social Assistance | 194 (23.7%) | 625 (76.3%) |
| Arts, Entertainment & Recreation | 10 (100.0%) | 0 (0.0%) |
| Accommodation & Food Services | 225 (35.5%) | 409 (64.5%) |
| Public Administration | 158 (55.2%) | 128 (44.8%) |
| Total | 4,079 (56.1%) | 3,195 (43.9%) |
Education in Mount Pleasant
School Enrollment in Mount Pleasant
The most common levels of schooling among the 4,746 students in Mount Pleasant are middle school (1,200 | 25.3%), elementary school (1,177 | 24.8%), and high school (1,002 | 21.1%).
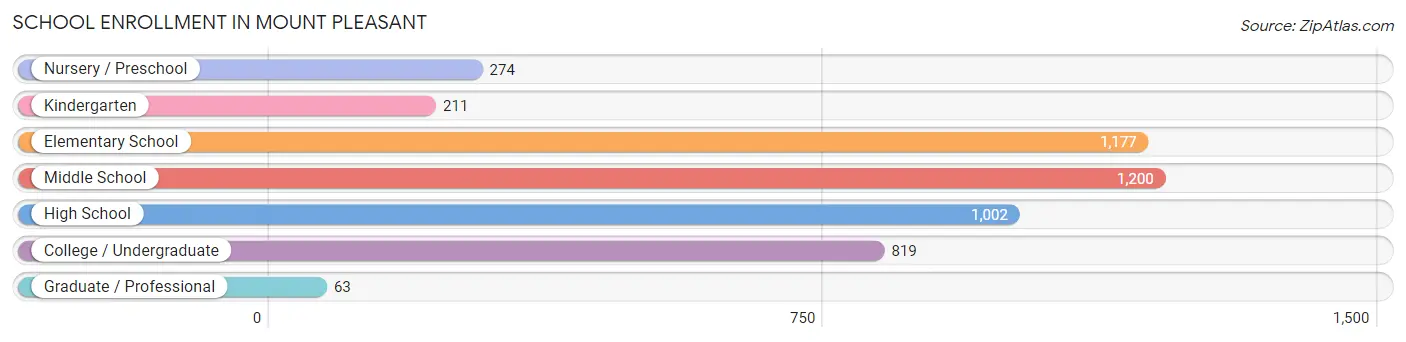
| School Level | # Students | % Students |
| Nursery / Preschool | 274 | 5.8% |
| Kindergarten | 211 | 4.4% |
| Elementary School | 1,177 | 24.8% |
| Middle School | 1,200 | 25.3% |
| High School | 1,002 | 21.1% |
| College / Undergraduate | 819 | 17.3% |
| Graduate / Professional | 63 | 1.3% |
| Total | 4,746 | 100.0% |
School Enrollment by Age by Funding Source in Mount Pleasant
Out of a total of 4,746 students who are enrolled in schools in Mount Pleasant, 209 (4.4%) attend a private institution, while the remaining 4,537 (95.6%) are enrolled in public schools. The age group of 25 to 34 year olds has the highest likelihood of being enrolled in private schools, with 28 (16.0% in the age bracket) enrolled. Conversely, the age group of 18 to 19 year olds has the lowest likelihood of being enrolled in a private school, with 311 (100.0% in the age bracket) attending a public institution.
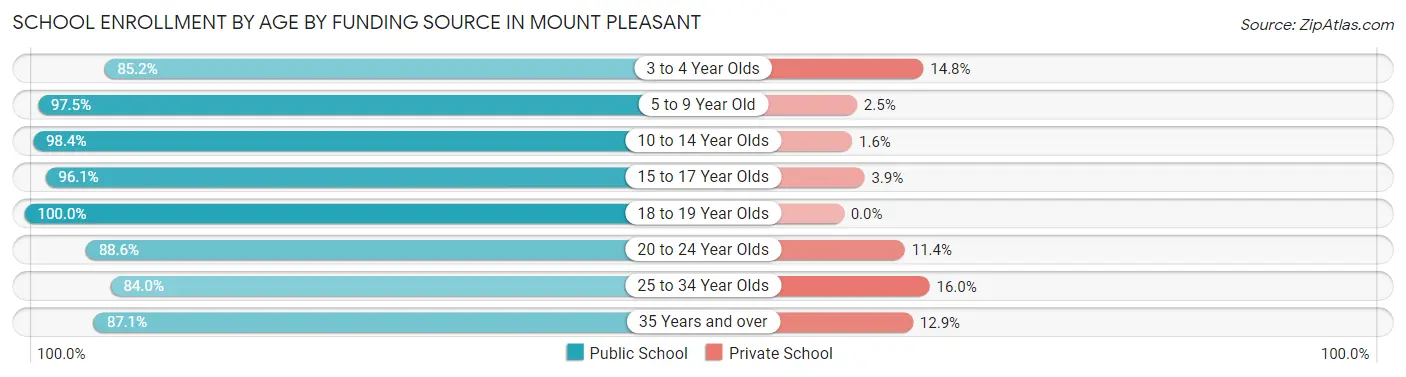
| Age Bracket | Public School | Private School |
| 3 to 4 Year Olds | 155 (85.2%) | 27 (14.8%) |
| 5 to 9 Year Old | 1,266 (97.5%) | 32 (2.5%) |
| 10 to 14 Year Olds | 1,378 (98.4%) | 22 (1.6%) |
| 15 to 17 Year Olds | 743 (96.1%) | 30 (3.9%) |
| 18 to 19 Year Olds | 311 (100.0%) | 0 (0.0%) |
| 20 to 24 Year Olds | 428 (88.6%) | 55 (11.4%) |
| 25 to 34 Year Olds | 147 (84.0%) | 28 (16.0%) |
| 35 Years and over | 108 (87.1%) | 16 (12.9%) |
| Total | 4,537 (95.6%) | 209 (4.4%) |
Educational Attainment by Field of Study in Mount Pleasant
Education (337 | 26.4%), business (283 | 22.2%), bio, nature & agricultural (128 | 10.0%), science & technology (91 | 7.1%), and arts & humanities (89 | 7.0%) are the most common fields of study among 1,276 individuals in Mount Pleasant who have obtained a bachelor's degree or higher.
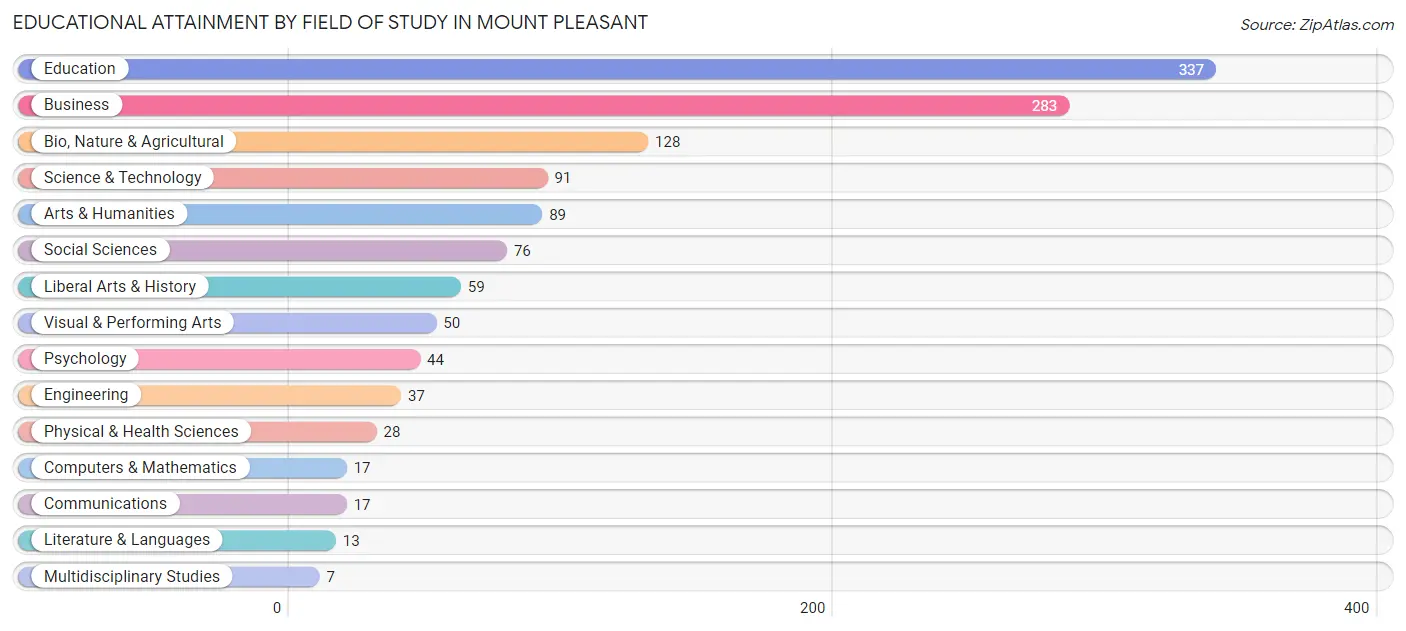
| Field of Study | # Graduates | % Graduates |
| Computers & Mathematics | 17 | 1.3% |
| Bio, Nature & Agricultural | 128 | 10.0% |
| Physical & Health Sciences | 28 | 2.2% |
| Psychology | 44 | 3.5% |
| Social Sciences | 76 | 6.0% |
| Engineering | 37 | 2.9% |
| Multidisciplinary Studies | 7 | 0.5% |
| Science & Technology | 91 | 7.1% |
| Business | 283 | 22.2% |
| Education | 337 | 26.4% |
| Literature & Languages | 13 | 1.0% |
| Liberal Arts & History | 59 | 4.6% |
| Visual & Performing Arts | 50 | 3.9% |
| Communications | 17 | 1.3% |
| Arts & Humanities | 89 | 7.0% |
| Total | 1,276 | 100.0% |
Transportation & Commute in Mount Pleasant
Vehicle Availability by Sex in Mount Pleasant
The most prevalent vehicle ownership categories in Mount Pleasant are males with 2 vehicles (1,591, accounting for 39.5%) and females with 2 vehicles (1,355, making up 51.2%).
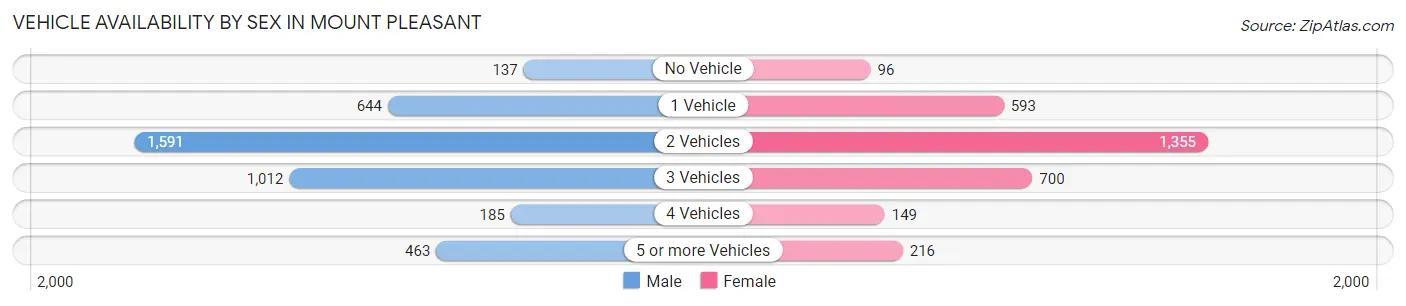
| Vehicles Available | Male | Female |
| No Vehicle | 137 (3.4%) | 96 (3.1%) |
| 1 Vehicle | 644 (16.0%) | 593 (19.1%) |
| 2 Vehicles | 1,591 (39.5%) | 1,355 (43.6%) |
| 3 Vehicles | 1,012 (25.1%) | 700 (22.5%) |
| 4 Vehicles | 185 (4.6%) | 149 (4.8%) |
| 5 or more Vehicles | 463 (11.5%) | 216 (7.0%) |
| Total | 4,032 (100.0%) | 3,109 (100.0%) |
Commute Time in Mount Pleasant
The most frequently occuring commute durations in Mount Pleasant are 10 to 14 minutes (1,935 commuters, 27.7%), 5 to 9 minutes (1,858 commuters, 26.6%), and 15 to 19 minutes (1,219 commuters, 17.4%).
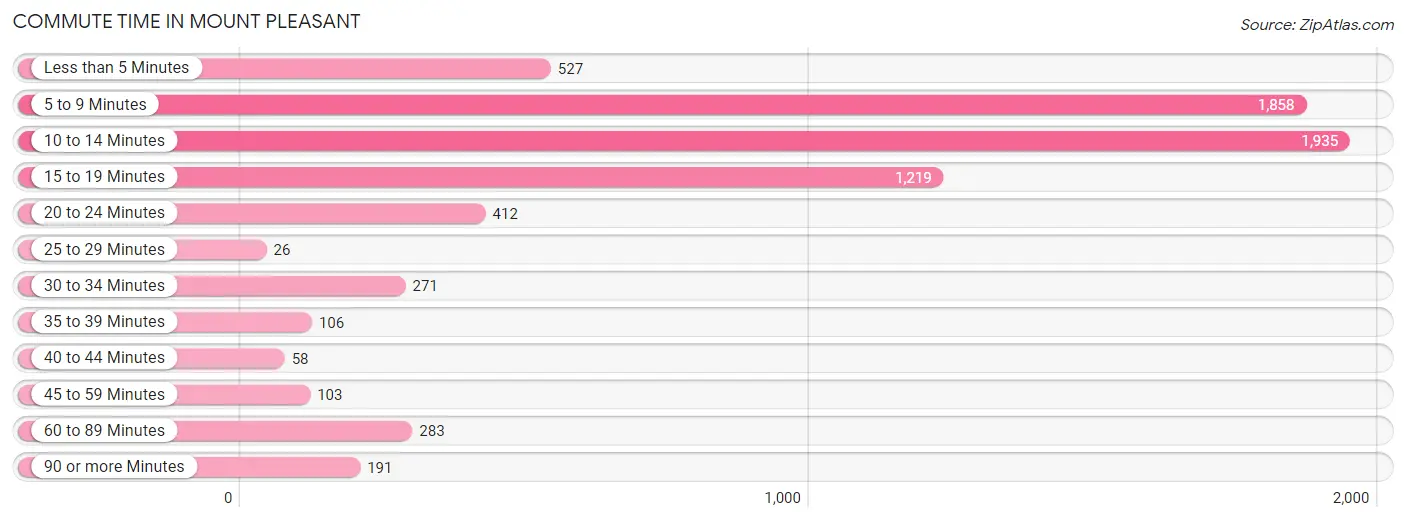
| Commute Time | # Commuters | % Commuters |
| Less than 5 Minutes | 527 | 7.5% |
| 5 to 9 Minutes | 1,858 | 26.6% |
| 10 to 14 Minutes | 1,935 | 27.7% |
| 15 to 19 Minutes | 1,219 | 17.4% |
| 20 to 24 Minutes | 412 | 5.9% |
| 25 to 29 Minutes | 26 | 0.4% |
| 30 to 34 Minutes | 271 | 3.9% |
| 35 to 39 Minutes | 106 | 1.5% |
| 40 to 44 Minutes | 58 | 0.8% |
| 45 to 59 Minutes | 103 | 1.5% |
| 60 to 89 Minutes | 283 | 4.1% |
| 90 or more Minutes | 191 | 2.7% |
Commute Time by Sex in Mount Pleasant
The most common commute times in Mount Pleasant are 5 to 9 minutes (998 commuters, 25.2%) for males and 10 to 14 minutes (1,025 commuters, 33.8%) for females.
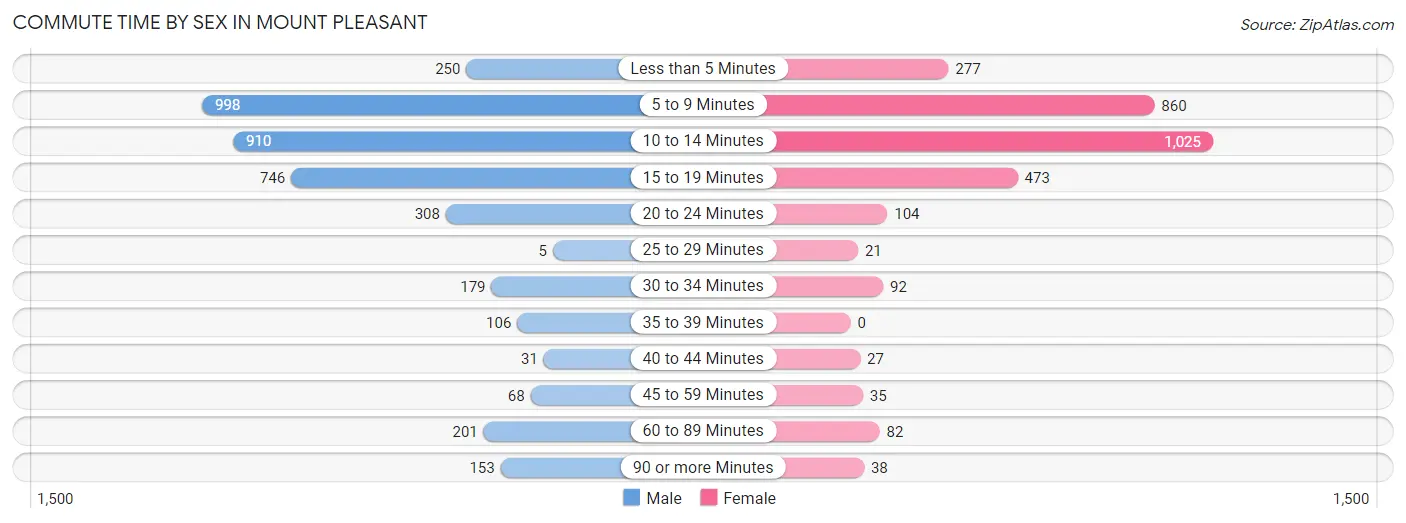
| Commute Time | Male | Female |
| Less than 5 Minutes | 250 (6.3%) | 277 (9.1%) |
| 5 to 9 Minutes | 998 (25.2%) | 860 (28.3%) |
| 10 to 14 Minutes | 910 (23.0%) | 1,025 (33.8%) |
| 15 to 19 Minutes | 746 (18.9%) | 473 (15.6%) |
| 20 to 24 Minutes | 308 (7.8%) | 104 (3.4%) |
| 25 to 29 Minutes | 5 (0.1%) | 21 (0.7%) |
| 30 to 34 Minutes | 179 (4.5%) | 92 (3.0%) |
| 35 to 39 Minutes | 106 (2.7%) | 0 (0.0%) |
| 40 to 44 Minutes | 31 (0.8%) | 27 (0.9%) |
| 45 to 59 Minutes | 68 (1.7%) | 35 (1.1%) |
| 60 to 89 Minutes | 201 (5.1%) | 82 (2.7%) |
| 90 or more Minutes | 153 (3.9%) | 38 (1.3%) |
Time of Departure to Work by Sex in Mount Pleasant
The most frequent times of departure to work in Mount Pleasant are 6:00 AM to 6:29 AM (545, 13.8%) for males and 7:30 AM to 7:59 AM (463, 15.3%) for females.
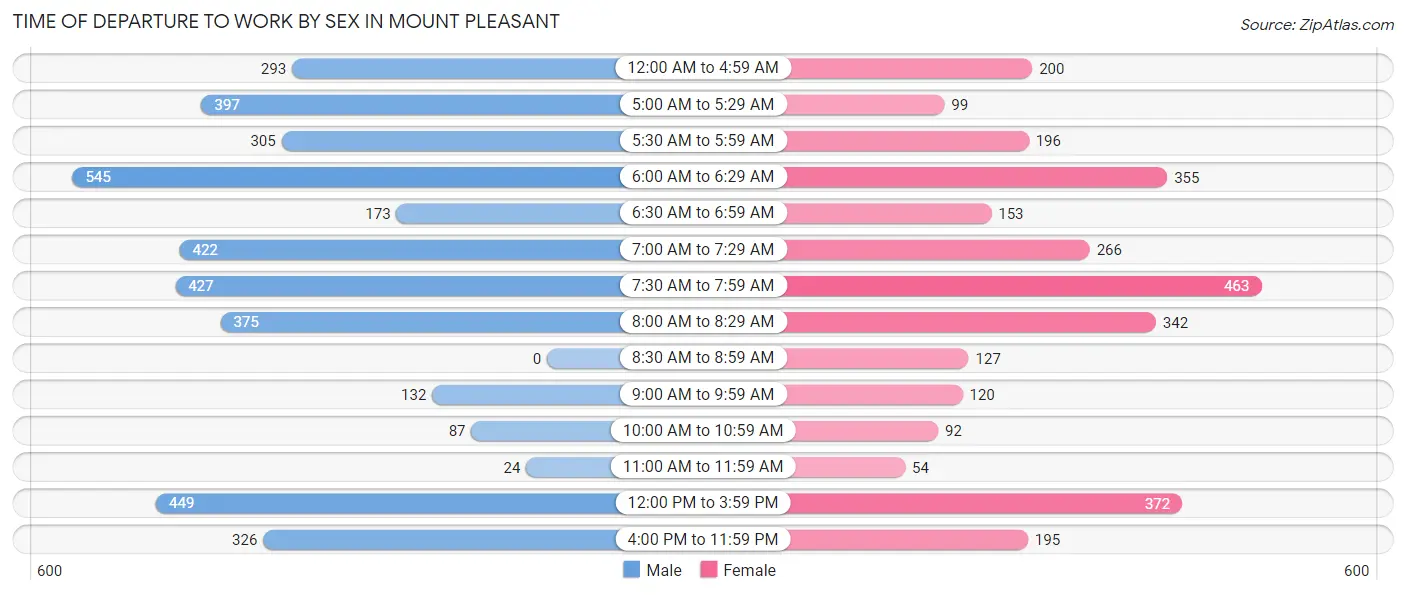
| Time of Departure | Male | Female |
| 12:00 AM to 4:59 AM | 293 (7.4%) | 200 (6.6%) |
| 5:00 AM to 5:29 AM | 397 (10.0%) | 99 (3.3%) |
| 5:30 AM to 5:59 AM | 305 (7.7%) | 196 (6.5%) |
| 6:00 AM to 6:29 AM | 545 (13.8%) | 355 (11.7%) |
| 6:30 AM to 6:59 AM | 173 (4.4%) | 153 (5.0%) |
| 7:00 AM to 7:29 AM | 422 (10.7%) | 266 (8.8%) |
| 7:30 AM to 7:59 AM | 427 (10.8%) | 463 (15.3%) |
| 8:00 AM to 8:29 AM | 375 (9.5%) | 342 (11.3%) |
| 8:30 AM to 8:59 AM | 0 (0.0%) | 127 (4.2%) |
| 9:00 AM to 9:59 AM | 132 (3.3%) | 120 (4.0%) |
| 10:00 AM to 10:59 AM | 87 (2.2%) | 92 (3.0%) |
| 11:00 AM to 11:59 AM | 24 (0.6%) | 54 (1.8%) |
| 12:00 PM to 3:59 PM | 449 (11.4%) | 372 (12.3%) |
| 4:00 PM to 11:59 PM | 326 (8.2%) | 195 (6.4%) |
| Total | 3,955 (100.0%) | 3,034 (100.0%) |
Housing Occupancy in Mount Pleasant
Occupancy by Ownership in Mount Pleasant
Of the total 5,418 dwellings in Mount Pleasant, owner-occupied units account for 2,805 (51.8%), while renter-occupied units make up 2,613 (48.2%).
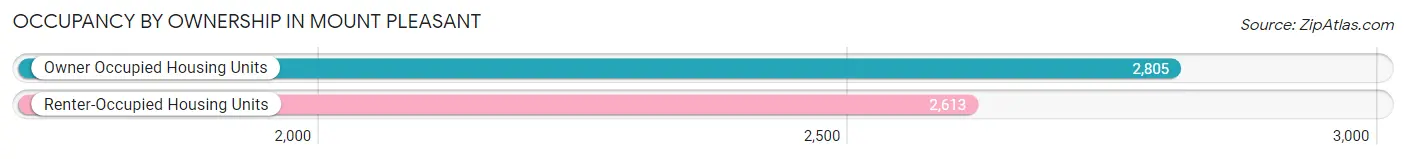
| Occupancy | # Housing Units | % Housing Units |
| Owner Occupied Housing Units | 2,805 | 51.8% |
| Renter-Occupied Housing Units | 2,613 | 48.2% |
| Total Occupied Housing Units | 5,418 | 100.0% |
Occupancy by Household Size in Mount Pleasant
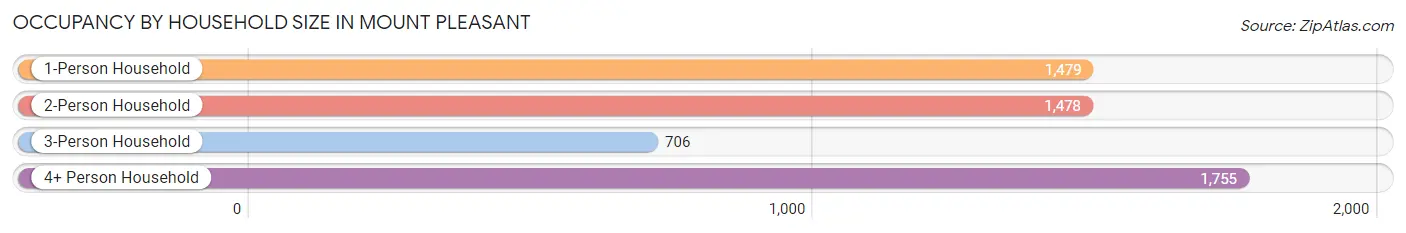
| Household Size | # Housing Units | % Housing Units |
| 1-Person Household | 1,479 | 27.3% |
| 2-Person Household | 1,478 | 27.3% |
| 3-Person Household | 706 | 13.0% |
| 4+ Person Household | 1,755 | 32.4% |
| Total Housing Units | 5,418 | 100.0% |
Occupancy by Ownership by Household Size in Mount Pleasant
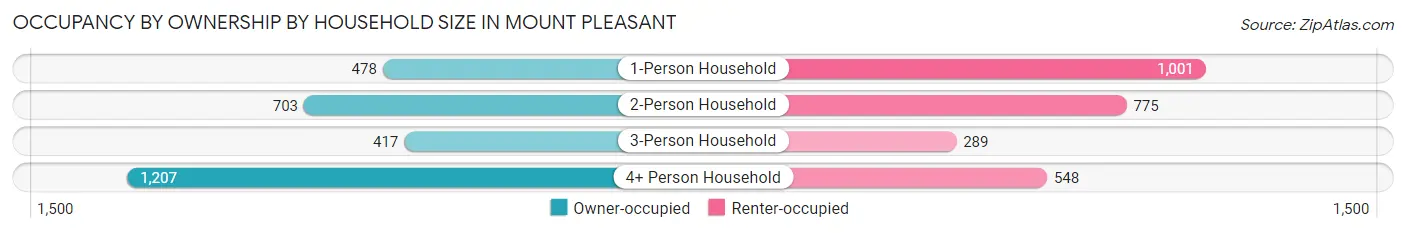
| Household Size | Owner-occupied | Renter-occupied |
| 1-Person Household | 478 (32.3%) | 1,001 (67.7%) |
| 2-Person Household | 703 (47.6%) | 775 (52.4%) |
| 3-Person Household | 417 (59.1%) | 289 (40.9%) |
| 4+ Person Household | 1,207 (68.8%) | 548 (31.2%) |
| Total Housing Units | 2,805 (51.8%) | 2,613 (48.2%) |
Occupancy by Educational Attainment in Mount Pleasant
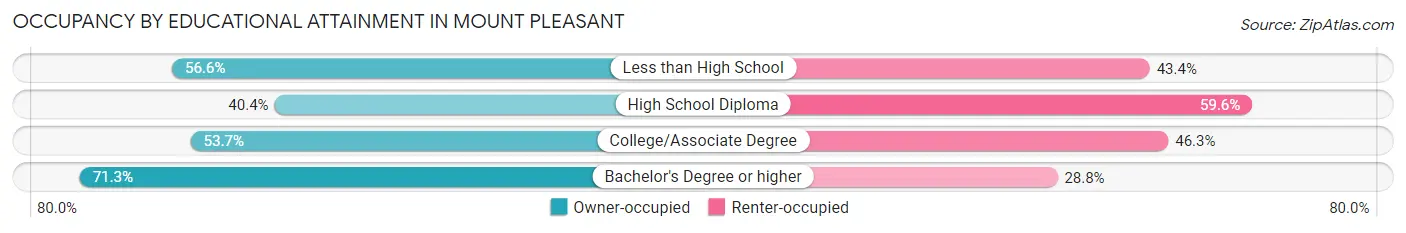
| Household Size | Owner-occupied | Renter-occupied |
| Less than High School | 689 (56.6%) | 528 (43.4%) |
| High School Diploma | 802 (40.4%) | 1,184 (59.6%) |
| College/Associate Degree | 806 (53.7%) | 696 (46.3%) |
| Bachelor's Degree or higher | 508 (71.3%) | 205 (28.7%) |
Occupancy by Age of Householder in Mount Pleasant
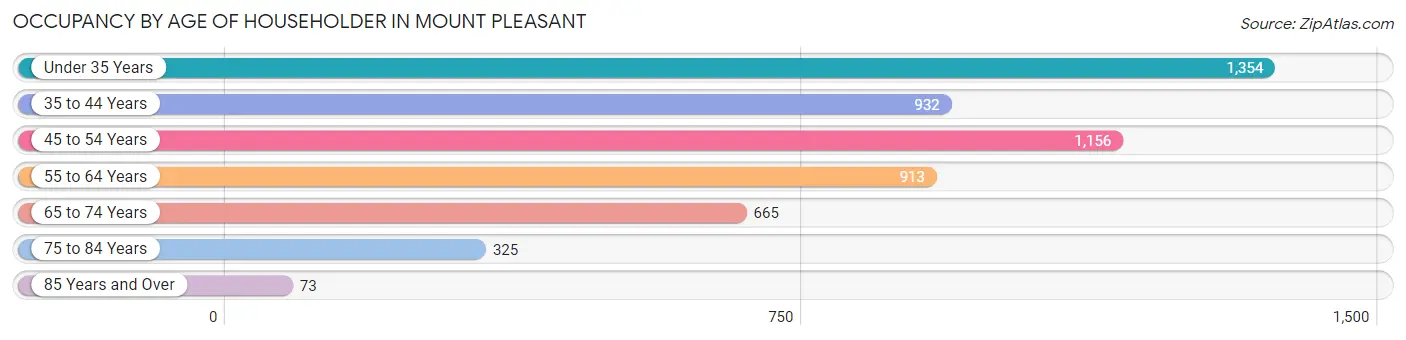
| Age Bracket | # Households | % Households |
| Under 35 Years | 1,354 | 25.0% |
| 35 to 44 Years | 932 | 17.2% |
| 45 to 54 Years | 1,156 | 21.3% |
| 55 to 64 Years | 913 | 16.9% |
| 65 to 74 Years | 665 | 12.3% |
| 75 to 84 Years | 325 | 6.0% |
| 85 Years and Over | 73 | 1.3% |
| Total | 5,418 | 100.0% |
Housing Finances in Mount Pleasant
Median Income by Occupancy in Mount Pleasant
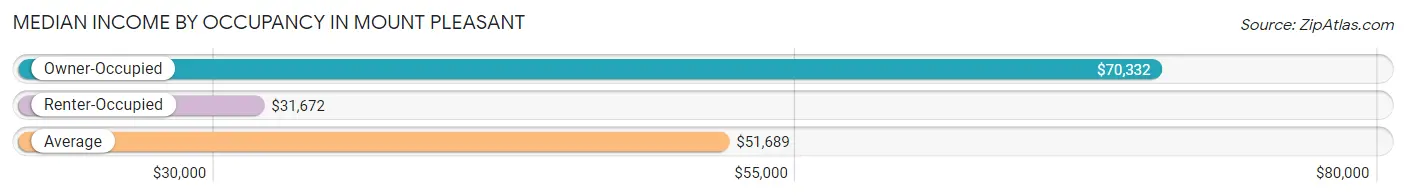
| Occupancy Type | # Households | Median Income |
| Owner-Occupied | 2,805 (51.8%) | $70,332 |
| Renter-Occupied | 2,613 (48.2%) | $31,672 |
| Average | 5,418 (100.0%) | $51,689 |
Occupancy by Householder Income Bracket in Mount Pleasant
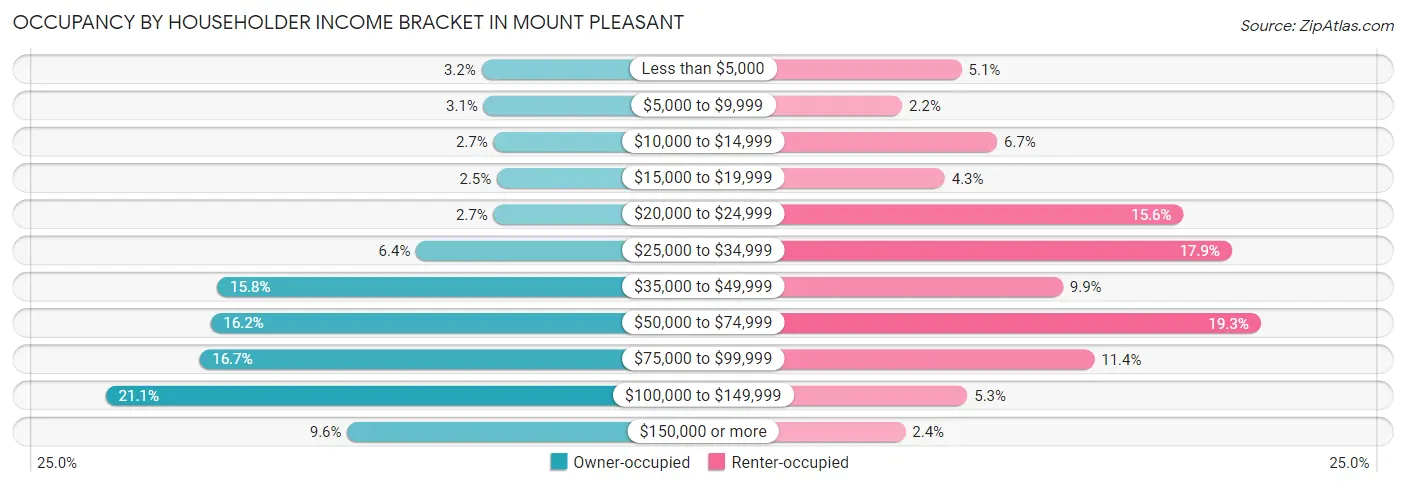
| Income Bracket | Owner-occupied | Renter-occupied |
| Less than $5,000 | 91 (3.2%) | 132 (5.1%) |
| $5,000 to $9,999 | 88 (3.1%) | 58 (2.2%) |
| $10,000 to $14,999 | 75 (2.7%) | 176 (6.7%) |
| $15,000 to $19,999 | 70 (2.5%) | 111 (4.3%) |
| $20,000 to $24,999 | 75 (2.7%) | 408 (15.6%) |
| $25,000 to $34,999 | 178 (6.4%) | 468 (17.9%) |
| $35,000 to $49,999 | 444 (15.8%) | 258 (9.9%) |
| $50,000 to $74,999 | 453 (16.2%) | 504 (19.3%) |
| $75,000 to $99,999 | 468 (16.7%) | 297 (11.4%) |
| $100,000 to $149,999 | 593 (21.1%) | 139 (5.3%) |
| $150,000 or more | 270 (9.6%) | 62 (2.4%) |
| Total | 2,805 (100.0%) | 2,613 (100.0%) |
Monthly Housing Cost Tiers in Mount Pleasant
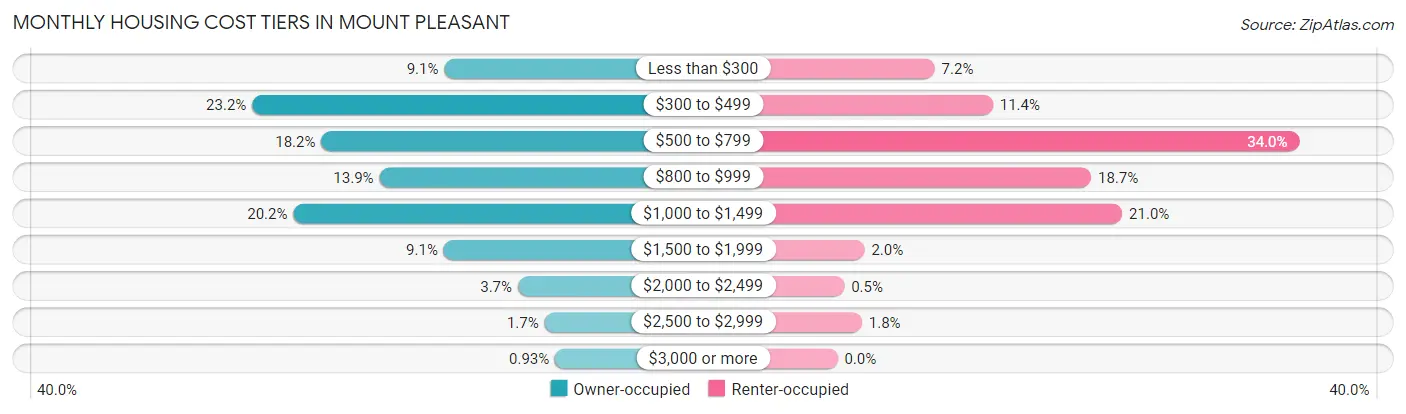
| Monthly Cost | Owner-occupied | Renter-occupied |
| Less than $300 | 255 (9.1%) | 187 (7.2%) |
| $300 to $499 | 652 (23.2%) | 299 (11.4%) |
| $500 to $799 | 509 (18.1%) | 889 (34.0%) |
| $800 to $999 | 389 (13.9%) | 488 (18.7%) |
| $1,000 to $1,499 | 567 (20.2%) | 548 (21.0%) |
| $1,500 to $1,999 | 256 (9.1%) | 52 (2.0%) |
| $2,000 to $2,499 | 103 (3.7%) | 13 (0.5%) |
| $2,500 to $2,999 | 48 (1.7%) | 47 (1.8%) |
| $3,000 or more | 26 (0.9%) | 0 (0.0%) |
| Total | 2,805 (100.0%) | 2,613 (100.0%) |
Physical Housing Characteristics in Mount Pleasant
Housing Structures in Mount Pleasant
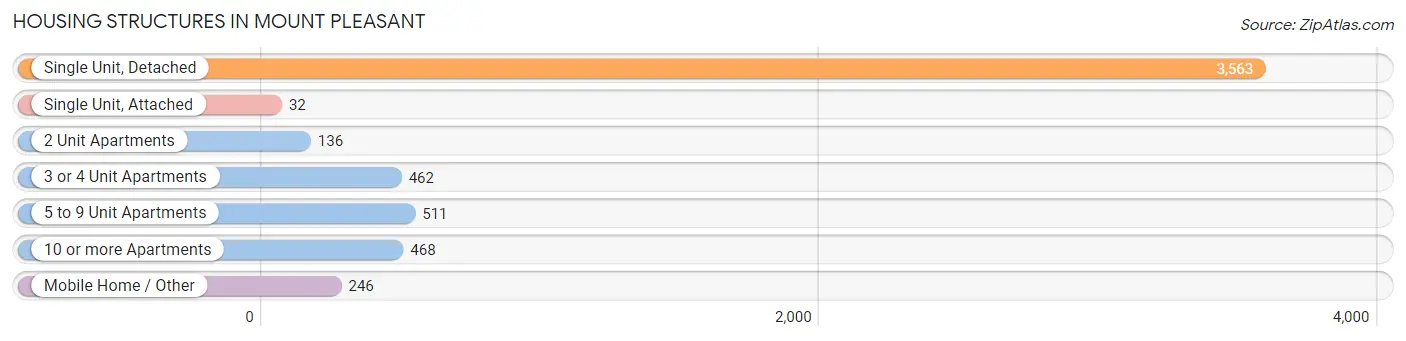
| Structure Type | # Housing Units | % Housing Units |
| Single Unit, Detached | 3,563 | 65.8% |
| Single Unit, Attached | 32 | 0.6% |
| 2 Unit Apartments | 136 | 2.5% |
| 3 or 4 Unit Apartments | 462 | 8.5% |
| 5 to 9 Unit Apartments | 511 | 9.4% |
| 10 or more Apartments | 468 | 8.6% |
| Mobile Home / Other | 246 | 4.5% |
| Total | 5,418 | 100.0% |
Housing Structures by Occupancy in Mount Pleasant
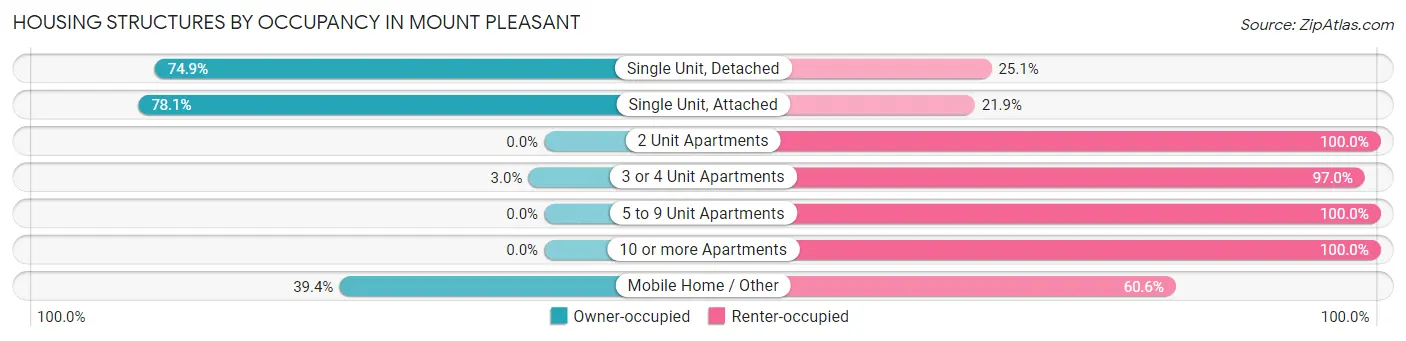
| Structure Type | Owner-occupied | Renter-occupied |
| Single Unit, Detached | 2,669 (74.9%) | 894 (25.1%) |
| Single Unit, Attached | 25 (78.1%) | 7 (21.9%) |
| 2 Unit Apartments | 0 (0.0%) | 136 (100.0%) |
| 3 or 4 Unit Apartments | 14 (3.0%) | 448 (97.0%) |
| 5 to 9 Unit Apartments | 0 (0.0%) | 511 (100.0%) |
| 10 or more Apartments | 0 (0.0%) | 468 (100.0%) |
| Mobile Home / Other | 97 (39.4%) | 149 (60.6%) |
| Total | 2,805 (51.8%) | 2,613 (48.2%) |
Housing Structures by Number of Rooms in Mount Pleasant
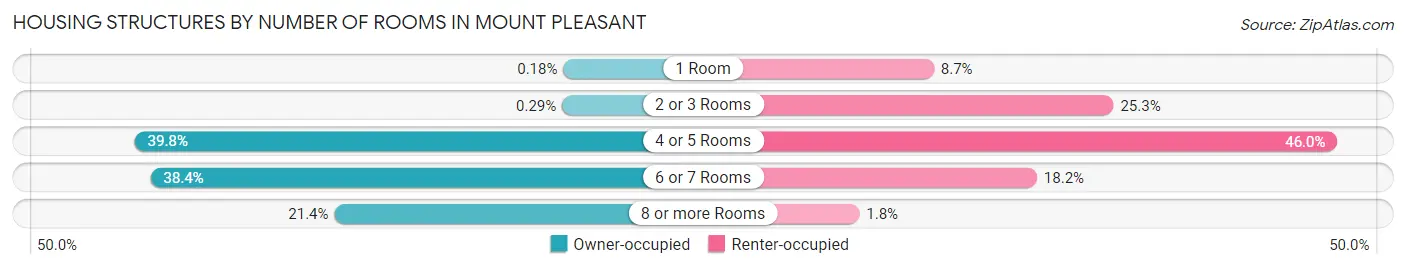
| Number of Rooms | Owner-occupied | Renter-occupied |
| 1 Room | 5 (0.2%) | 227 (8.7%) |
| 2 or 3 Rooms | 8 (0.3%) | 661 (25.3%) |
| 4 or 5 Rooms | 1,117 (39.8%) | 1,202 (46.0%) |
| 6 or 7 Rooms | 1,076 (38.4%) | 476 (18.2%) |
| 8 or more Rooms | 599 (21.3%) | 47 (1.8%) |
| Total | 2,805 (100.0%) | 2,613 (100.0%) |
Housing Structure by Heating Type in Mount Pleasant
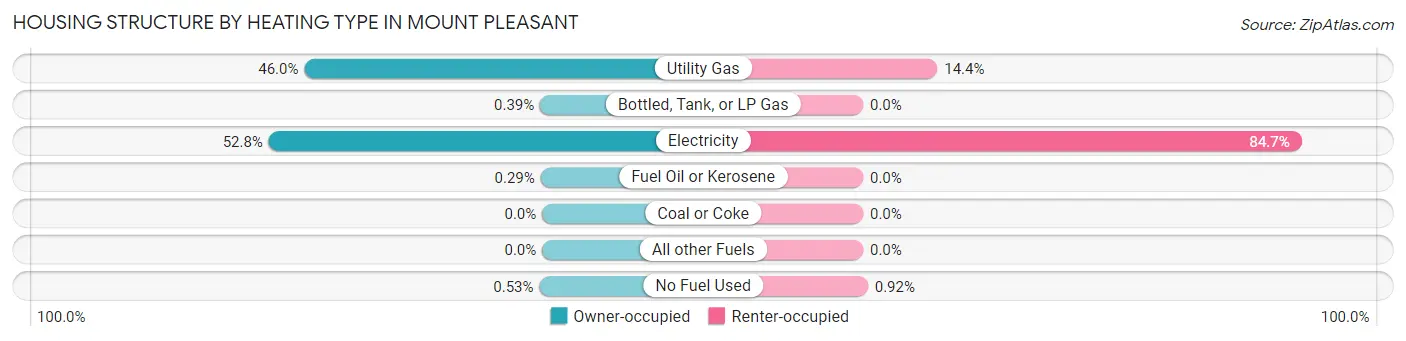
| Heating Type | Owner-occupied | Renter-occupied |
| Utility Gas | 1,289 (46.0%) | 375 (14.3%) |
| Bottled, Tank, or LP Gas | 11 (0.4%) | 0 (0.0%) |
| Electricity | 1,482 (52.8%) | 2,214 (84.7%) |
| Fuel Oil or Kerosene | 8 (0.3%) | 0 (0.0%) |
| Coal or Coke | 0 (0.0%) | 0 (0.0%) |
| All other Fuels | 0 (0.0%) | 0 (0.0%) |
| No Fuel Used | 15 (0.5%) | 24 (0.9%) |
| Total | 2,805 (100.0%) | 2,613 (100.0%) |
Household Vehicle Usage in Mount Pleasant
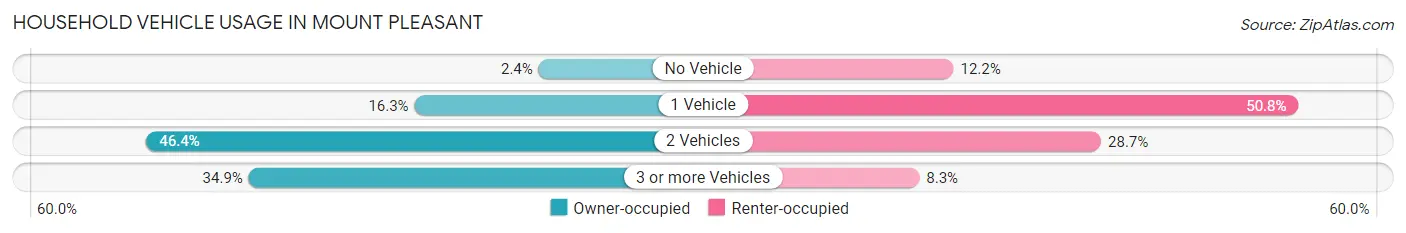
| Vehicles per Household | Owner-occupied | Renter-occupied |
| No Vehicle | 68 (2.4%) | 318 (12.2%) |
| 1 Vehicle | 458 (16.3%) | 1,327 (50.8%) |
| 2 Vehicles | 1,300 (46.4%) | 750 (28.7%) |
| 3 or more Vehicles | 979 (34.9%) | 218 (8.3%) |
| Total | 2,805 (100.0%) | 2,613 (100.0%) |
Real Estate & Mortgages in Mount Pleasant
Real Estate and Mortgage Overview in Mount Pleasant
| Characteristic | Without Mortgage | With Mortgage |
| Housing Units | 1,601 | 1,204 |
| Median Property Value | $126,900 | $162,800 |
| Median Household Income | $60,492 | $141 |
| Monthly Housing Costs | $479 | $26 |
| Real Estate Taxes | $1,628 | $63 |
Property Value by Mortgage Status in Mount Pleasant
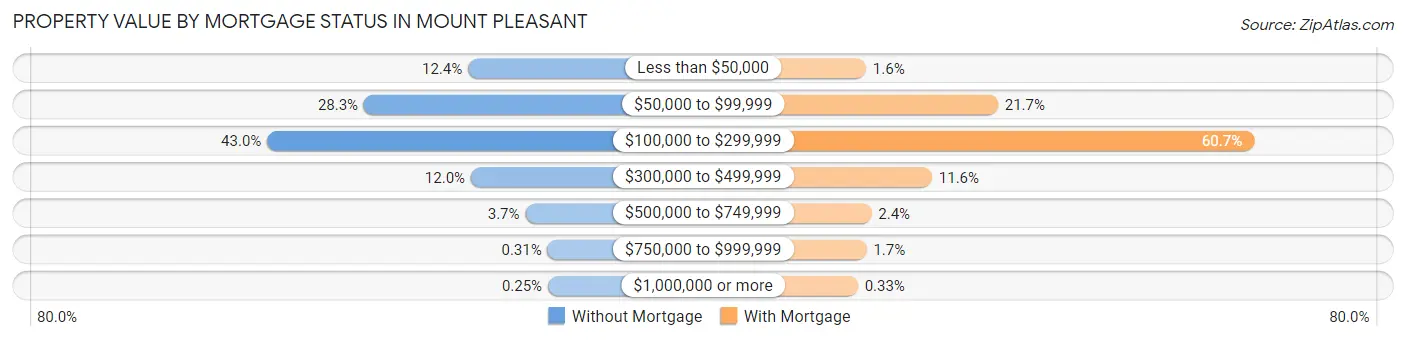
| Property Value | Without Mortgage | With Mortgage |
| Less than $50,000 | 199 (12.4%) | 19 (1.6%) |
| $50,000 to $99,999 | 453 (28.3%) | 261 (21.7%) |
| $100,000 to $299,999 | 689 (43.0%) | 731 (60.7%) |
| $300,000 to $499,999 | 192 (12.0%) | 140 (11.6%) |
| $500,000 to $749,999 | 59 (3.7%) | 29 (2.4%) |
| $750,000 to $999,999 | 5 (0.3%) | 20 (1.7%) |
| $1,000,000 or more | 4 (0.3%) | 4 (0.3%) |
| Total | 1,601 (100.0%) | 1,204 (100.0%) |
Household Income by Mortgage Status in Mount Pleasant
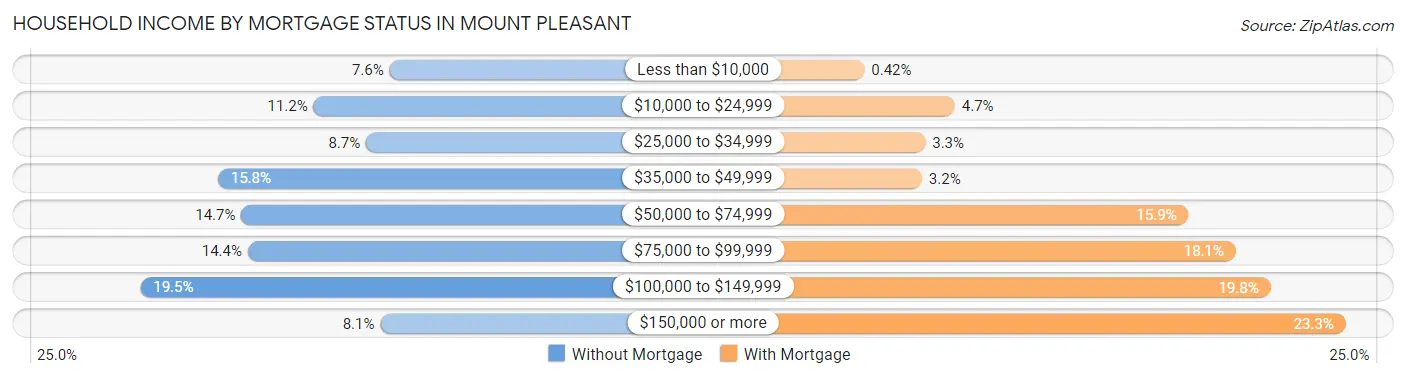
| Household Income | Without Mortgage | With Mortgage |
| Less than $10,000 | 122 (7.6%) | 5 (0.4%) |
| $10,000 to $24,999 | 180 (11.2%) | 57 (4.7%) |
| $25,000 to $34,999 | 140 (8.7%) | 40 (3.3%) |
| $35,000 to $49,999 | 253 (15.8%) | 38 (3.2%) |
| $50,000 to $74,999 | 235 (14.7%) | 191 (15.9%) |
| $75,000 to $99,999 | 230 (14.4%) | 218 (18.1%) |
| $100,000 to $149,999 | 312 (19.5%) | 238 (19.8%) |
| $150,000 or more | 129 (8.1%) | 281 (23.3%) |
| Total | 1,601 (100.0%) | 1,204 (100.0%) |
Property Value to Household Income Ratio in Mount Pleasant
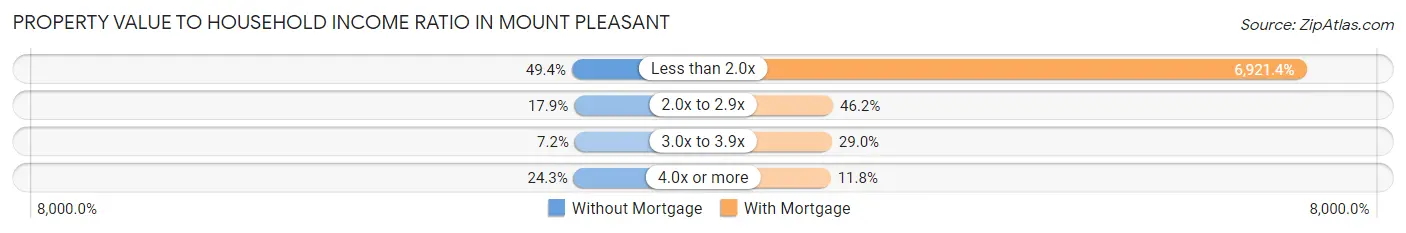
| Value-to-Income Ratio | Without Mortgage | With Mortgage |
| Less than 2.0x | 791 (49.4%) | 83,333 (6,921.3%) |
| 2.0x to 2.9x | 286 (17.9%) | 556 (46.2%) |
| 3.0x to 3.9x | 115 (7.2%) | 349 (29.0%) |
| 4.0x or more | 389 (24.3%) | 142 (11.8%) |
| Total | 1,601 (100.0%) | 1,204 (100.0%) |
Real Estate Taxes by Mortgage Status in Mount Pleasant
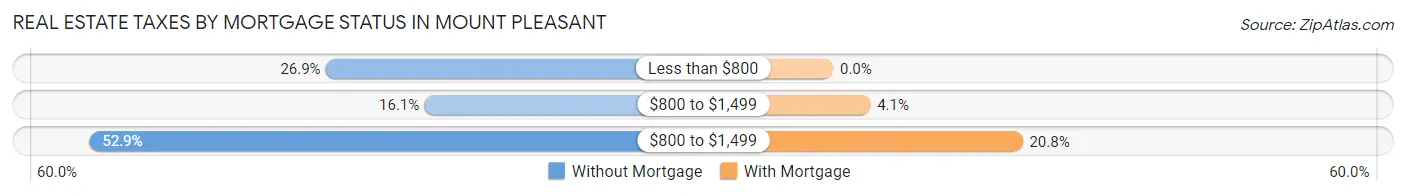
| Property Taxes | Without Mortgage | With Mortgage |
| Less than $800 | 431 (26.9%) | 0 (0.0%) |
| $800 to $1,499 | 258 (16.1%) | 49 (4.1%) |
| $800 to $1,499 | 847 (52.9%) | 250 (20.8%) |
| Total | 1,601 (100.0%) | 1,204 (100.0%) |
Health & Disability in Mount Pleasant
Health Insurance Coverage by Age in Mount Pleasant
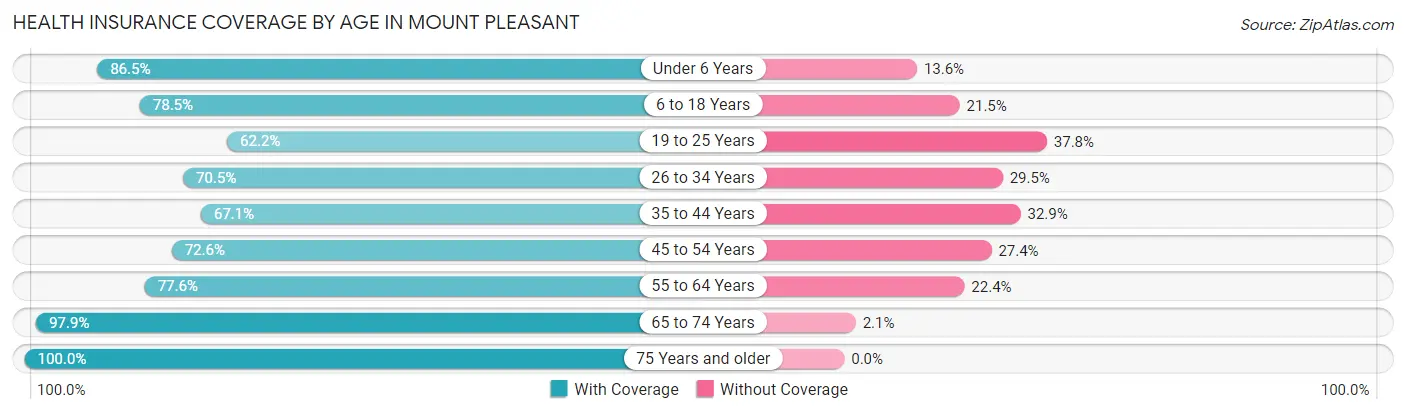
| Age Bracket | With Coverage | Without Coverage |
| Under 6 Years | 1,308 (86.5%) | 205 (13.6%) |
| 6 to 18 Years | 2,880 (78.5%) | 789 (21.5%) |
| 19 to 25 Years | 1,056 (62.2%) | 641 (37.8%) |
| 26 to 34 Years | 1,524 (70.5%) | 639 (29.5%) |
| 35 to 44 Years | 1,093 (67.1%) | 535 (32.9%) |
| 45 to 54 Years | 1,497 (72.6%) | 566 (27.4%) |
| 55 to 64 Years | 1,147 (77.6%) | 331 (22.4%) |
| 65 to 74 Years | 1,009 (97.9%) | 22 (2.1%) |
| 75 Years and older | 591 (100.0%) | 0 (0.0%) |
| Total | 12,105 (76.4%) | 3,728 (23.5%) |
Health Insurance Coverage by Citizenship Status in Mount Pleasant
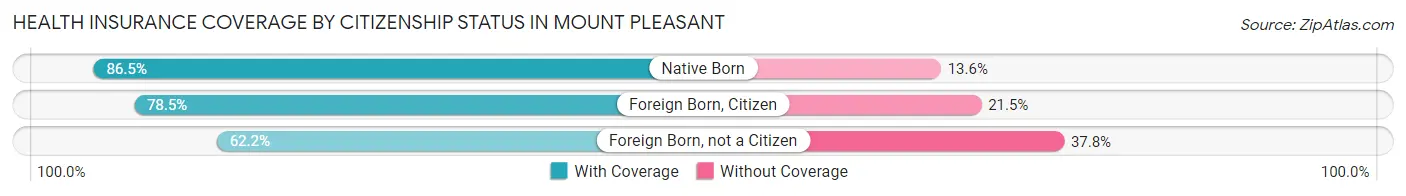
| Citizenship Status | With Coverage | Without Coverage |
| Native Born | 1,308 (86.5%) | 205 (13.6%) |
| Foreign Born, Citizen | 2,880 (78.5%) | 789 (21.5%) |
| Foreign Born, not a Citizen | 1,056 (62.2%) | 641 (37.8%) |
Health Insurance Coverage by Household Income in Mount Pleasant
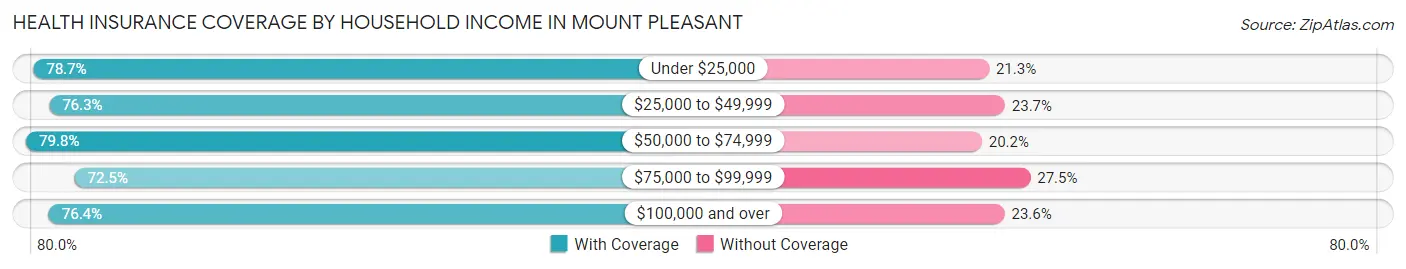
| Household Income | With Coverage | Without Coverage |
| Under $25,000 | 1,776 (78.7%) | 481 (21.3%) |
| $25,000 to $49,999 | 2,796 (76.3%) | 868 (23.7%) |
| $50,000 to $74,999 | 2,137 (79.8%) | 542 (20.2%) |
| $75,000 to $99,999 | 2,349 (72.5%) | 891 (27.5%) |
| $100,000 and over | 3,039 (76.4%) | 941 (23.6%) |
Public vs Private Health Insurance Coverage by Age in Mount Pleasant
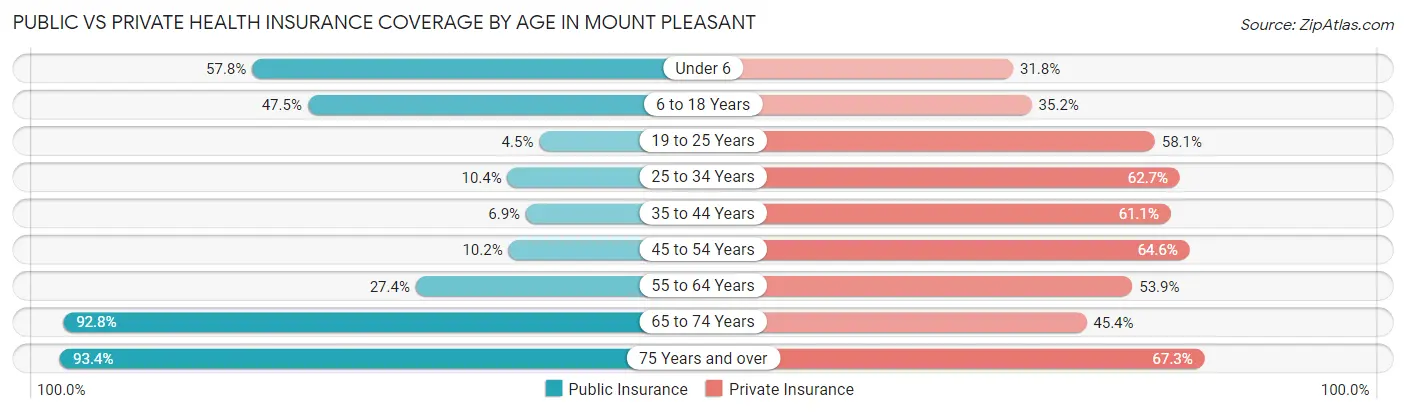
| Age Bracket | Public Insurance | Private Insurance |
| Under 6 | 874 (57.8%) | 481 (31.8%) |
| 6 to 18 Years | 1,741 (47.4%) | 1,293 (35.2%) |
| 19 to 25 Years | 76 (4.5%) | 986 (58.1%) |
| 25 to 34 Years | 224 (10.4%) | 1,357 (62.7%) |
| 35 to 44 Years | 113 (6.9%) | 994 (61.1%) |
| 45 to 54 Years | 210 (10.2%) | 1,332 (64.6%) |
| 55 to 64 Years | 405 (27.4%) | 797 (53.9%) |
| 65 to 74 Years | 957 (92.8%) | 468 (45.4%) |
| 75 Years and over | 552 (93.4%) | 398 (67.3%) |
| Total | 5,152 (32.5%) | 8,106 (51.2%) |
Disability Status by Sex by Age in Mount Pleasant
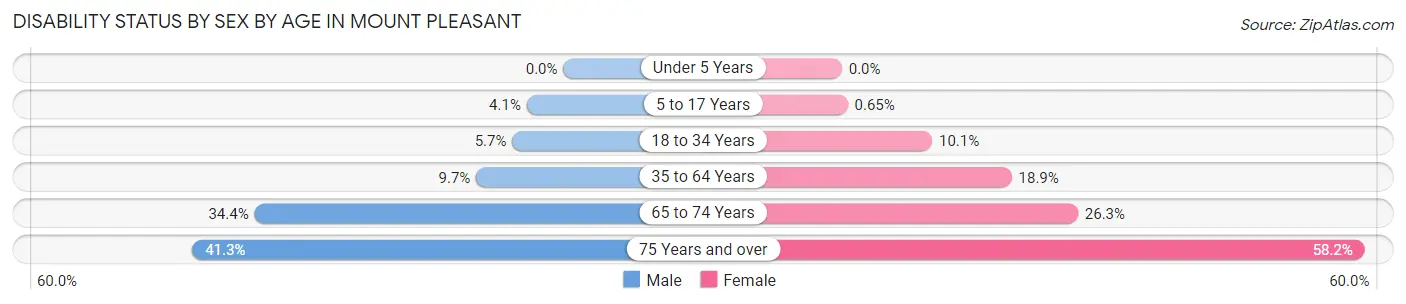
| Age Bracket | Male | Female |
| Under 5 Years | 0 (0.0%) | 0 (0.0%) |
| 5 to 17 Years | 81 (4.1%) | 11 (0.6%) |
| 18 to 34 Years | 116 (5.7%) | 206 (10.1%) |
| 35 to 64 Years | 256 (9.7%) | 479 (18.9%) |
| 65 to 74 Years | 161 (34.4%) | 148 (26.3%) |
| 75 Years and over | 81 (41.3%) | 230 (58.2%) |
Disability Class by Sex by Age in Mount Pleasant
Disability Class: Hearing Difficulty
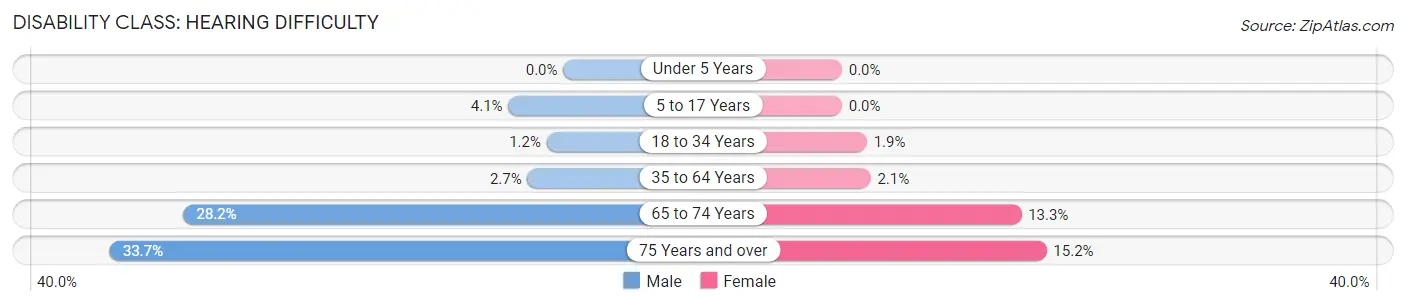
| Age Bracket | Male | Female |
| Under 5 Years | 0 (0.0%) | 0 (0.0%) |
| 5 to 17 Years | 81 (4.1%) | 0 (0.0%) |
| 18 to 34 Years | 25 (1.2%) | 38 (1.8%) |
| 35 to 64 Years | 70 (2.7%) | 54 (2.1%) |
| 65 to 74 Years | 132 (28.2%) | 75 (13.3%) |
| 75 Years and over | 66 (33.7%) | 60 (15.2%) |
Disability Class: Vision Difficulty
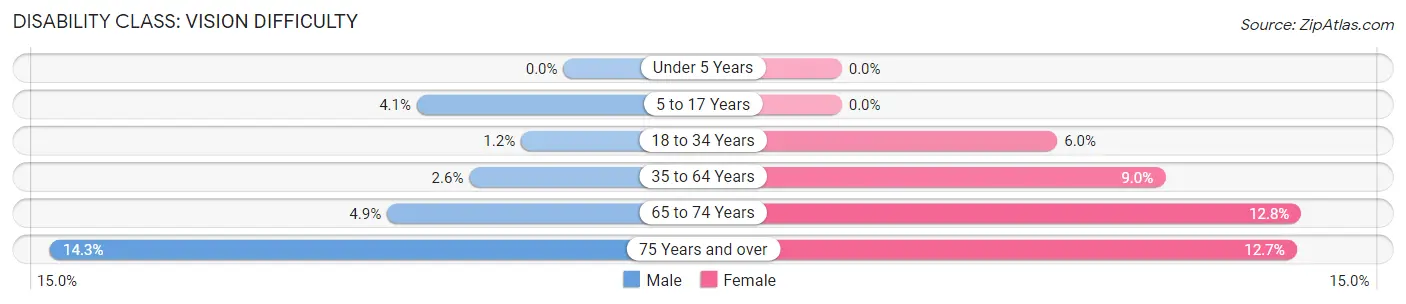
| Age Bracket | Male | Female |
| Under 5 Years | 0 (0.0%) | 0 (0.0%) |
| 5 to 17 Years | 81 (4.1%) | 0 (0.0%) |
| 18 to 34 Years | 24 (1.2%) | 123 (6.0%) |
| 35 to 64 Years | 69 (2.6%) | 228 (9.0%) |
| 65 to 74 Years | 23 (4.9%) | 72 (12.8%) |
| 75 Years and over | 28 (14.3%) | 50 (12.7%) |
Disability Class: Cognitive Difficulty
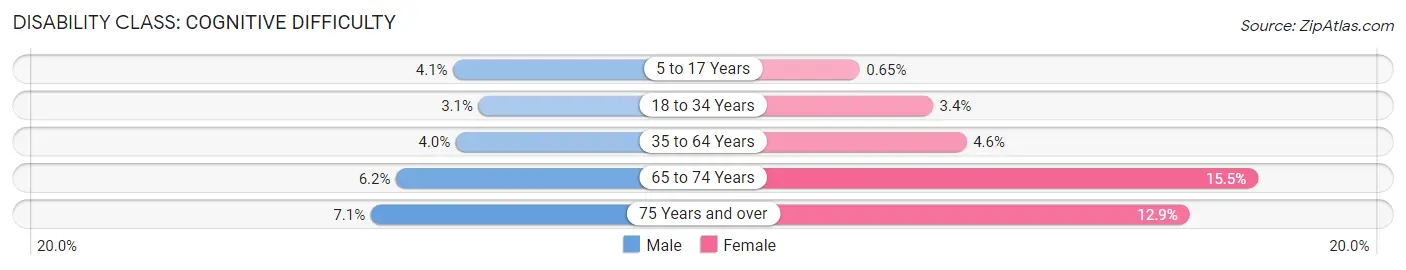
| Age Bracket | Male | Female |
| 5 to 17 Years | 81 (4.1%) | 11 (0.6%) |
| 18 to 34 Years | 64 (3.1%) | 69 (3.4%) |
| 35 to 64 Years | 105 (4.0%) | 117 (4.6%) |
| 65 to 74 Years | 29 (6.2%) | 87 (15.4%) |
| 75 Years and over | 14 (7.1%) | 51 (12.9%) |
Disability Class: Ambulatory Difficulty
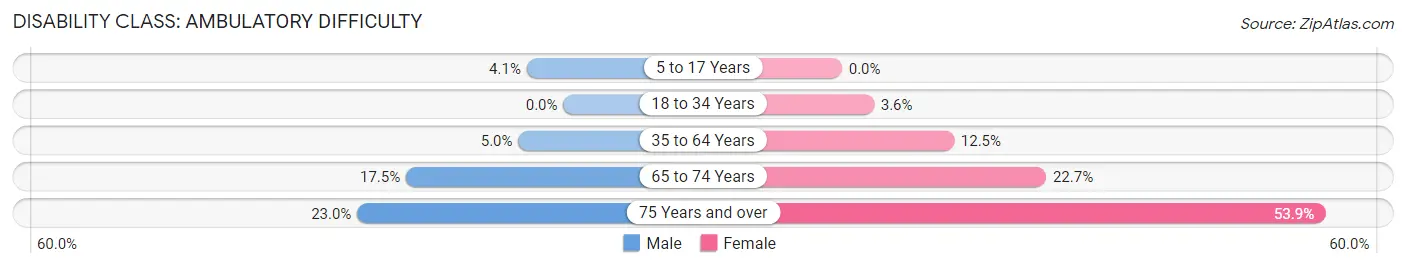
| Age Bracket | Male | Female |
| 5 to 17 Years | 81 (4.1%) | 0 (0.0%) |
| 18 to 34 Years | 0 (0.0%) | 73 (3.6%) |
| 35 to 64 Years | 132 (5.0%) | 316 (12.5%) |
| 65 to 74 Years | 82 (17.5%) | 128 (22.7%) |
| 75 Years and over | 45 (23.0%) | 213 (53.9%) |
Disability Class: Self-Care Difficulty
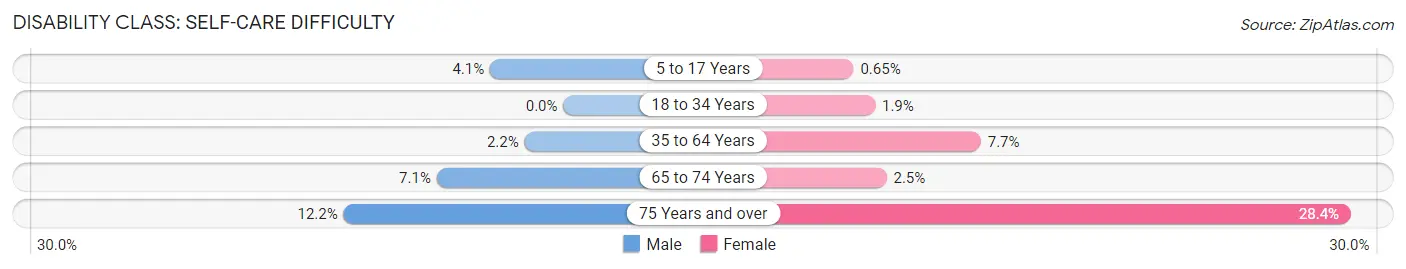
| Age Bracket | Male | Female |
| 5 to 17 Years | 81 (4.1%) | 11 (0.6%) |
| 18 to 34 Years | 0 (0.0%) | 38 (1.8%) |
| 35 to 64 Years | 57 (2.2%) | 196 (7.7%) |
| 65 to 74 Years | 33 (7.0%) | 14 (2.5%) |
| 75 Years and over | 24 (12.2%) | 112 (28.3%) |
Technology Access in Mount Pleasant
Computing Device Access in Mount Pleasant
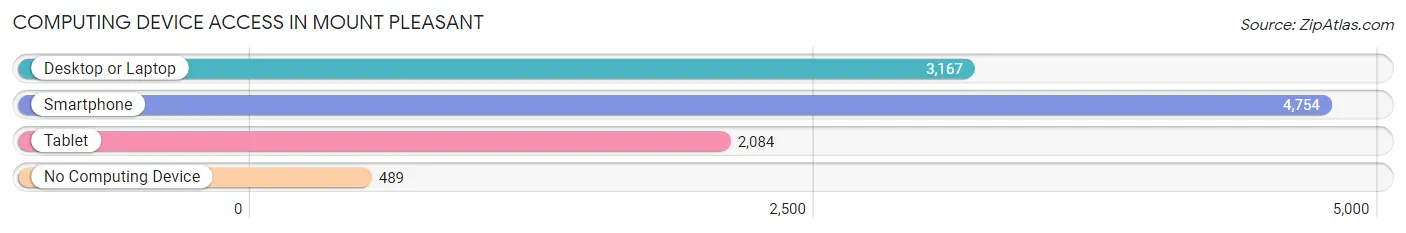
| Device Type | # Households | % Households |
| Desktop or Laptop | 3,167 | 58.5% |
| Smartphone | 4,754 | 87.7% |
| Tablet | 2,084 | 38.5% |
| No Computing Device | 489 | 9.0% |
| Total | 5,418 | 100.0% |
Internet Access in Mount Pleasant
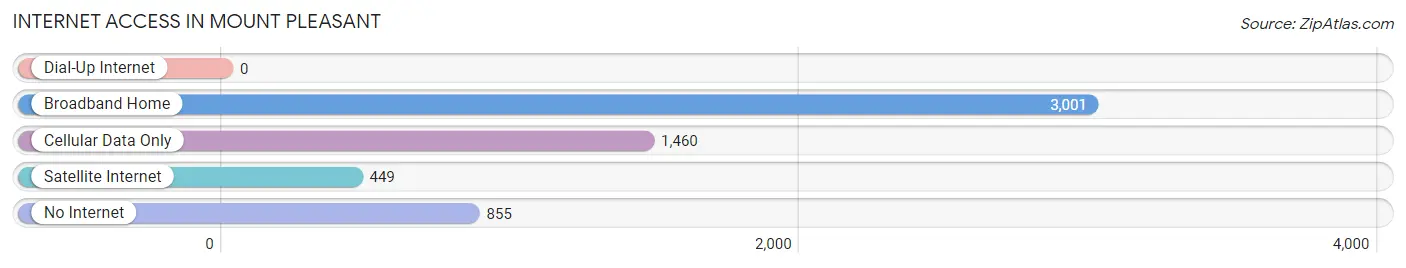
| Internet Type | # Households | % Households |
| Dial-Up Internet | 0 | 0.0% |
| Broadband Home | 3,001 | 55.4% |
| Cellular Data Only | 1,460 | 27.0% |
| Satellite Internet | 449 | 8.3% |
| No Internet | 855 | 15.8% |
| Total | 5,418 | 100.0% |
Mount Pleasant Summary
Introduction
Mount Pleasant is a city located in Titus County, Texas, United States. It is the county seat of Titus County and is situated in the northeast corner of the state. The city is located in the Piney Woods region of Texas and is part of the Texarkana metropolitan area. As of the 2010 census, the city had a population of 15,564.
History
Mount Pleasant was founded in 1848 by settlers from the nearby town of Pittsburg. The town was named after the nearby Mount Pleasant Church, which was built in 1845. The town was incorporated in 1872 and was designated as the county seat of Titus County in 1876.
The city experienced rapid growth in the late 19th and early 20th centuries, due to the discovery of oil in the area. The city was home to several oil refineries and related industries, which provided employment for many of the city’s residents.
In the mid-20th century, the city experienced a decline in population as many of the oil-related industries closed or moved away. The city has since experienced a resurgence in population and economic activity, due to the growth of the local healthcare and education sectors.
Geography
Mount Pleasant is located at 33°9'25"N 94°59'25"W (33.156944, -94.990250). The city is situated in the northeast corner of Texas, in the Piney Woods region. The city is located approximately 100 miles east of Dallas and 100 miles west of Shreveport, Louisiana.
The city is situated on the banks of the Sulphur River, which flows through the city. The city is surrounded by rolling hills and wooded areas, and is located in a region of Texas known for its natural beauty.
Economy
Mount Pleasant’s economy is largely based on the healthcare and education sectors. The city is home to Titus Regional Medical Center, a full-service hospital that serves the region. The city is also home to several educational institutions, including Northeast Texas Community College and the University of Texas at Tyler.
The city is also home to several manufacturing and industrial companies, including a large paper mill and a plastics manufacturing plant. The city is also home to several retail stores and restaurants.
Demographics
As of the 2010 census, the city had a population of 15,564. The racial makeup of the city was 73.3% White, 17.2% African American, 0.7% Native American, 0.7% Asian, 0.1% Pacific Islander, 5.7% from other races, and 2.4% from two or more races. Hispanic or Latino of any race were 11.3% of the population.
The median income for a household in the city was $31,945, and the median income for a family was $41,945. The per capita income for the city was $17,845. About 17.2% of families and 21.3% of the population were below the poverty line, including 28.3% of those under age 18 and 14.2% of those age 65 or over.
Conclusion
Mount Pleasant is a city located in Titus County, Texas, United States. It is the county seat of Titus County and is situated in the northeast corner of the state. The city is located in the Piney Woods region of Texas and is part of the Texarkana metropolitan area. As of the 2010 census, the city had a population of 15,564. The city’s economy is largely based on the healthcare and education sectors, and the city is also home to several manufacturing and industrial companies. The racial makeup of the city was 73.3% White, 17.2% African American, 0.7% Native American, 0.7% Asian, 0.1% Pacific Islander, 5.7% from other races, and 2.4% from two or more races. The median income for a household in the city was $31,945, and the median income for a family was $41,945. The per capita income for the city was $17,845. About 17.2% of families and 21.3% of the population were below the poverty line.
Common Questions
What is Per Capita Income in Mount Pleasant?
Per Capita income in Mount Pleasant is $22,858.
What is the Median Family Income in Mount Pleasant?
Median Family Income in Mount Pleasant is $65,836.
What is the Median Household income in Mount Pleasant?
Median Household Income in Mount Pleasant is $51,689.
What is Income or Wage Gap in Mount Pleasant?
Income or Wage Gap in Mount Pleasant is 40.5%.
Women in Mount Pleasant earn 59.5 cents for every dollar earned by a man.
What is Inequality or Gini Index in Mount Pleasant?
Inequality or Gini Index in Mount Pleasant is 0.44.
What is the Total Population of Mount Pleasant?
Total Population of Mount Pleasant is 16,065.
What is the Total Male Population of Mount Pleasant?
Total Male Population of Mount Pleasant is 8,069.
What is the Total Female Population of Mount Pleasant?
Total Female Population of Mount Pleasant is 7,996.
What is the Ratio of Males per 100 Females in Mount Pleasant?
There are 100.91 Males per 100 Females in Mount Pleasant.
What is the Ratio of Females per 100 Males in Mount Pleasant?
There are 99.10 Females per 100 Males in Mount Pleasant.
What is the Median Population Age in Mount Pleasant?
Median Population Age in Mount Pleasant is 30.4 Years.
What is the Average Family Size in Mount Pleasant
Average Family Size in Mount Pleasant is 3.6 People.
What is the Average Household Size in Mount Pleasant
Average Household Size in Mount Pleasant is 2.9 People.
How Large is the Labor Force in Mount Pleasant?
There are 7,538 People in the Labor Forcein in Mount Pleasant.
What is the Percentage of People in the Labor Force in Mount Pleasant?
64.7% of People are in the Labor Force in Mount Pleasant.
What is the Unemployment Rate in Mount Pleasant?
Unemployment Rate in Mount Pleasant is 3.5%.