Brownwood, TX Map & Demographics
Brownwood Map
Brownwood Overview
$25,906
PER CAPITA INCOME
$61,798
AVG FAMILY INCOME
$45,412
AVG HOUSEHOLD INCOME
33.9%
WAGE / INCOME GAP [ % ]
66.1¢/ $1
WAGE / INCOME GAP [ $ ]
$10,218
FAMILY INCOME DEFICIT
0.45
INEQUALITY / GINI INDEX
18,820
TOTAL POPULATION
9,105
MALE POPULATION
9,715
FEMALE POPULATION
93.72
MALES / 100 FEMALES
106.70
FEMALES / 100 MALES
34.9
MEDIAN AGE
3.0
AVG FAMILY SIZE
2.4
AVG HOUSEHOLD SIZE
9,260
LABOR FORCE [ PEOPLE ]
61.1%
PERCENT IN LABOR FORCE
3.2%
UNEMPLOYMENT RATE
Brownwood Zip Codes
Brownwood Area Codes
Income in Brownwood
Income Overview in Brownwood
Per Capita Income in Brownwood is $25,906, while median incomes of families and households are $61,798 and $45,412 respectively.
| Characteristic | Number | Measure |
| Per Capita Income | 18,820 | $25,906 |
| Median Family Income | 4,452 | $61,798 |
| Mean Family Income | 4,452 | $75,021 |
| Median Household Income | 7,313 | $45,412 |
| Mean Household Income | 7,313 | $62,492 |
| Income Deficit | 4,452 | $10,218 |
| Wage / Income Gap (%) | 18,820 | 33.90% |
| Wage / Income Gap ($) | 18,820 | 66.10¢ per $1 |
| Gini / Inequality Index | 18,820 | 0.45 |
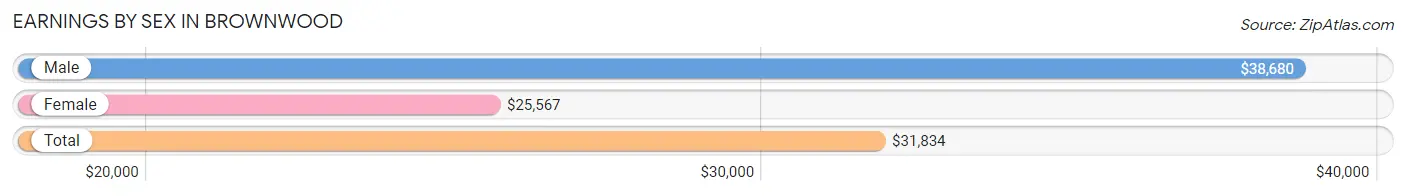
Earnings by Sex in Brownwood
Average Earnings in Brownwood are $31,834, $38,680 for men and $25,567 for women, a difference of 33.9%.
| Sex | Number | Average Earnings |
| Male | 4,970 (51.6%) | $38,680 |
| Female | 4,654 (48.4%) | $25,567 |
| Total | 9,624 (100.0%) | $31,834 |
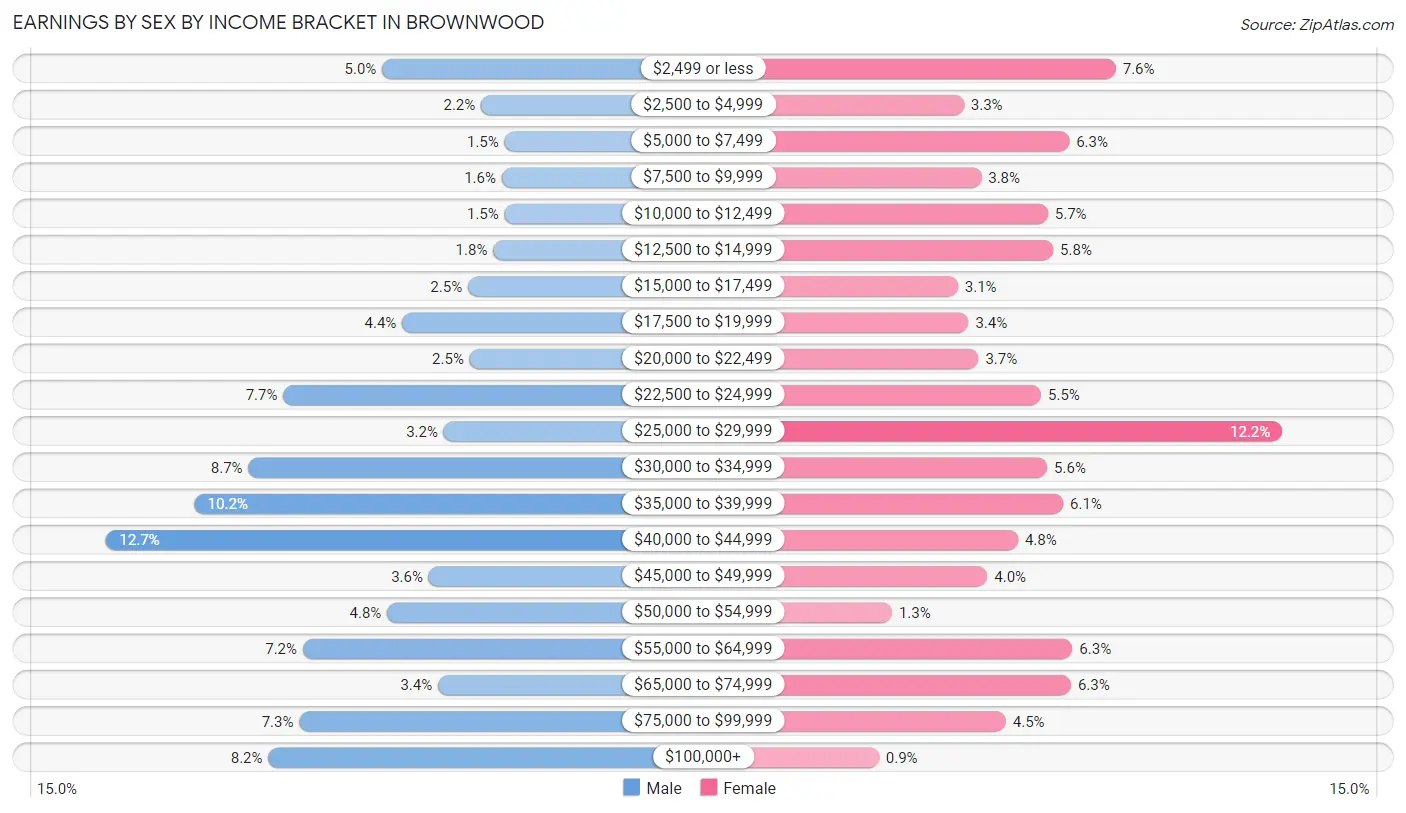
Earnings by Sex by Income Bracket in Brownwood
The most common earnings brackets in Brownwood are $40,000 to $44,999 for men (631 | 12.7%) and $25,000 to $29,999 for women (569 | 12.2%).
| Income | Male | Female |
| $2,499 or less | 246 (5.0%) | 352 (7.6%) |
| $2,500 to $4,999 | 108 (2.2%) | 153 (3.3%) |
| $5,000 to $7,499 | 75 (1.5%) | 291 (6.2%) |
| $7,500 to $9,999 | 79 (1.6%) | 176 (3.8%) |
| $10,000 to $12,499 | 75 (1.5%) | 263 (5.7%) |
| $12,500 to $14,999 | 91 (1.8%) | 270 (5.8%) |
| $15,000 to $17,499 | 126 (2.5%) | 145 (3.1%) |
| $17,500 to $19,999 | 218 (4.4%) | 159 (3.4%) |
| $20,000 to $22,499 | 124 (2.5%) | 172 (3.7%) |
| $22,500 to $24,999 | 384 (7.7%) | 254 (5.5%) |
| $25,000 to $29,999 | 160 (3.2%) | 569 (12.2%) |
| $30,000 to $34,999 | 433 (8.7%) | 262 (5.6%) |
| $35,000 to $39,999 | 508 (10.2%) | 283 (6.1%) |
| $40,000 to $44,999 | 631 (12.7%) | 224 (4.8%) |
| $45,000 to $49,999 | 181 (3.6%) | 184 (4.0%) |
| $50,000 to $54,999 | 239 (4.8%) | 59 (1.3%) |
| $55,000 to $64,999 | 357 (7.2%) | 295 (6.3%) |
| $65,000 to $74,999 | 168 (3.4%) | 293 (6.3%) |
| $75,000 to $99,999 | 362 (7.3%) | 208 (4.5%) |
| $100,000+ | 405 (8.2%) | 42 (0.9%) |
| Total | 4,970 (100.0%) | 4,654 (100.0%) |
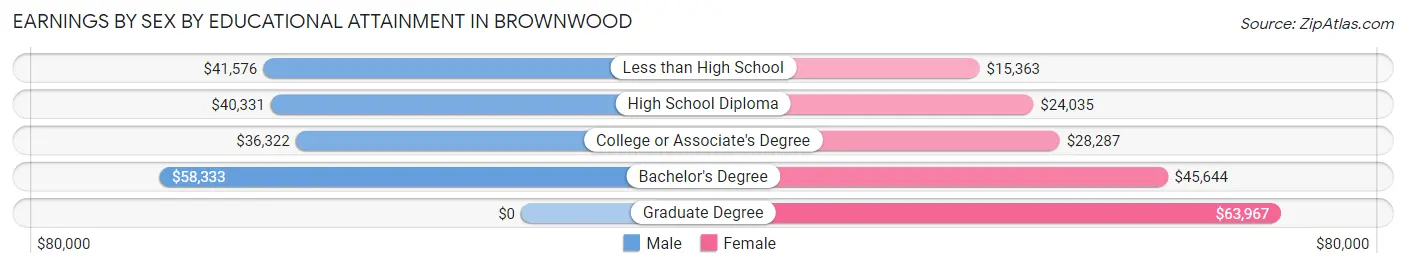
Earnings by Sex by Educational Attainment in Brownwood
Average earnings in Brownwood are $41,123 for men and $28,105 for women, a difference of 31.7%. Men with an educational attainment of bachelor's degree enjoy the highest average annual earnings of $58,333, while those with college or associate's degree education earn the least with $36,322. Women with an educational attainment of graduate degree earn the most with the average annual earnings of $63,967, while those with less than high school education have the smallest earnings of $15,363.
| Educational Attainment | Male Income | Female Income |
| Less than High School | $41,576 | $15,363 |
| High School Diploma | $40,331 | $24,035 |
| College or Associate's Degree | $36,322 | $28,287 |
| Bachelor's Degree | $58,333 | $45,644 |
| Graduate Degree | - | - |
| Total | $41,123 | $28,105 |
Family Income in Brownwood
Family Income Brackets in Brownwood
According to the Brownwood family income data, there are 868 families falling into the $50,000 to $74,999 income range, which is the most common income bracket and makes up 19.5% of all families. Conversely, the $10,000 to $14,999 income bracket is the least frequent group with only 151 families (3.4%) belonging to this category.
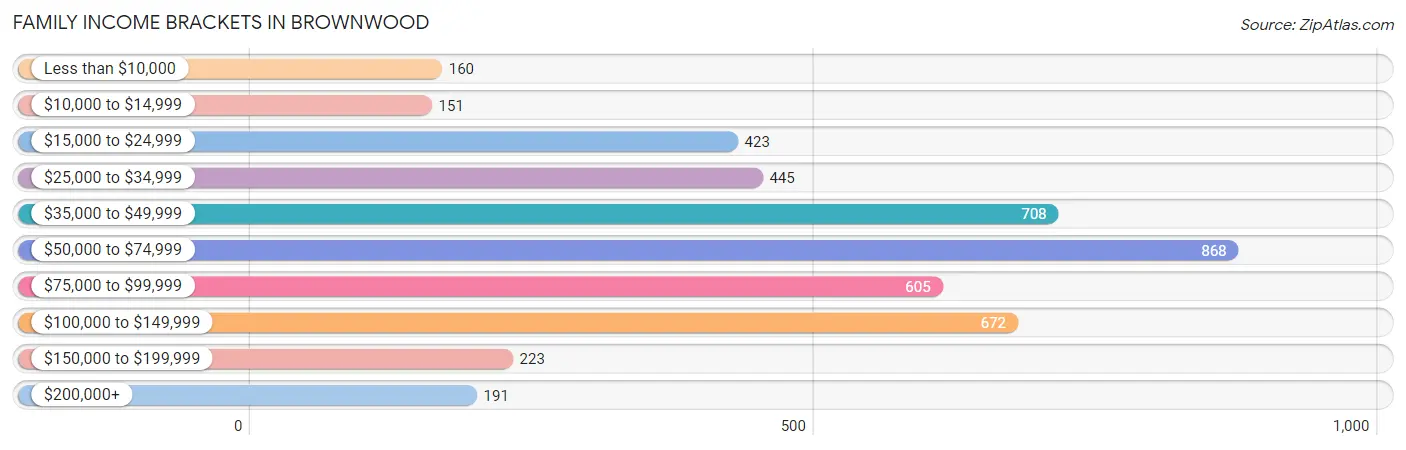
| Income Bracket | # Families | % Families |
| Less than $10,000 | 160 | 3.6% |
| $10,000 to $14,999 | 151 | 3.4% |
| $15,000 to $24,999 | 423 | 9.5% |
| $25,000 to $34,999 | 445 | 10.0% |
| $35,000 to $49,999 | 708 | 15.9% |
| $50,000 to $74,999 | 868 | 19.5% |
| $75,000 to $99,999 | 605 | 13.6% |
| $100,000 to $149,999 | 672 | 15.1% |
| $150,000 to $199,999 | 223 | 5.0% |
| $200,000+ | 191 | 4.3% |
Family Income by Famaliy Size in Brownwood
7+ person families (78 | 1.8%) account for the highest median family income in Brownwood with $108,750 per family, while 2-person families (2,100 | 47.2%) have the highest median income of $23,391 per family member.
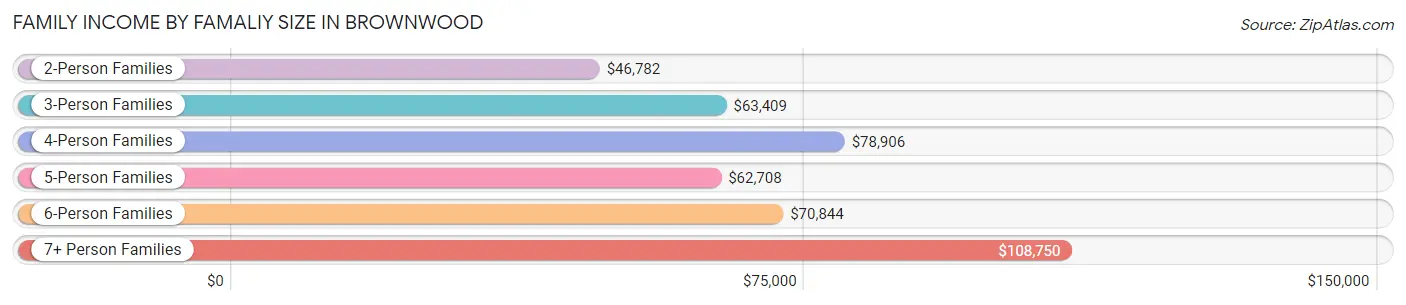
| Income Bracket | # Families | Median Income |
| 2-Person Families | 2,100 (47.2%) | $46,782 |
| 3-Person Families | 922 (20.7%) | $63,409 |
| 4-Person Families | 857 (19.3%) | $78,906 |
| 5-Person Families | 384 (8.6%) | $62,708 |
| 6-Person Families | 111 (2.5%) | $70,844 |
| 7+ Person Families | 78 (1.8%) | $108,750 |
| Total | 4,452 (100.0%) | $61,798 |
Family Income by Number of Earners in Brownwood
The median family income in Brownwood is $61,798, with families comprising 3+ earners (394) having the highest median family income of $145,000, while families with no earners (582) have the lowest median family income of $25,778, accounting for 8.8% and 13.1% of families, respectively.
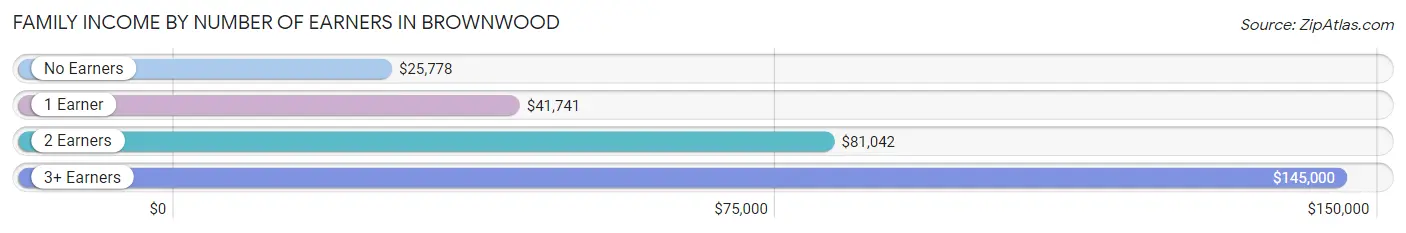
| Number of Earners | # Families | Median Income |
| No Earners | 582 (13.1%) | $25,778 |
| 1 Earner | 1,824 (41.0%) | $41,741 |
| 2 Earners | 1,652 (37.1%) | $81,042 |
| 3+ Earners | 394 (8.8%) | $145,000 |
| Total | 4,452 (100.0%) | $61,798 |
Household Income in Brownwood
Household Income Brackets in Brownwood
With 1,265 households falling in the category, the $50,000 to $74,999 income range is the most frequent in Brownwood, accounting for 17.3% of all households. In contrast, only 219 households (3.0%) fall into the $200,000+ income bracket, making it the least populous group.
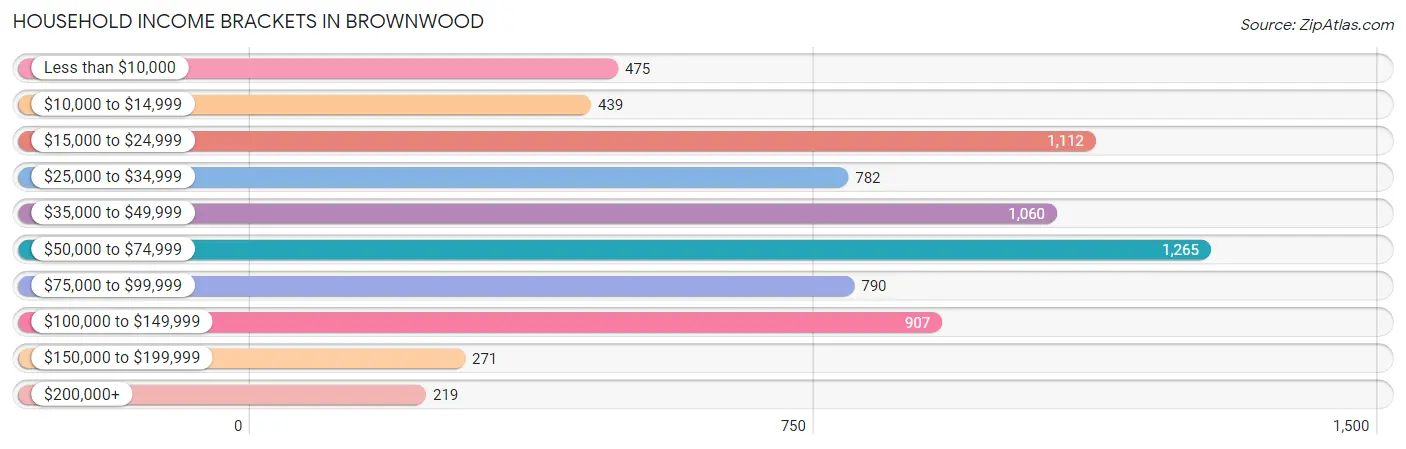
| Income Bracket | # Households | % Households |
| Less than $10,000 | 475 | 6.5% |
| $10,000 to $14,999 | 439 | 6.0% |
| $15,000 to $24,999 | 1,112 | 15.2% |
| $25,000 to $34,999 | 782 | 10.7% |
| $35,000 to $49,999 | 1,060 | 14.5% |
| $50,000 to $74,999 | 1,265 | 17.3% |
| $75,000 to $99,999 | 790 | 10.8% |
| $100,000 to $149,999 | 907 | 12.4% |
| $150,000 to $199,999 | 271 | 3.7% |
| $200,000+ | 219 | 3.0% |
Household Income by Householder Age in Brownwood
The median household income in Brownwood is $45,412, with the highest median household income of $52,212 found in the 25 to 44 years age bracket for the primary householder. A total of 2,381 households (32.6%) fall into this category. Meanwhile, the 65+ years age bracket for the primary householder has the lowest median household income of $31,382, with 1,754 households (24.0%) in this group.
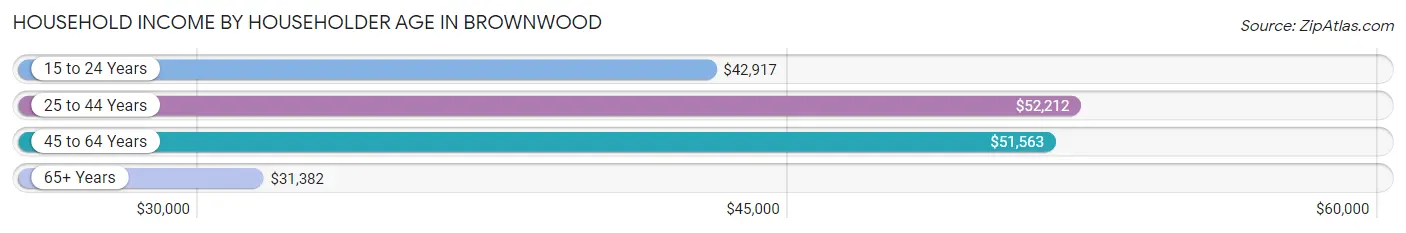
| Income Bracket | # Households | Median Income |
| 15 to 24 Years | 720 (9.9%) | $42,917 |
| 25 to 44 Years | 2,381 (32.6%) | $52,212 |
| 45 to 64 Years | 2,458 (33.6%) | $51,563 |
| 65+ Years | 1,754 (24.0%) | $31,382 |
| Total | 7,313 (100.0%) | $45,412 |
Poverty in Brownwood
Income Below Poverty by Sex and Age in Brownwood
With 14.3% poverty level for males and 20.9% for females among the residents of Brownwood, under 5 year old males and 5 year old females are the most vulnerable to poverty, with 205 males (35.7%) and 68 females (71.6%) in their respective age groups living below the poverty level.
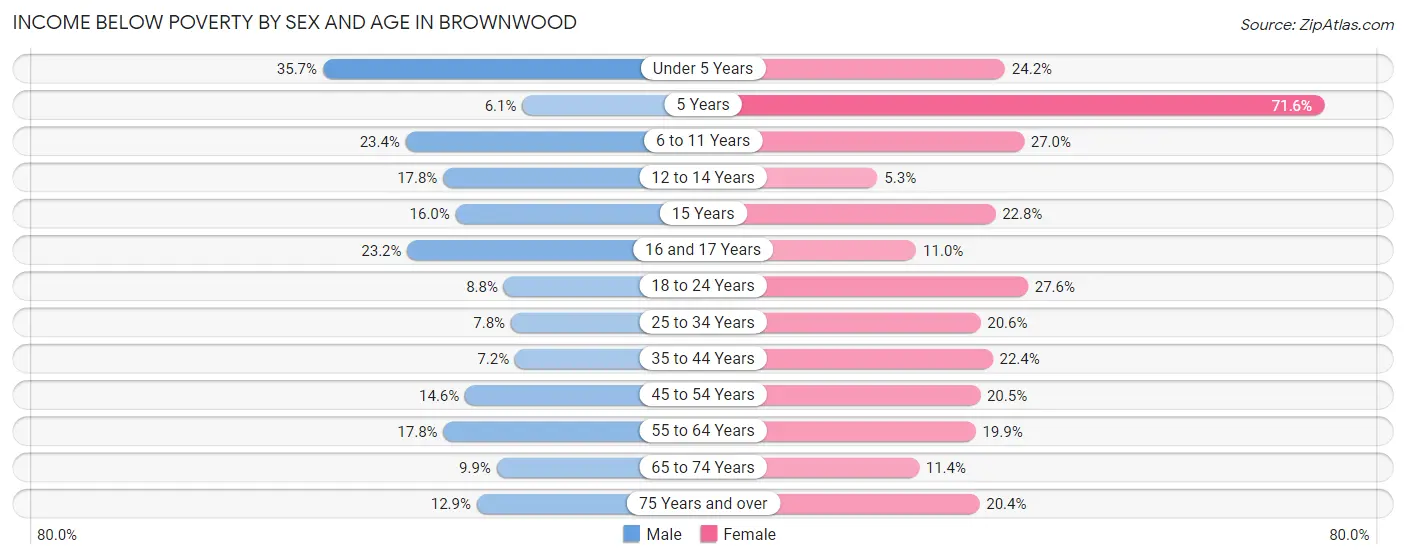
| Age Bracket | Male | Female |
| Under 5 Years | 205 (35.7%) | 116 (24.2%) |
| 5 Years | 5 (6.1%) | 68 (71.6%) |
| 6 to 11 Years | 158 (23.4%) | 137 (27.0%) |
| 12 to 14 Years | 89 (17.8%) | 18 (5.3%) |
| 15 Years | 20 (16.0%) | 41 (22.8%) |
| 16 and 17 Years | 44 (23.2%) | 35 (11.0%) |
| 18 to 24 Years | 92 (8.8%) | 250 (27.6%) |
| 25 to 34 Years | 99 (7.8%) | 283 (20.6%) |
| 35 to 44 Years | 73 (7.2%) | 252 (22.4%) |
| 45 to 54 Years | 150 (14.6%) | 197 (20.5%) |
| 55 to 64 Years | 185 (17.8%) | 241 (19.9%) |
| 65 to 74 Years | 77 (9.9%) | 83 (11.4%) |
| 75 Years and over | 50 (12.9%) | 147 (20.4%) |
| Total | 1,247 (14.3%) | 1,868 (20.9%) |
Income Above Poverty by Sex and Age in Brownwood
According to the poverty statistics in Brownwood, males aged 5 years and females aged 12 to 14 years are the age groups that are most secure financially, with 93.9% of males and 94.7% of females in these age groups living above the poverty line.
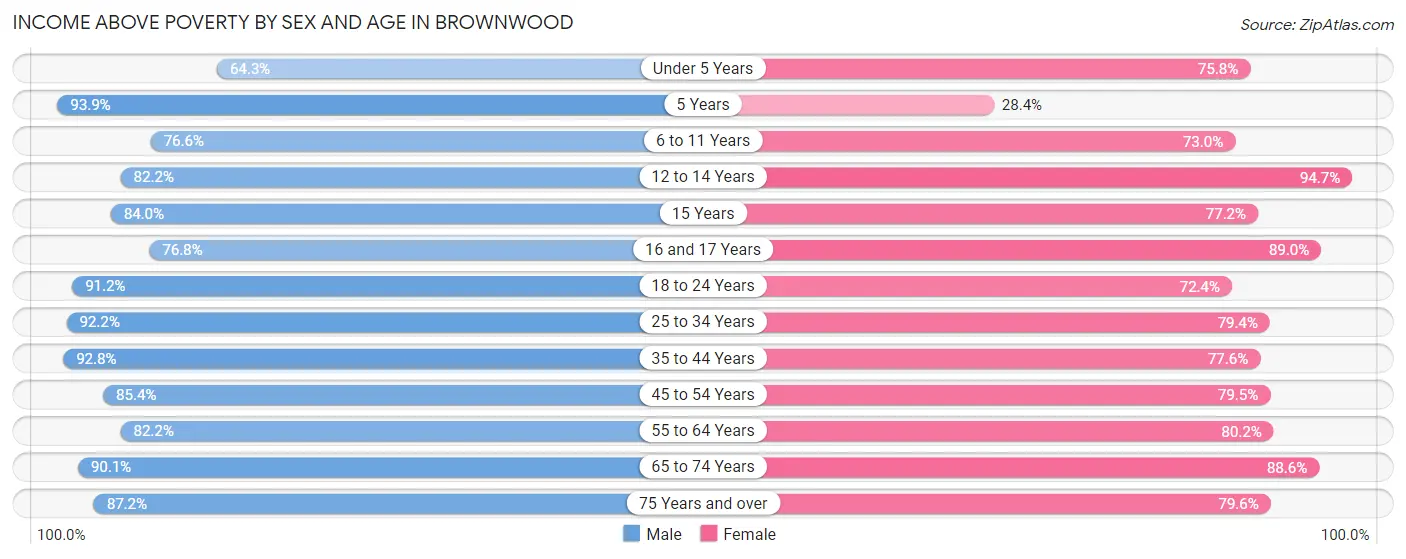
| Age Bracket | Male | Female |
| Under 5 Years | 369 (64.3%) | 363 (75.8%) |
| 5 Years | 77 (93.9%) | 27 (28.4%) |
| 6 to 11 Years | 517 (76.6%) | 370 (73.0%) |
| 12 to 14 Years | 410 (82.2%) | 322 (94.7%) |
| 15 Years | 105 (84.0%) | 139 (77.2%) |
| 16 and 17 Years | 146 (76.8%) | 282 (89.0%) |
| 18 to 24 Years | 949 (91.2%) | 655 (72.4%) |
| 25 to 34 Years | 1,173 (92.2%) | 1,093 (79.4%) |
| 35 to 44 Years | 945 (92.8%) | 874 (77.6%) |
| 45 to 54 Years | 878 (85.4%) | 763 (79.5%) |
| 55 to 64 Years | 854 (82.2%) | 973 (80.1%) |
| 65 to 74 Years | 701 (90.1%) | 643 (88.6%) |
| 75 Years and over | 339 (87.2%) | 573 (79.6%) |
| Total | 7,463 (85.7%) | 7,077 (79.1%) |
Income Below Poverty Among Married-Couple Families in Brownwood
The poverty statistics for married-couple families in Brownwood show that 8.2% or 238 of the total 2,901 families live below the poverty line. Families with no children have the highest poverty rate of 10.4%, comprising of 177 families. On the other hand, families with 5 or more children have the lowest poverty rate of 0.0%, which includes 0 families.
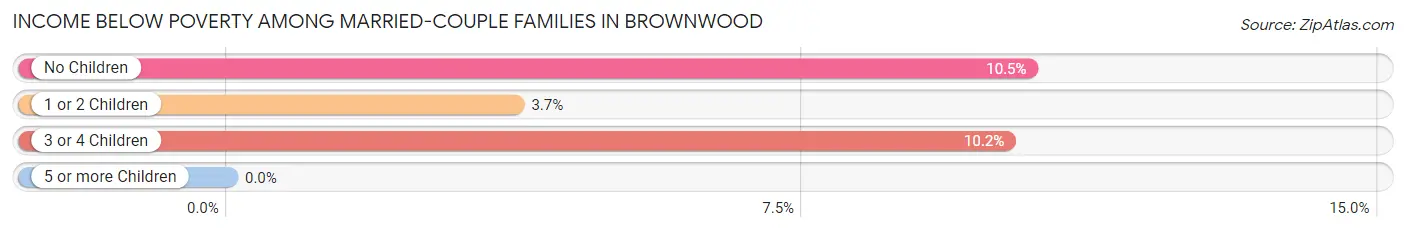
| Children | Above Poverty | Below Poverty |
| No Children | 1,516 (89.5%) | 177 (10.4%) |
| 1 or 2 Children | 902 (96.3%) | 35 (3.7%) |
| 3 or 4 Children | 230 (89.8%) | 26 (10.2%) |
| 5 or more Children | 15 (100.0%) | 0 (0.0%) |
| Total | 2,663 (91.8%) | 238 (8.2%) |
Income Below Poverty Among Single-Parent Households in Brownwood
According to the poverty data in Brownwood, 11.9% or 26 single-father households and 30.2% or 403 single-mother households are living below the poverty line. Among single-father households, those with no children have the highest poverty rate, with 16 households (19.1%) experiencing poverty. Likewise, among single-mother households, those with 3 or 4 children have the highest poverty rate, with 217 households (66.8%) falling below the poverty line.
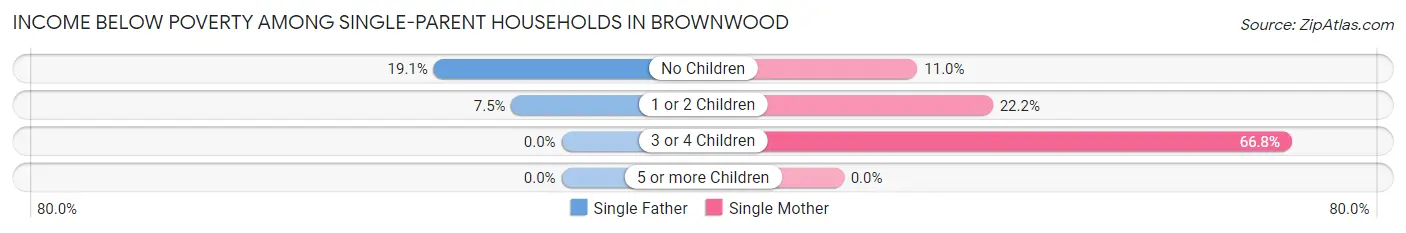
| Children | Single Father | Single Mother |
| No Children | 16 (19.1%) | 37 (11.0%) |
| 1 or 2 Children | 10 (7.5%) | 149 (22.2%) |
| 3 or 4 Children | 0 (0.0%) | 217 (66.8%) |
| 5 or more Children | 0 (0.0%) | 0 (0.0%) |
| Total | 26 (11.9%) | 403 (30.2%) |
Income Below Poverty Among Married-Couple vs Single-Parent Households in Brownwood
The poverty data for Brownwood shows that 238 of the married-couple family households (8.2%) and 429 of the single-parent households (27.7%) are living below the poverty level. Within the married-couple family households, those with no children have the highest poverty rate, with 177 households (10.4%) falling below the poverty line. Among the single-parent households, those with 3 or 4 children have the highest poverty rate, with 217 household (66.8%) living below poverty.
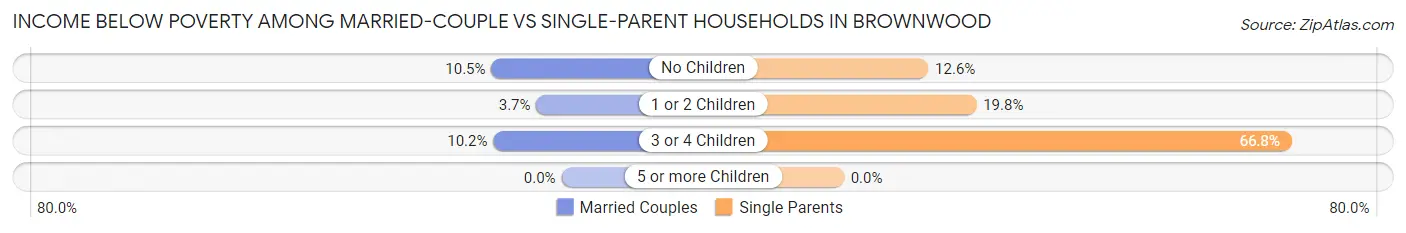
| Children | Married-Couple Families | Single-Parent Households |
| No Children | 177 (10.4%) | 53 (12.6%) |
| 1 or 2 Children | 35 (3.7%) | 159 (19.8%) |
| 3 or 4 Children | 26 (10.2%) | 217 (66.8%) |
| 5 or more Children | 0 (0.0%) | 0 (0.0%) |
| Total | 238 (8.2%) | 429 (27.7%) |
Race in Brownwood
The most populous races in Brownwood are White / Caucasian (14,025 | 74.5%), Hispanic or Latino (5,960 | 31.7%), and Two or more Races (3,063 | 16.3%).
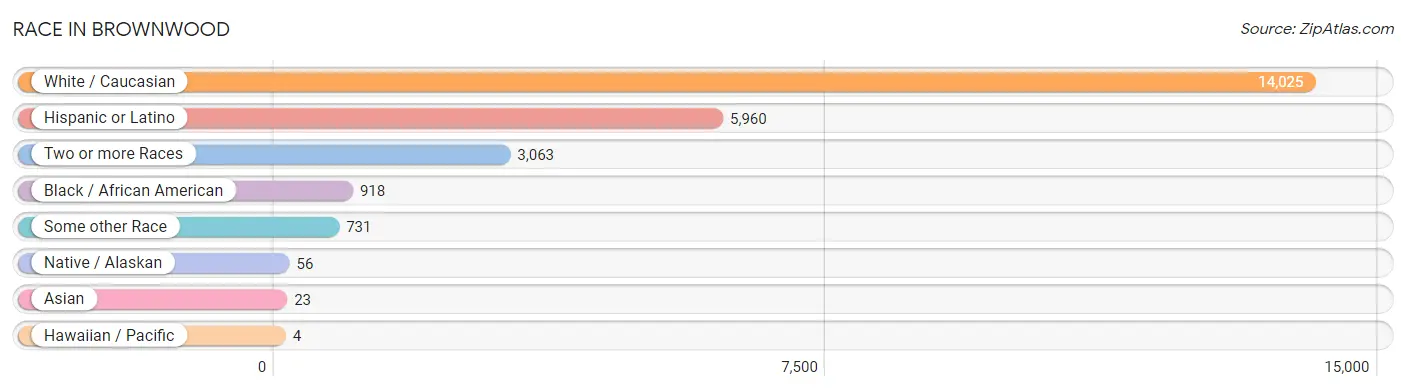
| Race | # Population | % Population |
| Asian | 23 | 0.1% |
| Black / African American | 918 | 4.9% |
| Hawaiian / Pacific | 4 | 0.0% |
| Hispanic or Latino | 5,960 | 31.7% |
| Native / Alaskan | 56 | 0.3% |
| White / Caucasian | 14,025 | 74.5% |
| Two or more Races | 3,063 | 16.3% |
| Some other Race | 731 | 3.9% |
| Total | 18,820 | 100.0% |
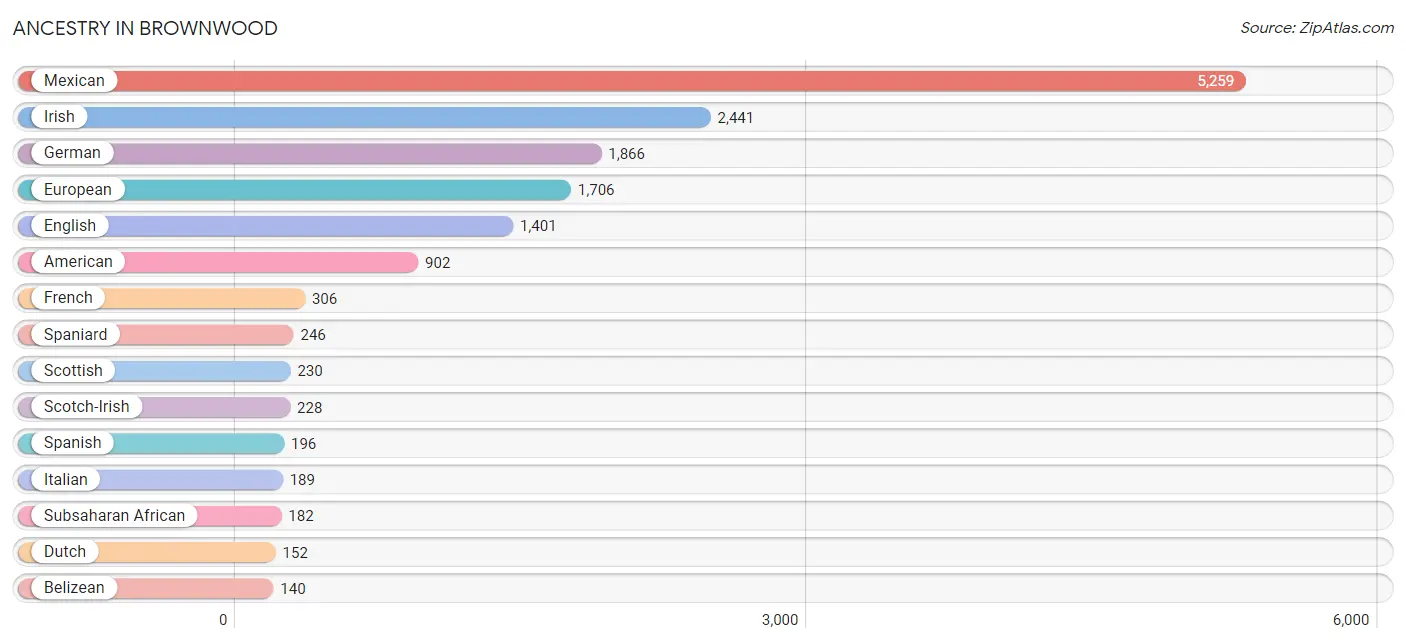
Ancestry in Brownwood
The most populous ancestries reported in Brownwood are Mexican (5,259 | 27.9%), Irish (2,441 | 13.0%), German (1,866 | 9.9%), European (1,706 | 9.1%), and English (1,401 | 7.4%), together accounting for 67.3% of all Brownwood residents.
| Ancestry | # Population | % Population |
| African | 46 | 0.2% |
| American | 902 | 4.8% |
| Apache | 7 | 0.0% |
| Australian | 18 | 0.1% |
| Belgian | 22 | 0.1% |
| Belizean | 140 | 0.7% |
| Blackfeet | 1 | 0.0% |
| British | 15 | 0.1% |
| Canadian | 5 | 0.0% |
| Central American | 4 | 0.0% |
| Cherokee | 35 | 0.2% |
| Chickasaw | 26 | 0.1% |
| Colombian | 56 | 0.3% |
| Creek | 4 | 0.0% |
| Czech | 37 | 0.2% |
| Danish | 9 | 0.1% |
| Dominican | 12 | 0.1% |
| Dutch | 152 | 0.8% |
| English | 1,401 | 7.4% |
| European | 1,706 | 9.1% |
| French | 306 | 1.6% |
| French Canadian | 29 | 0.2% |
| German | 1,866 | 9.9% |
| Greek | 54 | 0.3% |
| Guamanian / Chamorro | 4 | 0.0% |
| Guatemalan | 4 | 0.0% |
| Icelander | 7 | 0.0% |
| Indian (Asian) | 77 | 0.4% |
| Irish | 2,441 | 13.0% |
| Italian | 189 | 1.0% |
| Korean | 28 | 0.2% |
| Mexican | 5,259 | 27.9% |
| Nigerian | 114 | 0.6% |
| Northern European | 30 | 0.2% |
| Norwegian | 124 | 0.7% |
| Polish | 84 | 0.4% |
| Puerto Rican | 92 | 0.5% |
| Russian | 14 | 0.1% |
| Scandinavian | 5 | 0.0% |
| Scotch-Irish | 228 | 1.2% |
| Scottish | 230 | 1.2% |
| South American | 56 | 0.3% |
| Spaniard | 246 | 1.3% |
| Spanish | 196 | 1.0% |
| Subsaharan African | 182 | 1.0% |
| Sudanese | 19 | 0.1% |
| Swedish | 117 | 0.6% |
| Swiss | 15 | 0.1% |
| Thai | 6 | 0.0% |
| Welsh | 90 | 0.5% |
| West Indian | 24 | 0.1% | View All 51 Rows |
Immigrants in Brownwood
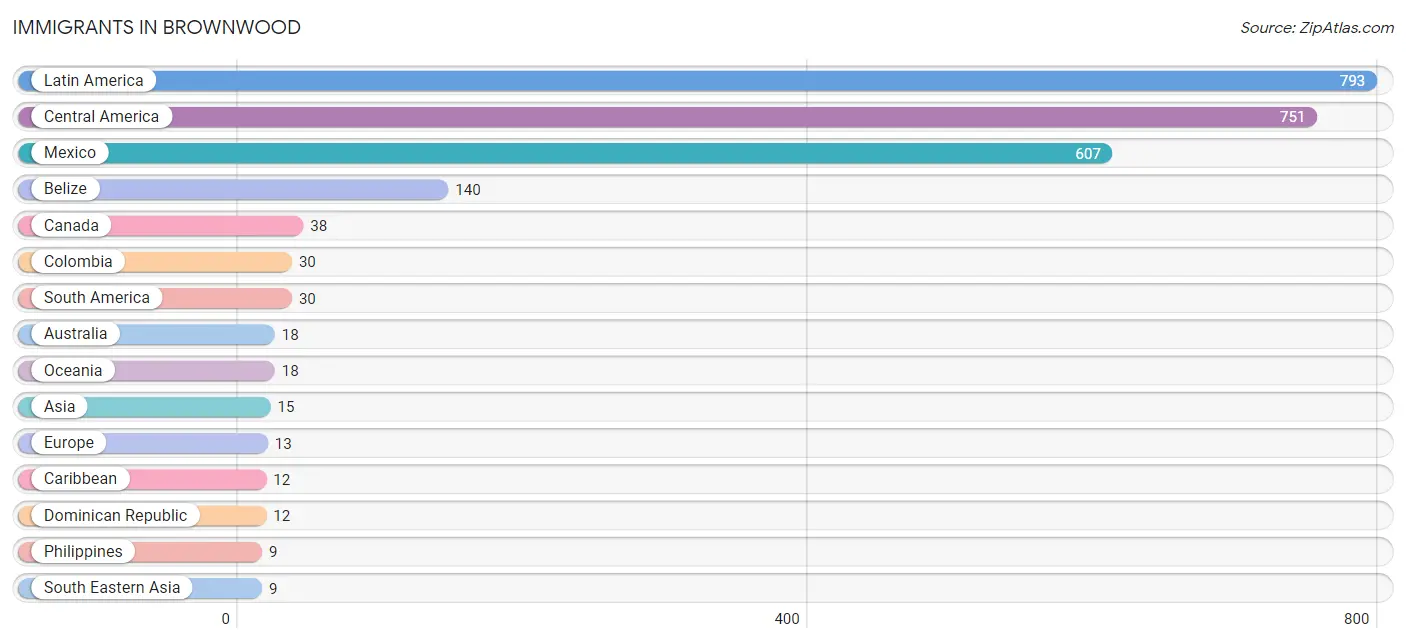
The most numerous immigrant groups reported in Brownwood came from Latin America (793 | 4.2%), Central America (751 | 4.0%), Mexico (607 | 3.2%), Belize (140 | 0.7%), and Canada (38 | 0.2%), together accounting for 12.4% of all Brownwood residents.
| Immigration Origin | # Population | % Population |
| Africa | 3 | 0.0% |
| Asia | 15 | 0.1% |
| Australia | 18 | 0.1% |
| Belize | 140 | 0.7% |
| Canada | 38 | 0.2% |
| Caribbean | 12 | 0.1% |
| Central America | 751 | 4.0% |
| China | 6 | 0.0% |
| Colombia | 30 | 0.2% |
| Dominican Republic | 12 | 0.1% |
| Eastern Asia | 6 | 0.0% |
| England | 7 | 0.0% |
| Europe | 13 | 0.1% |
| Germany | 6 | 0.0% |
| Guatemala | 4 | 0.0% |
| Latin America | 793 | 4.2% |
| Mexico | 607 | 3.2% |
| Middle Africa | 3 | 0.0% |
| Northern Europe | 7 | 0.0% |
| Oceania | 18 | 0.1% |
| Philippines | 9 | 0.1% |
| South America | 30 | 0.2% |
| South Eastern Asia | 9 | 0.1% |
| Western Europe | 6 | 0.0% |
| Zaire | 3 | 0.0% | View All 25 Rows |
Sex and Age in Brownwood
Sex and Age in Brownwood
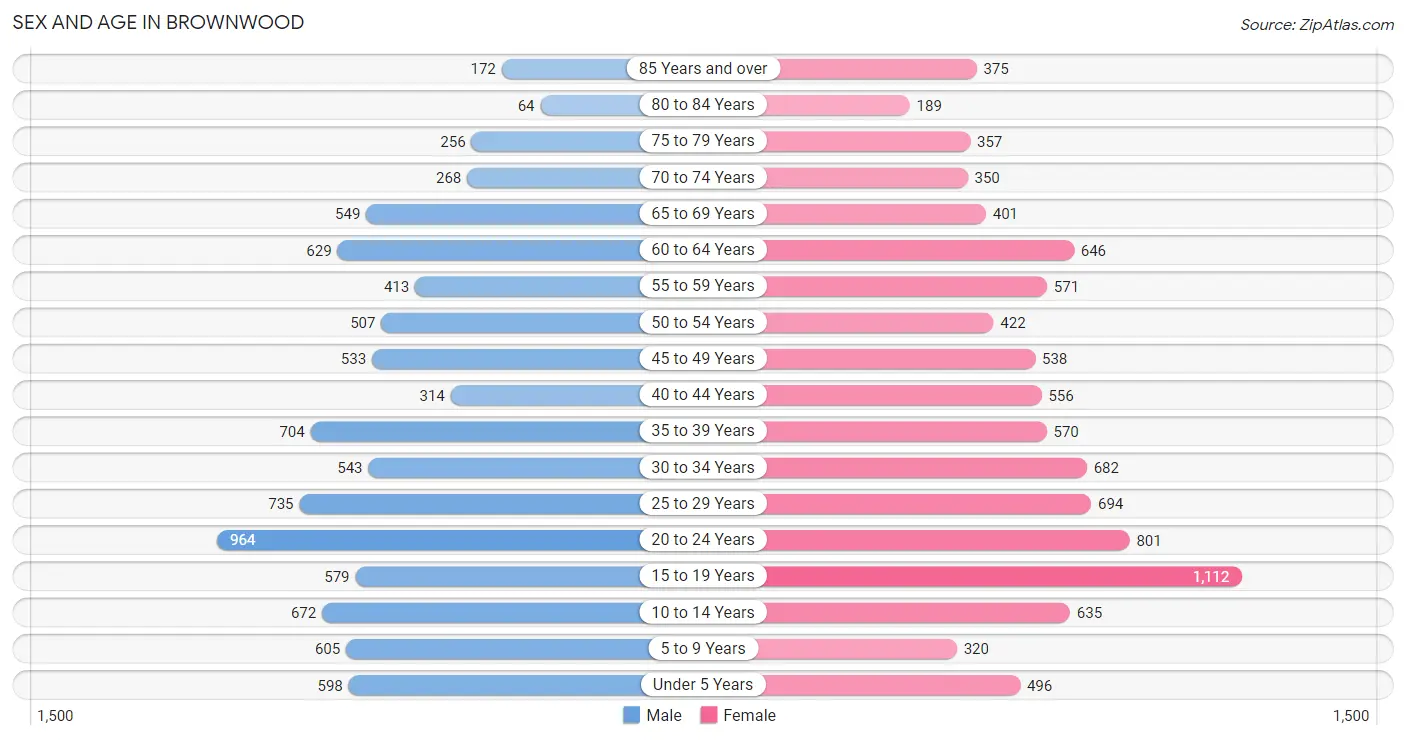
The most populous age groups in Brownwood are 20 to 24 Years (964 | 10.6%) for men and 15 to 19 Years (1,112 | 11.5%) for women.
| Age Bracket | Male | Female |
| Under 5 Years | 598 (6.6%) | 496 (5.1%) |
| 5 to 9 Years | 605 (6.6%) | 320 (3.3%) |
| 10 to 14 Years | 672 (7.4%) | 635 (6.5%) |
| 15 to 19 Years | 579 (6.4%) | 1,112 (11.5%) |
| 20 to 24 Years | 964 (10.6%) | 801 (8.2%) |
| 25 to 29 Years | 735 (8.1%) | 694 (7.1%) |
| 30 to 34 Years | 543 (6.0%) | 682 (7.0%) |
| 35 to 39 Years | 704 (7.7%) | 570 (5.9%) |
| 40 to 44 Years | 314 (3.5%) | 556 (5.7%) |
| 45 to 49 Years | 533 (5.9%) | 538 (5.5%) |
| 50 to 54 Years | 507 (5.6%) | 422 (4.3%) |
| 55 to 59 Years | 413 (4.5%) | 571 (5.9%) |
| 60 to 64 Years | 629 (6.9%) | 646 (6.7%) |
| 65 to 69 Years | 549 (6.0%) | 401 (4.1%) |
| 70 to 74 Years | 268 (2.9%) | 350 (3.6%) |
| 75 to 79 Years | 256 (2.8%) | 357 (3.7%) |
| 80 to 84 Years | 64 (0.7%) | 189 (1.9%) |
| 85 Years and over | 172 (1.9%) | 375 (3.9%) |
| Total | 9,105 (100.0%) | 9,715 (100.0%) |
Families and Households in Brownwood
Median Family Size in Brownwood
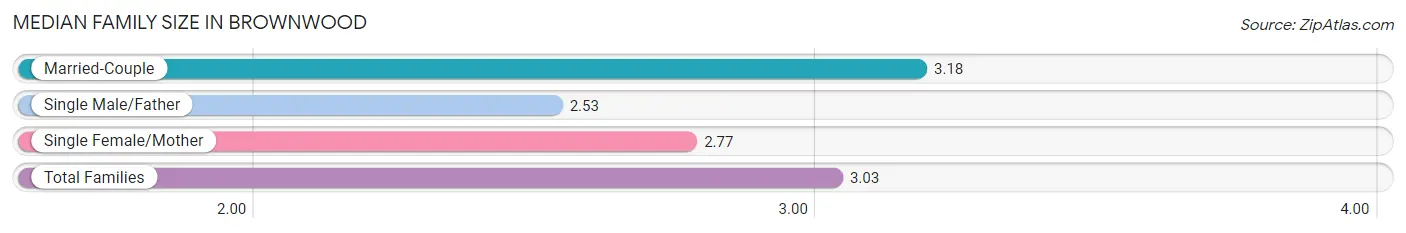
The median family size in Brownwood is 3.03 persons per family, with married-couple families (2,901 | 65.2%) accounting for the largest median family size of 3.18 persons per family. On the other hand, single male/father families (218 | 4.9%) represent the smallest median family size with 2.53 persons per family.
| Family Type | # Families | Family Size |
| Married-Couple | 2,901 (65.2%) | 3.18 |
| Single Male/Father | 218 (4.9%) | 2.53 |
| Single Female/Mother | 1,333 (29.9%) | 2.77 |
| Total Families | 4,452 (100.0%) | 3.03 |
Median Household Size in Brownwood
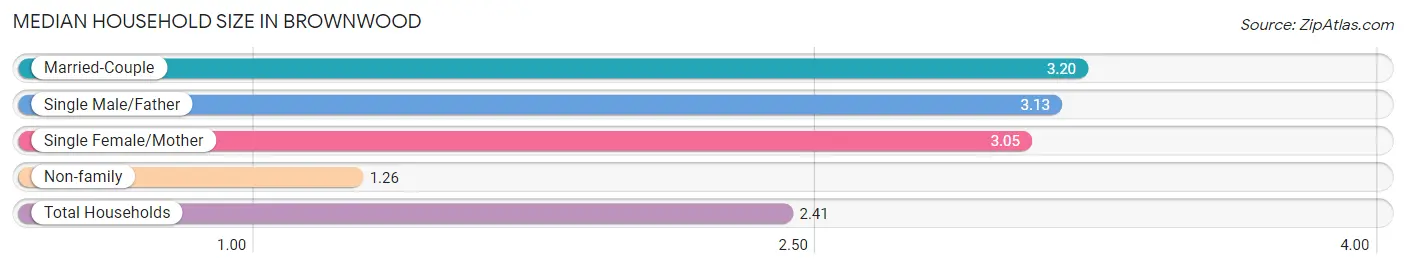
The median household size in Brownwood is 2.41 persons per household, with married-couple households (2,901 | 39.7%) accounting for the largest median household size of 3.2 persons per household. non-family households (2,861 | 39.1%) represent the smallest median household size with 1.26 persons per household.
| Household Type | # Households | Household Size |
| Married-Couple | 2,901 (39.7%) | 3.20 |
| Single Male/Father | 218 (3.0%) | 3.13 |
| Single Female/Mother | 1,333 (18.2%) | 3.05 |
| Non-family | 2,861 (39.1%) | 1.26 |
| Total Households | 7,313 (100.0%) | 2.41 |
Household Size by Marriage Status in Brownwood
Out of a total of 7,313 households in Brownwood, 4,452 (60.9%) are family households, while 2,861 (39.1%) are nonfamily households. The most numerous type of family households are 2-person households, comprising 2,023, and the most common type of nonfamily households are 1-person households, comprising 2,348.
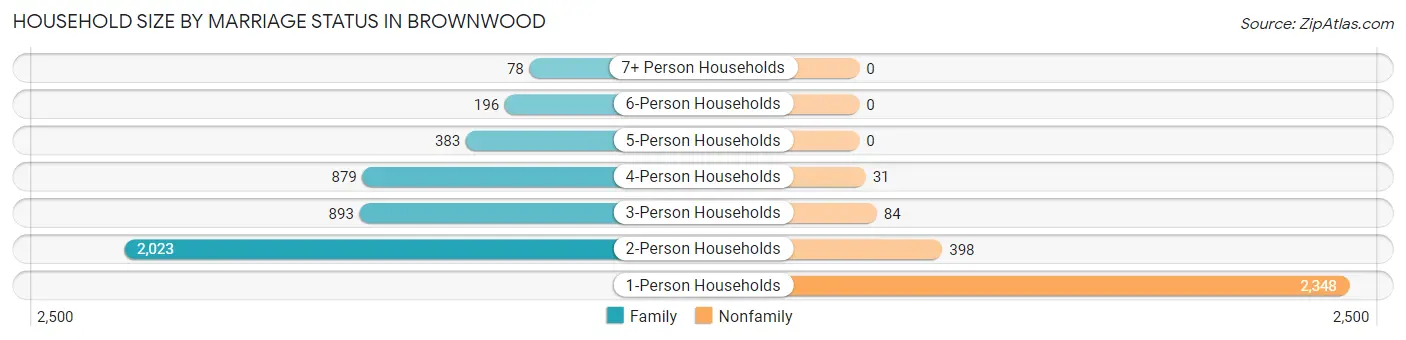
| Household Size | Family Households | Nonfamily Households |
| 1-Person Households | - | 2,348 (32.1%) |
| 2-Person Households | 2,023 (27.7%) | 398 (5.4%) |
| 3-Person Households | 893 (12.2%) | 84 (1.1%) |
| 4-Person Households | 879 (12.0%) | 31 (0.4%) |
| 5-Person Households | 383 (5.2%) | 0 (0.0%) |
| 6-Person Households | 196 (2.7%) | 0 (0.0%) |
| 7+ Person Households | 78 (1.1%) | 0 (0.0%) |
| Total | 4,452 (60.9%) | 2,861 (39.1%) |
Female Fertility in Brownwood
Fertility by Age in Brownwood
Average fertility rate in Brownwood is 23.0 births per 1,000 women. Women in the age bracket of 20 to 34 years have the highest fertility rate with 45.0 births per 1,000 women. Women in the age bracket of 20 to 34 years acount for 86.0% of all women with births.
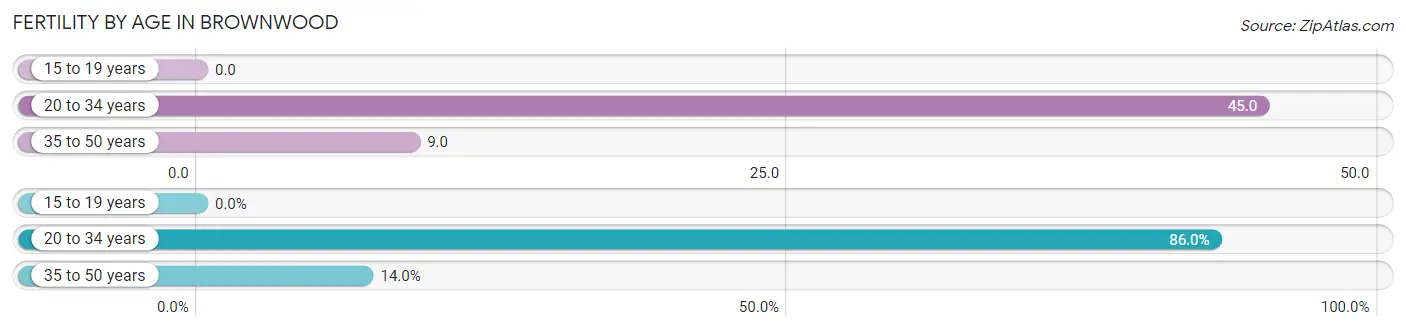
| Age Bracket | Women with Births | Births / 1,000 Women |
| 15 to 19 years | 0 (0.0%) | 0.0 |
| 20 to 34 years | 98 (86.0%) | 45.0 |
| 35 to 50 years | 16 (14.0%) | 9.0 |
| Total | 114 (100.0%) | 23.0 |
Fertility by Age by Marriage Status in Brownwood
57.9% of women with births (114) in Brownwood are married. The highest percentage of unmarried women with births falls into 20 to 34 years age bracket with 49.0% of them unmarried at the time of birth, while the lowest percentage of unmarried women with births belong to 35 to 50 years age bracket with 0.0% of them unmarried.
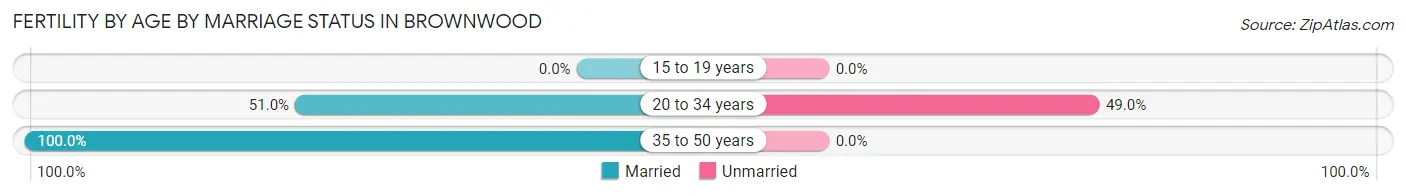
| Age Bracket | Married | Unmarried |
| 15 to 19 years | 0 (0.0%) | 0 (0.0%) |
| 20 to 34 years | 50 (51.0%) | 48 (49.0%) |
| 35 to 50 years | 16 (100.0%) | 0 (0.0%) |
| Total | 66 (57.9%) | 48 (42.1%) |
Fertility by Education in Brownwood
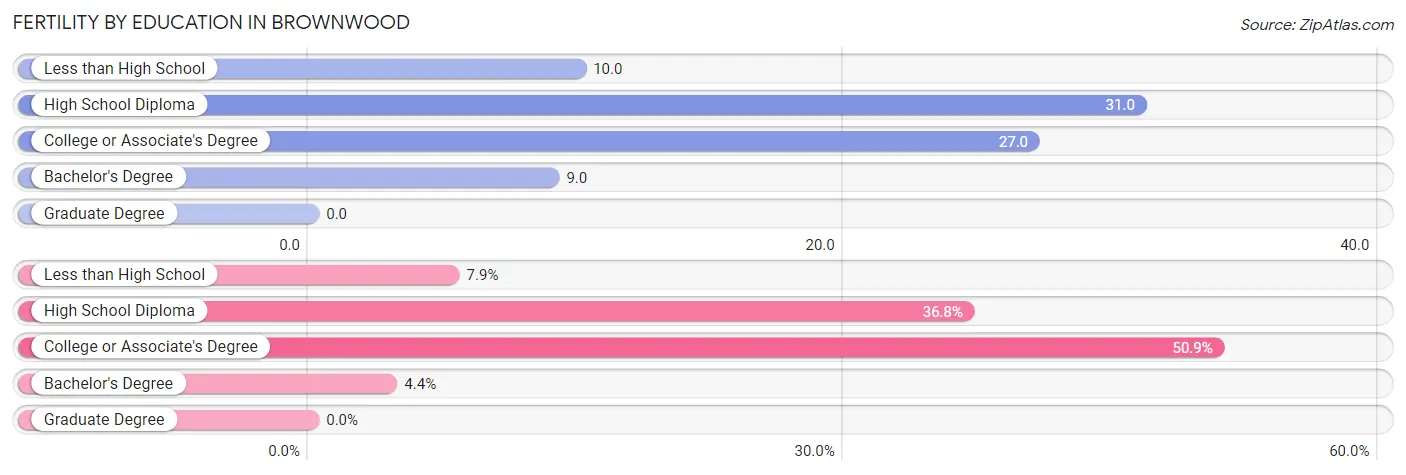
| Educational Attainment | Women with Births | Births / 1,000 Women |
| Less than High School | 9 (7.9%) | 10.0 |
| High School Diploma | 42 (36.8%) | 31.0 |
| College or Associate's Degree | 58 (50.9%) | 27.0 |
| Bachelor's Degree | 5 (4.4%) | 9.0 |
| Graduate Degree | 0 (0.0%) | 0.0 |
| Total | 114 (100.0%) | 23.0 |
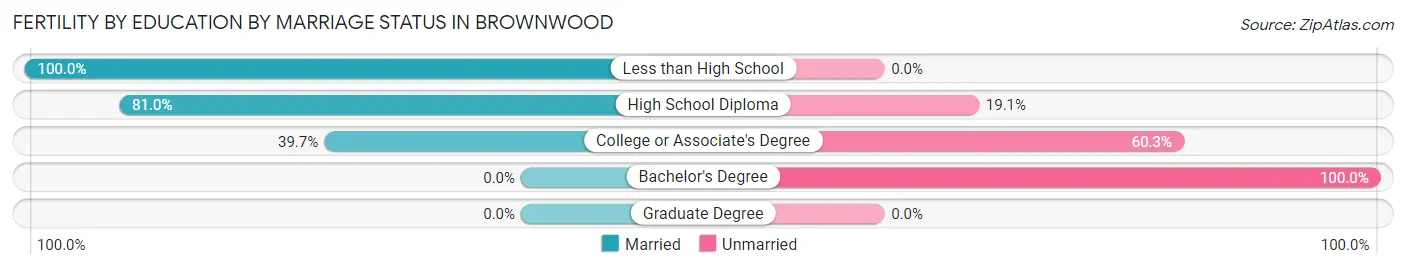
Fertility by Education by Marriage Status in Brownwood
42.1% of women with births in Brownwood are unmarried. Women with the educational attainment of less than high school are most likely to be married with 100.0% of them married at childbirth, while women with the educational attainment of bachelor's degree are least likely to be married with 100.0% of them unmarried at childbirth.
| Educational Attainment | Married | Unmarried |
| Less than High School | 9 (100.0%) | 0 (0.0%) |
| High School Diploma | 34 (80.9%) | 8 (19.1%) |
| College or Associate's Degree | 23 (39.7%) | 35 (60.3%) |
| Bachelor's Degree | 0 (0.0%) | 5 (100.0%) |
| Graduate Degree | 0 (0.0%) | 0 (0.0%) |
| Total | 66 (57.9%) | 48 (42.1%) |
Employment Characteristics in Brownwood
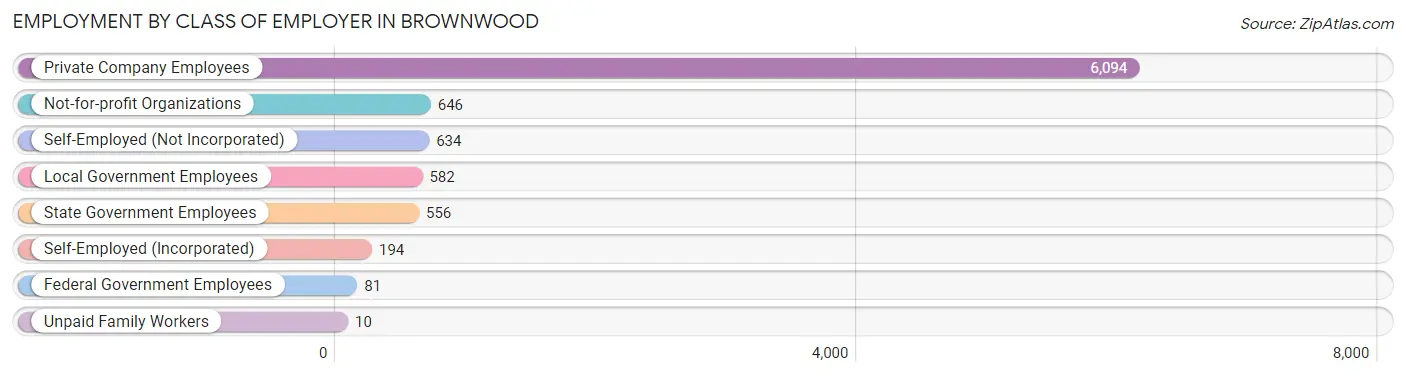
Employment by Class of Employer in Brownwood
Among the 8,797 employed individuals in Brownwood, private company employees (6,094 | 69.3%), not-for-profit organizations (646 | 7.3%), and self-employed (not incorporated) (634 | 7.2%) make up the most common classes of employment.
| Employer Class | # Employees | % Employees |
| Private Company Employees | 6,094 | 69.3% |
| Self-Employed (Incorporated) | 194 | 2.2% |
| Self-Employed (Not Incorporated) | 634 | 7.2% |
| Not-for-profit Organizations | 646 | 7.3% |
| Local Government Employees | 582 | 6.6% |
| State Government Employees | 556 | 6.3% |
| Federal Government Employees | 81 | 0.9% |
| Unpaid Family Workers | 10 | 0.1% |
| Total | 8,797 | 100.0% |
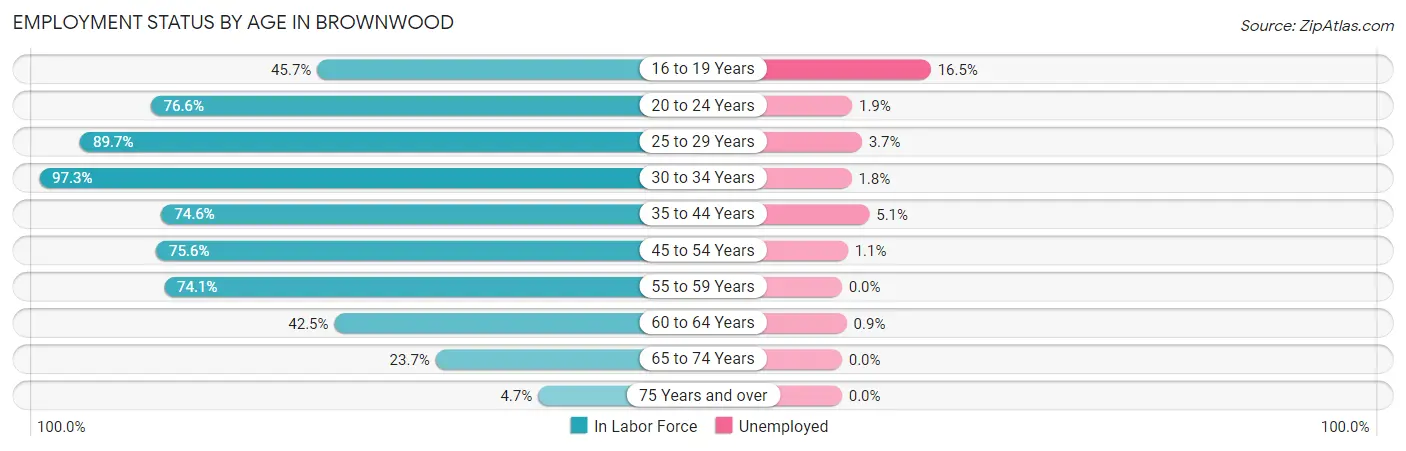
Employment Status by Age in Brownwood
According to the labor force statistics for Brownwood, out of the total population over 16 years of age (15,156), 61.1% or 9,260 individuals are in the labor force, with 3.2% or 296 of them unemployed. The age group with the highest labor force participation rate is 30 to 34 years, with 97.3% or 1,192 individuals in the labor force. Within the labor force, the 16 to 19 years age range has the highest percentage of unemployed individuals, with 16.5% or 102 of them being unemployed.
| Age Bracket | In Labor Force | Unemployed |
| 16 to 19 Years | 618 (45.7%) | 102 (16.5%) |
| 20 to 24 Years | 1,352 (76.6%) | 26 (1.9%) |
| 25 to 29 Years | 1,282 (89.7%) | 47 (3.7%) |
| 30 to 34 Years | 1,192 (97.3%) | 21 (1.8%) |
| 35 to 44 Years | 1,599 (74.6%) | 82 (5.1%) |
| 45 to 54 Years | 1,512 (75.6%) | 17 (1.1%) |
| 55 to 59 Years | 729 (74.1%) | 0 (0.0%) |
| 60 to 64 Years | 542 (42.5%) | 5 (0.9%) |
| 65 to 74 Years | 372 (23.7%) | 0 (0.0%) |
| 75 Years and over | 66 (4.7%) | 0 (0.0%) |
| Total | 9,260 (61.1%) | 296 (3.2%) |
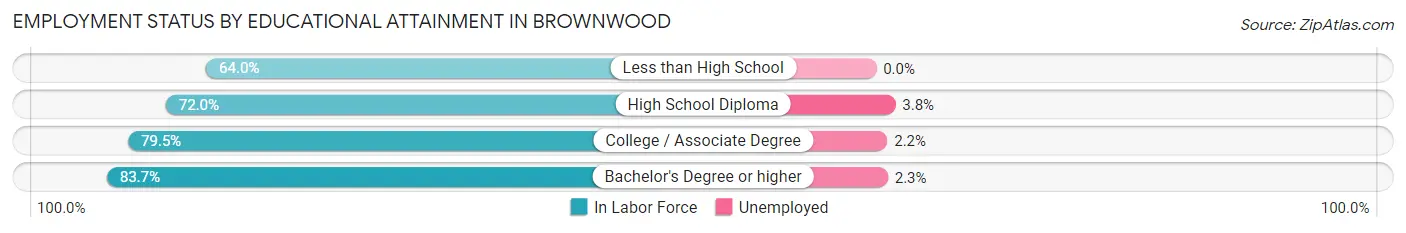
Employment Status by Educational Attainment in Brownwood
According to labor force statistics for Brownwood, 75.7% of individuals (6,856) out of the total population between 25 and 64 years of age (9,057) are in the labor force, with 2.5% or 171 of them being unemployed. The group with the highest labor force participation rate are those with the educational attainment of bachelor's degree or higher, with 83.7% or 1,270 individuals in the labor force. Within the labor force, individuals with high school diploma education have the highest percentage of unemployment, with 3.8% or 81 of them being unemployed.
| Educational Attainment | In Labor Force | Unemployed |
| Less than High School | 772 (64.0%) | 0 (0.0%) |
| High School Diploma | 2,120 (72.0%) | 112 (3.8%) |
| College / Associate Degree | 2,693 (79.5%) | 75 (2.2%) |
| Bachelor's Degree or higher | 1,270 (83.7%) | 35 (2.3%) |
| Total | 6,856 (75.7%) | 226 (2.5%) |
Employment Occupations by Sex in Brownwood
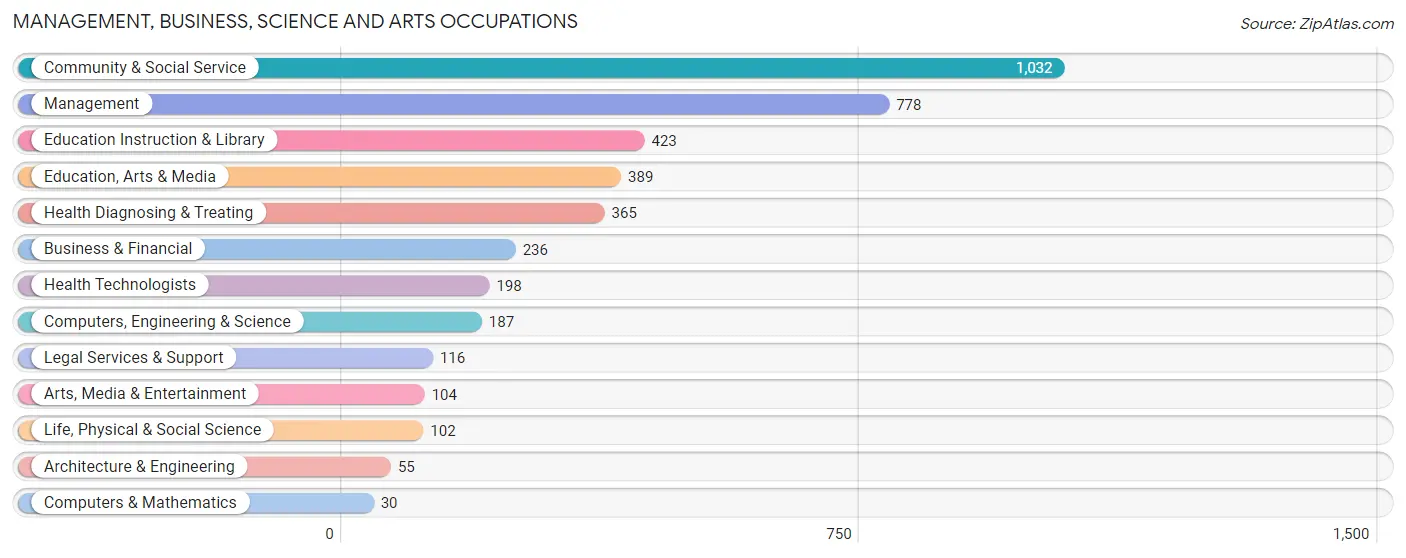
Management, Business, Science and Arts Occupations
The most common Management, Business, Science and Arts occupations in Brownwood are Community & Social Service (1,032 | 11.6%), Management (778 | 8.7%), Education Instruction & Library (423 | 4.7%), Education, Arts & Media (389 | 4.3%), and Health Diagnosing & Treating (365 | 4.1%).
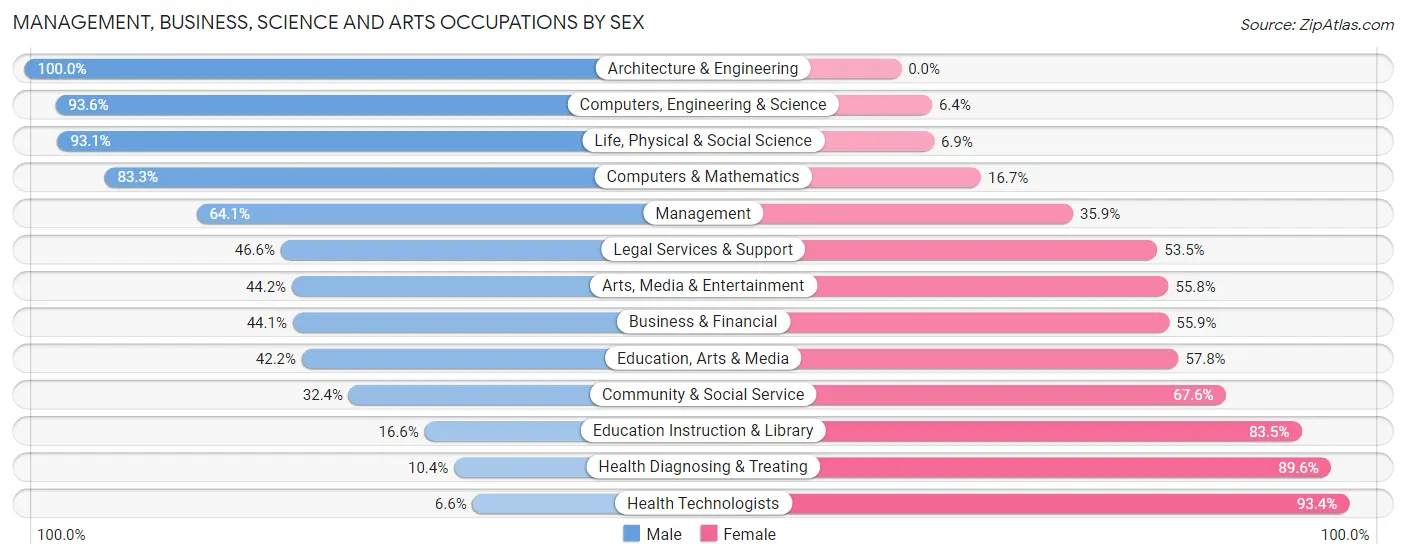
Management, Business, Science and Arts Occupations by Sex
Within the Management, Business, Science and Arts occupations in Brownwood, the most male-oriented occupations are Architecture & Engineering (100.0%), Computers, Engineering & Science (93.6%), and Life, Physical & Social Science (93.1%), while the most female-oriented occupations are Health Technologists (93.4%), Health Diagnosing & Treating (89.6%), and Education Instruction & Library (83.5%).
| Occupation | Male | Female |
| Management | 499 (64.1%) | 279 (35.9%) |
| Business & Financial | 104 (44.1%) | 132 (55.9%) |
| Computers, Engineering & Science | 175 (93.6%) | 12 (6.4%) |
| Computers & Mathematics | 25 (83.3%) | 5 (16.7%) |
| Architecture & Engineering | 55 (100.0%) | 0 (0.0%) |
| Life, Physical & Social Science | 95 (93.1%) | 7 (6.9%) |
| Community & Social Service | 334 (32.4%) | 698 (67.6%) |
| Education, Arts & Media | 164 (42.2%) | 225 (57.8%) |
| Legal Services & Support | 54 (46.6%) | 62 (53.4%) |
| Education Instruction & Library | 70 (16.6%) | 353 (83.5%) |
| Arts, Media & Entertainment | 46 (44.2%) | 58 (55.8%) |
| Health Diagnosing & Treating | 38 (10.4%) | 327 (89.6%) |
| Health Technologists | 13 (6.6%) | 185 (93.4%) |
| Total (Category) | 1,150 (44.3%) | 1,448 (55.7%) |
| Total (Overall) | 4,652 (52.1%) | 4,282 (47.9%) |
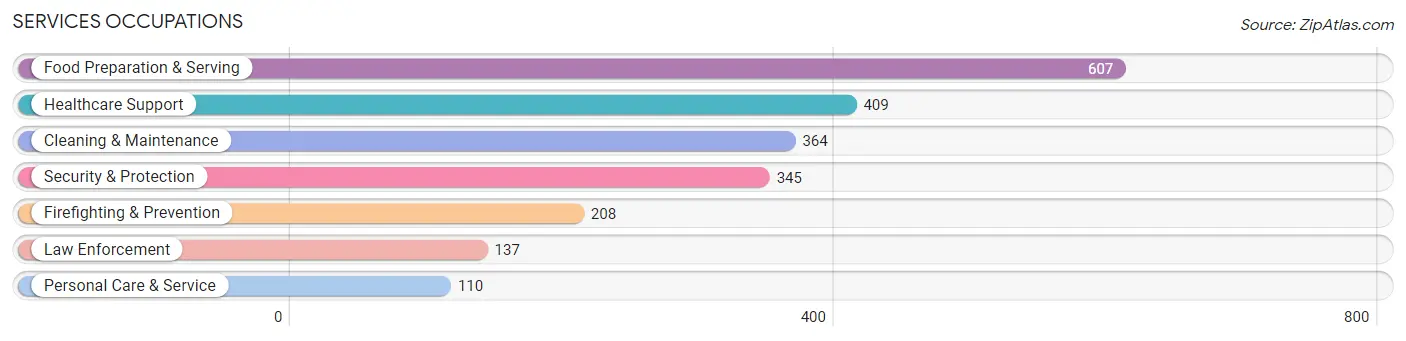
Services Occupations
The most common Services occupations in Brownwood are Food Preparation & Serving (607 | 6.8%), Healthcare Support (409 | 4.6%), Cleaning & Maintenance (364 | 4.1%), Security & Protection (345 | 3.9%), and Firefighting & Prevention (208 | 2.3%).
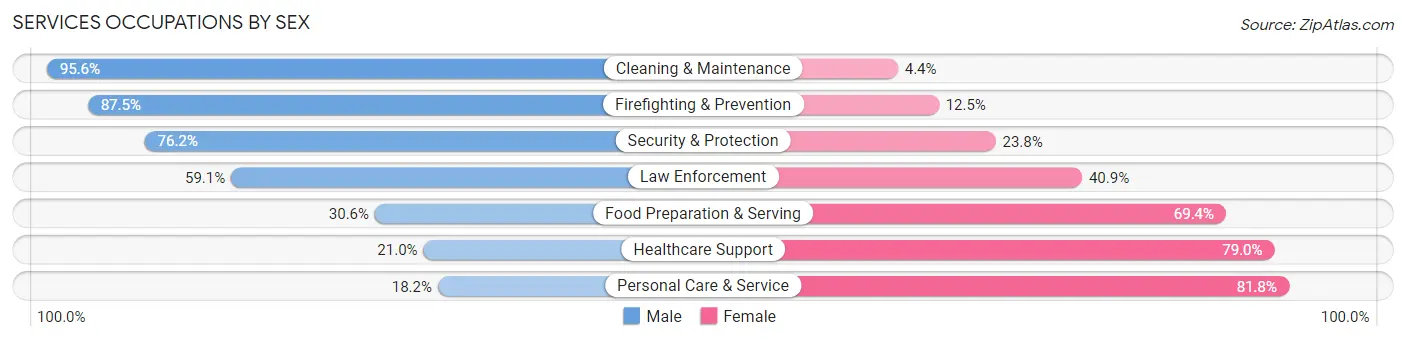
Services Occupations by Sex
Within the Services occupations in Brownwood, the most male-oriented occupations are Cleaning & Maintenance (95.6%), Firefighting & Prevention (87.5%), and Security & Protection (76.2%), while the most female-oriented occupations are Personal Care & Service (81.8%), Healthcare Support (79.0%), and Food Preparation & Serving (69.4%).
| Occupation | Male | Female |
| Healthcare Support | 86 (21.0%) | 323 (79.0%) |
| Security & Protection | 263 (76.2%) | 82 (23.8%) |
| Firefighting & Prevention | 182 (87.5%) | 26 (12.5%) |
| Law Enforcement | 81 (59.1%) | 56 (40.9%) |
| Food Preparation & Serving | 186 (30.6%) | 421 (69.4%) |
| Cleaning & Maintenance | 348 (95.6%) | 16 (4.4%) |
| Personal Care & Service | 20 (18.2%) | 90 (81.8%) |
| Total (Category) | 903 (49.2%) | 932 (50.8%) |
| Total (Overall) | 4,652 (52.1%) | 4,282 (47.9%) |
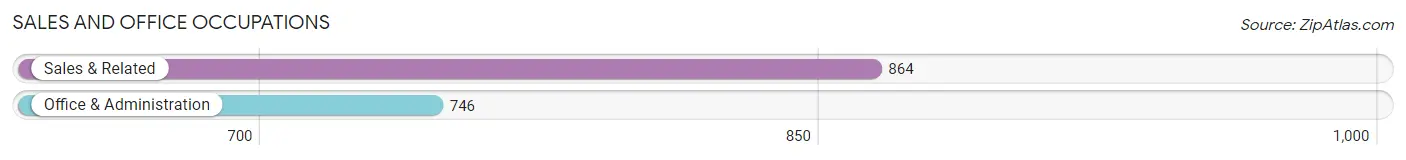
Sales and Office Occupations
The most common Sales and Office occupations in Brownwood are Sales & Related (864 | 9.7%), and Office & Administration (746 | 8.4%).
Sales and Office Occupations by Sex
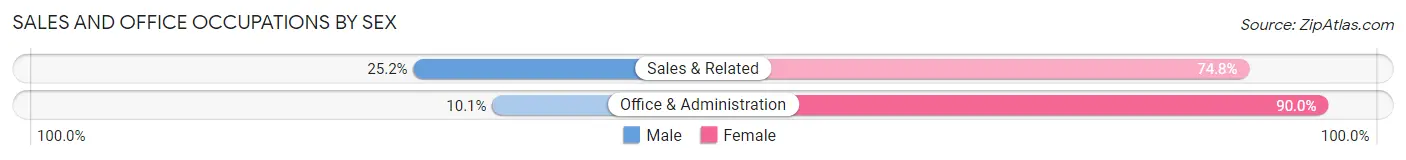
| Occupation | Male | Female |
| Sales & Related | 218 (25.2%) | 646 (74.8%) |
| Office & Administration | 75 (10.1%) | 671 (89.9%) |
| Total (Category) | 293 (18.2%) | 1,317 (81.8%) |
| Total (Overall) | 4,652 (52.1%) | 4,282 (47.9%) |
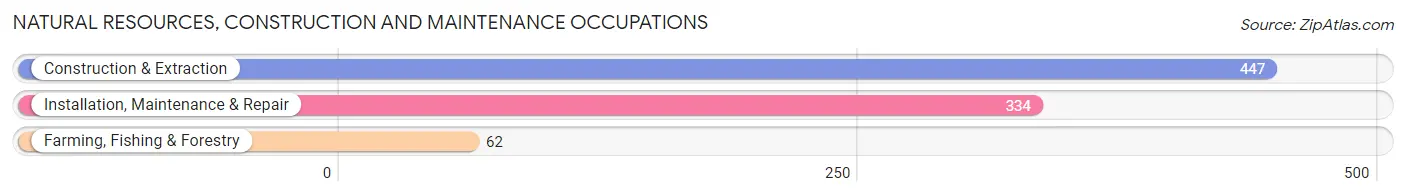
Natural Resources, Construction and Maintenance Occupations
The most common Natural Resources, Construction and Maintenance occupations in Brownwood are Construction & Extraction (447 | 5.0%), Installation, Maintenance & Repair (334 | 3.7%), and Farming, Fishing & Forestry (62 | 0.7%).
Natural Resources, Construction and Maintenance Occupations by Sex
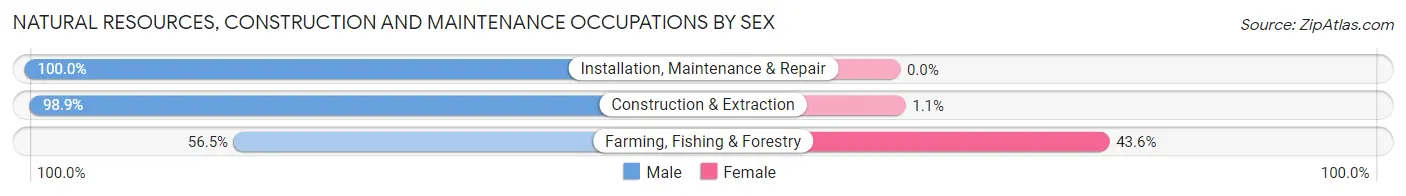
| Occupation | Male | Female |
| Farming, Fishing & Forestry | 35 (56.5%) | 27 (43.5%) |
| Construction & Extraction | 442 (98.9%) | 5 (1.1%) |
| Installation, Maintenance & Repair | 334 (100.0%) | 0 (0.0%) |
| Total (Category) | 811 (96.2%) | 32 (3.8%) |
| Total (Overall) | 4,652 (52.1%) | 4,282 (47.9%) |
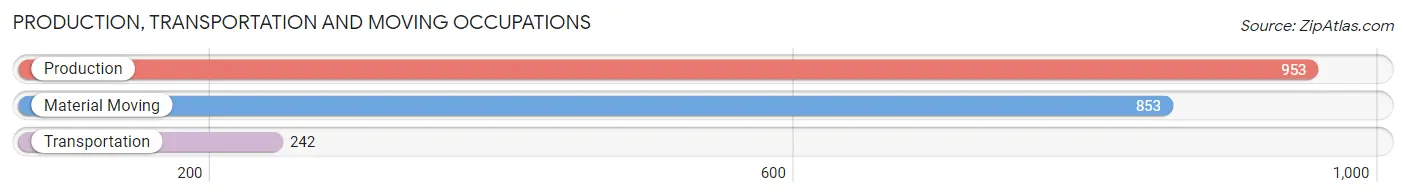
Production, Transportation and Moving Occupations
The most common Production, Transportation and Moving occupations in Brownwood are Production (953 | 10.7%), Material Moving (853 | 9.6%), and Transportation (242 | 2.7%).
Production, Transportation and Moving Occupations by Sex
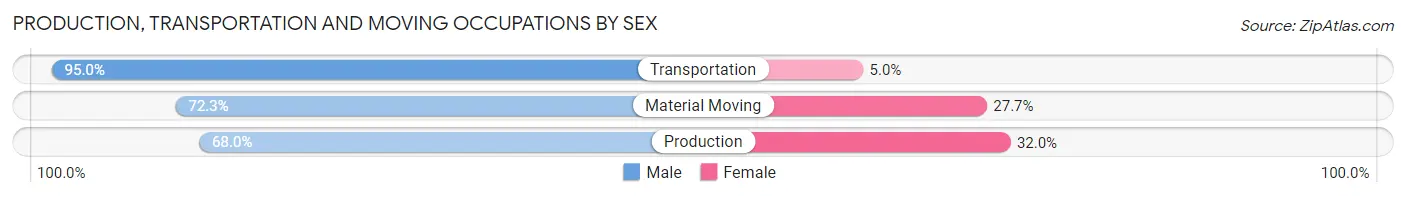
| Occupation | Male | Female |
| Production | 648 (68.0%) | 305 (32.0%) |
| Transportation | 230 (95.0%) | 12 (5.0%) |
| Material Moving | 617 (72.3%) | 236 (27.7%) |
| Total (Category) | 1,495 (73.0%) | 553 (27.0%) |
| Total (Overall) | 4,652 (52.1%) | 4,282 (47.9%) |
Employment Industries by Sex in Brownwood
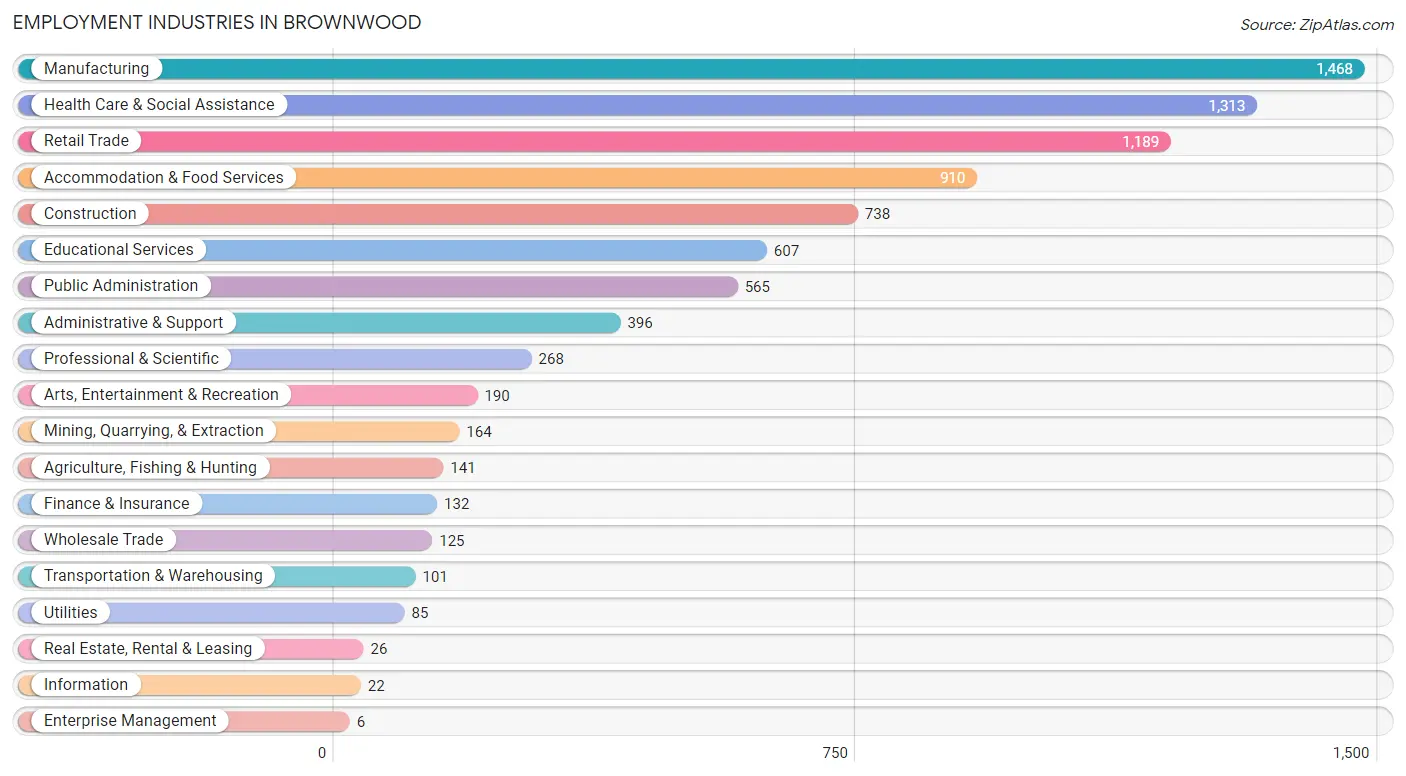
Employment Industries in Brownwood
The major employment industries in Brownwood include Manufacturing (1,468 | 16.4%), Health Care & Social Assistance (1,313 | 14.7%), Retail Trade (1,189 | 13.3%), Accommodation & Food Services (910 | 10.2%), and Construction (738 | 8.3%).
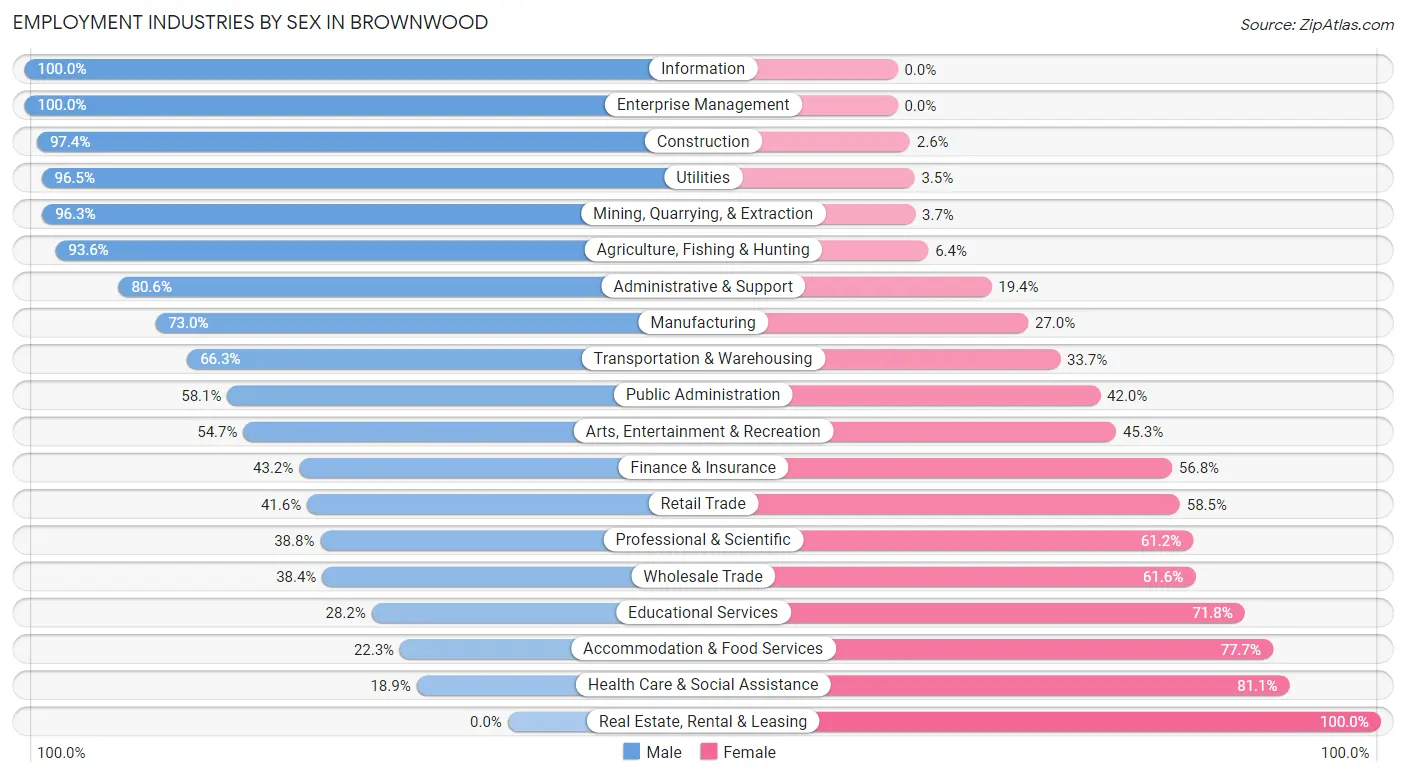
Employment Industries by Sex in Brownwood
The Brownwood industries that see more men than women are Information (100.0%), Enterprise Management (100.0%), and Construction (97.4%), whereas the industries that tend to have a higher number of women are Real Estate, Rental & Leasing (100.0%), Health Care & Social Assistance (81.1%), and Accommodation & Food Services (77.7%).
| Industry | Male | Female |
| Agriculture, Fishing & Hunting | 132 (93.6%) | 9 (6.4%) |
| Mining, Quarrying, & Extraction | 158 (96.3%) | 6 (3.7%) |
| Construction | 719 (97.4%) | 19 (2.6%) |
| Manufacturing | 1,071 (73.0%) | 397 (27.0%) |
| Wholesale Trade | 48 (38.4%) | 77 (61.6%) |
| Retail Trade | 494 (41.5%) | 695 (58.5%) |
| Transportation & Warehousing | 67 (66.3%) | 34 (33.7%) |
| Utilities | 82 (96.5%) | 3 (3.5%) |
| Information | 22 (100.0%) | 0 (0.0%) |
| Finance & Insurance | 57 (43.2%) | 75 (56.8%) |
| Real Estate, Rental & Leasing | 0 (0.0%) | 26 (100.0%) |
| Professional & Scientific | 104 (38.8%) | 164 (61.2%) |
| Enterprise Management | 6 (100.0%) | 0 (0.0%) |
| Administrative & Support | 319 (80.6%) | 77 (19.4%) |
| Educational Services | 171 (28.2%) | 436 (71.8%) |
| Health Care & Social Assistance | 248 (18.9%) | 1,065 (81.1%) |
| Arts, Entertainment & Recreation | 104 (54.7%) | 86 (45.3%) |
| Accommodation & Food Services | 203 (22.3%) | 707 (77.7%) |
| Public Administration | 328 (58.1%) | 237 (41.9%) |
| Total | 4,652 (52.1%) | 4,282 (47.9%) |
Education in Brownwood
School Enrollment in Brownwood
The most common levels of schooling among the 4,718 students in Brownwood are college / undergraduate (1,211 | 25.7%), high school (1,193 | 25.3%), and middle school (927 | 19.7%).
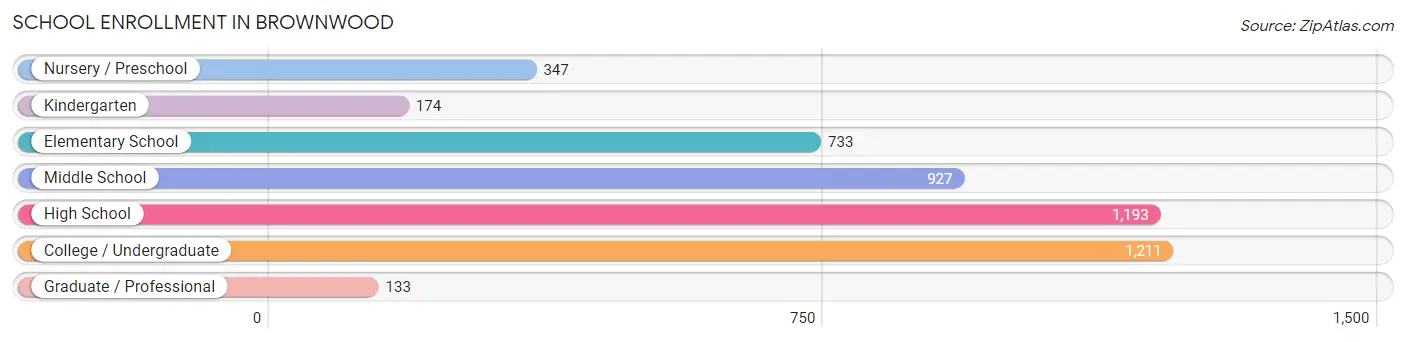
| School Level | # Students | % Students |
| Nursery / Preschool | 347 | 7.3% |
| Kindergarten | 174 | 3.7% |
| Elementary School | 733 | 15.5% |
| Middle School | 927 | 19.7% |
| High School | 1,193 | 25.3% |
| College / Undergraduate | 1,211 | 25.7% |
| Graduate / Professional | 133 | 2.8% |
| Total | 4,718 | 100.0% |
School Enrollment by Age by Funding Source in Brownwood
Out of a total of 4,718 students who are enrolled in schools in Brownwood, 727 (15.4%) attend a private institution, while the remaining 3,991 (84.6%) are enrolled in public schools. The age group of 18 to 19 year olds has the highest likelihood of being enrolled in private schools, with 246 (45.6% in the age bracket) enrolled. Conversely, the age group of 10 to 14 year olds has the lowest likelihood of being enrolled in a private school, with 1,229 (94.8% in the age bracket) attending a public institution.
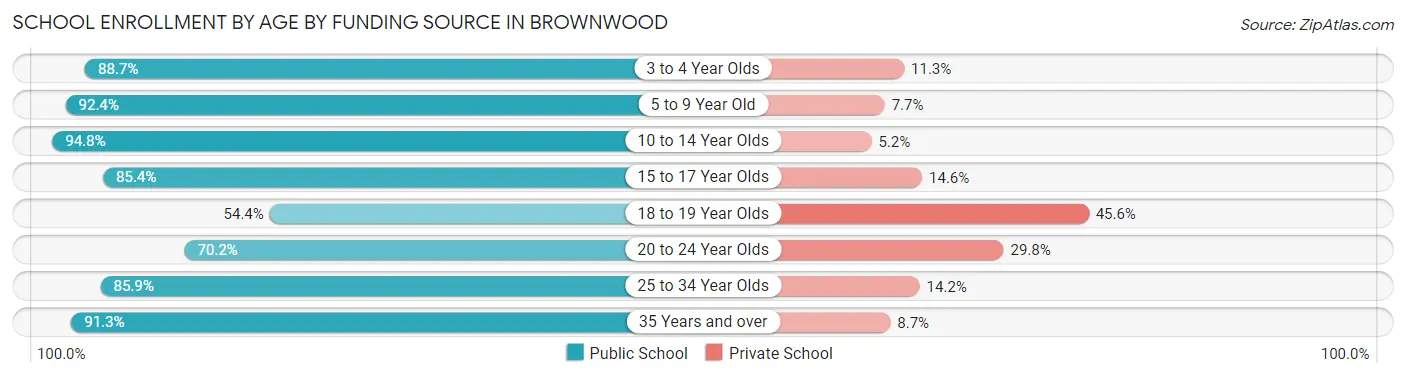
| Age Bracket | Public School | Private School |
| 3 to 4 Year Olds | 205 (88.7%) | 26 (11.3%) |
| 5 to 9 Year Old | 833 (92.3%) | 69 (7.6%) |
| 10 to 14 Year Olds | 1,229 (94.8%) | 67 (5.2%) |
| 15 to 17 Year Olds | 754 (85.4%) | 129 (14.6%) |
| 18 to 19 Year Olds | 293 (54.4%) | 246 (45.6%) |
| 20 to 24 Year Olds | 316 (70.2%) | 134 (29.8%) |
| 25 to 34 Year Olds | 279 (85.9%) | 46 (14.1%) |
| 35 Years and over | 84 (91.3%) | 8 (8.7%) |
| Total | 3,991 (84.6%) | 727 (15.4%) |
Educational Attainment by Field of Study in Brownwood
Education (531 | 23.3%), business (389 | 17.1%), arts & humanities (203 | 8.9%), liberal arts & history (199 | 8.7%), and science & technology (166 | 7.3%) are the most common fields of study among 2,277 individuals in Brownwood who have obtained a bachelor's degree or higher.
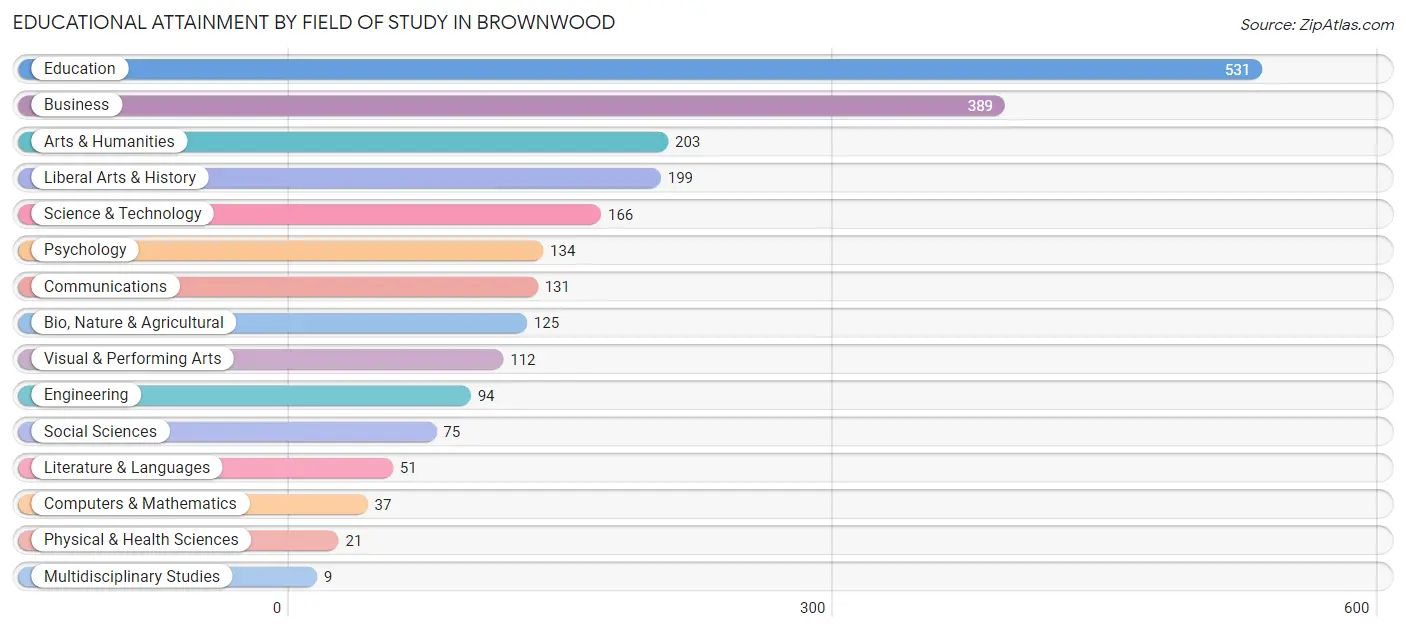
| Field of Study | # Graduates | % Graduates |
| Computers & Mathematics | 37 | 1.6% |
| Bio, Nature & Agricultural | 125 | 5.5% |
| Physical & Health Sciences | 21 | 0.9% |
| Psychology | 134 | 5.9% |
| Social Sciences | 75 | 3.3% |
| Engineering | 94 | 4.1% |
| Multidisciplinary Studies | 9 | 0.4% |
| Science & Technology | 166 | 7.3% |
| Business | 389 | 17.1% |
| Education | 531 | 23.3% |
| Literature & Languages | 51 | 2.2% |
| Liberal Arts & History | 199 | 8.7% |
| Visual & Performing Arts | 112 | 4.9% |
| Communications | 131 | 5.8% |
| Arts & Humanities | 203 | 8.9% |
| Total | 2,277 | 100.0% |
Transportation & Commute in Brownwood
Vehicle Availability by Sex in Brownwood
The most prevalent vehicle ownership categories in Brownwood are males with 2 vehicles (1,908, accounting for 41.6%) and females with 2 vehicles (1,417, making up 46.9%).
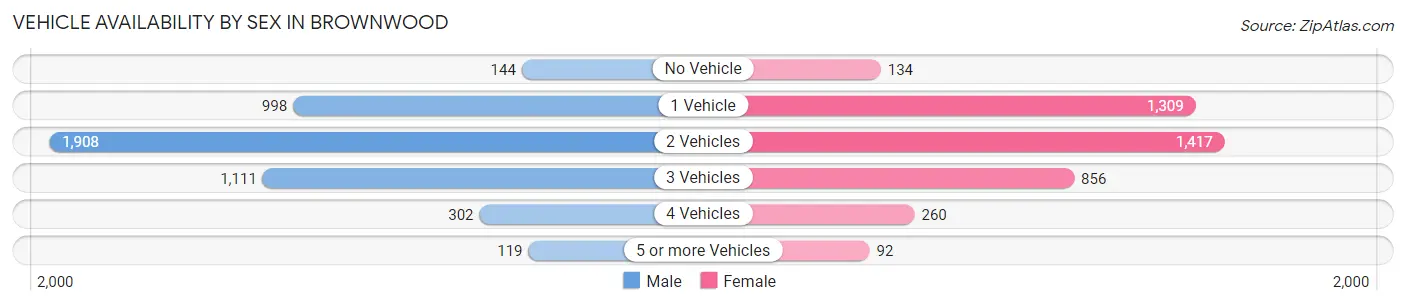
| Vehicles Available | Male | Female |
| No Vehicle | 144 (3.1%) | 134 (3.3%) |
| 1 Vehicle | 998 (21.8%) | 1,309 (32.2%) |
| 2 Vehicles | 1,908 (41.6%) | 1,417 (34.8%) |
| 3 Vehicles | 1,111 (24.2%) | 856 (21.0%) |
| 4 Vehicles | 302 (6.6%) | 260 (6.4%) |
| 5 or more Vehicles | 119 (2.6%) | 92 (2.3%) |
| Total | 4,582 (100.0%) | 4,068 (100.0%) |
Commute Time in Brownwood
The most frequently occuring commute durations in Brownwood are 5 to 9 minutes (2,919 commuters, 34.3%), 10 to 14 minutes (2,424 commuters, 28.4%), and less than 5 minutes (1,100 commuters, 12.9%).
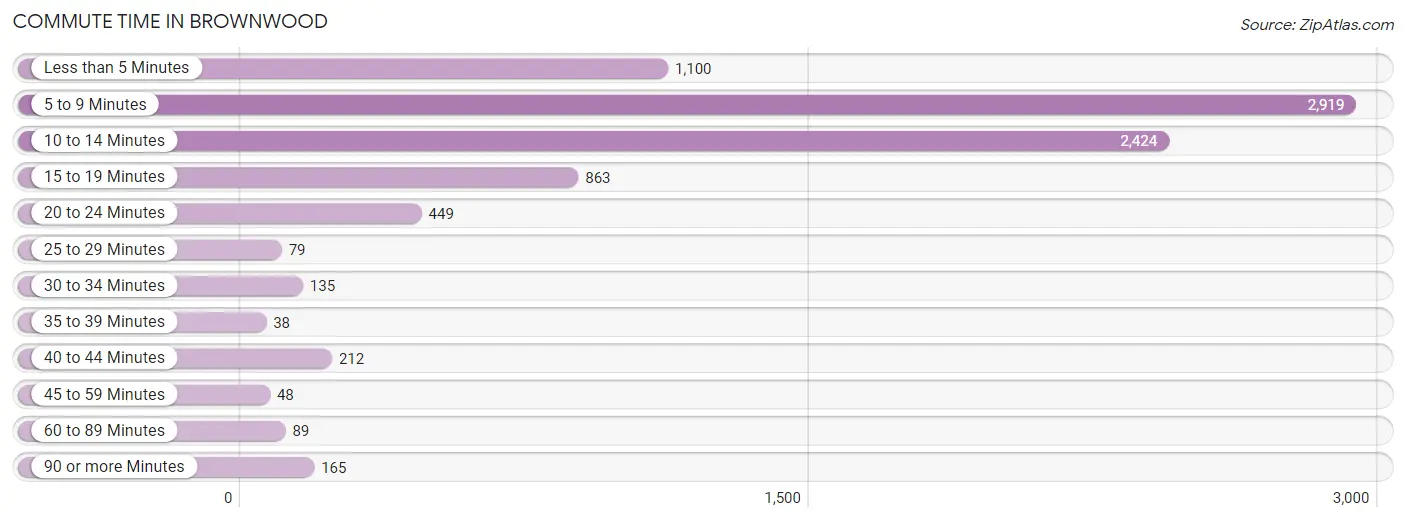
| Commute Time | # Commuters | % Commuters |
| Less than 5 Minutes | 1,100 | 12.9% |
| 5 to 9 Minutes | 2,919 | 34.3% |
| 10 to 14 Minutes | 2,424 | 28.4% |
| 15 to 19 Minutes | 863 | 10.1% |
| 20 to 24 Minutes | 449 | 5.3% |
| 25 to 29 Minutes | 79 | 0.9% |
| 30 to 34 Minutes | 135 | 1.6% |
| 35 to 39 Minutes | 38 | 0.4% |
| 40 to 44 Minutes | 212 | 2.5% |
| 45 to 59 Minutes | 48 | 0.6% |
| 60 to 89 Minutes | 89 | 1.0% |
| 90 or more Minutes | 165 | 1.9% |
Commute Time by Sex in Brownwood
The most common commute times in Brownwood are 5 to 9 minutes (1,356 commuters, 30.0%) for males and 5 to 9 minutes (1,563 commuters, 39.0%) for females.
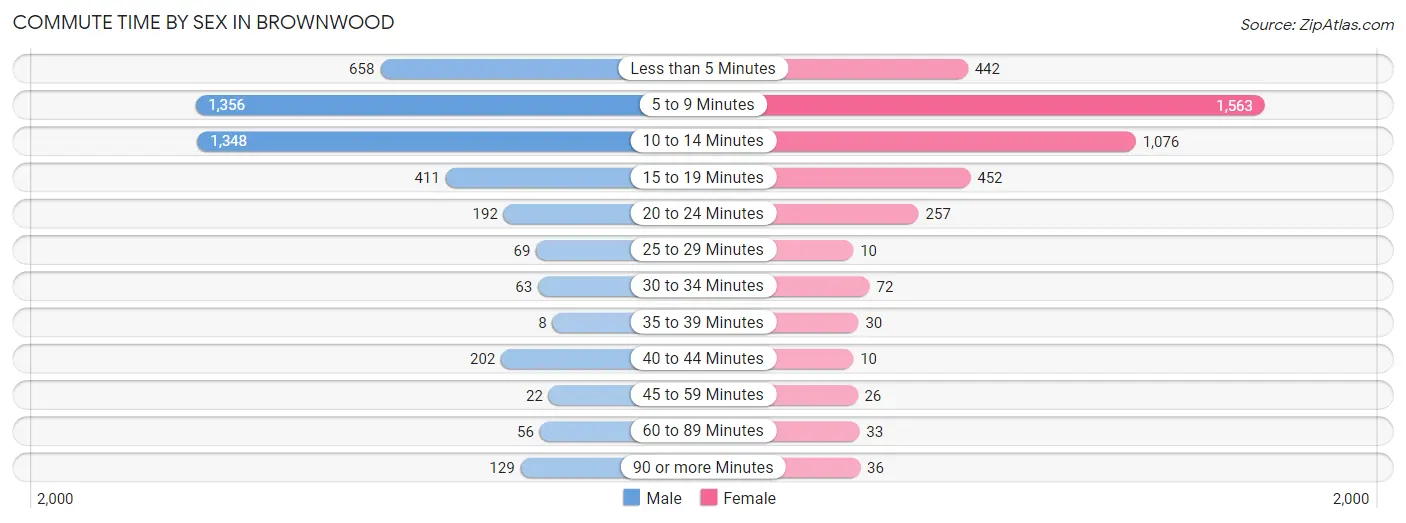
| Commute Time | Male | Female |
| Less than 5 Minutes | 658 (14.6%) | 442 (11.0%) |
| 5 to 9 Minutes | 1,356 (30.0%) | 1,563 (39.0%) |
| 10 to 14 Minutes | 1,348 (29.9%) | 1,076 (26.9%) |
| 15 to 19 Minutes | 411 (9.1%) | 452 (11.3%) |
| 20 to 24 Minutes | 192 (4.3%) | 257 (6.4%) |
| 25 to 29 Minutes | 69 (1.5%) | 10 (0.3%) |
| 30 to 34 Minutes | 63 (1.4%) | 72 (1.8%) |
| 35 to 39 Minutes | 8 (0.2%) | 30 (0.7%) |
| 40 to 44 Minutes | 202 (4.5%) | 10 (0.3%) |
| 45 to 59 Minutes | 22 (0.5%) | 26 (0.6%) |
| 60 to 89 Minutes | 56 (1.2%) | 33 (0.8%) |
| 90 or more Minutes | 129 (2.9%) | 36 (0.9%) |
Time of Departure to Work by Sex in Brownwood
The most frequent times of departure to work in Brownwood are 8:00 AM to 8:29 AM (593, 13.1%) for males and 7:30 AM to 7:59 AM (753, 18.8%) for females.
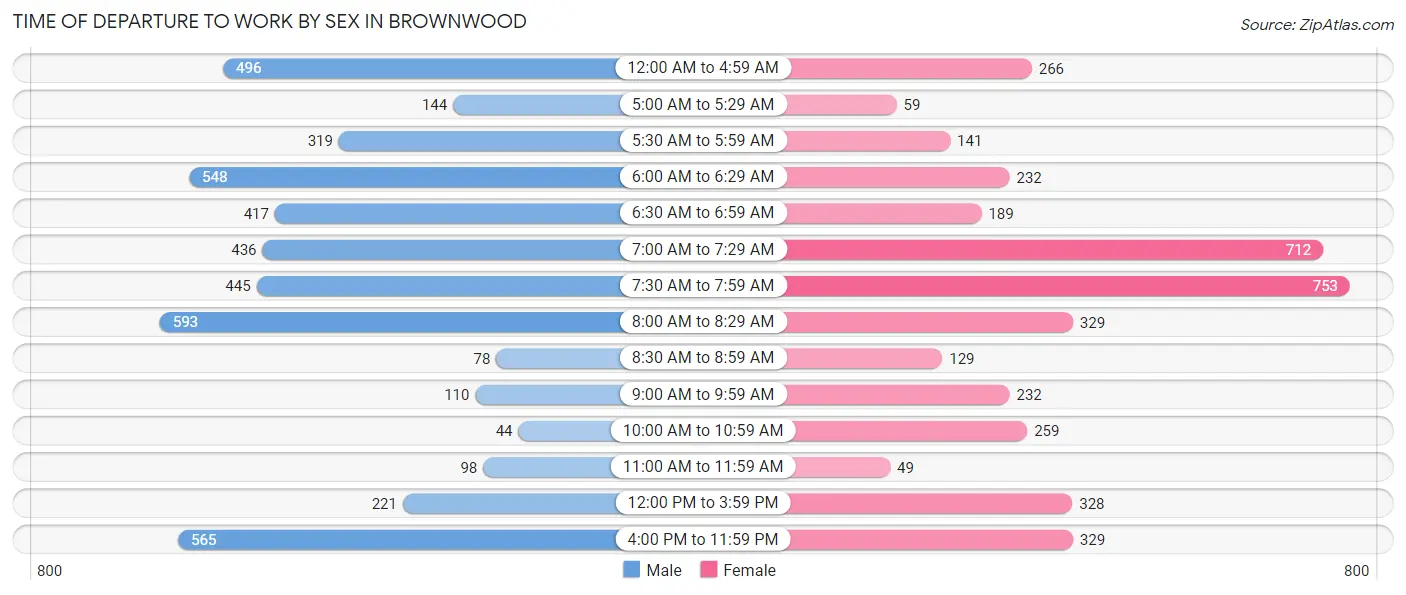
| Time of Departure | Male | Female |
| 12:00 AM to 4:59 AM | 496 (11.0%) | 266 (6.6%) |
| 5:00 AM to 5:29 AM | 144 (3.2%) | 59 (1.5%) |
| 5:30 AM to 5:59 AM | 319 (7.1%) | 141 (3.5%) |
| 6:00 AM to 6:29 AM | 548 (12.1%) | 232 (5.8%) |
| 6:30 AM to 6:59 AM | 417 (9.2%) | 189 (4.7%) |
| 7:00 AM to 7:29 AM | 436 (9.7%) | 712 (17.8%) |
| 7:30 AM to 7:59 AM | 445 (9.9%) | 753 (18.8%) |
| 8:00 AM to 8:29 AM | 593 (13.1%) | 329 (8.2%) |
| 8:30 AM to 8:59 AM | 78 (1.7%) | 129 (3.2%) |
| 9:00 AM to 9:59 AM | 110 (2.4%) | 232 (5.8%) |
| 10:00 AM to 10:59 AM | 44 (1.0%) | 259 (6.5%) |
| 11:00 AM to 11:59 AM | 98 (2.2%) | 49 (1.2%) |
| 12:00 PM to 3:59 PM | 221 (4.9%) | 328 (8.2%) |
| 4:00 PM to 11:59 PM | 565 (12.5%) | 329 (8.2%) |
| Total | 4,514 (100.0%) | 4,007 (100.0%) |
Housing Occupancy in Brownwood
Occupancy by Ownership in Brownwood
Of the total 7,313 dwellings in Brownwood, owner-occupied units account for 3,960 (54.1%), while renter-occupied units make up 3,353 (45.9%).
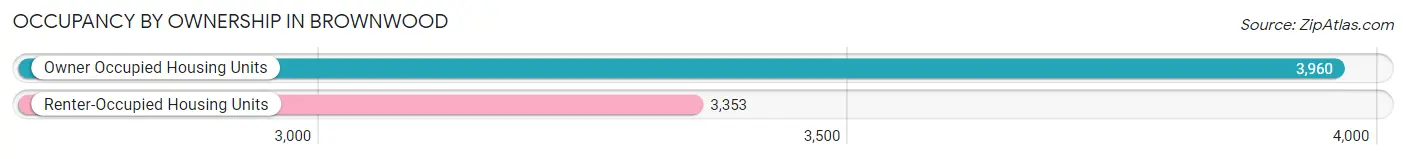
| Occupancy | # Housing Units | % Housing Units |
| Owner Occupied Housing Units | 3,960 | 54.1% |
| Renter-Occupied Housing Units | 3,353 | 45.9% |
| Total Occupied Housing Units | 7,313 | 100.0% |
Occupancy by Household Size in Brownwood
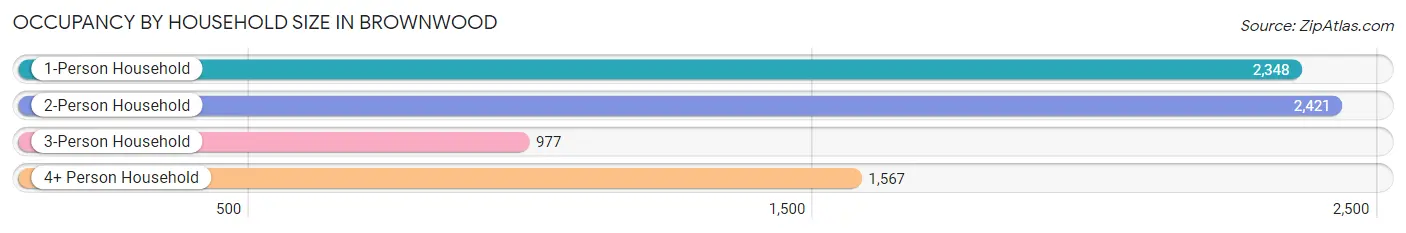
| Household Size | # Housing Units | % Housing Units |
| 1-Person Household | 2,348 | 32.1% |
| 2-Person Household | 2,421 | 33.1% |
| 3-Person Household | 977 | 13.4% |
| 4+ Person Household | 1,567 | 21.4% |
| Total Housing Units | 7,313 | 100.0% |
Occupancy by Ownership by Household Size in Brownwood
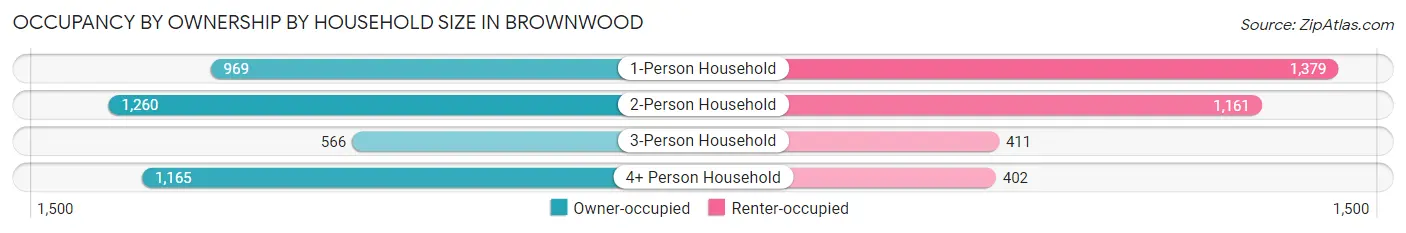
| Household Size | Owner-occupied | Renter-occupied |
| 1-Person Household | 969 (41.3%) | 1,379 (58.7%) |
| 2-Person Household | 1,260 (52.0%) | 1,161 (48.0%) |
| 3-Person Household | 566 (57.9%) | 411 (42.1%) |
| 4+ Person Household | 1,165 (74.4%) | 402 (25.7%) |
| Total Housing Units | 3,960 (54.1%) | 3,353 (45.9%) |
Occupancy by Educational Attainment in Brownwood
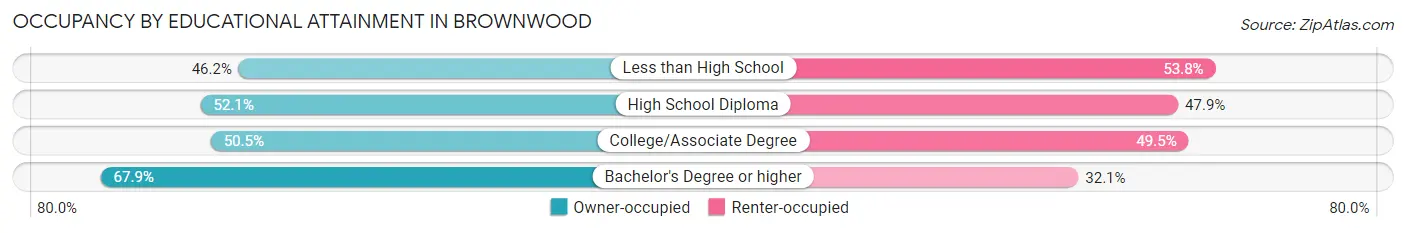
| Household Size | Owner-occupied | Renter-occupied |
| Less than High School | 370 (46.2%) | 431 (53.8%) |
| High School Diploma | 1,280 (52.1%) | 1,177 (47.9%) |
| College/Associate Degree | 1,285 (50.5%) | 1,261 (49.5%) |
| Bachelor's Degree or higher | 1,025 (67.9%) | 484 (32.1%) |
Occupancy by Age of Householder in Brownwood
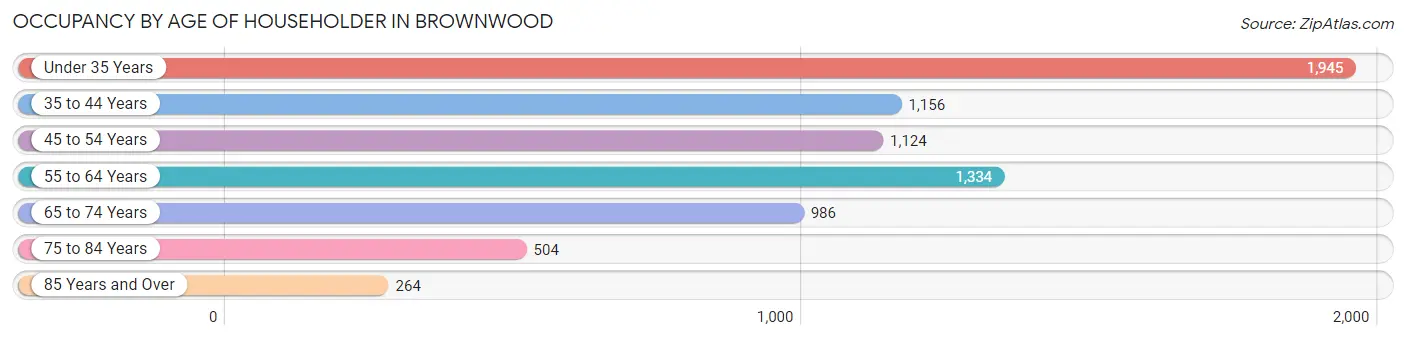
| Age Bracket | # Households | % Households |
| Under 35 Years | 1,945 | 26.6% |
| 35 to 44 Years | 1,156 | 15.8% |
| 45 to 54 Years | 1,124 | 15.4% |
| 55 to 64 Years | 1,334 | 18.2% |
| 65 to 74 Years | 986 | 13.5% |
| 75 to 84 Years | 504 | 6.9% |
| 85 Years and Over | 264 | 3.6% |
| Total | 7,313 | 100.0% |
Housing Finances in Brownwood
Median Income by Occupancy in Brownwood
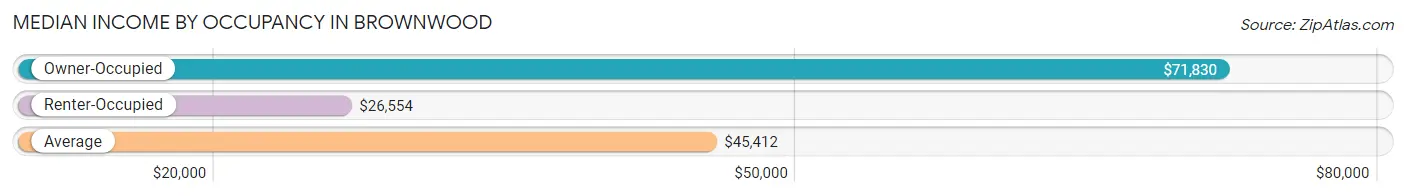
| Occupancy Type | # Households | Median Income |
| Owner-Occupied | 3,960 (54.1%) | $71,830 |
| Renter-Occupied | 3,353 (45.9%) | $26,554 |
| Average | 7,313 (100.0%) | $45,412 |
Occupancy by Householder Income Bracket in Brownwood
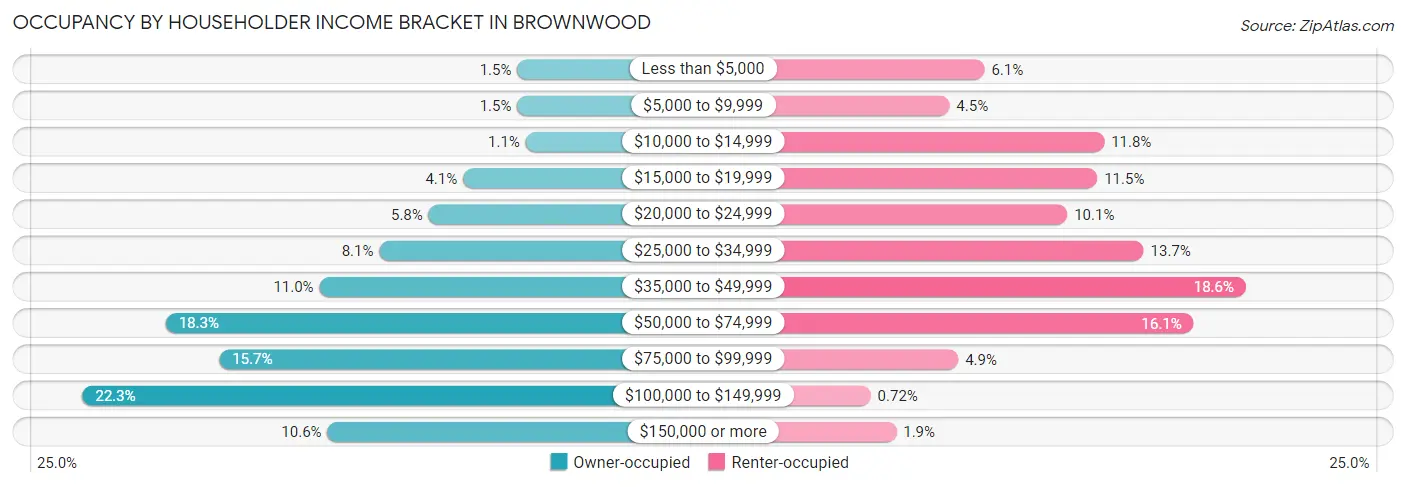
| Income Bracket | Owner-occupied | Renter-occupied |
| Less than $5,000 | 61 (1.5%) | 206 (6.1%) |
| $5,000 to $9,999 | 61 (1.5%) | 150 (4.5%) |
| $10,000 to $14,999 | 45 (1.1%) | 397 (11.8%) |
| $15,000 to $19,999 | 163 (4.1%) | 386 (11.5%) |
| $20,000 to $24,999 | 228 (5.8%) | 338 (10.1%) |
| $25,000 to $34,999 | 321 (8.1%) | 460 (13.7%) |
| $35,000 to $49,999 | 434 (11.0%) | 623 (18.6%) |
| $50,000 to $74,999 | 724 (18.3%) | 540 (16.1%) |
| $75,000 to $99,999 | 623 (15.7%) | 164 (4.9%) |
| $100,000 to $149,999 | 881 (22.3%) | 24 (0.7%) |
| $150,000 or more | 419 (10.6%) | 65 (1.9%) |
| Total | 3,960 (100.0%) | 3,353 (100.0%) |
Monthly Housing Cost Tiers in Brownwood
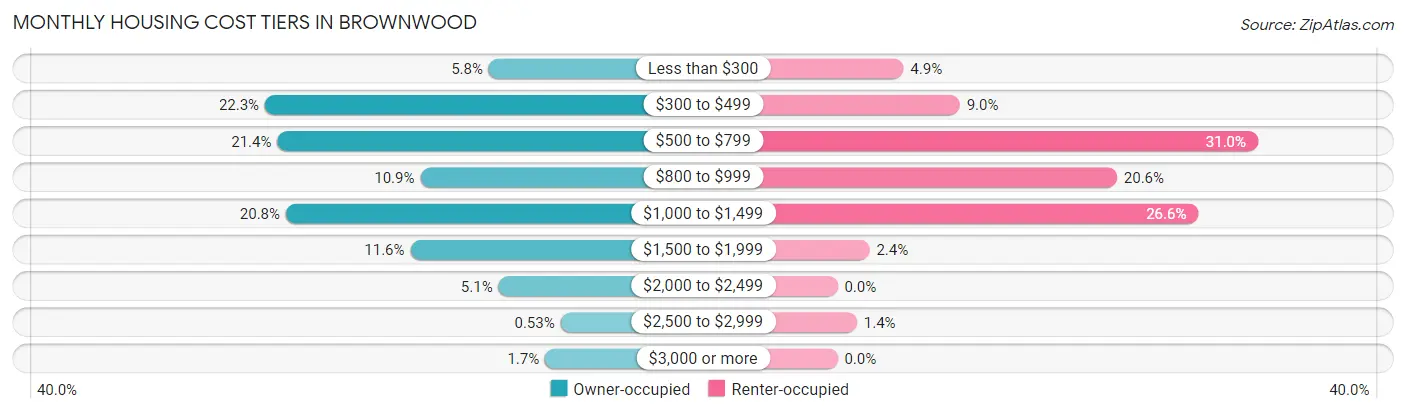
| Monthly Cost | Owner-occupied | Renter-occupied |
| Less than $300 | 230 (5.8%) | 163 (4.9%) |
| $300 to $499 | 883 (22.3%) | 302 (9.0%) |
| $500 to $799 | 847 (21.4%) | 1,038 (31.0%) |
| $800 to $999 | 430 (10.9%) | 690 (20.6%) |
| $1,000 to $1,499 | 822 (20.8%) | 891 (26.6%) |
| $1,500 to $1,999 | 459 (11.6%) | 79 (2.4%) |
| $2,000 to $2,499 | 202 (5.1%) | 0 (0.0%) |
| $2,500 to $2,999 | 21 (0.5%) | 48 (1.4%) |
| $3,000 or more | 66 (1.7%) | 0 (0.0%) |
| Total | 3,960 (100.0%) | 3,353 (100.0%) |
Physical Housing Characteristics in Brownwood
Housing Structures in Brownwood
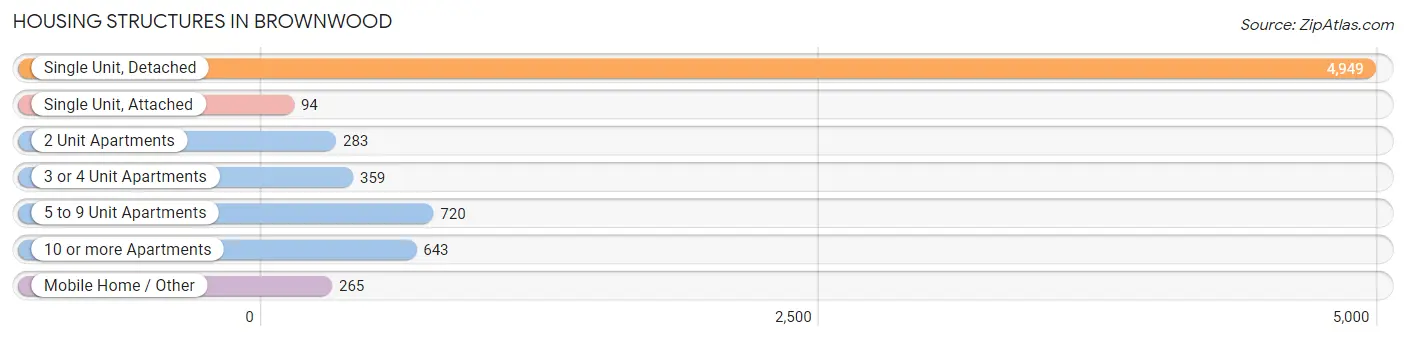
| Structure Type | # Housing Units | % Housing Units |
| Single Unit, Detached | 4,949 | 67.7% |
| Single Unit, Attached | 94 | 1.3% |
| 2 Unit Apartments | 283 | 3.9% |
| 3 or 4 Unit Apartments | 359 | 4.9% |
| 5 to 9 Unit Apartments | 720 | 9.9% |
| 10 or more Apartments | 643 | 8.8% |
| Mobile Home / Other | 265 | 3.6% |
| Total | 7,313 | 100.0% |
Housing Structures by Occupancy in Brownwood
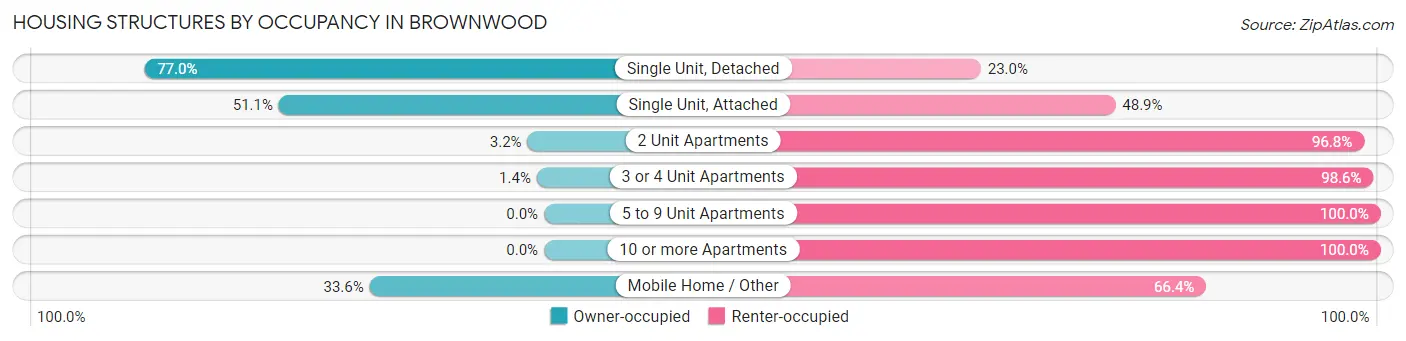
| Structure Type | Owner-occupied | Renter-occupied |
| Single Unit, Detached | 3,809 (77.0%) | 1,140 (23.0%) |
| Single Unit, Attached | 48 (51.1%) | 46 (48.9%) |
| 2 Unit Apartments | 9 (3.2%) | 274 (96.8%) |
| 3 or 4 Unit Apartments | 5 (1.4%) | 354 (98.6%) |
| 5 to 9 Unit Apartments | 0 (0.0%) | 720 (100.0%) |
| 10 or more Apartments | 0 (0.0%) | 643 (100.0%) |
| Mobile Home / Other | 89 (33.6%) | 176 (66.4%) |
| Total | 3,960 (54.1%) | 3,353 (45.9%) |
Housing Structures by Number of Rooms in Brownwood
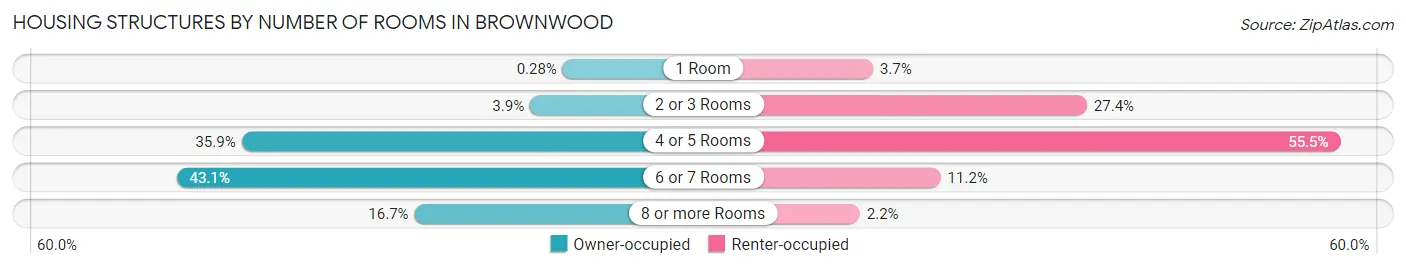
| Number of Rooms | Owner-occupied | Renter-occupied |
| 1 Room | 11 (0.3%) | 123 (3.7%) |
| 2 or 3 Rooms | 155 (3.9%) | 919 (27.4%) |
| 4 or 5 Rooms | 1,423 (35.9%) | 1,862 (55.5%) |
| 6 or 7 Rooms | 1,708 (43.1%) | 375 (11.2%) |
| 8 or more Rooms | 663 (16.7%) | 74 (2.2%) |
| Total | 3,960 (100.0%) | 3,353 (100.0%) |
Housing Structure by Heating Type in Brownwood
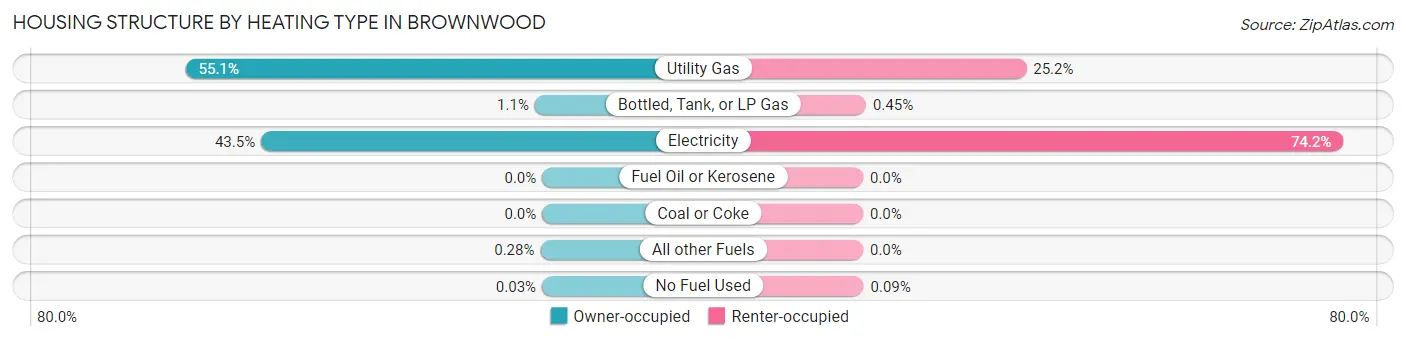
| Heating Type | Owner-occupied | Renter-occupied |
| Utility Gas | 2,182 (55.1%) | 846 (25.2%) |
| Bottled, Tank, or LP Gas | 45 (1.1%) | 15 (0.4%) |
| Electricity | 1,721 (43.5%) | 2,489 (74.2%) |
| Fuel Oil or Kerosene | 0 (0.0%) | 0 (0.0%) |
| Coal or Coke | 0 (0.0%) | 0 (0.0%) |
| All other Fuels | 11 (0.3%) | 0 (0.0%) |
| No Fuel Used | 1 (0.0%) | 3 (0.1%) |
| Total | 3,960 (100.0%) | 3,353 (100.0%) |
Household Vehicle Usage in Brownwood
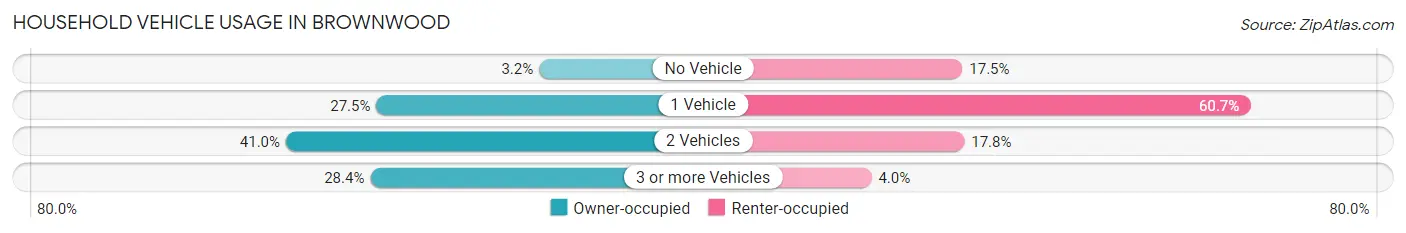
| Vehicles per Household | Owner-occupied | Renter-occupied |
| No Vehicle | 125 (3.2%) | 588 (17.5%) |
| 1 Vehicle | 1,088 (27.5%) | 2,034 (60.7%) |
| 2 Vehicles | 1,623 (41.0%) | 598 (17.8%) |
| 3 or more Vehicles | 1,124 (28.4%) | 133 (4.0%) |
| Total | 3,960 (100.0%) | 3,353 (100.0%) |
Real Estate & Mortgages in Brownwood
Real Estate and Mortgage Overview in Brownwood
| Characteristic | Without Mortgage | With Mortgage |
| Housing Units | 2,044 | 1,916 |
| Median Property Value | $90,300 | $137,700 |
| Median Household Income | $54,192 | $289 |
| Monthly Housing Costs | $487 | $66 |
| Real Estate Taxes | $1,252 | $33 |
Property Value by Mortgage Status in Brownwood
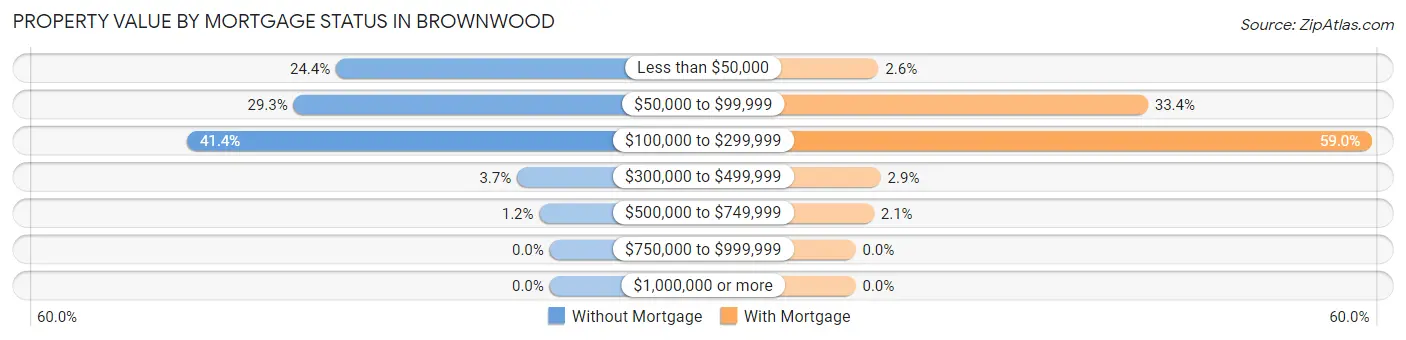
| Property Value | Without Mortgage | With Mortgage |
| Less than $50,000 | 499 (24.4%) | 50 (2.6%) |
| $50,000 to $99,999 | 598 (29.3%) | 640 (33.4%) |
| $100,000 to $299,999 | 847 (41.4%) | 1,131 (59.0%) |
| $300,000 to $499,999 | 76 (3.7%) | 55 (2.9%) |
| $500,000 to $749,999 | 24 (1.2%) | 40 (2.1%) |
| $750,000 to $999,999 | 0 (0.0%) | 0 (0.0%) |
| $1,000,000 or more | 0 (0.0%) | 0 (0.0%) |
| Total | 2,044 (100.0%) | 1,916 (100.0%) |
Household Income by Mortgage Status in Brownwood
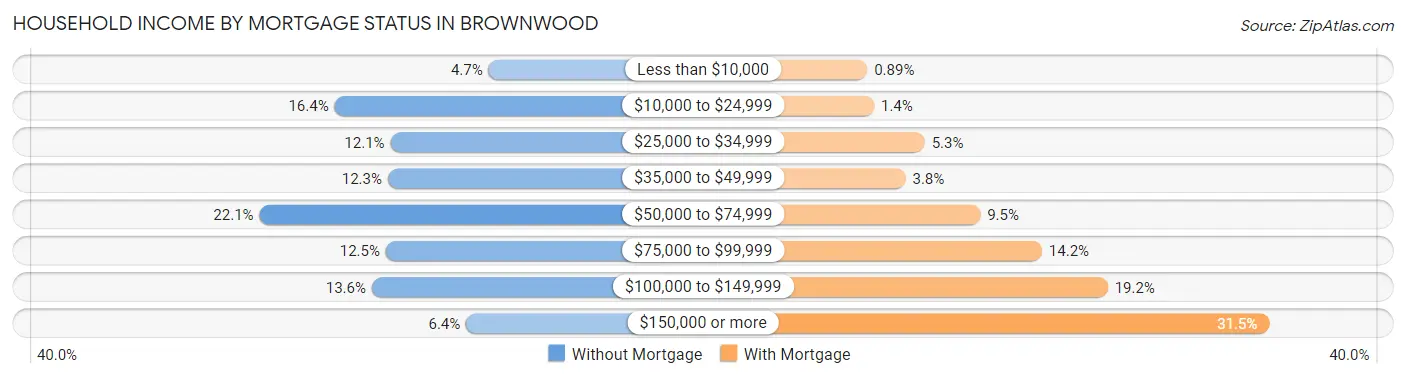
| Household Income | Without Mortgage | With Mortgage |
| Less than $10,000 | 95 (4.6%) | 17 (0.9%) |
| $10,000 to $24,999 | 335 (16.4%) | 27 (1.4%) |
| $25,000 to $34,999 | 248 (12.1%) | 101 (5.3%) |
| $35,000 to $49,999 | 252 (12.3%) | 73 (3.8%) |
| $50,000 to $74,999 | 452 (22.1%) | 182 (9.5%) |
| $75,000 to $99,999 | 255 (12.5%) | 272 (14.2%) |
| $100,000 to $149,999 | 277 (13.6%) | 368 (19.2%) |
| $150,000 or more | 130 (6.4%) | 604 (31.5%) |
| Total | 2,044 (100.0%) | 1,916 (100.0%) |
Property Value to Household Income Ratio in Brownwood
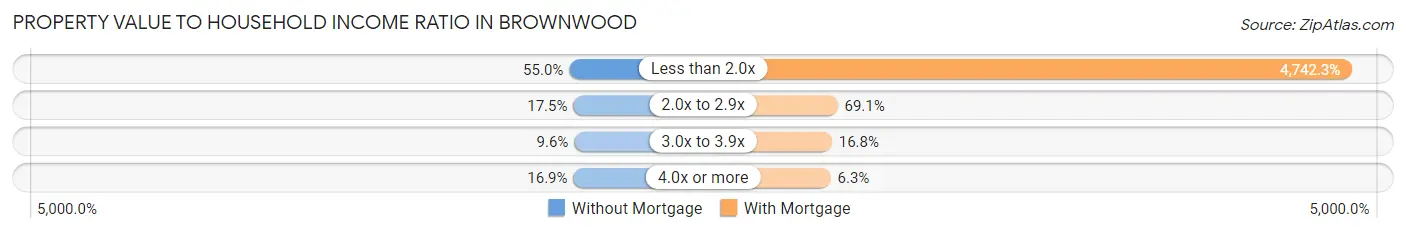
| Value-to-Income Ratio | Without Mortgage | With Mortgage |
| Less than 2.0x | 1,125 (55.0%) | 90,862 (4,742.3%) |
| 2.0x to 2.9x | 358 (17.5%) | 1,323 (69.1%) |
| 3.0x to 3.9x | 196 (9.6%) | 321 (16.8%) |
| 4.0x or more | 346 (16.9%) | 121 (6.3%) |
| Total | 2,044 (100.0%) | 1,916 (100.0%) |
Real Estate Taxes by Mortgage Status in Brownwood
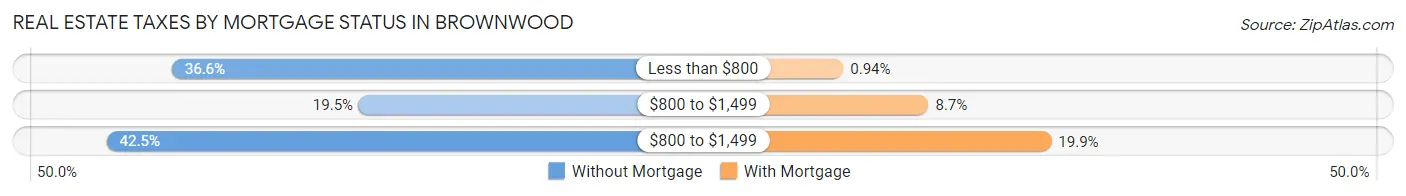
| Property Taxes | Without Mortgage | With Mortgage |
| Less than $800 | 747 (36.5%) | 18 (0.9%) |
| $800 to $1,499 | 398 (19.5%) | 167 (8.7%) |
| $800 to $1,499 | 869 (42.5%) | 382 (19.9%) |
| Total | 2,044 (100.0%) | 1,916 (100.0%) |
Health & Disability in Brownwood
Health Insurance Coverage by Age in Brownwood
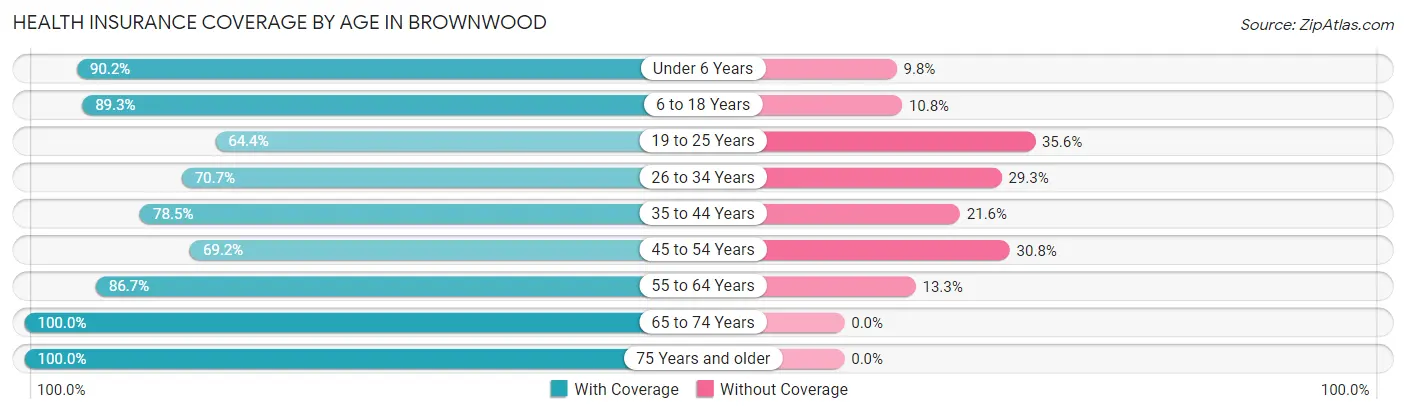
| Age Bracket | With Coverage | Without Coverage |
| Under 6 Years | 1,147 (90.2%) | 124 (9.8%) |
| 6 to 18 Years | 2,989 (89.2%) | 360 (10.7%) |
| 19 to 25 Years | 1,589 (64.4%) | 877 (35.6%) |
| 26 to 34 Years | 1,575 (70.7%) | 653 (29.3%) |
| 35 to 44 Years | 1,682 (78.4%) | 462 (21.5%) |
| 45 to 54 Years | 1,370 (69.2%) | 611 (30.8%) |
| 55 to 64 Years | 1,933 (86.7%) | 296 (13.3%) |
| 65 to 74 Years | 1,504 (100.0%) | 0 (0.0%) |
| 75 Years and older | 1,109 (100.0%) | 0 (0.0%) |
| Total | 14,898 (81.5%) | 3,383 (18.5%) |
Health Insurance Coverage by Citizenship Status in Brownwood
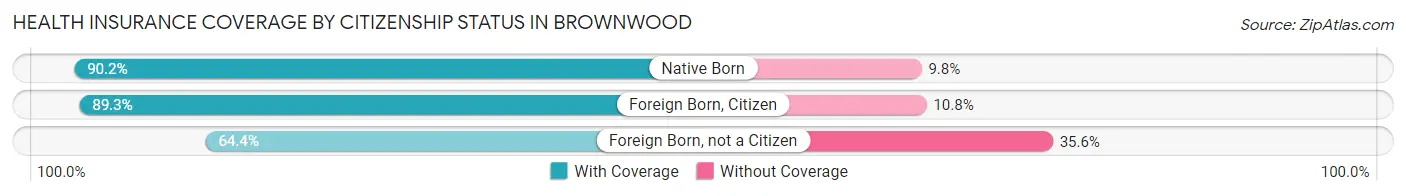
| Citizenship Status | With Coverage | Without Coverage |
| Native Born | 1,147 (90.2%) | 124 (9.8%) |
| Foreign Born, Citizen | 2,989 (89.2%) | 360 (10.7%) |
| Foreign Born, not a Citizen | 1,589 (64.4%) | 877 (35.6%) |
Health Insurance Coverage by Household Income in Brownwood
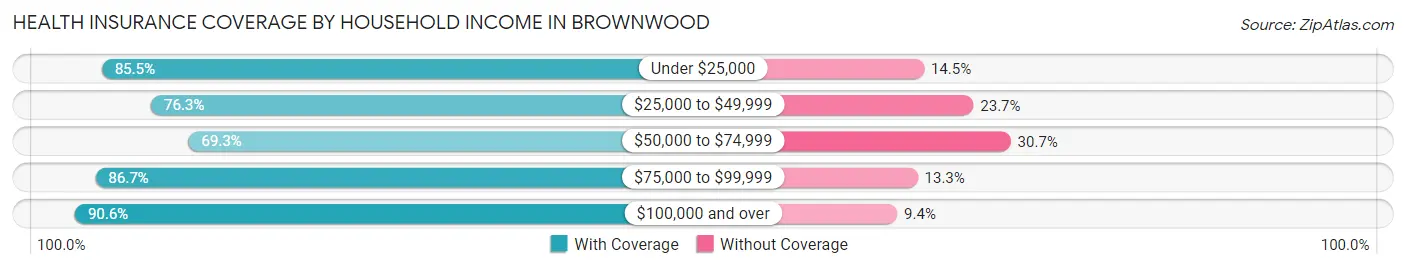
| Household Income | With Coverage | Without Coverage |
| Under $25,000 | 3,029 (85.5%) | 512 (14.5%) |
| $25,000 to $49,999 | 2,715 (76.3%) | 844 (23.7%) |
| $50,000 to $74,999 | 2,684 (69.3%) | 1,189 (30.7%) |
| $75,000 to $99,999 | 1,895 (86.7%) | 290 (13.3%) |
| $100,000 and over | 4,040 (90.6%) | 421 (9.4%) |
Public vs Private Health Insurance Coverage by Age in Brownwood
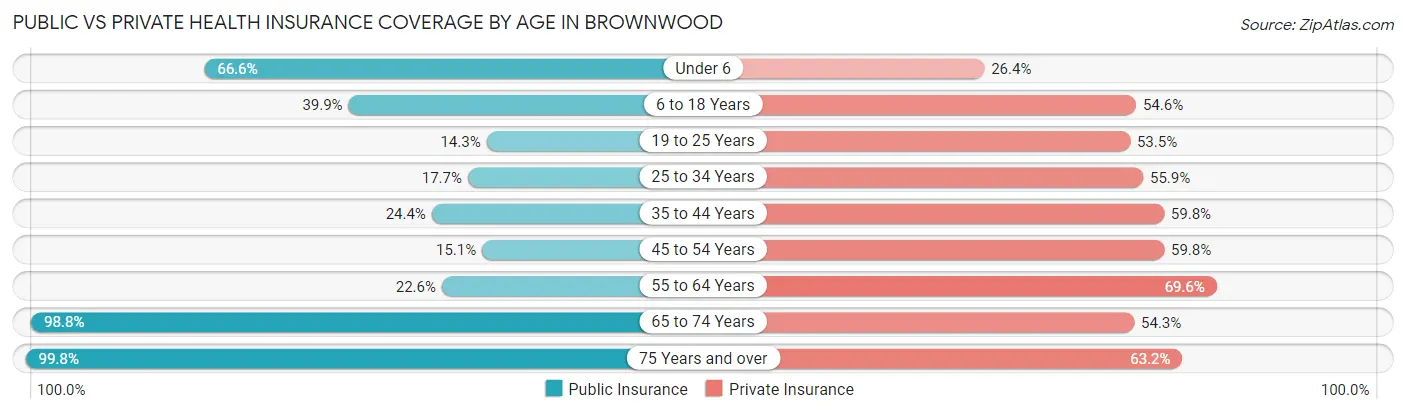
| Age Bracket | Public Insurance | Private Insurance |
| Under 6 | 847 (66.6%) | 336 (26.4%) |
| 6 to 18 Years | 1,336 (39.9%) | 1,829 (54.6%) |
| 19 to 25 Years | 352 (14.3%) | 1,319 (53.5%) |
| 25 to 34 Years | 395 (17.7%) | 1,246 (55.9%) |
| 35 to 44 Years | 524 (24.4%) | 1,282 (59.8%) |
| 45 to 54 Years | 299 (15.1%) | 1,185 (59.8%) |
| 55 to 64 Years | 503 (22.6%) | 1,551 (69.6%) |
| 65 to 74 Years | 1,486 (98.8%) | 816 (54.3%) |
| 75 Years and over | 1,107 (99.8%) | 701 (63.2%) |
| Total | 6,849 (37.5%) | 10,265 (56.1%) |
Disability Status by Sex by Age in Brownwood
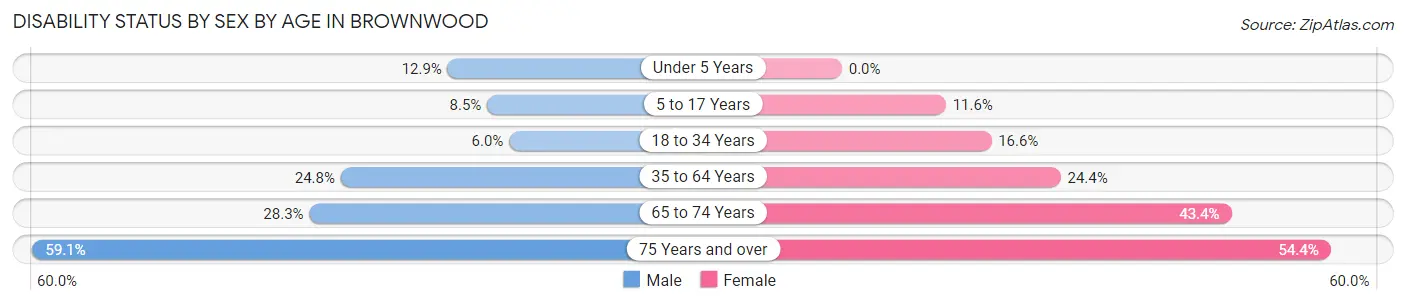
| Age Bracket | Male | Female |
| Under 5 Years | 77 (12.9%) | 0 (0.0%) |
| 5 to 17 Years | 135 (8.5%) | 167 (11.6%) |
| 18 to 34 Years | 149 (6.0%) | 451 (16.6%) |
| 35 to 64 Years | 757 (24.8%) | 804 (24.4%) |
| 65 to 74 Years | 220 (28.3%) | 315 (43.4%) |
| 75 Years and over | 230 (59.1%) | 392 (54.4%) |
Disability Class by Sex by Age in Brownwood
Disability Class: Hearing Difficulty
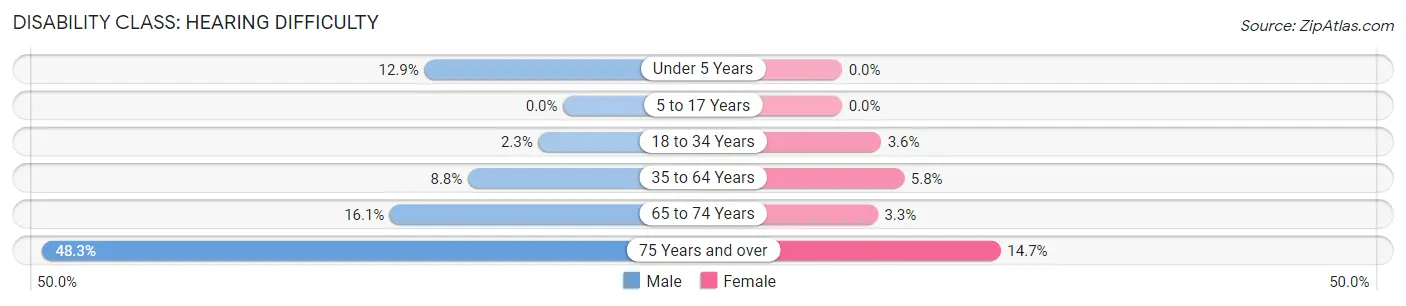
| Age Bracket | Male | Female |
| Under 5 Years | 77 (12.9%) | 0 (0.0%) |
| 5 to 17 Years | 0 (0.0%) | 0 (0.0%) |
| 18 to 34 Years | 57 (2.3%) | 98 (3.6%) |
| 35 to 64 Years | 270 (8.8%) | 190 (5.8%) |
| 65 to 74 Years | 125 (16.1%) | 24 (3.3%) |
| 75 Years and over | 188 (48.3%) | 106 (14.7%) |
Disability Class: Vision Difficulty
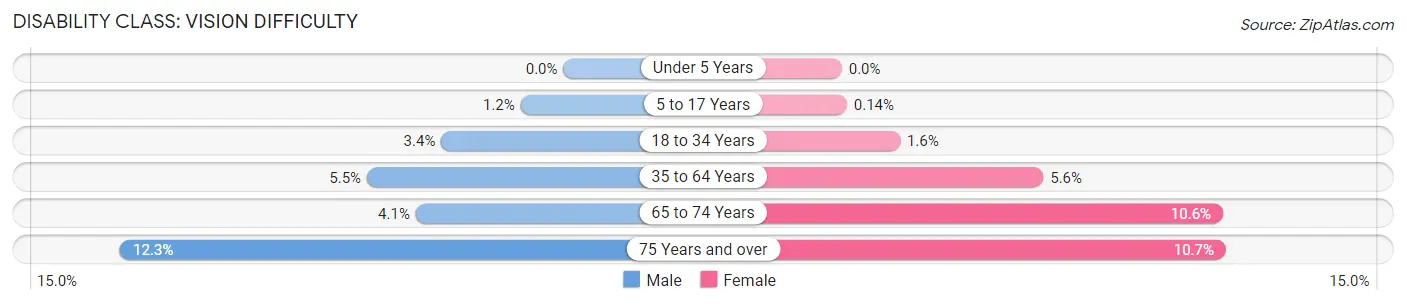
| Age Bracket | Male | Female |
| Under 5 Years | 0 (0.0%) | 0 (0.0%) |
| 5 to 17 Years | 19 (1.2%) | 2 (0.1%) |
| 18 to 34 Years | 84 (3.4%) | 44 (1.6%) |
| 35 to 64 Years | 167 (5.5%) | 185 (5.6%) |
| 65 to 74 Years | 32 (4.1%) | 77 (10.6%) |
| 75 Years and over | 48 (12.3%) | 77 (10.7%) |
Disability Class: Cognitive Difficulty
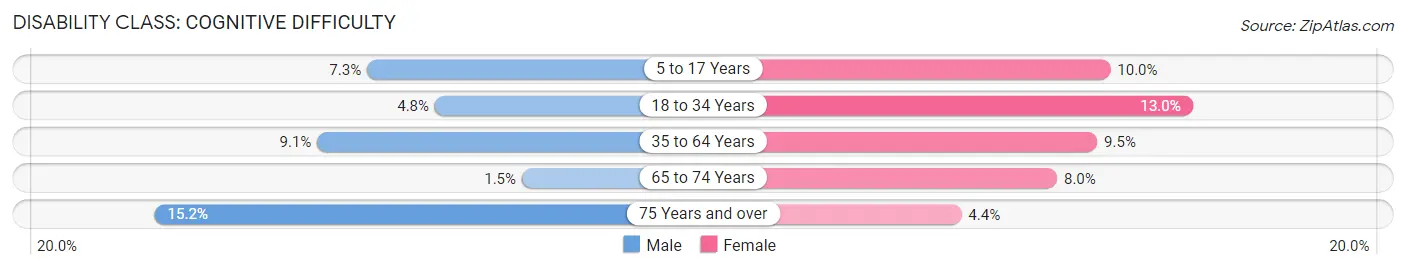
| Age Bracket | Male | Female |
| 5 to 17 Years | 116 (7.3%) | 144 (10.0%) |
| 18 to 34 Years | 118 (4.8%) | 353 (13.0%) |
| 35 to 64 Years | 279 (9.1%) | 313 (9.5%) |
| 65 to 74 Years | 12 (1.5%) | 58 (8.0%) |
| 75 Years and over | 59 (15.2%) | 32 (4.4%) |
Disability Class: Ambulatory Difficulty
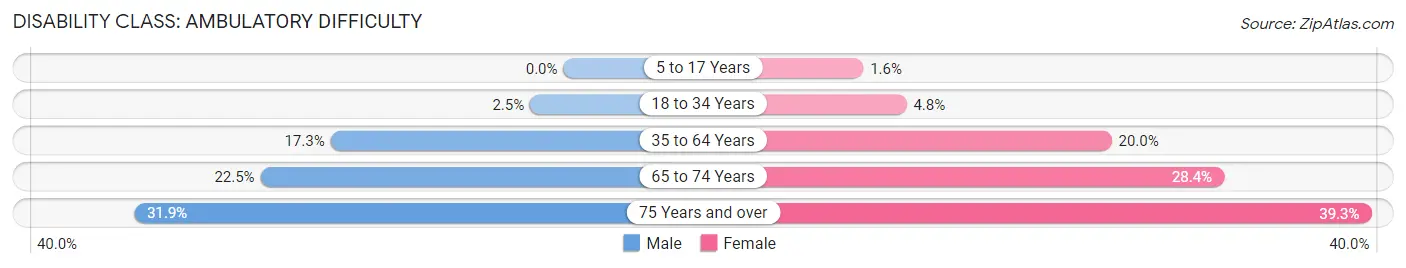
| Age Bracket | Male | Female |
| 5 to 17 Years | 0 (0.0%) | 23 (1.6%) |
| 18 to 34 Years | 61 (2.5%) | 130 (4.8%) |
| 35 to 64 Years | 528 (17.3%) | 661 (20.0%) |
| 65 to 74 Years | 175 (22.5%) | 206 (28.4%) |
| 75 Years and over | 124 (31.9%) | 283 (39.3%) |
Disability Class: Self-Care Difficulty
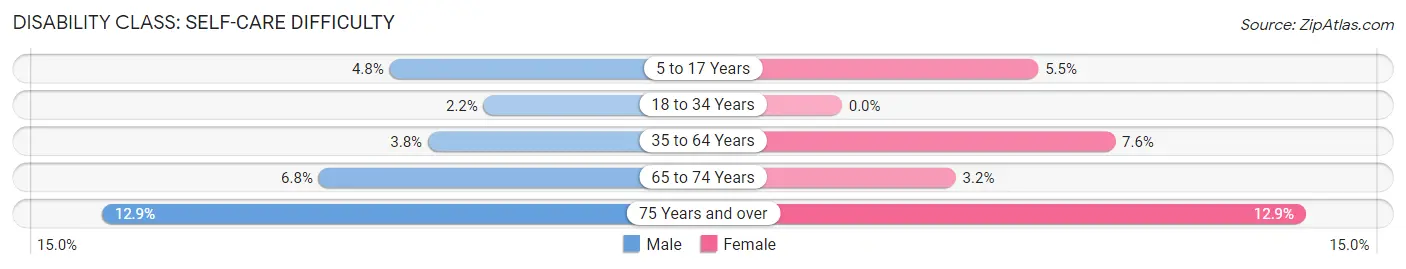
| Age Bracket | Male | Female |
| 5 to 17 Years | 77 (4.8%) | 79 (5.5%) |
| 18 to 34 Years | 55 (2.2%) | 0 (0.0%) |
| 35 to 64 Years | 115 (3.8%) | 251 (7.6%) |
| 65 to 74 Years | 53 (6.8%) | 23 (3.2%) |
| 75 Years and over | 50 (12.9%) | 93 (12.9%) |
Technology Access in Brownwood
Computing Device Access in Brownwood
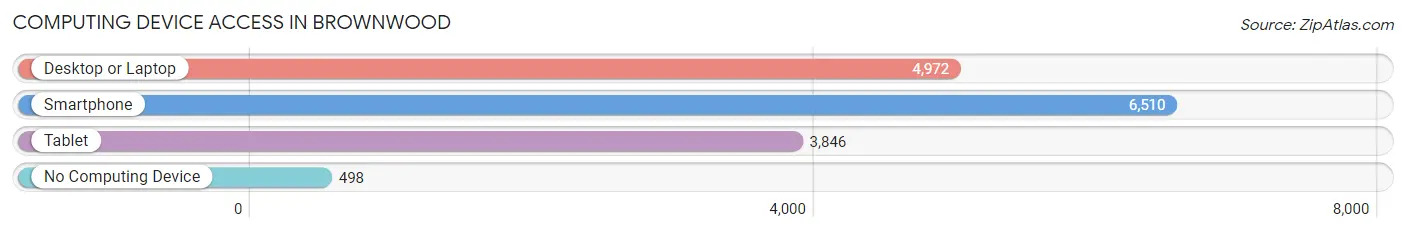
| Device Type | # Households | % Households |
| Desktop or Laptop | 4,972 | 68.0% |
| Smartphone | 6,510 | 89.0% |
| Tablet | 3,846 | 52.6% |
| No Computing Device | 498 | 6.8% |
| Total | 7,313 | 100.0% |
Internet Access in Brownwood
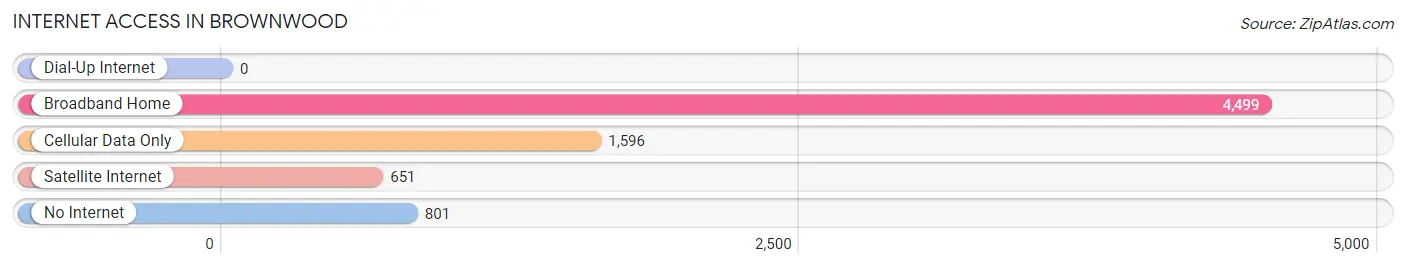
| Internet Type | # Households | % Households |
| Dial-Up Internet | 0 | 0.0% |
| Broadband Home | 4,499 | 61.5% |
| Cellular Data Only | 1,596 | 21.8% |
| Satellite Internet | 651 | 8.9% |
| No Internet | 801 | 11.0% |
| Total | 7,313 | 100.0% |
Brownwood Summary
Brownwood, Texas is a city located in Brown County in the state of Texas. It is the county seat of Brown County and is located in the heart of Central Texas. The city has a population of 19,288 as of the 2010 census.
History
Brownwood was founded in 1856 by Henry C. Brown, a settler from the nearby town of Bangs. Brown had been a successful rancher and businessman in the area and decided to establish a town in the area. He named the town after himself and the county after his father, Henry F. Brown. The town was officially incorporated in 1884.
In the late 19th century, Brownwood was a major center for the cattle industry. The town was also a major stop on the Texas and Pacific Railway, which connected the town to other major cities in the state.
In the early 20th century, the town began to experience a period of growth and development. The city was home to several major industries, including a cotton mill, a lumber mill, and a brick factory. The city also became a major center for education, with several colleges and universities being established in the area.
Geography
Brownwood is located in Central Texas, approximately 100 miles west of the Dallas-Fort Worth Metroplex. The city is situated in the rolling hills of the Edwards Plateau, which is part of the larger Great Plains region. The city is located at the intersection of U.S. Highway 84 and State Highway 279.
The city has a total area of 11.2 square miles, of which 11.1 square miles is land and 0.1 square miles is water. The city is located at an elevation of 1,400 feet above sea level.
Economy
The economy of Brownwood is largely based on the service industry. The city is home to several major employers, including Brownwood Regional Medical Center, Brownwood Independent School District, and the Texas Department of Criminal Justice. The city is also home to several retail stores, restaurants, and other businesses.
The city is also home to several manufacturing companies, including Brownwood Manufacturing, which produces a variety of products, including furniture, cabinets, and other wood products. The city is also home to several oil and gas companies, including Brownwood Oil and Gas.
Demographics
As of the 2010 census, the population of Brownwood was 19,288. The racial makeup of the city was 79.2% White, 11.7% African American, 0.7% Native American, 0.7% Asian, 0.1% Pacific Islander, 5.7% from other races, and 2.1% from two or more races. Hispanic or Latino of any race were 13.2% of the population.
The median income for a household in the city was $31,945, and the median income for a family was $41,945. The per capita income for the city was $17,845. About 17.2% of families and 21.3% of the population were below the poverty line, including 28.3% of those under age 18 and 11.7% of those age 65 or over.
Common Questions
What is Per Capita Income in Brownwood?
Per Capita income in Brownwood is $25,906.
What is the Median Family Income in Brownwood?
Median Family Income in Brownwood is $61,798.
What is the Median Household income in Brownwood?
Median Household Income in Brownwood is $45,412.
What is Income or Wage Gap in Brownwood?
Income or Wage Gap in Brownwood is 33.9%.
Women in Brownwood earn 66.1 cents for every dollar earned by a man.
What is Family Income Deficit in Brownwood?
Family Income Deficit in Brownwood is $10,218.
Families that are below poverty line in Brownwood earn $10,218 less on average than the poverty threshold level.
What is Inequality or Gini Index in Brownwood?
Inequality or Gini Index in Brownwood is 0.45.
What is the Total Population of Brownwood?
Total Population of Brownwood is 18,820.
What is the Total Male Population of Brownwood?
Total Male Population of Brownwood is 9,105.
What is the Total Female Population of Brownwood?
Total Female Population of Brownwood is 9,715.
What is the Ratio of Males per 100 Females in Brownwood?
There are 93.72 Males per 100 Females in Brownwood.
What is the Ratio of Females per 100 Males in Brownwood?
There are 106.70 Females per 100 Males in Brownwood.
What is the Median Population Age in Brownwood?
Median Population Age in Brownwood is 34.9 Years.
What is the Average Family Size in Brownwood
Average Family Size in Brownwood is 3.0 People.
What is the Average Household Size in Brownwood
Average Household Size in Brownwood is 2.4 People.
How Large is the Labor Force in Brownwood?
There are 9,260 People in the Labor Forcein in Brownwood.
What is the Percentage of People in the Labor Force in Brownwood?
61.1% of People are in the Labor Force in Brownwood.
What is the Unemployment Rate in Brownwood?
Unemployment Rate in Brownwood is 3.2%.