Terrell, TX Map & Demographics
Terrell Map
Terrell Overview
$25,428
PER CAPITA INCOME
$63,958
AVG FAMILY INCOME
$61,513
AVG HOUSEHOLD INCOME
25.4%
WAGE / INCOME GAP [ % ]
74.6¢/ $1
WAGE / INCOME GAP [ $ ]
$12,733
FAMILY INCOME DEFICIT
0.41
INEQUALITY / GINI INDEX
18,001
TOTAL POPULATION
7,896
MALE POPULATION
10,105
FEMALE POPULATION
78.14
MALES / 100 FEMALES
127.98
FEMALES / 100 MALES
35.0
MEDIAN AGE
3.4
AVG FAMILY SIZE
2.8
AVG HOUSEHOLD SIZE
8,434
LABOR FORCE [ PEOPLE ]
60.7%
PERCENT IN LABOR FORCE
5.6%
UNEMPLOYMENT RATE
Income in Terrell
Income Overview in Terrell
Per Capita Income in Terrell is $25,428, while median incomes of families and households are $63,958 and $61,513 respectively.
| Characteristic | Number | Measure |
| Per Capita Income | 18,001 | $25,428 |
| Median Family Income | 4,322 | $63,958 |
| Mean Family Income | 4,322 | $75,121 |
| Median Household Income | 6,169 | $61,513 |
| Mean Household Income | 6,169 | $69,077 |
| Income Deficit | 4,322 | $12,733 |
| Wage / Income Gap (%) | 18,001 | 25.43% |
| Wage / Income Gap ($) | 18,001 | 74.57¢ per $1 |
| Gini / Inequality Index | 18,001 | 0.41 |
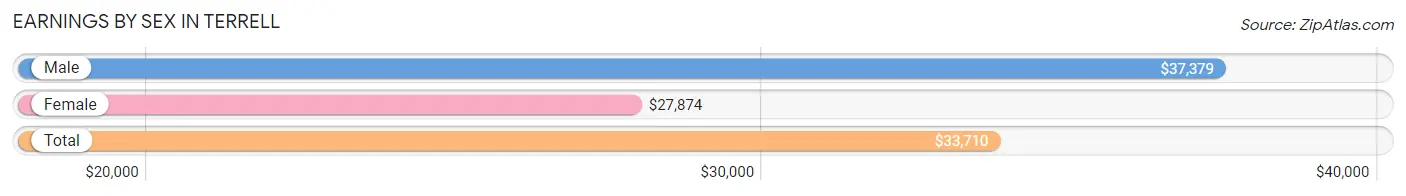
Earnings by Sex in Terrell
Average Earnings in Terrell are $33,710, $37,379 for men and $27,874 for women, a difference of 25.4%.
| Sex | Number | Average Earnings |
| Male | 4,252 (48.1%) | $37,379 |
| Female | 4,590 (51.9%) | $27,874 |
| Total | 8,842 (100.0%) | $33,710 |
Earnings by Sex by Income Bracket in Terrell
The most common earnings brackets in Terrell are $65,000 to $74,999 for men (525 | 12.3%) and $25,000 to $29,999 for women (475 | 10.3%).
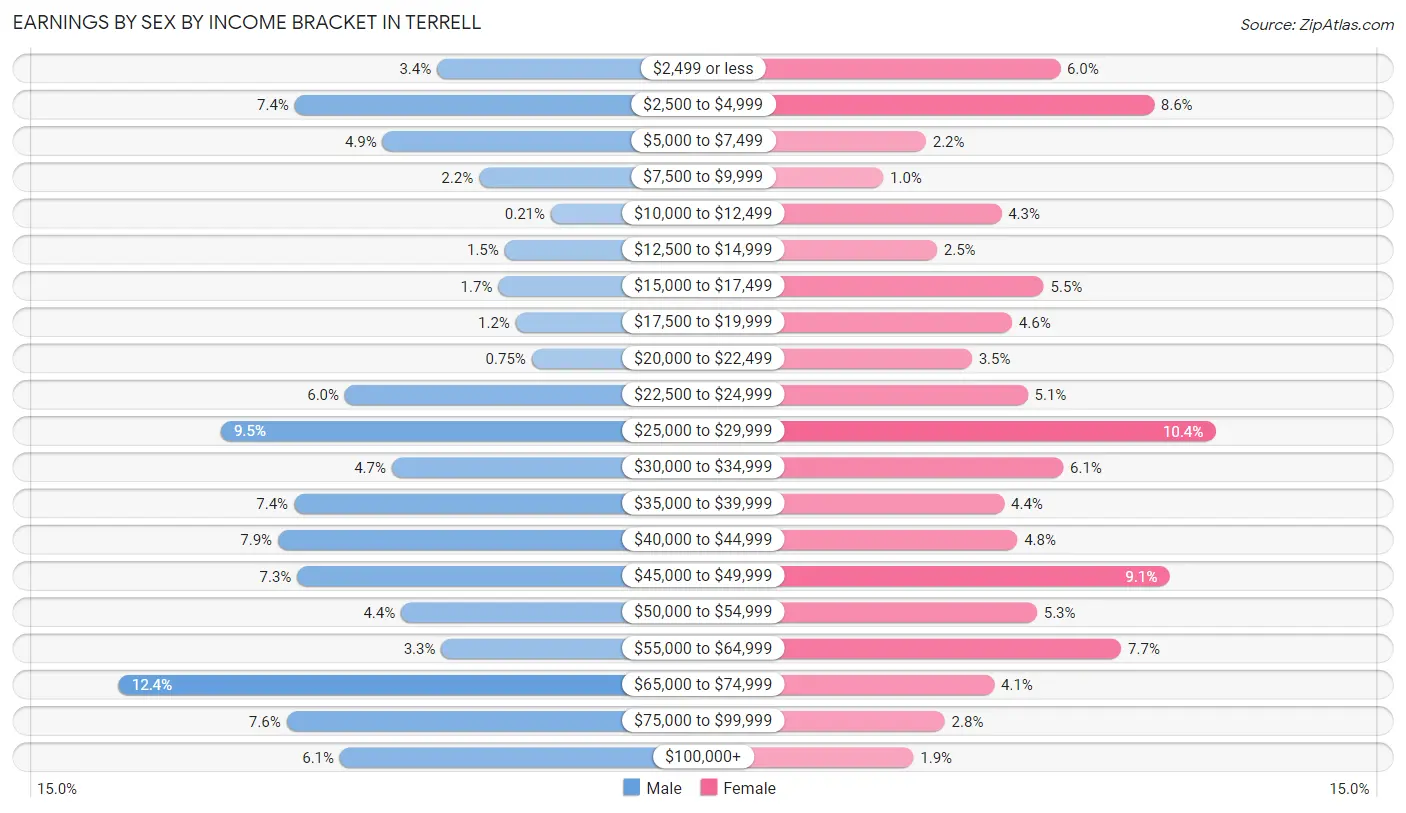
| Income | Male | Female |
| $2,499 or less | 145 (3.4%) | 275 (6.0%) |
| $2,500 to $4,999 | 315 (7.4%) | 396 (8.6%) |
| $5,000 to $7,499 | 210 (4.9%) | 102 (2.2%) |
| $7,500 to $9,999 | 95 (2.2%) | 47 (1.0%) |
| $10,000 to $12,499 | 9 (0.2%) | 199 (4.3%) |
| $12,500 to $14,999 | 64 (1.5%) | 116 (2.5%) |
| $15,000 to $17,499 | 72 (1.7%) | 254 (5.5%) |
| $17,500 to $19,999 | 51 (1.2%) | 213 (4.6%) |
| $20,000 to $22,499 | 32 (0.7%) | 161 (3.5%) |
| $22,500 to $24,999 | 255 (6.0%) | 233 (5.1%) |
| $25,000 to $29,999 | 403 (9.5%) | 475 (10.3%) |
| $30,000 to $34,999 | 199 (4.7%) | 279 (6.1%) |
| $35,000 to $39,999 | 316 (7.4%) | 203 (4.4%) |
| $40,000 to $44,999 | 335 (7.9%) | 220 (4.8%) |
| $45,000 to $49,999 | 312 (7.3%) | 416 (9.1%) |
| $50,000 to $54,999 | 188 (4.4%) | 245 (5.3%) |
| $55,000 to $64,999 | 140 (3.3%) | 354 (7.7%) |
| $65,000 to $74,999 | 525 (12.3%) | 190 (4.1%) |
| $75,000 to $99,999 | 325 (7.6%) | 126 (2.8%) |
| $100,000+ | 261 (6.1%) | 86 (1.9%) |
| Total | 4,252 (100.0%) | 4,590 (100.0%) |
Earnings by Sex by Educational Attainment in Terrell
Average earnings in Terrell are $42,285 for men and $33,421 for women, a difference of 21.0%. Men with an educational attainment of graduate degree enjoy the highest average annual earnings of $73,167, while those with less than high school education earn the least with $30,060. Women with an educational attainment of graduate degree earn the most with the average annual earnings of $52,083, while those with high school diploma education have the smallest earnings of $25,212.
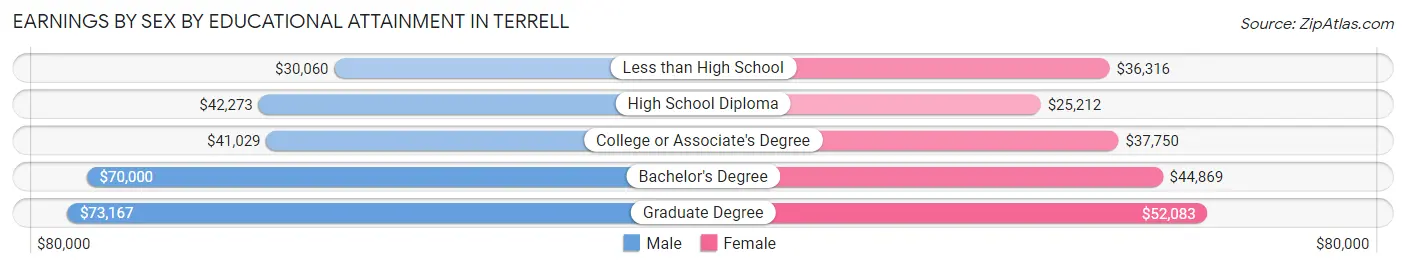
| Educational Attainment | Male Income | Female Income |
| Less than High School | $30,060 | $36,316 |
| High School Diploma | $42,273 | $25,212 |
| College or Associate's Degree | $41,029 | $37,750 |
| Bachelor's Degree | $70,000 | $44,869 |
| Graduate Degree | $73,167 | $52,083 |
| Total | $42,285 | $33,421 |
Family Income in Terrell
Family Income Brackets in Terrell
According to the Terrell family income data, there are 1,007 families falling into the $50,000 to $74,999 income range, which is the most common income bracket and makes up 23.3% of all families. Conversely, the $200,000+ income bracket is the least frequent group with only 147 families (3.4%) belonging to this category.
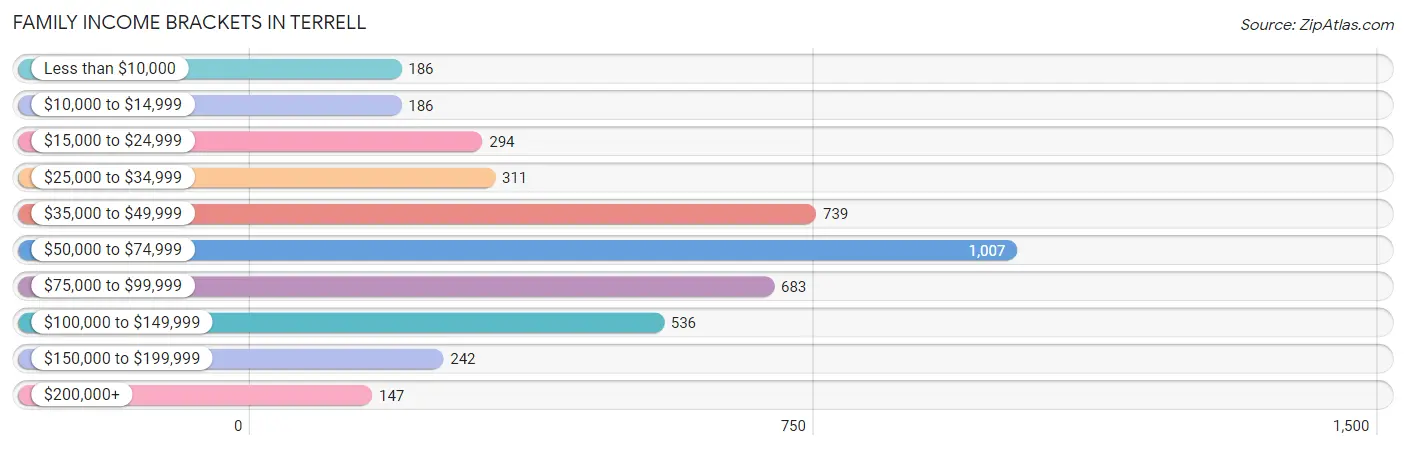
| Income Bracket | # Families | % Families |
| Less than $10,000 | 186 | 4.3% |
| $10,000 to $14,999 | 186 | 4.3% |
| $15,000 to $24,999 | 294 | 6.8% |
| $25,000 to $34,999 | 311 | 7.2% |
| $35,000 to $49,999 | 739 | 17.1% |
| $50,000 to $74,999 | 1,007 | 23.3% |
| $75,000 to $99,999 | 683 | 15.8% |
| $100,000 to $149,999 | 536 | 12.4% |
| $150,000 to $199,999 | 242 | 5.6% |
| $200,000+ | 147 | 3.4% |
Family Income by Famaliy Size in Terrell
4-person families (708 | 16.4%) account for the highest median family income in Terrell with $92,649 per family, while 2-person families (1,710 | 39.6%) have the highest median income of $30,933 per family member.
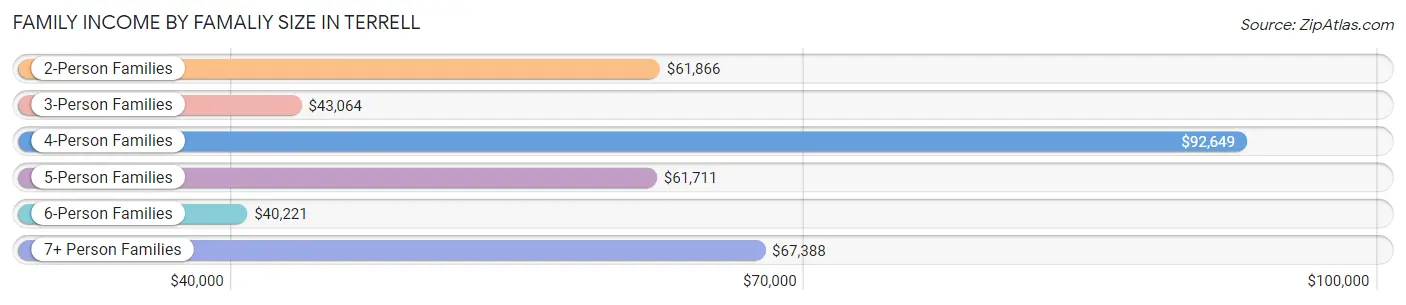
| Income Bracket | # Families | Median Income |
| 2-Person Families | 1,710 (39.6%) | $61,866 |
| 3-Person Families | 961 (22.2%) | $43,064 |
| 4-Person Families | 708 (16.4%) | $92,649 |
| 5-Person Families | 686 (15.9%) | $61,711 |
| 6-Person Families | 87 (2.0%) | $40,221 |
| 7+ Person Families | 170 (3.9%) | $67,388 |
| Total | 4,322 (100.0%) | $63,958 |
Family Income by Number of Earners in Terrell
The median family income in Terrell is $63,958, with families comprising 2 earners (1,459) having the highest median family income of $86,224, while families with no earners (653) have the lowest median family income of $37,734, accounting for 33.8% and 15.1% of families, respectively.
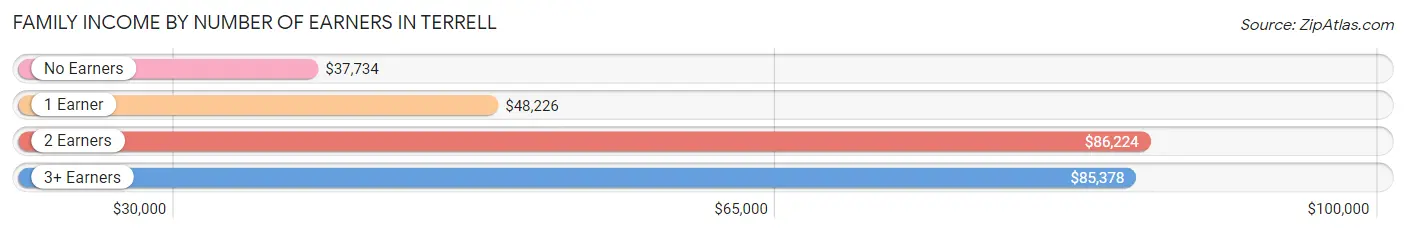
| Number of Earners | # Families | Median Income |
| No Earners | 653 (15.1%) | $37,734 |
| 1 Earner | 1,645 (38.1%) | $48,226 |
| 2 Earners | 1,459 (33.8%) | $86,224 |
| 3+ Earners | 565 (13.1%) | $85,378 |
| Total | 4,322 (100.0%) | $63,958 |
Household Income in Terrell
Household Income Brackets in Terrell
With 1,573 households falling in the category, the $50,000 to $74,999 income range is the most frequent in Terrell, accounting for 25.5% of all households. In contrast, only 173 households (2.8%) fall into the $200,000+ income bracket, making it the least populous group.
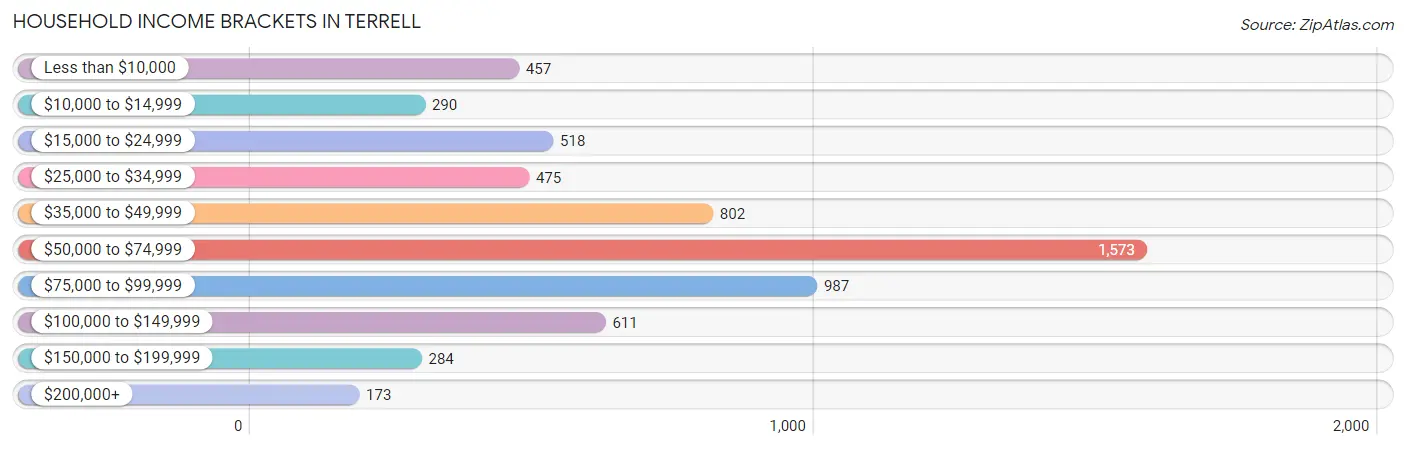
| Income Bracket | # Households | % Households |
| Less than $10,000 | 457 | 7.4% |
| $10,000 to $14,999 | 290 | 4.7% |
| $15,000 to $24,999 | 518 | 8.4% |
| $25,000 to $34,999 | 475 | 7.7% |
| $35,000 to $49,999 | 802 | 13.0% |
| $50,000 to $74,999 | 1,573 | 25.5% |
| $75,000 to $99,999 | 987 | 16.0% |
| $100,000 to $149,999 | 611 | 9.9% |
| $150,000 to $199,999 | 284 | 4.6% |
| $200,000+ | 173 | 2.8% |
Household Income by Householder Age in Terrell
The median household income in Terrell is $61,513, with the highest median household income of $64,856 found in the 25 to 44 years age bracket for the primary householder. A total of 1,943 households (31.5%) fall into this category. Meanwhile, the 65+ years age bracket for the primary householder has the lowest median household income of $52,917, with 1,806 households (29.3%) in this group.
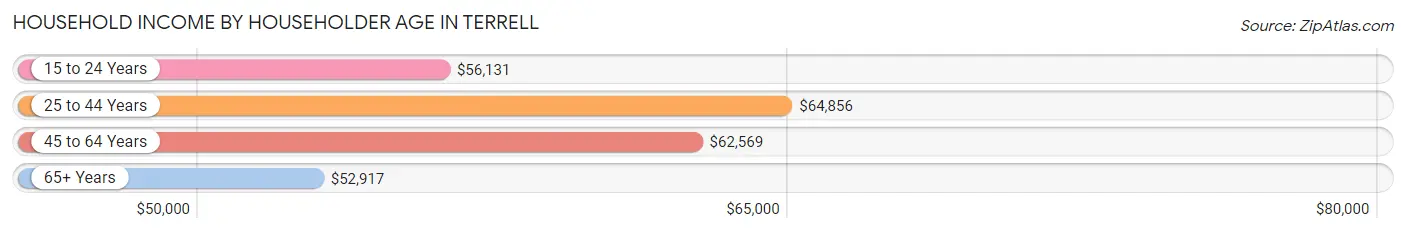
| Income Bracket | # Households | Median Income |
| 15 to 24 Years | 97 (1.6%) | $56,131 |
| 25 to 44 Years | 1,943 (31.5%) | $64,856 |
| 45 to 64 Years | 2,323 (37.7%) | $62,569 |
| 65+ Years | 1,806 (29.3%) | $52,917 |
| Total | 6,169 (100.0%) | $61,513 |
Poverty in Terrell
Income Below Poverty by Sex and Age in Terrell
With 15.1% poverty level for males and 19.9% for females among the residents of Terrell, 18 to 24 year old males and 16 and 17 year old females are the most vulnerable to poverty, with 189 males (31.9%) and 367 females (60.6%) in their respective age groups living below the poverty level.
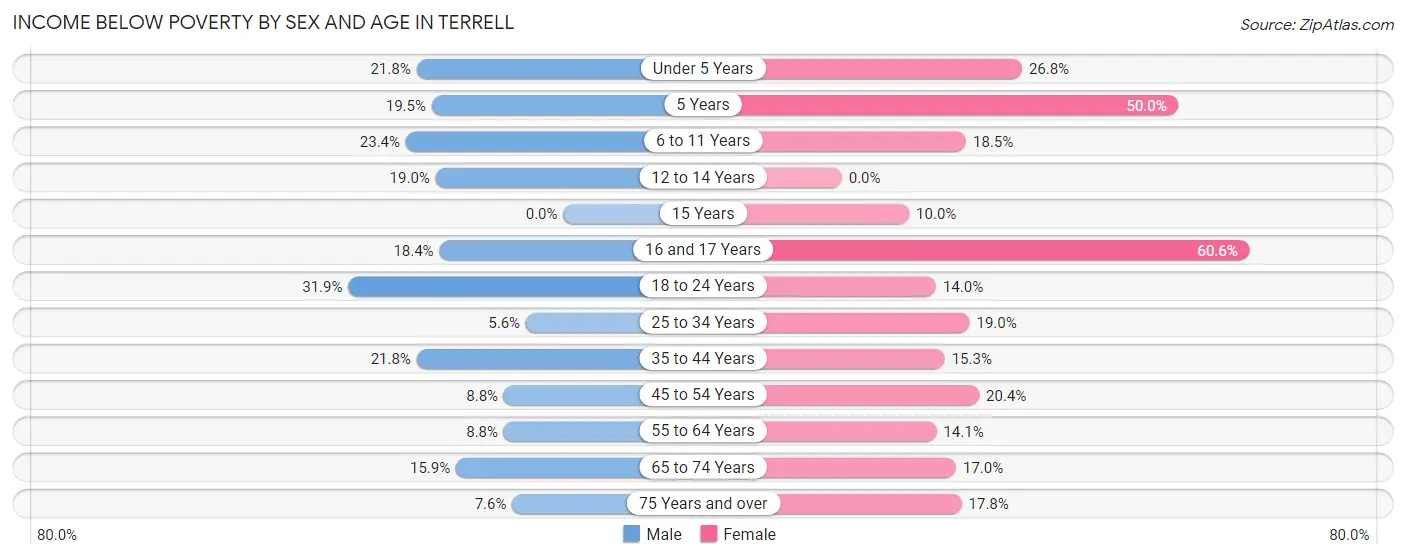
| Age Bracket | Male | Female |
| Under 5 Years | 89 (21.8%) | 195 (26.8%) |
| 5 Years | 17 (19.5%) | 9 (50.0%) |
| 6 to 11 Years | 171 (23.4%) | 163 (18.5%) |
| 12 to 14 Years | 102 (19.0%) | 0 (0.0%) |
| 15 Years | 0 (0.0%) | 18 (10.0%) |
| 16 and 17 Years | 30 (18.4%) | 367 (60.6%) |
| 18 to 24 Years | 189 (31.9%) | 95 (14.0%) |
| 25 to 34 Years | 60 (5.6%) | 292 (19.0%) |
| 35 to 44 Years | 193 (21.8%) | 148 (15.3%) |
| 45 to 54 Years | 85 (8.8%) | 209 (20.4%) |
| 55 to 64 Years | 86 (8.8%) | 140 (14.1%) |
| 65 to 74 Years | 94 (15.9%) | 168 (17.0%) |
| 75 Years and over | 37 (7.6%) | 153 (17.8%) |
| Total | 1,153 (15.1%) | 1,957 (19.9%) |
Income Above Poverty by Sex and Age in Terrell
According to the poverty statistics in Terrell, males aged 15 years and females aged 12 to 14 years are the age groups that are most secure financially, with 100.0% of males and 100.0% of females in these age groups living above the poverty line.
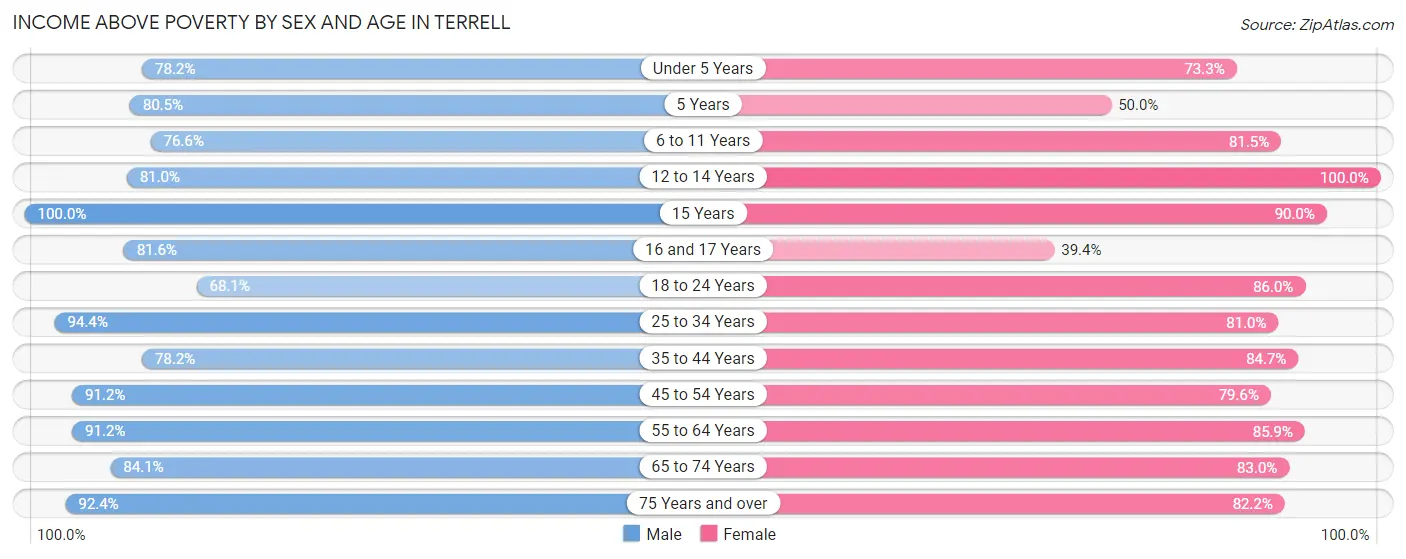
| Age Bracket | Male | Female |
| Under 5 Years | 319 (78.2%) | 534 (73.3%) |
| 5 Years | 70 (80.5%) | 9 (50.0%) |
| 6 to 11 Years | 560 (76.6%) | 720 (81.5%) |
| 12 to 14 Years | 436 (81.0%) | 342 (100.0%) |
| 15 Years | 146 (100.0%) | 162 (90.0%) |
| 16 and 17 Years | 133 (81.6%) | 239 (39.4%) |
| 18 to 24 Years | 403 (68.1%) | 584 (86.0%) |
| 25 to 34 Years | 1,020 (94.4%) | 1,247 (81.0%) |
| 35 to 44 Years | 693 (78.2%) | 820 (84.7%) |
| 45 to 54 Years | 879 (91.2%) | 816 (79.6%) |
| 55 to 64 Years | 888 (91.2%) | 856 (85.9%) |
| 65 to 74 Years | 496 (84.1%) | 822 (83.0%) |
| 75 Years and over | 451 (92.4%) | 707 (82.2%) |
| Total | 6,494 (84.9%) | 7,858 (80.1%) |
Income Below Poverty Among Married-Couple Families in Terrell
The poverty statistics for married-couple families in Terrell show that 10.4% or 268 of the total 2,572 families live below the poverty line. Families with 3 or 4 children have the highest poverty rate of 24.1%, comprising of 70 families. On the other hand, families with 5 or more children have the lowest poverty rate of 0.0%, which includes 0 families.
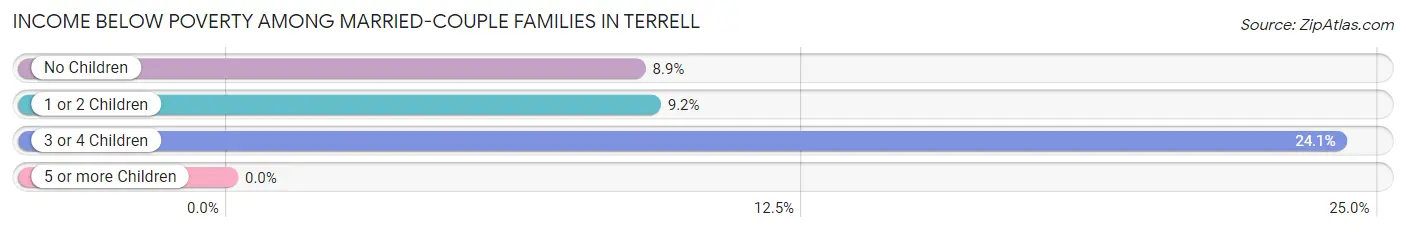
| Children | Above Poverty | Below Poverty |
| No Children | 1,038 (91.1%) | 101 (8.9%) |
| 1 or 2 Children | 957 (90.8%) | 97 (9.2%) |
| 3 or 4 Children | 220 (75.9%) | 70 (24.1%) |
| 5 or more Children | 89 (100.0%) | 0 (0.0%) |
| Total | 2,304 (89.6%) | 268 (10.4%) |
Income Below Poverty Among Single-Parent Households in Terrell
According to the poverty data in Terrell, 15.7% or 54 single-father households and 23.0% or 323 single-mother households are living below the poverty line. Among single-father households, those with 1 or 2 children have the highest poverty rate, with 54 households (30.9%) experiencing poverty. Likewise, among single-mother households, those with 1 or 2 children have the highest poverty rate, with 244 households (29.1%) falling below the poverty line.
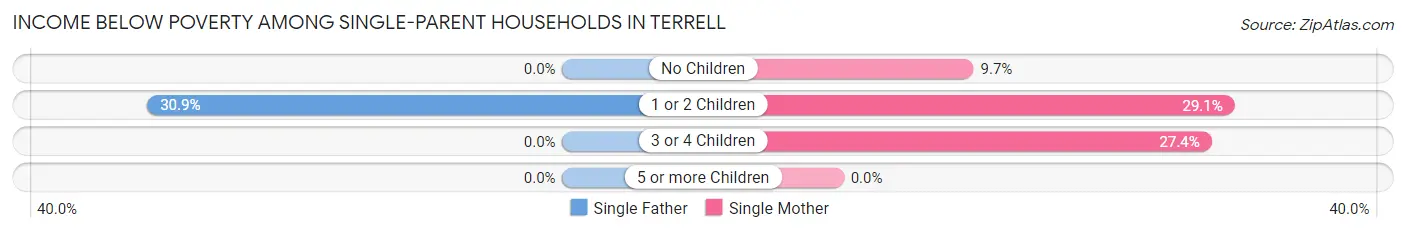
| Children | Single Father | Single Mother |
| No Children | 0 (0.0%) | 42 (9.7%) |
| 1 or 2 Children | 54 (30.9%) | 244 (29.1%) |
| 3 or 4 Children | 0 (0.0%) | 37 (27.4%) |
| 5 or more Children | 0 (0.0%) | 0 (0.0%) |
| Total | 54 (15.7%) | 323 (23.0%) |
Income Below Poverty Among Married-Couple vs Single-Parent Households in Terrell
The poverty data for Terrell shows that 268 of the married-couple family households (10.4%) and 377 of the single-parent households (21.5%) are living below the poverty level. Within the married-couple family households, those with 3 or 4 children have the highest poverty rate, with 70 households (24.1%) falling below the poverty line. Among the single-parent households, those with 1 or 2 children have the highest poverty rate, with 298 household (29.4%) living below poverty.
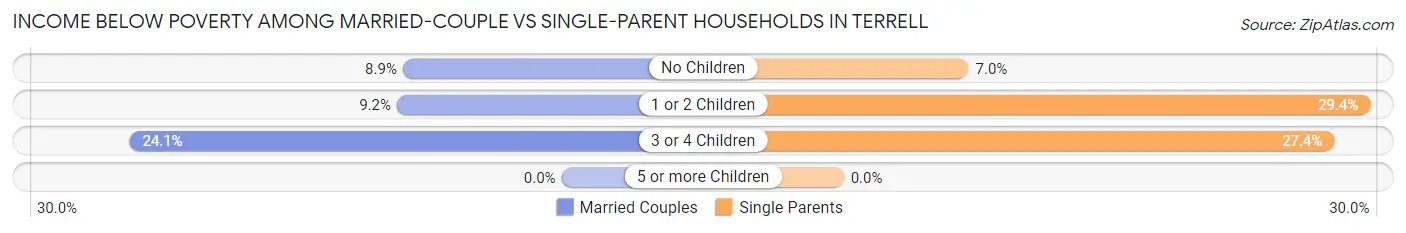
| Children | Married-Couple Families | Single-Parent Households |
| No Children | 101 (8.9%) | 42 (7.0%) |
| 1 or 2 Children | 97 (9.2%) | 298 (29.4%) |
| 3 or 4 Children | 70 (24.1%) | 37 (27.4%) |
| 5 or more Children | 0 (0.0%) | 0 (0.0%) |
| Total | 268 (10.4%) | 377 (21.5%) |
Race in Terrell
The most populous races in Terrell are White / Caucasian (10,074 | 56.0%), Hispanic or Latino (5,859 | 32.6%), and Black / African American (4,441 | 24.7%).
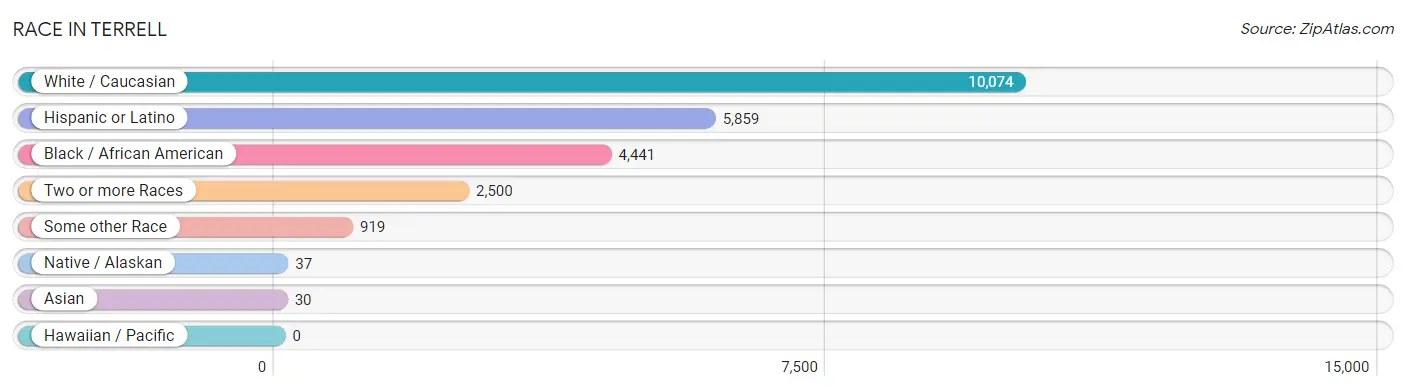
| Race | # Population | % Population |
| Asian | 30 | 0.2% |
| Black / African American | 4,441 | 24.7% |
| Hawaiian / Pacific | 0 | 0.0% |
| Hispanic or Latino | 5,859 | 32.6% |
| Native / Alaskan | 37 | 0.2% |
| White / Caucasian | 10,074 | 56.0% |
| Two or more Races | 2,500 | 13.9% |
| Some other Race | 919 | 5.1% |
| Total | 18,001 | 100.0% |
Ancestry in Terrell
The most populous ancestries reported in Terrell are Mexican (5,349 | 29.7%), Irish (1,146 | 6.4%), German (1,058 | 5.9%), English (822 | 4.6%), and American (772 | 4.3%), together accounting for 50.8% of all Terrell residents.
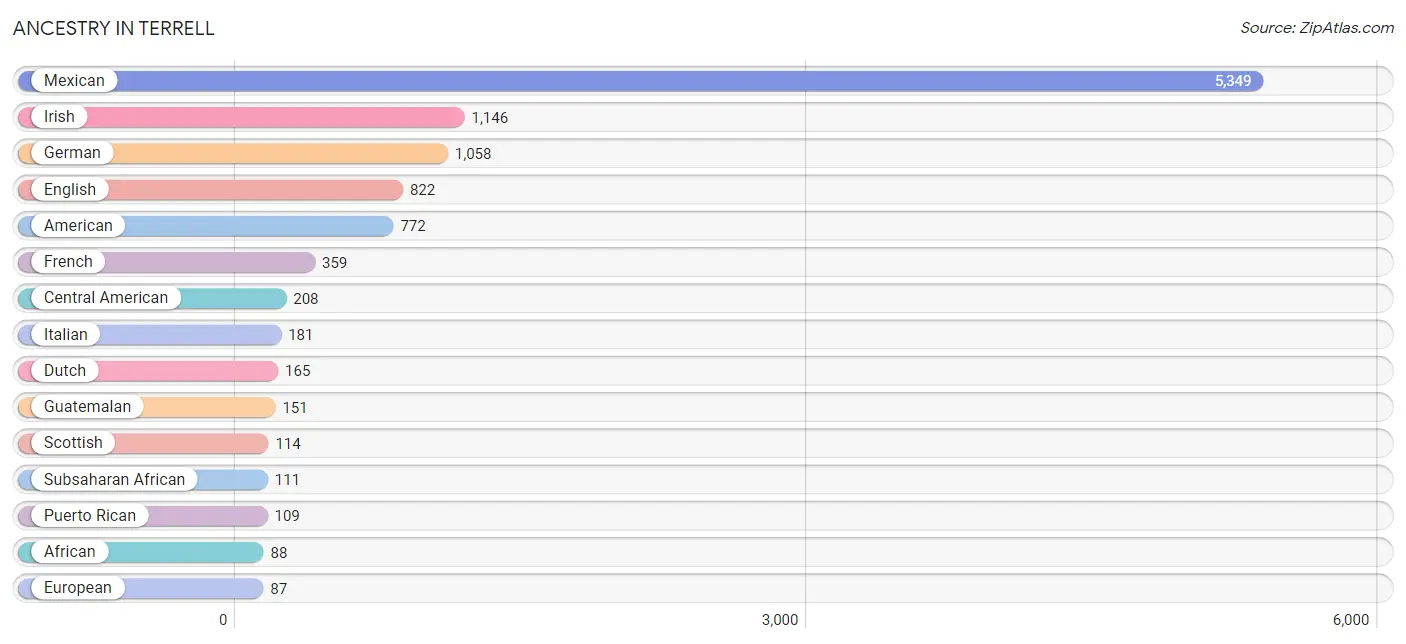
| Ancestry | # Population | % Population |
| African | 88 | 0.5% |
| American | 772 | 4.3% |
| Barbadian | 6 | 0.0% |
| British | 21 | 0.1% |
| British West Indian | 17 | 0.1% |
| Canadian | 6 | 0.0% |
| Central American | 208 | 1.2% |
| Cherokee | 37 | 0.2% |
| Chippewa | 16 | 0.1% |
| Creek | 11 | 0.1% |
| Croatian | 10 | 0.1% |
| Cuban | 20 | 0.1% |
| Czech | 27 | 0.2% |
| Dutch | 165 | 0.9% |
| English | 822 | 4.6% |
| European | 87 | 0.5% |
| French | 359 | 2.0% |
| French Canadian | 38 | 0.2% |
| German | 1,058 | 5.9% |
| Greek | 27 | 0.2% |
| Guamanian / Chamorro | 9 | 0.1% |
| Guatemalan | 151 | 0.8% |
| Indian (Asian) | 19 | 0.1% |
| Irish | 1,146 | 6.4% |
| Italian | 181 | 1.0% |
| Jamaican | 9 | 0.1% |
| Korean | 83 | 0.5% |
| Mexican | 5,349 | 29.7% |
| Nigerian | 23 | 0.1% |
| Norwegian | 36 | 0.2% |
| Panamanian | 57 | 0.3% |
| Polish | 10 | 0.1% |
| Puerto Rican | 109 | 0.6% |
| Russian | 54 | 0.3% |
| Scandinavian | 13 | 0.1% |
| Scotch-Irish | 75 | 0.4% |
| Scottish | 114 | 0.6% |
| Subsaharan African | 111 | 0.6% |
| Swedish | 38 | 0.2% |
| Swiss | 22 | 0.1% |
| Thai | 11 | 0.1% |
| Welsh | 37 | 0.2% | View All 42 Rows |
Immigrants in Terrell
The most numerous immigrant groups reported in Terrell came from Latin America (1,761 | 9.8%), Central America (1,743 | 9.7%), Mexico (1,651 | 9.2%), Guatemala (92 | 0.5%), and Europe (49 | 0.3%), together accounting for 29.4% of all Terrell residents.
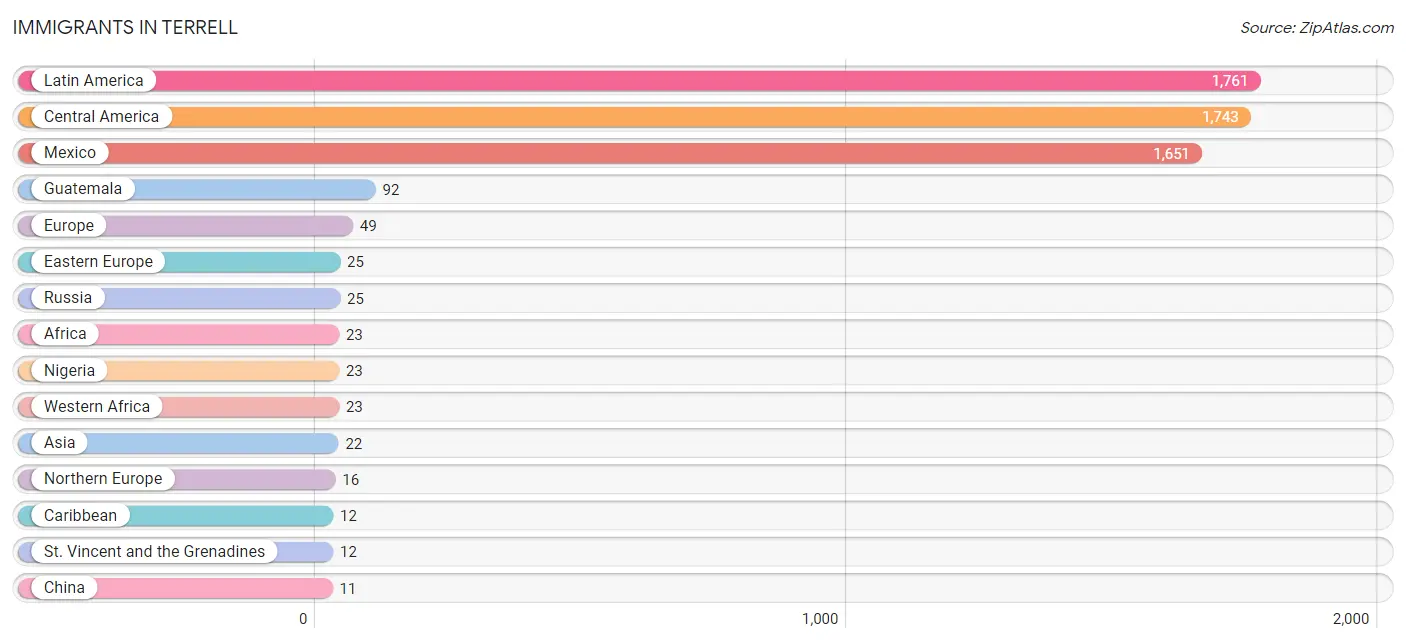
| Immigration Origin | # Population | % Population |
| Africa | 23 | 0.1% |
| Asia | 22 | 0.1% |
| Caribbean | 12 | 0.1% |
| Central America | 1,743 | 9.7% |
| Chile | 6 | 0.0% |
| China | 11 | 0.1% |
| Eastern Asia | 11 | 0.1% |
| Eastern Europe | 25 | 0.1% |
| England | 9 | 0.1% |
| Europe | 49 | 0.3% |
| Germany | 8 | 0.0% |
| Guatemala | 92 | 0.5% |
| Hong Kong | 11 | 0.1% |
| India | 11 | 0.1% |
| Latin America | 1,761 | 9.8% |
| Mexico | 1,651 | 9.2% |
| Nigeria | 23 | 0.1% |
| Northern Europe | 16 | 0.1% |
| Russia | 25 | 0.1% |
| South America | 6 | 0.0% |
| South Central Asia | 11 | 0.1% |
| St. Vincent and the Grenadines | 12 | 0.1% |
| Western Africa | 23 | 0.1% |
| Western Europe | 8 | 0.0% | View All 24 Rows |
Sex and Age in Terrell
Sex and Age in Terrell
The most populous age groups in Terrell are 10 to 14 Years (708 | 9.0%) for men and 15 to 19 Years (935 | 9.2%) for women.
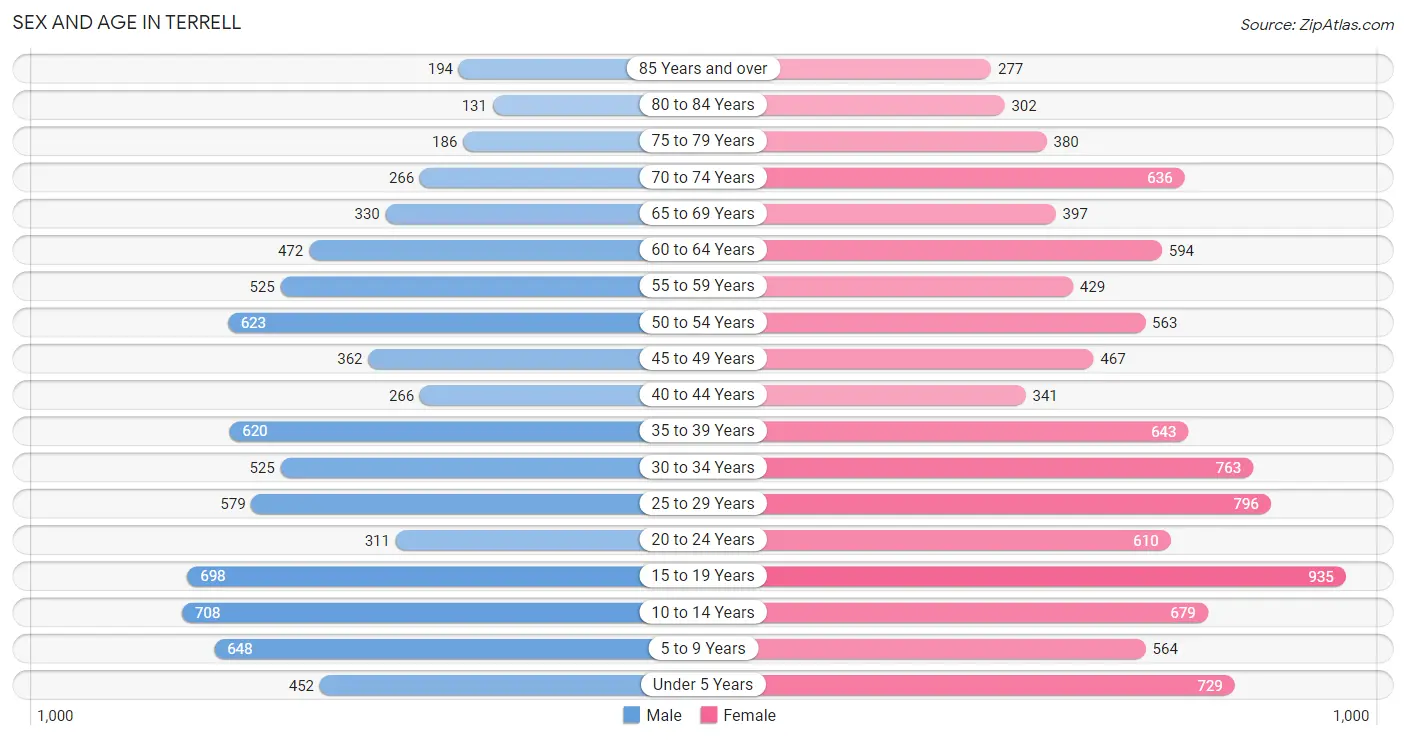
| Age Bracket | Male | Female |
| Under 5 Years | 452 (5.7%) | 729 (7.2%) |
| 5 to 9 Years | 648 (8.2%) | 564 (5.6%) |
| 10 to 14 Years | 708 (9.0%) | 679 (6.7%) |
| 15 to 19 Years | 698 (8.8%) | 935 (9.2%) |
| 20 to 24 Years | 311 (3.9%) | 610 (6.0%) |
| 25 to 29 Years | 579 (7.3%) | 796 (7.9%) |
| 30 to 34 Years | 525 (6.7%) | 763 (7.5%) |
| 35 to 39 Years | 620 (7.9%) | 643 (6.4%) |
| 40 to 44 Years | 266 (3.4%) | 341 (3.4%) |
| 45 to 49 Years | 362 (4.6%) | 467 (4.6%) |
| 50 to 54 Years | 623 (7.9%) | 563 (5.6%) |
| 55 to 59 Years | 525 (6.7%) | 429 (4.3%) |
| 60 to 64 Years | 472 (6.0%) | 594 (5.9%) |
| 65 to 69 Years | 330 (4.2%) | 397 (3.9%) |
| 70 to 74 Years | 266 (3.4%) | 636 (6.3%) |
| 75 to 79 Years | 186 (2.4%) | 380 (3.8%) |
| 80 to 84 Years | 131 (1.7%) | 302 (3.0%) |
| 85 Years and over | 194 (2.5%) | 277 (2.7%) |
| Total | 7,896 (100.0%) | 10,105 (100.0%) |
Families and Households in Terrell
Median Family Size in Terrell
The median family size in Terrell is 3.43 persons per family, with married-couple families (2,572 | 59.5%) accounting for the largest median family size of 3.69 persons per family. On the other hand, single male/father families (343 | 7.9%) represent the smallest median family size with 2.78 persons per family.
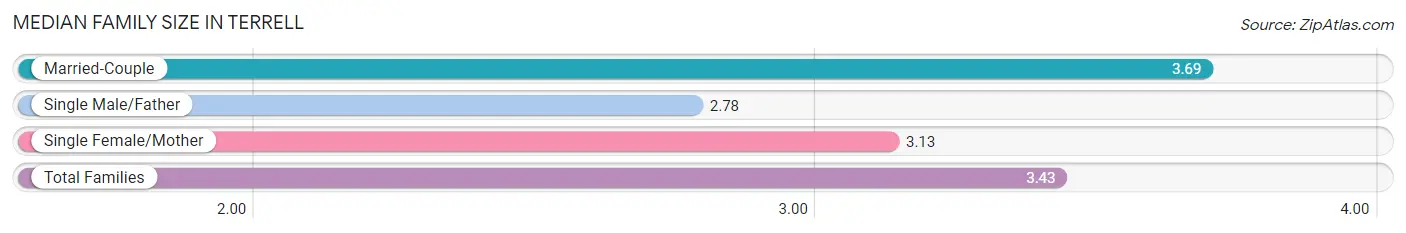
| Family Type | # Families | Family Size |
| Married-Couple | 2,572 (59.5%) | 3.69 |
| Single Male/Father | 343 (7.9%) | 2.78 |
| Single Female/Mother | 1,407 (32.6%) | 3.13 |
| Total Families | 4,322 (100.0%) | 3.43 |
Median Household Size in Terrell
The median household size in Terrell is 2.82 persons per household, with married-couple households (2,572 | 41.7%) accounting for the largest median household size of 3.72 persons per household. non-family households (1,847 | 29.9%) represent the smallest median household size with 1.17 persons per household.
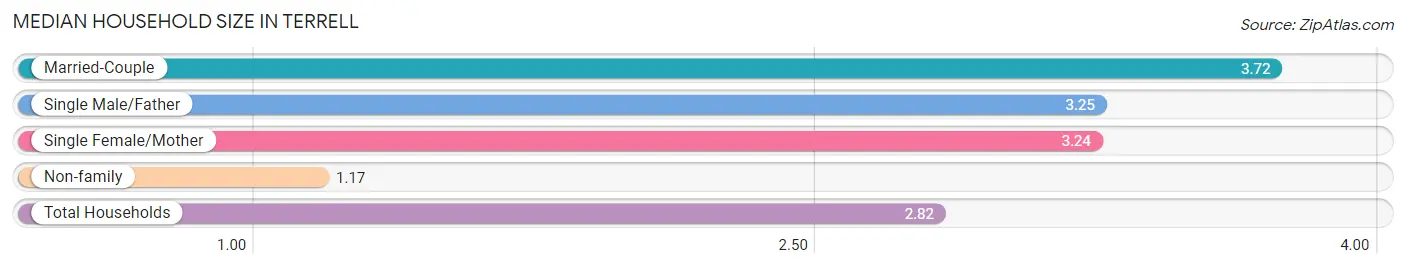
| Household Type | # Households | Household Size |
| Married-Couple | 2,572 (41.7%) | 3.72 |
| Single Male/Father | 343 (5.6%) | 3.25 |
| Single Female/Mother | 1,407 (22.8%) | 3.24 |
| Non-family | 1,847 (29.9%) | 1.17 |
| Total Households | 6,169 (100.0%) | 2.82 |
Household Size by Marriage Status in Terrell
Out of a total of 6,169 households in Terrell, 4,322 (70.1%) are family households, while 1,847 (29.9%) are nonfamily households. The most numerous type of family households are 2-person households, comprising 1,627, and the most common type of nonfamily households are 1-person households, comprising 1,562.
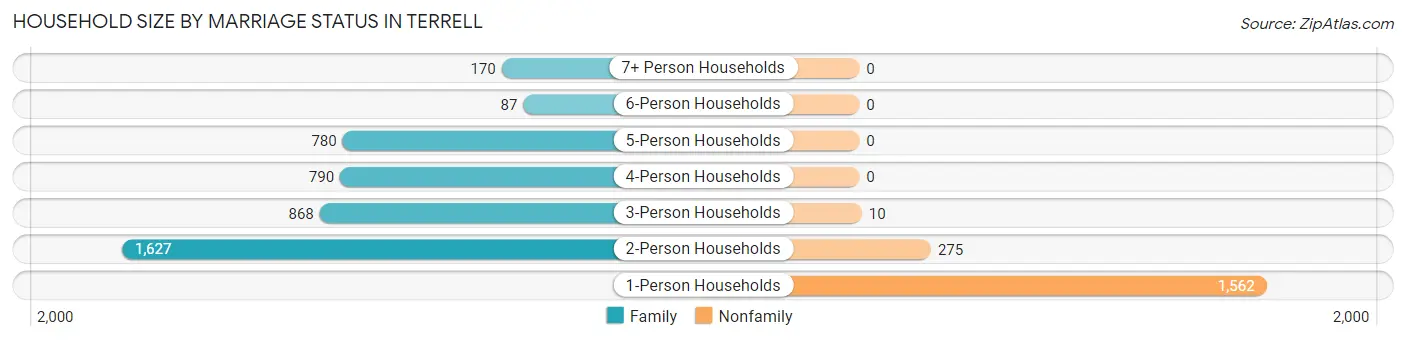
| Household Size | Family Households | Nonfamily Households |
| 1-Person Households | - | 1,562 (25.3%) |
| 2-Person Households | 1,627 (26.4%) | 275 (4.5%) |
| 3-Person Households | 868 (14.1%) | 10 (0.2%) |
| 4-Person Households | 790 (12.8%) | 0 (0.0%) |
| 5-Person Households | 780 (12.6%) | 0 (0.0%) |
| 6-Person Households | 87 (1.4%) | 0 (0.0%) |
| 7+ Person Households | 170 (2.8%) | 0 (0.0%) |
| Total | 4,322 (70.1%) | 1,847 (29.9%) |
Female Fertility in Terrell
Fertility by Age in Terrell
Average fertility rate in Terrell is 37.0 births per 1,000 women. Women in the age bracket of 20 to 34 years have the highest fertility rate with 70.0 births per 1,000 women. Women in the age bracket of 20 to 34 years acount for 88.8% of all women with births.
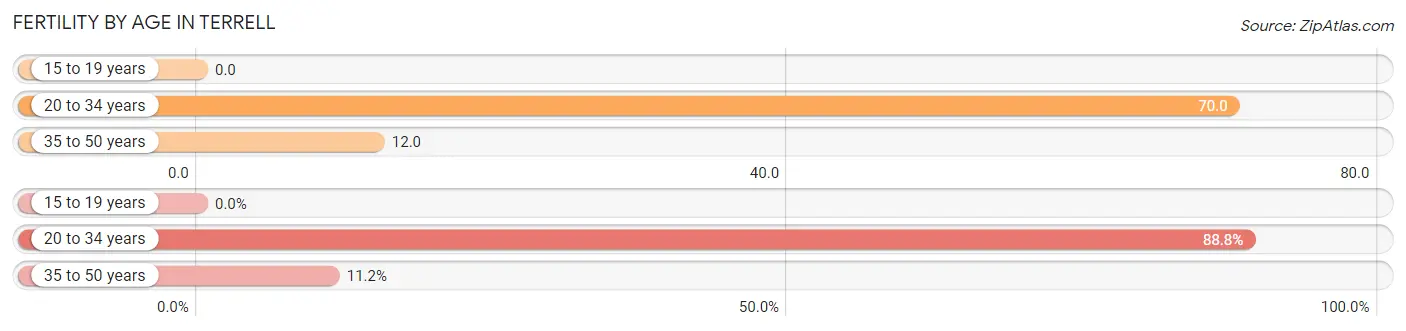
| Age Bracket | Women with Births | Births / 1,000 Women |
| 15 to 19 years | 0 (0.0%) | 0.0 |
| 20 to 34 years | 151 (88.8%) | 70.0 |
| 35 to 50 years | 19 (11.2%) | 12.0 |
| Total | 170 (100.0%) | 37.0 |
Fertility by Age by Marriage Status in Terrell
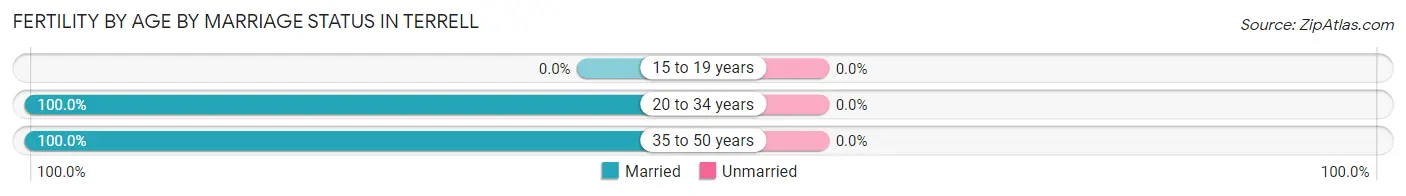
| Age Bracket | Married | Unmarried |
| 15 to 19 years | 0 (0.0%) | 0 (0.0%) |
| 20 to 34 years | 151 (100.0%) | 0 (0.0%) |
| 35 to 50 years | 19 (100.0%) | 0 (0.0%) |
| Total | 170 (100.0%) | 0 (0.0%) |
Fertility by Education in Terrell
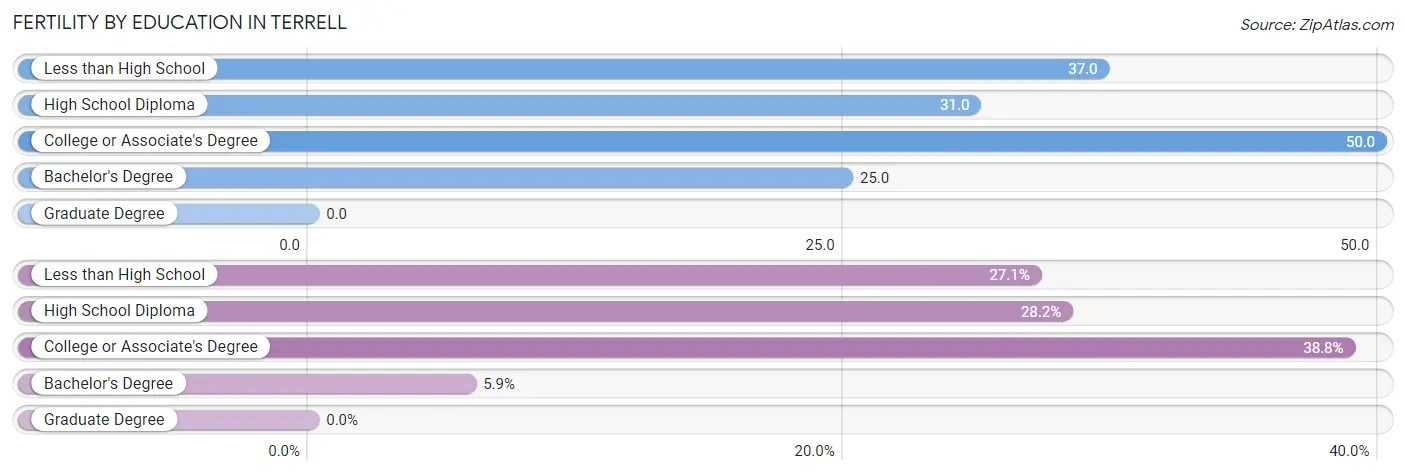
| Educational Attainment | Women with Births | Births / 1,000 Women |
| Less than High School | 46 (27.1%) | 37.0 |
| High School Diploma | 48 (28.2%) | 31.0 |
| College or Associate's Degree | 66 (38.8%) | 50.0 |
| Bachelor's Degree | 10 (5.9%) | 25.0 |
| Graduate Degree | 0 (0.0%) | 0.0 |
| Total | 170 (100.0%) | 37.0 |
Fertility by Education by Marriage Status in Terrell
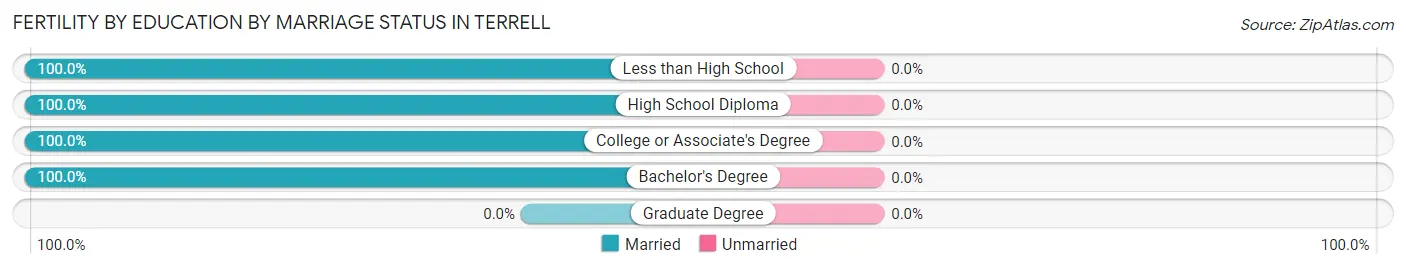
| Educational Attainment | Married | Unmarried |
| Less than High School | 46 (100.0%) | 0 (0.0%) |
| High School Diploma | 48 (100.0%) | 0 (0.0%) |
| College or Associate's Degree | 66 (100.0%) | 0 (0.0%) |
| Bachelor's Degree | 10 (100.0%) | 0 (0.0%) |
| Graduate Degree | 0 (0.0%) | 0 (0.0%) |
| Total | 170 (100.0%) | 0 (0.0%) |
Employment Characteristics in Terrell
Employment by Class of Employer in Terrell
Among the 7,696 employed individuals in Terrell, private company employees (5,510 | 71.6%), local government employees (636 | 8.3%), and state government employees (474 | 6.2%) make up the most common classes of employment.
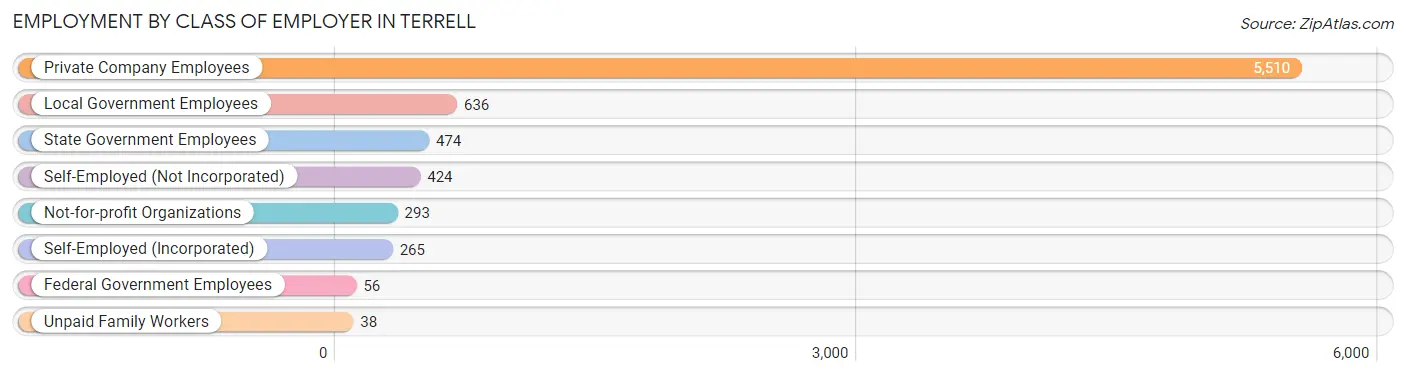
| Employer Class | # Employees | % Employees |
| Private Company Employees | 5,510 | 71.6% |
| Self-Employed (Incorporated) | 265 | 3.4% |
| Self-Employed (Not Incorporated) | 424 | 5.5% |
| Not-for-profit Organizations | 293 | 3.8% |
| Local Government Employees | 636 | 8.3% |
| State Government Employees | 474 | 6.2% |
| Federal Government Employees | 56 | 0.7% |
| Unpaid Family Workers | 38 | 0.5% |
| Total | 7,696 | 100.0% |
Employment Status by Age in Terrell
According to the labor force statistics for Terrell, out of the total population over 16 years of age (13,895), 60.7% or 8,434 individuals are in the labor force, with 5.6% or 472 of them unemployed. The age group with the highest labor force participation rate is 25 to 29 years, with 87.6% or 1,204 individuals in the labor force. Within the labor force, the 16 to 19 years age range has the highest percentage of unemployed individuals, with 20.4% or 102 of them being unemployed.
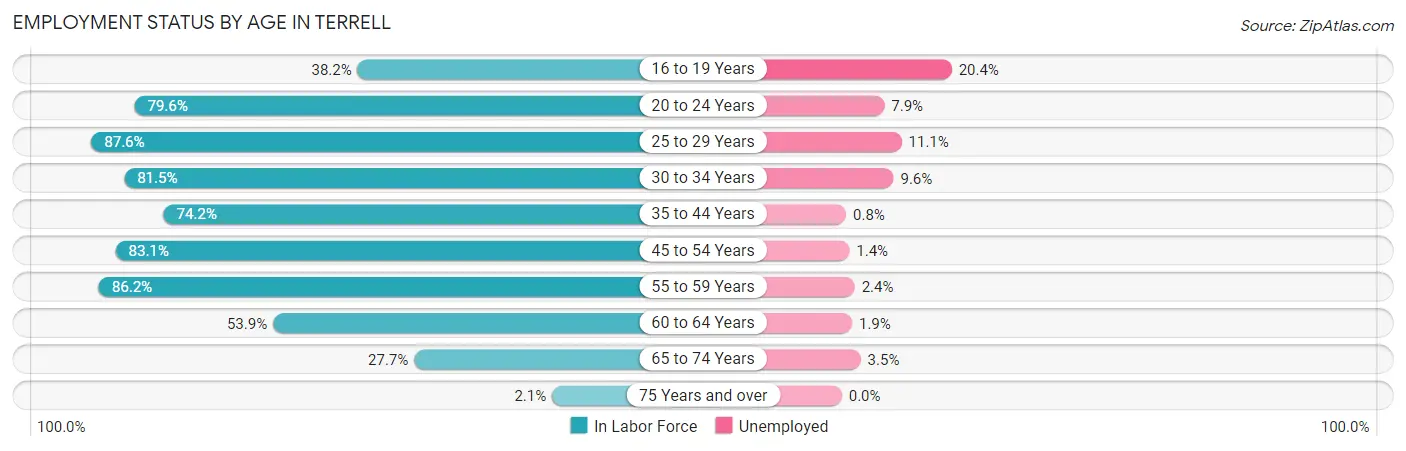
| Age Bracket | In Labor Force | Unemployed |
| 16 to 19 Years | 499 (38.2%) | 102 (20.4%) |
| 20 to 24 Years | 733 (79.6%) | 58 (7.9%) |
| 25 to 29 Years | 1,204 (87.6%) | 134 (11.1%) |
| 30 to 34 Years | 1,050 (81.5%) | 101 (9.6%) |
| 35 to 44 Years | 1,388 (74.2%) | 11 (0.8%) |
| 45 to 54 Years | 1,674 (83.1%) | 23 (1.4%) |
| 55 to 59 Years | 822 (86.2%) | 20 (2.4%) |
| 60 to 64 Years | 575 (53.9%) | 11 (1.9%) |
| 65 to 74 Years | 451 (27.7%) | 16 (3.5%) |
| 75 Years and over | 31 (2.1%) | 0 (0.0%) |
| Total | 8,434 (60.7%) | 472 (5.6%) |
Employment Status by Educational Attainment in Terrell
According to labor force statistics for Terrell, 78.4% of individuals (6,717) out of the total population between 25 and 64 years of age (8,568) are in the labor force, with 4.5% or 302 of them being unemployed. The group with the highest labor force participation rate are those with the educational attainment of college / associate degree, with 89.3% or 2,376 individuals in the labor force. Within the labor force, individuals with less than high school education have the highest percentage of unemployment, with 10.9% or 100 of them being unemployed.
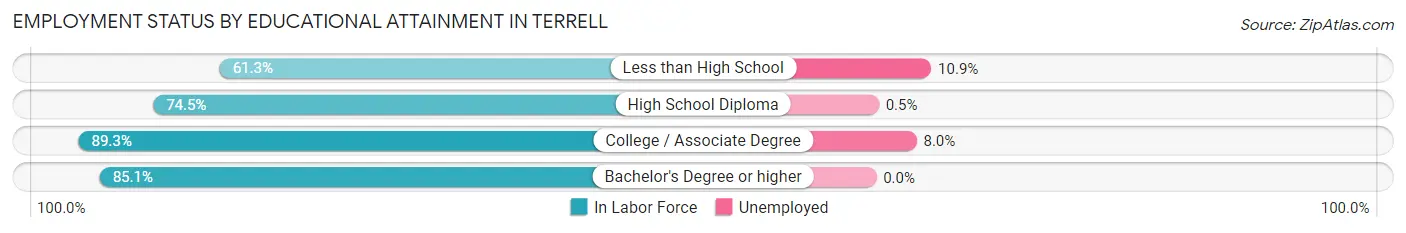
| Educational Attainment | In Labor Force | Unemployed |
| Less than High School | 916 (61.3%) | 163 (10.9%) |
| High School Diploma | 2,351 (74.5%) | 16 (0.5%) |
| College / Associate Degree | 2,376 (89.3%) | 213 (8.0%) |
| Bachelor's Degree or higher | 1,070 (85.1%) | 0 (0.0%) |
| Total | 6,717 (78.4%) | 386 (4.5%) |
Employment Occupations by Sex in Terrell
Management, Business, Science and Arts Occupations
The most common Management, Business, Science and Arts occupations in Terrell are Management (628 | 7.9%), Community & Social Service (628 | 7.9%), Education Instruction & Library (428 | 5.4%), Business & Financial (350 | 4.4%), and Health Diagnosing & Treating (287 | 3.6%).
Management, Business, Science and Arts Occupations by Sex
Within the Management, Business, Science and Arts occupations in Terrell, the most male-oriented occupations are Computers & Mathematics (100.0%), Life, Physical & Social Science (100.0%), and Computers, Engineering & Science (90.1%), while the most female-oriented occupations are Health Technologists (100.0%), Health Diagnosing & Treating (92.0%), and Education Instruction & Library (81.3%).
| Occupation | Male | Female |
| Management | 446 (71.0%) | 182 (29.0%) |
| Business & Financial | 177 (50.6%) | 173 (49.4%) |
| Computers, Engineering & Science | 109 (90.1%) | 12 (9.9%) |
| Computers & Mathematics | 72 (100.0%) | 0 (0.0%) |
| Architecture & Engineering | 20 (62.5%) | 12 (37.5%) |
| Life, Physical & Social Science | 17 (100.0%) | 0 (0.0%) |
| Community & Social Service | 190 (30.2%) | 438 (69.8%) |
| Education, Arts & Media | 43 (50.6%) | 42 (49.4%) |
| Legal Services & Support | 42 (63.6%) | 24 (36.4%) |
| Education Instruction & Library | 80 (18.7%) | 348 (81.3%) |
| Arts, Media & Entertainment | 25 (51.0%) | 24 (49.0%) |
| Health Diagnosing & Treating | 23 (8.0%) | 264 (92.0%) |
| Health Technologists | 0 (0.0%) | 94 (100.0%) |
| Total (Category) | 945 (46.9%) | 1,069 (53.1%) |
| Total (Overall) | 4,017 (50.5%) | 3,936 (49.5%) |
Services Occupations
The most common Services occupations in Terrell are Food Preparation & Serving (641 | 8.1%), Healthcare Support (385 | 4.8%), Security & Protection (373 | 4.7%), Firefighting & Prevention (248 | 3.1%), and Cleaning & Maintenance (192 | 2.4%).
Services Occupations by Sex
Within the Services occupations in Terrell, the most male-oriented occupations are Personal Care & Service (83.3%), Food Preparation & Serving (49.9%), and Law Enforcement (38.4%), while the most female-oriented occupations are Healthcare Support (86.2%), Firefighting & Prevention (67.3%), and Security & Protection (65.4%).
| Occupation | Male | Female |
| Healthcare Support | 53 (13.8%) | 332 (86.2%) |
| Security & Protection | 129 (34.6%) | 244 (65.4%) |
| Firefighting & Prevention | 81 (32.7%) | 167 (67.3%) |
| Law Enforcement | 48 (38.4%) | 77 (61.6%) |
| Food Preparation & Serving | 320 (49.9%) | 321 (50.1%) |
| Cleaning & Maintenance | 72 (37.5%) | 120 (62.5%) |
| Personal Care & Service | 90 (83.3%) | 18 (16.7%) |
| Total (Category) | 664 (39.1%) | 1,035 (60.9%) |
| Total (Overall) | 4,017 (50.5%) | 3,936 (49.5%) |
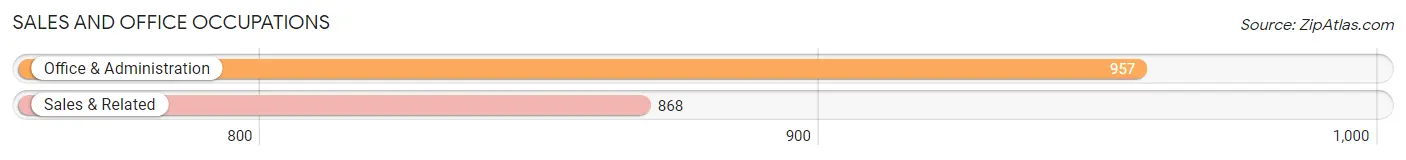
Sales and Office Occupations
The most common Sales and Office occupations in Terrell are Office & Administration (957 | 12.0%), and Sales & Related (868 | 10.9%).
Sales and Office Occupations by Sex
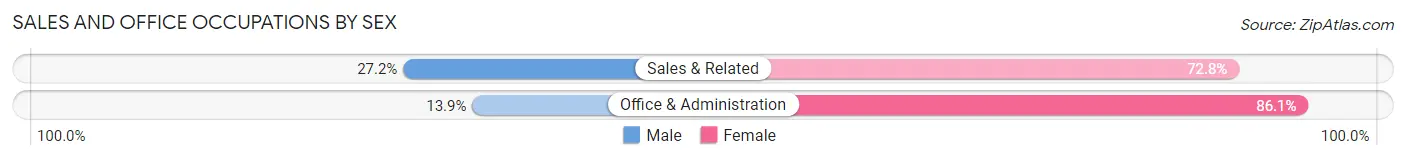
| Occupation | Male | Female |
| Sales & Related | 236 (27.2%) | 632 (72.8%) |
| Office & Administration | 133 (13.9%) | 824 (86.1%) |
| Total (Category) | 369 (20.2%) | 1,456 (79.8%) |
| Total (Overall) | 4,017 (50.5%) | 3,936 (49.5%) |
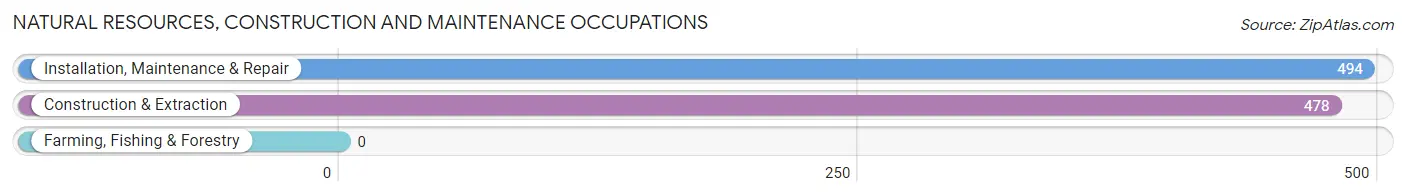
Natural Resources, Construction and Maintenance Occupations
The most common Natural Resources, Construction and Maintenance occupations in Terrell are Installation, Maintenance & Repair (494 | 6.2%), and Construction & Extraction (478 | 6.0%).
Natural Resources, Construction and Maintenance Occupations by Sex
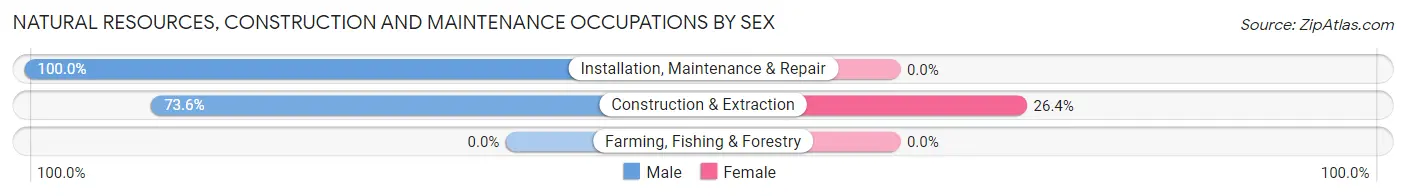
| Occupation | Male | Female |
| Farming, Fishing & Forestry | 0 (0.0%) | 0 (0.0%) |
| Construction & Extraction | 352 (73.6%) | 126 (26.4%) |
| Installation, Maintenance & Repair | 494 (100.0%) | 0 (0.0%) |
| Total (Category) | 846 (87.0%) | 126 (13.0%) |
| Total (Overall) | 4,017 (50.5%) | 3,936 (49.5%) |
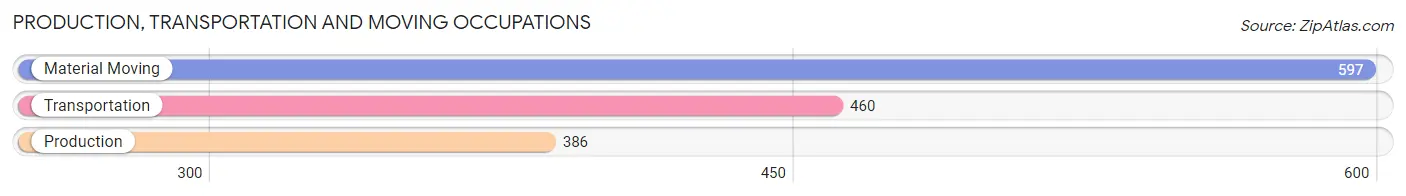
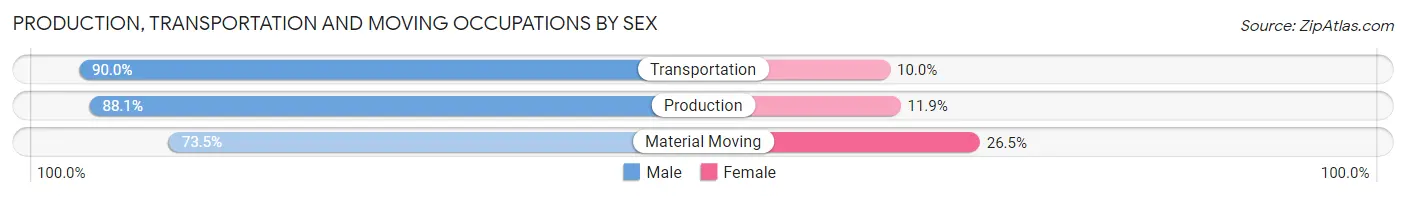
Production, Transportation and Moving Occupations
The most common Production, Transportation and Moving occupations in Terrell are Material Moving (597 | 7.5%), Transportation (460 | 5.8%), and Production (386 | 4.9%).
Production, Transportation and Moving Occupations by Sex
| Occupation | Male | Female |
| Production | 340 (88.1%) | 46 (11.9%) |
| Transportation | 414 (90.0%) | 46 (10.0%) |
| Material Moving | 439 (73.5%) | 158 (26.5%) |
| Total (Category) | 1,193 (82.7%) | 250 (17.3%) |
| Total (Overall) | 4,017 (50.5%) | 3,936 (49.5%) |
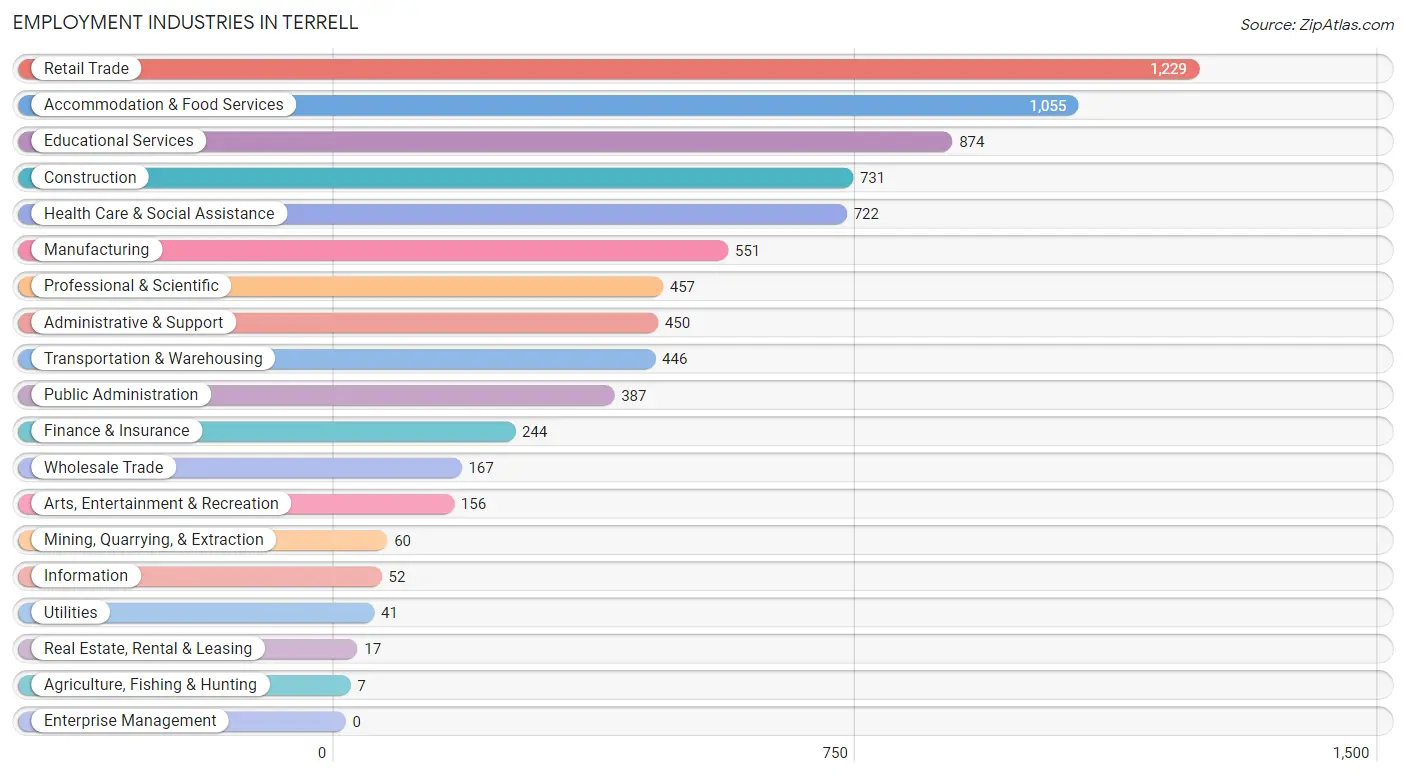
Employment Industries by Sex in Terrell
Employment Industries in Terrell
The major employment industries in Terrell include Retail Trade (1,229 | 15.4%), Accommodation & Food Services (1,055 | 13.3%), Educational Services (874 | 11.0%), Construction (731 | 9.2%), and Health Care & Social Assistance (722 | 9.1%).
Employment Industries by Sex in Terrell
The Terrell industries that see more men than women are Agriculture, Fishing & Hunting (100.0%), Mining, Quarrying, & Extraction (100.0%), and Utilities (100.0%), whereas the industries that tend to have a higher number of women are Arts, Entertainment & Recreation (89.7%), Health Care & Social Assistance (81.6%), and Professional & Scientific (75.7%).
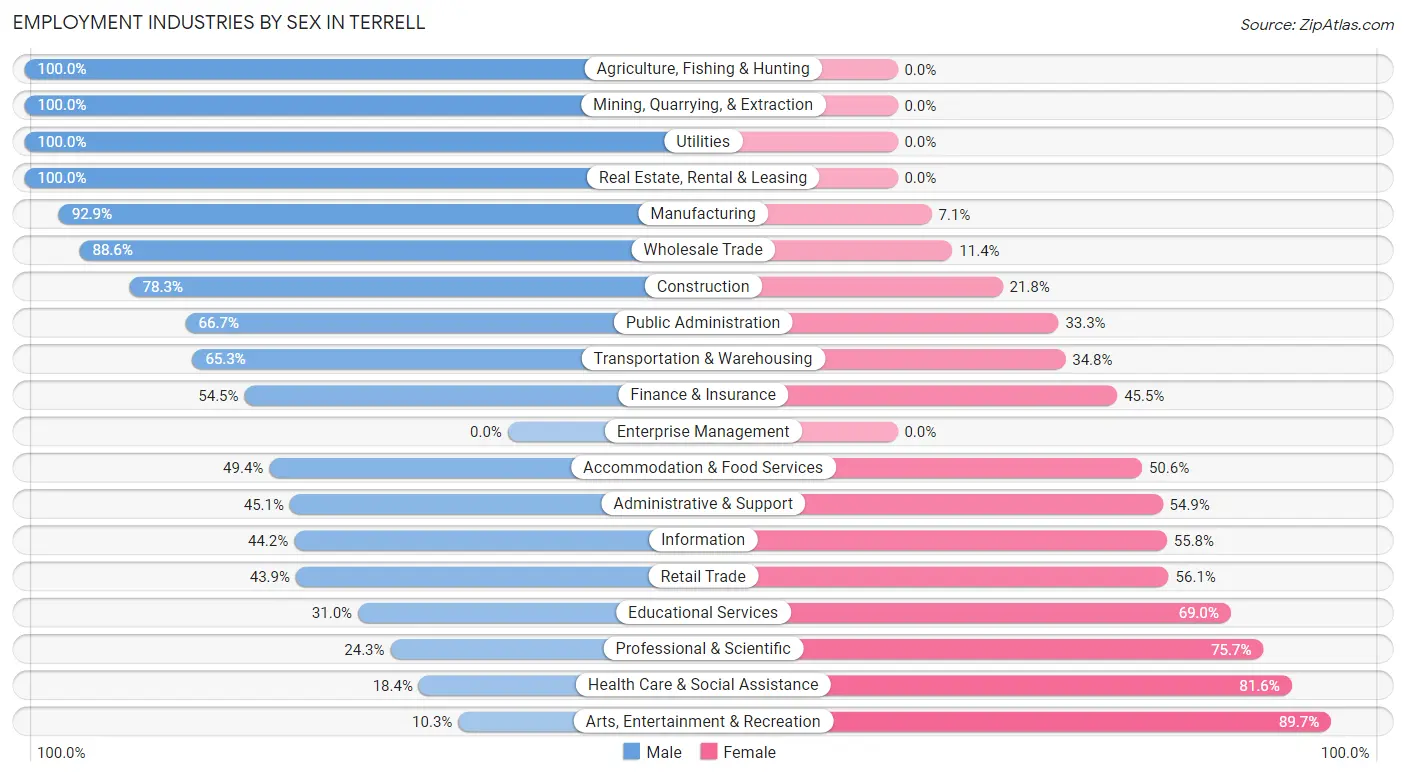
| Industry | Male | Female |
| Agriculture, Fishing & Hunting | 7 (100.0%) | 0 (0.0%) |
| Mining, Quarrying, & Extraction | 60 (100.0%) | 0 (0.0%) |
| Construction | 572 (78.2%) | 159 (21.7%) |
| Manufacturing | 512 (92.9%) | 39 (7.1%) |
| Wholesale Trade | 148 (88.6%) | 19 (11.4%) |
| Retail Trade | 539 (43.9%) | 690 (56.1%) |
| Transportation & Warehousing | 291 (65.2%) | 155 (34.7%) |
| Utilities | 41 (100.0%) | 0 (0.0%) |
| Information | 23 (44.2%) | 29 (55.8%) |
| Finance & Insurance | 133 (54.5%) | 111 (45.5%) |
| Real Estate, Rental & Leasing | 17 (100.0%) | 0 (0.0%) |
| Professional & Scientific | 111 (24.3%) | 346 (75.7%) |
| Enterprise Management | 0 (0.0%) | 0 (0.0%) |
| Administrative & Support | 203 (45.1%) | 247 (54.9%) |
| Educational Services | 271 (31.0%) | 603 (69.0%) |
| Health Care & Social Assistance | 133 (18.4%) | 589 (81.6%) |
| Arts, Entertainment & Recreation | 16 (10.3%) | 140 (89.7%) |
| Accommodation & Food Services | 521 (49.4%) | 534 (50.6%) |
| Public Administration | 258 (66.7%) | 129 (33.3%) |
| Total | 4,017 (50.5%) | 3,936 (49.5%) |
Education in Terrell
School Enrollment in Terrell
The most common levels of schooling among the 4,847 students in Terrell are high school (1,384 | 28.5%), middle school (1,219 | 25.2%), and elementary school (1,013 | 20.9%).
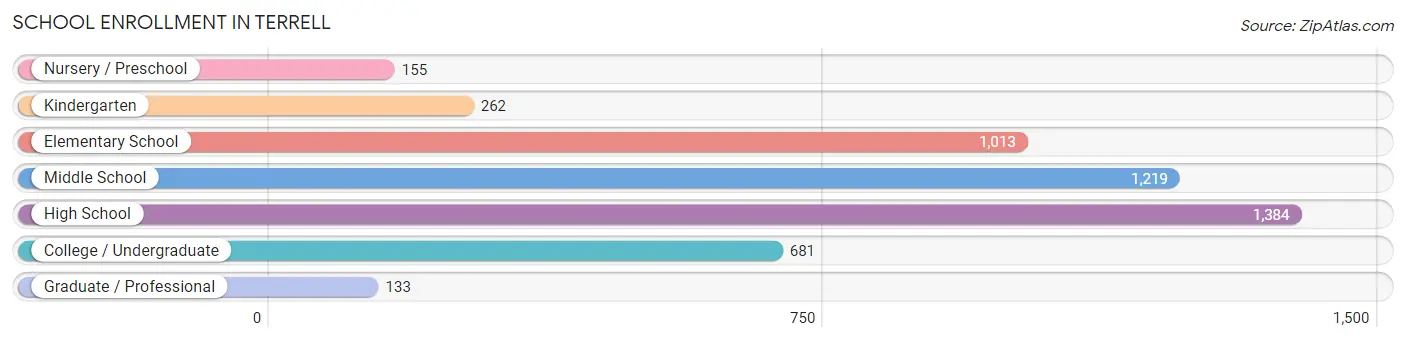
| School Level | # Students | % Students |
| Nursery / Preschool | 155 | 3.2% |
| Kindergarten | 262 | 5.4% |
| Elementary School | 1,013 | 20.9% |
| Middle School | 1,219 | 25.2% |
| High School | 1,384 | 28.5% |
| College / Undergraduate | 681 | 14.1% |
| Graduate / Professional | 133 | 2.7% |
| Total | 4,847 | 100.0% |
School Enrollment by Age by Funding Source in Terrell
Out of a total of 4,847 students who are enrolled in schools in Terrell, 349 (7.2%) attend a private institution, while the remaining 4,498 (92.8%) are enrolled in public schools. The age group of 25 to 34 year olds has the highest likelihood of being enrolled in private schools, with 89 (65.0% in the age bracket) enrolled. Conversely, the age group of 3 to 4 year olds has the lowest likelihood of being enrolled in a private school, with 206 (100.0% in the age bracket) attending a public institution.
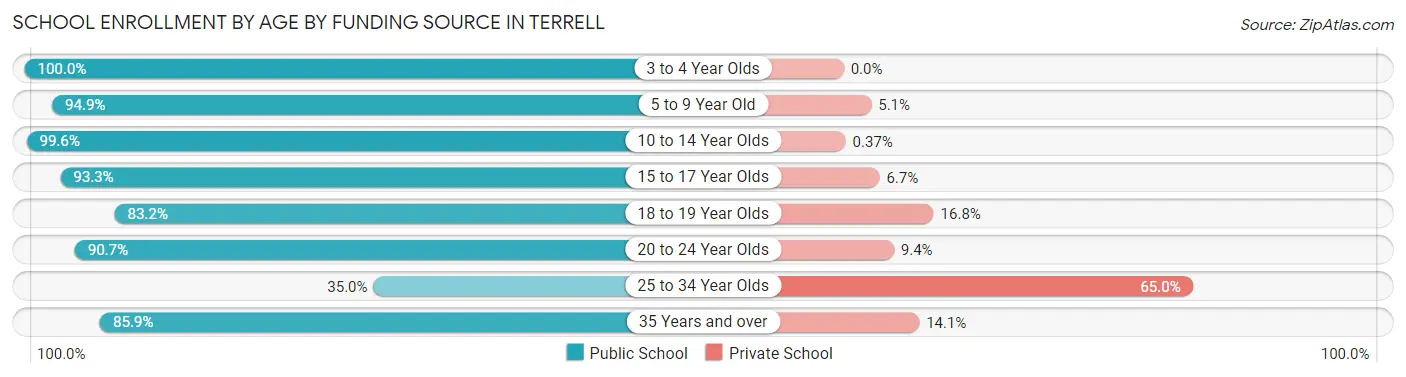
| Age Bracket | Public School | Private School |
| 3 to 4 Year Olds | 206 (100.0%) | 0 (0.0%) |
| 5 to 9 Year Old | 1,107 (94.9%) | 60 (5.1%) |
| 10 to 14 Year Olds | 1,336 (99.6%) | 5 (0.4%) |
| 15 to 17 Year Olds | 1,008 (93.3%) | 72 (6.7%) |
| 18 to 19 Year Olds | 303 (83.2%) | 61 (16.8%) |
| 20 to 24 Year Olds | 320 (90.6%) | 33 (9.3%) |
| 25 to 34 Year Olds | 48 (35.0%) | 89 (65.0%) |
| 35 Years and over | 171 (85.9%) | 28 (14.1%) |
| Total | 4,498 (92.8%) | 349 (7.2%) |
Educational Attainment by Field of Study in Terrell
Education (501 | 24.6%), business (279 | 13.7%), science & technology (247 | 12.1%), liberal arts & history (179 | 8.8%), and engineering (166 | 8.2%) are the most common fields of study among 2,033 individuals in Terrell who have obtained a bachelor's degree or higher.
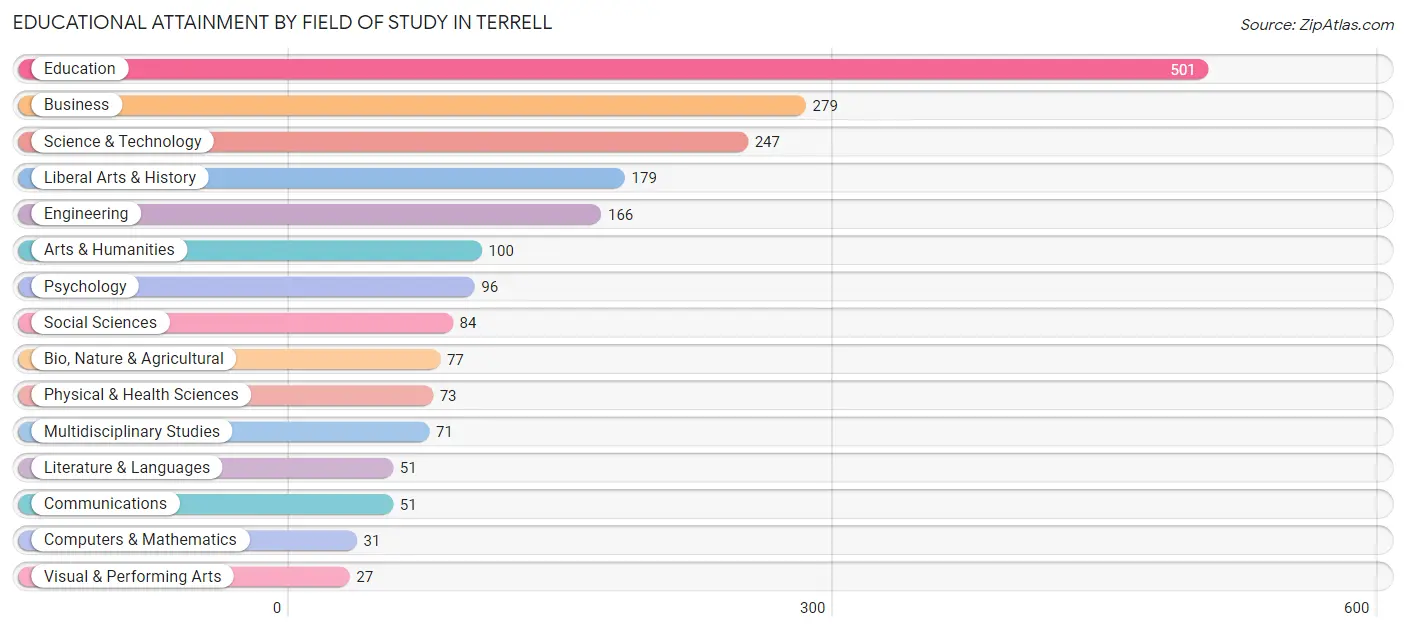
| Field of Study | # Graduates | % Graduates |
| Computers & Mathematics | 31 | 1.5% |
| Bio, Nature & Agricultural | 77 | 3.8% |
| Physical & Health Sciences | 73 | 3.6% |
| Psychology | 96 | 4.7% |
| Social Sciences | 84 | 4.1% |
| Engineering | 166 | 8.2% |
| Multidisciplinary Studies | 71 | 3.5% |
| Science & Technology | 247 | 12.1% |
| Business | 279 | 13.7% |
| Education | 501 | 24.6% |
| Literature & Languages | 51 | 2.5% |
| Liberal Arts & History | 179 | 8.8% |
| Visual & Performing Arts | 27 | 1.3% |
| Communications | 51 | 2.5% |
| Arts & Humanities | 100 | 4.9% |
| Total | 2,033 | 100.0% |
Transportation & Commute in Terrell
Vehicle Availability by Sex in Terrell
The most prevalent vehicle ownership categories in Terrell are males with 2 vehicles (2,039, accounting for 53.3%) and females with 2 vehicles (1,833, making up 54.5%).
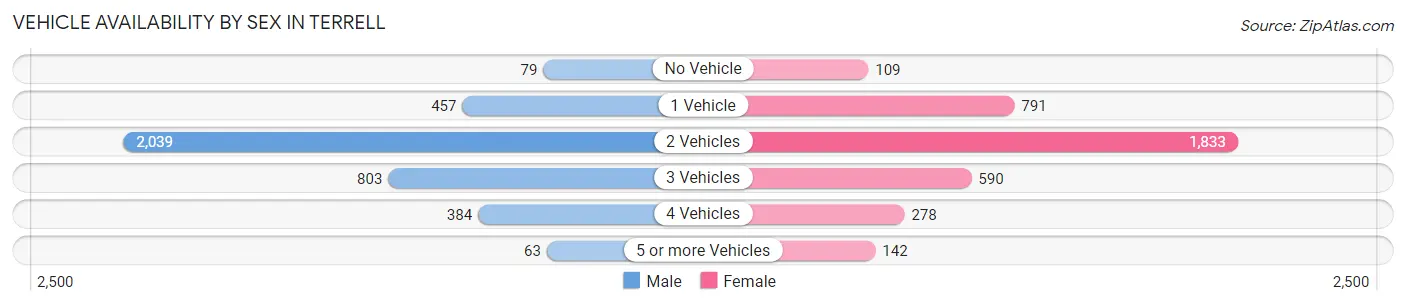
| Vehicles Available | Male | Female |
| No Vehicle | 79 (2.1%) | 109 (2.9%) |
| 1 Vehicle | 457 (11.9%) | 791 (21.1%) |
| 2 Vehicles | 2,039 (53.3%) | 1,833 (49.0%) |
| 3 Vehicles | 803 (21.0%) | 590 (15.8%) |
| 4 Vehicles | 384 (10.0%) | 278 (7.4%) |
| 5 or more Vehicles | 63 (1.7%) | 142 (3.8%) |
| Total | 3,825 (100.0%) | 3,743 (100.0%) |
Commute Time in Terrell
The most frequently occuring commute durations in Terrell are 10 to 14 minutes (1,884 commuters, 25.4%), 5 to 9 minutes (1,080 commuters, 14.5%), and 30 to 34 minutes (895 commuters, 12.0%).
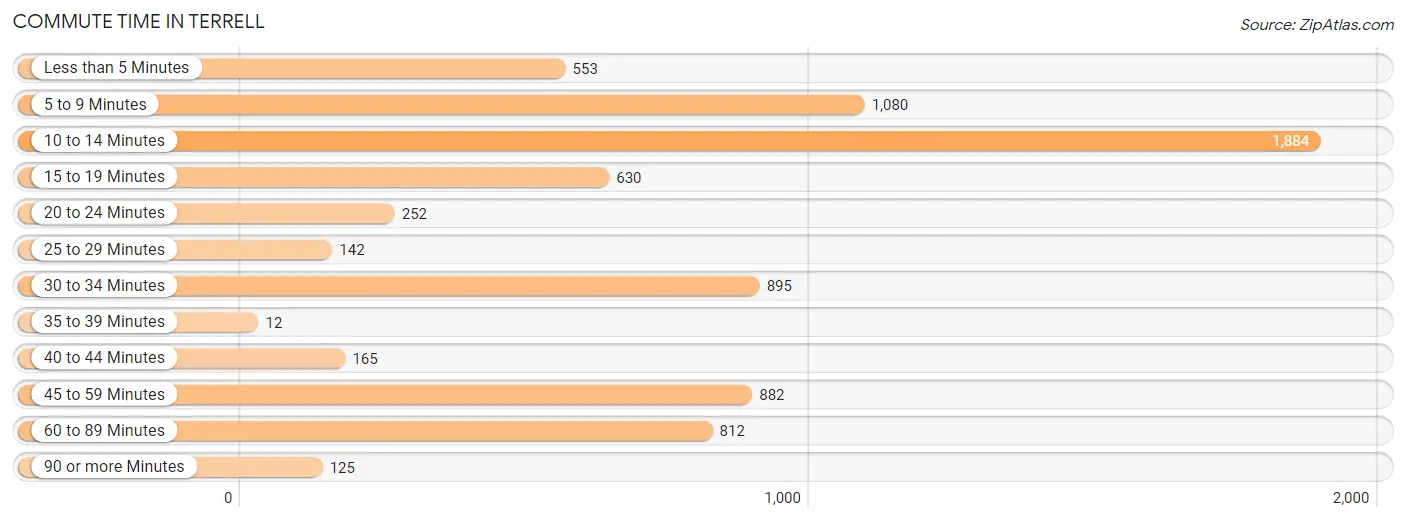
| Commute Time | # Commuters | % Commuters |
| Less than 5 Minutes | 553 | 7.4% |
| 5 to 9 Minutes | 1,080 | 14.5% |
| 10 to 14 Minutes | 1,884 | 25.4% |
| 15 to 19 Minutes | 630 | 8.5% |
| 20 to 24 Minutes | 252 | 3.4% |
| 25 to 29 Minutes | 142 | 1.9% |
| 30 to 34 Minutes | 895 | 12.0% |
| 35 to 39 Minutes | 12 | 0.2% |
| 40 to 44 Minutes | 165 | 2.2% |
| 45 to 59 Minutes | 882 | 11.9% |
| 60 to 89 Minutes | 812 | 10.9% |
| 90 or more Minutes | 125 | 1.7% |
Commute Time by Sex in Terrell
The most common commute times in Terrell are 10 to 14 minutes (985 commuters, 25.7%) for males and 10 to 14 minutes (899 commuters, 25.0%) for females.
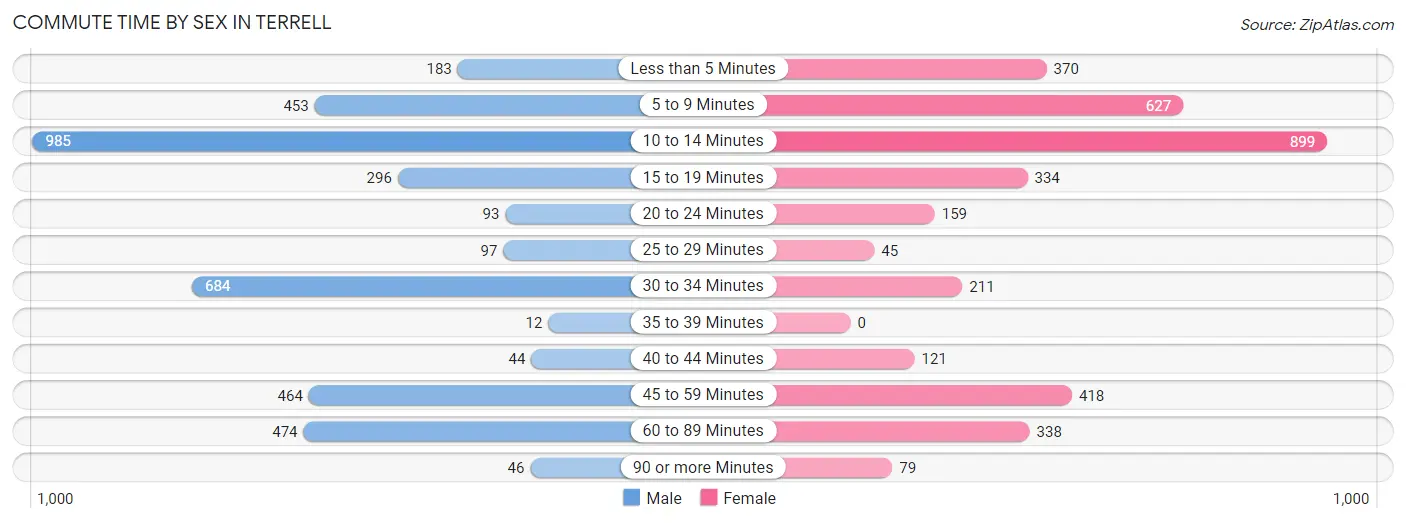
| Commute Time | Male | Female |
| Less than 5 Minutes | 183 (4.8%) | 370 (10.3%) |
| 5 to 9 Minutes | 453 (11.8%) | 627 (17.4%) |
| 10 to 14 Minutes | 985 (25.7%) | 899 (25.0%) |
| 15 to 19 Minutes | 296 (7.7%) | 334 (9.3%) |
| 20 to 24 Minutes | 93 (2.4%) | 159 (4.4%) |
| 25 to 29 Minutes | 97 (2.5%) | 45 (1.3%) |
| 30 to 34 Minutes | 684 (17.8%) | 211 (5.9%) |
| 35 to 39 Minutes | 12 (0.3%) | 0 (0.0%) |
| 40 to 44 Minutes | 44 (1.1%) | 121 (3.4%) |
| 45 to 59 Minutes | 464 (12.1%) | 418 (11.6%) |
| 60 to 89 Minutes | 474 (12.4%) | 338 (9.4%) |
| 90 or more Minutes | 46 (1.2%) | 79 (2.2%) |
Time of Departure to Work by Sex in Terrell
The most frequent times of departure to work in Terrell are 7:00 AM to 7:29 AM (545, 14.2%) for males and 7:30 AM to 7:59 AM (752, 20.9%) for females.
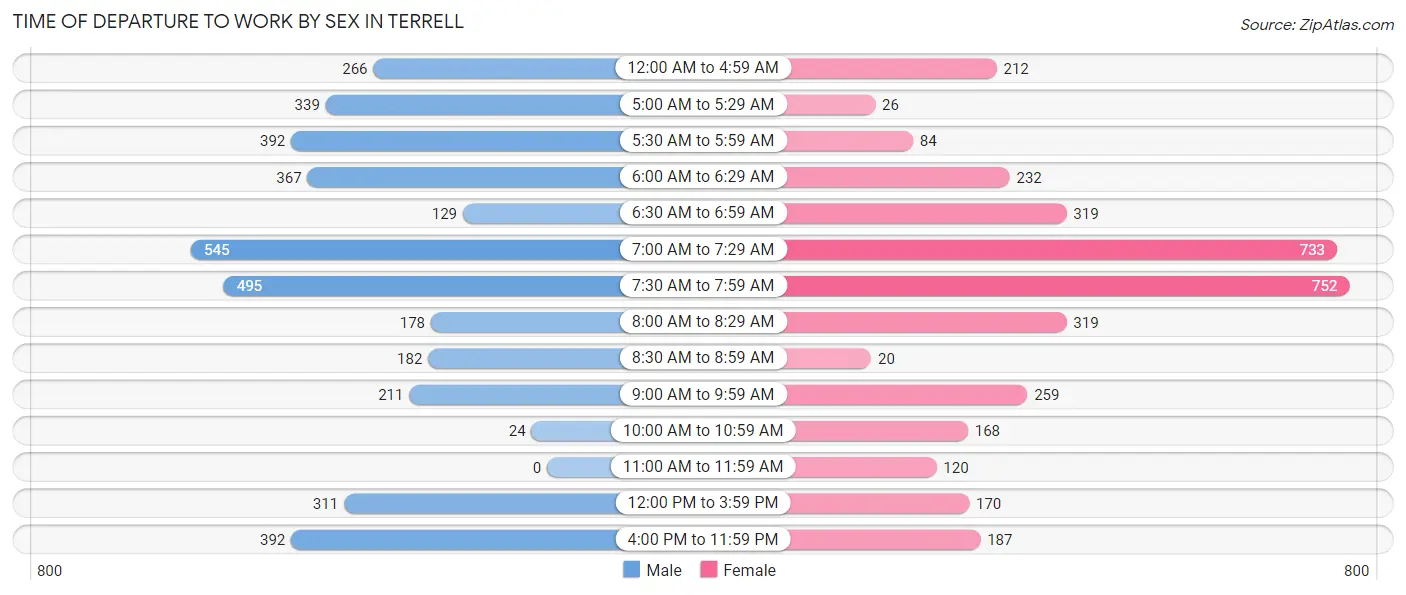
| Time of Departure | Male | Female |
| 12:00 AM to 4:59 AM | 266 (6.9%) | 212 (5.9%) |
| 5:00 AM to 5:29 AM | 339 (8.8%) | 26 (0.7%) |
| 5:30 AM to 5:59 AM | 392 (10.2%) | 84 (2.3%) |
| 6:00 AM to 6:29 AM | 367 (9.6%) | 232 (6.4%) |
| 6:30 AM to 6:59 AM | 129 (3.4%) | 319 (8.9%) |
| 7:00 AM to 7:29 AM | 545 (14.2%) | 733 (20.4%) |
| 7:30 AM to 7:59 AM | 495 (12.9%) | 752 (20.9%) |
| 8:00 AM to 8:29 AM | 178 (4.6%) | 319 (8.9%) |
| 8:30 AM to 8:59 AM | 182 (4.8%) | 20 (0.6%) |
| 9:00 AM to 9:59 AM | 211 (5.5%) | 259 (7.2%) |
| 10:00 AM to 10:59 AM | 24 (0.6%) | 168 (4.7%) |
| 11:00 AM to 11:59 AM | 0 (0.0%) | 120 (3.3%) |
| 12:00 PM to 3:59 PM | 311 (8.1%) | 170 (4.7%) |
| 4:00 PM to 11:59 PM | 392 (10.2%) | 187 (5.2%) |
| Total | 3,831 (100.0%) | 3,601 (100.0%) |
Housing Occupancy in Terrell
Occupancy by Ownership in Terrell
Of the total 6,169 dwellings in Terrell, owner-occupied units account for 3,572 (57.9%), while renter-occupied units make up 2,597 (42.1%).
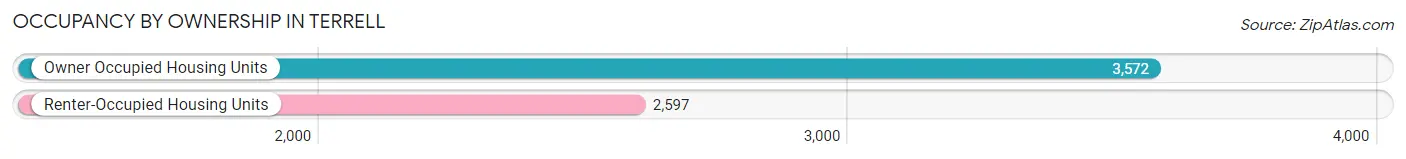
| Occupancy | # Housing Units | % Housing Units |
| Owner Occupied Housing Units | 3,572 | 57.9% |
| Renter-Occupied Housing Units | 2,597 | 42.1% |
| Total Occupied Housing Units | 6,169 | 100.0% |
Occupancy by Household Size in Terrell
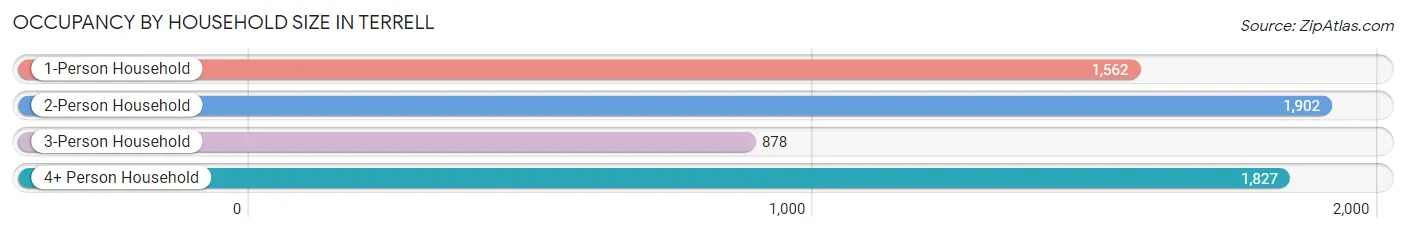
| Household Size | # Housing Units | % Housing Units |
| 1-Person Household | 1,562 | 25.3% |
| 2-Person Household | 1,902 | 30.8% |
| 3-Person Household | 878 | 14.2% |
| 4+ Person Household | 1,827 | 29.6% |
| Total Housing Units | 6,169 | 100.0% |
Occupancy by Ownership by Household Size in Terrell
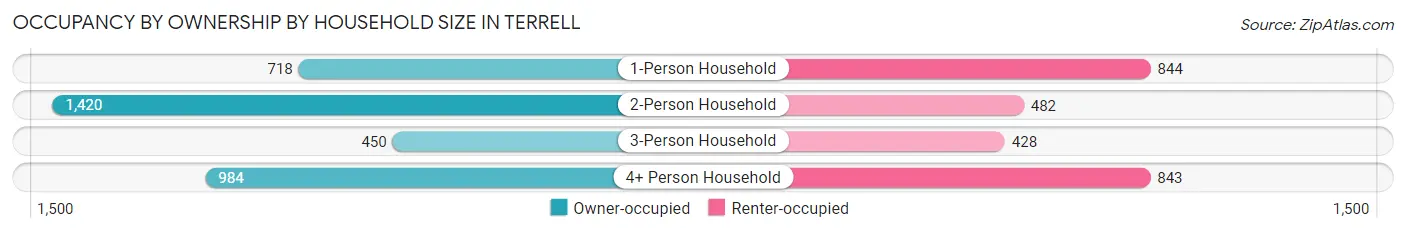
| Household Size | Owner-occupied | Renter-occupied |
| 1-Person Household | 718 (46.0%) | 844 (54.0%) |
| 2-Person Household | 1,420 (74.7%) | 482 (25.3%) |
| 3-Person Household | 450 (51.2%) | 428 (48.7%) |
| 4+ Person Household | 984 (53.9%) | 843 (46.1%) |
| Total Housing Units | 3,572 (57.9%) | 2,597 (42.1%) |
Occupancy by Educational Attainment in Terrell
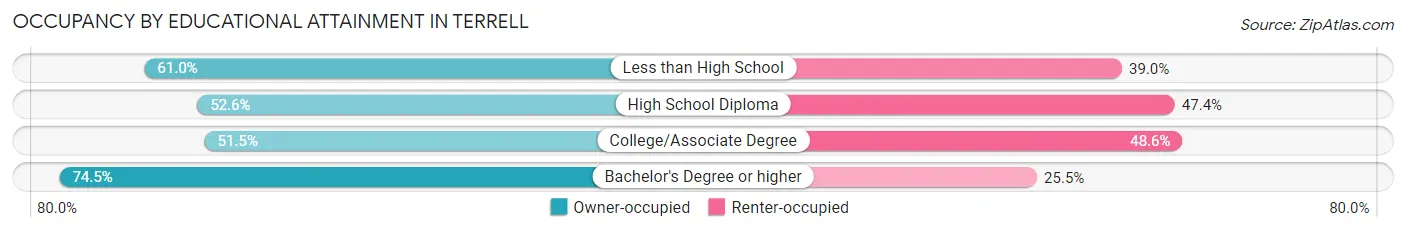
| Household Size | Owner-occupied | Renter-occupied |
| Less than High School | 666 (61.0%) | 426 (39.0%) |
| High School Diploma | 1,015 (52.6%) | 914 (47.4%) |
| College/Associate Degree | 1,013 (51.4%) | 956 (48.5%) |
| Bachelor's Degree or higher | 878 (74.5%) | 301 (25.5%) |
Occupancy by Age of Householder in Terrell
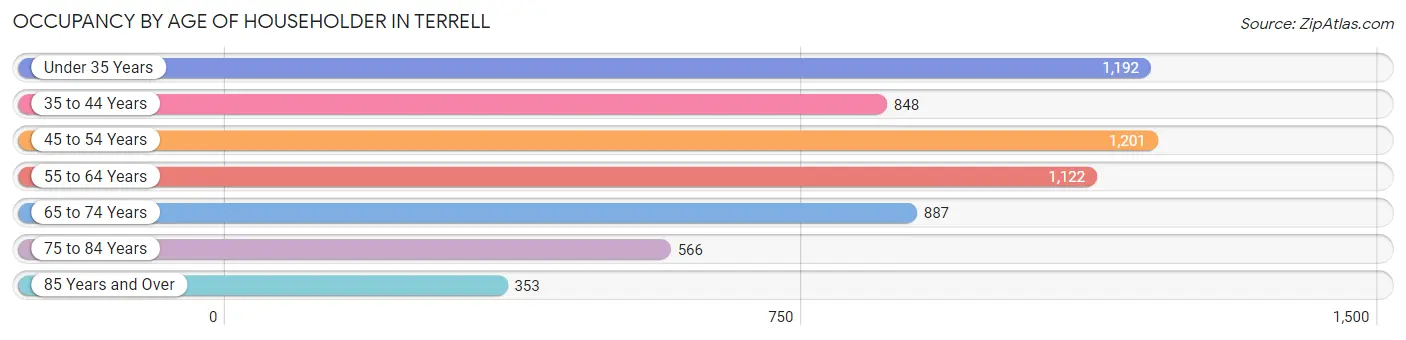
| Age Bracket | # Households | % Households |
| Under 35 Years | 1,192 | 19.3% |
| 35 to 44 Years | 848 | 13.8% |
| 45 to 54 Years | 1,201 | 19.5% |
| 55 to 64 Years | 1,122 | 18.2% |
| 65 to 74 Years | 887 | 14.4% |
| 75 to 84 Years | 566 | 9.2% |
| 85 Years and Over | 353 | 5.7% |
| Total | 6,169 | 100.0% |
Housing Finances in Terrell
Median Income by Occupancy in Terrell
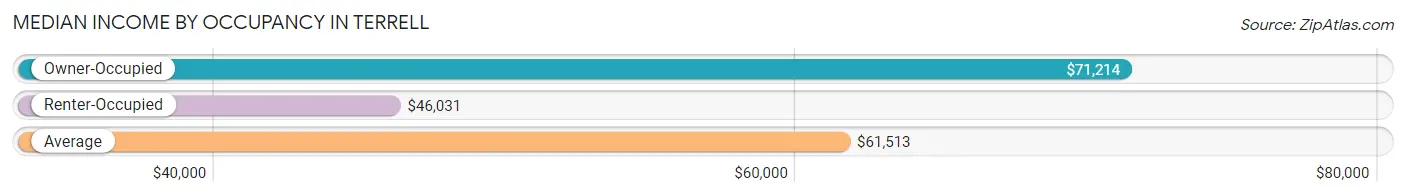
| Occupancy Type | # Households | Median Income |
| Owner-Occupied | 3,572 (57.9%) | $71,214 |
| Renter-Occupied | 2,597 (42.1%) | $46,031 |
| Average | 6,169 (100.0%) | $61,513 |
Occupancy by Householder Income Bracket in Terrell
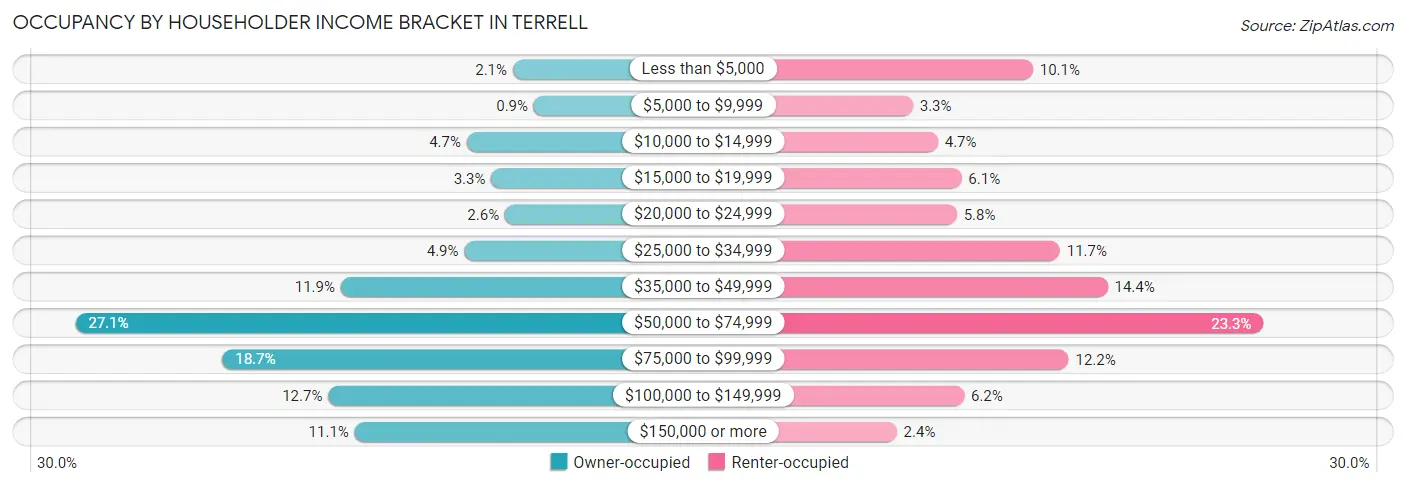
| Income Bracket | Owner-occupied | Renter-occupied |
| Less than $5,000 | 75 (2.1%) | 263 (10.1%) |
| $5,000 to $9,999 | 32 (0.9%) | 85 (3.3%) |
| $10,000 to $14,999 | 169 (4.7%) | 122 (4.7%) |
| $15,000 to $19,999 | 119 (3.3%) | 157 (6.0%) |
| $20,000 to $24,999 | 91 (2.5%) | 150 (5.8%) |
| $25,000 to $34,999 | 174 (4.9%) | 303 (11.7%) |
| $35,000 to $49,999 | 426 (11.9%) | 374 (14.4%) |
| $50,000 to $74,999 | 968 (27.1%) | 605 (23.3%) |
| $75,000 to $99,999 | 668 (18.7%) | 316 (12.2%) |
| $100,000 to $149,999 | 452 (12.7%) | 161 (6.2%) |
| $150,000 or more | 398 (11.1%) | 61 (2.4%) |
| Total | 3,572 (100.0%) | 2,597 (100.0%) |
Monthly Housing Cost Tiers in Terrell
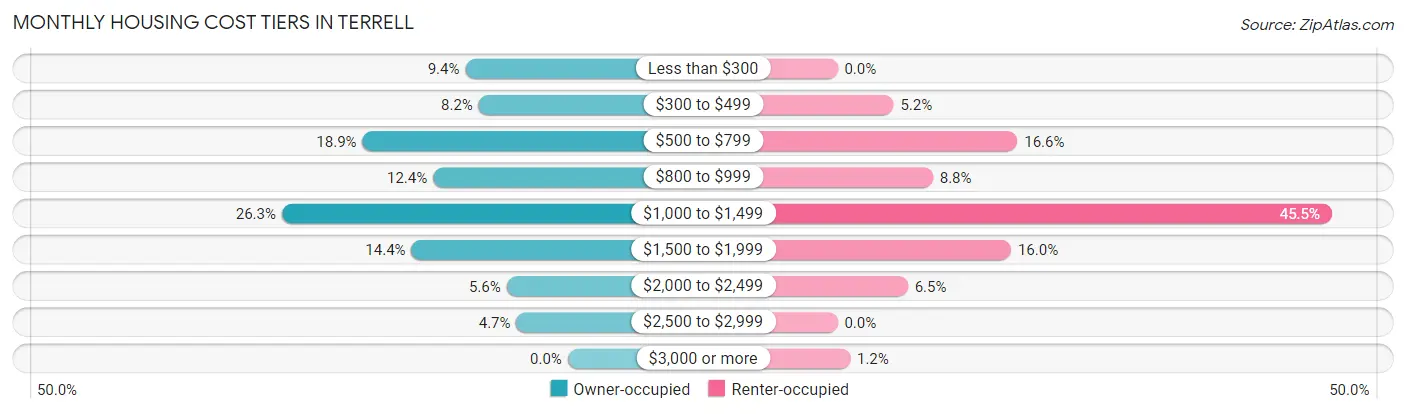
| Monthly Cost | Owner-occupied | Renter-occupied |
| Less than $300 | 337 (9.4%) | 0 (0.0%) |
| $300 to $499 | 293 (8.2%) | 134 (5.2%) |
| $500 to $799 | 675 (18.9%) | 430 (16.6%) |
| $800 to $999 | 443 (12.4%) | 228 (8.8%) |
| $1,000 to $1,499 | 940 (26.3%) | 1,182 (45.5%) |
| $1,500 to $1,999 | 514 (14.4%) | 415 (16.0%) |
| $2,000 to $2,499 | 201 (5.6%) | 168 (6.5%) |
| $2,500 to $2,999 | 169 (4.7%) | 0 (0.0%) |
| $3,000 or more | 0 (0.0%) | 30 (1.2%) |
| Total | 3,572 (100.0%) | 2,597 (100.0%) |
Physical Housing Characteristics in Terrell
Housing Structures in Terrell
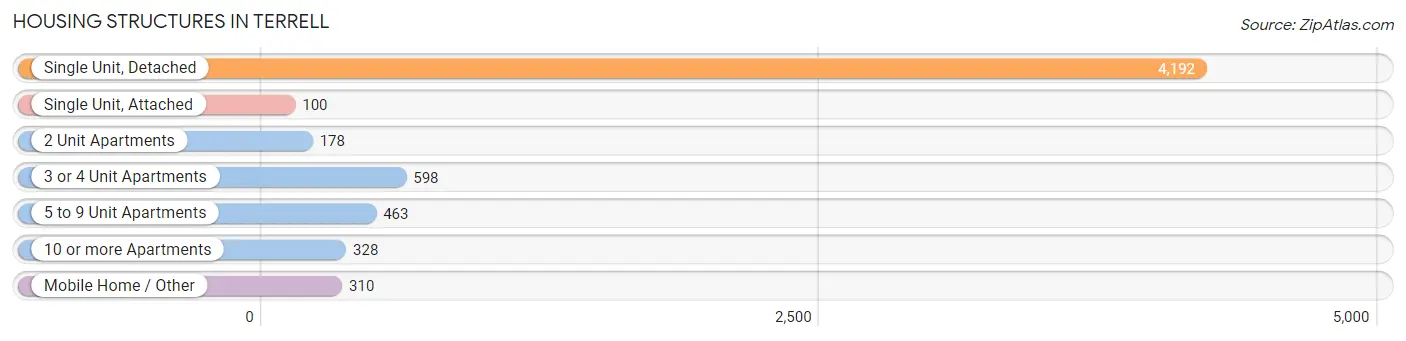
| Structure Type | # Housing Units | % Housing Units |
| Single Unit, Detached | 4,192 | 67.9% |
| Single Unit, Attached | 100 | 1.6% |
| 2 Unit Apartments | 178 | 2.9% |
| 3 or 4 Unit Apartments | 598 | 9.7% |
| 5 to 9 Unit Apartments | 463 | 7.5% |
| 10 or more Apartments | 328 | 5.3% |
| Mobile Home / Other | 310 | 5.0% |
| Total | 6,169 | 100.0% |
Housing Structures by Occupancy in Terrell
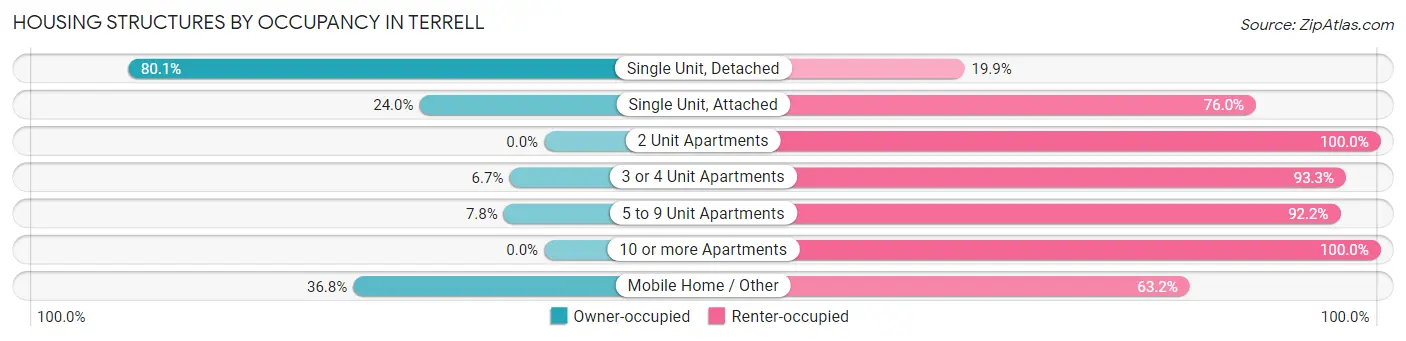
| Structure Type | Owner-occupied | Renter-occupied |
| Single Unit, Detached | 3,358 (80.1%) | 834 (19.9%) |
| Single Unit, Attached | 24 (24.0%) | 76 (76.0%) |
| 2 Unit Apartments | 0 (0.0%) | 178 (100.0%) |
| 3 or 4 Unit Apartments | 40 (6.7%) | 558 (93.3%) |
| 5 to 9 Unit Apartments | 36 (7.8%) | 427 (92.2%) |
| 10 or more Apartments | 0 (0.0%) | 328 (100.0%) |
| Mobile Home / Other | 114 (36.8%) | 196 (63.2%) |
| Total | 3,572 (57.9%) | 2,597 (42.1%) |
Housing Structures by Number of Rooms in Terrell
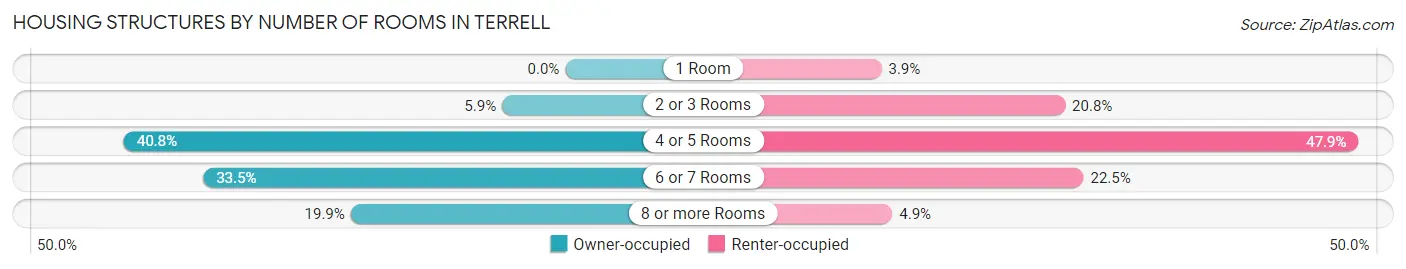
| Number of Rooms | Owner-occupied | Renter-occupied |
| 1 Room | 0 (0.0%) | 100 (3.8%) |
| 2 or 3 Rooms | 209 (5.9%) | 541 (20.8%) |
| 4 or 5 Rooms | 1,458 (40.8%) | 1,245 (47.9%) |
| 6 or 7 Rooms | 1,196 (33.5%) | 585 (22.5%) |
| 8 or more Rooms | 709 (19.9%) | 126 (4.9%) |
| Total | 3,572 (100.0%) | 2,597 (100.0%) |
Housing Structure by Heating Type in Terrell
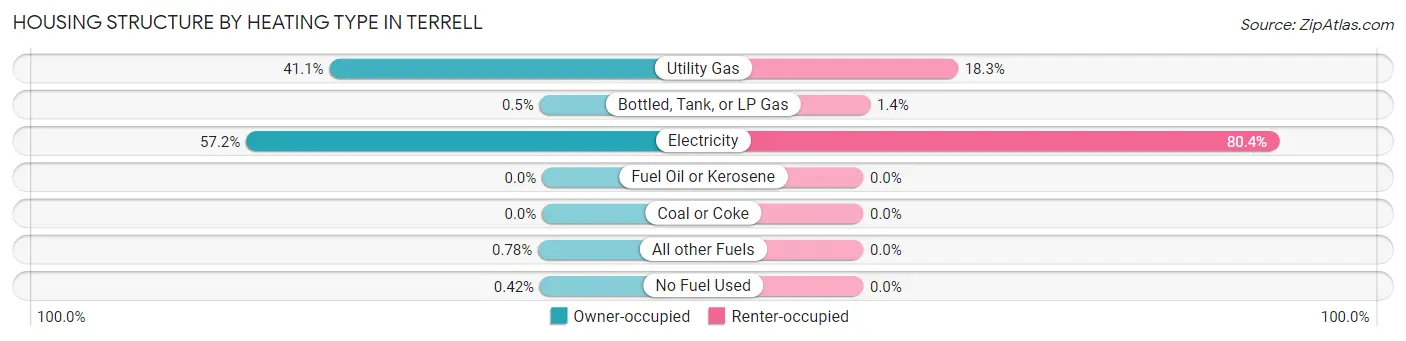
| Heating Type | Owner-occupied | Renter-occupied |
| Utility Gas | 1,468 (41.1%) | 475 (18.3%) |
| Bottled, Tank, or LP Gas | 18 (0.5%) | 35 (1.3%) |
| Electricity | 2,043 (57.2%) | 2,087 (80.4%) |
| Fuel Oil or Kerosene | 0 (0.0%) | 0 (0.0%) |
| Coal or Coke | 0 (0.0%) | 0 (0.0%) |
| All other Fuels | 28 (0.8%) | 0 (0.0%) |
| No Fuel Used | 15 (0.4%) | 0 (0.0%) |
| Total | 3,572 (100.0%) | 2,597 (100.0%) |
Household Vehicle Usage in Terrell
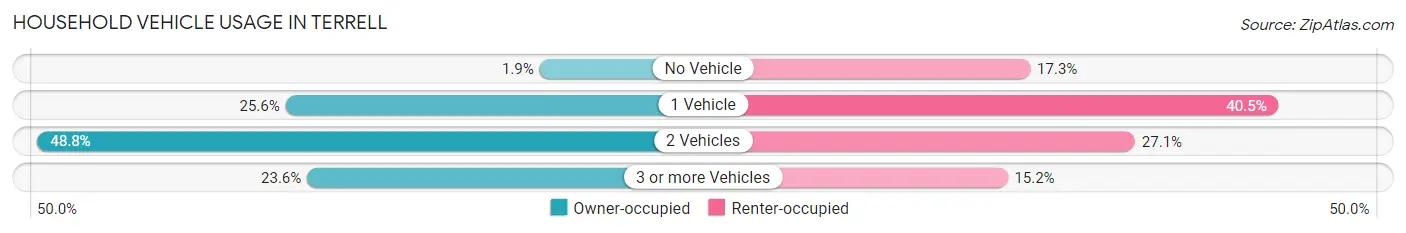
| Vehicles per Household | Owner-occupied | Renter-occupied |
| No Vehicle | 69 (1.9%) | 449 (17.3%) |
| 1 Vehicle | 916 (25.6%) | 1,051 (40.5%) |
| 2 Vehicles | 1,743 (48.8%) | 703 (27.1%) |
| 3 or more Vehicles | 844 (23.6%) | 394 (15.2%) |
| Total | 3,572 (100.0%) | 2,597 (100.0%) |
Real Estate & Mortgages in Terrell
Real Estate and Mortgage Overview in Terrell
| Characteristic | Without Mortgage | With Mortgage |
| Housing Units | 1,771 | 1,801 |
| Median Property Value | $157,700 | $165,500 |
| Median Household Income | $63,750 | $218 |
| Monthly Housing Costs | $661 | $0 |
| Real Estate Taxes | $2,741 | $34 |
Property Value by Mortgage Status in Terrell
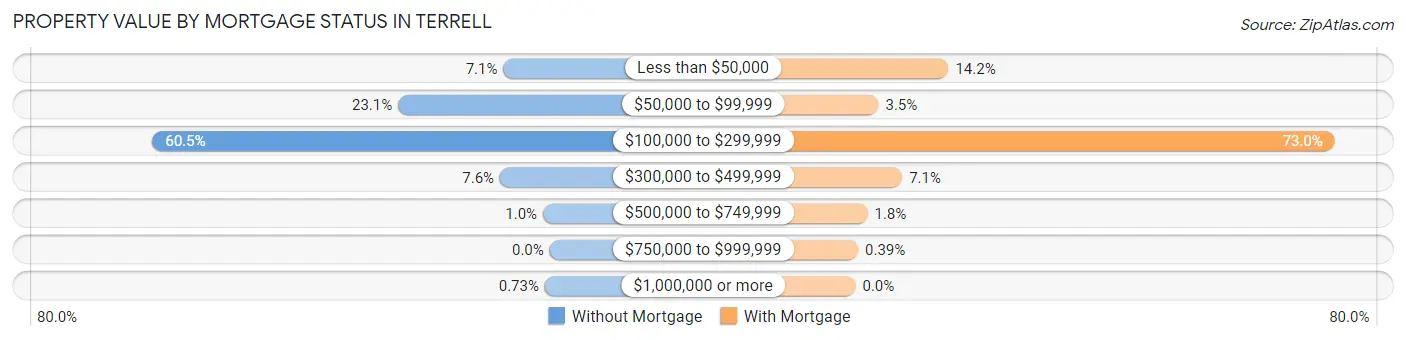
| Property Value | Without Mortgage | With Mortgage |
| Less than $50,000 | 125 (7.1%) | 255 (14.2%) |
| $50,000 to $99,999 | 409 (23.1%) | 63 (3.5%) |
| $100,000 to $299,999 | 1,072 (60.5%) | 1,315 (73.0%) |
| $300,000 to $499,999 | 134 (7.6%) | 128 (7.1%) |
| $500,000 to $749,999 | 18 (1.0%) | 33 (1.8%) |
| $750,000 to $999,999 | 0 (0.0%) | 7 (0.4%) |
| $1,000,000 or more | 13 (0.7%) | 0 (0.0%) |
| Total | 1,771 (100.0%) | 1,801 (100.0%) |
Household Income by Mortgage Status in Terrell
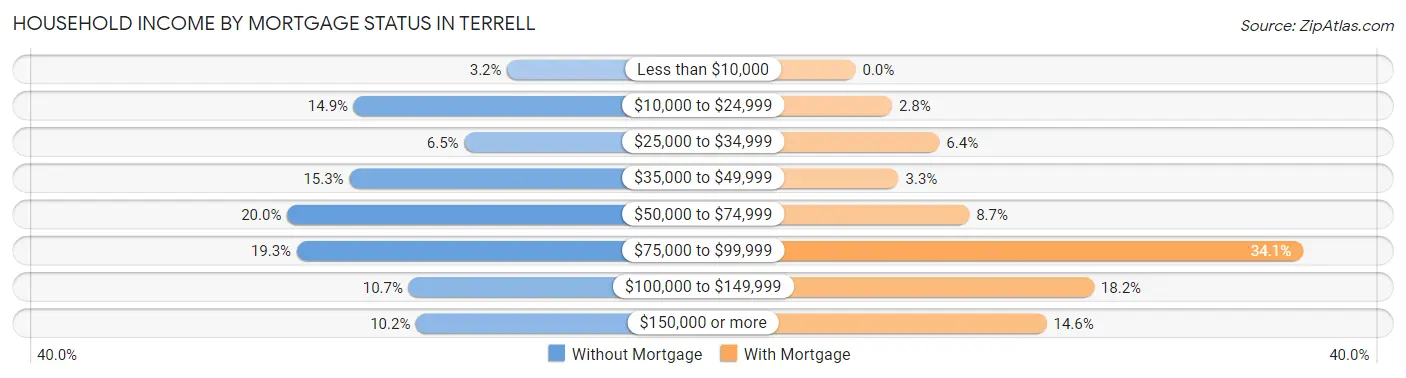
| Household Income | Without Mortgage | With Mortgage |
| Less than $10,000 | 57 (3.2%) | 0 (0.0%) |
| $10,000 to $24,999 | 264 (14.9%) | 50 (2.8%) |
| $25,000 to $34,999 | 115 (6.5%) | 115 (6.4%) |
| $35,000 to $49,999 | 270 (15.2%) | 59 (3.3%) |
| $50,000 to $74,999 | 354 (20.0%) | 156 (8.7%) |
| $75,000 to $99,999 | 341 (19.3%) | 614 (34.1%) |
| $100,000 to $149,999 | 190 (10.7%) | 327 (18.2%) |
| $150,000 or more | 180 (10.2%) | 262 (14.5%) |
| Total | 1,771 (100.0%) | 1,801 (100.0%) |
Property Value to Household Income Ratio in Terrell
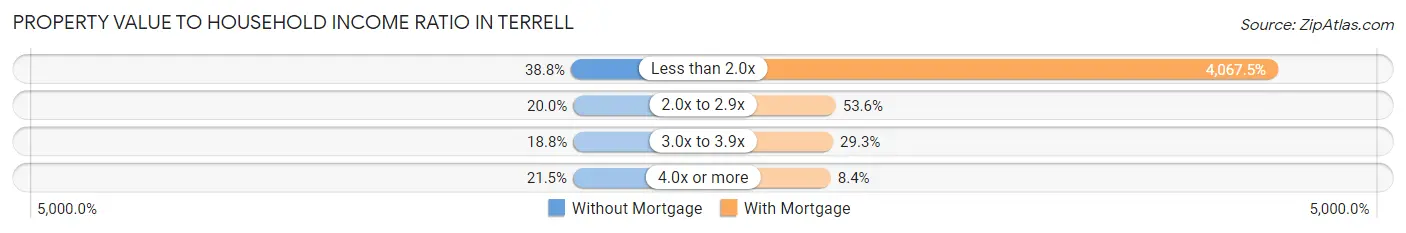
| Value-to-Income Ratio | Without Mortgage | With Mortgage |
| Less than 2.0x | 687 (38.8%) | 73,256 (4,067.5%) |
| 2.0x to 2.9x | 354 (20.0%) | 966 (53.6%) |
| 3.0x to 3.9x | 332 (18.8%) | 528 (29.3%) |
| 4.0x or more | 380 (21.5%) | 151 (8.4%) |
| Total | 1,771 (100.0%) | 1,801 (100.0%) |
Real Estate Taxes by Mortgage Status in Terrell
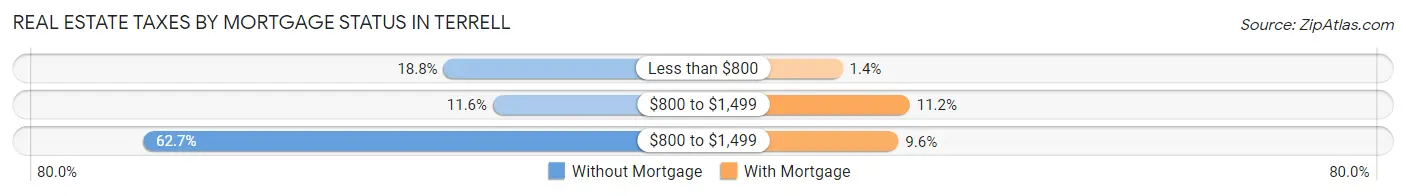
| Property Taxes | Without Mortgage | With Mortgage |
| Less than $800 | 333 (18.8%) | 25 (1.4%) |
| $800 to $1,499 | 205 (11.6%) | 202 (11.2%) |
| $800 to $1,499 | 1,110 (62.7%) | 172 (9.6%) |
| Total | 1,771 (100.0%) | 1,801 (100.0%) |
Health & Disability in Terrell
Health Insurance Coverage by Age in Terrell
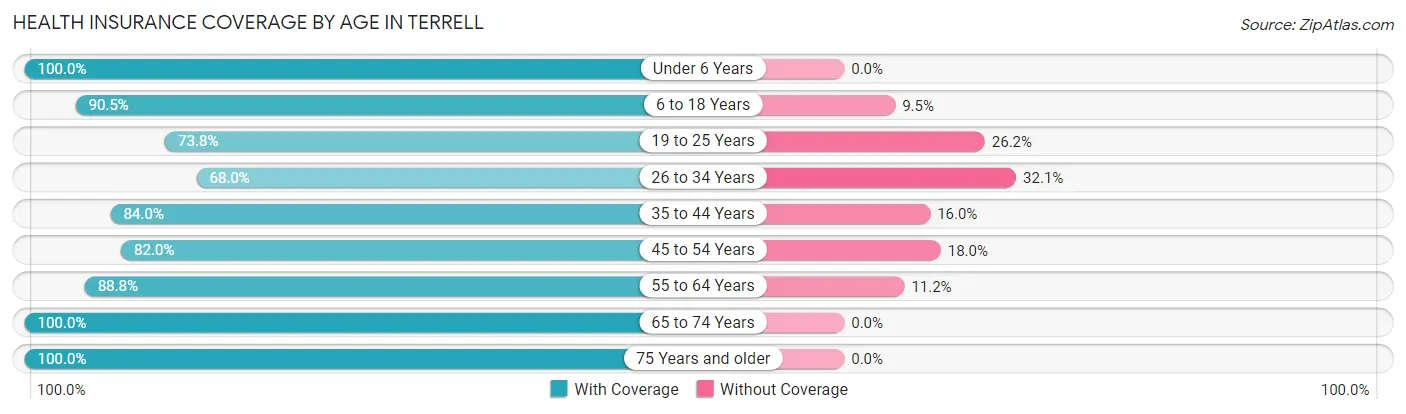
| Age Bracket | With Coverage | Without Coverage |
| Under 6 Years | 1,286 (100.0%) | 0 (0.0%) |
| 6 to 18 Years | 3,624 (90.5%) | 380 (9.5%) |
| 19 to 25 Years | 1,039 (73.8%) | 369 (26.2%) |
| 26 to 34 Years | 1,539 (67.9%) | 726 (32.1%) |
| 35 to 44 Years | 1,557 (84.0%) | 297 (16.0%) |
| 45 to 54 Years | 1,631 (82.0%) | 358 (18.0%) |
| 55 to 64 Years | 1,749 (88.8%) | 221 (11.2%) |
| 65 to 74 Years | 1,580 (100.0%) | 0 (0.0%) |
| 75 Years and older | 1,348 (100.0%) | 0 (0.0%) |
| Total | 15,353 (86.7%) | 2,351 (13.3%) |
Health Insurance Coverage by Citizenship Status in Terrell
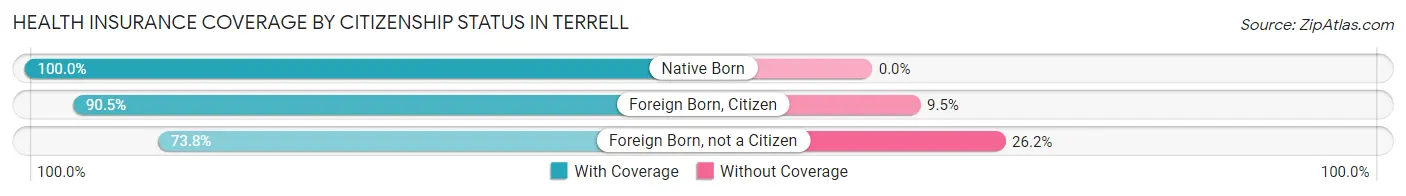
| Citizenship Status | With Coverage | Without Coverage |
| Native Born | 1,286 (100.0%) | 0 (0.0%) |
| Foreign Born, Citizen | 3,624 (90.5%) | 380 (9.5%) |
| Foreign Born, not a Citizen | 1,039 (73.8%) | 369 (26.2%) |
Health Insurance Coverage by Household Income in Terrell
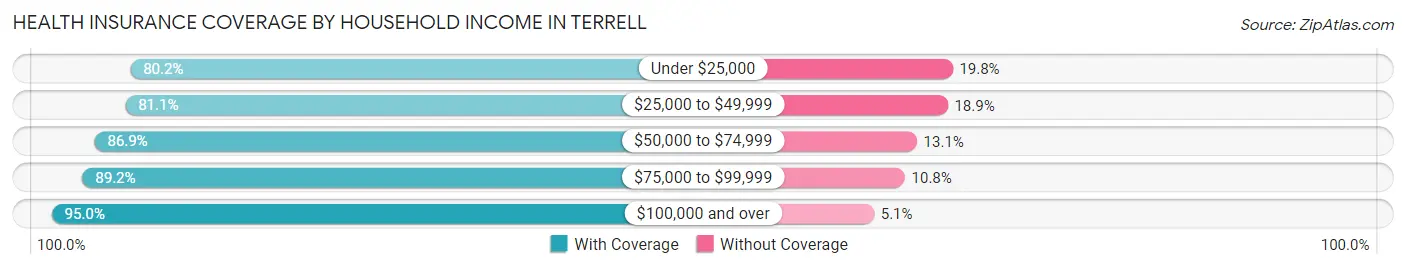
| Household Income | With Coverage | Without Coverage |
| Under $25,000 | 2,452 (80.2%) | 605 (19.8%) |
| $25,000 to $49,999 | 2,572 (81.1%) | 598 (18.9%) |
| $50,000 to $74,999 | 3,877 (86.9%) | 584 (13.1%) |
| $75,000 to $99,999 | 2,726 (89.2%) | 331 (10.8%) |
| $100,000 and over | 3,459 (95.0%) | 184 (5.1%) |
Public vs Private Health Insurance Coverage by Age in Terrell
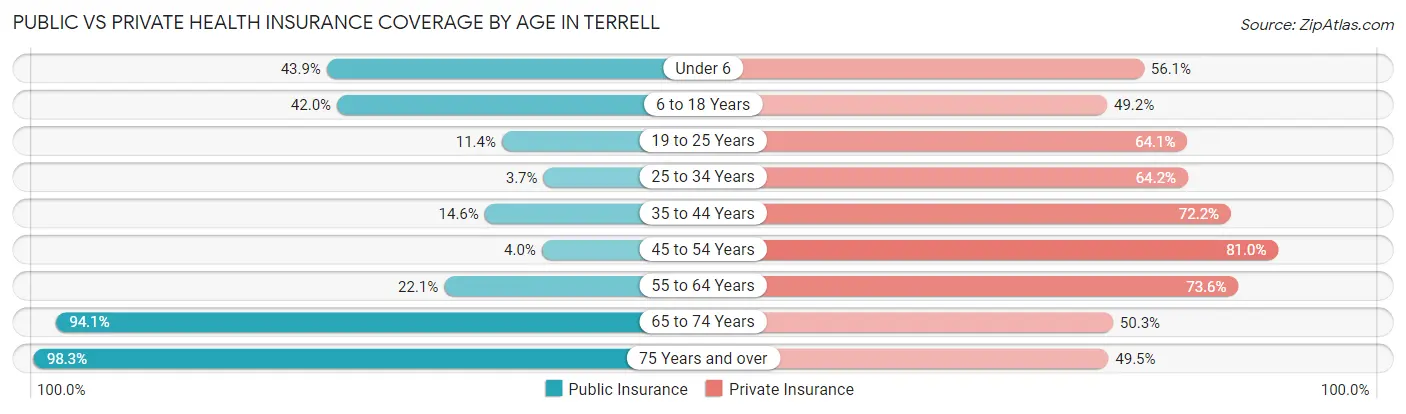
| Age Bracket | Public Insurance | Private Insurance |
| Under 6 | 565 (43.9%) | 721 (56.1%) |
| 6 to 18 Years | 1,683 (42.0%) | 1,971 (49.2%) |
| 19 to 25 Years | 161 (11.4%) | 903 (64.1%) |
| 25 to 34 Years | 84 (3.7%) | 1,455 (64.2%) |
| 35 to 44 Years | 271 (14.6%) | 1,339 (72.2%) |
| 45 to 54 Years | 80 (4.0%) | 1,611 (81.0%) |
| 55 to 64 Years | 436 (22.1%) | 1,450 (73.6%) |
| 65 to 74 Years | 1,487 (94.1%) | 795 (50.3%) |
| 75 Years and over | 1,325 (98.3%) | 667 (49.5%) |
| Total | 6,092 (34.4%) | 10,912 (61.6%) |
Disability Status by Sex by Age in Terrell
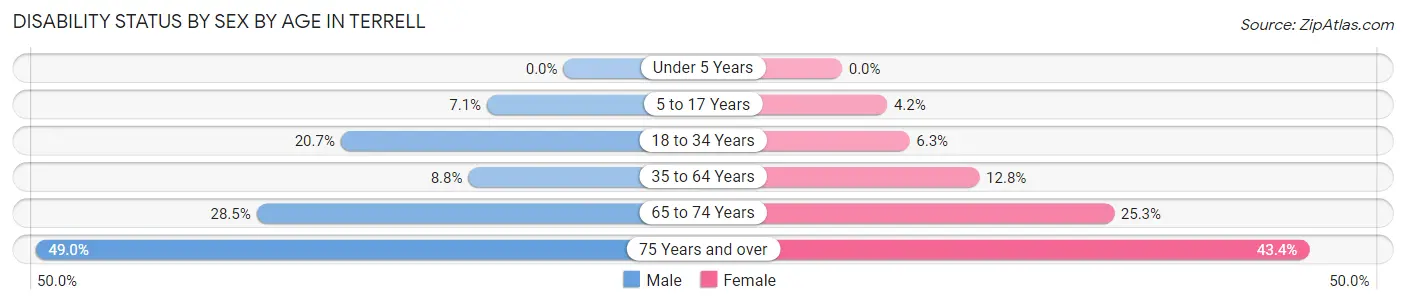
| Age Bracket | Male | Female |
| Under 5 Years | 0 (0.0%) | 0 (0.0%) |
| 5 to 17 Years | 118 (7.1%) | 85 (4.2%) |
| 18 to 34 Years | 370 (20.7%) | 144 (6.3%) |
| 35 to 64 Years | 249 (8.8%) | 381 (12.8%) |
| 65 to 74 Years | 168 (28.5%) | 250 (25.3%) |
| 75 Years and over | 239 (49.0%) | 373 (43.4%) |
Disability Class by Sex by Age in Terrell
Disability Class: Hearing Difficulty
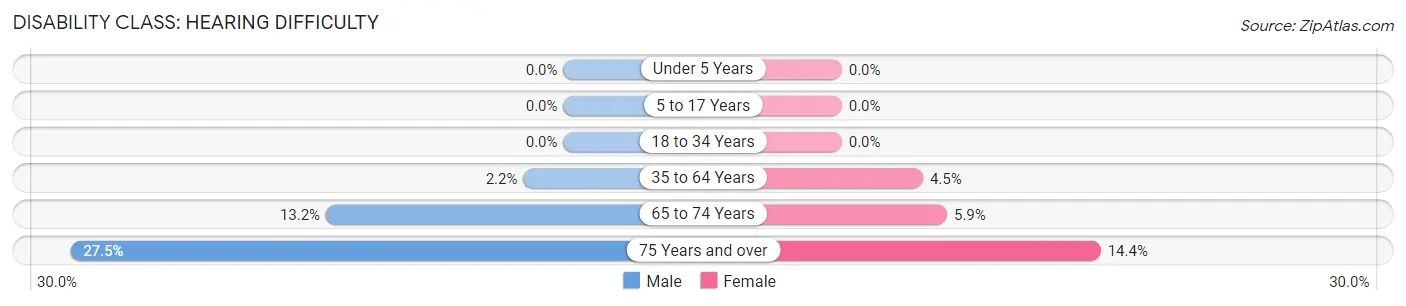
| Age Bracket | Male | Female |
| Under 5 Years | 0 (0.0%) | 0 (0.0%) |
| 5 to 17 Years | 0 (0.0%) | 0 (0.0%) |
| 18 to 34 Years | 0 (0.0%) | 0 (0.0%) |
| 35 to 64 Years | 63 (2.2%) | 135 (4.5%) |
| 65 to 74 Years | 78 (13.2%) | 58 (5.9%) |
| 75 Years and over | 134 (27.5%) | 124 (14.4%) |
Disability Class: Vision Difficulty
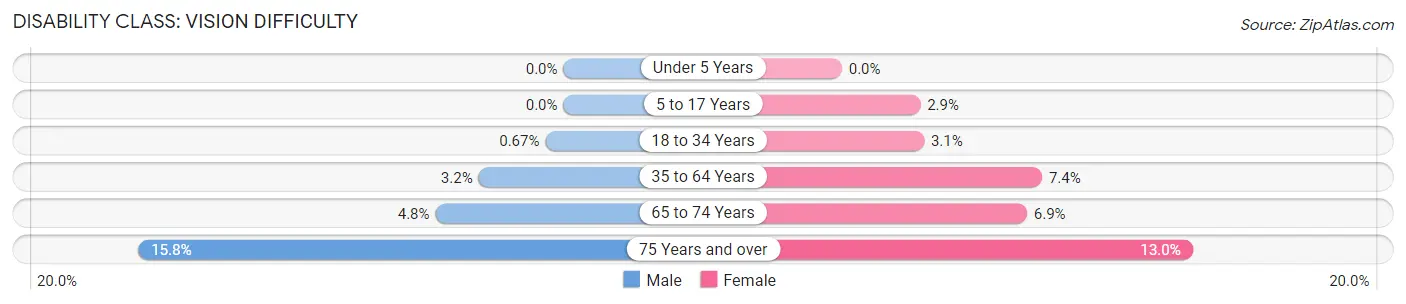
| Age Bracket | Male | Female |
| Under 5 Years | 0 (0.0%) | 0 (0.0%) |
| 5 to 17 Years | 0 (0.0%) | 59 (2.9%) |
| 18 to 34 Years | 12 (0.7%) | 70 (3.0%) |
| 35 to 64 Years | 89 (3.2%) | 222 (7.4%) |
| 65 to 74 Years | 28 (4.8%) | 68 (6.9%) |
| 75 Years and over | 77 (15.8%) | 112 (13.0%) |
Disability Class: Cognitive Difficulty
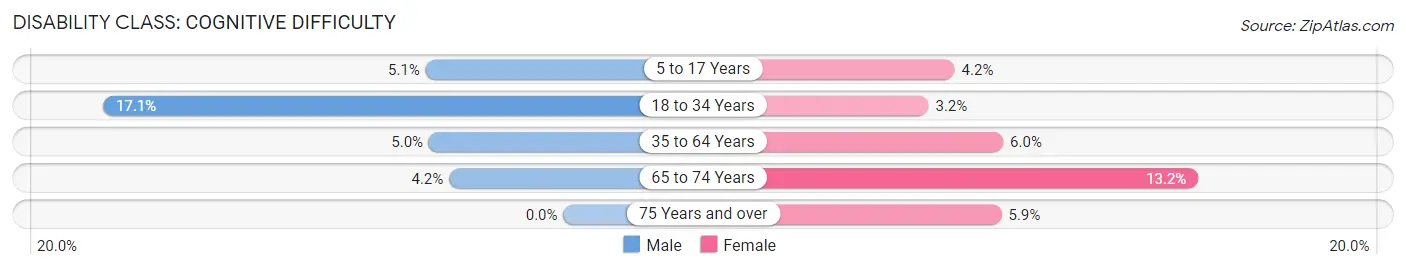
| Age Bracket | Male | Female |
| 5 to 17 Years | 85 (5.1%) | 85 (4.2%) |
| 18 to 34 Years | 306 (17.1%) | 74 (3.2%) |
| 35 to 64 Years | 141 (5.0%) | 179 (6.0%) |
| 65 to 74 Years | 25 (4.2%) | 131 (13.2%) |
| 75 Years and over | 0 (0.0%) | 51 (5.9%) |
Disability Class: Ambulatory Difficulty
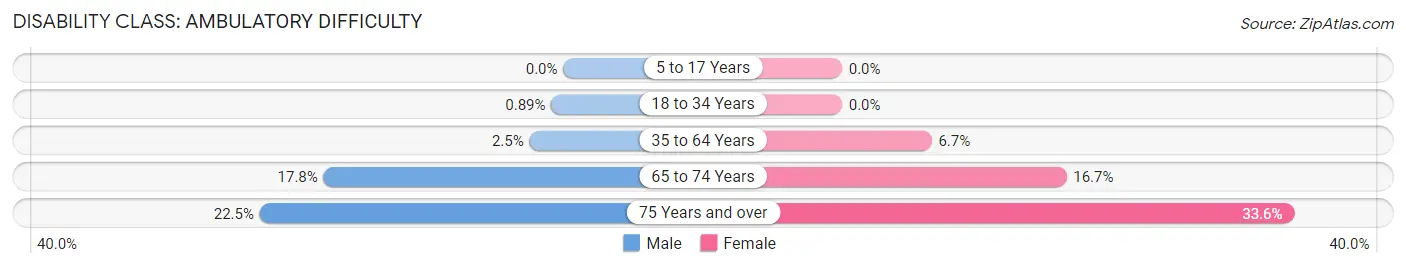
| Age Bracket | Male | Female |
| 5 to 17 Years | 0 (0.0%) | 0 (0.0%) |
| 18 to 34 Years | 16 (0.9%) | 0 (0.0%) |
| 35 to 64 Years | 71 (2.5%) | 199 (6.7%) |
| 65 to 74 Years | 105 (17.8%) | 165 (16.7%) |
| 75 Years and over | 110 (22.5%) | 289 (33.6%) |
Disability Class: Self-Care Difficulty
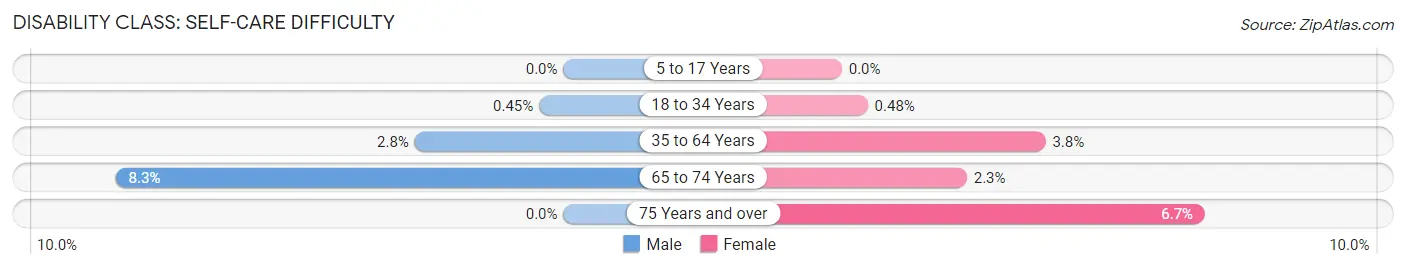
| Age Bracket | Male | Female |
| 5 to 17 Years | 0 (0.0%) | 0 (0.0%) |
| 18 to 34 Years | 8 (0.4%) | 11 (0.5%) |
| 35 to 64 Years | 78 (2.8%) | 113 (3.8%) |
| 65 to 74 Years | 49 (8.3%) | 23 (2.3%) |
| 75 Years and over | 0 (0.0%) | 58 (6.7%) |
Technology Access in Terrell
Computing Device Access in Terrell
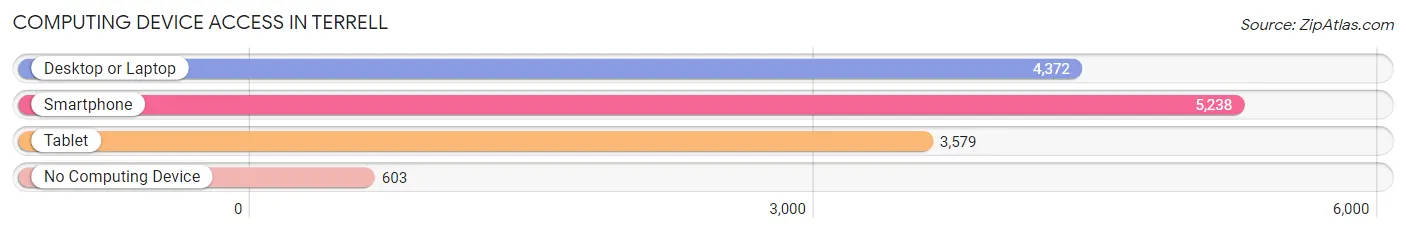
| Device Type | # Households | % Households |
| Desktop or Laptop | 4,372 | 70.9% |
| Smartphone | 5,238 | 84.9% |
| Tablet | 3,579 | 58.0% |
| No Computing Device | 603 | 9.8% |
| Total | 6,169 | 100.0% |
Internet Access in Terrell
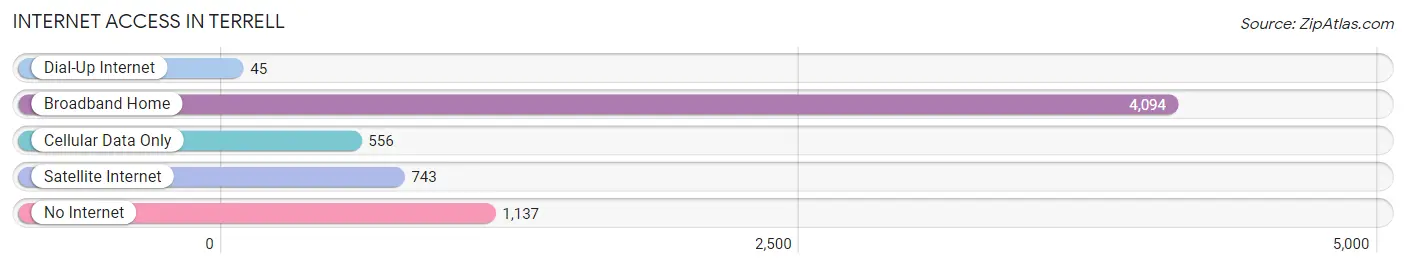
| Internet Type | # Households | % Households |
| Dial-Up Internet | 45 | 0.7% |
| Broadband Home | 4,094 | 66.4% |
| Cellular Data Only | 556 | 9.0% |
| Satellite Internet | 743 | 12.0% |
| No Internet | 1,137 | 18.4% |
| Total | 6,169 | 100.0% |
Terrell Summary
Terrell, Texas is a city located in Kaufman County, Texas, United States. It is situated approximately 32 miles east of Dallas and is part of the Dallas–Fort Worth metroplex. The population of Terrell was 15,816 at the 2010 census, making it the largest city in Kaufman County.
History
The area that is now Terrell was first settled in the 1840s by settlers from Tennessee and Kentucky. The town was originally known as "Frog Level" due to the abundance of frogs in the area. In 1873, the town was renamed "Terrell" in honor of Robert A. Terrell, a prominent local businessman.
The town was incorporated in 1875 and was designated as the county seat of Kaufman County. In 1876, the Texas and Pacific Railway arrived in Terrell, connecting the town to the rest of the state and nation. This allowed the town to become a major shipping center for the region.
In the early 1900s, Terrell was a major cotton-producing center. The town was also home to several large cotton gins and other businesses related to the cotton industry.
Geography
Terrell is located at 32°45'25" North, 96°17'45" West (32.756944, -96.295833). According to the United States Census Bureau, the city has a total area of 10.2 square miles, all of it land.
Economy
Terrell's economy is largely based on agriculture and manufacturing. The city is home to several large manufacturing plants, including a Tyson Foods poultry processing plant and a General Motors assembly plant.
The city is also home to several large retail stores including Walmart Lowe s and Home Depot
Demographics
As of the 2010 census, there were 15,816 people, 5,845 households, and 3,845 families residing in the city. The population density was 1,547.2 people per square mile. The racial makeup of the city was 68.2% White, 19.2% African American, 0.7% Native American, 0.7% Asian, 0.1% Pacific Islander, 8.7% from other races, and 2.4% from two or more races. Hispanic or Latino of any race were 18.2% of the population.
The median income for a household in the city was $37,945, and the median income for a family was $45,945. The per capita income for the city was $19,845. About 17.2% of families and 20.7% of the population were below the poverty line, including 28.2% of those under age 18 and 14.2% of those age 65 or over.
Conclusion
Terrell, Texas is a city located in Kaufman County, Texas, United States. It is situated approximately 32 miles east of Dallas and is part of the Dallas–Fort Worth metroplex. The population of Terrell was 15,816 at the 2010 census, making it the largest city in Kaufman County. The city has a long history, dating back to the 1840s when it was first settled by settlers from Tennessee and Kentucky. The town was incorporated in 1875 and was designated as the county seat of Kaufman County. The economy of Terrell is largely based on agriculture and manufacturing, with several large manufacturing plants and retail stores located in the city. The population of Terrell is diverse, with a median household income of $37,945 and a median family income of $45,945. The city also has a high poverty rate, with 17.2% of families and 20.7% of the population living below the poverty line.
Common Questions
What is Per Capita Income in Terrell?
Per Capita income in Terrell is $25,428.
What is the Median Family Income in Terrell?
Median Family Income in Terrell is $63,958.
What is the Median Household income in Terrell?
Median Household Income in Terrell is $61,513.
What is Income or Wage Gap in Terrell?
Income or Wage Gap in Terrell is 25.4%.
Women in Terrell earn 74.6 cents for every dollar earned by a man.
What is Family Income Deficit in Terrell?
Family Income Deficit in Terrell is $12,733.
Families that are below poverty line in Terrell earn $12,733 less on average than the poverty threshold level.
What is Inequality or Gini Index in Terrell?
Inequality or Gini Index in Terrell is 0.41.
What is the Total Population of Terrell?
Total Population of Terrell is 18,001.
What is the Total Male Population of Terrell?
Total Male Population of Terrell is 7,896.
What is the Total Female Population of Terrell?
Total Female Population of Terrell is 10,105.
What is the Ratio of Males per 100 Females in Terrell?
There are 78.14 Males per 100 Females in Terrell.
What is the Ratio of Females per 100 Males in Terrell?
There are 127.98 Females per 100 Males in Terrell.
What is the Median Population Age in Terrell?
Median Population Age in Terrell is 35.0 Years.
What is the Average Family Size in Terrell
Average Family Size in Terrell is 3.4 People.
What is the Average Household Size in Terrell
Average Household Size in Terrell is 2.8 People.
How Large is the Labor Force in Terrell?
There are 8,434 People in the Labor Forcein in Terrell.
What is the Percentage of People in the Labor Force in Terrell?
60.7% of People are in the Labor Force in Terrell.
What is the Unemployment Rate in Terrell?
Unemployment Rate in Terrell is 5.6%.