Keene, TX Map & Demographics
Keene Map
Keene Overview
$22,993
PER CAPITA INCOME
$68,833
AVG FAMILY INCOME
$53,701
AVG HOUSEHOLD INCOME
48.0%
WAGE / INCOME GAP [ % ]
52.0¢/ $1
WAGE / INCOME GAP [ $ ]
0.41
INEQUALITY / GINI INDEX
6,451
TOTAL POPULATION
2,943
MALE POPULATION
3,508
FEMALE POPULATION
83.89
MALES / 100 FEMALES
119.20
FEMALES / 100 MALES
31.4
MEDIAN AGE
3.4
AVG FAMILY SIZE
2.8
AVG HOUSEHOLD SIZE
3,104
LABOR FORCE [ PEOPLE ]
62.9%
PERCENT IN LABOR FORCE
4.5%
UNEMPLOYMENT RATE
Keene Zip Codes
Keene Area Codes
Income in Keene
Income Overview in Keene
Per Capita Income in Keene is $22,993, while median incomes of families and households are $68,833 and $53,701 respectively.
| Characteristic | Number | Measure |
| Per Capita Income | 6,451 | $22,993 |
| Median Family Income | 1,440 | $68,833 |
| Mean Family Income | 1,440 | $77,356 |
| Median Household Income | 2,109 | $53,701 |
| Mean Household Income | 2,109 | $67,386 |
| Income Deficit | 1,440 | $0 |
| Wage / Income Gap (%) | 6,451 | 48.04% |
| Wage / Income Gap ($) | 6,451 | 51.96¢ per $1 |
| Gini / Inequality Index | 6,451 | 0.41 |
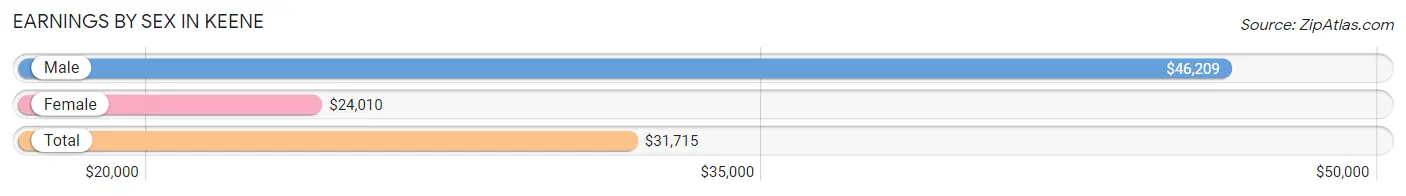
Earnings by Sex in Keene
Average Earnings in Keene are $31,715, $46,209 for men and $24,010 for women, a difference of 48.0%.
| Sex | Number | Average Earnings |
| Male | 1,569 (49.7%) | $46,209 |
| Female | 1,585 (50.2%) | $24,010 |
| Total | 3,154 (100.0%) | $31,715 |
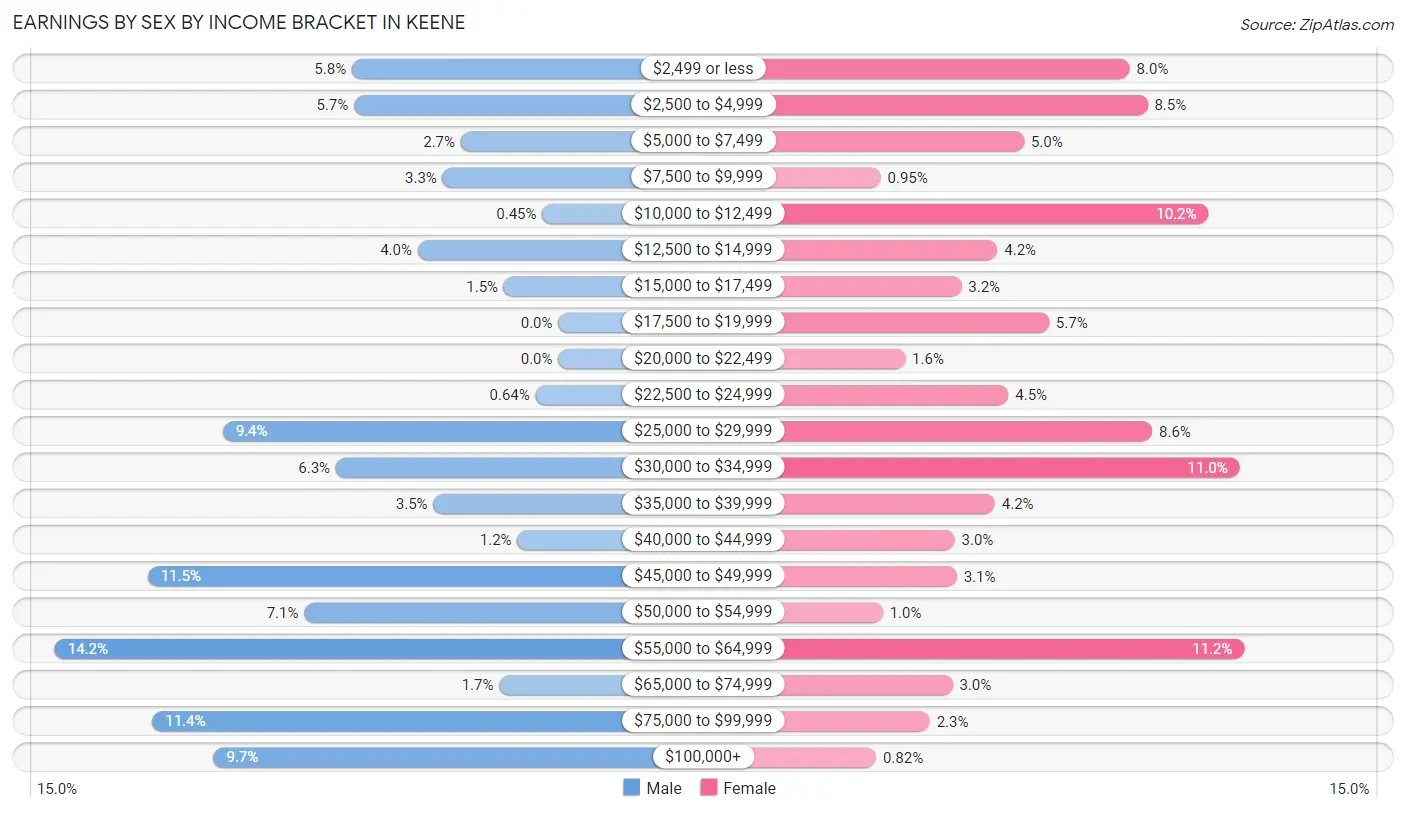
Earnings by Sex by Income Bracket in Keene
The most common earnings brackets in Keene are $55,000 to $64,999 for men (222 | 14.1%) and $55,000 to $64,999 for women (177 | 11.2%).
| Income | Male | Female |
| $2,499 or less | 91 (5.8%) | 126 (8.0%) |
| $2,500 to $4,999 | 90 (5.7%) | 134 (8.5%) |
| $5,000 to $7,499 | 43 (2.7%) | 79 (5.0%) |
| $7,500 to $9,999 | 51 (3.3%) | 15 (0.9%) |
| $10,000 to $12,499 | 7 (0.4%) | 161 (10.2%) |
| $12,500 to $14,999 | 62 (4.0%) | 67 (4.2%) |
| $15,000 to $17,499 | 24 (1.5%) | 51 (3.2%) |
| $17,500 to $19,999 | 0 (0.0%) | 90 (5.7%) |
| $20,000 to $22,499 | 0 (0.0%) | 26 (1.6%) |
| $22,500 to $24,999 | 10 (0.6%) | 72 (4.5%) |
| $25,000 to $29,999 | 148 (9.4%) | 136 (8.6%) |
| $30,000 to $34,999 | 98 (6.2%) | 175 (11.0%) |
| $35,000 to $39,999 | 55 (3.5%) | 66 (4.2%) |
| $40,000 to $44,999 | 18 (1.1%) | 48 (3.0%) |
| $45,000 to $49,999 | 181 (11.5%) | 49 (3.1%) |
| $50,000 to $54,999 | 112 (7.1%) | 16 (1.0%) |
| $55,000 to $64,999 | 222 (14.1%) | 177 (11.2%) |
| $65,000 to $74,999 | 26 (1.7%) | 47 (3.0%) |
| $75,000 to $99,999 | 179 (11.4%) | 37 (2.3%) |
| $100,000+ | 152 (9.7%) | 13 (0.8%) |
| Total | 1,569 (100.0%) | 1,585 (100.0%) |
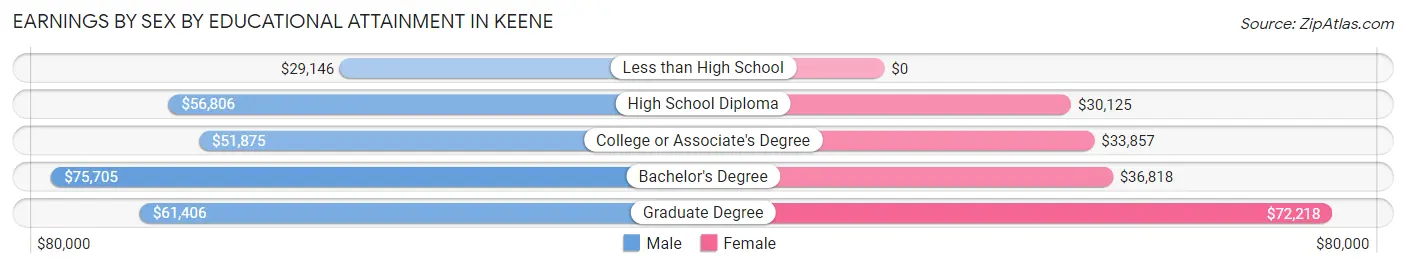
Earnings by Sex by Educational Attainment in Keene
Average earnings in Keene are $51,875 for men and $31,357 for women, a difference of 39.6%. Men with an educational attainment of bachelor's degree enjoy the highest average annual earnings of $75,705, while those with less than high school education earn the least with $29,146. Women with an educational attainment of graduate degree earn the most with the average annual earnings of $72,218, while those with high school diploma education have the smallest earnings of $30,125.
| Educational Attainment | Male Income | Female Income |
| Less than High School | $29,146 | $0 |
| High School Diploma | $56,806 | $30,125 |
| College or Associate's Degree | $51,875 | $33,857 |
| Bachelor's Degree | $75,705 | $36,818 |
| Graduate Degree | $61,406 | $72,218 |
| Total | $51,875 | $31,357 |
Family Income in Keene
Family Income Brackets in Keene
According to the Keene family income data, there are 323 families falling into the $35,000 to $49,999 income range, which is the most common income bracket and makes up 22.4% of all families. Conversely, the $10,000 to $14,999 income bracket is the least frequent group with only 9 families (0.6%) belonging to this category.
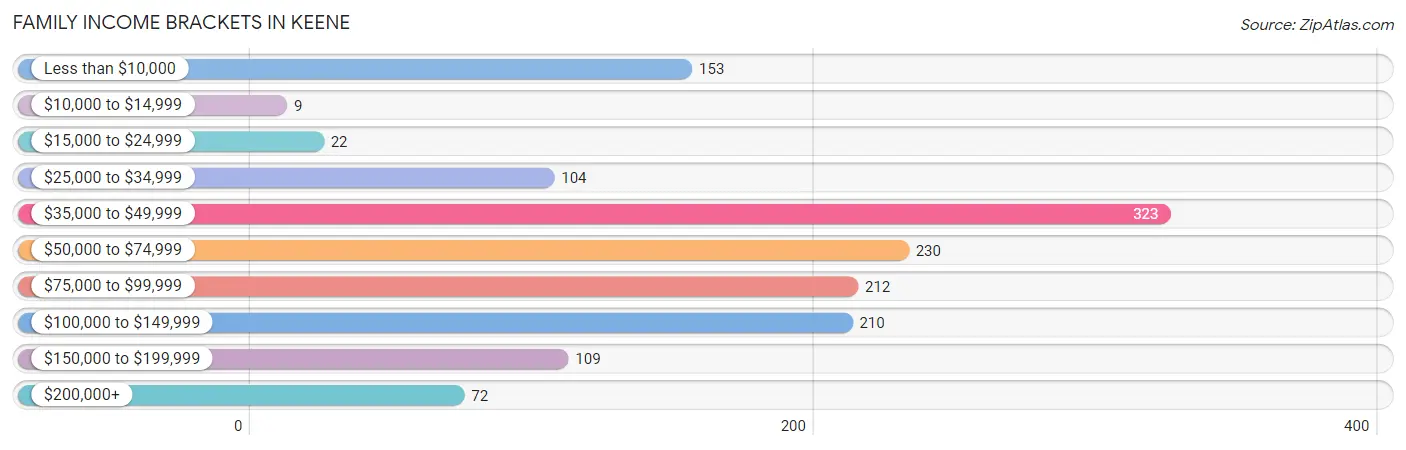
| Income Bracket | # Families | % Families |
| Less than $10,000 | 153 | 10.6% |
| $10,000 to $14,999 | 9 | 0.6% |
| $15,000 to $24,999 | 22 | 1.5% |
| $25,000 to $34,999 | 104 | 7.2% |
| $35,000 to $49,999 | 323 | 22.4% |
| $50,000 to $74,999 | 230 | 16.0% |
| $75,000 to $99,999 | 212 | 14.7% |
| $100,000 to $149,999 | 210 | 14.6% |
| $150,000 to $199,999 | 109 | 7.6% |
| $200,000+ | 72 | 5.0% |
Family Income by Famaliy Size in Keene
4-person families (326 | 22.6%) account for the highest median family income in Keene with $120,125 per family, while 4-person families (326 | 22.6%) have the highest median income of $30,031 per family member.
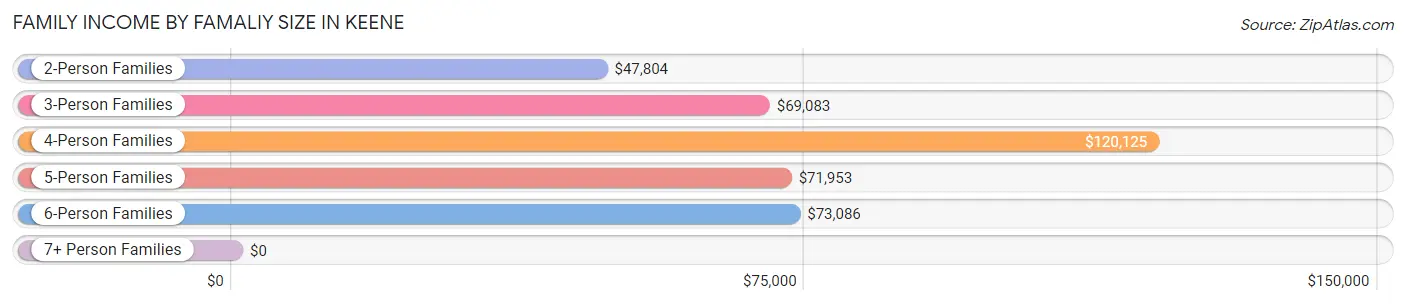
| Income Bracket | # Families | Median Income |
| 2-Person Families | 544 (37.8%) | $47,804 |
| 3-Person Families | 305 (21.2%) | $69,083 |
| 4-Person Families | 326 (22.6%) | $120,125 |
| 5-Person Families | 210 (14.6%) | $71,953 |
| 6-Person Families | 49 (3.4%) | $73,086 |
| 7+ Person Families | 6 (0.4%) | $0 |
| Total | 1,440 (100.0%) | $68,833 |
Family Income by Number of Earners in Keene
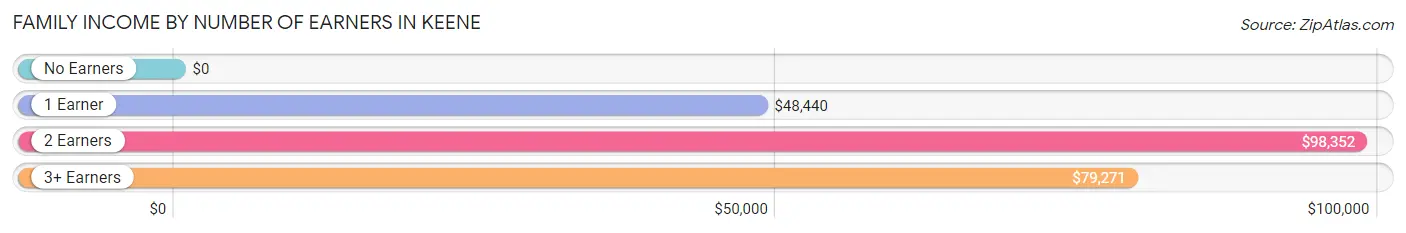
| Number of Earners | # Families | Median Income |
| No Earners | 215 (14.9%) | $0 |
| 1 Earner | 476 (33.1%) | $48,440 |
| 2 Earners | 553 (38.4%) | $98,352 |
| 3+ Earners | 196 (13.6%) | $79,271 |
| Total | 1,440 (100.0%) | $68,833 |
Household Income in Keene
Household Income Brackets in Keene
With 390 households falling in the category, the $35,000 to $49,999 income range is the most frequent in Keene, accounting for 18.5% of all households. In contrast, only 72 households (3.4%) fall into the $200,000+ income bracket, making it the least populous group.
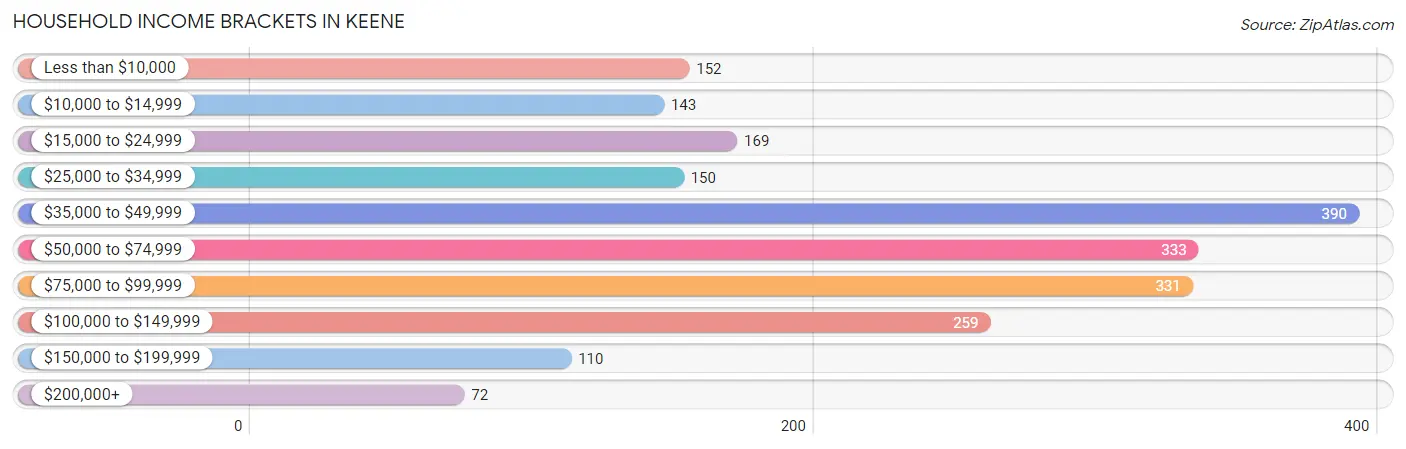
| Income Bracket | # Households | % Households |
| Less than $10,000 | 152 | 7.2% |
| $10,000 to $14,999 | 143 | 6.8% |
| $15,000 to $24,999 | 169 | 8.0% |
| $25,000 to $34,999 | 150 | 7.1% |
| $35,000 to $49,999 | 390 | 18.5% |
| $50,000 to $74,999 | 333 | 15.8% |
| $75,000 to $99,999 | 331 | 15.7% |
| $100,000 to $149,999 | 259 | 12.3% |
| $150,000 to $199,999 | 110 | 5.2% |
| $200,000+ | 72 | 3.4% |
Household Income by Householder Age in Keene
The median household income in Keene is $53,701, with the highest median household income of $75,217 found in the 25 to 44 years age bracket for the primary householder. A total of 806 households (38.2%) fall into this category. Meanwhile, the 15 to 24 years age bracket for the primary householder has the lowest median household income of $18,580, with 179 households (8.5%) in this group.
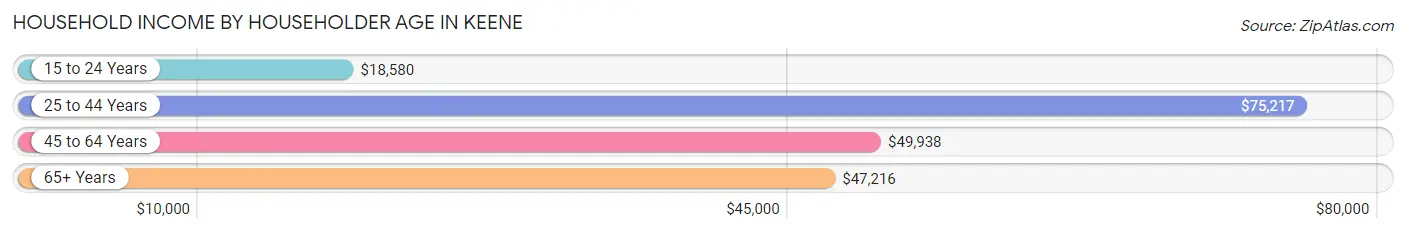
| Income Bracket | # Households | Median Income |
| 15 to 24 Years | 179 (8.5%) | $18,580 |
| 25 to 44 Years | 806 (38.2%) | $75,217 |
| 45 to 64 Years | 717 (34.0%) | $49,938 |
| 65+ Years | 407 (19.3%) | $47,216 |
| Total | 2,109 (100.0%) | $53,701 |
Poverty in Keene
Income Below Poverty by Sex and Age in Keene
With 9.3% poverty level for males and 15.0% for females among the residents of Keene, 75 year old and over males and 18 to 24 year old females are the most vulnerable to poverty, with 40 males (32.0%) and 246 females (40.2%) in their respective age groups living below the poverty level.
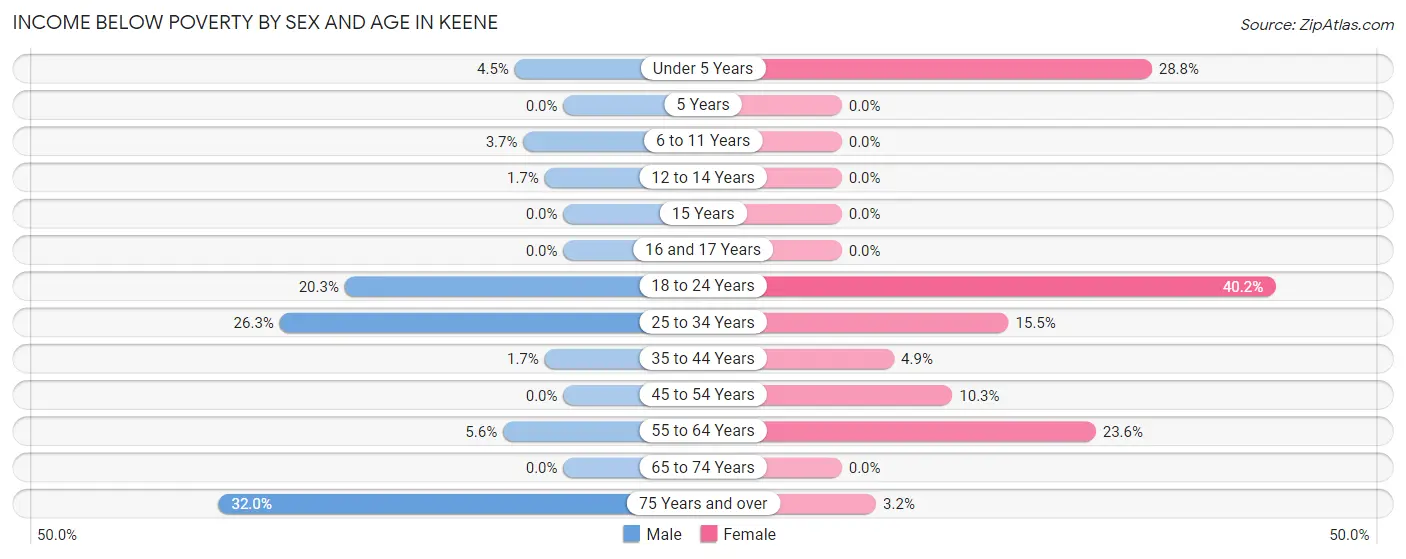
| Age Bracket | Male | Female |
| Under 5 Years | 10 (4.5%) | 42 (28.8%) |
| 5 Years | 0 (0.0%) | 0 (0.0%) |
| 6 to 11 Years | 10 (3.7%) | 0 (0.0%) |
| 12 to 14 Years | 5 (1.7%) | 0 (0.0%) |
| 15 Years | 0 (0.0%) | 0 (0.0%) |
| 16 and 17 Years | 0 (0.0%) | 0 (0.0%) |
| 18 to 24 Years | 42 (20.3%) | 246 (40.2%) |
| 25 to 34 Years | 124 (26.3%) | 65 (15.5%) |
| 35 to 44 Years | 6 (1.7%) | 14 (4.9%) |
| 45 to 54 Years | 0 (0.0%) | 39 (10.3%) |
| 55 to 64 Years | 13 (5.6%) | 66 (23.6%) |
| 65 to 74 Years | 0 (0.0%) | 0 (0.0%) |
| 75 Years and over | 40 (32.0%) | 12 (3.2%) |
| Total | 250 (9.3%) | 484 (15.0%) |
Income Above Poverty by Sex and Age in Keene
According to the poverty statistics in Keene, males aged 15 years and females aged 5 years are the age groups that are most secure financially, with 100.0% of males and 100.0% of females in these age groups living above the poverty line.
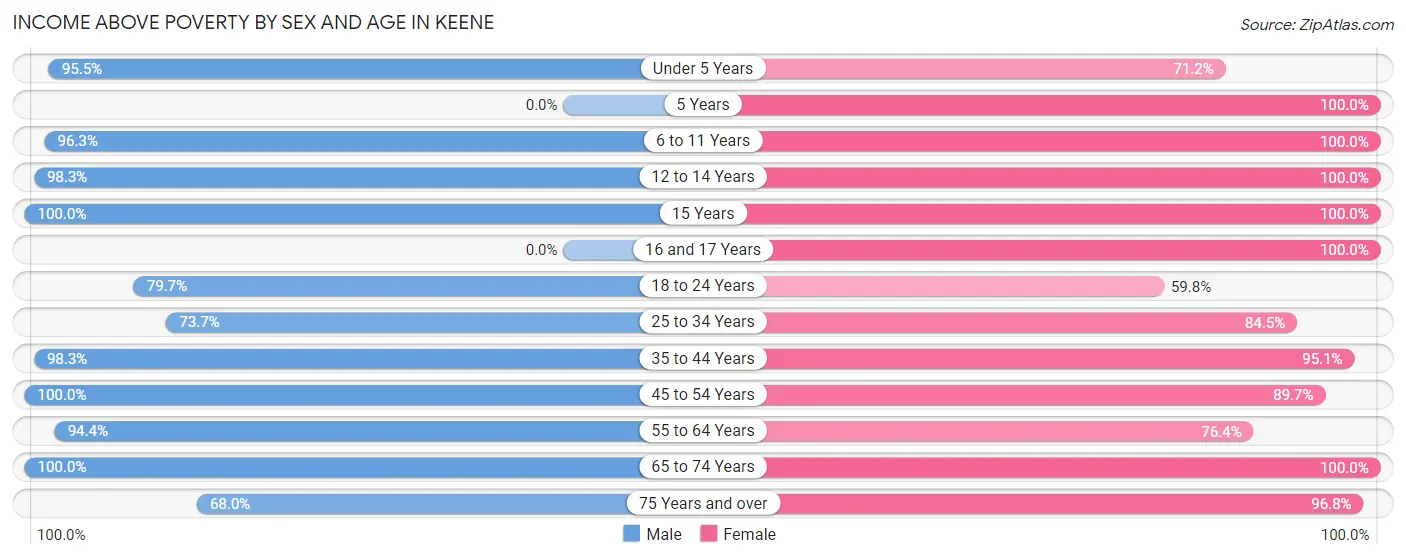
| Age Bracket | Male | Female |
| Under 5 Years | 211 (95.5%) | 104 (71.2%) |
| 5 Years | 0 (0.0%) | 30 (100.0%) |
| 6 to 11 Years | 259 (96.3%) | 375 (100.0%) |
| 12 to 14 Years | 282 (98.3%) | 29 (100.0%) |
| 15 Years | 53 (100.0%) | 31 (100.0%) |
| 16 and 17 Years | 0 (0.0%) | 84 (100.0%) |
| 18 to 24 Years | 165 (79.7%) | 366 (59.8%) |
| 25 to 34 Years | 347 (73.7%) | 355 (84.5%) |
| 35 to 44 Years | 338 (98.3%) | 274 (95.1%) |
| 45 to 54 Years | 363 (100.0%) | 341 (89.7%) |
| 55 to 64 Years | 219 (94.4%) | 214 (76.4%) |
| 65 to 74 Years | 118 (100.0%) | 173 (100.0%) |
| 75 Years and over | 85 (68.0%) | 364 (96.8%) |
| Total | 2,440 (90.7%) | 2,740 (85.0%) |
Income Below Poverty Among Married-Couple Families in Keene
The poverty statistics for married-couple families in Keene show that 11.5% or 125 of the total 1,083 families live below the poverty line. Families with no children have the highest poverty rate of 15.6%, comprising of 65 families. On the other hand, families with 3 or 4 children have the lowest poverty rate of 0.0%, which includes 0 families.
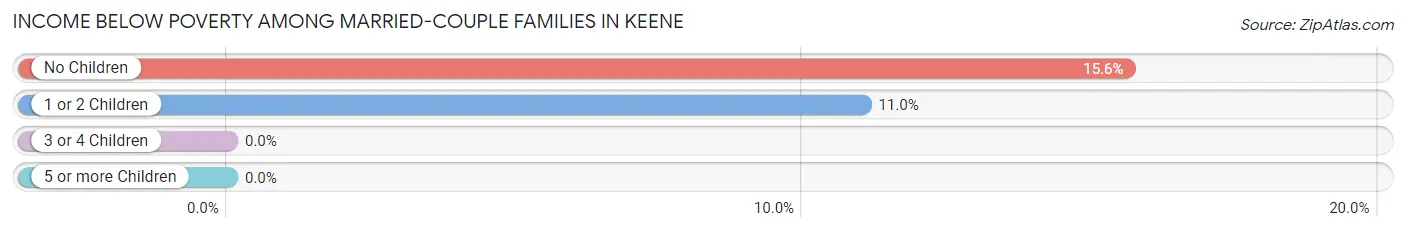
| Children | Above Poverty | Below Poverty |
| No Children | 351 (84.4%) | 65 (15.6%) |
| 1 or 2 Children | 484 (89.0%) | 60 (11.0%) |
| 3 or 4 Children | 117 (100.0%) | 0 (0.0%) |
| 5 or more Children | 6 (100.0%) | 0 (0.0%) |
| Total | 958 (88.5%) | 125 (11.5%) |
Income Below Poverty Among Single-Parent Households in Keene
According to the poverty data in Keene, 17.8% or 16 single-father households and 9.0% or 24 single-mother households are living below the poverty line. Among single-father households, those with no children have the highest poverty rate, with 16 households (53.3%) experiencing poverty. Likewise, among single-mother households, those with 1 or 2 children have the highest poverty rate, with 24 households (82.8%) falling below the poverty line.
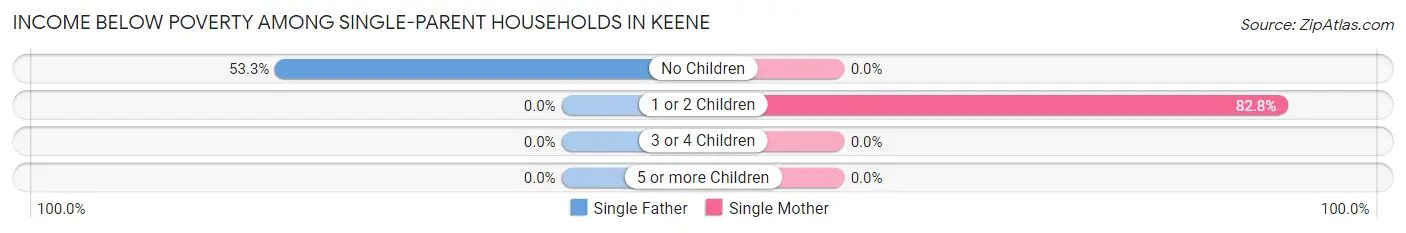
| Children | Single Father | Single Mother |
| No Children | 16 (53.3%) | 0 (0.0%) |
| 1 or 2 Children | 0 (0.0%) | 24 (82.8%) |
| 3 or 4 Children | 0 (0.0%) | 0 (0.0%) |
| 5 or more Children | 0 (0.0%) | 0 (0.0%) |
| Total | 16 (17.8%) | 24 (9.0%) |
Income Below Poverty Among Married-Couple vs Single-Parent Households in Keene
The poverty data for Keene shows that 125 of the married-couple family households (11.5%) and 40 of the single-parent households (11.2%) are living below the poverty level. Within the married-couple family households, those with no children have the highest poverty rate, with 65 households (15.6%) falling below the poverty line. Among the single-parent households, those with 1 or 2 children have the highest poverty rate, with 24 household (42.1%) living below poverty.
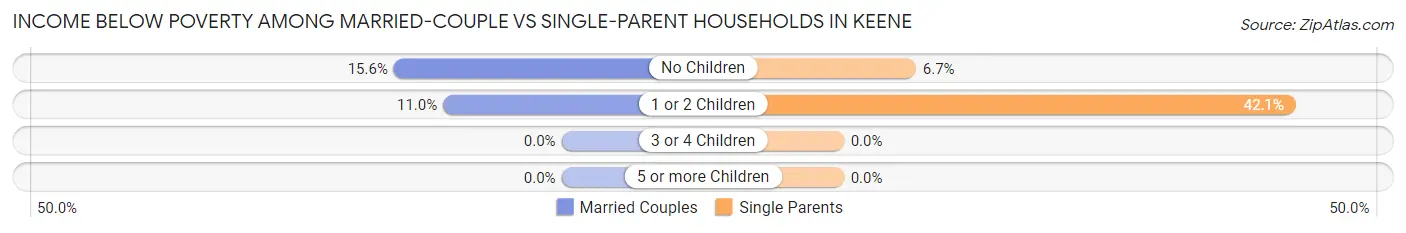
| Children | Married-Couple Families | Single-Parent Households |
| No Children | 65 (15.6%) | 16 (6.7%) |
| 1 or 2 Children | 60 (11.0%) | 24 (42.1%) |
| 3 or 4 Children | 0 (0.0%) | 0 (0.0%) |
| 5 or more Children | 0 (0.0%) | 0 (0.0%) |
| Total | 125 (11.5%) | 40 (11.2%) |
Race in Keene
The most populous races in Keene are White / Caucasian (5,470 | 84.8%), Hispanic or Latino (2,131 | 33.0%), and Two or more Races (432 | 6.7%).
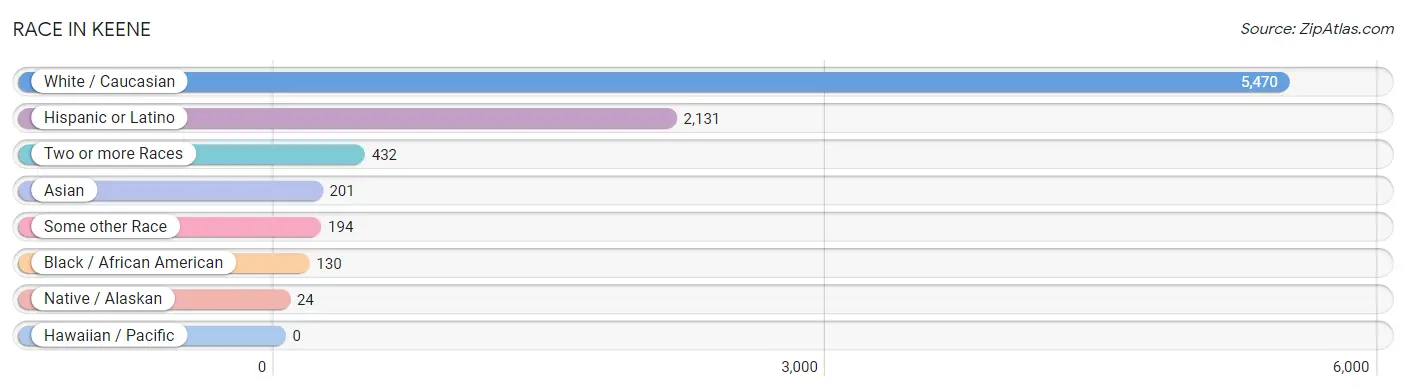
| Race | # Population | % Population |
| Asian | 201 | 3.1% |
| Black / African American | 130 | 2.0% |
| Hawaiian / Pacific | 0 | 0.0% |
| Hispanic or Latino | 2,131 | 33.0% |
| Native / Alaskan | 24 | 0.4% |
| White / Caucasian | 5,470 | 84.8% |
| Two or more Races | 432 | 6.7% |
| Some other Race | 194 | 3.0% |
| Total | 6,451 | 100.0% |
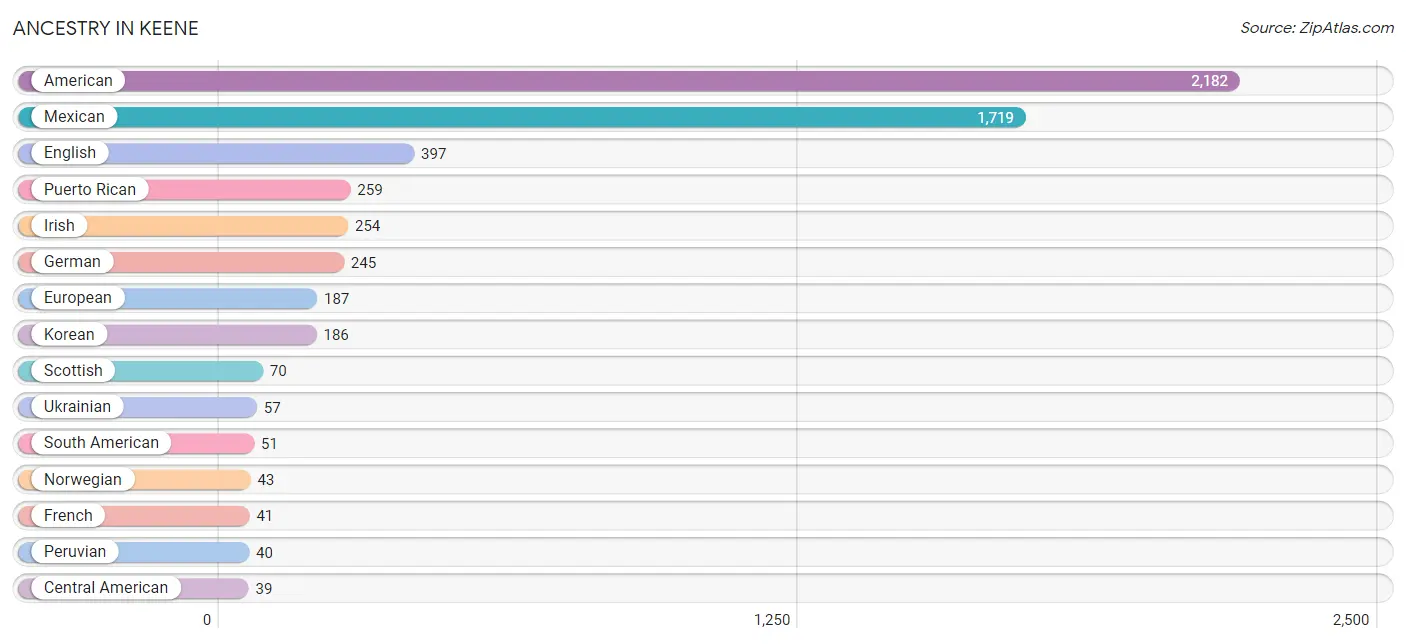
Ancestry in Keene
The most populous ancestries reported in Keene are American (2,182 | 33.8%), Mexican (1,719 | 26.7%), English (397 | 6.1%), Puerto Rican (259 | 4.0%), and Irish (254 | 3.9%), together accounting for 74.6% of all Keene residents.
| Ancestry | # Population | % Population |
| African | 18 | 0.3% |
| American | 2,182 | 33.8% |
| Bahamian | 2 | 0.0% |
| Belizean | 1 | 0.0% |
| British | 15 | 0.2% |
| Central American | 39 | 0.6% |
| Central American Indian | 7 | 0.1% |
| Cuban | 26 | 0.4% |
| Danish | 7 | 0.1% |
| Dutch | 11 | 0.2% |
| English | 397 | 6.1% |
| European | 187 | 2.9% |
| Finnish | 14 | 0.2% |
| French | 41 | 0.6% |
| German | 245 | 3.8% |
| Ghanaian | 2 | 0.0% |
| Guatemalan | 5 | 0.1% |
| Haitian | 1 | 0.0% |
| Honduran | 6 | 0.1% |
| Hungarian | 1 | 0.0% |
| Indian (Asian) | 11 | 0.2% |
| Irish | 254 | 3.9% |
| Italian | 9 | 0.1% |
| Jamaican | 23 | 0.4% |
| Korean | 186 | 2.9% |
| Lithuanian | 9 | 0.1% |
| Mexican | 1,719 | 26.7% |
| Nigerian | 6 | 0.1% |
| Norwegian | 43 | 0.7% |
| Panamanian | 27 | 0.4% |
| Peruvian | 40 | 0.6% |
| Polish | 25 | 0.4% |
| Portuguese | 2 | 0.0% |
| Puerto Rican | 259 | 4.0% |
| Salvadoran | 1 | 0.0% |
| Scotch-Irish | 5 | 0.1% |
| Scottish | 70 | 1.1% |
| Serbian | 10 | 0.2% |
| South American | 51 | 0.8% |
| Spanish | 14 | 0.2% |
| Subsaharan African | 26 | 0.4% |
| Swedish | 16 | 0.3% |
| Swiss | 8 | 0.1% |
| Thai | 5 | 0.1% |
| Trinidadian and Tobagonian | 7 | 0.1% |
| Ukrainian | 57 | 0.9% |
| Venezuelan | 11 | 0.2% |
| West Indian | 2 | 0.0% | View All 48 Rows |
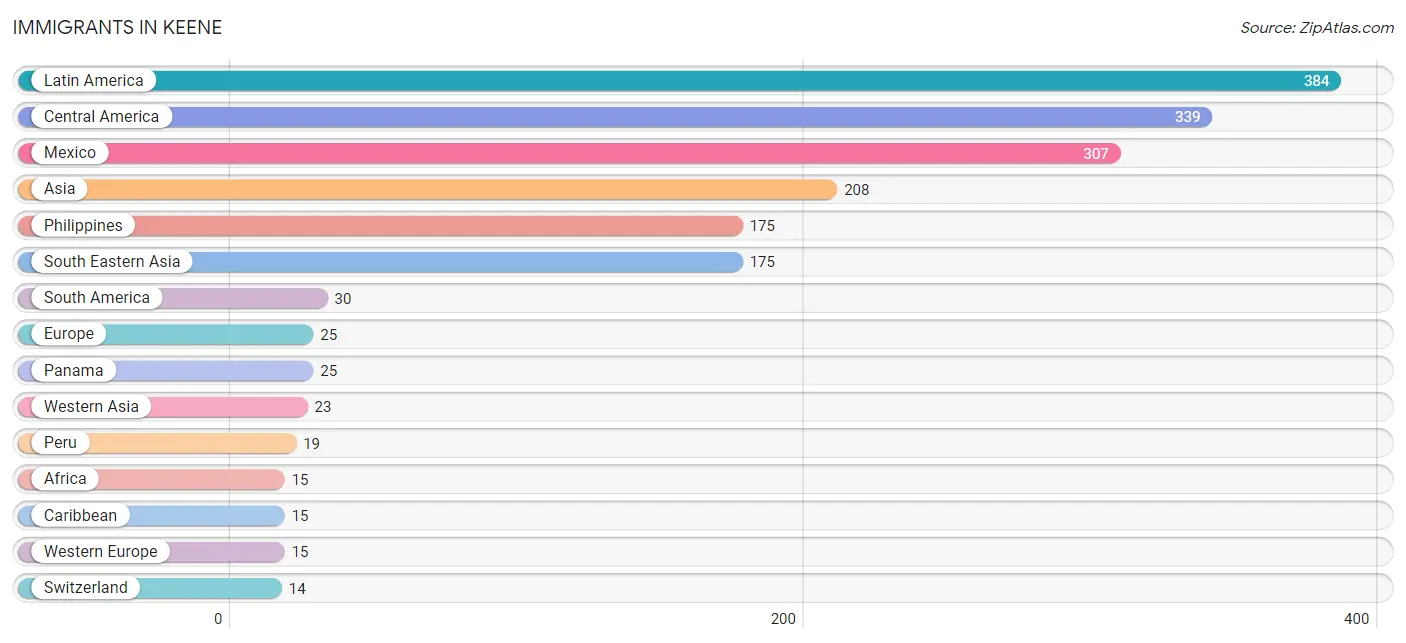
Immigrants in Keene
The most numerous immigrant groups reported in Keene came from Latin America (384 | 5.9%), Central America (339 | 5.2%), Mexico (307 | 4.8%), Asia (208 | 3.2%), and Philippines (175 | 2.7%), together accounting for 21.9% of all Keene residents.
| Immigration Origin | # Population | % Population |
| Africa | 15 | 0.2% |
| Asia | 208 | 3.2% |
| Austria | 1 | 0.0% |
| Bahamas | 2 | 0.0% |
| Belize | 1 | 0.0% |
| Cabo Verde | 1 | 0.0% |
| Canada | 6 | 0.1% |
| Caribbean | 15 | 0.2% |
| Central America | 339 | 5.2% |
| China | 10 | 0.2% |
| Cuba | 2 | 0.0% |
| Eastern Africa | 8 | 0.1% |
| Eastern Asia | 10 | 0.2% |
| Eastern Europe | 10 | 0.2% |
| Europe | 25 | 0.4% |
| Honduras | 6 | 0.1% |
| Jamaica | 11 | 0.2% |
| Latin America | 384 | 5.9% |
| Mexico | 307 | 4.8% |
| Nigeria | 6 | 0.1% |
| Panama | 25 | 0.4% |
| Peru | 19 | 0.3% |
| Philippines | 175 | 2.7% |
| Serbia | 10 | 0.2% |
| South America | 30 | 0.5% |
| South Eastern Asia | 175 | 2.7% |
| Switzerland | 14 | 0.2% |
| Venezuela | 11 | 0.2% |
| Western Africa | 7 | 0.1% |
| Western Asia | 23 | 0.4% |
| Western Europe | 15 | 0.2% | View All 31 Rows |
Sex and Age in Keene
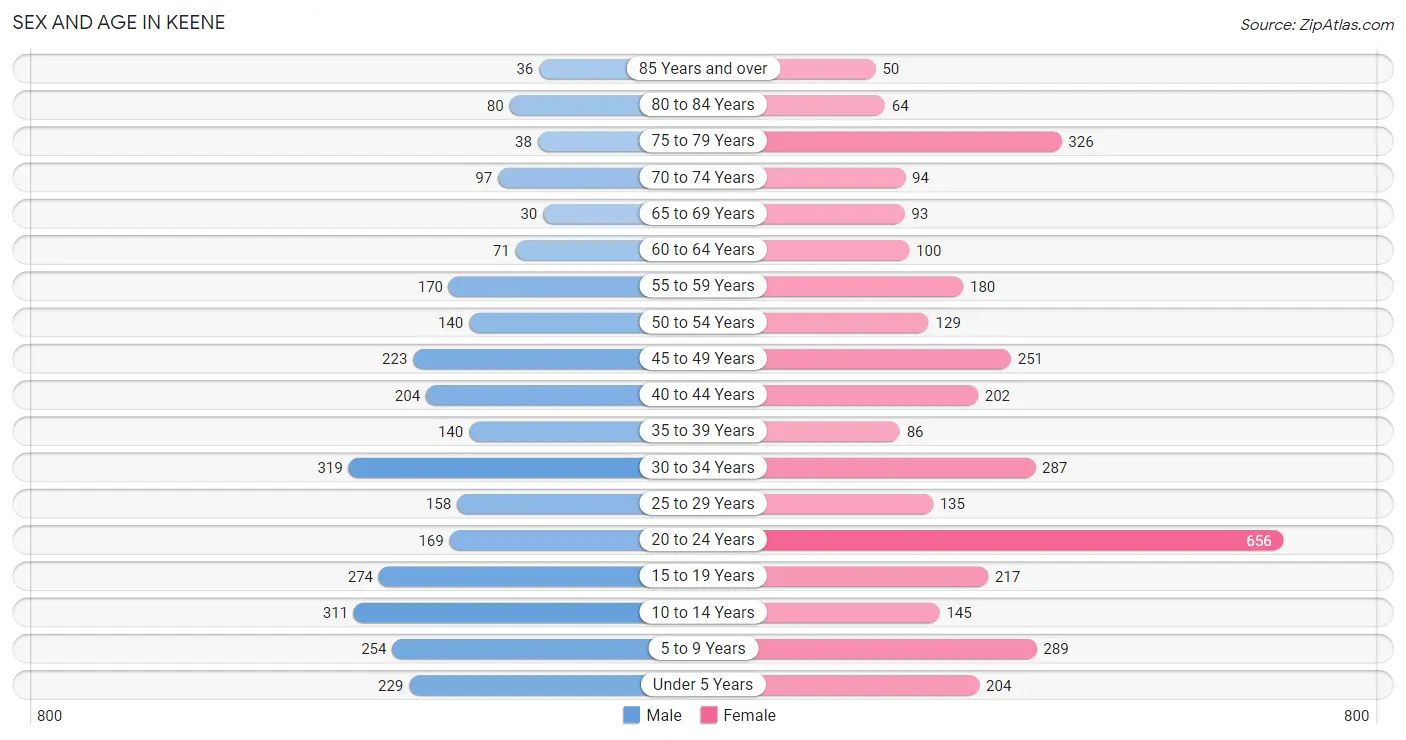
Sex and Age in Keene
The most populous age groups in Keene are 30 to 34 Years (319 | 10.8%) for men and 20 to 24 Years (656 | 18.7%) for women.
| Age Bracket | Male | Female |
| Under 5 Years | 229 (7.8%) | 204 (5.8%) |
| 5 to 9 Years | 254 (8.6%) | 289 (8.2%) |
| 10 to 14 Years | 311 (10.6%) | 145 (4.1%) |
| 15 to 19 Years | 274 (9.3%) | 217 (6.2%) |
| 20 to 24 Years | 169 (5.7%) | 656 (18.7%) |
| 25 to 29 Years | 158 (5.4%) | 135 (3.8%) |
| 30 to 34 Years | 319 (10.8%) | 287 (8.2%) |
| 35 to 39 Years | 140 (4.8%) | 86 (2.5%) |
| 40 to 44 Years | 204 (6.9%) | 202 (5.8%) |
| 45 to 49 Years | 223 (7.6%) | 251 (7.2%) |
| 50 to 54 Years | 140 (4.8%) | 129 (3.7%) |
| 55 to 59 Years | 170 (5.8%) | 180 (5.1%) |
| 60 to 64 Years | 71 (2.4%) | 100 (2.9%) |
| 65 to 69 Years | 30 (1.0%) | 93 (2.6%) |
| 70 to 74 Years | 97 (3.3%) | 94 (2.7%) |
| 75 to 79 Years | 38 (1.3%) | 326 (9.3%) |
| 80 to 84 Years | 80 (2.7%) | 64 (1.8%) |
| 85 Years and over | 36 (1.2%) | 50 (1.4%) |
| Total | 2,943 (100.0%) | 3,508 (100.0%) |
Families and Households in Keene
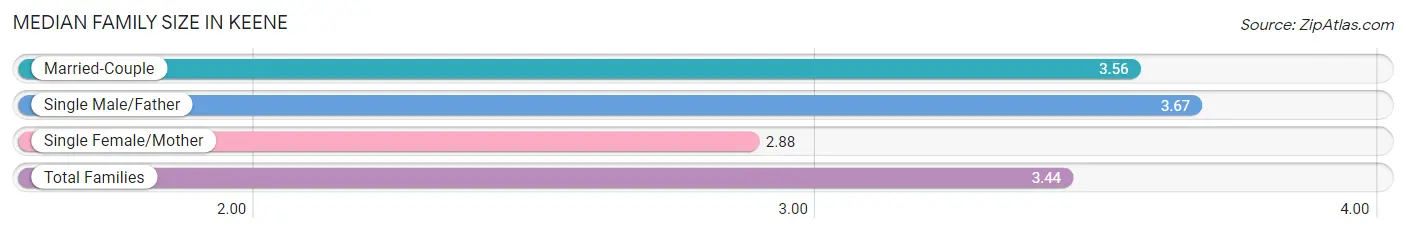
Median Family Size in Keene
The median family size in Keene is 3.44 persons per family, with single male/father families (90 | 6.2%) accounting for the largest median family size of 3.67 persons per family. On the other hand, single female/mother families (267 | 18.5%) represent the smallest median family size with 2.88 persons per family.
| Family Type | # Families | Family Size |
| Married-Couple | 1,083 (75.2%) | 3.56 |
| Single Male/Father | 90 (6.2%) | 3.67 |
| Single Female/Mother | 267 (18.5%) | 2.88 |
| Total Families | 1,440 (100.0%) | 3.44 |
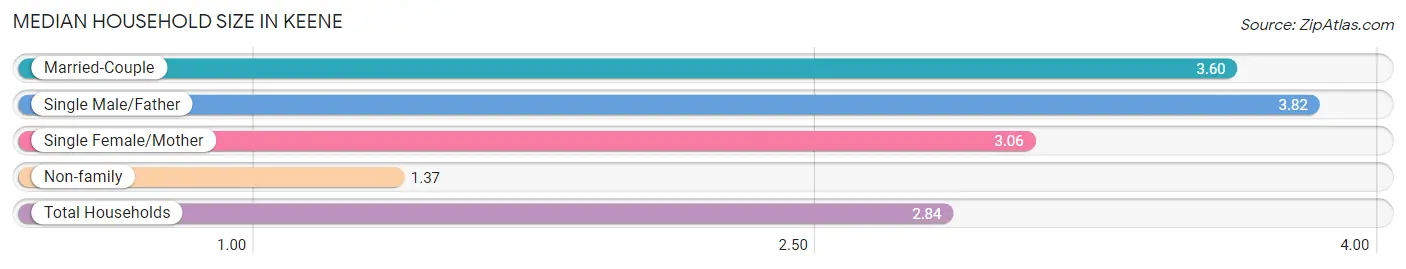
Median Household Size in Keene
The median household size in Keene is 2.84 persons per household, with single male/father households (90 | 4.3%) accounting for the largest median household size of 3.82 persons per household. non-family households (669 | 31.7%) represent the smallest median household size with 1.37 persons per household.
| Household Type | # Households | Household Size |
| Married-Couple | 1,083 (51.3%) | 3.60 |
| Single Male/Father | 90 (4.3%) | 3.82 |
| Single Female/Mother | 267 (12.7%) | 3.06 |
| Non-family | 669 (31.7%) | 1.37 |
| Total Households | 2,109 (100.0%) | 2.84 |
Household Size by Marriage Status in Keene
Out of a total of 2,109 households in Keene, 1,440 (68.3%) are family households, while 669 (31.7%) are nonfamily households. The most numerous type of family households are 2-person households, comprising 488, and the most common type of nonfamily households are 1-person households, comprising 572.
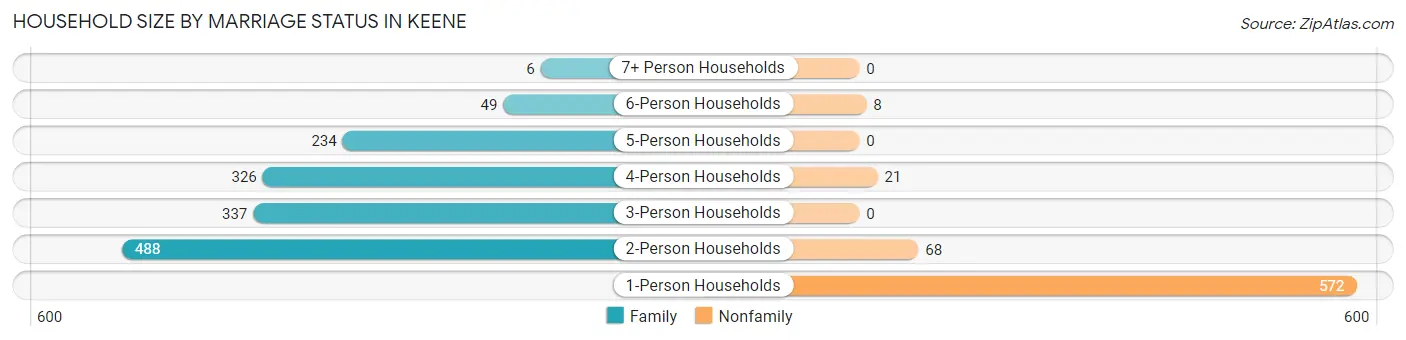
| Household Size | Family Households | Nonfamily Households |
| 1-Person Households | - | 572 (27.1%) |
| 2-Person Households | 488 (23.1%) | 68 (3.2%) |
| 3-Person Households | 337 (16.0%) | 0 (0.0%) |
| 4-Person Households | 326 (15.5%) | 21 (1.0%) |
| 5-Person Households | 234 (11.1%) | 0 (0.0%) |
| 6-Person Households | 49 (2.3%) | 8 (0.4%) |
| 7+ Person Households | 6 (0.3%) | 0 (0.0%) |
| Total | 1,440 (68.3%) | 669 (31.7%) |
Female Fertility in Keene
Fertility by Age in Keene
Average fertility rate in Keene is 72.0 births per 1,000 women. Women in the age bracket of 20 to 34 years have the highest fertility rate with 117.0 births per 1,000 women. Women in the age bracket of 20 to 34 years acount for 93.3% of all women with births.
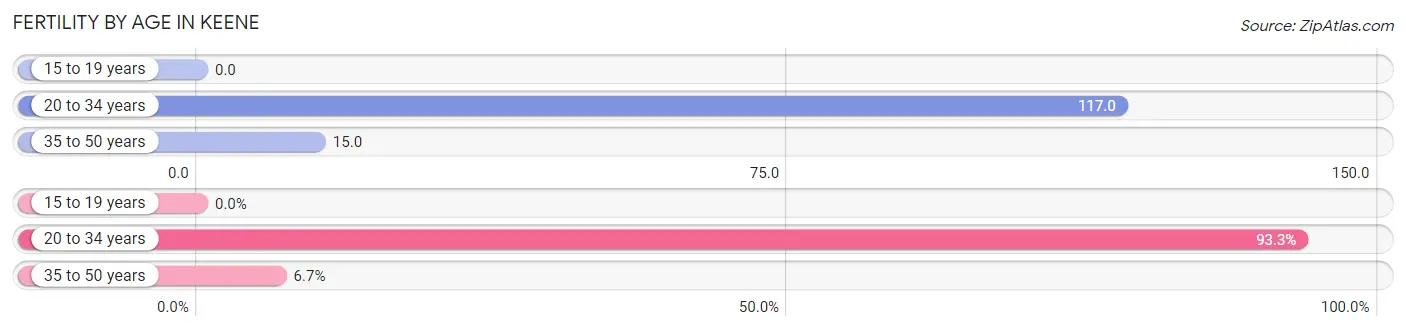
| Age Bracket | Women with Births | Births / 1,000 Women |
| 15 to 19 years | 0 (0.0%) | 0.0 |
| 20 to 34 years | 126 (93.3%) | 117.0 |
| 35 to 50 years | 9 (6.7%) | 15.0 |
| Total | 135 (100.0%) | 72.0 |
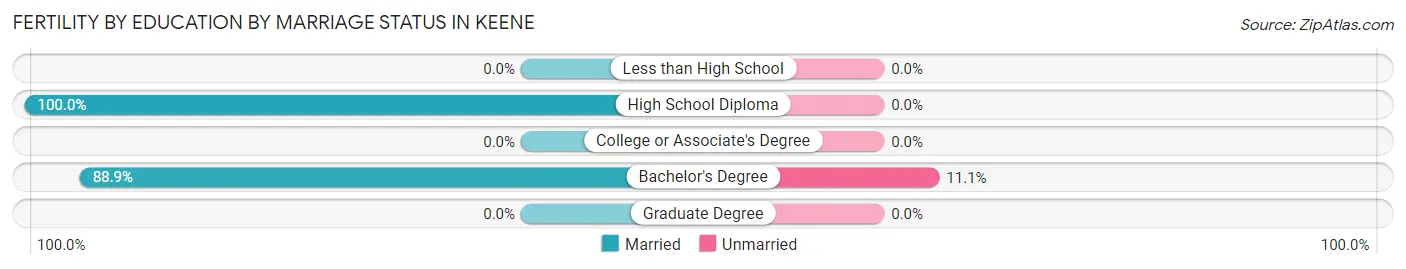
Fertility by Age by Marriage Status in Keene
89.6% of women with births (135) in Keene are married. The highest percentage of unmarried women with births falls into 20 to 34 years age bracket with 11.1% of them unmarried at the time of birth, while the lowest percentage of unmarried women with births belong to 35 to 50 years age bracket with 0.0% of them unmarried.
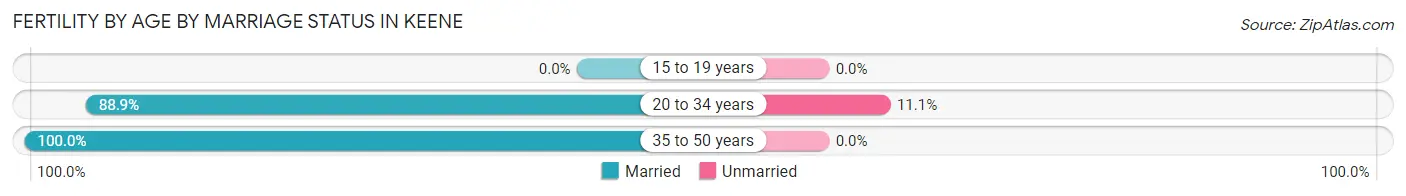
| Age Bracket | Married | Unmarried |
| 15 to 19 years | 0 (0.0%) | 0 (0.0%) |
| 20 to 34 years | 112 (88.9%) | 14 (11.1%) |
| 35 to 50 years | 9 (100.0%) | 0 (0.0%) |
| Total | 121 (89.6%) | 14 (10.4%) |
Fertility by Education in Keene
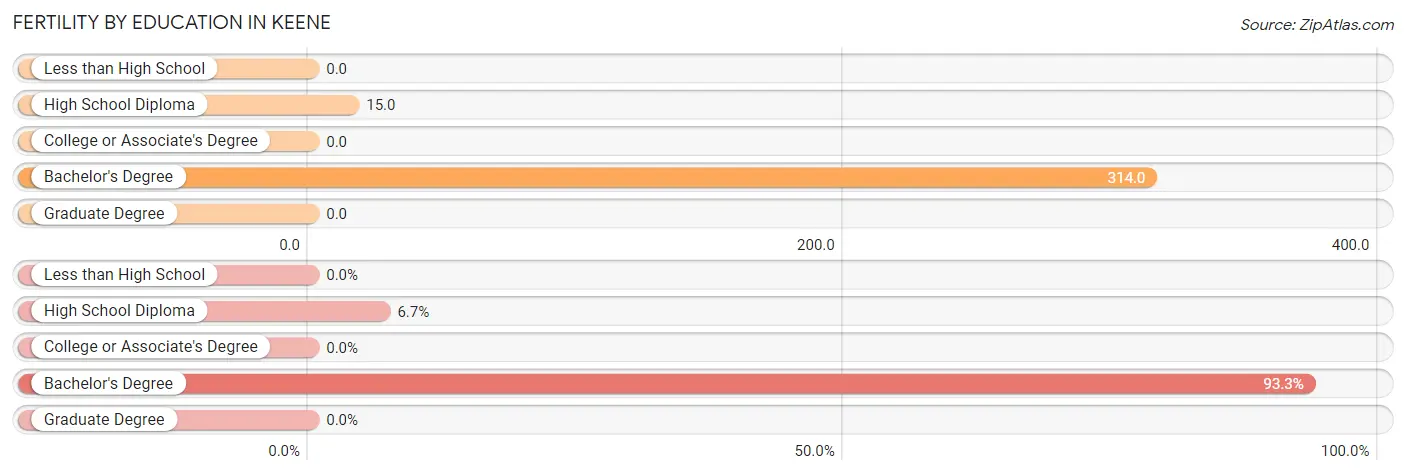
| Educational Attainment | Women with Births | Births / 1,000 Women |
| Less than High School | 0 (0.0%) | 0.0 |
| High School Diploma | 9 (6.7%) | 15.0 |
| College or Associate's Degree | 0 (0.0%) | 0.0 |
| Bachelor's Degree | 126 (93.3%) | 314.0 |
| Graduate Degree | 0 (0.0%) | 0.0 |
| Total | 135 (100.0%) | 72.0 |
Fertility by Education by Marriage Status in Keene
10.4% of women with births in Keene are unmarried. Women with the educational attainment of high school diploma are most likely to be married with 100.0% of them married at childbirth, while women with the educational attainment of bachelor's degree are least likely to be married with 11.1% of them unmarried at childbirth.
| Educational Attainment | Married | Unmarried |
| Less than High School | 0 (0.0%) | 0 (0.0%) |
| High School Diploma | 9 (100.0%) | 0 (0.0%) |
| College or Associate's Degree | 0 (0.0%) | 0 (0.0%) |
| Bachelor's Degree | 112 (88.9%) | 14 (11.1%) |
| Graduate Degree | 0 (0.0%) | 0 (0.0%) |
| Total | 121 (89.6%) | 14 (10.4%) |
Employment Characteristics in Keene
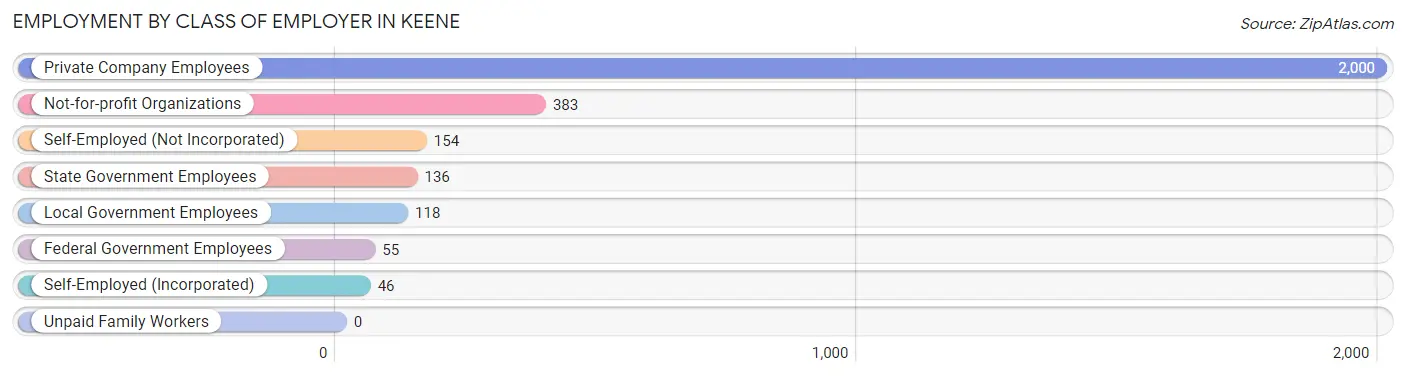
Employment by Class of Employer in Keene
Among the 2,892 employed individuals in Keene, private company employees (2,000 | 69.2%), not-for-profit organizations (383 | 13.2%), and self-employed (not incorporated) (154 | 5.3%) make up the most common classes of employment.
| Employer Class | # Employees | % Employees |
| Private Company Employees | 2,000 | 69.2% |
| Self-Employed (Incorporated) | 46 | 1.6% |
| Self-Employed (Not Incorporated) | 154 | 5.3% |
| Not-for-profit Organizations | 383 | 13.2% |
| Local Government Employees | 118 | 4.1% |
| State Government Employees | 136 | 4.7% |
| Federal Government Employees | 55 | 1.9% |
| Unpaid Family Workers | 0 | 0.0% |
| Total | 2,892 | 100.0% |
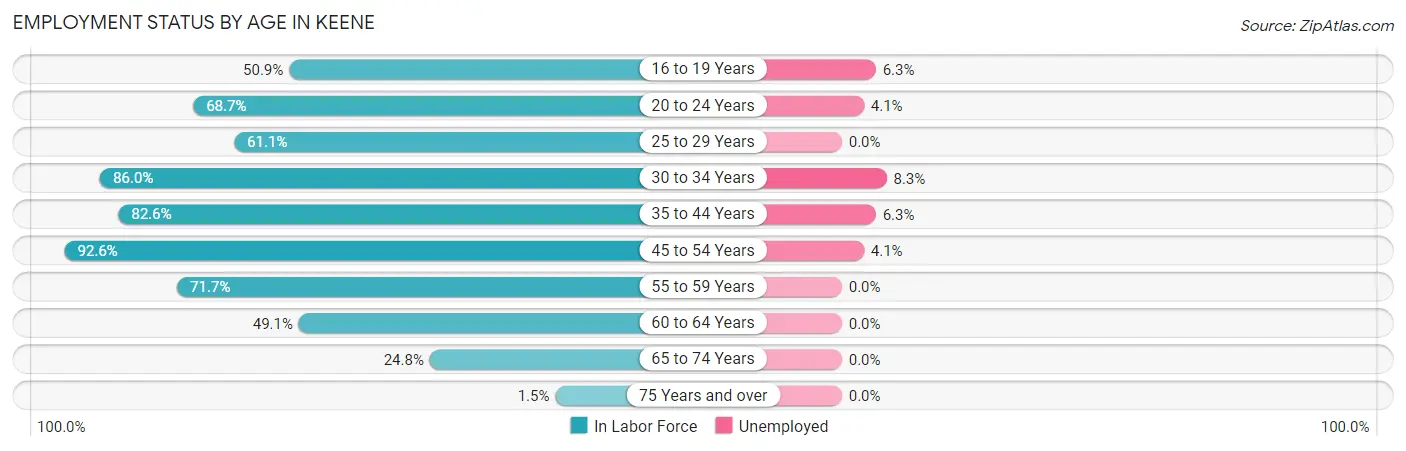
Employment Status by Age in Keene
According to the labor force statistics for Keene, out of the total population over 16 years of age (4,935), 62.9% or 3,104 individuals are in the labor force, with 4.5% or 140 of them unemployed. The age group with the highest labor force participation rate is 45 to 54 years, with 92.6% or 688 individuals in the labor force. Within the labor force, the 30 to 34 years age range has the highest percentage of unemployed individuals, with 8.3% or 43 of them being unemployed.
| Age Bracket | In Labor Force | Unemployed |
| 16 to 19 Years | 207 (50.9%) | 13 (6.3%) |
| 20 to 24 Years | 567 (68.7%) | 23 (4.1%) |
| 25 to 29 Years | 179 (61.1%) | 0 (0.0%) |
| 30 to 34 Years | 521 (86.0%) | 43 (8.3%) |
| 35 to 44 Years | 522 (82.6%) | 33 (6.3%) |
| 45 to 54 Years | 688 (92.6%) | 28 (4.1%) |
| 55 to 59 Years | 251 (71.7%) | 0 (0.0%) |
| 60 to 64 Years | 84 (49.1%) | 0 (0.0%) |
| 65 to 74 Years | 78 (24.8%) | 0 (0.0%) |
| 75 Years and over | 9 (1.5%) | 0 (0.0%) |
| Total | 3,104 (62.9%) | 140 (4.5%) |
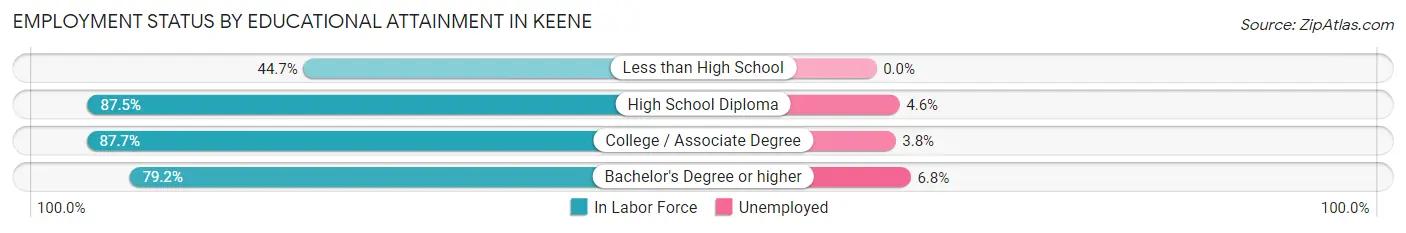
Employment Status by Educational Attainment in Keene
According to labor force statistics for Keene, 80.3% of individuals (2,244) out of the total population between 25 and 64 years of age (2,795) are in the labor force, with 4.6% or 103 of them being unemployed. The group with the highest labor force participation rate are those with the educational attainment of college / associate degree, with 87.7% or 729 individuals in the labor force. Within the labor force, individuals with bachelor's degree or higher education have the highest percentage of unemployment, with 6.8% or 37 of them being unemployed.
| Educational Attainment | In Labor Force | Unemployed |
| Less than High School | 152 (44.7%) | 0 (0.0%) |
| High School Diploma | 820 (87.5%) | 43 (4.6%) |
| College / Associate Degree | 729 (87.7%) | 32 (3.8%) |
| Bachelor's Degree or higher | 544 (79.2%) | 47 (6.8%) |
| Total | 2,244 (80.3%) | 129 (4.6%) |
Employment Occupations by Sex in Keene
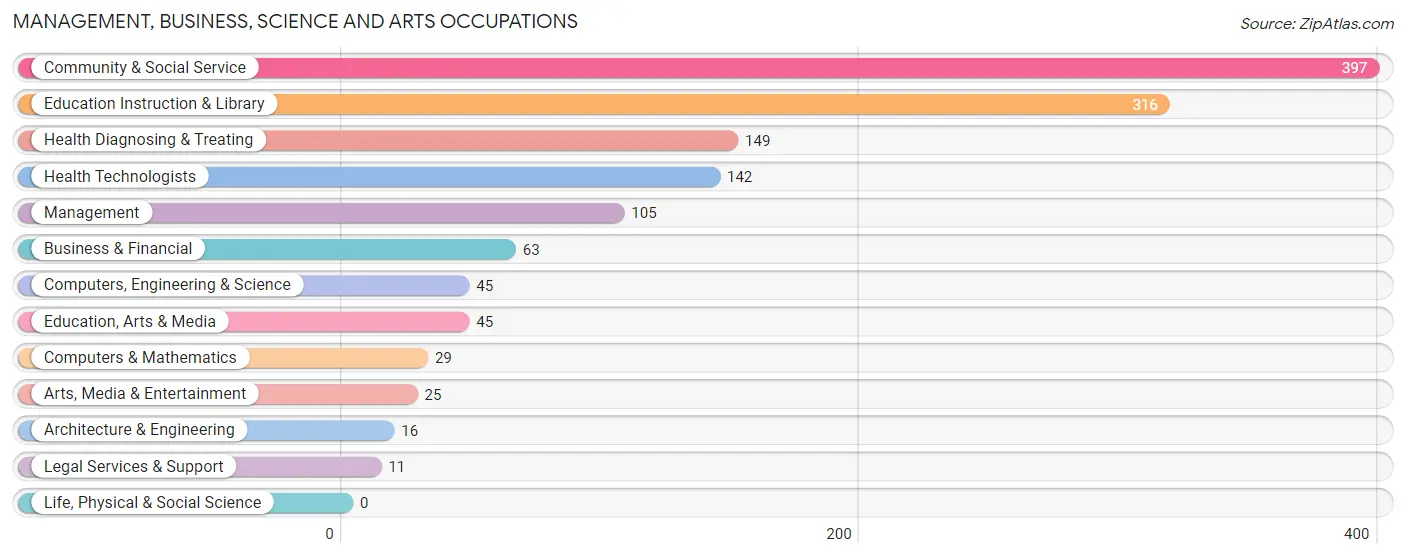
Management, Business, Science and Arts Occupations
The most common Management, Business, Science and Arts occupations in Keene are Community & Social Service (397 | 13.6%), Education Instruction & Library (316 | 10.8%), Health Diagnosing & Treating (149 | 5.1%), Health Technologists (142 | 4.9%), and Management (105 | 3.6%).
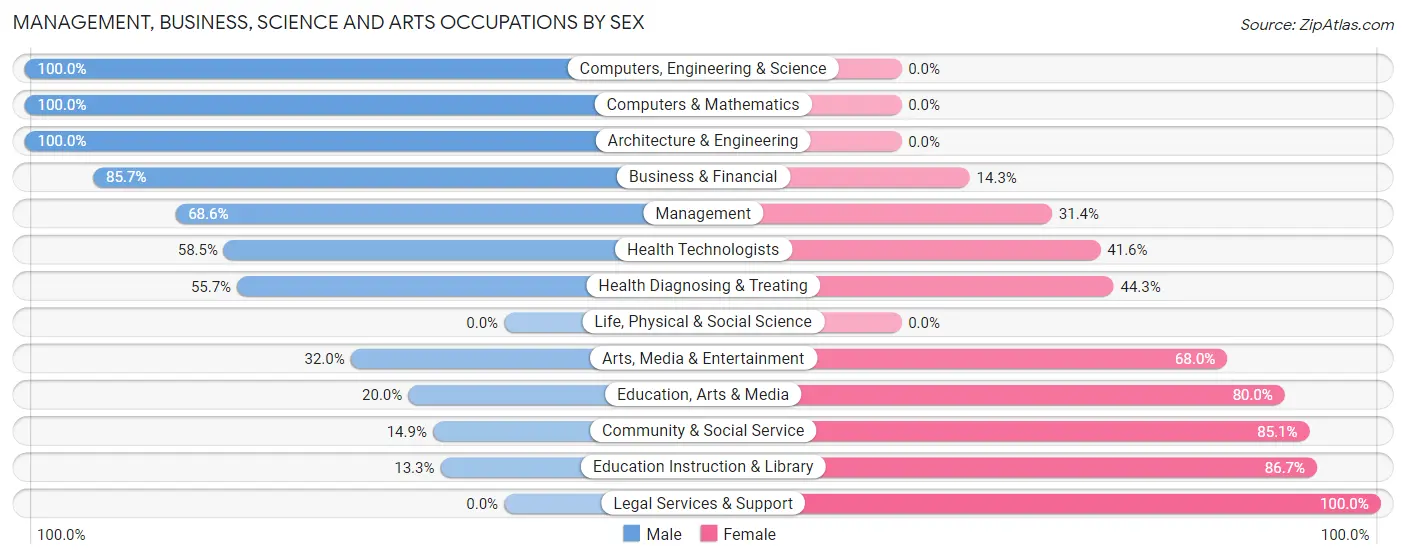
Management, Business, Science and Arts Occupations by Sex
Within the Management, Business, Science and Arts occupations in Keene, the most male-oriented occupations are Computers, Engineering & Science (100.0%), Computers & Mathematics (100.0%), and Architecture & Engineering (100.0%), while the most female-oriented occupations are Legal Services & Support (100.0%), Education Instruction & Library (86.7%), and Community & Social Service (85.1%).
| Occupation | Male | Female |
| Management | 72 (68.6%) | 33 (31.4%) |
| Business & Financial | 54 (85.7%) | 9 (14.3%) |
| Computers, Engineering & Science | 45 (100.0%) | 0 (0.0%) |
| Computers & Mathematics | 29 (100.0%) | 0 (0.0%) |
| Architecture & Engineering | 16 (100.0%) | 0 (0.0%) |
| Life, Physical & Social Science | 0 (0.0%) | 0 (0.0%) |
| Community & Social Service | 59 (14.9%) | 338 (85.1%) |
| Education, Arts & Media | 9 (20.0%) | 36 (80.0%) |
| Legal Services & Support | 0 (0.0%) | 11 (100.0%) |
| Education Instruction & Library | 42 (13.3%) | 274 (86.7%) |
| Arts, Media & Entertainment | 8 (32.0%) | 17 (68.0%) |
| Health Diagnosing & Treating | 83 (55.7%) | 66 (44.3%) |
| Health Technologists | 83 (58.5%) | 59 (41.5%) |
| Total (Category) | 313 (41.2%) | 446 (58.8%) |
| Total (Overall) | 1,453 (49.7%) | 1,473 (50.3%) |
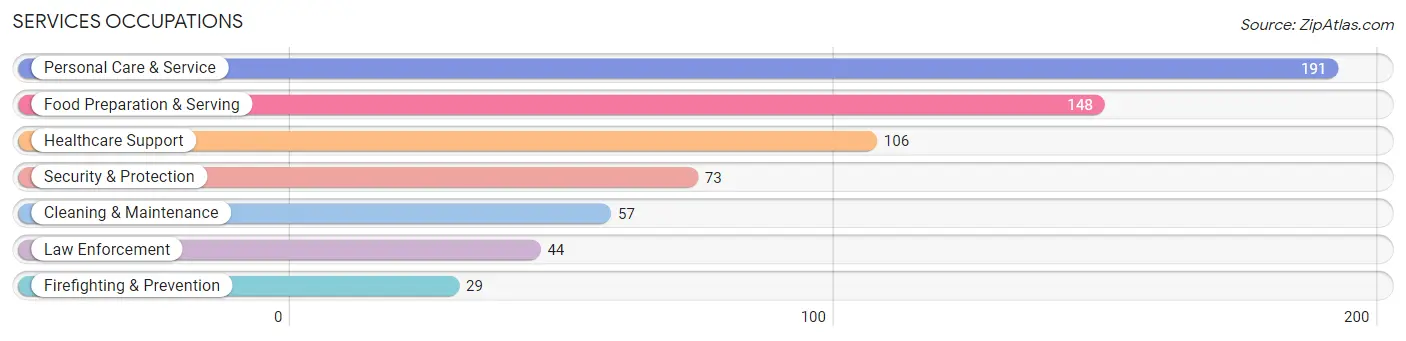
Services Occupations
The most common Services occupations in Keene are Personal Care & Service (191 | 6.5%), Food Preparation & Serving (148 | 5.1%), Healthcare Support (106 | 3.6%), Security & Protection (73 | 2.5%), and Cleaning & Maintenance (57 | 1.9%).
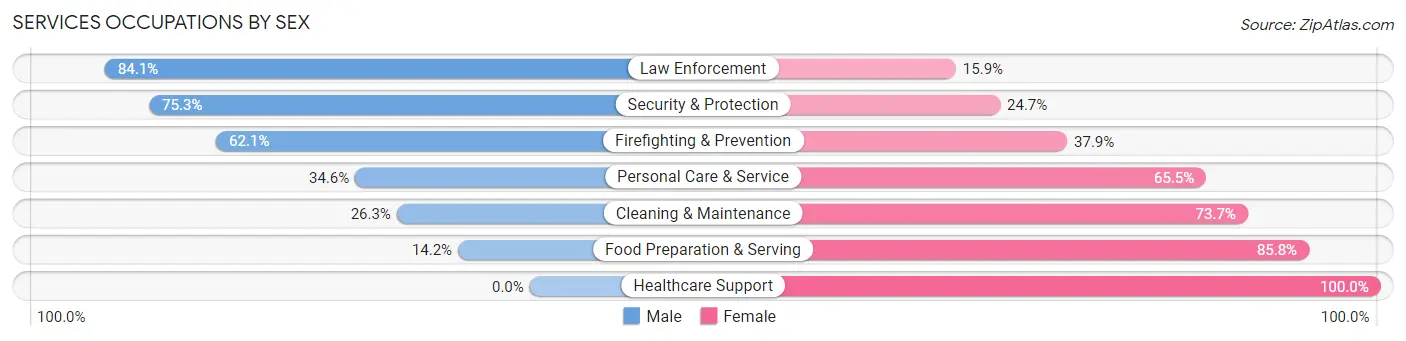
Services Occupations by Sex
Within the Services occupations in Keene, the most male-oriented occupations are Law Enforcement (84.1%), Security & Protection (75.3%), and Firefighting & Prevention (62.1%), while the most female-oriented occupations are Healthcare Support (100.0%), Food Preparation & Serving (85.8%), and Cleaning & Maintenance (73.7%).
| Occupation | Male | Female |
| Healthcare Support | 0 (0.0%) | 106 (100.0%) |
| Security & Protection | 55 (75.3%) | 18 (24.7%) |
| Firefighting & Prevention | 18 (62.1%) | 11 (37.9%) |
| Law Enforcement | 37 (84.1%) | 7 (15.9%) |
| Food Preparation & Serving | 21 (14.2%) | 127 (85.8%) |
| Cleaning & Maintenance | 15 (26.3%) | 42 (73.7%) |
| Personal Care & Service | 66 (34.5%) | 125 (65.4%) |
| Total (Category) | 157 (27.3%) | 418 (72.7%) |
| Total (Overall) | 1,453 (49.7%) | 1,473 (50.3%) |
Sales and Office Occupations
The most common Sales and Office occupations in Keene are Office & Administration (282 | 9.6%), and Sales & Related (196 | 6.7%).

Sales and Office Occupations by Sex
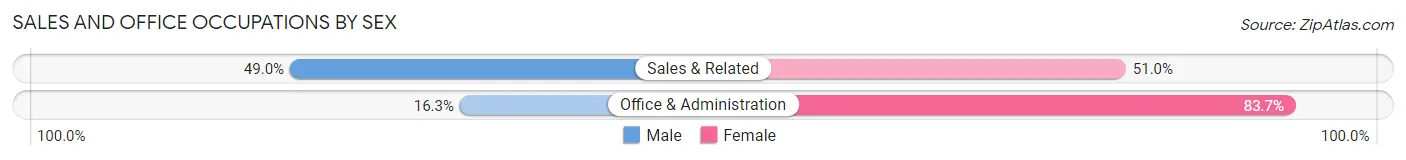
| Occupation | Male | Female |
| Sales & Related | 96 (49.0%) | 100 (51.0%) |
| Office & Administration | 46 (16.3%) | 236 (83.7%) |
| Total (Category) | 142 (29.7%) | 336 (70.3%) |
| Total (Overall) | 1,453 (49.7%) | 1,473 (50.3%) |
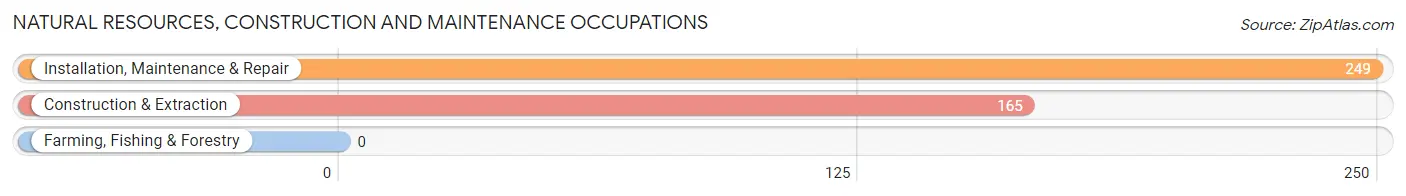
Natural Resources, Construction and Maintenance Occupations
The most common Natural Resources, Construction and Maintenance occupations in Keene are Installation, Maintenance & Repair (249 | 8.5%), and Construction & Extraction (165 | 5.6%).
Natural Resources, Construction and Maintenance Occupations by Sex
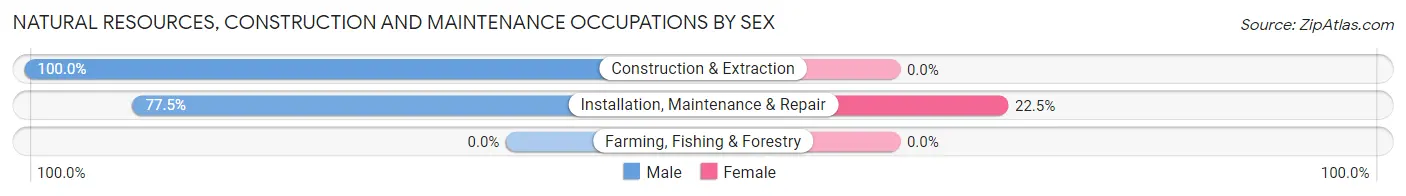
| Occupation | Male | Female |
| Farming, Fishing & Forestry | 0 (0.0%) | 0 (0.0%) |
| Construction & Extraction | 165 (100.0%) | 0 (0.0%) |
| Installation, Maintenance & Repair | 193 (77.5%) | 56 (22.5%) |
| Total (Category) | 358 (86.5%) | 56 (13.5%) |
| Total (Overall) | 1,453 (49.7%) | 1,473 (50.3%) |
Production, Transportation and Moving Occupations
The most common Production, Transportation and Moving occupations in Keene are Material Moving (432 | 14.8%), Transportation (223 | 7.6%), and Production (45 | 1.5%).
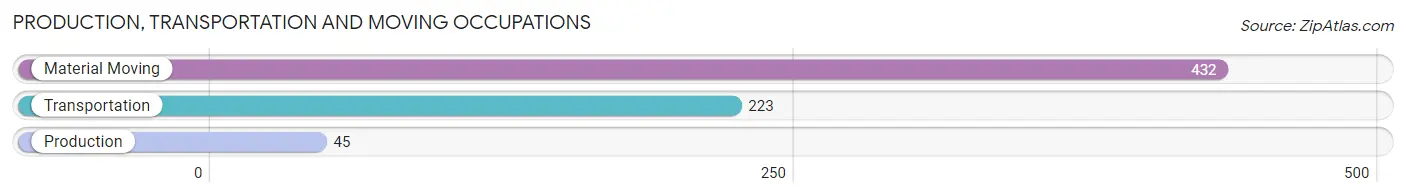
Production, Transportation and Moving Occupations by Sex
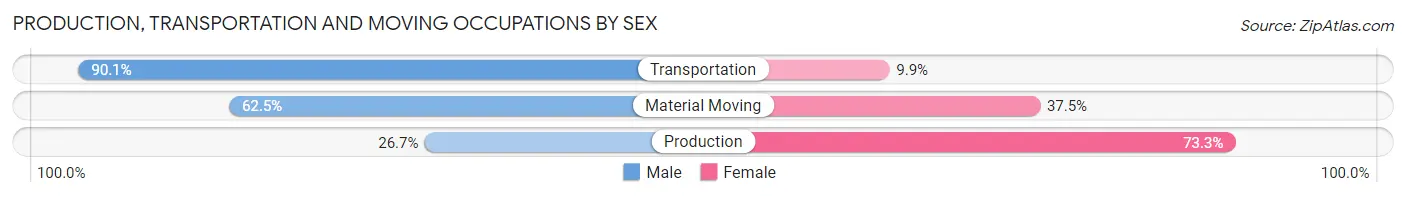
| Occupation | Male | Female |
| Production | 12 (26.7%) | 33 (73.3%) |
| Transportation | 201 (90.1%) | 22 (9.9%) |
| Material Moving | 270 (62.5%) | 162 (37.5%) |
| Total (Category) | 483 (69.0%) | 217 (31.0%) |
| Total (Overall) | 1,453 (49.7%) | 1,473 (50.3%) |
Employment Industries by Sex in Keene
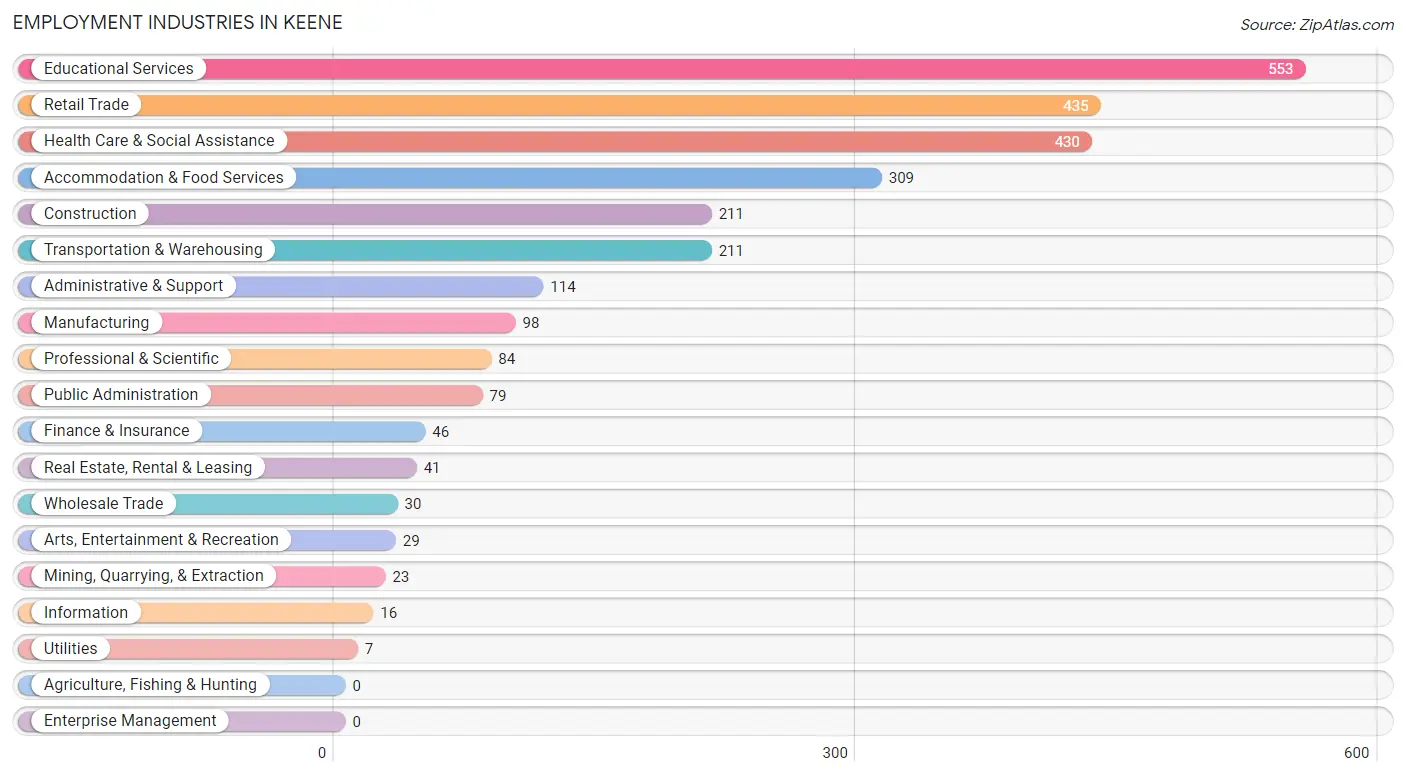
Employment Industries in Keene
The major employment industries in Keene include Educational Services (553 | 18.9%), Retail Trade (435 | 14.9%), Health Care & Social Assistance (430 | 14.7%), Accommodation & Food Services (309 | 10.6%), and Construction (211 | 7.2%).
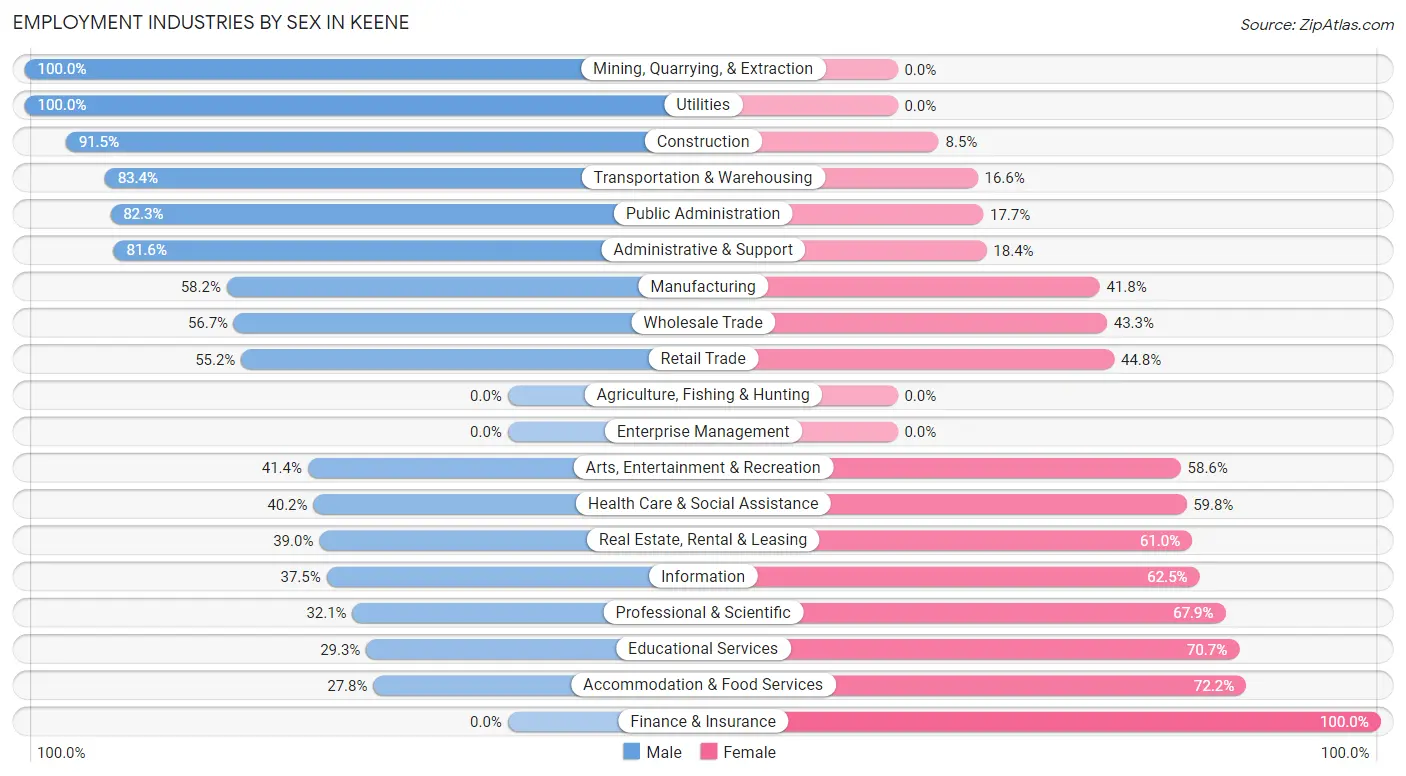
Employment Industries by Sex in Keene
The Keene industries that see more men than women are Mining, Quarrying, & Extraction (100.0%), Utilities (100.0%), and Construction (91.5%), whereas the industries that tend to have a higher number of women are Finance & Insurance (100.0%), Accommodation & Food Services (72.2%), and Educational Services (70.7%).
| Industry | Male | Female |
| Agriculture, Fishing & Hunting | 0 (0.0%) | 0 (0.0%) |
| Mining, Quarrying, & Extraction | 23 (100.0%) | 0 (0.0%) |
| Construction | 193 (91.5%) | 18 (8.5%) |
| Manufacturing | 57 (58.2%) | 41 (41.8%) |
| Wholesale Trade | 17 (56.7%) | 13 (43.3%) |
| Retail Trade | 240 (55.2%) | 195 (44.8%) |
| Transportation & Warehousing | 176 (83.4%) | 35 (16.6%) |
| Utilities | 7 (100.0%) | 0 (0.0%) |
| Information | 6 (37.5%) | 10 (62.5%) |
| Finance & Insurance | 0 (0.0%) | 46 (100.0%) |
| Real Estate, Rental & Leasing | 16 (39.0%) | 25 (61.0%) |
| Professional & Scientific | 27 (32.1%) | 57 (67.9%) |
| Enterprise Management | 0 (0.0%) | 0 (0.0%) |
| Administrative & Support | 93 (81.6%) | 21 (18.4%) |
| Educational Services | 162 (29.3%) | 391 (70.7%) |
| Health Care & Social Assistance | 173 (40.2%) | 257 (59.8%) |
| Arts, Entertainment & Recreation | 12 (41.4%) | 17 (58.6%) |
| Accommodation & Food Services | 86 (27.8%) | 223 (72.2%) |
| Public Administration | 65 (82.3%) | 14 (17.7%) |
| Total | 1,453 (49.7%) | 1,473 (50.3%) |
Education in Keene
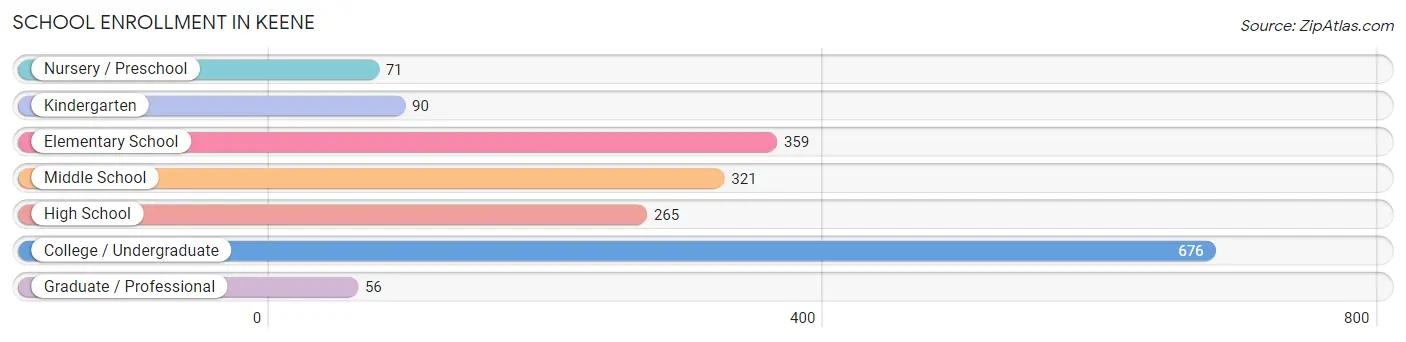
School Enrollment in Keene
The most common levels of schooling among the 1,838 students in Keene are college / undergraduate (676 | 36.8%), elementary school (359 | 19.5%), and middle school (321 | 17.5%).
| School Level | # Students | % Students |
| Nursery / Preschool | 71 | 3.9% |
| Kindergarten | 90 | 4.9% |
| Elementary School | 359 | 19.5% |
| Middle School | 321 | 17.5% |
| High School | 265 | 14.4% |
| College / Undergraduate | 676 | 36.8% |
| Graduate / Professional | 56 | 3.0% |
| Total | 1,838 | 100.0% |
School Enrollment by Age by Funding Source in Keene
Out of a total of 1,838 students who are enrolled in schools in Keene, 458 (24.9%) attend a private institution, while the remaining 1,380 (75.1%) are enrolled in public schools. The age group of 20 to 24 year olds has the highest likelihood of being enrolled in private schools, with 222 (64.2% in the age bracket) enrolled. Conversely, the age group of 3 to 4 year olds has the lowest likelihood of being enrolled in a private school, with 53 (100.0% in the age bracket) attending a public institution.
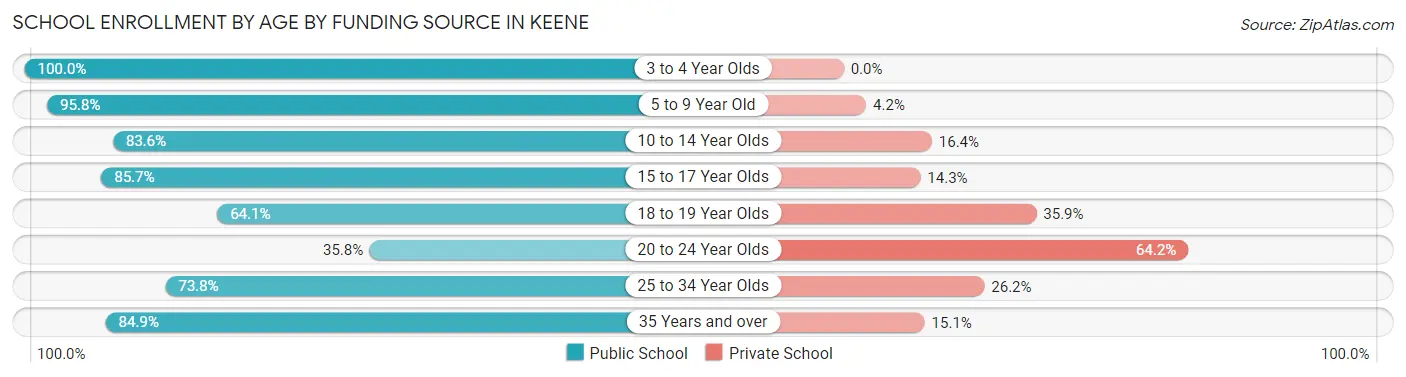
| Age Bracket | Public School | Private School |
| 3 to 4 Year Olds | 53 (100.0%) | 0 (0.0%) |
| 5 to 9 Year Old | 434 (95.8%) | 19 (4.2%) |
| 10 to 14 Year Olds | 346 (83.6%) | 68 (16.4%) |
| 15 to 17 Year Olds | 144 (85.7%) | 24 (14.3%) |
| 18 to 19 Year Olds | 159 (64.1%) | 89 (35.9%) |
| 20 to 24 Year Olds | 124 (35.8%) | 222 (64.2%) |
| 25 to 34 Year Olds | 76 (73.8%) | 27 (26.2%) |
| 35 Years and over | 45 (84.9%) | 8 (15.1%) |
| Total | 1,380 (75.1%) | 458 (24.9%) |
Educational Attainment by Field of Study in Keene
Education (366 | 36.6%), business (106 | 10.6%), science & technology (100 | 10.0%), bio, nature & agricultural (76 | 7.6%), and arts & humanities (70 | 7.0%) are the most common fields of study among 1,001 individuals in Keene who have obtained a bachelor's degree or higher.
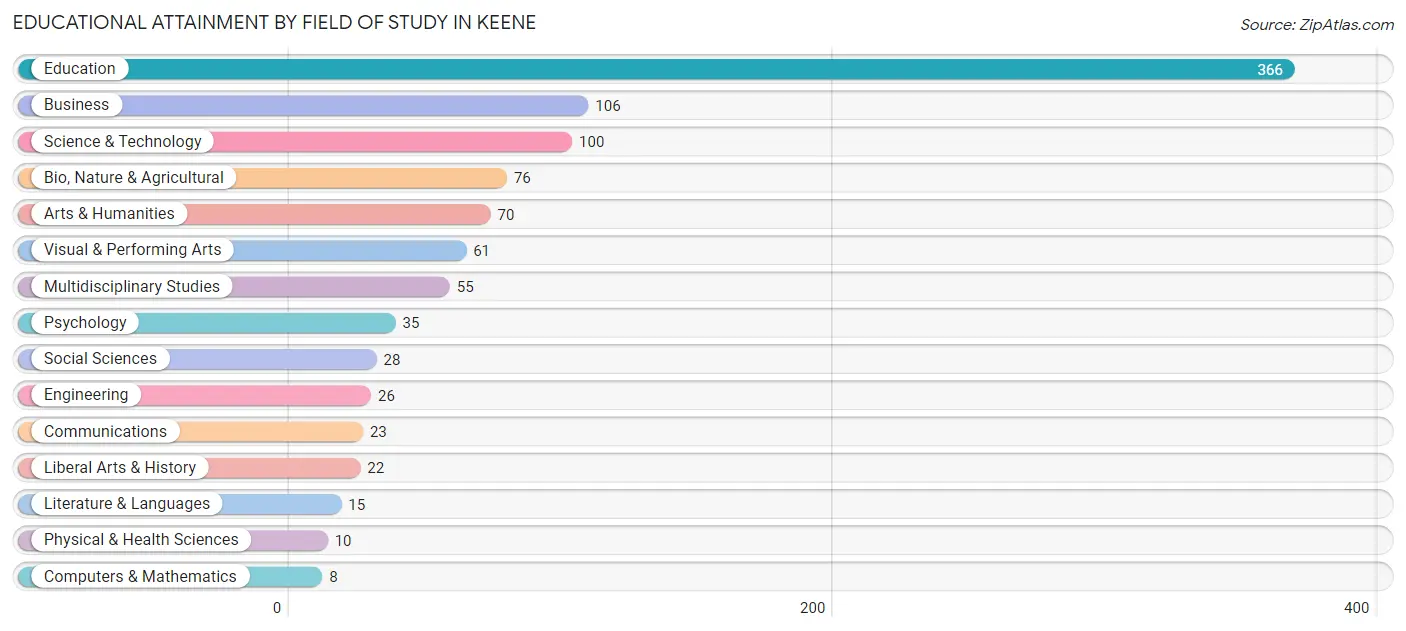
| Field of Study | # Graduates | % Graduates |
| Computers & Mathematics | 8 | 0.8% |
| Bio, Nature & Agricultural | 76 | 7.6% |
| Physical & Health Sciences | 10 | 1.0% |
| Psychology | 35 | 3.5% |
| Social Sciences | 28 | 2.8% |
| Engineering | 26 | 2.6% |
| Multidisciplinary Studies | 55 | 5.5% |
| Science & Technology | 100 | 10.0% |
| Business | 106 | 10.6% |
| Education | 366 | 36.6% |
| Literature & Languages | 15 | 1.5% |
| Liberal Arts & History | 22 | 2.2% |
| Visual & Performing Arts | 61 | 6.1% |
| Communications | 23 | 2.3% |
| Arts & Humanities | 70 | 7.0% |
| Total | 1,001 | 100.0% |
Transportation & Commute in Keene
Vehicle Availability by Sex in Keene
The most prevalent vehicle ownership categories in Keene are males with 2 vehicles (818, accounting for 59.3%) and females with 2 vehicles (622, making up 59.0%).
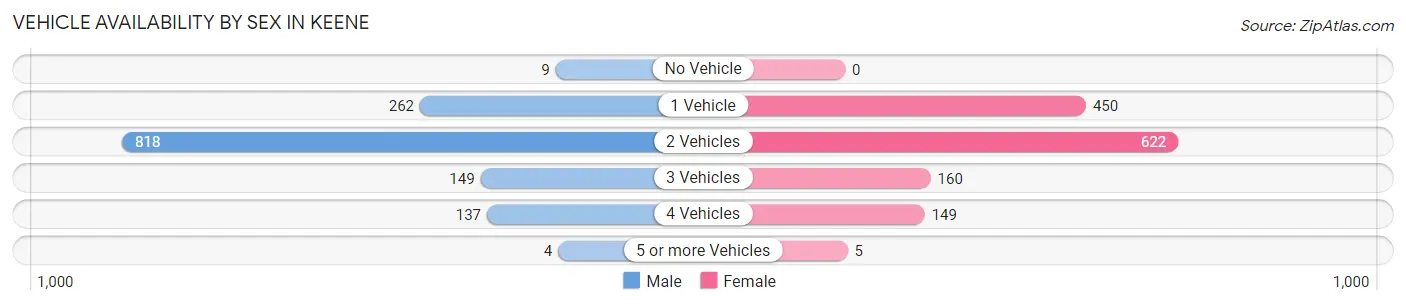
| Vehicles Available | Male | Female |
| No Vehicle | 9 (0.6%) | 0 (0.0%) |
| 1 Vehicle | 262 (19.0%) | 450 (32.5%) |
| 2 Vehicles | 818 (59.3%) | 622 (44.9%) |
| 3 Vehicles | 149 (10.8%) | 160 (11.5%) |
| 4 Vehicles | 137 (9.9%) | 149 (10.7%) |
| 5 or more Vehicles | 4 (0.3%) | 5 (0.4%) |
| Total | 1,379 (100.0%) | 1,386 (100.0%) |
Commute Time in Keene
The most frequently occuring commute durations in Keene are 30 to 34 minutes (946 commuters, 34.2%), 10 to 14 minutes (307 commuters, 11.1%), and 45 to 59 minutes (306 commuters, 11.1%).
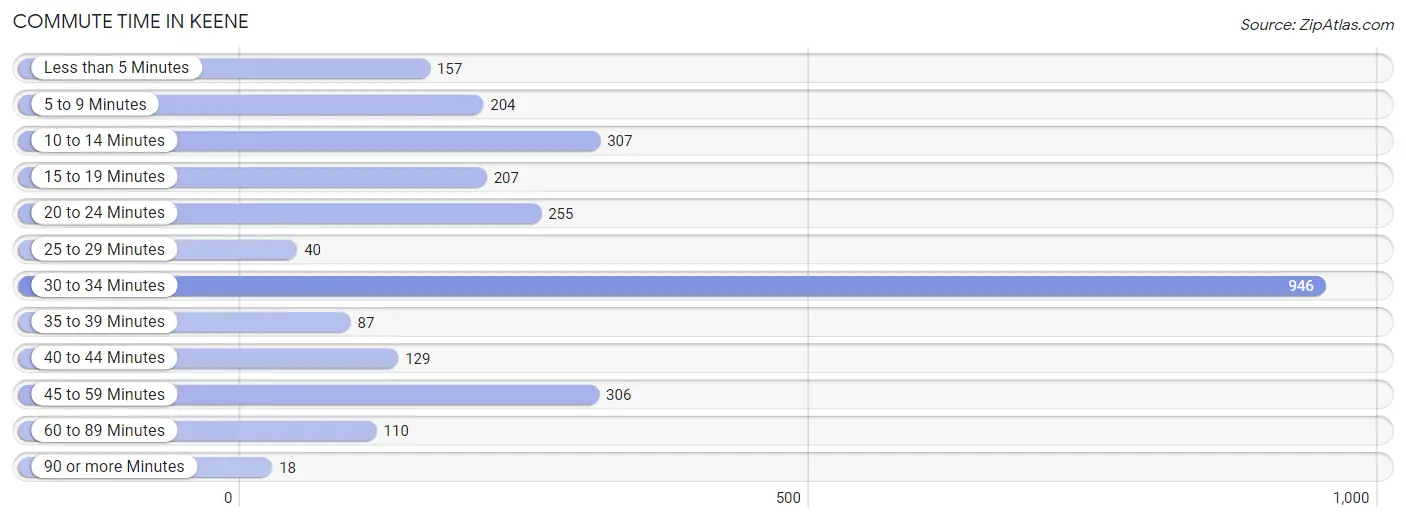
| Commute Time | # Commuters | % Commuters |
| Less than 5 Minutes | 157 | 5.7% |
| 5 to 9 Minutes | 204 | 7.4% |
| 10 to 14 Minutes | 307 | 11.1% |
| 15 to 19 Minutes | 207 | 7.5% |
| 20 to 24 Minutes | 255 | 9.2% |
| 25 to 29 Minutes | 40 | 1.5% |
| 30 to 34 Minutes | 946 | 34.2% |
| 35 to 39 Minutes | 87 | 3.2% |
| 40 to 44 Minutes | 129 | 4.7% |
| 45 to 59 Minutes | 306 | 11.1% |
| 60 to 89 Minutes | 110 | 4.0% |
| 90 or more Minutes | 18 | 0.6% |
Commute Time by Sex in Keene
The most common commute times in Keene are 30 to 34 minutes (581 commuters, 42.7%) for males and 30 to 34 minutes (365 commuters, 26.0%) for females.
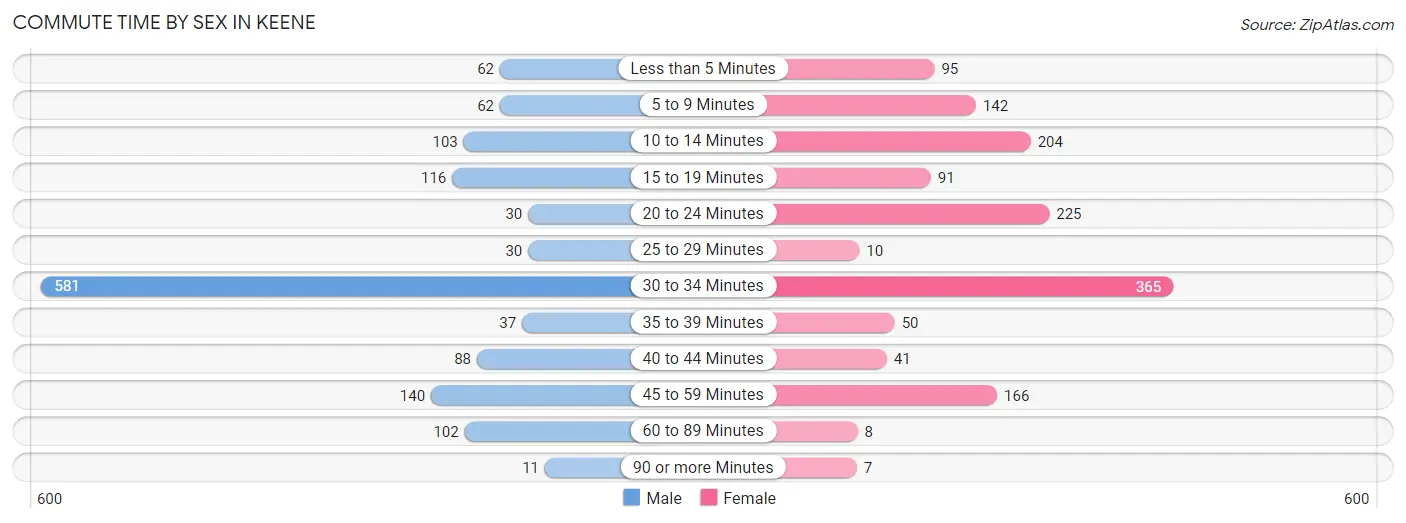
| Commute Time | Male | Female |
| Less than 5 Minutes | 62 (4.5%) | 95 (6.8%) |
| 5 to 9 Minutes | 62 (4.5%) | 142 (10.1%) |
| 10 to 14 Minutes | 103 (7.6%) | 204 (14.5%) |
| 15 to 19 Minutes | 116 (8.5%) | 91 (6.5%) |
| 20 to 24 Minutes | 30 (2.2%) | 225 (16.0%) |
| 25 to 29 Minutes | 30 (2.2%) | 10 (0.7%) |
| 30 to 34 Minutes | 581 (42.7%) | 365 (26.0%) |
| 35 to 39 Minutes | 37 (2.7%) | 50 (3.6%) |
| 40 to 44 Minutes | 88 (6.5%) | 41 (2.9%) |
| 45 to 59 Minutes | 140 (10.3%) | 166 (11.8%) |
| 60 to 89 Minutes | 102 (7.5%) | 8 (0.6%) |
| 90 or more Minutes | 11 (0.8%) | 7 (0.5%) |
Time of Departure to Work by Sex in Keene
The most frequent times of departure to work in Keene are 7:00 AM to 7:29 AM (475, 34.9%) for males and 7:30 AM to 7:59 AM (407, 29.0%) for females.
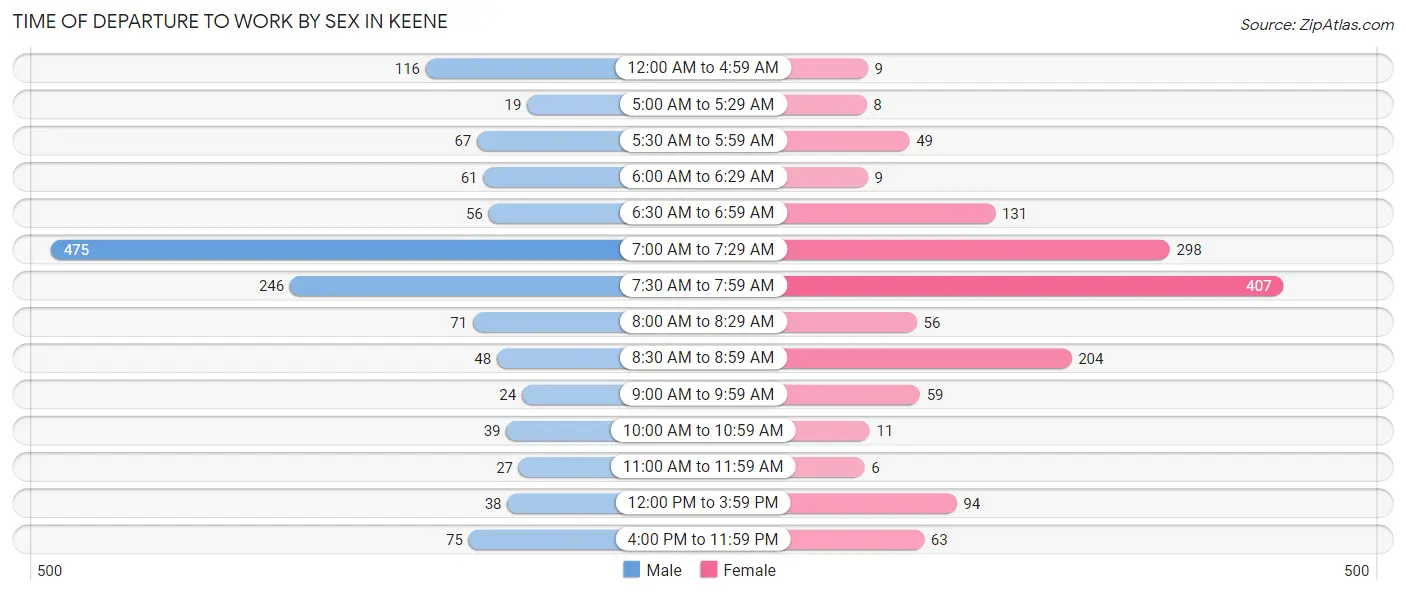
| Time of Departure | Male | Female |
| 12:00 AM to 4:59 AM | 116 (8.5%) | 9 (0.6%) |
| 5:00 AM to 5:29 AM | 19 (1.4%) | 8 (0.6%) |
| 5:30 AM to 5:59 AM | 67 (4.9%) | 49 (3.5%) |
| 6:00 AM to 6:29 AM | 61 (4.5%) | 9 (0.6%) |
| 6:30 AM to 6:59 AM | 56 (4.1%) | 131 (9.3%) |
| 7:00 AM to 7:29 AM | 475 (34.9%) | 298 (21.2%) |
| 7:30 AM to 7:59 AM | 246 (18.1%) | 407 (29.0%) |
| 8:00 AM to 8:29 AM | 71 (5.2%) | 56 (4.0%) |
| 8:30 AM to 8:59 AM | 48 (3.5%) | 204 (14.5%) |
| 9:00 AM to 9:59 AM | 24 (1.8%) | 59 (4.2%) |
| 10:00 AM to 10:59 AM | 39 (2.9%) | 11 (0.8%) |
| 11:00 AM to 11:59 AM | 27 (2.0%) | 6 (0.4%) |
| 12:00 PM to 3:59 PM | 38 (2.8%) | 94 (6.7%) |
| 4:00 PM to 11:59 PM | 75 (5.5%) | 63 (4.5%) |
| Total | 1,362 (100.0%) | 1,404 (100.0%) |
Housing Occupancy in Keene
Occupancy by Ownership in Keene
Of the total 2,109 dwellings in Keene, owner-occupied units account for 1,032 (48.9%), while renter-occupied units make up 1,077 (51.1%).
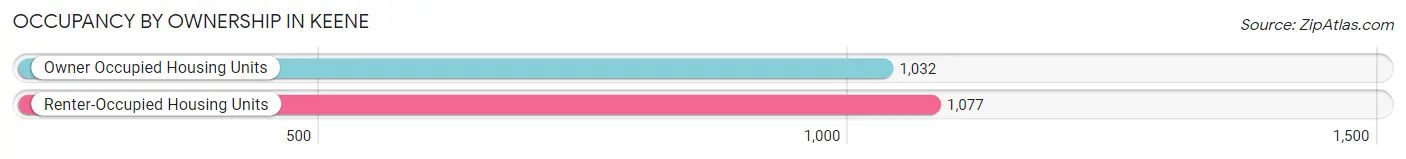
| Occupancy | # Housing Units | % Housing Units |
| Owner Occupied Housing Units | 1,032 | 48.9% |
| Renter-Occupied Housing Units | 1,077 | 51.1% |
| Total Occupied Housing Units | 2,109 | 100.0% |
Occupancy by Household Size in Keene
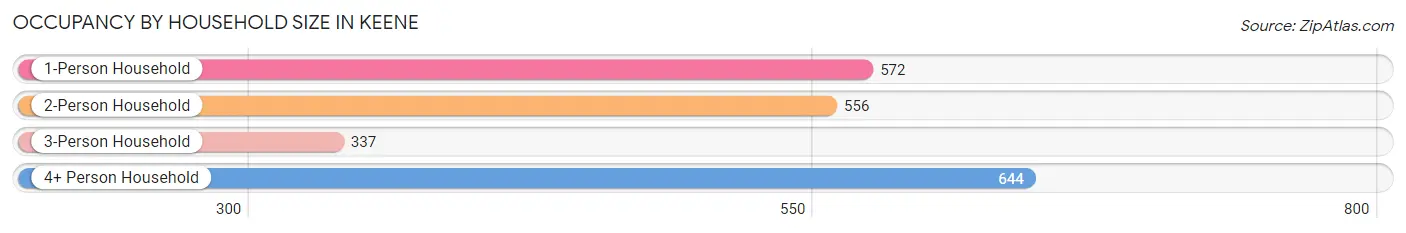
| Household Size | # Housing Units | % Housing Units |
| 1-Person Household | 572 | 27.1% |
| 2-Person Household | 556 | 26.4% |
| 3-Person Household | 337 | 16.0% |
| 4+ Person Household | 644 | 30.5% |
| Total Housing Units | 2,109 | 100.0% |
Occupancy by Ownership by Household Size in Keene
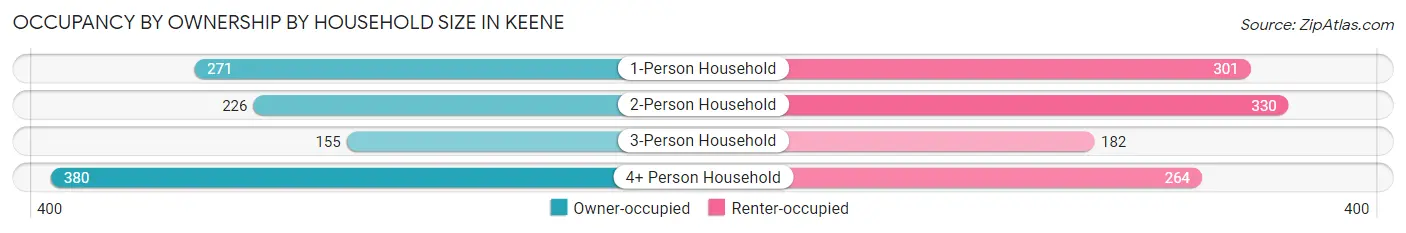
| Household Size | Owner-occupied | Renter-occupied |
| 1-Person Household | 271 (47.4%) | 301 (52.6%) |
| 2-Person Household | 226 (40.6%) | 330 (59.4%) |
| 3-Person Household | 155 (46.0%) | 182 (54.0%) |
| 4+ Person Household | 380 (59.0%) | 264 (41.0%) |
| Total Housing Units | 1,032 (48.9%) | 1,077 (51.1%) |
Occupancy by Educational Attainment in Keene
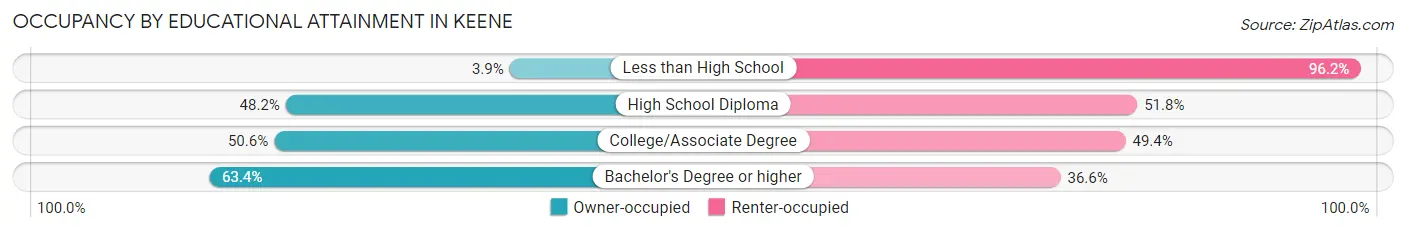
| Household Size | Owner-occupied | Renter-occupied |
| Less than High School | 7 (3.8%) | 175 (96.2%) |
| High School Diploma | 301 (48.2%) | 323 (51.8%) |
| College/Associate Degree | 403 (50.6%) | 394 (49.4%) |
| Bachelor's Degree or higher | 321 (63.4%) | 185 (36.6%) |
Occupancy by Age of Householder in Keene
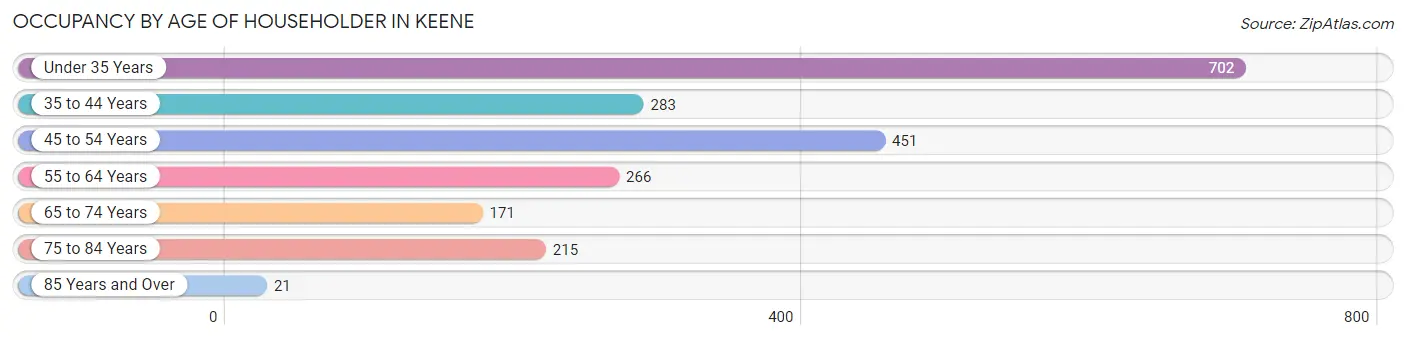
| Age Bracket | # Households | % Households |
| Under 35 Years | 702 | 33.3% |
| 35 to 44 Years | 283 | 13.4% |
| 45 to 54 Years | 451 | 21.4% |
| 55 to 64 Years | 266 | 12.6% |
| 65 to 74 Years | 171 | 8.1% |
| 75 to 84 Years | 215 | 10.2% |
| 85 Years and Over | 21 | 1.0% |
| Total | 2,109 | 100.0% |
Housing Finances in Keene
Median Income by Occupancy in Keene
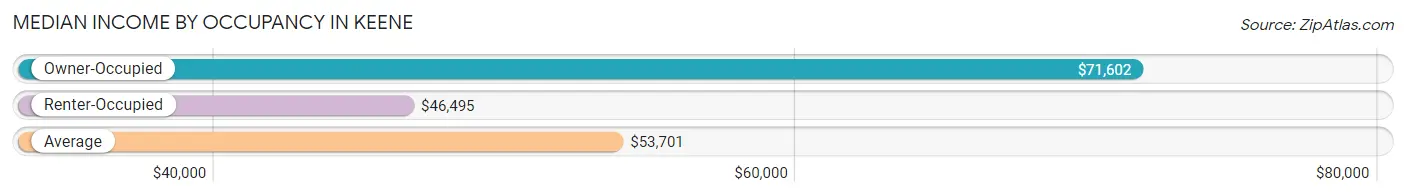
| Occupancy Type | # Households | Median Income |
| Owner-Occupied | 1,032 (48.9%) | $71,602 |
| Renter-Occupied | 1,077 (51.1%) | $46,495 |
| Average | 2,109 (100.0%) | $53,701 |
Occupancy by Householder Income Bracket in Keene
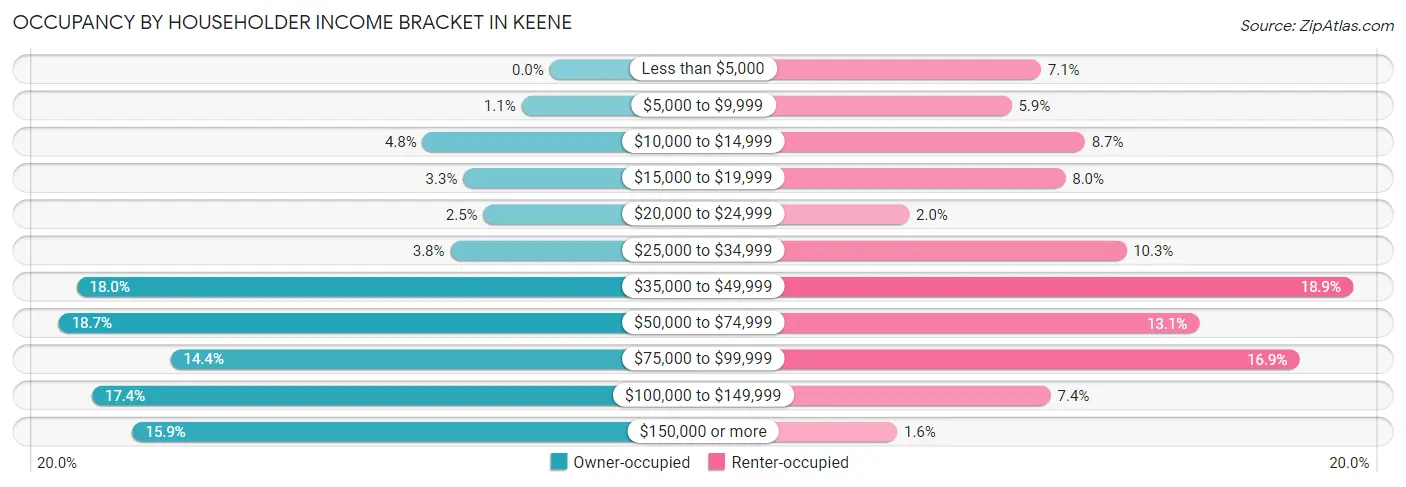
| Income Bracket | Owner-occupied | Renter-occupied |
| Less than $5,000 | 0 (0.0%) | 76 (7.1%) |
| $5,000 to $9,999 | 11 (1.1%) | 64 (5.9%) |
| $10,000 to $14,999 | 50 (4.8%) | 94 (8.7%) |
| $15,000 to $19,999 | 34 (3.3%) | 86 (8.0%) |
| $20,000 to $24,999 | 26 (2.5%) | 22 (2.0%) |
| $25,000 to $34,999 | 39 (3.8%) | 111 (10.3%) |
| $35,000 to $49,999 | 186 (18.0%) | 204 (18.9%) |
| $50,000 to $74,999 | 193 (18.7%) | 141 (13.1%) |
| $75,000 to $99,999 | 149 (14.4%) | 182 (16.9%) |
| $100,000 to $149,999 | 180 (17.4%) | 80 (7.4%) |
| $150,000 or more | 164 (15.9%) | 17 (1.6%) |
| Total | 1,032 (100.0%) | 1,077 (100.0%) |
Monthly Housing Cost Tiers in Keene
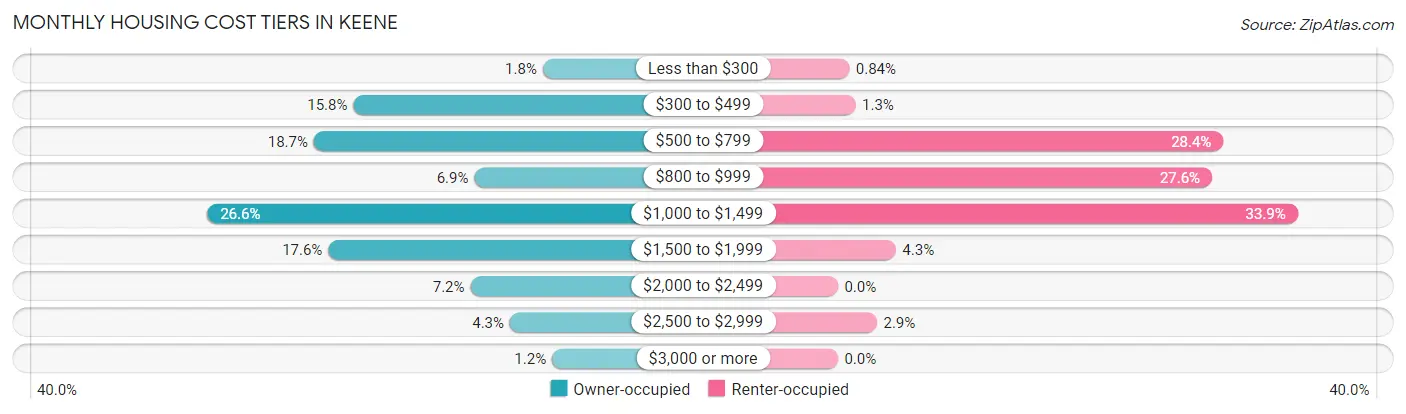
| Monthly Cost | Owner-occupied | Renter-occupied |
| Less than $300 | 19 (1.8%) | 9 (0.8%) |
| $300 to $499 | 163 (15.8%) | 14 (1.3%) |
| $500 to $799 | 193 (18.7%) | 306 (28.4%) |
| $800 to $999 | 71 (6.9%) | 297 (27.6%) |
| $1,000 to $1,499 | 274 (26.6%) | 365 (33.9%) |
| $1,500 to $1,999 | 182 (17.6%) | 46 (4.3%) |
| $2,000 to $2,499 | 74 (7.2%) | 0 (0.0%) |
| $2,500 to $2,999 | 44 (4.3%) | 31 (2.9%) |
| $3,000 or more | 12 (1.2%) | 0 (0.0%) |
| Total | 1,032 (100.0%) | 1,077 (100.0%) |
Physical Housing Characteristics in Keene
Housing Structures in Keene
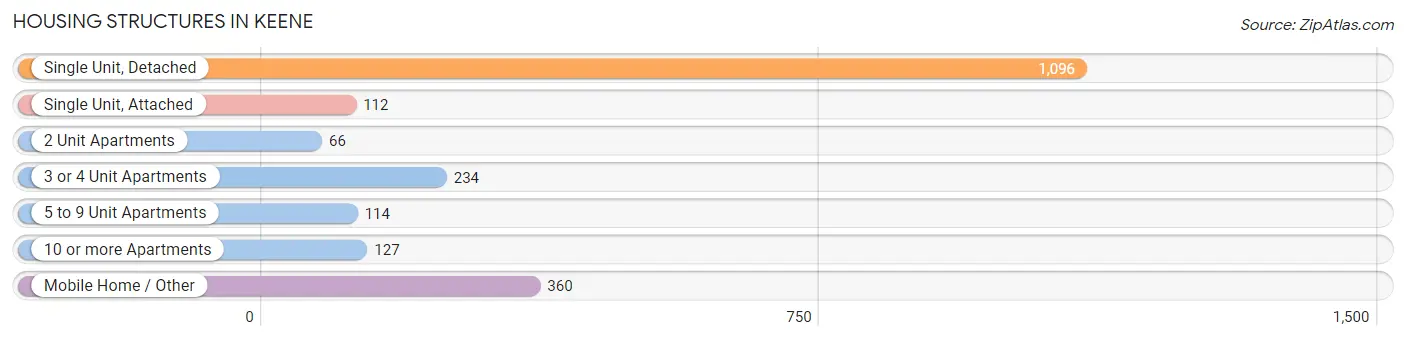
| Structure Type | # Housing Units | % Housing Units |
| Single Unit, Detached | 1,096 | 52.0% |
| Single Unit, Attached | 112 | 5.3% |
| 2 Unit Apartments | 66 | 3.1% |
| 3 or 4 Unit Apartments | 234 | 11.1% |
| 5 to 9 Unit Apartments | 114 | 5.4% |
| 10 or more Apartments | 127 | 6.0% |
| Mobile Home / Other | 360 | 17.1% |
| Total | 2,109 | 100.0% |
Housing Structures by Occupancy in Keene
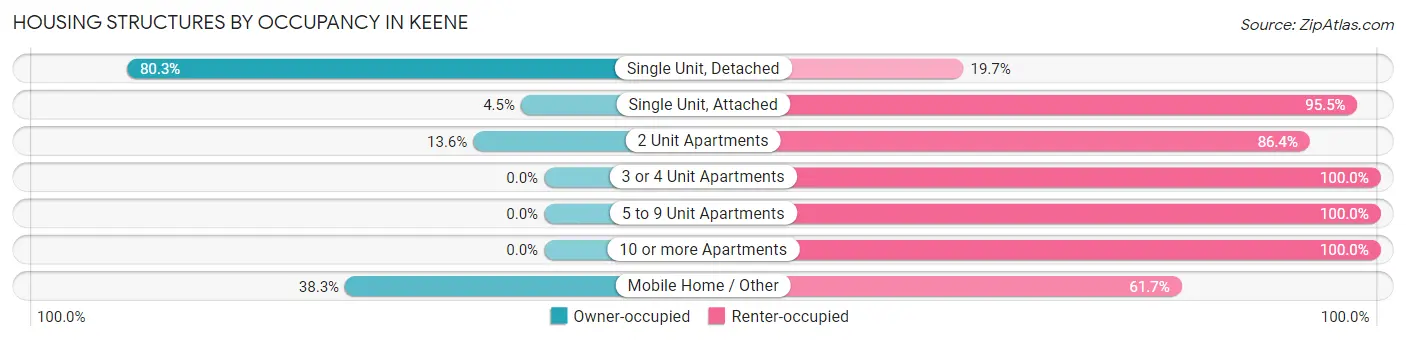
| Structure Type | Owner-occupied | Renter-occupied |
| Single Unit, Detached | 880 (80.3%) | 216 (19.7%) |
| Single Unit, Attached | 5 (4.5%) | 107 (95.5%) |
| 2 Unit Apartments | 9 (13.6%) | 57 (86.4%) |
| 3 or 4 Unit Apartments | 0 (0.0%) | 234 (100.0%) |
| 5 to 9 Unit Apartments | 0 (0.0%) | 114 (100.0%) |
| 10 or more Apartments | 0 (0.0%) | 127 (100.0%) |
| Mobile Home / Other | 138 (38.3%) | 222 (61.7%) |
| Total | 1,032 (48.9%) | 1,077 (51.1%) |
Housing Structures by Number of Rooms in Keene
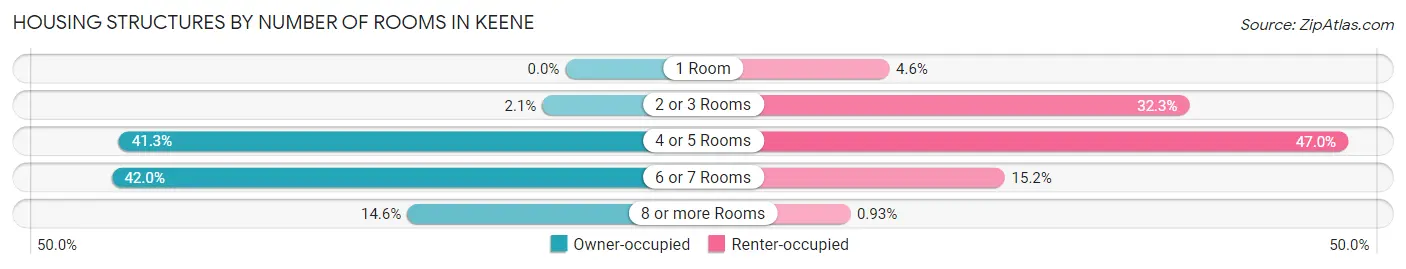
| Number of Rooms | Owner-occupied | Renter-occupied |
| 1 Room | 0 (0.0%) | 49 (4.5%) |
| 2 or 3 Rooms | 22 (2.1%) | 348 (32.3%) |
| 4 or 5 Rooms | 426 (41.3%) | 506 (47.0%) |
| 6 or 7 Rooms | 433 (42.0%) | 164 (15.2%) |
| 8 or more Rooms | 151 (14.6%) | 10 (0.9%) |
| Total | 1,032 (100.0%) | 1,077 (100.0%) |
Housing Structure by Heating Type in Keene
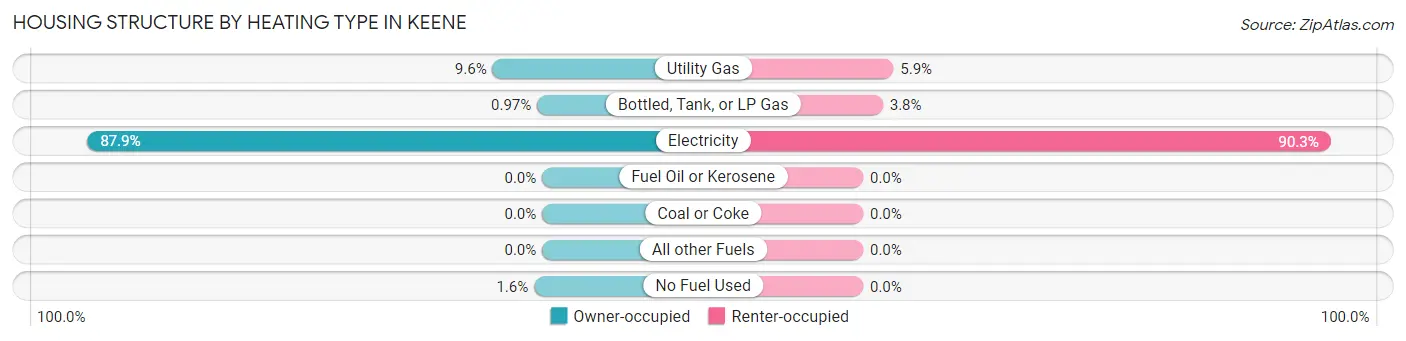
| Heating Type | Owner-occupied | Renter-occupied |
| Utility Gas | 99 (9.6%) | 63 (5.9%) |
| Bottled, Tank, or LP Gas | 10 (1.0%) | 41 (3.8%) |
| Electricity | 907 (87.9%) | 973 (90.3%) |
| Fuel Oil or Kerosene | 0 (0.0%) | 0 (0.0%) |
| Coal or Coke | 0 (0.0%) | 0 (0.0%) |
| All other Fuels | 0 (0.0%) | 0 (0.0%) |
| No Fuel Used | 16 (1.5%) | 0 (0.0%) |
| Total | 1,032 (100.0%) | 1,077 (100.0%) |
Household Vehicle Usage in Keene
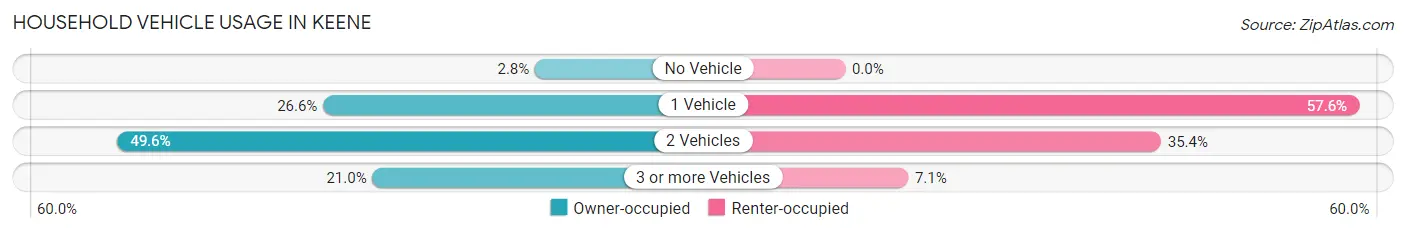
| Vehicles per Household | Owner-occupied | Renter-occupied |
| No Vehicle | 29 (2.8%) | 0 (0.0%) |
| 1 Vehicle | 274 (26.6%) | 620 (57.6%) |
| 2 Vehicles | 512 (49.6%) | 381 (35.4%) |
| 3 or more Vehicles | 217 (21.0%) | 76 (7.1%) |
| Total | 1,032 (100.0%) | 1,077 (100.0%) |
Real Estate & Mortgages in Keene
Real Estate and Mortgage Overview in Keene
| Characteristic | Without Mortgage | With Mortgage |
| Housing Units | 381 | 651 |
| Median Property Value | $174,000 | $218,900 |
| Median Household Income | $46,420 | $125 |
| Monthly Housing Costs | $618 | $12 |
| Real Estate Taxes | $2,409 | $9 |
Property Value by Mortgage Status in Keene
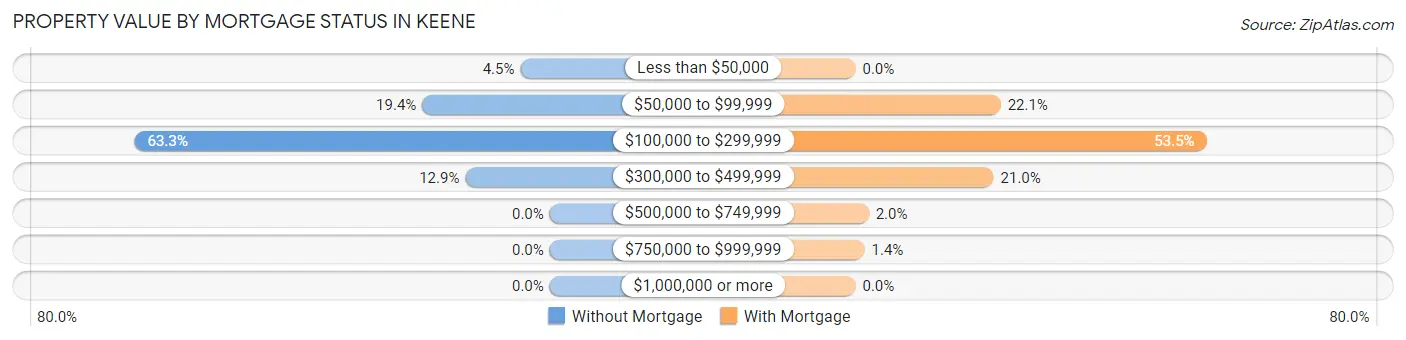
| Property Value | Without Mortgage | With Mortgage |
| Less than $50,000 | 17 (4.5%) | 0 (0.0%) |
| $50,000 to $99,999 | 74 (19.4%) | 144 (22.1%) |
| $100,000 to $299,999 | 241 (63.2%) | 348 (53.5%) |
| $300,000 to $499,999 | 49 (12.9%) | 137 (21.0%) |
| $500,000 to $749,999 | 0 (0.0%) | 13 (2.0%) |
| $750,000 to $999,999 | 0 (0.0%) | 9 (1.4%) |
| $1,000,000 or more | 0 (0.0%) | 0 (0.0%) |
| Total | 381 (100.0%) | 651 (100.0%) |
Household Income by Mortgage Status in Keene
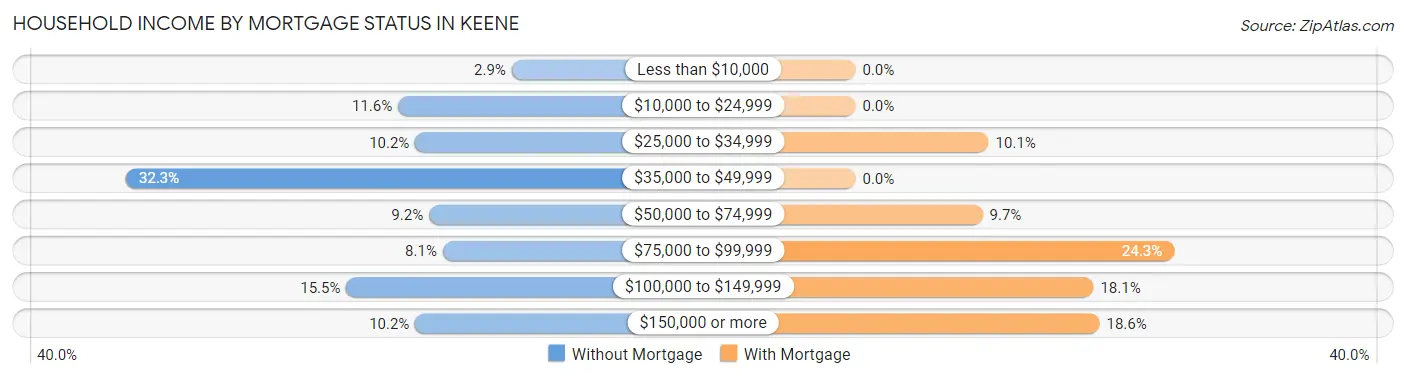
| Household Income | Without Mortgage | With Mortgage |
| Less than $10,000 | 11 (2.9%) | 0 (0.0%) |
| $10,000 to $24,999 | 44 (11.6%) | 0 (0.0%) |
| $25,000 to $34,999 | 39 (10.2%) | 66 (10.1%) |
| $35,000 to $49,999 | 123 (32.3%) | 0 (0.0%) |
| $50,000 to $74,999 | 35 (9.2%) | 63 (9.7%) |
| $75,000 to $99,999 | 31 (8.1%) | 158 (24.3%) |
| $100,000 to $149,999 | 59 (15.5%) | 118 (18.1%) |
| $150,000 or more | 39 (10.2%) | 121 (18.6%) |
| Total | 381 (100.0%) | 651 (100.0%) |
Property Value to Household Income Ratio in Keene
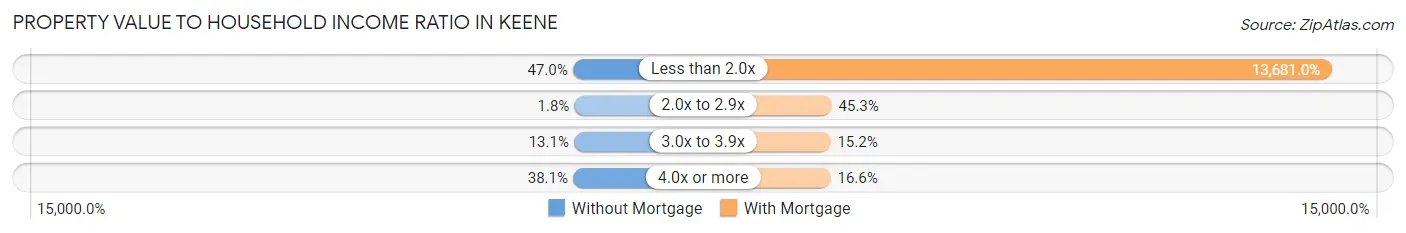
| Value-to-Income Ratio | Without Mortgage | With Mortgage |
| Less than 2.0x | 179 (47.0%) | 89,063 (13,681.0%) |
| 2.0x to 2.9x | 7 (1.8%) | 295 (45.3%) |
| 3.0x to 3.9x | 50 (13.1%) | 99 (15.2%) |
| 4.0x or more | 145 (38.1%) | 108 (16.6%) |
| Total | 381 (100.0%) | 651 (100.0%) |
Real Estate Taxes by Mortgage Status in Keene
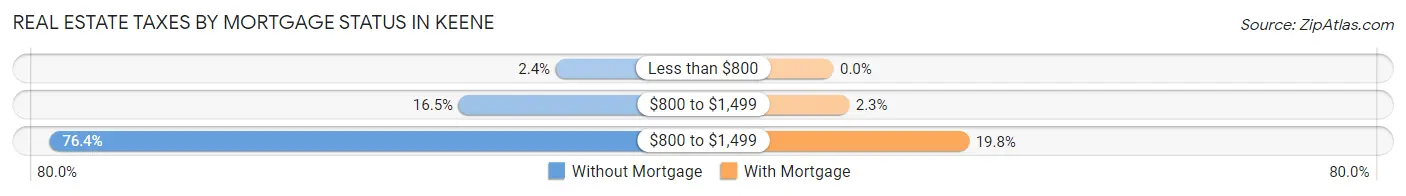
| Property Taxes | Without Mortgage | With Mortgage |
| Less than $800 | 9 (2.4%) | 0 (0.0%) |
| $800 to $1,499 | 63 (16.5%) | 15 (2.3%) |
| $800 to $1,499 | 291 (76.4%) | 129 (19.8%) |
| Total | 381 (100.0%) | 651 (100.0%) |
Health & Disability in Keene
Health Insurance Coverage by Age in Keene
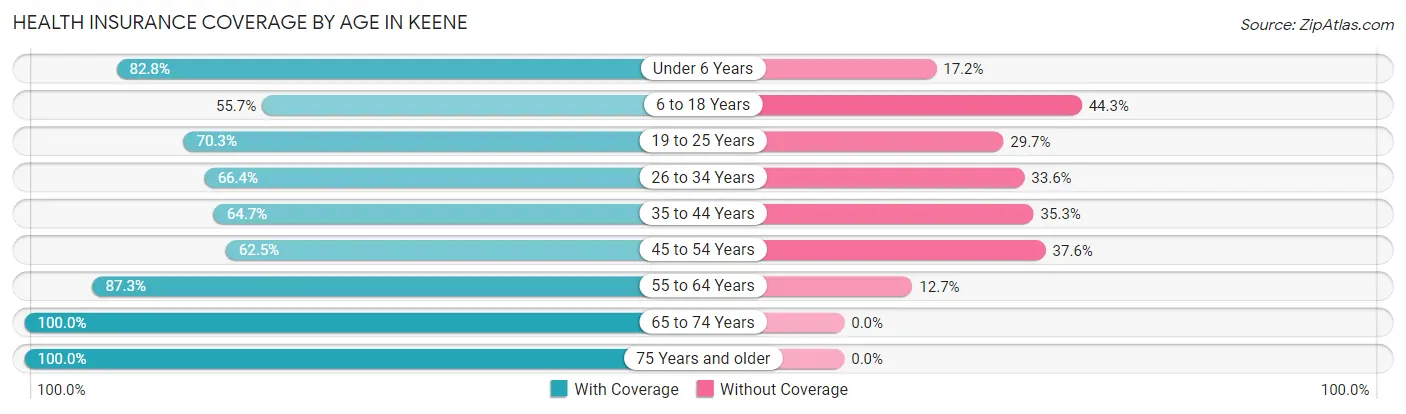
| Age Bracket | With Coverage | Without Coverage |
| Under 6 Years | 391 (82.8%) | 81 (17.2%) |
| 6 to 18 Years | 697 (55.7%) | 554 (44.3%) |
| 19 to 25 Years | 721 (70.3%) | 304 (29.7%) |
| 26 to 34 Years | 597 (66.4%) | 302 (33.6%) |
| 35 to 44 Years | 381 (64.7%) | 208 (35.3%) |
| 45 to 54 Years | 464 (62.5%) | 279 (37.6%) |
| 55 to 64 Years | 447 (87.3%) | 65 (12.7%) |
| 65 to 74 Years | 291 (100.0%) | 0 (0.0%) |
| 75 Years and older | 501 (100.0%) | 0 (0.0%) |
| Total | 4,490 (71.5%) | 1,793 (28.5%) |
Health Insurance Coverage by Citizenship Status in Keene
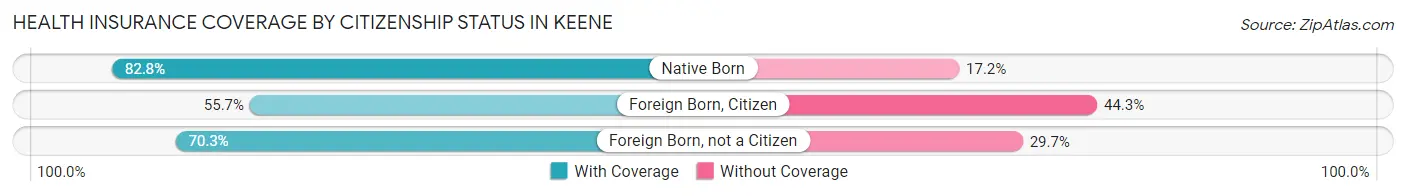
| Citizenship Status | With Coverage | Without Coverage |
| Native Born | 391 (82.8%) | 81 (17.2%) |
| Foreign Born, Citizen | 697 (55.7%) | 554 (44.3%) |
| Foreign Born, not a Citizen | 721 (70.3%) | 304 (29.7%) |
Health Insurance Coverage by Household Income in Keene
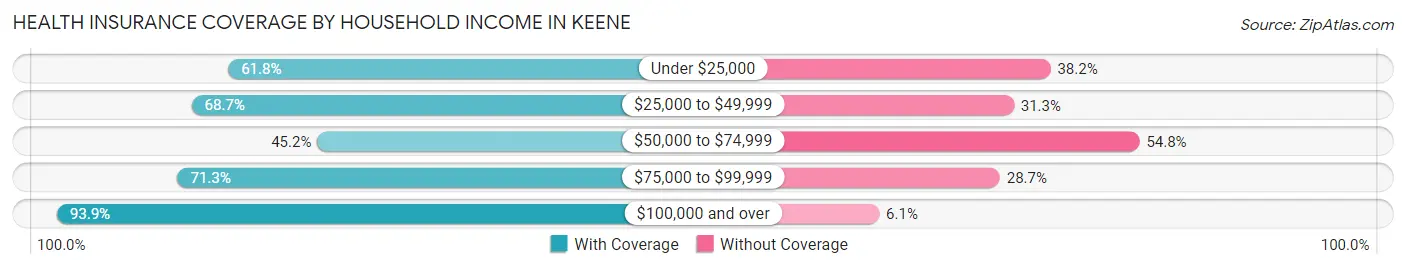
| Household Income | With Coverage | Without Coverage |
| Under $25,000 | 483 (61.8%) | 298 (38.2%) |
| $25,000 to $49,999 | 1,076 (68.7%) | 490 (31.3%) |
| $50,000 to $74,999 | 505 (45.2%) | 613 (54.8%) |
| $75,000 to $99,999 | 704 (71.3%) | 283 (28.7%) |
| $100,000 and over | 1,396 (93.9%) | 90 (6.1%) |
Public vs Private Health Insurance Coverage by Age in Keene
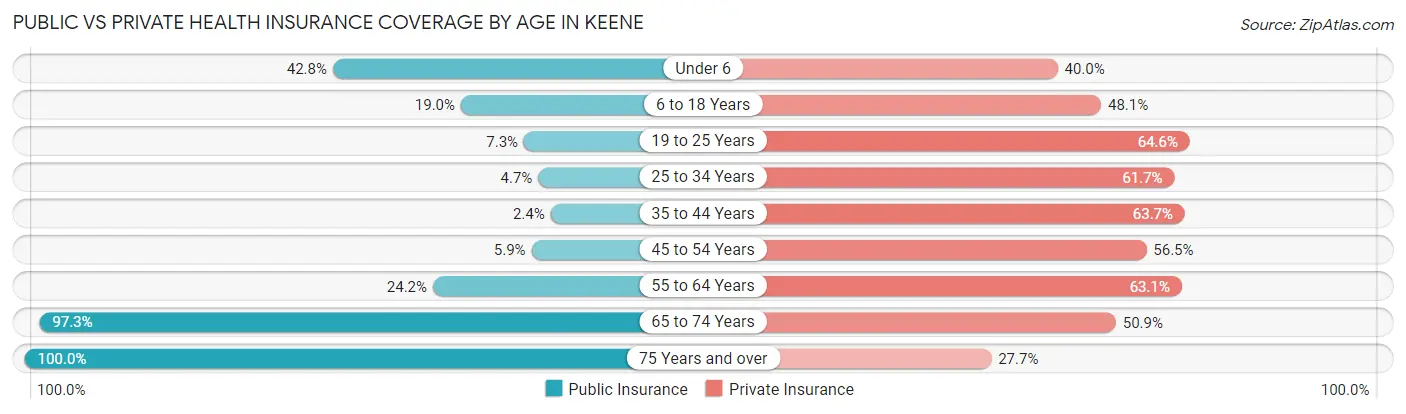
| Age Bracket | Public Insurance | Private Insurance |
| Under 6 | 202 (42.8%) | 189 (40.0%) |
| 6 to 18 Years | 238 (19.0%) | 602 (48.1%) |
| 19 to 25 Years | 75 (7.3%) | 662 (64.6%) |
| 25 to 34 Years | 42 (4.7%) | 555 (61.7%) |
| 35 to 44 Years | 14 (2.4%) | 375 (63.7%) |
| 45 to 54 Years | 44 (5.9%) | 420 (56.5%) |
| 55 to 64 Years | 124 (24.2%) | 323 (63.1%) |
| 65 to 74 Years | 283 (97.3%) | 148 (50.9%) |
| 75 Years and over | 501 (100.0%) | 139 (27.7%) |
| Total | 1,523 (24.2%) | 3,413 (54.3%) |
Disability Status by Sex by Age in Keene
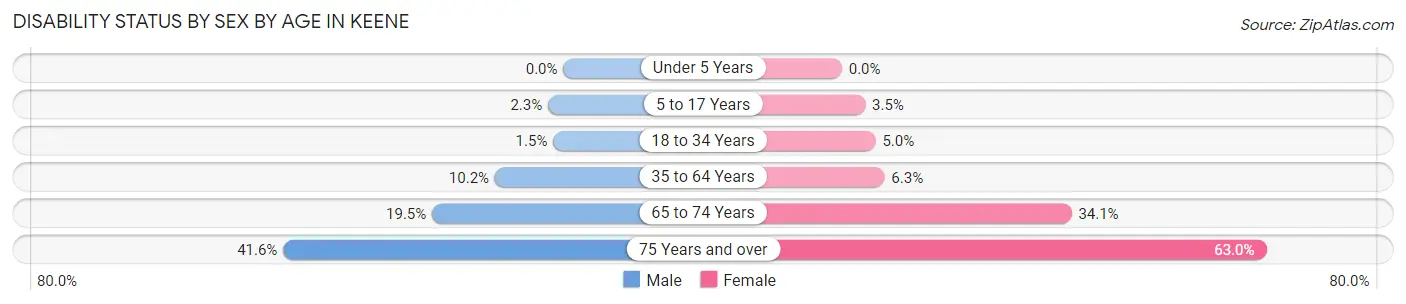
| Age Bracket | Male | Female |
| Under 5 Years | 0 (0.0%) | 0 (0.0%) |
| 5 to 17 Years | 14 (2.3%) | 19 (3.5%) |
| 18 to 34 Years | 13 (1.5%) | 59 (5.0%) |
| 35 to 64 Years | 91 (10.2%) | 60 (6.3%) |
| 65 to 74 Years | 23 (19.5%) | 59 (34.1%) |
| 75 Years and over | 52 (41.6%) | 237 (63.0%) |
Disability Class by Sex by Age in Keene
Disability Class: Hearing Difficulty
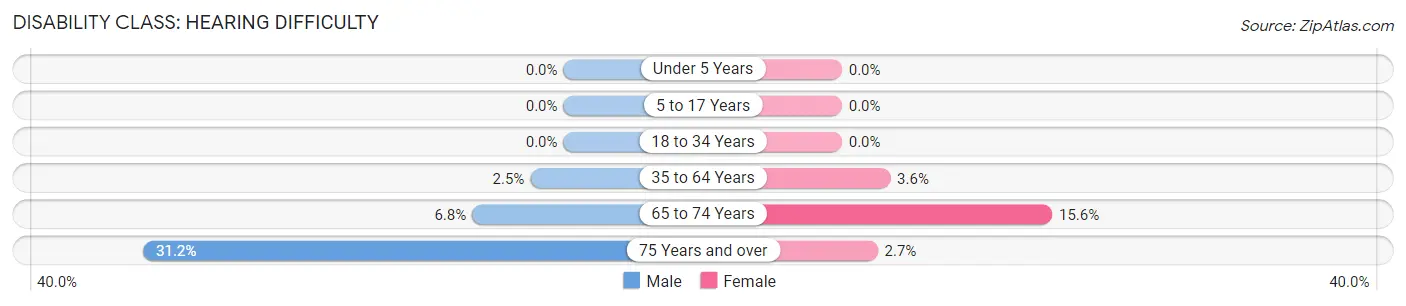
| Age Bracket | Male | Female |
| Under 5 Years | 0 (0.0%) | 0 (0.0%) |
| 5 to 17 Years | 0 (0.0%) | 0 (0.0%) |
| 18 to 34 Years | 0 (0.0%) | 0 (0.0%) |
| 35 to 64 Years | 22 (2.5%) | 34 (3.6%) |
| 65 to 74 Years | 8 (6.8%) | 27 (15.6%) |
| 75 Years and over | 39 (31.2%) | 10 (2.7%) |
Disability Class: Vision Difficulty
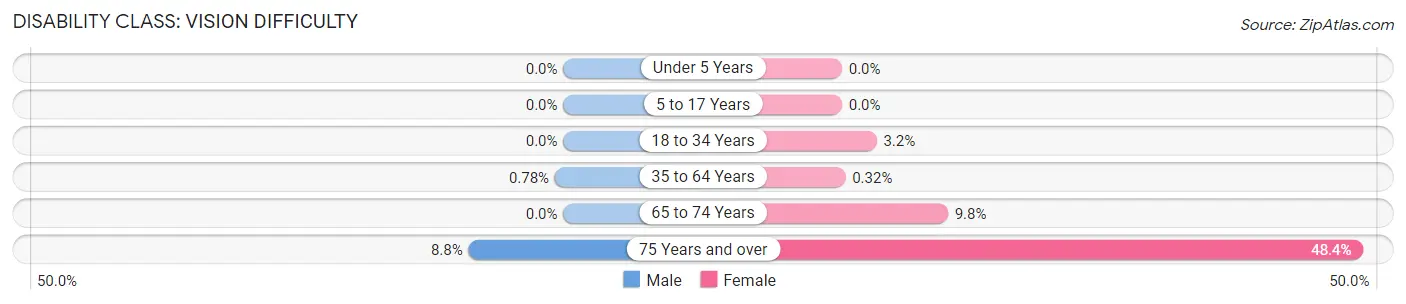
| Age Bracket | Male | Female |
| Under 5 Years | 0 (0.0%) | 0 (0.0%) |
| 5 to 17 Years | 0 (0.0%) | 0 (0.0%) |
| 18 to 34 Years | 0 (0.0%) | 38 (3.2%) |
| 35 to 64 Years | 7 (0.8%) | 3 (0.3%) |
| 65 to 74 Years | 0 (0.0%) | 17 (9.8%) |
| 75 Years and over | 11 (8.8%) | 182 (48.4%) |
Disability Class: Cognitive Difficulty
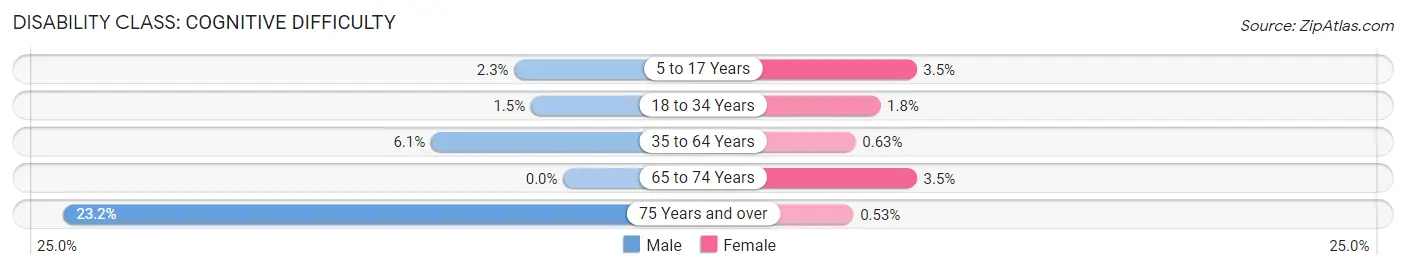
| Age Bracket | Male | Female |
| 5 to 17 Years | 14 (2.3%) | 19 (3.5%) |
| 18 to 34 Years | 13 (1.5%) | 21 (1.8%) |
| 35 to 64 Years | 55 (6.1%) | 6 (0.6%) |
| 65 to 74 Years | 0 (0.0%) | 6 (3.5%) |
| 75 Years and over | 29 (23.2%) | 2 (0.5%) |
Disability Class: Ambulatory Difficulty
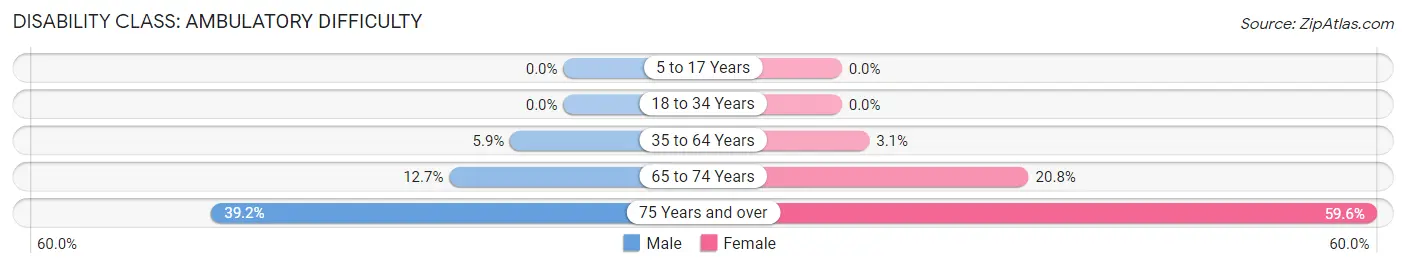
| Age Bracket | Male | Female |
| 5 to 17 Years | 0 (0.0%) | 0 (0.0%) |
| 18 to 34 Years | 0 (0.0%) | 0 (0.0%) |
| 35 to 64 Years | 53 (5.9%) | 29 (3.1%) |
| 65 to 74 Years | 15 (12.7%) | 36 (20.8%) |
| 75 Years and over | 49 (39.2%) | 224 (59.6%) |
Disability Class: Self-Care Difficulty
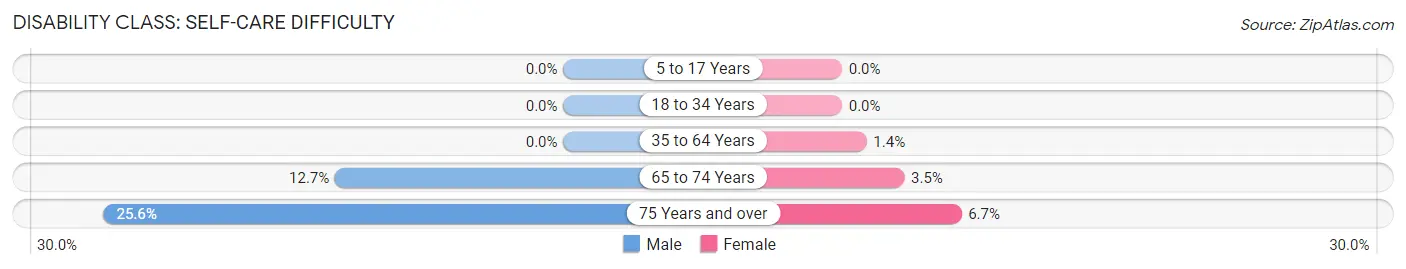
| Age Bracket | Male | Female |
| 5 to 17 Years | 0 (0.0%) | 0 (0.0%) |
| 18 to 34 Years | 0 (0.0%) | 0 (0.0%) |
| 35 to 64 Years | 0 (0.0%) | 13 (1.4%) |
| 65 to 74 Years | 15 (12.7%) | 6 (3.5%) |
| 75 Years and over | 32 (25.6%) | 25 (6.7%) |
Technology Access in Keene
Computing Device Access in Keene
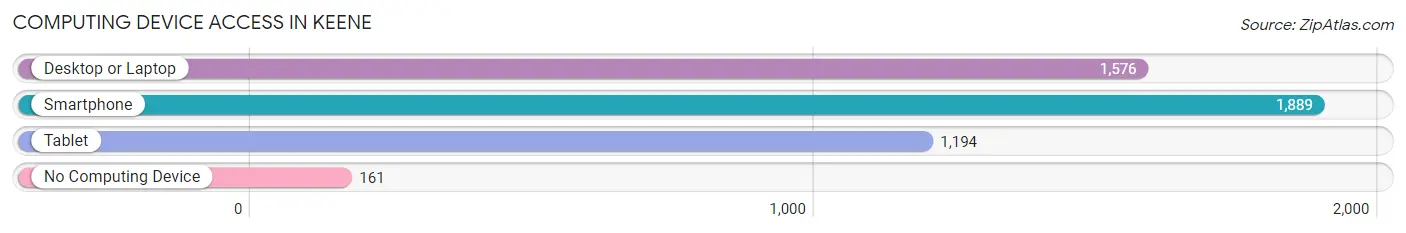
| Device Type | # Households | % Households |
| Desktop or Laptop | 1,576 | 74.7% |
| Smartphone | 1,889 | 89.6% |
| Tablet | 1,194 | 56.6% |
| No Computing Device | 161 | 7.6% |
| Total | 2,109 | 100.0% |
Internet Access in Keene
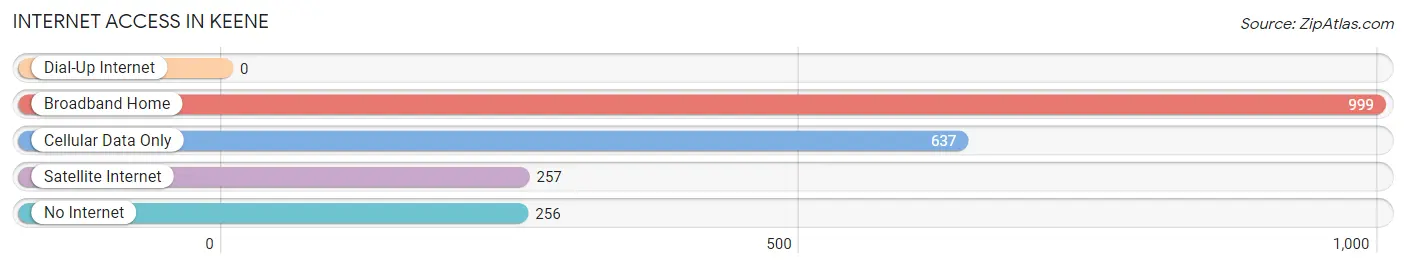
| Internet Type | # Households | % Households |
| Dial-Up Internet | 0 | 0.0% |
| Broadband Home | 999 | 47.4% |
| Cellular Data Only | 637 | 30.2% |
| Satellite Internet | 257 | 12.2% |
| No Internet | 256 | 12.1% |
| Total | 2,109 | 100.0% |
Keene Summary
Keene, Texas is a small city located in Johnson County, Texas, United States. It is situated about 25 miles south of Fort Worth and is part of the Dallas-Fort Worth-Arlington metropolitan area. The population of Keene was estimated to be 6,719 in 2019.
History
Keene was founded in 1881 by a group of settlers from Kentucky. The town was named after a prominent local family, the Keenes. The town was incorporated in 1883 and the first post office was established in 1884.
The town grew rapidly in the late 19th century, and by 1900, it had a population of 1,000. The town was a center of commerce and industry, with several cotton gins, a flour mill, and a brick factory.
In the early 20th century, Keene was a popular stop on the Texas and Pacific Railway. The town was also home to several churches, schools, and a hospital.
Geography
Keene is located in Johnson County, Texas, about 25 miles south of Fort Worth. The city is situated at the intersection of State Highway 67 and State Highway 174. The city is surrounded by rolling hills and is located in the Cross Timbers region of Texas.
The climate in Keene is hot and humid in the summer and mild in the winter. The average annual temperature is 68°F (20°C). The average annual precipitation is 36 inches (91 cm).
Economy
Keene is a small city with a diverse economy. The city is home to several manufacturing companies, including a plastics manufacturer, a metal fabricator, and a food processor. The city is also home to several retail stores, restaurants, and other businesses.
The city is also home to several educational institutions, including Southwestern Adventist University and Texas A&M University-Commerce.
Demographics
As of the 2019 census, the population of Keene was estimated to be 6,719. The racial makeup of the city was 79.3% White, 14.2% Hispanic or Latino, 4.2% African American, 0.7% Native American, 0.3% Asian, and 1.5% from other races.
The median household income in Keene was $45,945 in 2019. The median home value was $128,400. The median age of the population was 37.7 years.
Conclusion
Keene, Texas is a small city located in Johnson County, Texas, United States. It is situated about 25 miles south of Fort Worth and is part of the Dallas-Fort Worth-Arlington metropolitan area. The city has a diverse economy and is home to several manufacturing companies, retail stores, restaurants, and educational institutions. The population of Keene was estimated to be 6,719 in 2019. The median household income in Keene was $45,945 in 2019 and the median home value was $128,400.
Common Questions
What is Per Capita Income in Keene?
Per Capita income in Keene is $22,993.
What is the Median Family Income in Keene?
Median Family Income in Keene is $68,833.
What is the Median Household income in Keene?
Median Household Income in Keene is $53,701.
What is Income or Wage Gap in Keene?
Income or Wage Gap in Keene is 48.0%.
Women in Keene earn 52.0 cents for every dollar earned by a man.
What is Inequality or Gini Index in Keene?
Inequality or Gini Index in Keene is 0.41.
What is the Total Population of Keene?
Total Population of Keene is 6,451.
What is the Total Male Population of Keene?
Total Male Population of Keene is 2,943.
What is the Total Female Population of Keene?
Total Female Population of Keene is 3,508.
What is the Ratio of Males per 100 Females in Keene?
There are 83.89 Males per 100 Females in Keene.
What is the Ratio of Females per 100 Males in Keene?
There are 119.20 Females per 100 Males in Keene.
What is the Median Population Age in Keene?
Median Population Age in Keene is 31.4 Years.
What is the Average Family Size in Keene
Average Family Size in Keene is 3.4 People.
What is the Average Household Size in Keene
Average Household Size in Keene is 2.8 People.
How Large is the Labor Force in Keene?
There are 3,104 People in the Labor Forcein in Keene.
What is the Percentage of People in the Labor Force in Keene?
62.9% of People are in the Labor Force in Keene.
What is the Unemployment Rate in Keene?
Unemployment Rate in Keene is 4.5%.