Geronimo, TX Map & Demographics
Geronimo Map
Geronimo Overview
$30,470
PER CAPITA INCOME
$88,625
AVG FAMILY INCOME
$65,714
AVG HOUSEHOLD INCOME
25.8%
WAGE / INCOME GAP [ % ]
74.2¢/ $1
WAGE / INCOME GAP [ $ ]
0.37
INEQUALITY / GINI INDEX
1,075
TOTAL POPULATION
490
MALE POPULATION
585
FEMALE POPULATION
83.76
MALES / 100 FEMALES
119.39
FEMALES / 100 MALES
26.0
MEDIAN AGE
3.9
AVG FAMILY SIZE
3.8
AVG HOUSEHOLD SIZE
600
LABOR FORCE [ PEOPLE ]
71.8%
PERCENT IN LABOR FORCE
1.8%
UNEMPLOYMENT RATE
Geronimo Area Codes
Income in Geronimo
Income Overview in Geronimo
Per Capita Income in Geronimo is $30,470, while median incomes of families and households are $88,625 and $65,714 respectively.
| Characteristic | Number | Measure |
| Per Capita Income | 1,075 | $30,470 |
| Median Family Income | 247 | $88,625 |
| Mean Family Income | 247 | $111,677 |
| Median Household Income | 286 | $65,714 |
| Mean Household Income | 286 | $109,367 |
| Income Deficit | 247 | $0 |
| Wage / Income Gap (%) | 1,075 | 25.78% |
| Wage / Income Gap ($) | 1,075 | 74.22¢ per $1 |
| Gini / Inequality Index | 1,075 | 0.37 |
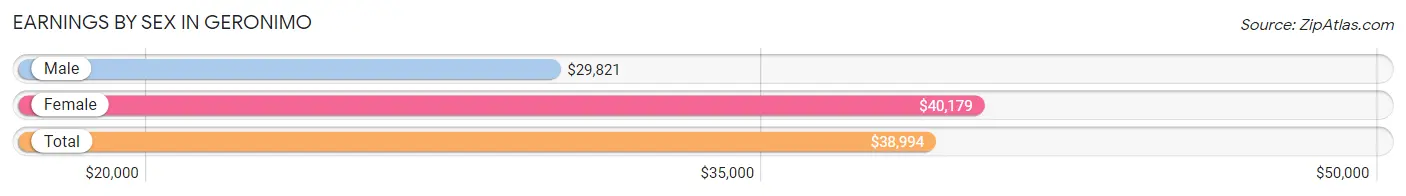
Earnings by Sex in Geronimo
Average Earnings in Geronimo are $38,994, $29,821 for men and $40,179 for women, a difference of 25.8%.
| Sex | Number | Average Earnings |
| Male | 285 (47.2%) | $29,821 |
| Female | 319 (52.8%) | $40,179 |
| Total | 604 (100.0%) | $38,994 |
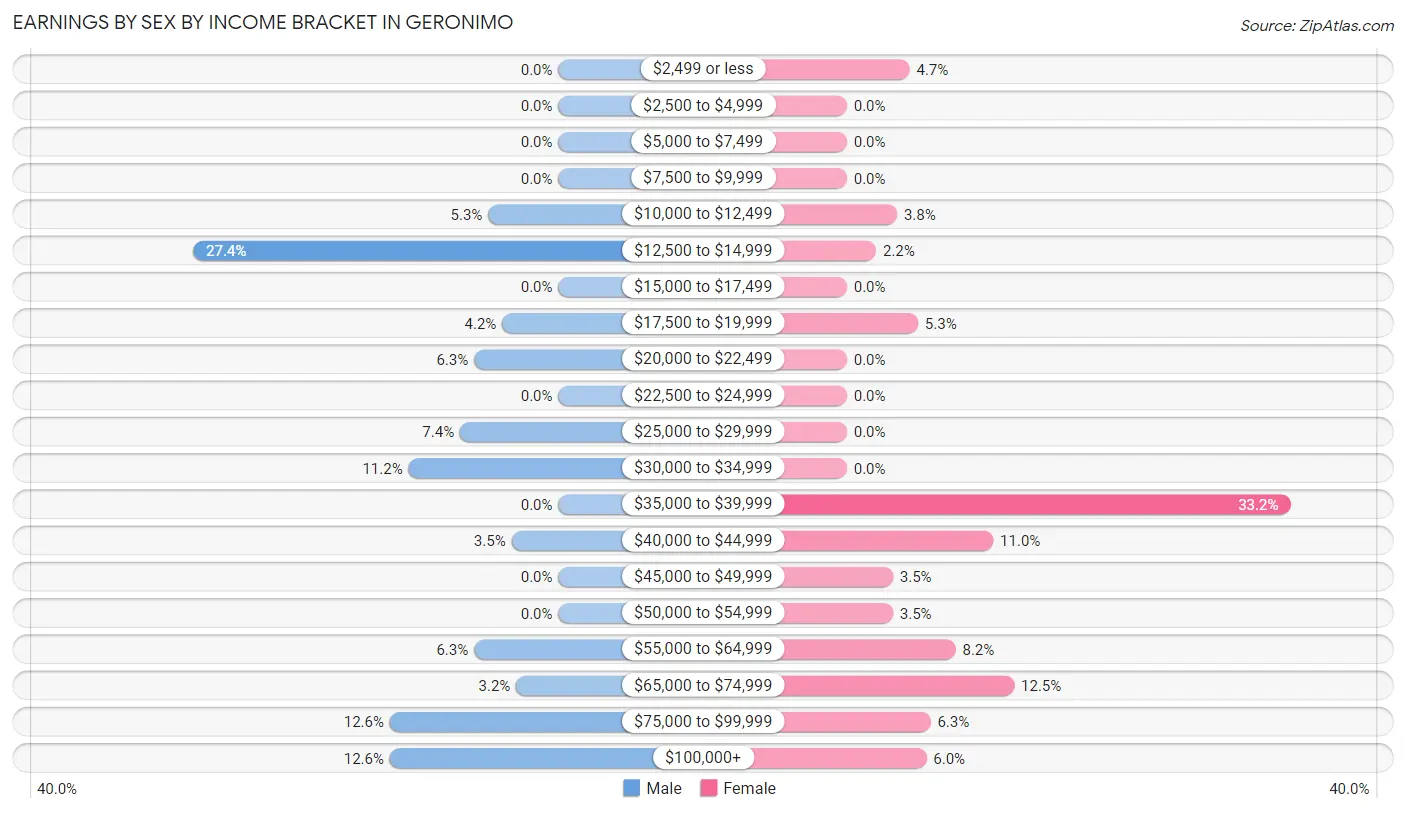
Earnings by Sex by Income Bracket in Geronimo
The most common earnings brackets in Geronimo are $12,500 to $14,999 for men (78 | 27.4%) and $35,000 to $39,999 for women (106 | 33.2%).
| Income | Male | Female |
| $2,499 or less | 0 (0.0%) | 15 (4.7%) |
| $2,500 to $4,999 | 0 (0.0%) | 0 (0.0%) |
| $5,000 to $7,499 | 0 (0.0%) | 0 (0.0%) |
| $7,500 to $9,999 | 0 (0.0%) | 0 (0.0%) |
| $10,000 to $12,499 | 15 (5.3%) | 12 (3.8%) |
| $12,500 to $14,999 | 78 (27.4%) | 7 (2.2%) |
| $15,000 to $17,499 | 0 (0.0%) | 0 (0.0%) |
| $17,500 to $19,999 | 12 (4.2%) | 17 (5.3%) |
| $20,000 to $22,499 | 18 (6.3%) | 0 (0.0%) |
| $22,500 to $24,999 | 0 (0.0%) | 0 (0.0%) |
| $25,000 to $29,999 | 21 (7.4%) | 0 (0.0%) |
| $30,000 to $34,999 | 32 (11.2%) | 0 (0.0%) |
| $35,000 to $39,999 | 0 (0.0%) | 106 (33.2%) |
| $40,000 to $44,999 | 10 (3.5%) | 35 (11.0%) |
| $45,000 to $49,999 | 0 (0.0%) | 11 (3.5%) |
| $50,000 to $54,999 | 0 (0.0%) | 11 (3.5%) |
| $55,000 to $64,999 | 18 (6.3%) | 26 (8.2%) |
| $65,000 to $74,999 | 9 (3.2%) | 40 (12.5%) |
| $75,000 to $99,999 | 36 (12.6%) | 20 (6.3%) |
| $100,000+ | 36 (12.6%) | 19 (6.0%) |
| Total | 285 (100.0%) | 319 (100.0%) |
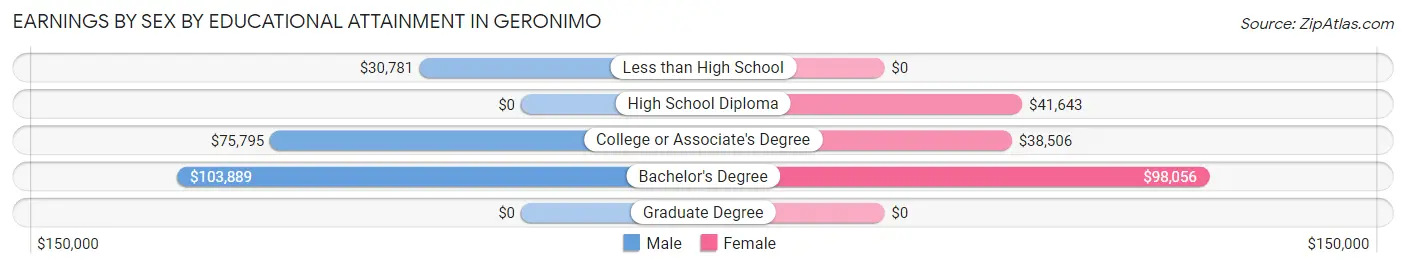
Earnings by Sex by Educational Attainment in Geronimo
Average earnings in Geronimo are $62,361 for men and $40,714 for women, a difference of 34.7%. Men with an educational attainment of bachelor's degree enjoy the highest average annual earnings of $103,889, while those with less than high school education earn the least with $30,781. Women with an educational attainment of bachelor's degree earn the most with the average annual earnings of $98,056, while those with college or associate's degree education have the smallest earnings of $38,506.
| Educational Attainment | Male Income | Female Income |
| Less than High School | $30,781 | $0 |
| High School Diploma | - | - |
| College or Associate's Degree | $75,795 | $38,506 |
| Bachelor's Degree | $103,889 | $98,056 |
| Graduate Degree | - | - |
| Total | $62,361 | $40,714 |
Family Income in Geronimo
Family Income Brackets in Geronimo
According to the Geronimo family income data, there are 109 families falling into the $50,000 to $74,999 income range, which is the most common income bracket and makes up 44.1% of all families.
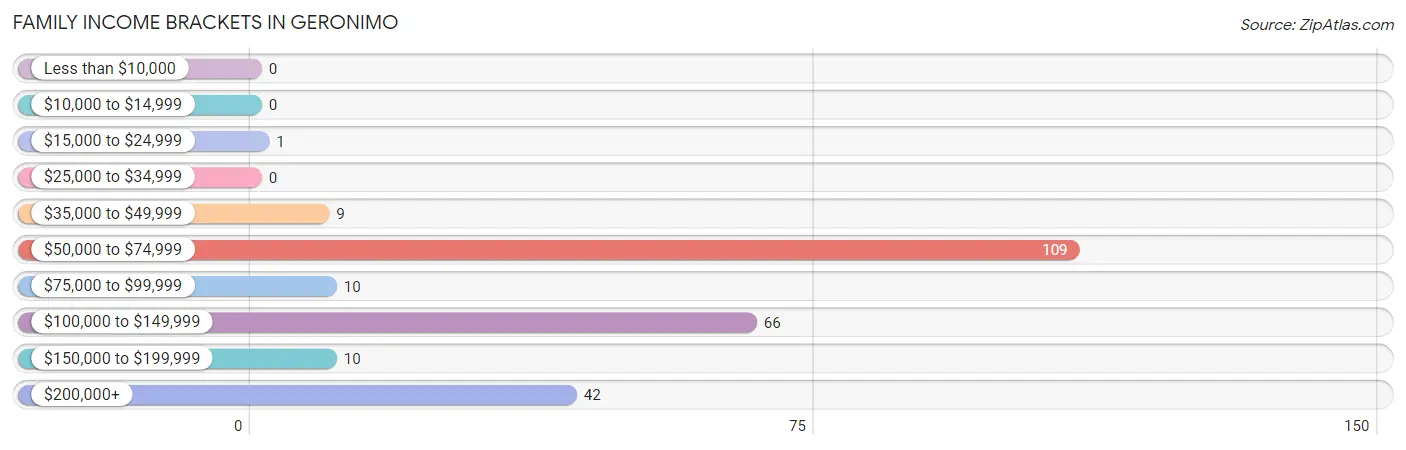
| Income Bracket | # Families | % Families |
| Less than $10,000 | 0 | 0.0% |
| $10,000 to $14,999 | 0 | 0.0% |
| $15,000 to $24,999 | 1 | 0.4% |
| $25,000 to $34,999 | 0 | 0.0% |
| $35,000 to $49,999 | 9 | 3.6% |
| $50,000 to $74,999 | 109 | 44.1% |
| $75,000 to $99,999 | 10 | 4.0% |
| $100,000 to $149,999 | 66 | 26.7% |
| $150,000 to $199,999 | 10 | 4.0% |
| $200,000+ | 42 | 17.0% |
Family Income by Famaliy Size in Geronimo
2-person families (80 | 32.4%) account for the highest median family income in Geronimo with $117,652 per family, while 2-person families (80 | 32.4%) have the highest median income of $58,826 per family member.
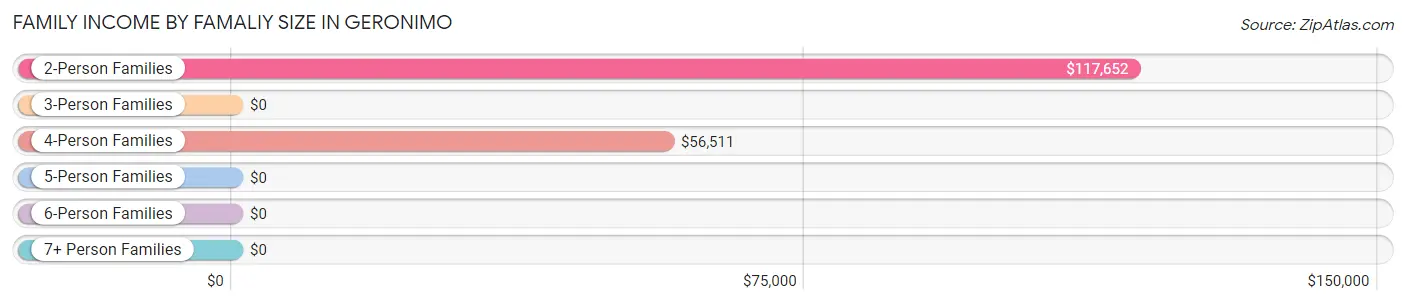
| Income Bracket | # Families | Median Income |
| 2-Person Families | 80 (32.4%) | $117,652 |
| 3-Person Families | 42 (17.0%) | $0 |
| 4-Person Families | 81 (32.8%) | $56,511 |
| 5-Person Families | 2 (0.8%) | $0 |
| 6-Person Families | 24 (9.7%) | $0 |
| 7+ Person Families | 18 (7.3%) | $0 |
| Total | 247 (100.0%) | $88,625 |
Family Income by Number of Earners in Geronimo
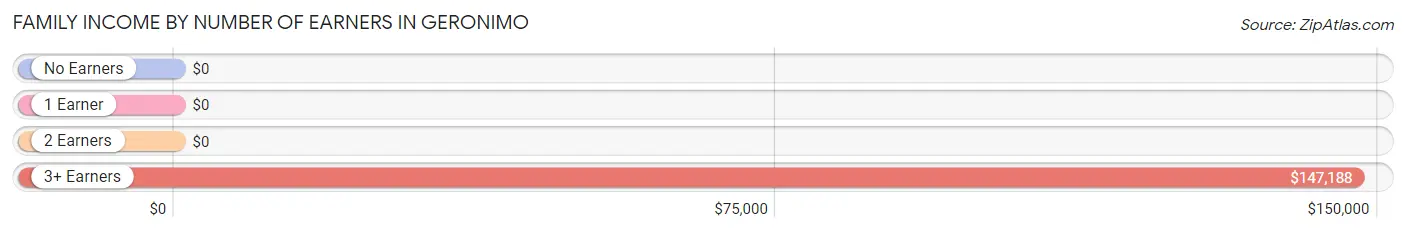
| Number of Earners | # Families | Median Income |
| No Earners | 18 (7.3%) | $0 |
| 1 Earner | 32 (13.0%) | $0 |
| 2 Earners | 149 (60.3%) | $0 |
| 3+ Earners | 48 (19.4%) | $147,188 |
| Total | 247 (100.0%) | $88,625 |
Household Income in Geronimo
Household Income Brackets in Geronimo
With 115 households falling in the category, the $50,000 to $74,999 income range is the most frequent in Geronimo, accounting for 40.2% of all households.
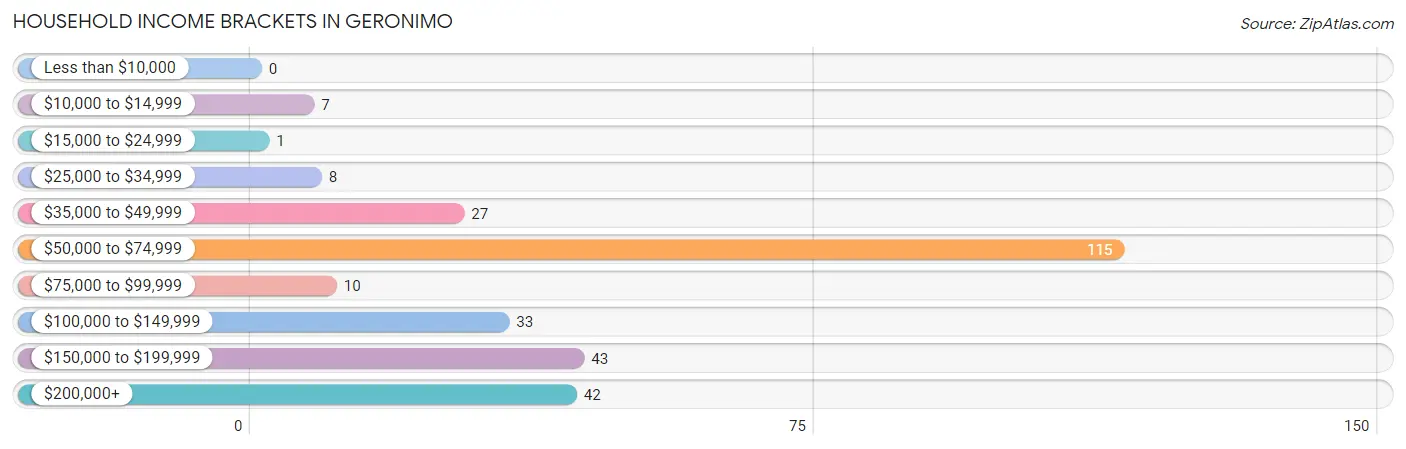
| Income Bracket | # Households | % Households |
| Less than $10,000 | 0 | 0.0% |
| $10,000 to $14,999 | 7 | 2.4% |
| $15,000 to $24,999 | 1 | 0.3% |
| $25,000 to $34,999 | 8 | 2.8% |
| $35,000 to $49,999 | 27 | 9.4% |
| $50,000 to $74,999 | 115 | 40.2% |
| $75,000 to $99,999 | 10 | 3.5% |
| $100,000 to $149,999 | 33 | 11.5% |
| $150,000 to $199,999 | 43 | 15.0% |
| $200,000+ | 42 | 14.7% |
Household Income by Householder Age in Geronimo
The median household income in Geronimo is $65,714, with the highest median household income of $66,591 found in the 45 to 64 years age bracket for the primary householder. A total of 76 households (26.6%) fall into this category.
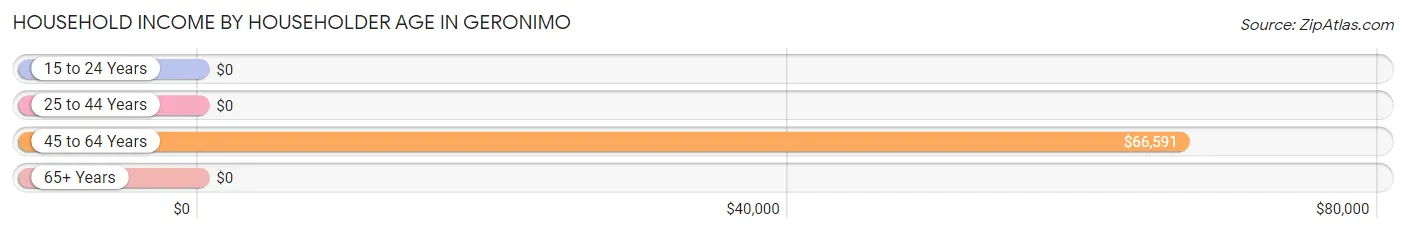
| Income Bracket | # Households | Median Income |
| 15 to 24 Years | 0 (0.0%) | $0 |
| 25 to 44 Years | 149 (52.1%) | $0 |
| 45 to 64 Years | 76 (26.6%) | $66,591 |
| 65+ Years | 61 (21.3%) | $0 |
| Total | 286 (100.0%) | $65,714 |
Poverty in Geronimo
Income Below Poverty by Sex and Age in Geronimo
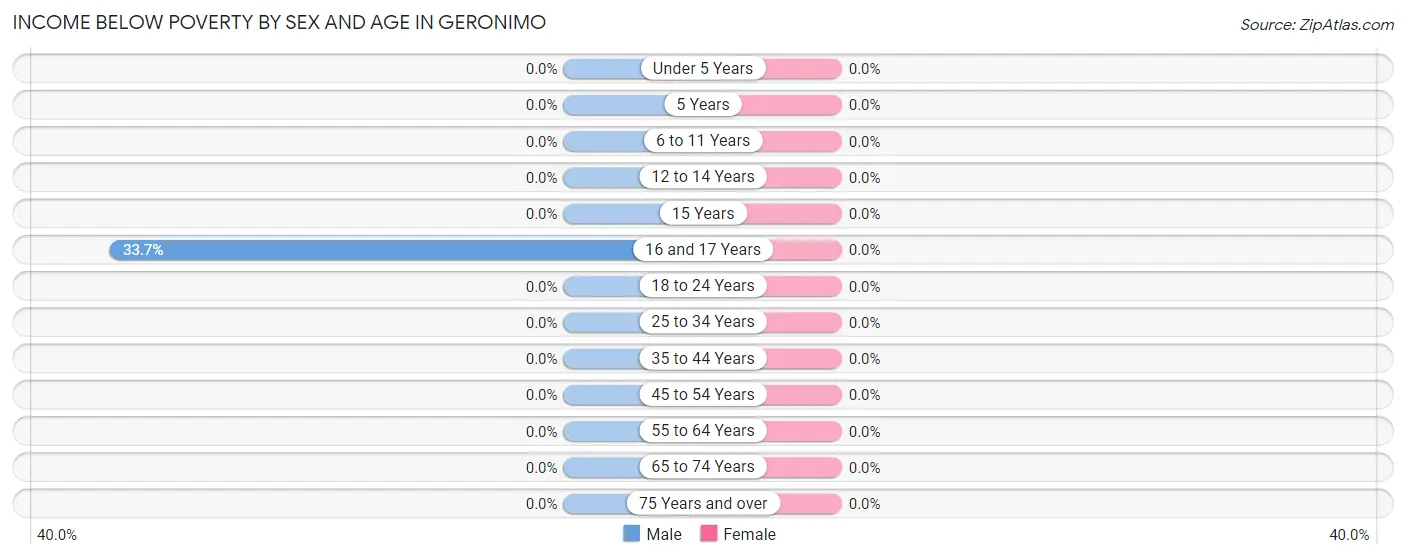
| Age Bracket | Male | Female |
| Under 5 Years | 0 (0.0%) | 0 (0.0%) |
| 5 Years | 0 (0.0%) | 0 (0.0%) |
| 6 to 11 Years | 0 (0.0%) | 0 (0.0%) |
| 12 to 14 Years | 0 (0.0%) | 0 (0.0%) |
| 15 Years | 0 (0.0%) | 0 (0.0%) |
| 16 and 17 Years | 35 (33.7%) | 0 (0.0%) |
| 18 to 24 Years | 0 (0.0%) | 0 (0.0%) |
| 25 to 34 Years | 0 (0.0%) | 0 (0.0%) |
| 35 to 44 Years | 0 (0.0%) | 0 (0.0%) |
| 45 to 54 Years | 0 (0.0%) | 0 (0.0%) |
| 55 to 64 Years | 0 (0.0%) | 0 (0.0%) |
| 65 to 74 Years | 0 (0.0%) | 0 (0.0%) |
| 75 Years and over | 0 (0.0%) | 0 (0.0%) |
| Total | 35 (7.1%) | 0 (0.0%) |
Income Above Poverty by Sex and Age in Geronimo
According to the poverty statistics in Geronimo, males aged under 5 years and females aged under 5 years are the age groups that are most secure financially, with 100.0% of males and 100.0% of females in these age groups living above the poverty line.
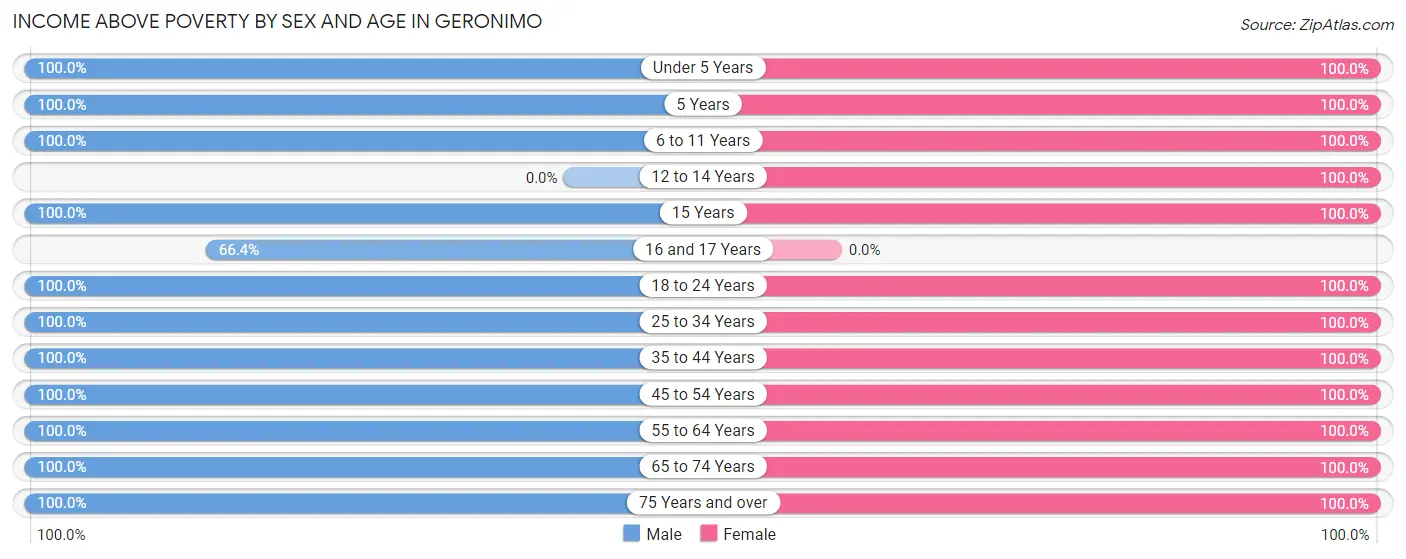
| Age Bracket | Male | Female |
| Under 5 Years | 20 (100.0%) | 53 (100.0%) |
| 5 Years | 22 (100.0%) | 12 (100.0%) |
| 6 to 11 Years | 11 (100.0%) | 19 (100.0%) |
| 12 to 14 Years | 0 (0.0%) | 66 (100.0%) |
| 15 Years | 23 (100.0%) | 13 (100.0%) |
| 16 and 17 Years | 69 (66.3%) | 0 (0.0%) |
| 18 to 24 Years | 121 (100.0%) | 26 (100.0%) |
| 25 to 34 Years | 76 (100.0%) | 92 (100.0%) |
| 35 to 44 Years | 17 (100.0%) | 150 (100.0%) |
| 45 to 54 Years | 25 (100.0%) | 49 (100.0%) |
| 55 to 64 Years | 27 (100.0%) | 60 (100.0%) |
| 65 to 74 Years | 35 (100.0%) | 12 (100.0%) |
| 75 Years and over | 9 (100.0%) | 33 (100.0%) |
| Total | 455 (92.9%) | 585 (100.0%) |
Income Below Poverty Among Married-Couple Families in Geronimo
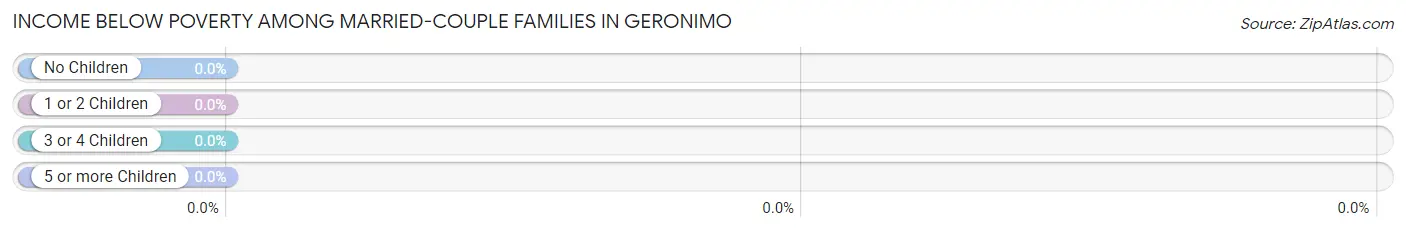
| Children | Above Poverty | Below Poverty |
| No Children | 94 (100.0%) | 0 (0.0%) |
| 1 or 2 Children | 41 (100.0%) | 0 (0.0%) |
| 3 or 4 Children | 36 (100.0%) | 0 (0.0%) |
| 5 or more Children | 0 (0.0%) | 0 (0.0%) |
| Total | 171 (100.0%) | 0 (0.0%) |
Income Below Poverty Among Single-Parent Households in Geronimo
| Children | Single Father | Single Mother |
| No Children | 0 (0.0%) | 0 (0.0%) |
| 1 or 2 Children | 0 (0.0%) | 0 (0.0%) |
| 3 or 4 Children | 0 (0.0%) | 0 (0.0%) |
| 5 or more Children | 0 (0.0%) | 0 (0.0%) |
| Total | 0 (0.0%) | 0 (0.0%) |
Income Below Poverty Among Married-Couple vs Single-Parent Households in Geronimo
| Children | Married-Couple Families | Single-Parent Households |
| No Children | 0 (0.0%) | 0 (0.0%) |
| 1 or 2 Children | 0 (0.0%) | 0 (0.0%) |
| 3 or 4 Children | 0 (0.0%) | 0 (0.0%) |
| 5 or more Children | 0 (0.0%) | 0 (0.0%) |
| Total | 0 (0.0%) | 0 (0.0%) |
Race in Geronimo
The most populous races in Geronimo are White / Caucasian (643 | 59.8%), Hispanic or Latino (608 | 56.6%), and Two or more Races (332 | 30.9%).
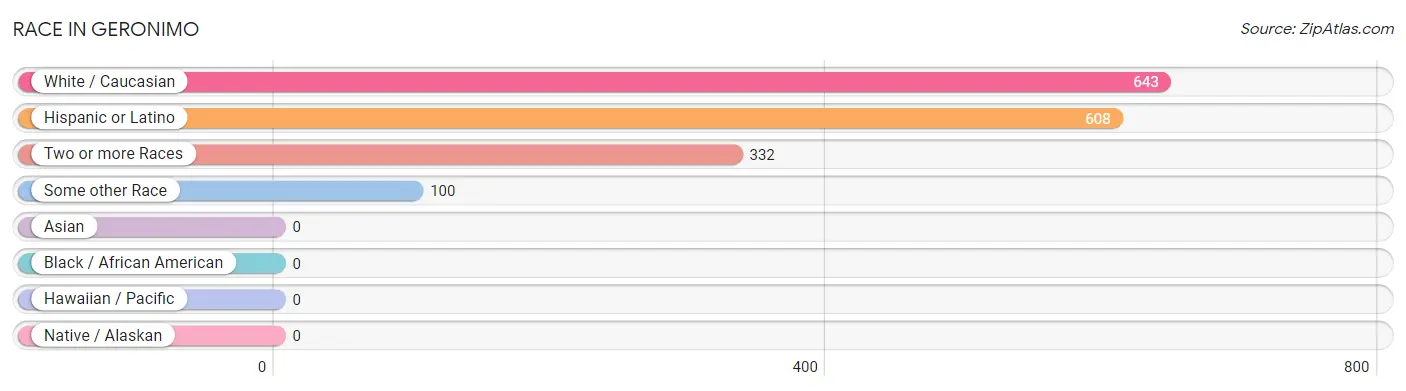
| Race | # Population | % Population |
| Asian | 0 | 0.0% |
| Black / African American | 0 | 0.0% |
| Hawaiian / Pacific | 0 | 0.0% |
| Hispanic or Latino | 608 | 56.6% |
| Native / Alaskan | 0 | 0.0% |
| White / Caucasian | 643 | 59.8% |
| Two or more Races | 332 | 30.9% |
| Some other Race | 100 | 9.3% |
| Total | 1,075 | 100.0% |
Ancestry in Geronimo
The most populous ancestries reported in Geronimo are Mexican (541 | 50.3%), German (352 | 32.7%), American (89 | 8.3%), English (64 | 5.9%), and Irish (58 | 5.4%), together accounting for 102.7% of all Geronimo residents.
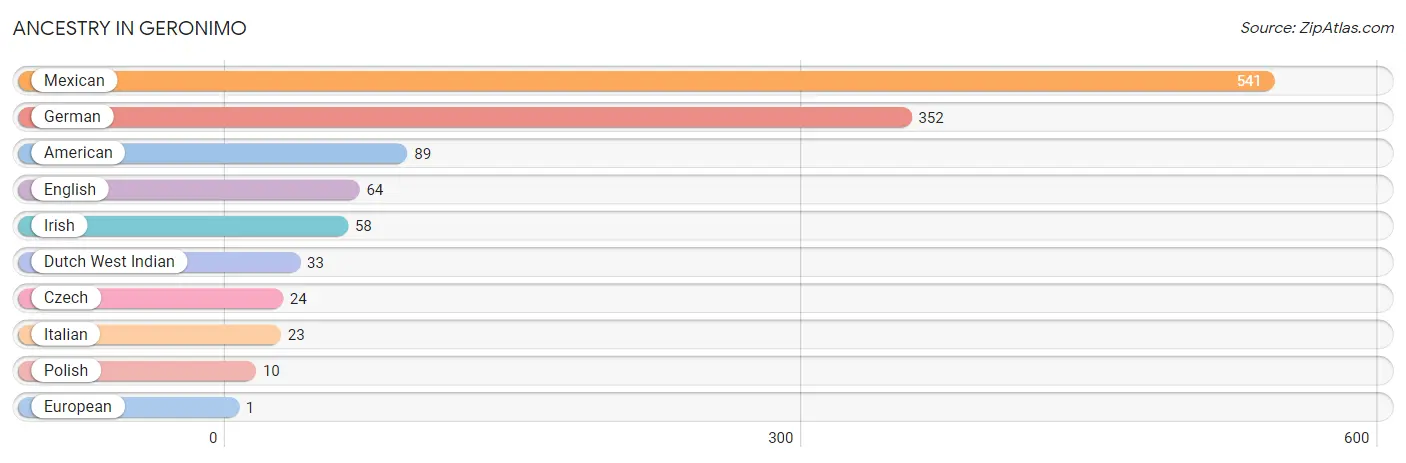
| Ancestry | # Population | % Population |
| American | 89 | 8.3% |
| Czech | 24 | 2.2% |
| Dutch West Indian | 33 | 3.1% |
| English | 64 | 5.9% |
| European | 1 | 0.1% |
| German | 352 | 32.7% |
| Irish | 58 | 5.4% |
| Italian | 23 | 2.1% |
| Mexican | 541 | 50.3% |
| Polish | 10 | 0.9% | View All 10 Rows |
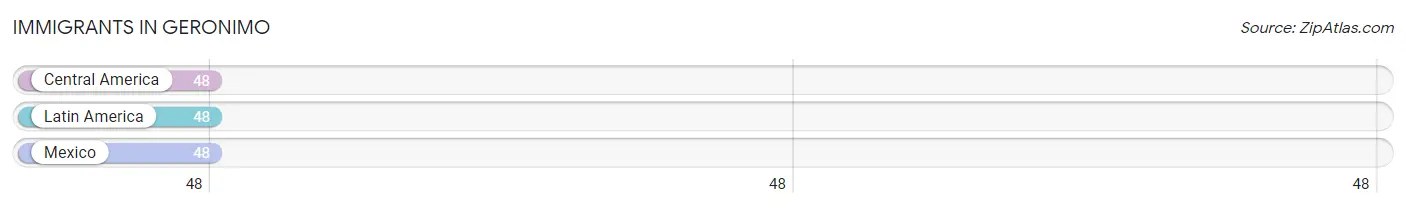
Immigrants in Geronimo
The most numerous immigrant groups reported in Geronimo came from Central America (48 | 4.5%), Latin America (48 | 4.5%), and Mexico (48 | 4.5%), together accounting for 13.4% of all Geronimo residents.
| Immigration Origin | # Population | % Population |
| Central America | 48 | 4.5% |
| Latin America | 48 | 4.5% |
| Mexico | 48 | 4.5% | View All 3 Rows |
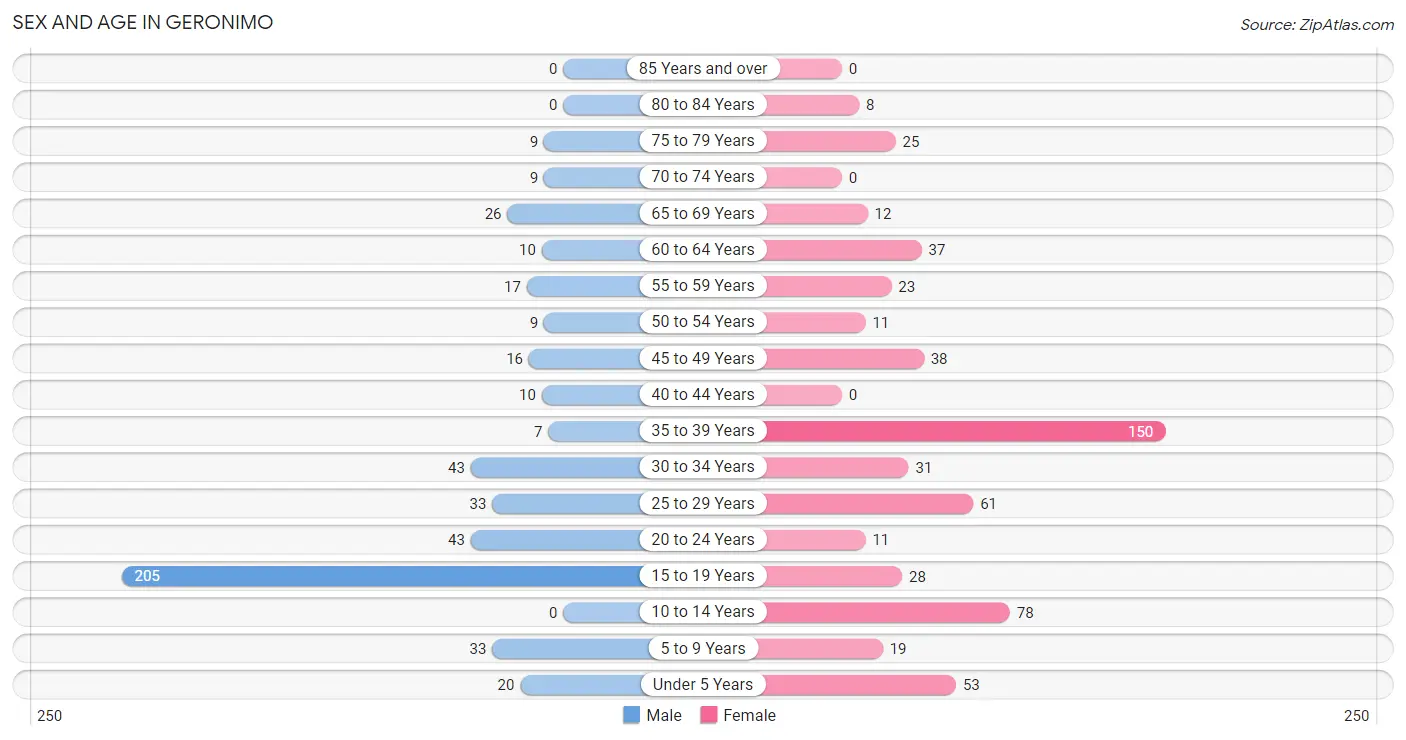
Sex and Age in Geronimo
Sex and Age in Geronimo
The most populous age groups in Geronimo are 15 to 19 Years (205 | 41.8%) for men and 35 to 39 Years (150 | 25.6%) for women.
| Age Bracket | Male | Female |
| Under 5 Years | 20 (4.1%) | 53 (9.1%) |
| 5 to 9 Years | 33 (6.7%) | 19 (3.3%) |
| 10 to 14 Years | 0 (0.0%) | 78 (13.3%) |
| 15 to 19 Years | 205 (41.8%) | 28 (4.8%) |
| 20 to 24 Years | 43 (8.8%) | 11 (1.9%) |
| 25 to 29 Years | 33 (6.7%) | 61 (10.4%) |
| 30 to 34 Years | 43 (8.8%) | 31 (5.3%) |
| 35 to 39 Years | 7 (1.4%) | 150 (25.6%) |
| 40 to 44 Years | 10 (2.0%) | 0 (0.0%) |
| 45 to 49 Years | 16 (3.3%) | 38 (6.5%) |
| 50 to 54 Years | 9 (1.8%) | 11 (1.9%) |
| 55 to 59 Years | 17 (3.5%) | 23 (3.9%) |
| 60 to 64 Years | 10 (2.0%) | 37 (6.3%) |
| 65 to 69 Years | 26 (5.3%) | 12 (2.1%) |
| 70 to 74 Years | 9 (1.8%) | 0 (0.0%) |
| 75 to 79 Years | 9 (1.8%) | 25 (4.3%) |
| 80 to 84 Years | 0 (0.0%) | 8 (1.4%) |
| 85 Years and over | 0 (0.0%) | 0 (0.0%) |
| Total | 490 (100.0%) | 585 (100.0%) |
Families and Households in Geronimo
Median Family Size in Geronimo
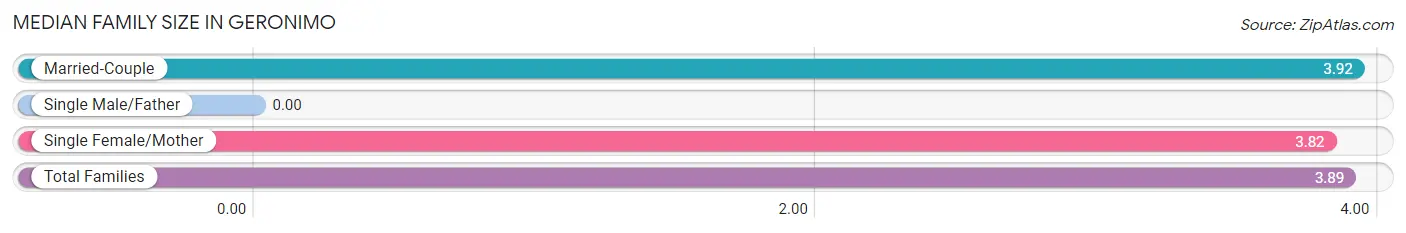
| Family Type | # Families | Family Size |
| Married-Couple | 171 (69.2%) | 3.92 |
| Single Male/Father | 0 (0.0%) | - |
| Single Female/Mother | 76 (30.8%) | 3.82 |
| Total Families | 247 (100.0%) | 3.89 |
Median Household Size in Geronimo
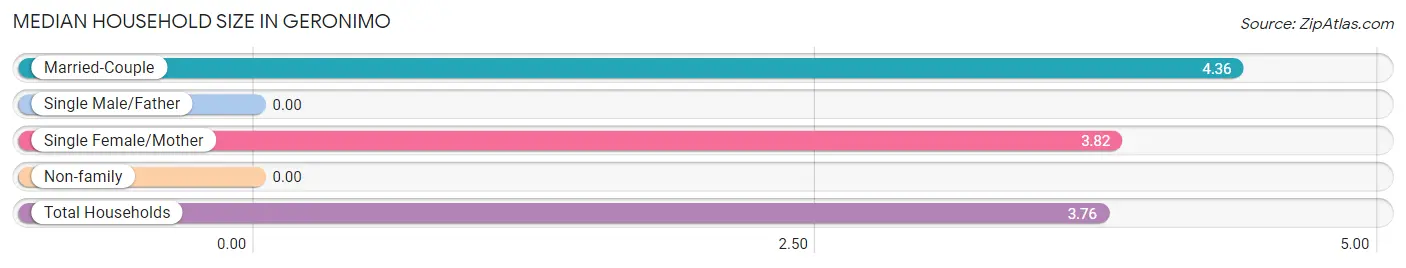
| Household Type | # Households | Household Size |
| Married-Couple | 171 (59.8%) | 4.36 |
| Single Male/Father | 0 (0.0%) | - |
| Single Female/Mother | 76 (26.6%) | 3.82 |
| Non-family | 39 (13.6%) | - |
| Total Households | 286 (100.0%) | 3.76 |
Household Size by Marriage Status in Geronimo
Out of a total of 286 households in Geronimo, 247 (86.4%) are family households, while 39 (13.6%) are nonfamily households. The most numerous type of family households are 4-person households, comprising 114, and the most common type of nonfamily households are 1-person households, comprising 39.
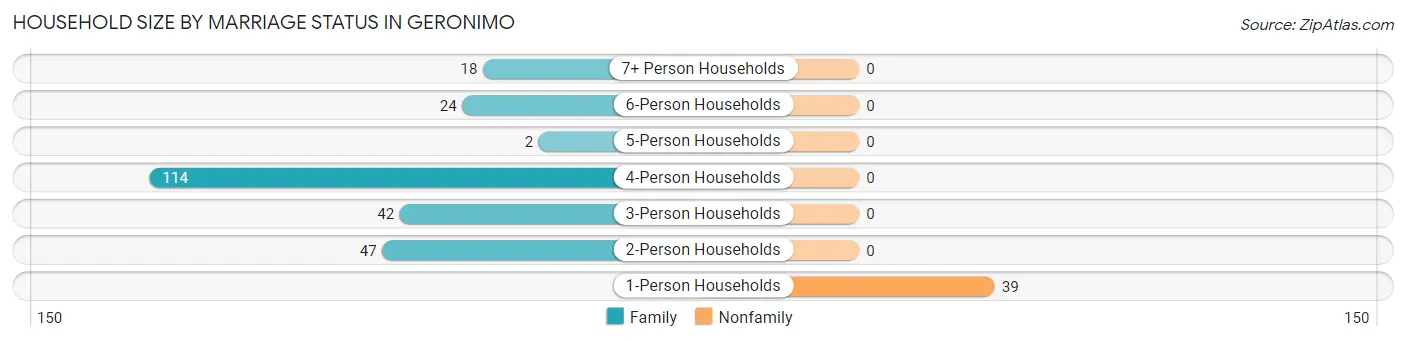
| Household Size | Family Households | Nonfamily Households |
| 1-Person Households | - | 39 (13.6%) |
| 2-Person Households | 47 (16.4%) | 0 (0.0%) |
| 3-Person Households | 42 (14.7%) | 0 (0.0%) |
| 4-Person Households | 114 (39.9%) | 0 (0.0%) |
| 5-Person Households | 2 (0.7%) | 0 (0.0%) |
| 6-Person Households | 24 (8.4%) | 0 (0.0%) |
| 7+ Person Households | 18 (6.3%) | 0 (0.0%) |
| Total | 247 (86.4%) | 39 (13.6%) |
Female Fertility in Geronimo
Fertility by Age in Geronimo
Average fertility rate in Geronimo is 6.0 births per 1,000 women. Women in the age bracket of 35 to 50 years have the highest fertility rate with 11.0 births per 1,000 women. Women in the age bracket of 35 to 50 years acount for 100.0% of all women with births.
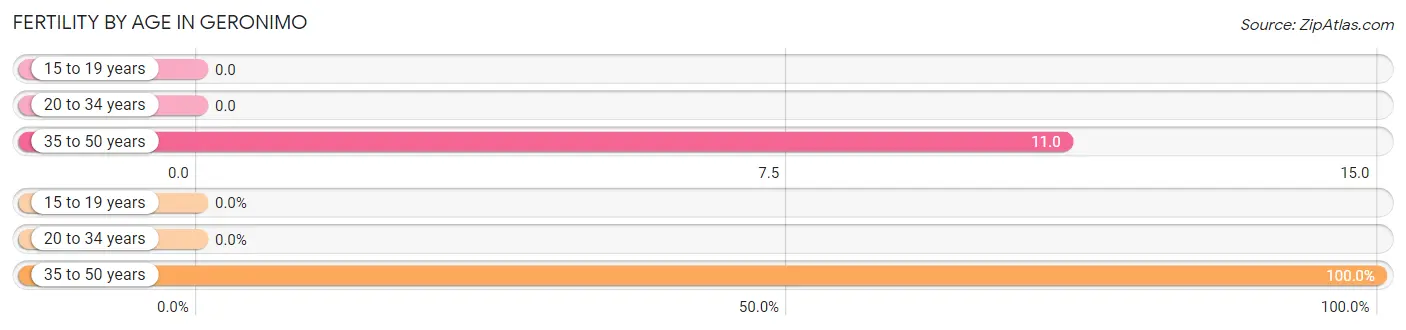
| Age Bracket | Women with Births | Births / 1,000 Women |
| 15 to 19 years | 0 (0.0%) | 0.0 |
| 20 to 34 years | 0 (0.0%) | 0.0 |
| 35 to 50 years | 2 (100.0%) | 11.0 |
| Total | 2 (100.0%) | 6.0 |
Fertility by Age by Marriage Status in Geronimo
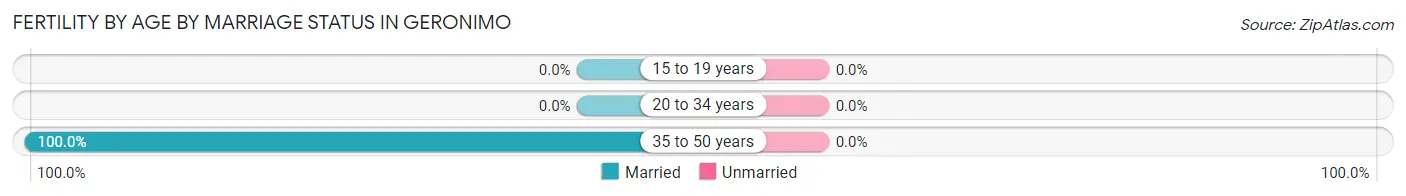
| Age Bracket | Married | Unmarried |
| 15 to 19 years | 0 (0.0%) | 0 (0.0%) |
| 20 to 34 years | 0 (0.0%) | 0 (0.0%) |
| 35 to 50 years | 2 (100.0%) | 0 (0.0%) |
| Total | 2 (100.0%) | 0 (0.0%) |
Fertility by Education in Geronimo
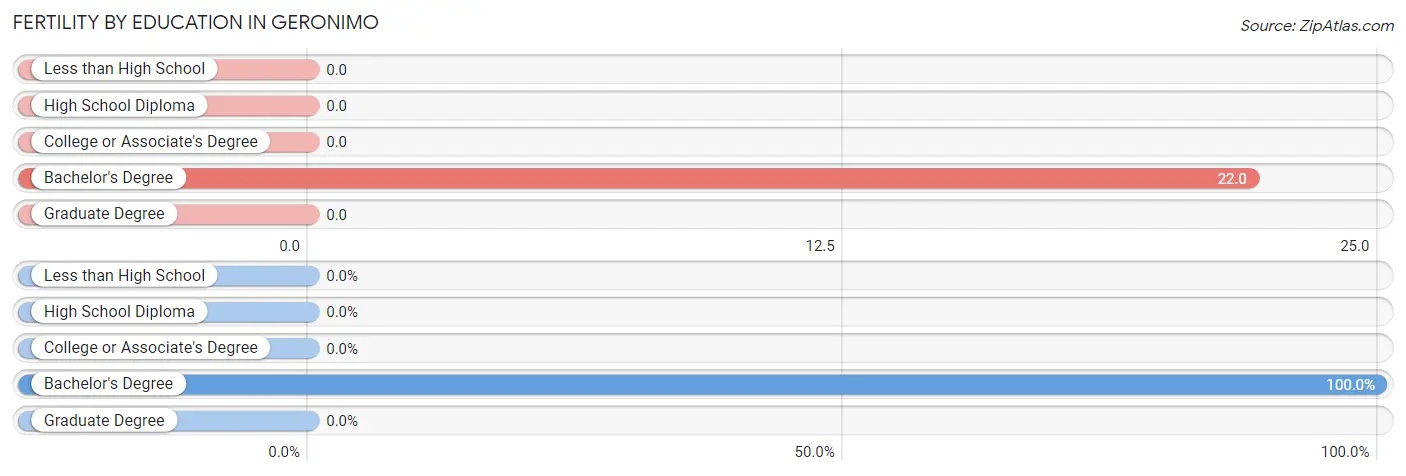
| Educational Attainment | Women with Births | Births / 1,000 Women |
| Less than High School | 0 (0.0%) | 0.0 |
| High School Diploma | 0 (0.0%) | 0.0 |
| College or Associate's Degree | 0 (0.0%) | 0.0 |
| Bachelor's Degree | 2 (100.0%) | 22.0 |
| Graduate Degree | 0 (0.0%) | 0.0 |
| Total | 2 (100.0%) | 6.0 |
Fertility by Education by Marriage Status in Geronimo
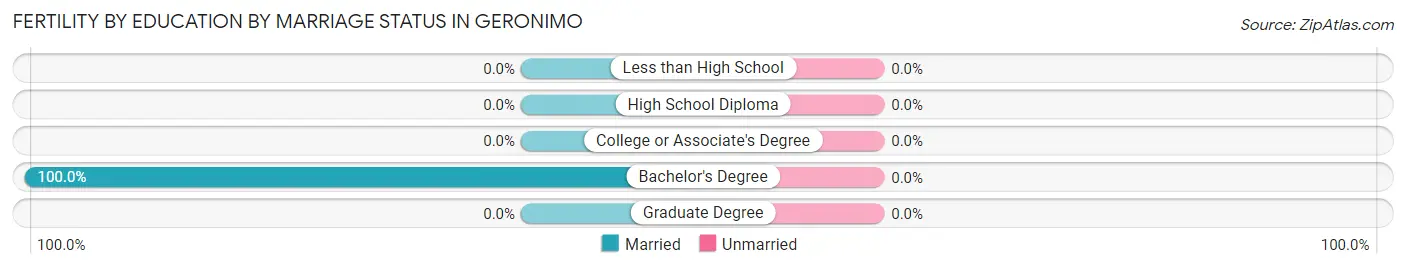
| Educational Attainment | Married | Unmarried |
| Less than High School | 0 (0.0%) | 0 (0.0%) |
| High School Diploma | 0 (0.0%) | 0 (0.0%) |
| College or Associate's Degree | 0 (0.0%) | 0 (0.0%) |
| Bachelor's Degree | 2 (100.0%) | 0 (0.0%) |
| Graduate Degree | 0 (0.0%) | 0 (0.0%) |
| Total | 2 (100.0%) | 0 (0.0%) |
Employment Characteristics in Geronimo
Employment by Class of Employer in Geronimo
Among the 589 employed individuals in Geronimo, private company employees (475 | 80.6%), local government employees (53 | 9.0%), and not-for-profit organizations (22 | 3.7%) make up the most common classes of employment.
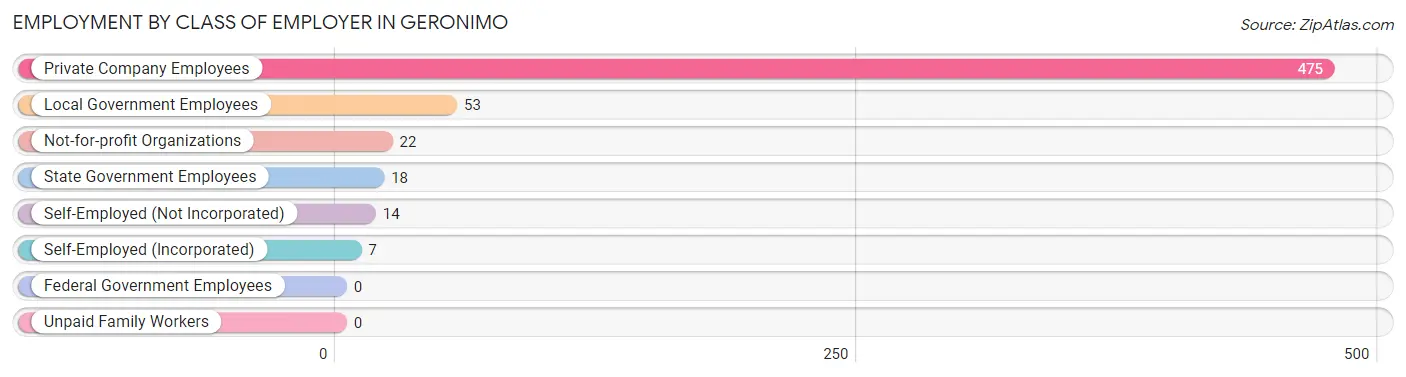
| Employer Class | # Employees | % Employees |
| Private Company Employees | 475 | 80.6% |
| Self-Employed (Incorporated) | 7 | 1.2% |
| Self-Employed (Not Incorporated) | 14 | 2.4% |
| Not-for-profit Organizations | 22 | 3.7% |
| Local Government Employees | 53 | 9.0% |
| State Government Employees | 18 | 3.1% |
| Federal Government Employees | 0 | 0.0% |
| Unpaid Family Workers | 0 | 0.0% |
| Total | 589 | 100.0% |
Employment Status by Age in Geronimo
According to the labor force statistics for Geronimo, out of the total population over 16 years of age (836), 71.8% or 600 individuals are in the labor force, with 1.8% or 11 of them unemployed. The age group with the highest labor force participation rate is 20 to 24 years, with 100.0% or 54 individuals in the labor force. Within the labor force, the 20 to 24 years age range has the highest percentage of unemployed individuals, with 20.4% or 11 of them being unemployed.
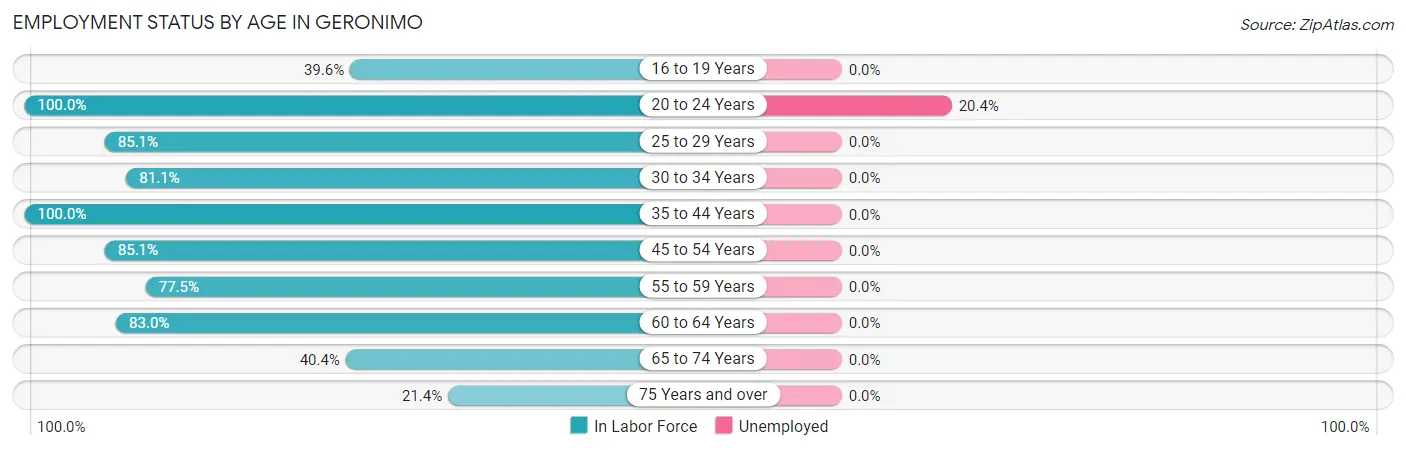
| Age Bracket | In Labor Force | Unemployed |
| 16 to 19 Years | 78 (39.6%) | 0 (0.0%) |
| 20 to 24 Years | 54 (100.0%) | 11 (20.4%) |
| 25 to 29 Years | 80 (85.1%) | 0 (0.0%) |
| 30 to 34 Years | 60 (81.1%) | 0 (0.0%) |
| 35 to 44 Years | 167 (100.0%) | 0 (0.0%) |
| 45 to 54 Years | 63 (85.1%) | 0 (0.0%) |
| 55 to 59 Years | 31 (77.5%) | 0 (0.0%) |
| 60 to 64 Years | 39 (83.0%) | 0 (0.0%) |
| 65 to 74 Years | 19 (40.4%) | 0 (0.0%) |
| 75 Years and over | 9 (21.4%) | 0 (0.0%) |
| Total | 600 (71.8%) | 11 (1.8%) |
Employment Status by Educational Attainment in Geronimo
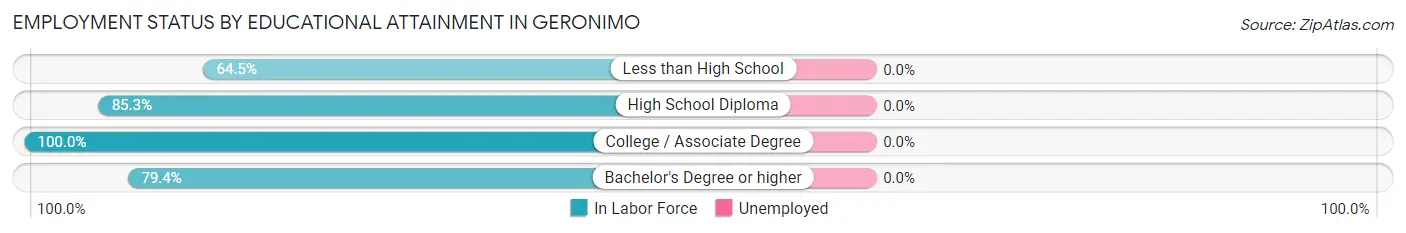
| Educational Attainment | In Labor Force | Unemployed |
| Less than High School | 20 (64.5%) | 0 (0.0%) |
| High School Diploma | 133 (85.3%) | 0 (0.0%) |
| College / Associate Degree | 202 (100.0%) | 0 (0.0%) |
| Bachelor's Degree or higher | 85 (79.4%) | 0 (0.0%) |
| Total | 440 (88.7%) | 0 (0.0%) |
Employment Occupations by Sex in Geronimo
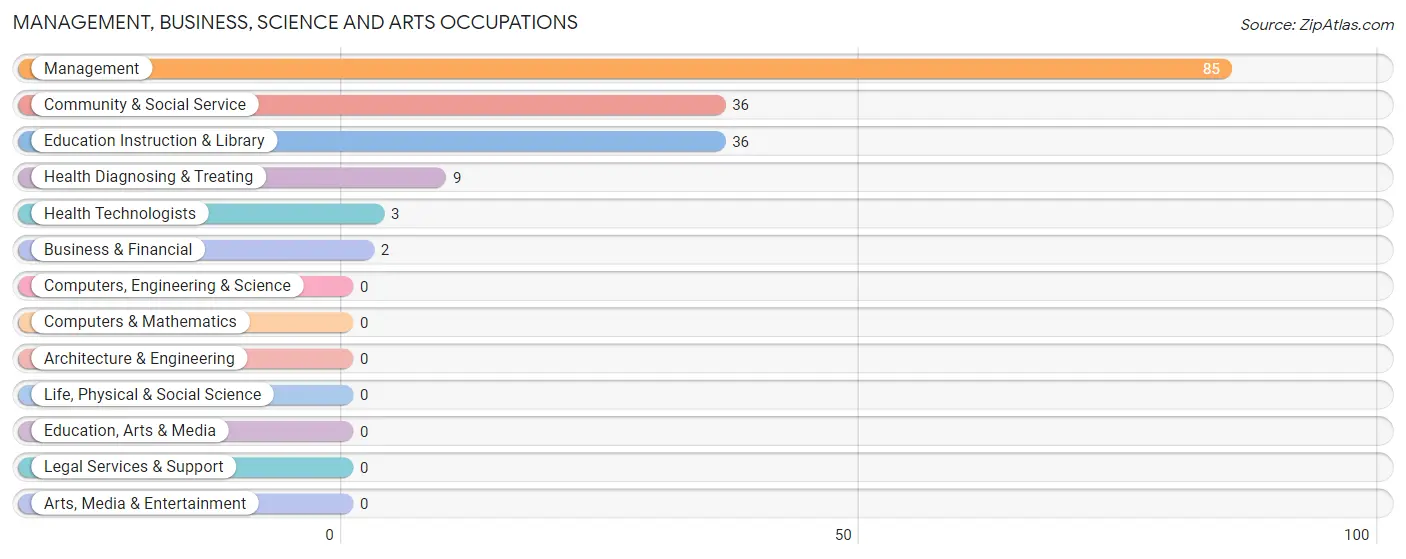
Management, Business, Science and Arts Occupations
The most common Management, Business, Science and Arts occupations in Geronimo are Management (85 | 14.4%), Community & Social Service (36 | 6.1%), Education Instruction & Library (36 | 6.1%), Health Diagnosing & Treating (9 | 1.5%), and Health Technologists (3 | 0.5%).
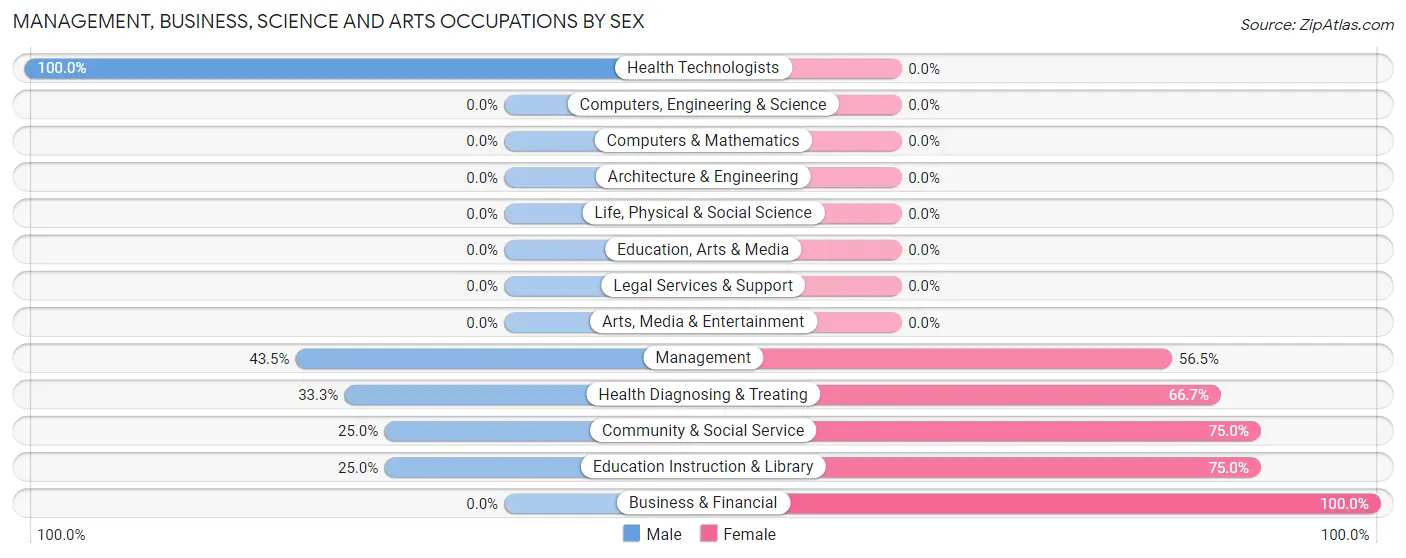
Management, Business, Science and Arts Occupations by Sex
Within the Management, Business, Science and Arts occupations in Geronimo, the most male-oriented occupations are Health Technologists (100.0%), Management (43.5%), and Health Diagnosing & Treating (33.3%), while the most female-oriented occupations are Business & Financial (100.0%), Community & Social Service (75.0%), and Education Instruction & Library (75.0%).
| Occupation | Male | Female |
| Management | 37 (43.5%) | 48 (56.5%) |
| Business & Financial | 0 (0.0%) | 2 (100.0%) |
| Computers, Engineering & Science | 0 (0.0%) | 0 (0.0%) |
| Computers & Mathematics | 0 (0.0%) | 0 (0.0%) |
| Architecture & Engineering | 0 (0.0%) | 0 (0.0%) |
| Life, Physical & Social Science | 0 (0.0%) | 0 (0.0%) |
| Community & Social Service | 9 (25.0%) | 27 (75.0%) |
| Education, Arts & Media | 0 (0.0%) | 0 (0.0%) |
| Legal Services & Support | 0 (0.0%) | 0 (0.0%) |
| Education Instruction & Library | 9 (25.0%) | 27 (75.0%) |
| Arts, Media & Entertainment | 0 (0.0%) | 0 (0.0%) |
| Health Diagnosing & Treating | 3 (33.3%) | 6 (66.7%) |
| Health Technologists | 3 (100.0%) | 0 (0.0%) |
| Total (Category) | 49 (37.1%) | 83 (62.9%) |
| Total (Overall) | 285 (48.4%) | 304 (51.6%) |
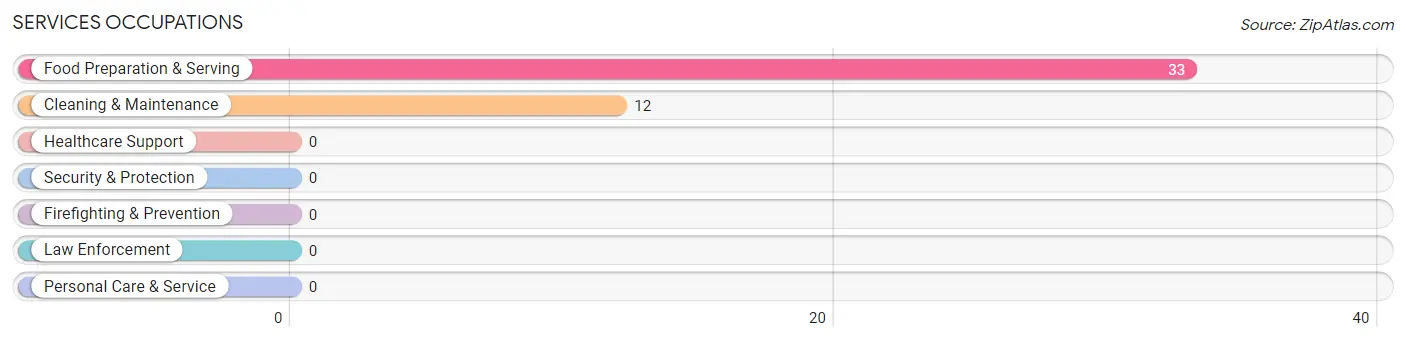
Services Occupations
The most common Services occupations in Geronimo are Food Preparation & Serving (33 | 5.6%), and Cleaning & Maintenance (12 | 2.0%).
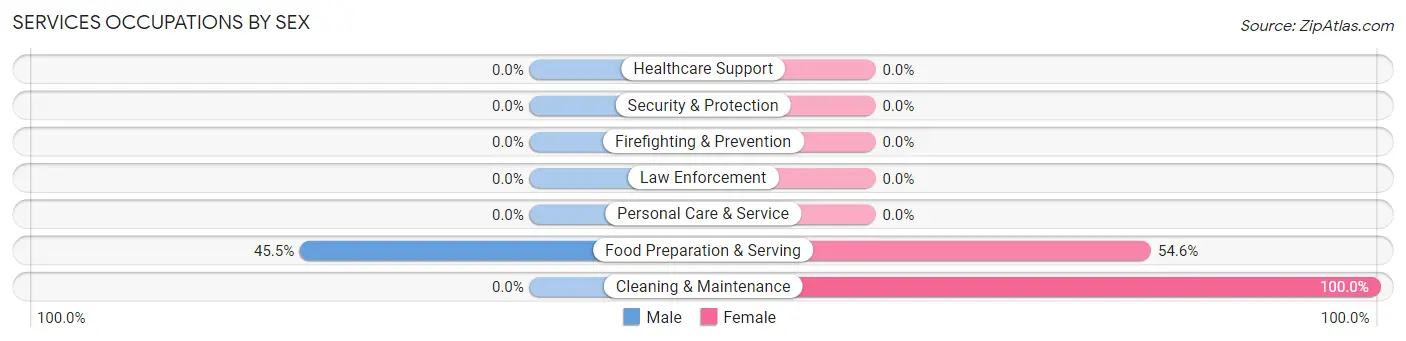
Services Occupations by Sex
| Occupation | Male | Female |
| Healthcare Support | 0 (0.0%) | 0 (0.0%) |
| Security & Protection | 0 (0.0%) | 0 (0.0%) |
| Firefighting & Prevention | 0 (0.0%) | 0 (0.0%) |
| Law Enforcement | 0 (0.0%) | 0 (0.0%) |
| Food Preparation & Serving | 15 (45.5%) | 18 (54.5%) |
| Cleaning & Maintenance | 0 (0.0%) | 12 (100.0%) |
| Personal Care & Service | 0 (0.0%) | 0 (0.0%) |
| Total (Category) | 15 (33.3%) | 30 (66.7%) |
| Total (Overall) | 285 (48.4%) | 304 (51.6%) |
Sales and Office Occupations
The most common Sales and Office occupations in Geronimo are Office & Administration (105 | 17.8%), and Sales & Related (22 | 3.7%).

Sales and Office Occupations by Sex

| Occupation | Male | Female |
| Sales & Related | 11 (50.0%) | 11 (50.0%) |
| Office & Administration | 0 (0.0%) | 105 (100.0%) |
| Total (Category) | 11 (8.7%) | 116 (91.3%) |
| Total (Overall) | 285 (48.4%) | 304 (51.6%) |
Natural Resources, Construction and Maintenance Occupations
The most common Natural Resources, Construction and Maintenance occupations in Geronimo are Installation, Maintenance & Repair (61 | 10.4%), Construction & Extraction (20 | 3.4%), and Farming, Fishing & Forestry (12 | 2.0%).

Natural Resources, Construction and Maintenance Occupations by Sex
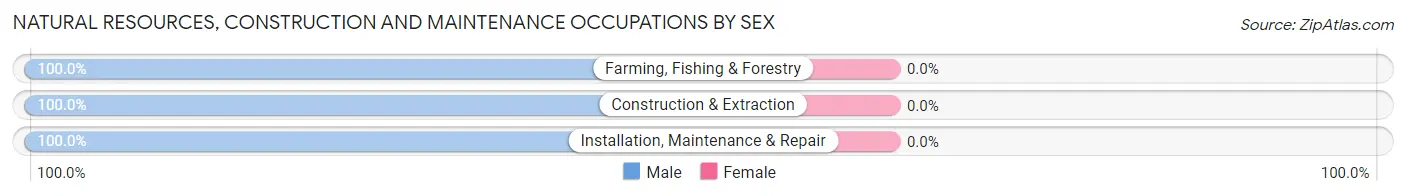
| Occupation | Male | Female |
| Farming, Fishing & Forestry | 12 (100.0%) | 0 (0.0%) |
| Construction & Extraction | 20 (100.0%) | 0 (0.0%) |
| Installation, Maintenance & Repair | 61 (100.0%) | 0 (0.0%) |
| Total (Category) | 93 (100.0%) | 0 (0.0%) |
| Total (Overall) | 285 (48.4%) | 304 (51.6%) |
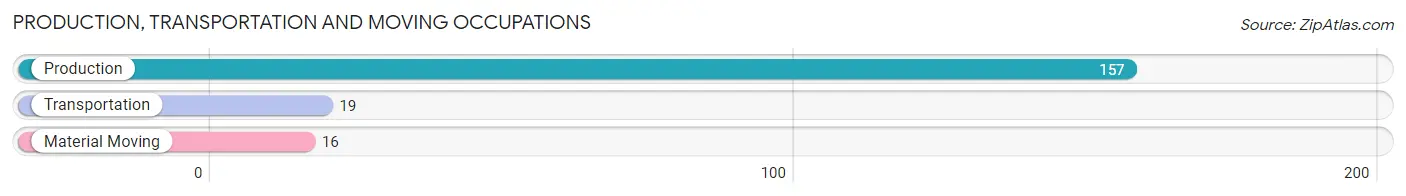
Production, Transportation and Moving Occupations
The most common Production, Transportation and Moving occupations in Geronimo are Production (157 | 26.7%), Transportation (19 | 3.2%), and Material Moving (16 | 2.7%).
Production, Transportation and Moving Occupations by Sex
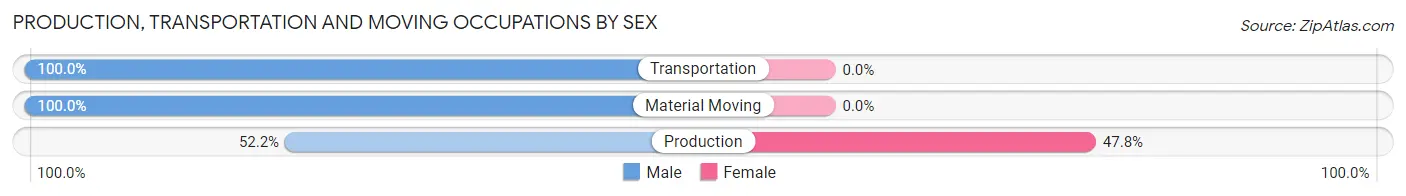
| Occupation | Male | Female |
| Production | 82 (52.2%) | 75 (47.8%) |
| Transportation | 19 (100.0%) | 0 (0.0%) |
| Material Moving | 16 (100.0%) | 0 (0.0%) |
| Total (Category) | 117 (60.9%) | 75 (39.1%) |
| Total (Overall) | 285 (48.4%) | 304 (51.6%) |
Employment Industries by Sex in Geronimo
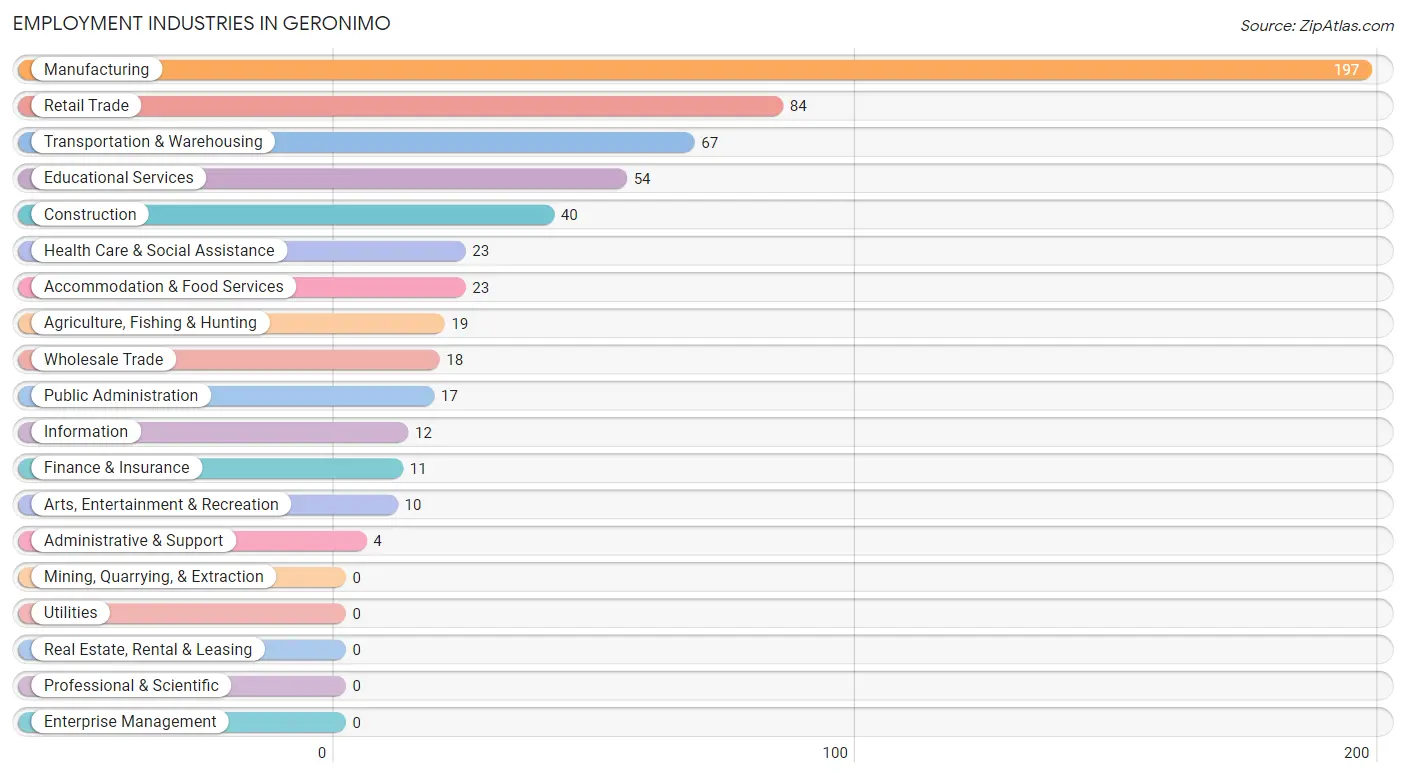
Employment Industries in Geronimo
The major employment industries in Geronimo include Manufacturing (197 | 33.5%), Retail Trade (84 | 14.3%), Transportation & Warehousing (67 | 11.4%), Educational Services (54 | 9.2%), and Construction (40 | 6.8%).
Employment Industries by Sex in Geronimo
The Geronimo industries that see more men than women are Construction (100.0%), Wholesale Trade (100.0%), and Arts, Entertainment & Recreation (100.0%), whereas the industries that tend to have a higher number of women are Transportation & Warehousing (100.0%), Information (100.0%), and Finance & Insurance (100.0%).
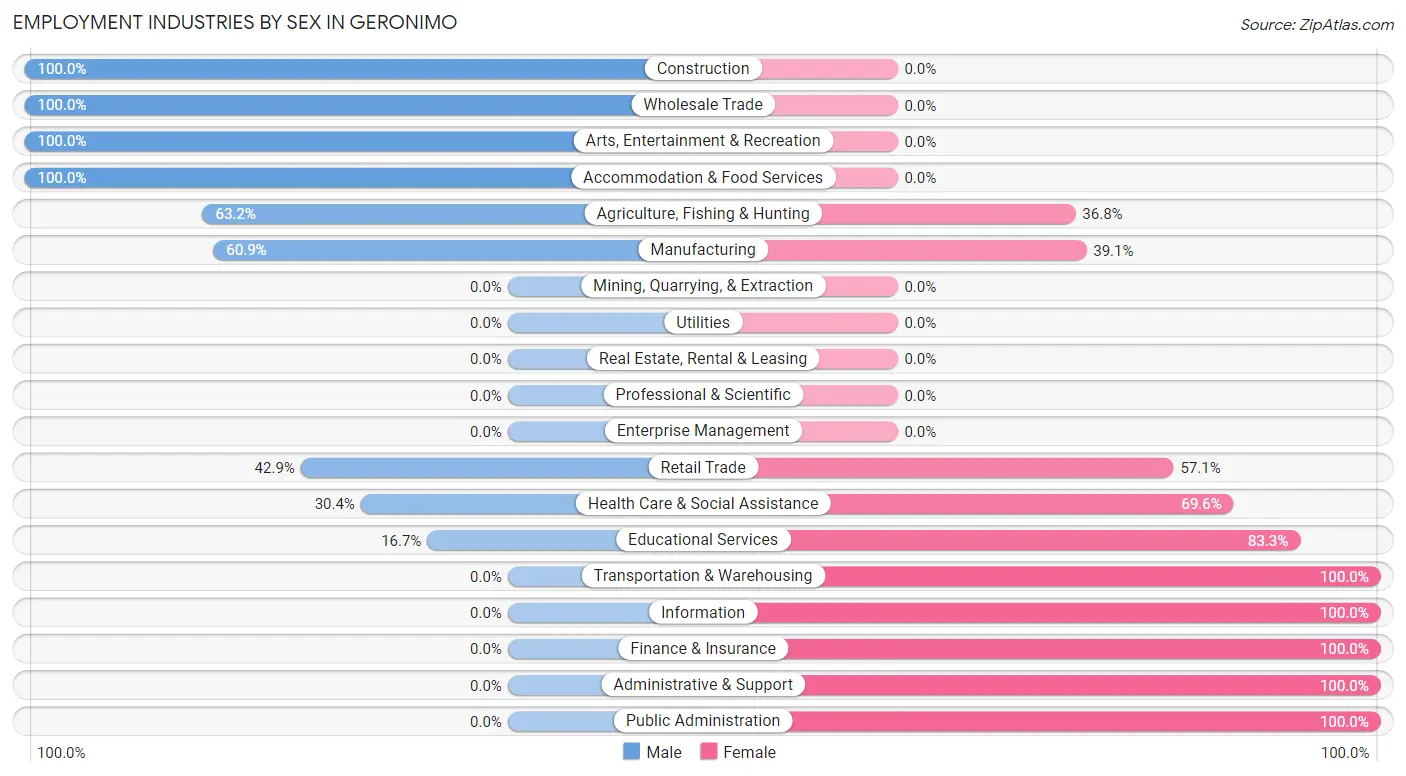
| Industry | Male | Female |
| Agriculture, Fishing & Hunting | 12 (63.2%) | 7 (36.8%) |
| Mining, Quarrying, & Extraction | 0 (0.0%) | 0 (0.0%) |
| Construction | 40 (100.0%) | 0 (0.0%) |
| Manufacturing | 120 (60.9%) | 77 (39.1%) |
| Wholesale Trade | 18 (100.0%) | 0 (0.0%) |
| Retail Trade | 36 (42.9%) | 48 (57.1%) |
| Transportation & Warehousing | 0 (0.0%) | 67 (100.0%) |
| Utilities | 0 (0.0%) | 0 (0.0%) |
| Information | 0 (0.0%) | 12 (100.0%) |
| Finance & Insurance | 0 (0.0%) | 11 (100.0%) |
| Real Estate, Rental & Leasing | 0 (0.0%) | 0 (0.0%) |
| Professional & Scientific | 0 (0.0%) | 0 (0.0%) |
| Enterprise Management | 0 (0.0%) | 0 (0.0%) |
| Administrative & Support | 0 (0.0%) | 4 (100.0%) |
| Educational Services | 9 (16.7%) | 45 (83.3%) |
| Health Care & Social Assistance | 7 (30.4%) | 16 (69.6%) |
| Arts, Entertainment & Recreation | 10 (100.0%) | 0 (0.0%) |
| Accommodation & Food Services | 23 (100.0%) | 0 (0.0%) |
| Public Administration | 0 (0.0%) | 17 (100.0%) |
| Total | 285 (48.4%) | 304 (51.6%) |
Education in Geronimo
School Enrollment in Geronimo
The most common levels of schooling among the 325 students in Geronimo are high school (155 | 47.7%), middle school (66 | 20.3%), and nursery / preschool (28 | 8.6%).
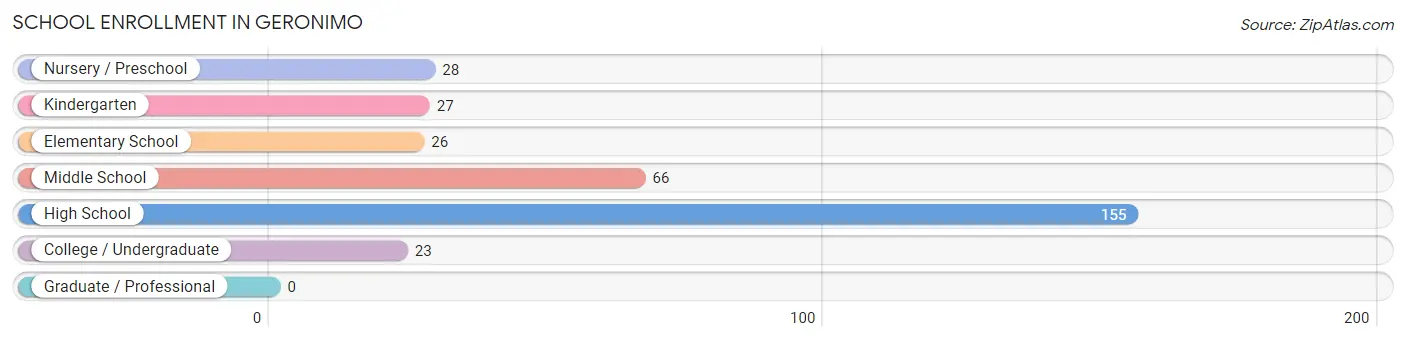
| School Level | # Students | % Students |
| Nursery / Preschool | 28 | 8.6% |
| Kindergarten | 27 | 8.3% |
| Elementary School | 26 | 8.0% |
| Middle School | 66 | 20.3% |
| High School | 155 | 47.7% |
| College / Undergraduate | 23 | 7.1% |
| Graduate / Professional | 0 | 0.0% |
| Total | 325 | 100.0% |
School Enrollment by Age by Funding Source in Geronimo
Out of a total of 325 students who are enrolled in schools in Geronimo, 8 (2.5%) attend a private institution, while the remaining 317 (97.5%) are enrolled in public schools. The age group of 35 years and over has the highest likelihood of being enrolled in private schools, with 8 (100.0% in the age bracket) enrolled. Conversely, the age group of 3 to 4 year olds has the lowest likelihood of being enrolled in a private school, with 17 (100.0% in the age bracket) attending a public institution.
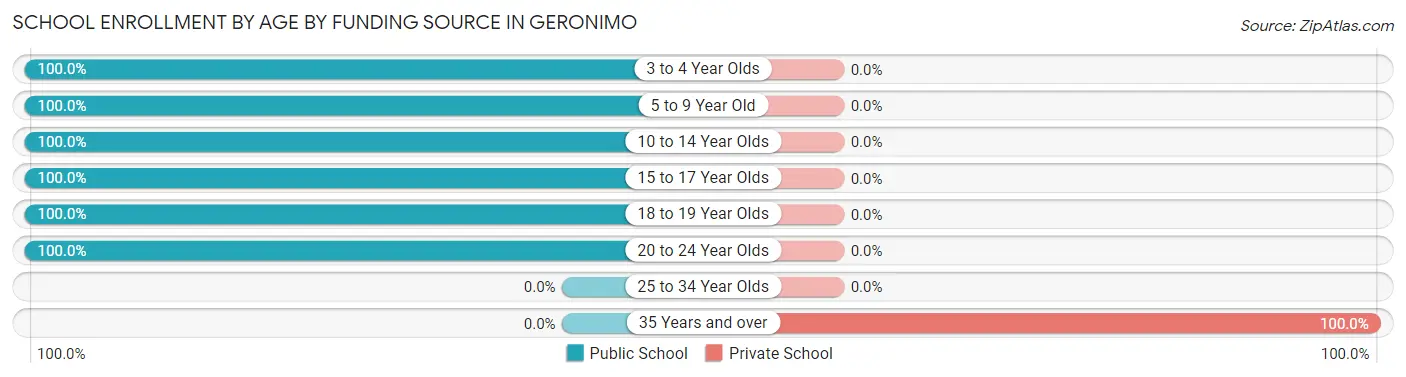
| Age Bracket | Public School | Private School |
| 3 to 4 Year Olds | 17 (100.0%) | 0 (0.0%) |
| 5 to 9 Year Old | 52 (100.0%) | 0 (0.0%) |
| 10 to 14 Year Olds | 78 (100.0%) | 0 (0.0%) |
| 15 to 17 Year Olds | 140 (100.0%) | 0 (0.0%) |
| 18 to 19 Year Olds | 15 (100.0%) | 0 (0.0%) |
| 20 to 24 Year Olds | 15 (100.0%) | 0 (0.0%) |
| 25 to 34 Year Olds | 0 (0.0%) | 0 (0.0%) |
| 35 Years and over | 0 (0.0%) | 8 (100.0%) |
| Total | 317 (97.5%) | 8 (2.5%) |
Educational Attainment by Field of Study in Geronimo
Arts & humanities (33 | 28.4%), bio, nature & agricultural (19 | 16.4%), psychology (18 | 15.5%), visual & performing arts (14 | 12.1%), and education (11 | 9.5%) are the most common fields of study among 116 individuals in Geronimo who have obtained a bachelor's degree or higher.
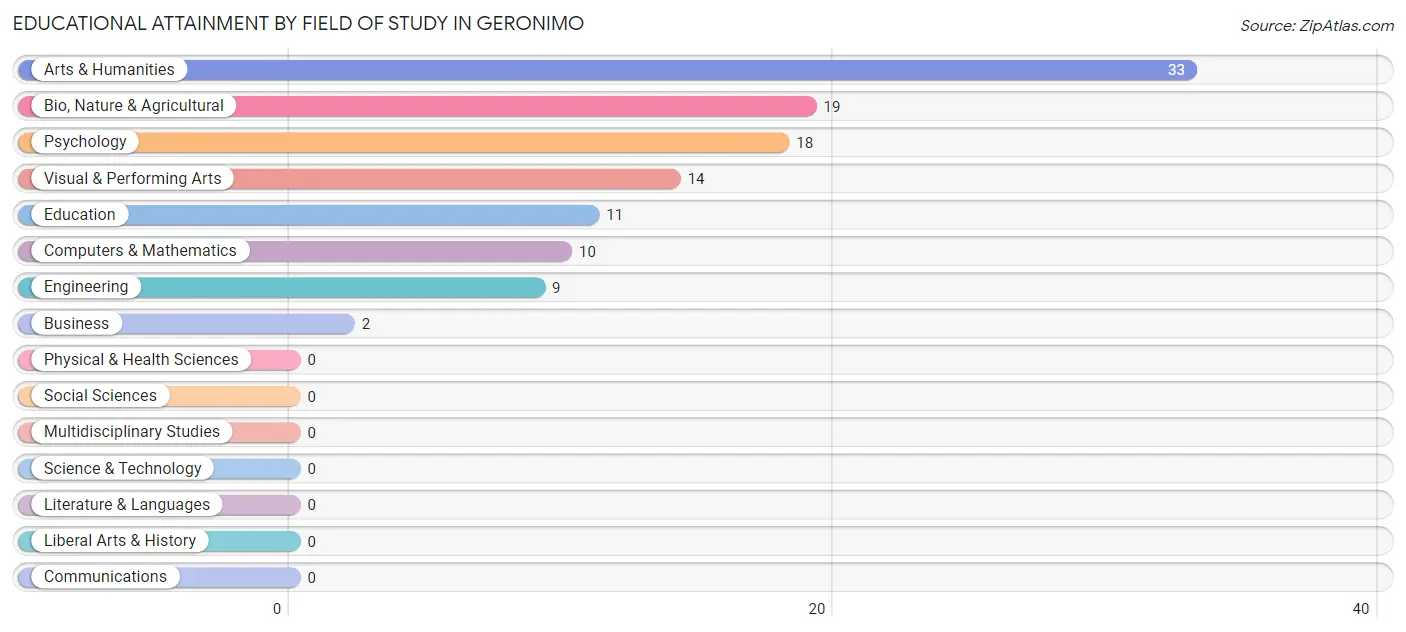
| Field of Study | # Graduates | % Graduates |
| Computers & Mathematics | 10 | 8.6% |
| Bio, Nature & Agricultural | 19 | 16.4% |
| Physical & Health Sciences | 0 | 0.0% |
| Psychology | 18 | 15.5% |
| Social Sciences | 0 | 0.0% |
| Engineering | 9 | 7.8% |
| Multidisciplinary Studies | 0 | 0.0% |
| Science & Technology | 0 | 0.0% |
| Business | 2 | 1.7% |
| Education | 11 | 9.5% |
| Literature & Languages | 0 | 0.0% |
| Liberal Arts & History | 0 | 0.0% |
| Visual & Performing Arts | 14 | 12.1% |
| Communications | 0 | 0.0% |
| Arts & Humanities | 33 | 28.4% |
| Total | 116 | 100.0% |
Transportation & Commute in Geronimo
Vehicle Availability by Sex in Geronimo
The most prevalent vehicle ownership categories in Geronimo are males with 3 vehicles (133, accounting for 46.7%) and females with 3 vehicles (145, making up 43.8%).
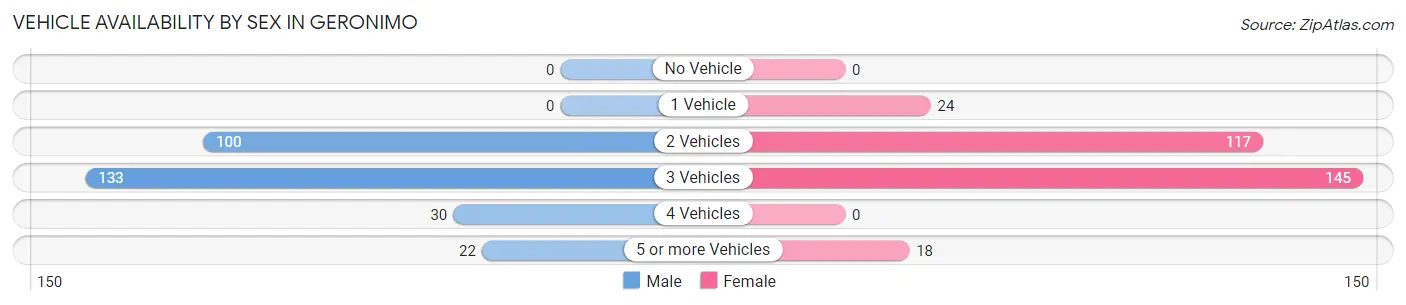
| Vehicles Available | Male | Female |
| No Vehicle | 0 (0.0%) | 0 (0.0%) |
| 1 Vehicle | 0 (0.0%) | 24 (7.9%) |
| 2 Vehicles | 100 (35.1%) | 117 (38.5%) |
| 3 Vehicles | 133 (46.7%) | 145 (47.7%) |
| 4 Vehicles | 30 (10.5%) | 0 (0.0%) |
| 5 or more Vehicles | 22 (7.7%) | 18 (5.9%) |
| Total | 285 (100.0%) | 304 (100.0%) |
Commute Time in Geronimo
The most frequently occuring commute durations in Geronimo are 20 to 24 minutes (202 commuters, 36.8%), 15 to 19 minutes (117 commuters, 21.3%), and 25 to 29 minutes (44 commuters, 8.0%).
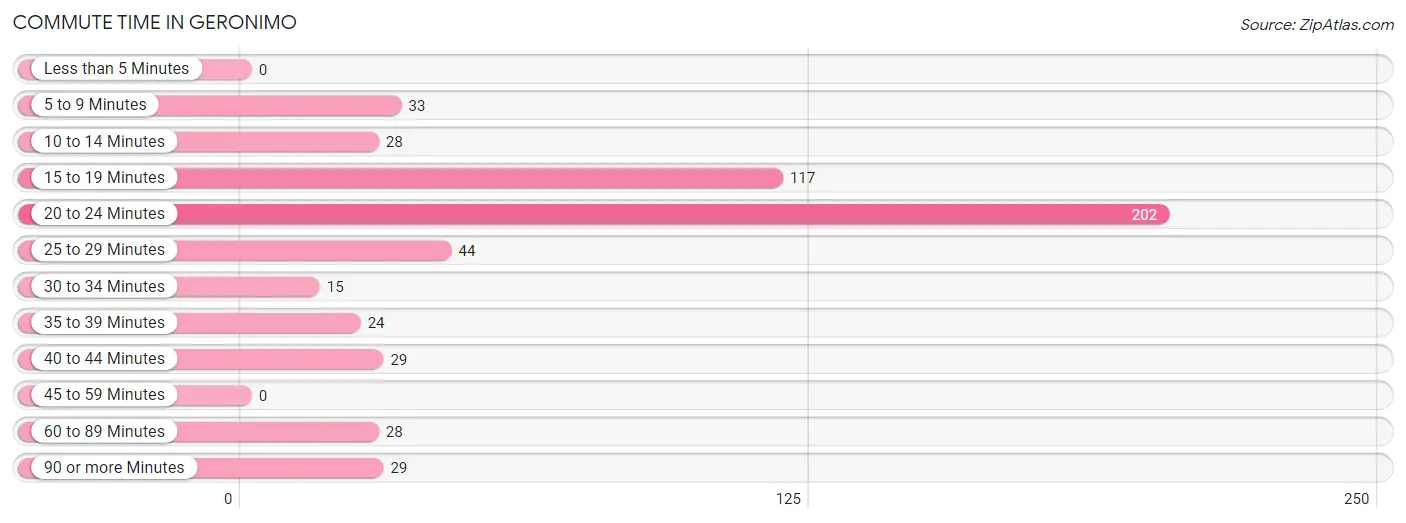
| Commute Time | # Commuters | % Commuters |
| Less than 5 Minutes | 0 | 0.0% |
| 5 to 9 Minutes | 33 | 6.0% |
| 10 to 14 Minutes | 28 | 5.1% |
| 15 to 19 Minutes | 117 | 21.3% |
| 20 to 24 Minutes | 202 | 36.8% |
| 25 to 29 Minutes | 44 | 8.0% |
| 30 to 34 Minutes | 15 | 2.7% |
| 35 to 39 Minutes | 24 | 4.4% |
| 40 to 44 Minutes | 29 | 5.3% |
| 45 to 59 Minutes | 0 | 0.0% |
| 60 to 89 Minutes | 28 | 5.1% |
| 90 or more Minutes | 29 | 5.3% |
Commute Time by Sex in Geronimo
The most common commute times in Geronimo are 20 to 24 minutes (99 commuters, 34.7%) for males and 20 to 24 minutes (103 commuters, 39.0%) for females.
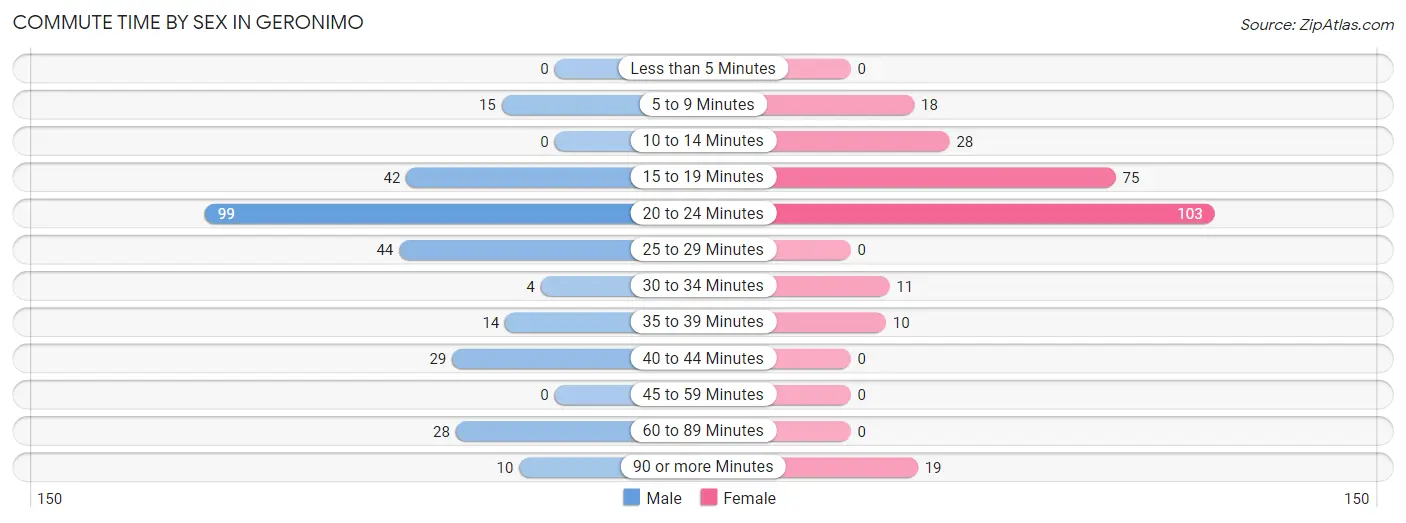
| Commute Time | Male | Female |
| Less than 5 Minutes | 0 (0.0%) | 0 (0.0%) |
| 5 to 9 Minutes | 15 (5.3%) | 18 (6.8%) |
| 10 to 14 Minutes | 0 (0.0%) | 28 (10.6%) |
| 15 to 19 Minutes | 42 (14.7%) | 75 (28.4%) |
| 20 to 24 Minutes | 99 (34.7%) | 103 (39.0%) |
| 25 to 29 Minutes | 44 (15.4%) | 0 (0.0%) |
| 30 to 34 Minutes | 4 (1.4%) | 11 (4.2%) |
| 35 to 39 Minutes | 14 (4.9%) | 10 (3.8%) |
| 40 to 44 Minutes | 29 (10.2%) | 0 (0.0%) |
| 45 to 59 Minutes | 0 (0.0%) | 0 (0.0%) |
| 60 to 89 Minutes | 28 (9.8%) | 0 (0.0%) |
| 90 or more Minutes | 10 (3.5%) | 19 (7.2%) |
Time of Departure to Work by Sex in Geronimo
The most frequent times of departure to work in Geronimo are 6:30 AM to 6:59 AM (97, 34.0%) for males and 7:00 AM to 7:29 AM (121, 45.8%) for females.
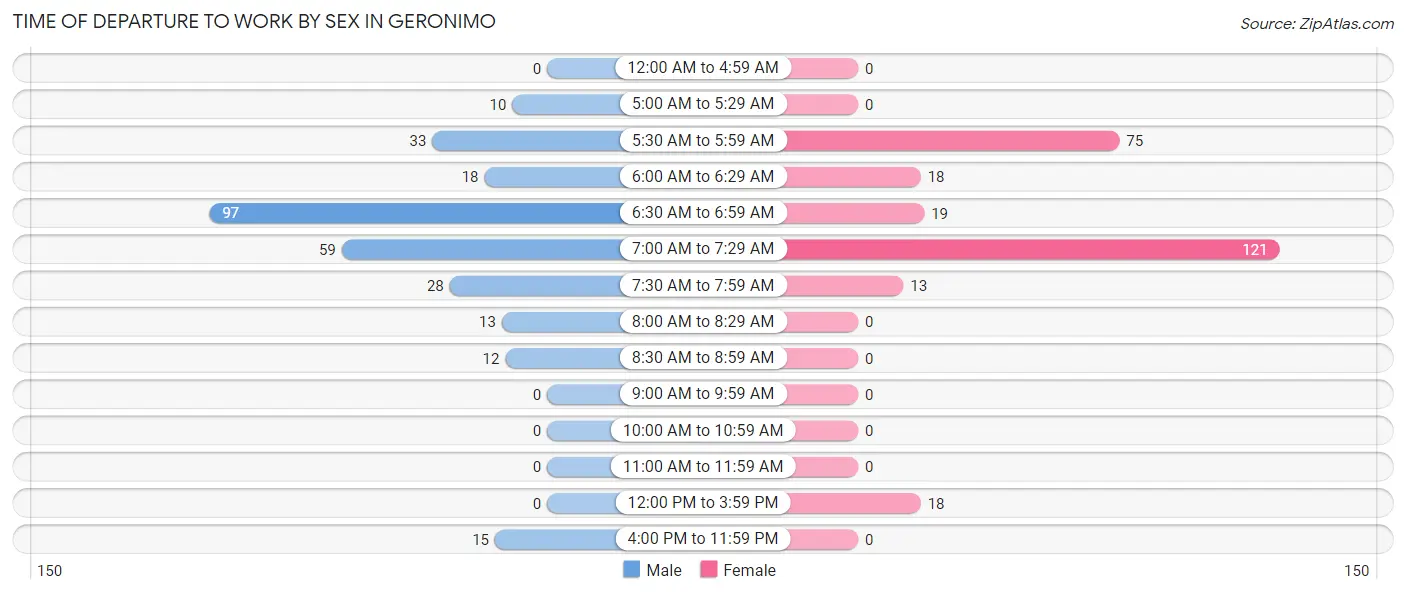
| Time of Departure | Male | Female |
| 12:00 AM to 4:59 AM | 0 (0.0%) | 0 (0.0%) |
| 5:00 AM to 5:29 AM | 10 (3.5%) | 0 (0.0%) |
| 5:30 AM to 5:59 AM | 33 (11.6%) | 75 (28.4%) |
| 6:00 AM to 6:29 AM | 18 (6.3%) | 18 (6.8%) |
| 6:30 AM to 6:59 AM | 97 (34.0%) | 19 (7.2%) |
| 7:00 AM to 7:29 AM | 59 (20.7%) | 121 (45.8%) |
| 7:30 AM to 7:59 AM | 28 (9.8%) | 13 (4.9%) |
| 8:00 AM to 8:29 AM | 13 (4.6%) | 0 (0.0%) |
| 8:30 AM to 8:59 AM | 12 (4.2%) | 0 (0.0%) |
| 9:00 AM to 9:59 AM | 0 (0.0%) | 0 (0.0%) |
| 10:00 AM to 10:59 AM | 0 (0.0%) | 0 (0.0%) |
| 11:00 AM to 11:59 AM | 0 (0.0%) | 0 (0.0%) |
| 12:00 PM to 3:59 PM | 0 (0.0%) | 18 (6.8%) |
| 4:00 PM to 11:59 PM | 15 (5.3%) | 0 (0.0%) |
| Total | 285 (100.0%) | 264 (100.0%) |
Housing Occupancy in Geronimo
Occupancy by Ownership in Geronimo
Of the total 286 dwellings in Geronimo, owner-occupied units account for 207 (72.4%), while renter-occupied units make up 79 (27.6%).
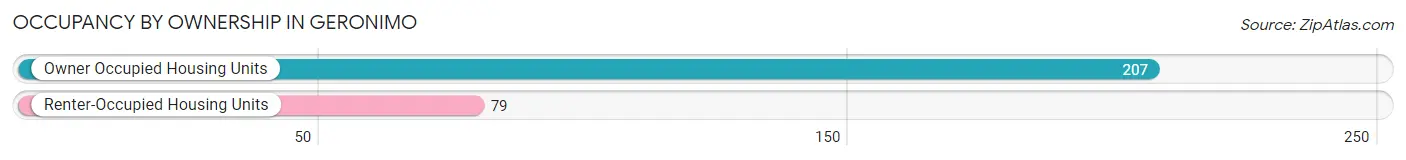
| Occupancy | # Housing Units | % Housing Units |
| Owner Occupied Housing Units | 207 | 72.4% |
| Renter-Occupied Housing Units | 79 | 27.6% |
| Total Occupied Housing Units | 286 | 100.0% |
Occupancy by Household Size in Geronimo
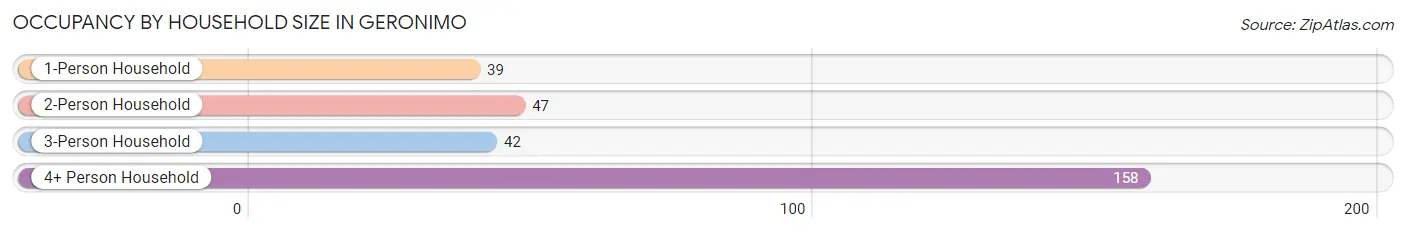
| Household Size | # Housing Units | % Housing Units |
| 1-Person Household | 39 | 13.6% |
| 2-Person Household | 47 | 16.4% |
| 3-Person Household | 42 | 14.7% |
| 4+ Person Household | 158 | 55.2% |
| Total Housing Units | 286 | 100.0% |
Occupancy by Ownership by Household Size in Geronimo
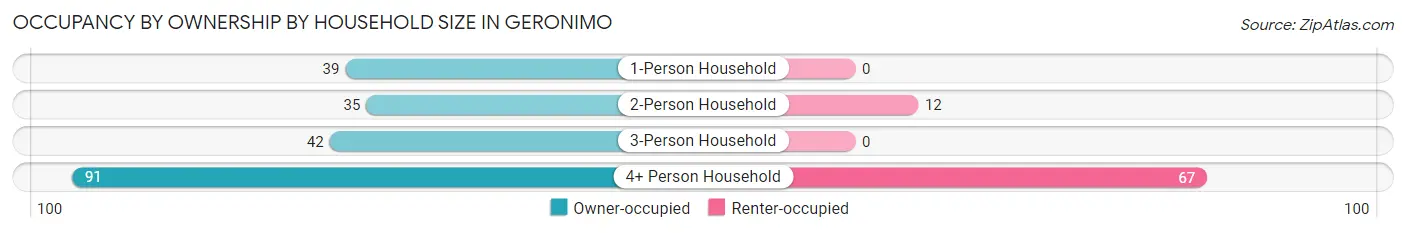
| Household Size | Owner-occupied | Renter-occupied |
| 1-Person Household | 39 (100.0%) | 0 (0.0%) |
| 2-Person Household | 35 (74.5%) | 12 (25.5%) |
| 3-Person Household | 42 (100.0%) | 0 (0.0%) |
| 4+ Person Household | 91 (57.6%) | 67 (42.4%) |
| Total Housing Units | 207 (72.4%) | 79 (27.6%) |
Occupancy by Educational Attainment in Geronimo
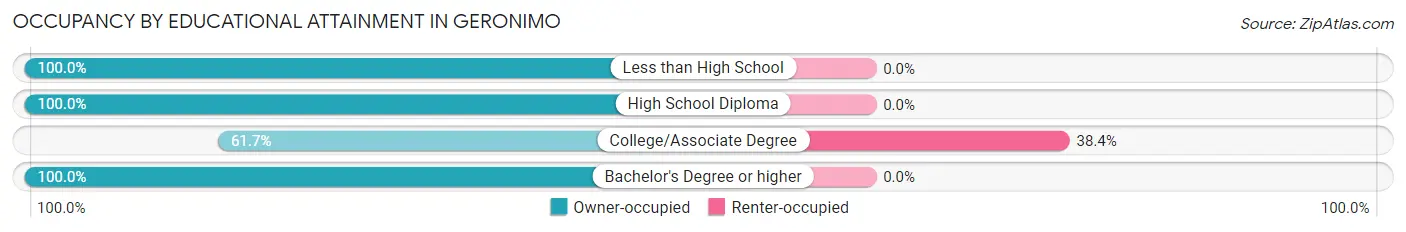
| Household Size | Owner-occupied | Renter-occupied |
| Less than High School | 10 (100.0%) | 0 (0.0%) |
| High School Diploma | 14 (100.0%) | 0 (0.0%) |
| College/Associate Degree | 127 (61.7%) | 79 (38.4%) |
| Bachelor's Degree or higher | 56 (100.0%) | 0 (0.0%) |
Occupancy by Age of Householder in Geronimo
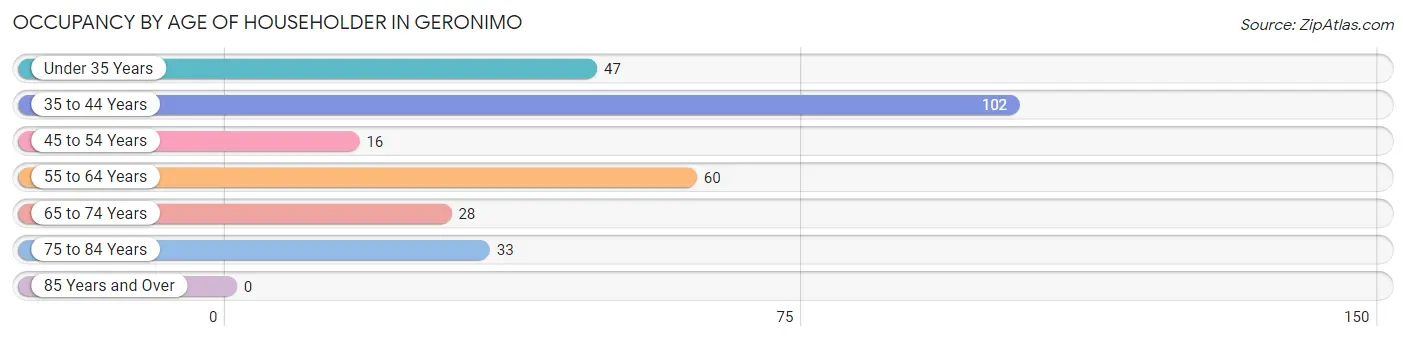
| Age Bracket | # Households | % Households |
| Under 35 Years | 47 | 16.4% |
| 35 to 44 Years | 102 | 35.7% |
| 45 to 54 Years | 16 | 5.6% |
| 55 to 64 Years | 60 | 21.0% |
| 65 to 74 Years | 28 | 9.8% |
| 75 to 84 Years | 33 | 11.5% |
| 85 Years and Over | 0 | 0.0% |
| Total | 286 | 100.0% |
Housing Finances in Geronimo
Median Income by Occupancy in Geronimo
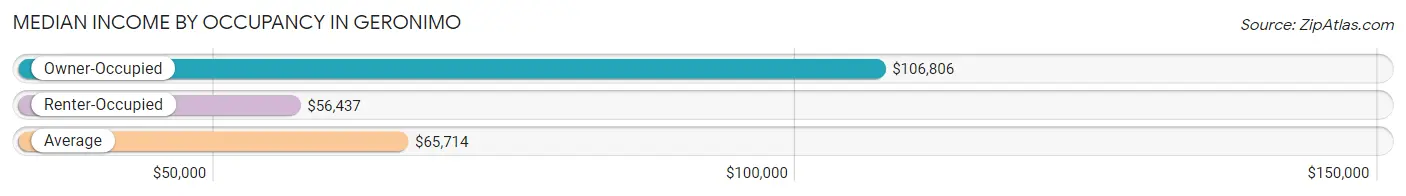
| Occupancy Type | # Households | Median Income |
| Owner-Occupied | 207 (72.4%) | $106,806 |
| Renter-Occupied | 79 (27.6%) | $56,437 |
| Average | 286 (100.0%) | $65,714 |
Occupancy by Householder Income Bracket in Geronimo
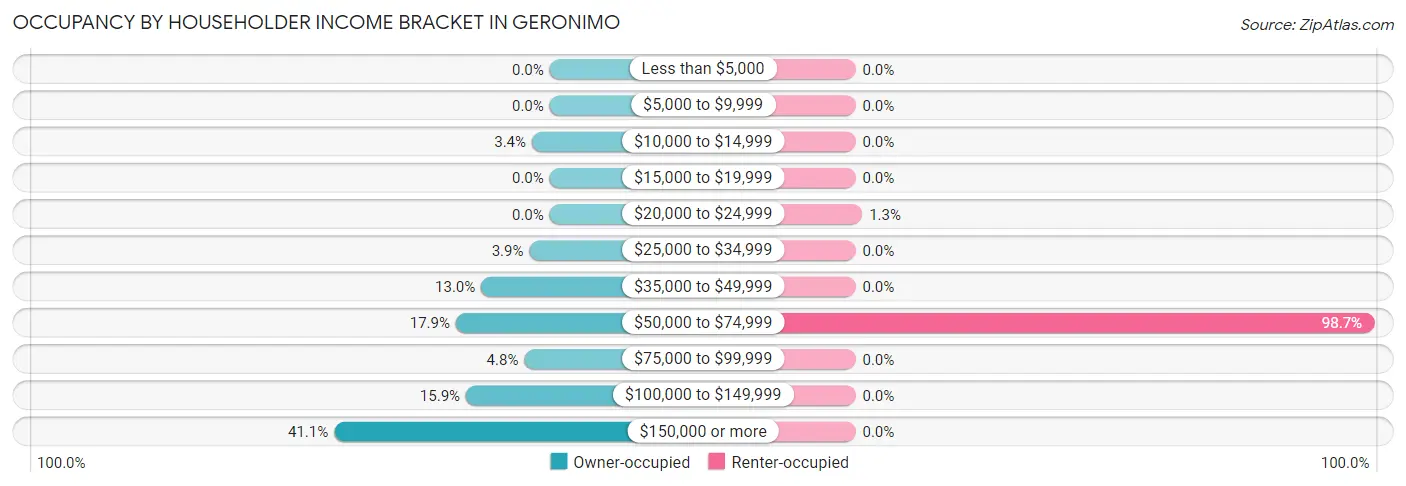
| Income Bracket | Owner-occupied | Renter-occupied |
| Less than $5,000 | 0 (0.0%) | 0 (0.0%) |
| $5,000 to $9,999 | 0 (0.0%) | 0 (0.0%) |
| $10,000 to $14,999 | 7 (3.4%) | 0 (0.0%) |
| $15,000 to $19,999 | 0 (0.0%) | 0 (0.0%) |
| $20,000 to $24,999 | 0 (0.0%) | 1 (1.3%) |
| $25,000 to $34,999 | 8 (3.9%) | 0 (0.0%) |
| $35,000 to $49,999 | 27 (13.0%) | 0 (0.0%) |
| $50,000 to $74,999 | 37 (17.9%) | 78 (98.7%) |
| $75,000 to $99,999 | 10 (4.8%) | 0 (0.0%) |
| $100,000 to $149,999 | 33 (15.9%) | 0 (0.0%) |
| $150,000 or more | 85 (41.1%) | 0 (0.0%) |
| Total | 207 (100.0%) | 79 (100.0%) |
Monthly Housing Cost Tiers in Geronimo
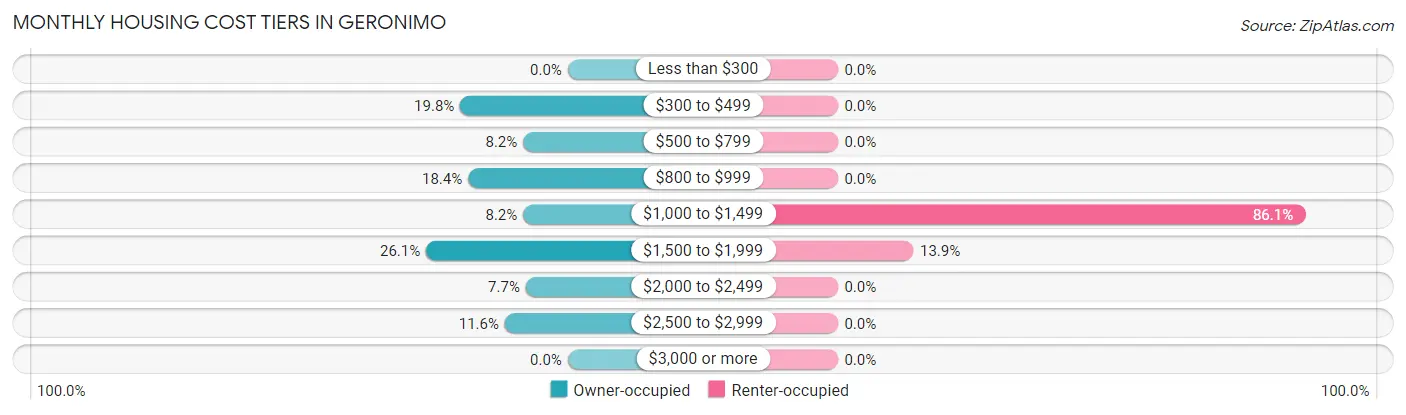
| Monthly Cost | Owner-occupied | Renter-occupied |
| Less than $300 | 0 (0.0%) | 0 (0.0%) |
| $300 to $499 | 41 (19.8%) | 0 (0.0%) |
| $500 to $799 | 17 (8.2%) | 0 (0.0%) |
| $800 to $999 | 38 (18.4%) | 0 (0.0%) |
| $1,000 to $1,499 | 17 (8.2%) | 68 (86.1%) |
| $1,500 to $1,999 | 54 (26.1%) | 11 (13.9%) |
| $2,000 to $2,499 | 16 (7.7%) | 0 (0.0%) |
| $2,500 to $2,999 | 24 (11.6%) | 0 (0.0%) |
| $3,000 or more | 0 (0.0%) | 0 (0.0%) |
| Total | 207 (100.0%) | 79 (100.0%) |
Physical Housing Characteristics in Geronimo
Housing Structures in Geronimo
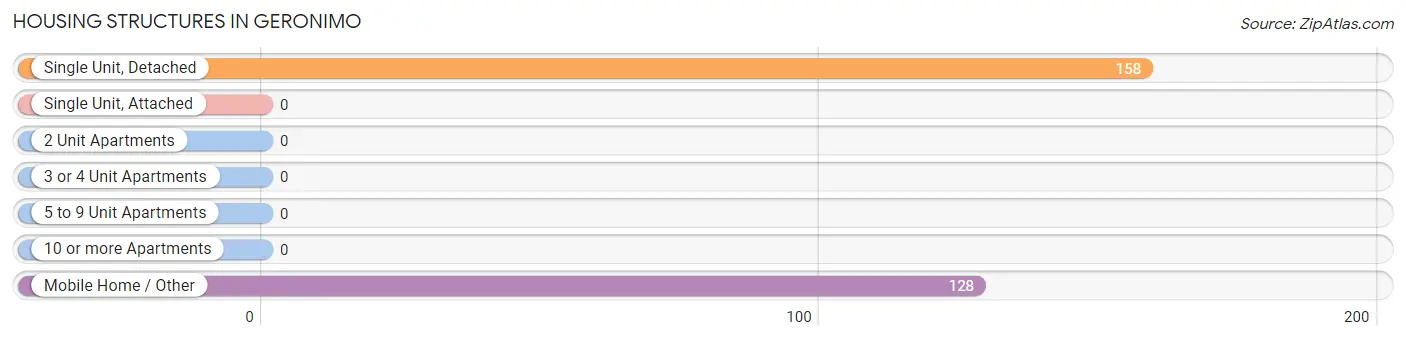
| Structure Type | # Housing Units | % Housing Units |
| Single Unit, Detached | 158 | 55.2% |
| Single Unit, Attached | 0 | 0.0% |
| 2 Unit Apartments | 0 | 0.0% |
| 3 or 4 Unit Apartments | 0 | 0.0% |
| 5 to 9 Unit Apartments | 0 | 0.0% |
| 10 or more Apartments | 0 | 0.0% |
| Mobile Home / Other | 128 | 44.8% |
| Total | 286 | 100.0% |
Housing Structures by Occupancy in Geronimo
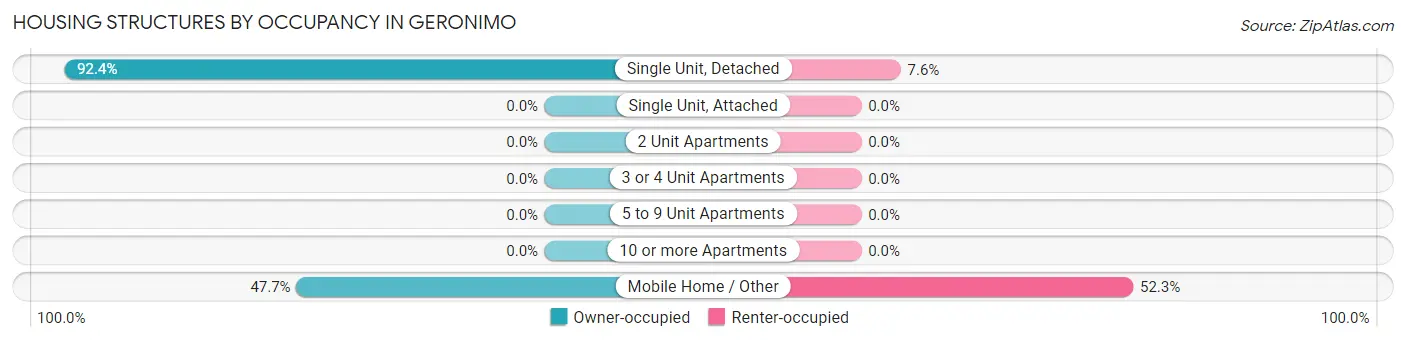
| Structure Type | Owner-occupied | Renter-occupied |
| Single Unit, Detached | 146 (92.4%) | 12 (7.6%) |
| Single Unit, Attached | 0 (0.0%) | 0 (0.0%) |
| 2 Unit Apartments | 0 (0.0%) | 0 (0.0%) |
| 3 or 4 Unit Apartments | 0 (0.0%) | 0 (0.0%) |
| 5 to 9 Unit Apartments | 0 (0.0%) | 0 (0.0%) |
| 10 or more Apartments | 0 (0.0%) | 0 (0.0%) |
| Mobile Home / Other | 61 (47.7%) | 67 (52.3%) |
| Total | 207 (72.4%) | 79 (27.6%) |
Housing Structures by Number of Rooms in Geronimo
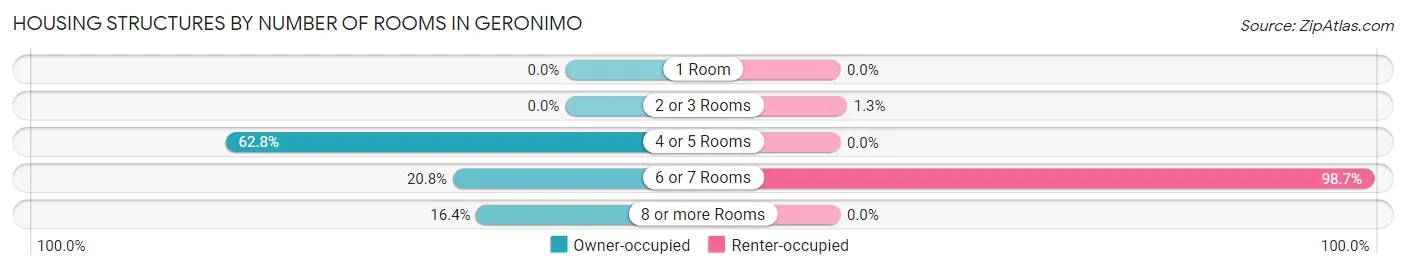
| Number of Rooms | Owner-occupied | Renter-occupied |
| 1 Room | 0 (0.0%) | 0 (0.0%) |
| 2 or 3 Rooms | 0 (0.0%) | 1 (1.3%) |
| 4 or 5 Rooms | 130 (62.8%) | 0 (0.0%) |
| 6 or 7 Rooms | 43 (20.8%) | 78 (98.7%) |
| 8 or more Rooms | 34 (16.4%) | 0 (0.0%) |
| Total | 207 (100.0%) | 79 (100.0%) |
Housing Structure by Heating Type in Geronimo
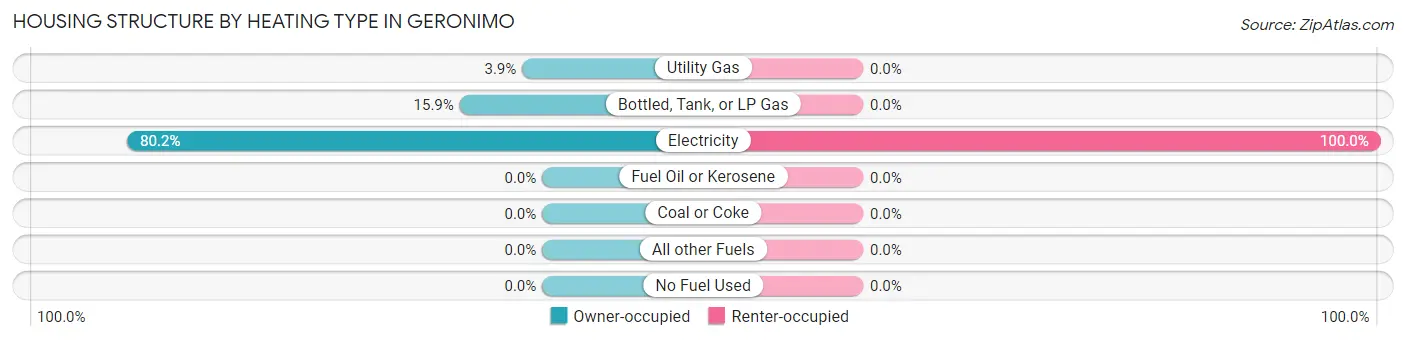
| Heating Type | Owner-occupied | Renter-occupied |
| Utility Gas | 8 (3.9%) | 0 (0.0%) |
| Bottled, Tank, or LP Gas | 33 (15.9%) | 0 (0.0%) |
| Electricity | 166 (80.2%) | 79 (100.0%) |
| Fuel Oil or Kerosene | 0 (0.0%) | 0 (0.0%) |
| Coal or Coke | 0 (0.0%) | 0 (0.0%) |
| All other Fuels | 0 (0.0%) | 0 (0.0%) |
| No Fuel Used | 0 (0.0%) | 0 (0.0%) |
| Total | 207 (100.0%) | 79 (100.0%) |
Household Vehicle Usage in Geronimo
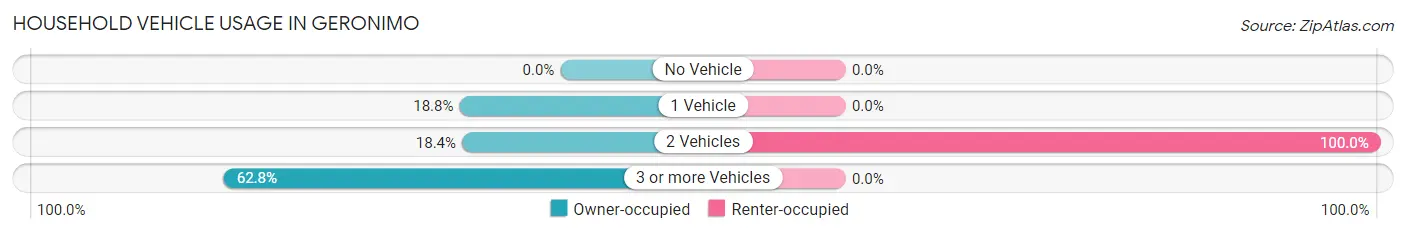
| Vehicles per Household | Owner-occupied | Renter-occupied |
| No Vehicle | 0 (0.0%) | 0 (0.0%) |
| 1 Vehicle | 39 (18.8%) | 0 (0.0%) |
| 2 Vehicles | 38 (18.4%) | 79 (100.0%) |
| 3 or more Vehicles | 130 (62.8%) | 0 (0.0%) |
| Total | 207 (100.0%) | 79 (100.0%) |
Real Estate & Mortgages in Geronimo
Real Estate and Mortgage Overview in Geronimo
| Characteristic | Without Mortgage | With Mortgage |
| Housing Units | 83 | 124 |
| Median Property Value | $281,300 | $228,800 |
| Median Household Income | - | - |
| Monthly Housing Costs | $805 | $0 |
| Real Estate Taxes | $3,263 | $0 |
Property Value by Mortgage Status in Geronimo
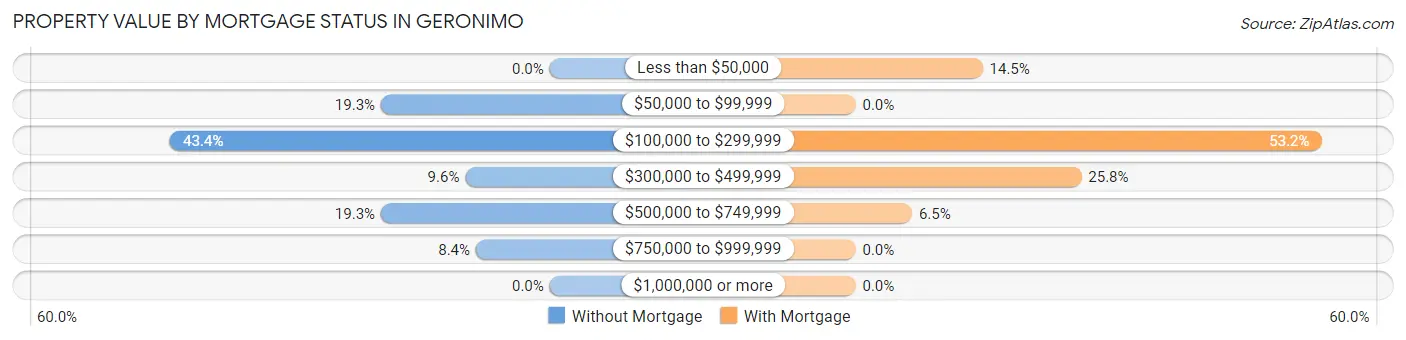
| Property Value | Without Mortgage | With Mortgage |
| Less than $50,000 | 0 (0.0%) | 18 (14.5%) |
| $50,000 to $99,999 | 16 (19.3%) | 0 (0.0%) |
| $100,000 to $299,999 | 36 (43.4%) | 66 (53.2%) |
| $300,000 to $499,999 | 8 (9.6%) | 32 (25.8%) |
| $500,000 to $749,999 | 16 (19.3%) | 8 (6.5%) |
| $750,000 to $999,999 | 7 (8.4%) | 0 (0.0%) |
| $1,000,000 or more | 0 (0.0%) | 0 (0.0%) |
| Total | 83 (100.0%) | 124 (100.0%) |
Household Income by Mortgage Status in Geronimo
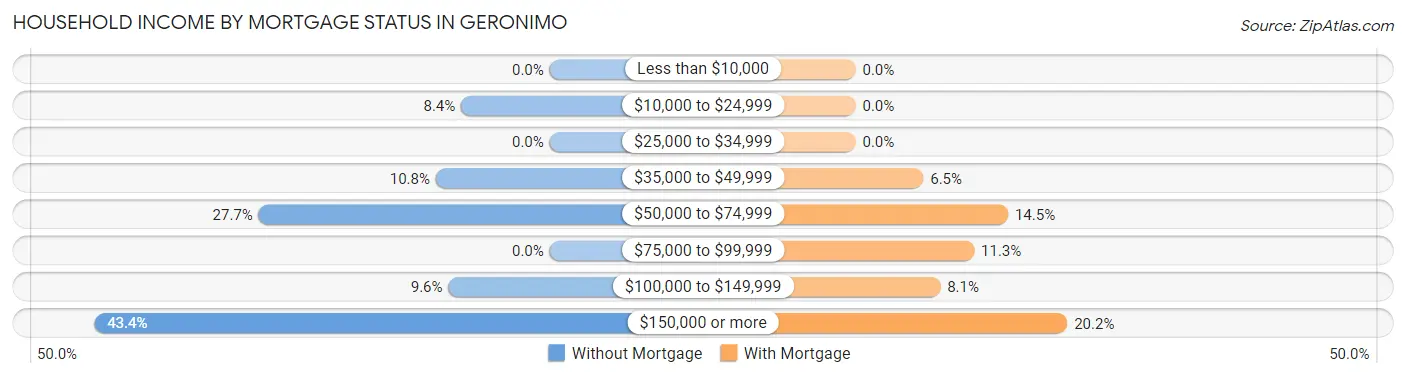
| Household Income | Without Mortgage | With Mortgage |
| Less than $10,000 | 0 (0.0%) | 0 (0.0%) |
| $10,000 to $24,999 | 7 (8.4%) | 0 (0.0%) |
| $25,000 to $34,999 | 0 (0.0%) | 0 (0.0%) |
| $35,000 to $49,999 | 9 (10.8%) | 8 (6.5%) |
| $50,000 to $74,999 | 23 (27.7%) | 18 (14.5%) |
| $75,000 to $99,999 | 0 (0.0%) | 14 (11.3%) |
| $100,000 to $149,999 | 8 (9.6%) | 10 (8.1%) |
| $150,000 or more | 36 (43.4%) | 25 (20.2%) |
| Total | 83 (100.0%) | 124 (100.0%) |
Property Value to Household Income Ratio in Geronimo
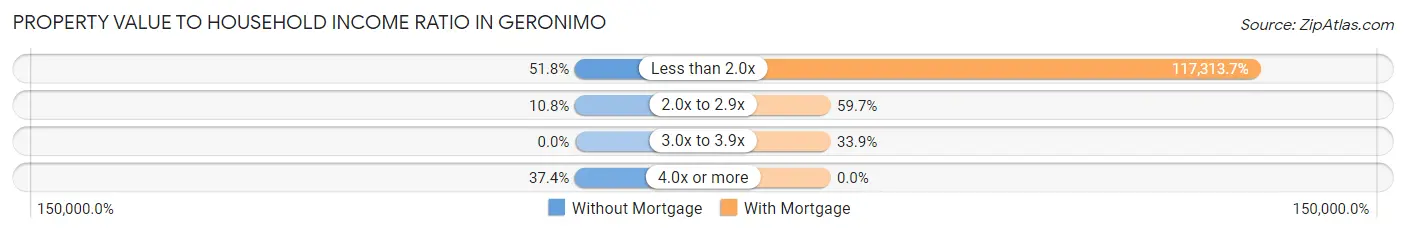
| Value-to-Income Ratio | Without Mortgage | With Mortgage |
| Less than 2.0x | 43 (51.8%) | 145,469 (117,313.7%) |
| 2.0x to 2.9x | 9 (10.8%) | 74 (59.7%) |
| 3.0x to 3.9x | 0 (0.0%) | 42 (33.9%) |
| 4.0x or more | 31 (37.3%) | 0 (0.0%) |
| Total | 83 (100.0%) | 124 (100.0%) |
Real Estate Taxes by Mortgage Status in Geronimo
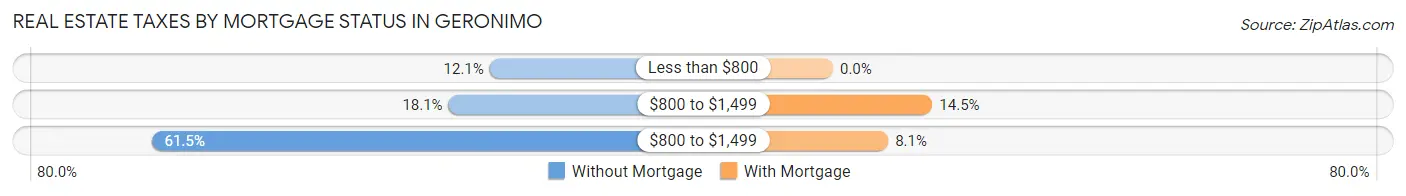
| Property Taxes | Without Mortgage | With Mortgage |
| Less than $800 | 10 (12.0%) | 0 (0.0%) |
| $800 to $1,499 | 15 (18.1%) | 18 (14.5%) |
| $800 to $1,499 | 51 (61.5%) | 10 (8.1%) |
| Total | 83 (100.0%) | 124 (100.0%) |
Health & Disability in Geronimo
Health Insurance Coverage by Age in Geronimo
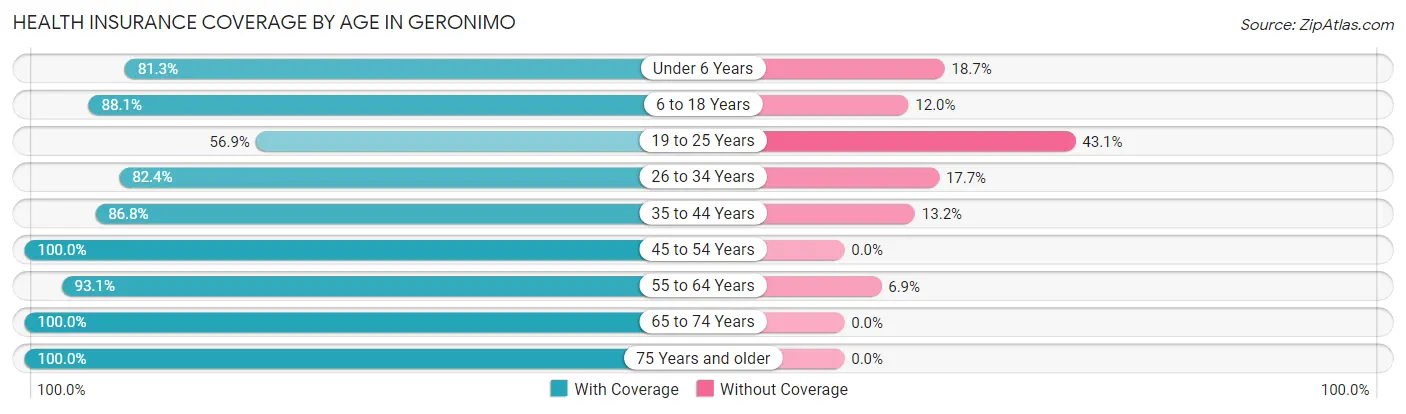
| Age Bracket | With Coverage | Without Coverage |
| Under 6 Years | 87 (81.3%) | 20 (18.7%) |
| 6 to 18 Years | 221 (88.0%) | 30 (11.9%) |
| 19 to 25 Years | 103 (56.9%) | 78 (43.1%) |
| 26 to 34 Years | 98 (82.4%) | 21 (17.6%) |
| 35 to 44 Years | 145 (86.8%) | 22 (13.2%) |
| 45 to 54 Years | 74 (100.0%) | 0 (0.0%) |
| 55 to 64 Years | 81 (93.1%) | 6 (6.9%) |
| 65 to 74 Years | 47 (100.0%) | 0 (0.0%) |
| 75 Years and older | 42 (100.0%) | 0 (0.0%) |
| Total | 898 (83.5%) | 177 (16.5%) |
Health Insurance Coverage by Citizenship Status in Geronimo
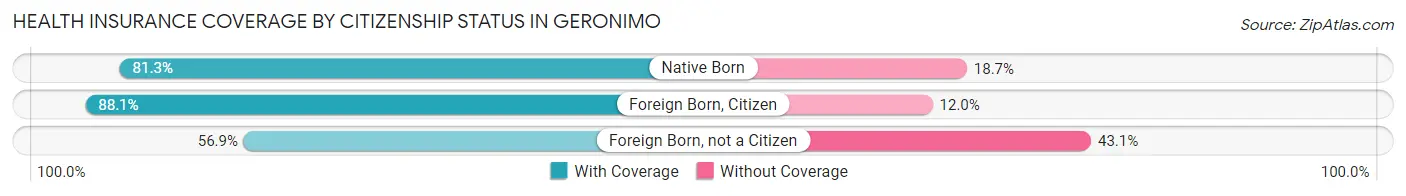
| Citizenship Status | With Coverage | Without Coverage |
| Native Born | 87 (81.3%) | 20 (18.7%) |
| Foreign Born, Citizen | 221 (88.0%) | 30 (11.9%) |
| Foreign Born, not a Citizen | 103 (56.9%) | 78 (43.1%) |
Health Insurance Coverage by Household Income in Geronimo
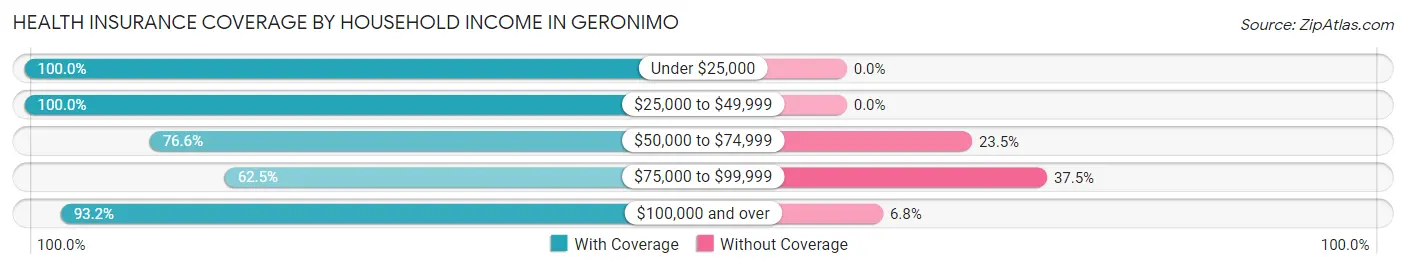
| Household Income | With Coverage | Without Coverage |
| Under $25,000 | 9 (100.0%) | 0 (0.0%) |
| $25,000 to $49,999 | 44 (100.0%) | 0 (0.0%) |
| $50,000 to $74,999 | 382 (76.5%) | 117 (23.4%) |
| $75,000 to $99,999 | 50 (62.5%) | 30 (37.5%) |
| $100,000 and over | 413 (93.2%) | 30 (6.8%) |
Public vs Private Health Insurance Coverage by Age in Geronimo
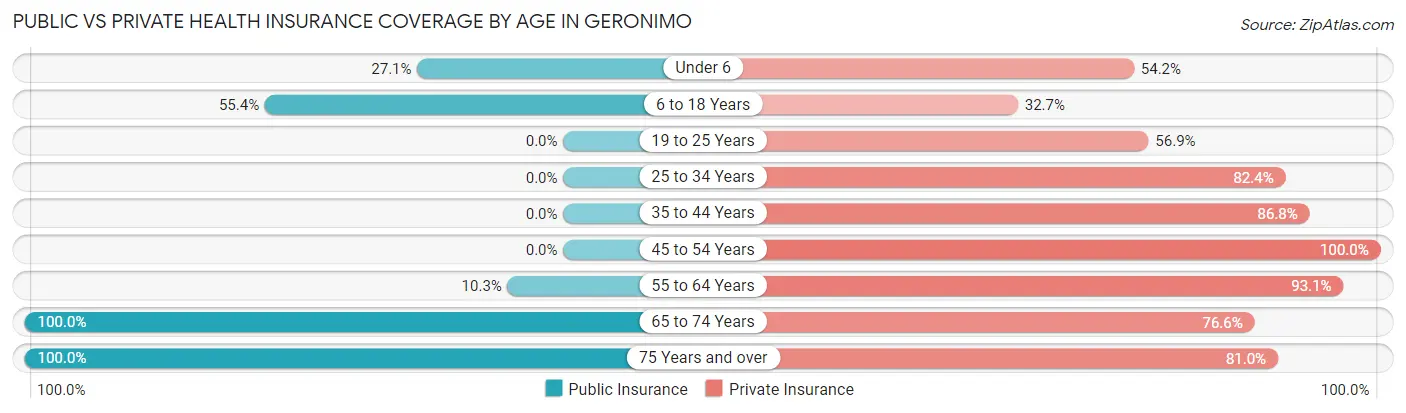
| Age Bracket | Public Insurance | Private Insurance |
| Under 6 | 29 (27.1%) | 58 (54.2%) |
| 6 to 18 Years | 139 (55.4%) | 82 (32.7%) |
| 19 to 25 Years | 0 (0.0%) | 103 (56.9%) |
| 25 to 34 Years | 0 (0.0%) | 98 (82.4%) |
| 35 to 44 Years | 0 (0.0%) | 145 (86.8%) |
| 45 to 54 Years | 0 (0.0%) | 74 (100.0%) |
| 55 to 64 Years | 9 (10.3%) | 81 (93.1%) |
| 65 to 74 Years | 47 (100.0%) | 36 (76.6%) |
| 75 Years and over | 42 (100.0%) | 34 (80.9%) |
| Total | 266 (24.7%) | 711 (66.1%) |
Disability Status by Sex by Age in Geronimo
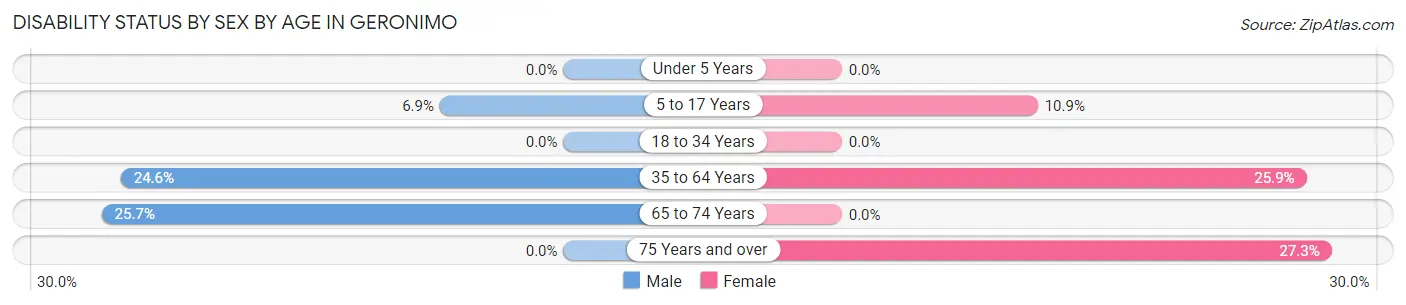
| Age Bracket | Male | Female |
| Under 5 Years | 0 (0.0%) | 0 (0.0%) |
| 5 to 17 Years | 11 (6.9%) | 12 (10.9%) |
| 18 to 34 Years | 0 (0.0%) | 0 (0.0%) |
| 35 to 64 Years | 17 (24.6%) | 67 (25.9%) |
| 65 to 74 Years | 9 (25.7%) | 0 (0.0%) |
| 75 Years and over | 0 (0.0%) | 9 (27.3%) |
Disability Class by Sex by Age in Geronimo
Disability Class: Hearing Difficulty
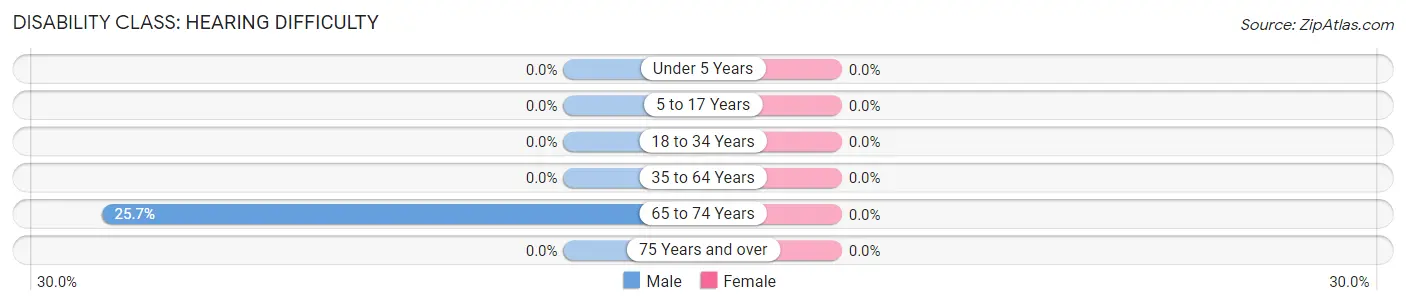
| Age Bracket | Male | Female |
| Under 5 Years | 0 (0.0%) | 0 (0.0%) |
| 5 to 17 Years | 0 (0.0%) | 0 (0.0%) |
| 18 to 34 Years | 0 (0.0%) | 0 (0.0%) |
| 35 to 64 Years | 0 (0.0%) | 0 (0.0%) |
| 65 to 74 Years | 9 (25.7%) | 0 (0.0%) |
| 75 Years and over | 0 (0.0%) | 0 (0.0%) |
Disability Class: Vision Difficulty
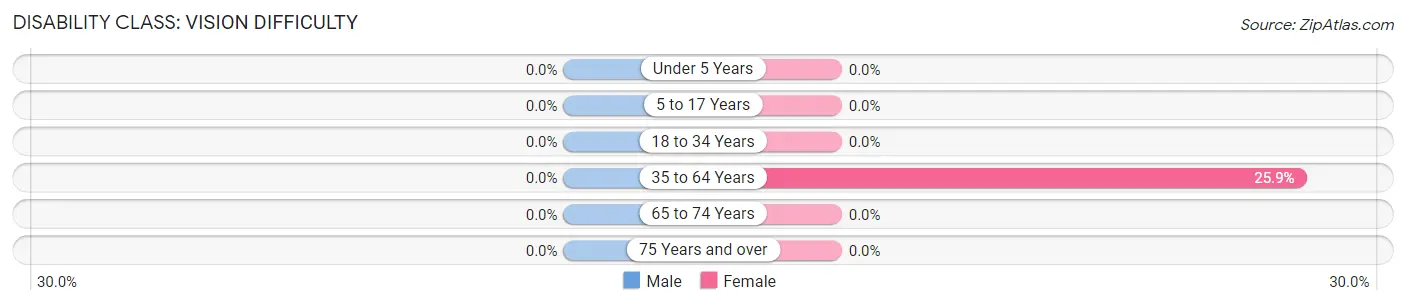
| Age Bracket | Male | Female |
| Under 5 Years | 0 (0.0%) | 0 (0.0%) |
| 5 to 17 Years | 0 (0.0%) | 0 (0.0%) |
| 18 to 34 Years | 0 (0.0%) | 0 (0.0%) |
| 35 to 64 Years | 0 (0.0%) | 67 (25.9%) |
| 65 to 74 Years | 0 (0.0%) | 0 (0.0%) |
| 75 Years and over | 0 (0.0%) | 0 (0.0%) |
Disability Class: Cognitive Difficulty
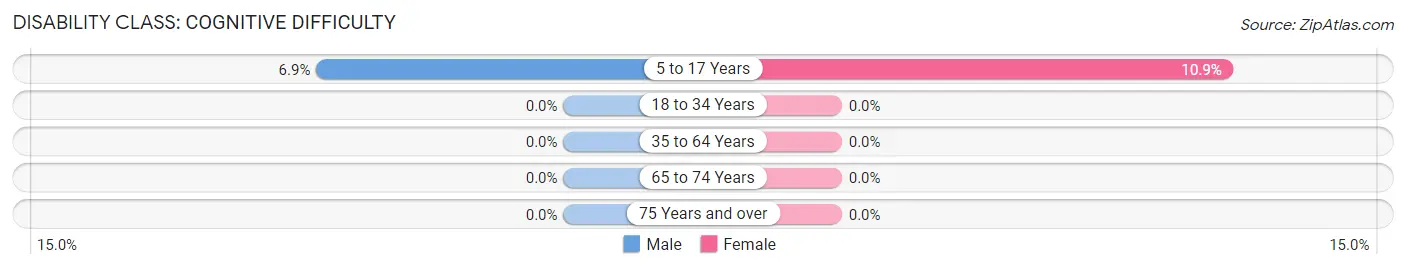
| Age Bracket | Male | Female |
| 5 to 17 Years | 11 (6.9%) | 12 (10.9%) |
| 18 to 34 Years | 0 (0.0%) | 0 (0.0%) |
| 35 to 64 Years | 0 (0.0%) | 0 (0.0%) |
| 65 to 74 Years | 0 (0.0%) | 0 (0.0%) |
| 75 Years and over | 0 (0.0%) | 0 (0.0%) |
Disability Class: Ambulatory Difficulty
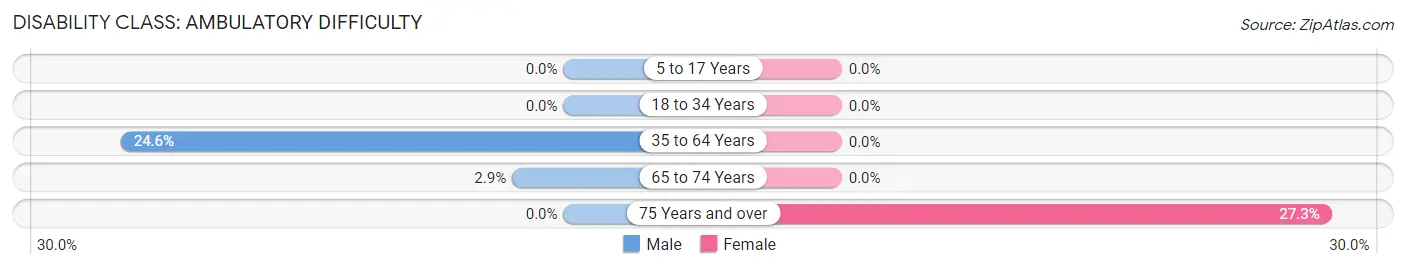
| Age Bracket | Male | Female |
| 5 to 17 Years | 0 (0.0%) | 0 (0.0%) |
| 18 to 34 Years | 0 (0.0%) | 0 (0.0%) |
| 35 to 64 Years | 17 (24.6%) | 0 (0.0%) |
| 65 to 74 Years | 1 (2.9%) | 0 (0.0%) |
| 75 Years and over | 0 (0.0%) | 9 (27.3%) |
Disability Class: Self-Care Difficulty
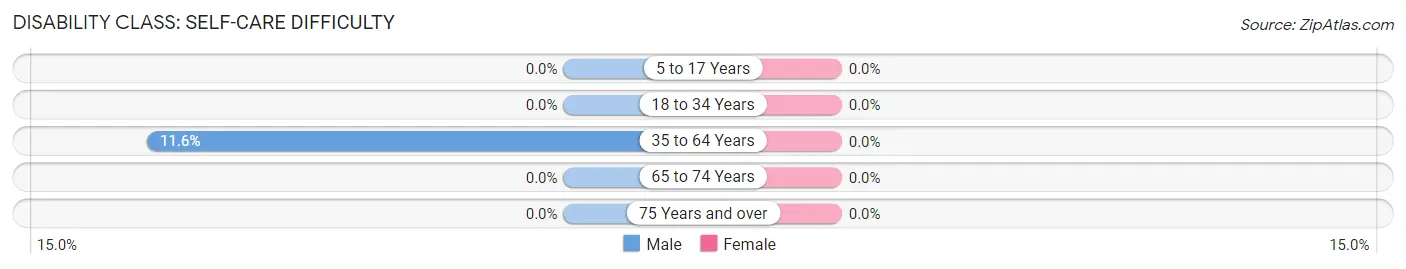
| Age Bracket | Male | Female |
| 5 to 17 Years | 0 (0.0%) | 0 (0.0%) |
| 18 to 34 Years | 0 (0.0%) | 0 (0.0%) |
| 35 to 64 Years | 8 (11.6%) | 0 (0.0%) |
| 65 to 74 Years | 0 (0.0%) | 0 (0.0%) |
| 75 Years and over | 0 (0.0%) | 0 (0.0%) |
Technology Access in Geronimo
Computing Device Access in Geronimo
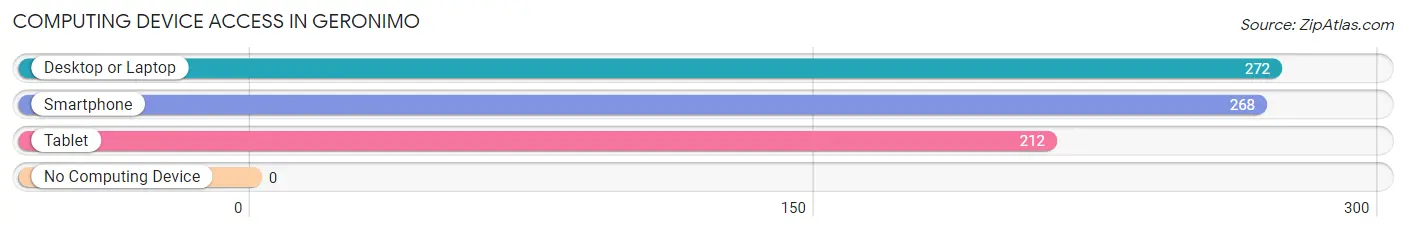
| Device Type | # Households | % Households |
| Desktop or Laptop | 272 | 95.1% |
| Smartphone | 268 | 93.7% |
| Tablet | 212 | 74.1% |
| No Computing Device | 0 | 0.0% |
| Total | 286 | 100.0% |
Internet Access in Geronimo
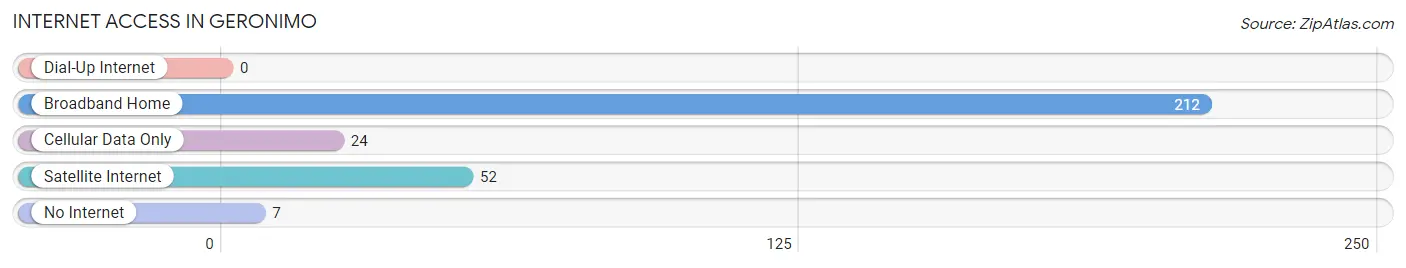
| Internet Type | # Households | % Households |
| Dial-Up Internet | 0 | 0.0% |
| Broadband Home | 212 | 74.1% |
| Cellular Data Only | 24 | 8.4% |
| Satellite Internet | 52 | 18.2% |
| No Internet | 7 | 2.5% |
| Total | 286 | 100.0% |
Geronimo Summary
Geronimo is a small town located in Guadalupe County, Texas. It is situated about 20 miles east of San Antonio and is part of the San Antonio–New Braunfels metropolitan area. The population of Geronimo was 1,845 at the 2010 census.
Geography
Geronimo is located at 29°41'25" North, 97°59'45" West (29.690278, -97.995833). It is situated in the rolling hills of the Texas Hill Country, about 20 miles east of San Antonio. The town is located on the banks of the San Marcos River, which flows through the center of town.
The town has a total area of 1 2 square miles all of which is land
History
Geronimo was founded in 1876 by German immigrants who named the town after the Apache leader Geronimo. The town was originally a farming community, but it soon became a center for the local cattle industry. In the early 1900s, the town was home to several cotton gins and a cottonseed oil mill.
In the 1920s, the town began to experience a period of growth and prosperity. The population increased from 500 in 1920 to 1,000 in 1930. During this time, the town was home to several businesses, including a bank, a hotel, a movie theater, and a variety of stores.
In the 1950s, the town began to decline as the local economy shifted away from agriculture. The population decreased from 1,000 in 1950 to 845 in 1960.
Economy
Today, Geronimo is a small, rural community with a population of 1,845. The town is home to several businesses, including a grocery store, a hardware store, a restaurant, and a gas station. The town is also home to a number of small manufacturing companies.
The town is served by the Guadalupe Valley Electric Cooperative, which provides electricity to the area.
Demographics
As of the 2010 census, the population of Geronimo was 1,845. The racial makeup of the town was 79.2% White, 0.7% African American, 0.2% Native American, 0.2% Asian, 0.1% Pacific Islander, 17.7% from other races, and 2.1% from two or more races. Hispanic or Latino of any race were 37.2% of the population.
The median household income in Geronimo was $37,917, and the median family income was $41,250. The per capita income for the town was $17,845. About 17.2% of families and 20.2% of the population were below the poverty line, including 28.3% of those under age 18 and 11.2% of those age 65 or over.
Common Questions
What is Per Capita Income in Geronimo?
Per Capita income in Geronimo is $30,470.
What is the Median Family Income in Geronimo?
Median Family Income in Geronimo is $88,625.
What is the Median Household income in Geronimo?
Median Household Income in Geronimo is $65,714.
What is Income or Wage Gap in Geronimo?
Income or Wage Gap in Geronimo is 25.8%.
Women in Geronimo earn 74.2 cents for every dollar earned by a man.
What is Inequality or Gini Index in Geronimo?
Inequality or Gini Index in Geronimo is 0.37.
What is the Total Population of Geronimo?
Total Population of Geronimo is 1,075.
What is the Total Male Population of Geronimo?
Total Male Population of Geronimo is 490.
What is the Total Female Population of Geronimo?
Total Female Population of Geronimo is 585.
What is the Ratio of Males per 100 Females in Geronimo?
There are 83.76 Males per 100 Females in Geronimo.
What is the Ratio of Females per 100 Males in Geronimo?
There are 119.39 Females per 100 Males in Geronimo.
What is the Median Population Age in Geronimo?
Median Population Age in Geronimo is 26.0 Years.
What is the Average Family Size in Geronimo
Average Family Size in Geronimo is 3.9 People.
What is the Average Household Size in Geronimo
Average Household Size in Geronimo is 3.8 People.
How Large is the Labor Force in Geronimo?
There are 600 People in the Labor Forcein in Geronimo.
What is the Percentage of People in the Labor Force in Geronimo?
71.8% of People are in the Labor Force in Geronimo.
What is the Unemployment Rate in Geronimo?
Unemployment Rate in Geronimo is 1.8%.