La Marque, TX Map & Demographics
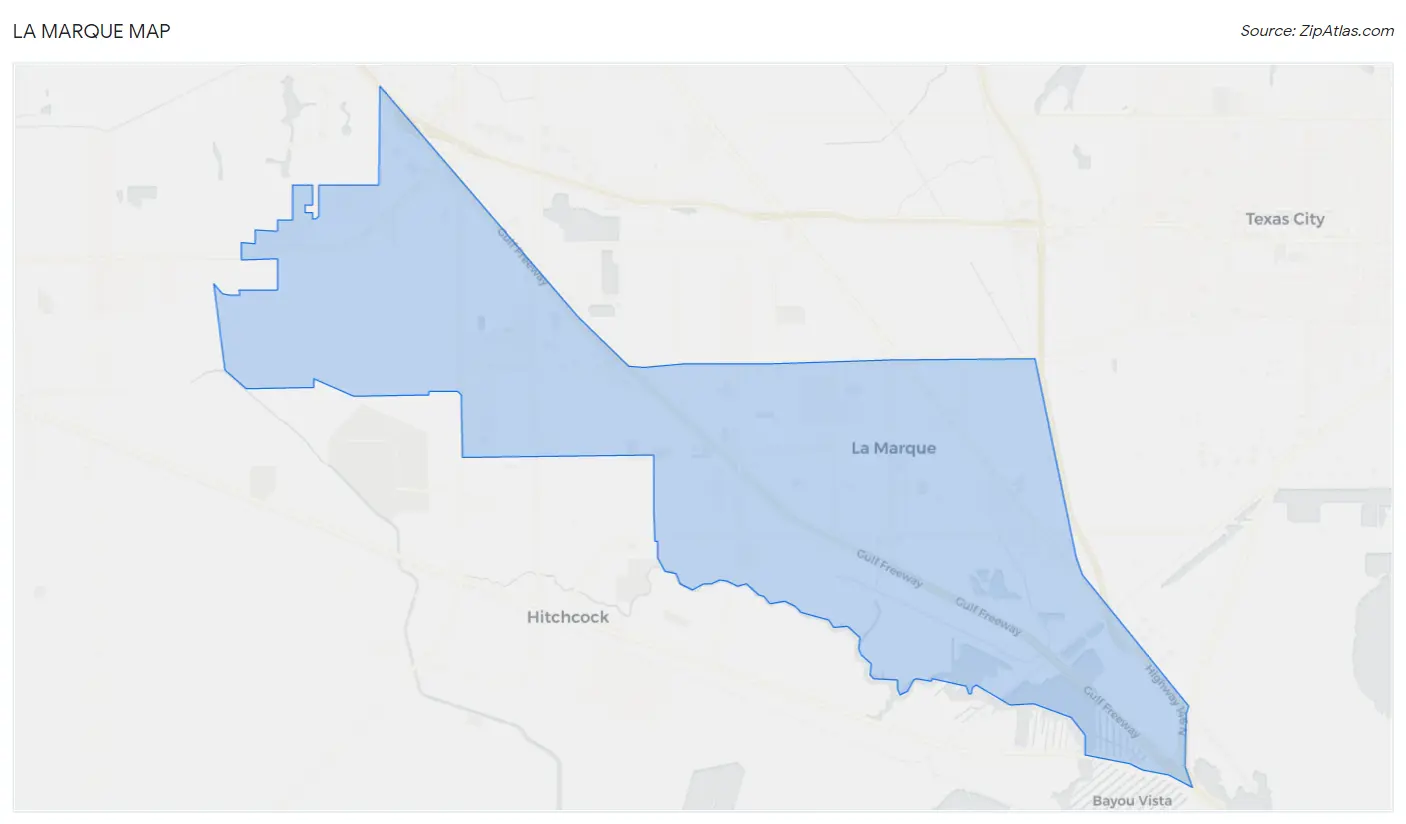
La Marque Map
La Marque Overview
$31,191
PER CAPITA INCOME
$76,492
AVG FAMILY INCOME
$61,403
AVG HOUSEHOLD INCOME
27.8%
WAGE / INCOME GAP [ % ]
72.2¢/ $1
WAGE / INCOME GAP [ $ ]
$13,554
FAMILY INCOME DEFICIT
0.46
INEQUALITY / GINI INDEX
18,464
TOTAL POPULATION
8,659
MALE POPULATION
9,805
FEMALE POPULATION
88.31
MALES / 100 FEMALES
113.23
FEMALES / 100 MALES
39.6
MEDIAN AGE
3.2
AVG FAMILY SIZE
2.6
AVG HOUSEHOLD SIZE
9,156
LABOR FORCE [ PEOPLE ]
63.0%
PERCENT IN LABOR FORCE
8.5%
UNEMPLOYMENT RATE
La Marque Zip Codes
La Marque Area Codes
Income in La Marque
Income Overview in La Marque
Per Capita Income in La Marque is $31,191, while median incomes of families and households are $76,492 and $61,403 respectively.
| Characteristic | Number | Measure |
| Per Capita Income | 18,464 | $31,191 |
| Median Family Income | 4,622 | $76,492 |
| Mean Family Income | 4,622 | $94,919 |
| Median Household Income | 7,043 | $61,403 |
| Mean Household Income | 7,043 | $80,543 |
| Income Deficit | 4,622 | $13,554 |
| Wage / Income Gap (%) | 18,464 | 27.83% |
| Wage / Income Gap ($) | 18,464 | 72.17¢ per $1 |
| Gini / Inequality Index | 18,464 | 0.46 |
Earnings by Sex in La Marque
Average Earnings in La Marque are $38,881, $46,533 for men and $33,583 for women, a difference of 27.8%.
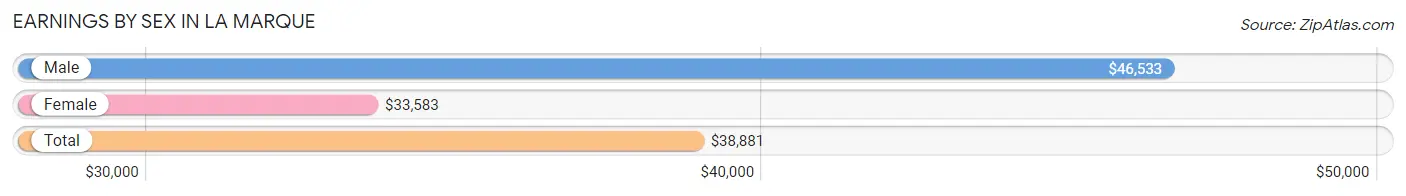
| Sex | Number | Average Earnings |
| Male | 4,710 (51.1%) | $46,533 |
| Female | 4,514 (48.9%) | $33,583 |
| Total | 9,224 (100.0%) | $38,881 |
Earnings by Sex by Income Bracket in La Marque
The most common earnings brackets in La Marque are $100,000+ for men (863 | 18.3%) and $55,000 to $64,999 for women (413 | 9.1%).
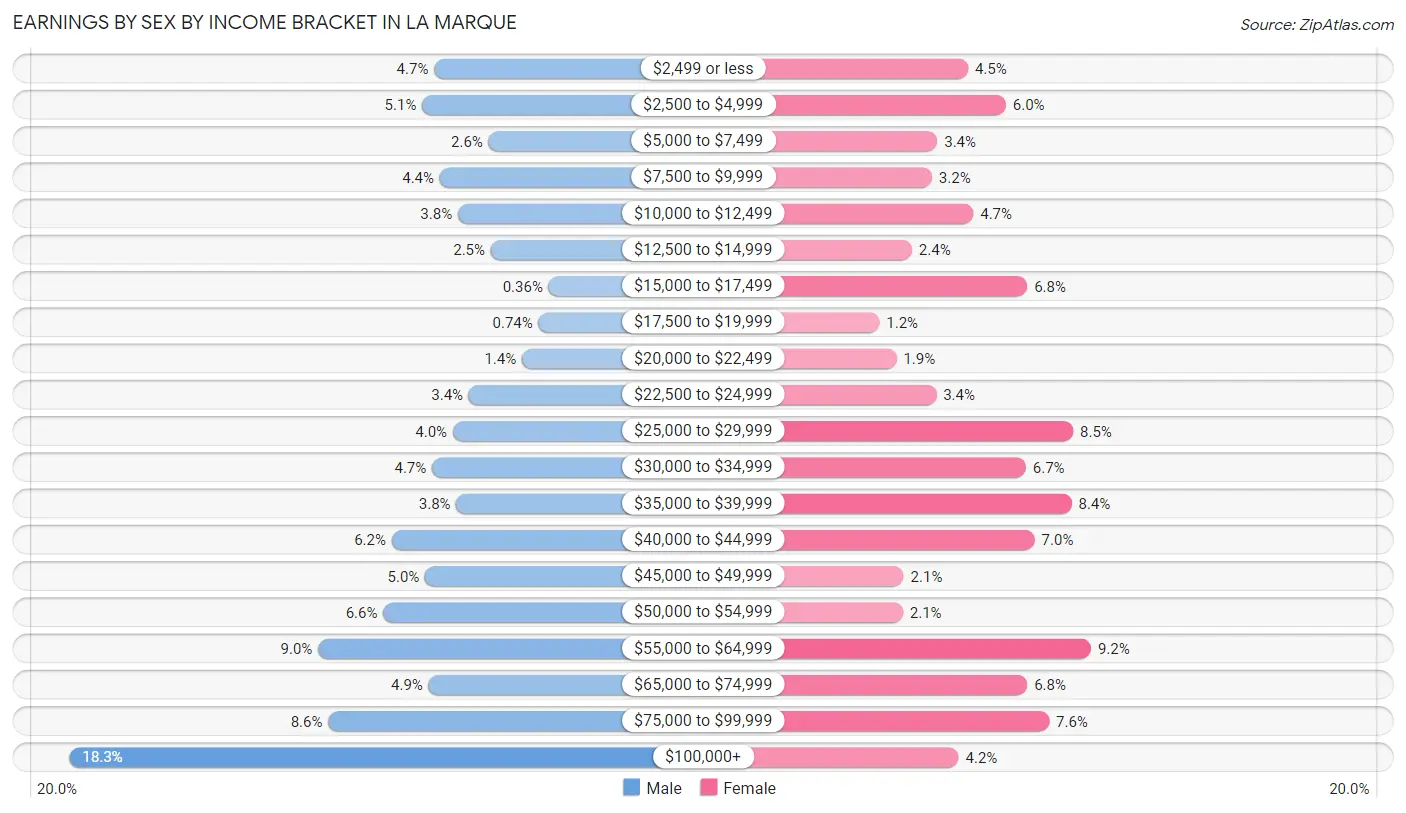
| Income | Male | Female |
| $2,499 or less | 219 (4.6%) | 205 (4.5%) |
| $2,500 to $4,999 | 240 (5.1%) | 269 (6.0%) |
| $5,000 to $7,499 | 123 (2.6%) | 153 (3.4%) |
| $7,500 to $9,999 | 209 (4.4%) | 144 (3.2%) |
| $10,000 to $12,499 | 177 (3.8%) | 214 (4.7%) |
| $12,500 to $14,999 | 119 (2.5%) | 110 (2.4%) |
| $15,000 to $17,499 | 17 (0.4%) | 305 (6.8%) |
| $17,500 to $19,999 | 35 (0.7%) | 55 (1.2%) |
| $20,000 to $22,499 | 64 (1.4%) | 84 (1.9%) |
| $22,500 to $24,999 | 158 (3.4%) | 151 (3.4%) |
| $25,000 to $29,999 | 186 (4.0%) | 383 (8.5%) |
| $30,000 to $34,999 | 223 (4.7%) | 303 (6.7%) |
| $35,000 to $39,999 | 180 (3.8%) | 380 (8.4%) |
| $40,000 to $44,999 | 294 (6.2%) | 318 (7.0%) |
| $45,000 to $49,999 | 235 (5.0%) | 96 (2.1%) |
| $50,000 to $54,999 | 309 (6.6%) | 95 (2.1%) |
| $55,000 to $64,999 | 424 (9.0%) | 413 (9.1%) |
| $65,000 to $74,999 | 229 (4.9%) | 305 (6.8%) |
| $75,000 to $99,999 | 406 (8.6%) | 342 (7.6%) |
| $100,000+ | 863 (18.3%) | 189 (4.2%) |
| Total | 4,710 (100.0%) | 4,514 (100.0%) |
Earnings by Sex by Educational Attainment in La Marque
Average earnings in La Marque are $51,976 for men and $35,576 for women, a difference of 31.6%. Men with an educational attainment of bachelor's degree enjoy the highest average annual earnings of $58,417, while those with less than high school education earn the least with $42,656. Women with an educational attainment of bachelor's degree earn the most with the average annual earnings of $61,339, while those with less than high school education have the smallest earnings of $12,303.
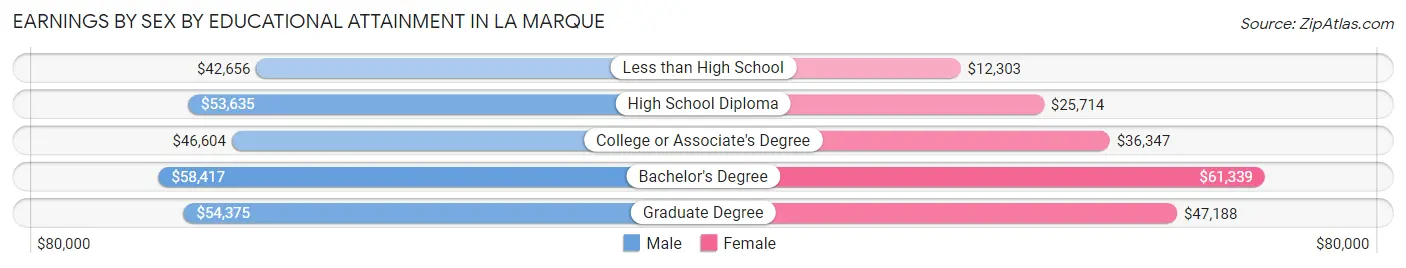
| Educational Attainment | Male Income | Female Income |
| Less than High School | $42,656 | $12,303 |
| High School Diploma | $53,635 | $25,714 |
| College or Associate's Degree | $46,604 | $36,347 |
| Bachelor's Degree | $58,417 | $61,339 |
| Graduate Degree | $54,375 | $47,188 |
| Total | $51,976 | $35,576 |
Family Income in La Marque
Family Income Brackets in La Marque
According to the La Marque family income data, there are 809 families falling into the $50,000 to $74,999 income range, which is the most common income bracket and makes up 17.5% of all families. Conversely, the $10,000 to $14,999 income bracket is the least frequent group with only 120 families (2.6%) belonging to this category.
| Income Bracket | # Families | % Families |
| Less than $10,000 | 296 | 6.4% |
| $10,000 to $14,999 | 120 | 2.6% |
| $15,000 to $24,999 | 273 | 5.9% |
| $25,000 to $34,999 | 176 | 3.8% |
| $35,000 to $49,999 | 601 | 13.0% |
| $50,000 to $74,999 | 809 | 17.5% |
| $75,000 to $99,999 | 758 | 16.4% |
| $100,000 to $149,999 | 684 | 14.8% |
| $150,000 to $199,999 | 499 | 10.8% |
| $200,000+ | 407 | 8.8% |
Family Income by Famaliy Size in La Marque
7+ person families (128 | 2.8%) account for the highest median family income in La Marque with $171,646 per family, while 2-person families (1,784 | 38.6%) have the highest median income of $32,447 per family member.
| Income Bracket | # Families | Median Income |
| 2-Person Families | 1,784 (38.6%) | $64,894 |
| 3-Person Families | 1,424 (30.8%) | $73,705 |
| 4-Person Families | 874 (18.9%) | $95,000 |
| 5-Person Families | 348 (7.5%) | $64,107 |
| 6-Person Families | 64 (1.4%) | $0 |
| 7+ Person Families | 128 (2.8%) | $171,646 |
| Total | 4,622 (100.0%) | $76,492 |
Family Income by Number of Earners in La Marque
The median family income in La Marque is $76,492, with families comprising 3+ earners (415) having the highest median family income of $170,503, while families with no earners (739) have the lowest median family income of $37,917, accounting for 9.0% and 16.0% of families, respectively.
| Number of Earners | # Families | Median Income |
| No Earners | 739 (16.0%) | $37,917 |
| 1 Earner | 1,612 (34.9%) | $50,950 |
| 2 Earners | 1,856 (40.2%) | $105,787 |
| 3+ Earners | 415 (9.0%) | $170,503 |
| Total | 4,622 (100.0%) | $76,492 |
Household Income in La Marque
Household Income Brackets in La Marque
With 1,211 households falling in the category, the $50,000 to $74,999 income range is the most frequent in La Marque, accounting for 17.2% of all households. In contrast, only 465 households (6.6%) fall into the $200,000+ income bracket, making it the least populous group.
| Income Bracket | # Households | % Households |
| Less than $10,000 | 486 | 6.9% |
| $10,000 to $14,999 | 514 | 7.3% |
| $15,000 to $24,999 | 641 | 9.1% |
| $25,000 to $34,999 | 570 | 8.1% |
| $35,000 to $49,999 | 711 | 10.1% |
| $50,000 to $74,999 | 1,211 | 17.2% |
| $75,000 to $99,999 | 958 | 13.6% |
| $100,000 to $149,999 | 944 | 13.4% |
| $150,000 to $199,999 | 556 | 7.9% |
| $200,000+ | 465 | 6.6% |
Household Income by Householder Age in La Marque
The median household income in La Marque is $61,403, with the highest median household income of $74,500 found in the 45 to 64 years age bracket for the primary householder. A total of 2,832 households (40.2%) fall into this category. Meanwhile, the 15 to 24 years age bracket for the primary householder has the lowest median household income of $39,187, with 131 households (1.9%) in this group.
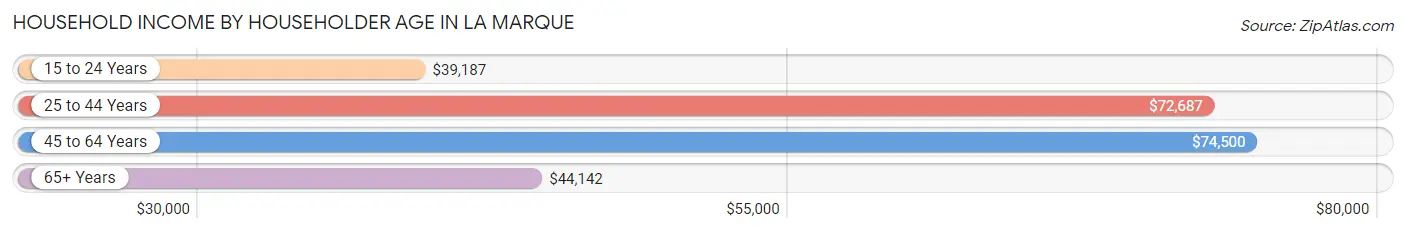
| Income Bracket | # Households | Median Income |
| 15 to 24 Years | 131 (1.9%) | $39,187 |
| 25 to 44 Years | 2,217 (31.5%) | $72,687 |
| 45 to 64 Years | 2,832 (40.2%) | $74,500 |
| 65+ Years | 1,863 (26.5%) | $44,142 |
| Total | 7,043 (100.0%) | $61,403 |
Poverty in La Marque
Income Below Poverty by Sex and Age in La Marque
With 14.9% poverty level for males and 19.8% for females among the residents of La Marque, 6 to 11 year old males and 15 year old females are the most vulnerable to poverty, with 340 males (36.8%) and 79 females (57.3%) in their respective age groups living below the poverty level.
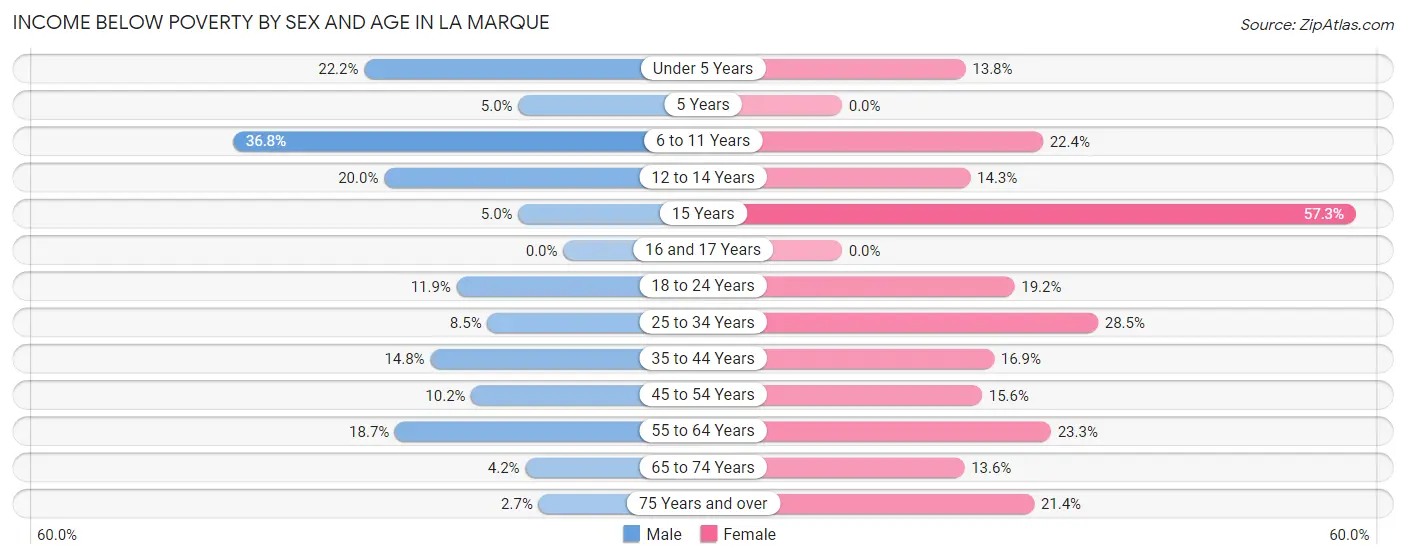
| Age Bracket | Male | Female |
| Under 5 Years | 100 (22.2%) | 82 (13.8%) |
| 5 Years | 6 (5.0%) | 0 (0.0%) |
| 6 to 11 Years | 340 (36.8%) | 203 (22.4%) |
| 12 to 14 Years | 80 (20.0%) | 39 (14.3%) |
| 15 Years | 4 (5.0%) | 79 (57.3%) |
| 16 and 17 Years | 0 (0.0%) | 0 (0.0%) |
| 18 to 24 Years | 95 (11.9%) | 137 (19.2%) |
| 25 to 34 Years | 84 (8.5%) | 351 (28.5%) |
| 35 to 44 Years | 194 (14.8%) | 250 (16.9%) |
| 45 to 54 Years | 114 (10.2%) | 162 (15.6%) |
| 55 to 64 Years | 235 (18.7%) | 327 (23.3%) |
| 65 to 74 Years | 27 (4.2%) | 137 (13.6%) |
| 75 Years and over | 12 (2.7%) | 153 (21.4%) |
| Total | 1,291 (14.9%) | 1,920 (19.8%) |
Income Above Poverty by Sex and Age in La Marque
According to the poverty statistics in La Marque, males aged 16 and 17 years and females aged 5 years are the age groups that are most secure financially, with 100.0% of males and 100.0% of females in these age groups living above the poverty line.
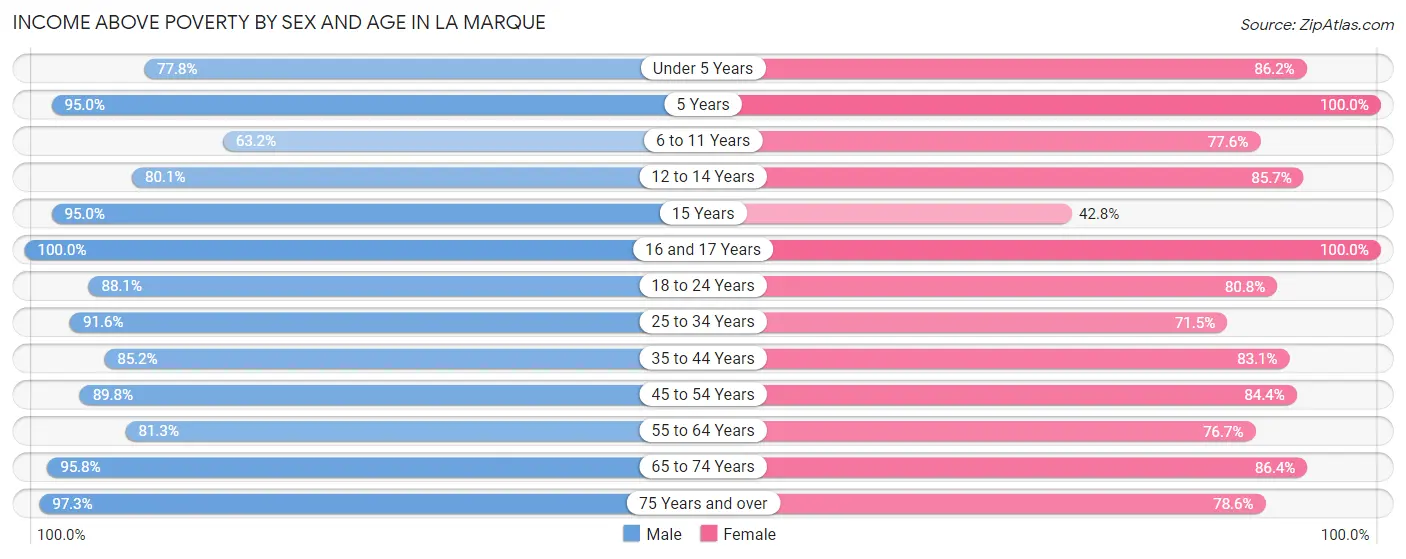
| Age Bracket | Male | Female |
| Under 5 Years | 351 (77.8%) | 514 (86.2%) |
| 5 Years | 114 (95.0%) | 34 (100.0%) |
| 6 to 11 Years | 584 (63.2%) | 704 (77.6%) |
| 12 to 14 Years | 321 (80.0%) | 234 (85.7%) |
| 15 Years | 76 (95.0%) | 59 (42.7%) |
| 16 and 17 Years | 118 (100.0%) | 175 (100.0%) |
| 18 to 24 Years | 705 (88.1%) | 576 (80.8%) |
| 25 to 34 Years | 910 (91.5%) | 880 (71.5%) |
| 35 to 44 Years | 1,117 (85.2%) | 1,227 (83.1%) |
| 45 to 54 Years | 999 (89.8%) | 877 (84.4%) |
| 55 to 64 Years | 1,020 (81.3%) | 1,078 (76.7%) |
| 65 to 74 Years | 613 (95.8%) | 868 (86.4%) |
| 75 Years and over | 426 (97.3%) | 562 (78.6%) |
| Total | 7,354 (85.1%) | 7,788 (80.2%) |
Income Below Poverty Among Married-Couple Families in La Marque
The poverty statistics for married-couple families in La Marque show that 7.4% or 231 of the total 3,129 families live below the poverty line. Families with 1 or 2 children have the highest poverty rate of 14.1%, comprising of 164 families. On the other hand, families with no children have the lowest poverty rate of 2.9%, which includes 50 families.
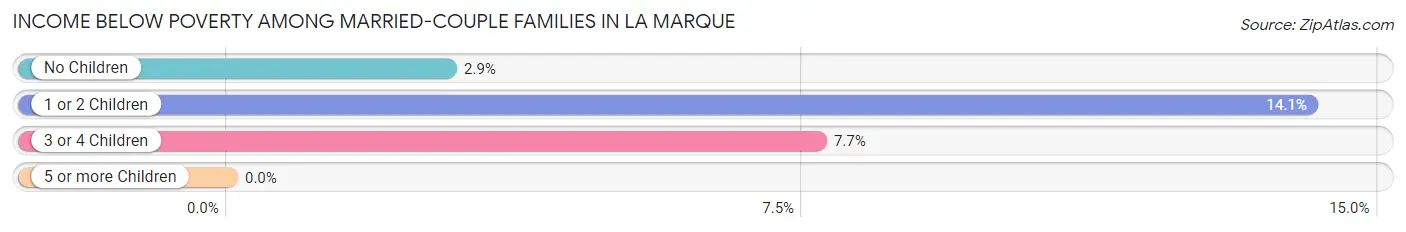
| Children | Above Poverty | Below Poverty |
| No Children | 1,696 (97.1%) | 50 (2.9%) |
| 1 or 2 Children | 998 (85.9%) | 164 (14.1%) |
| 3 or 4 Children | 204 (92.3%) | 17 (7.7%) |
| 5 or more Children | 0 (0.0%) | 0 (0.0%) |
| Total | 2,898 (92.6%) | 231 (7.4%) |
Income Below Poverty Among Single-Parent Households in La Marque
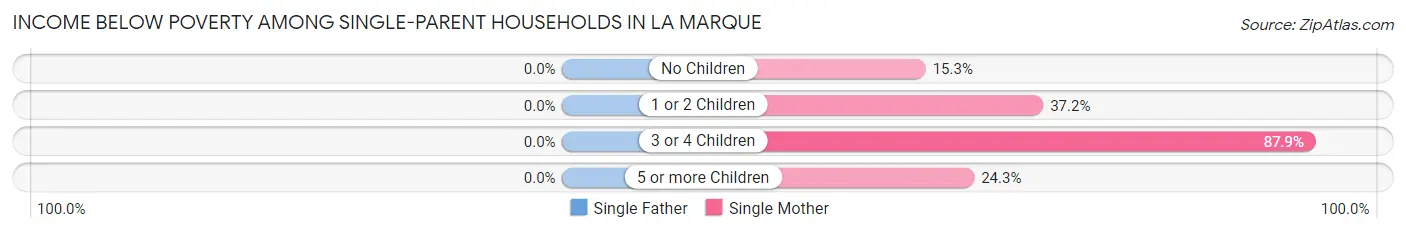
| Children | Single Father | Single Mother |
| No Children | 0 (0.0%) | 63 (15.3%) |
| 1 or 2 Children | 0 (0.0%) | 268 (37.2%) |
| 3 or 4 Children | 0 (0.0%) | 51 (87.9%) |
| 5 or more Children | 0 (0.0%) | 9 (24.3%) |
| Total | 0 (0.0%) | 391 (31.8%) |
Income Below Poverty Among Married-Couple vs Single-Parent Households in La Marque
The poverty data for La Marque shows that 231 of the married-couple family households (7.4%) and 391 of the single-parent households (26.2%) are living below the poverty level. Within the married-couple family households, those with 1 or 2 children have the highest poverty rate, with 164 households (14.1%) falling below the poverty line. Among the single-parent households, those with 3 or 4 children have the highest poverty rate, with 51 household (61.5%) living below poverty.
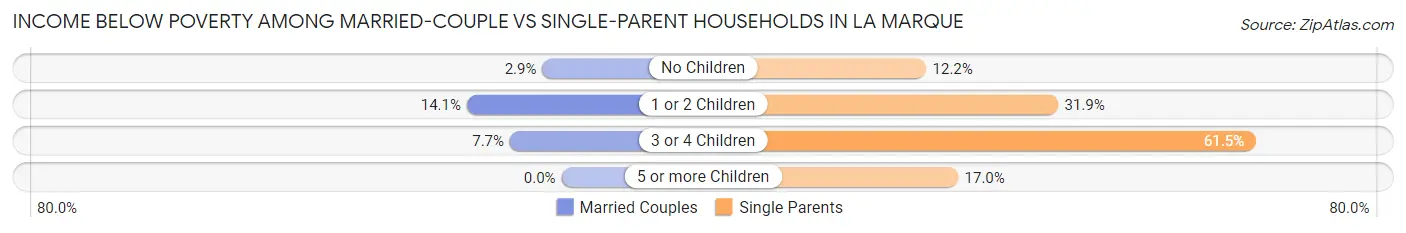
| Children | Married-Couple Families | Single-Parent Households |
| No Children | 50 (2.9%) | 63 (12.2%) |
| 1 or 2 Children | 164 (14.1%) | 268 (31.9%) |
| 3 or 4 Children | 17 (7.7%) | 51 (61.5%) |
| 5 or more Children | 0 (0.0%) | 9 (17.0%) |
| Total | 231 (7.4%) | 391 (26.2%) |
Race in La Marque
The most populous races in La Marque are White / Caucasian (8,899 | 48.2%), Black / African American (5,547 | 30.0%), and Hispanic or Latino (5,375 | 29.1%).
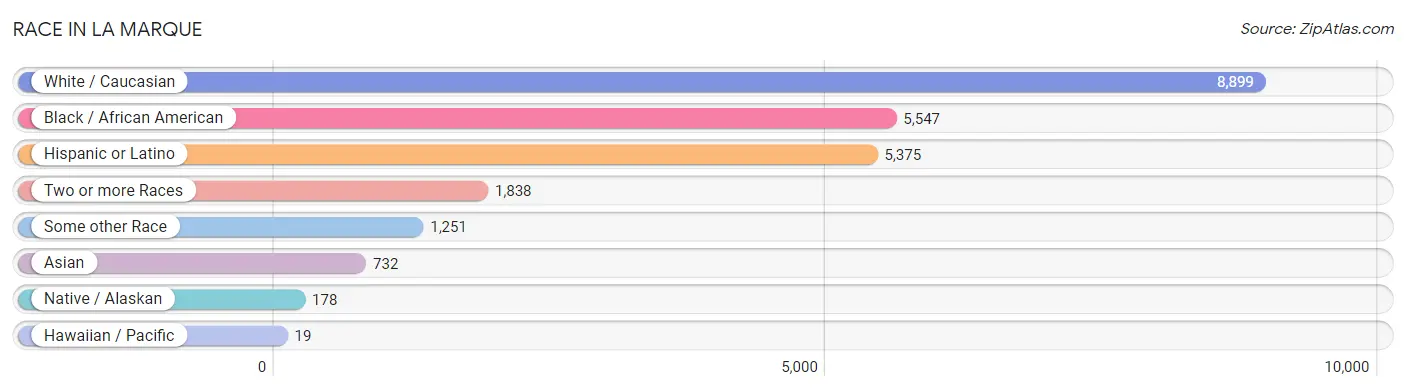
| Race | # Population | % Population |
| Asian | 732 | 4.0% |
| Black / African American | 5,547 | 30.0% |
| Hawaiian / Pacific | 19 | 0.1% |
| Hispanic or Latino | 5,375 | 29.1% |
| Native / Alaskan | 178 | 1.0% |
| White / Caucasian | 8,899 | 48.2% |
| Two or more Races | 1,838 | 10.0% |
| Some other Race | 1,251 | 6.8% |
| Total | 18,464 | 100.0% |
Ancestry in La Marque
The most populous ancestries reported in La Marque are Mexican (4,098 | 22.2%), German (1,084 | 5.9%), Irish (762 | 4.1%), English (728 | 3.9%), and Korean (699 | 3.8%), together accounting for 39.9% of all La Marque residents.
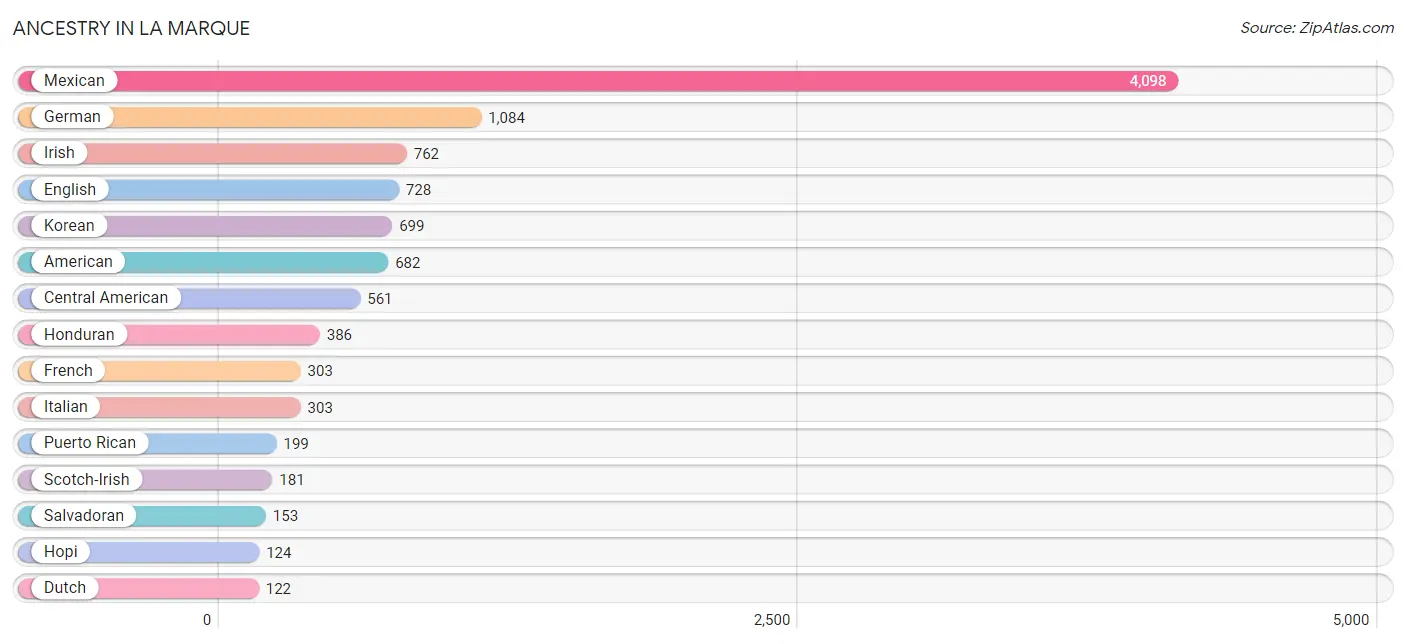
| Ancestry | # Population | % Population |
| African | 54 | 0.3% |
| American | 682 | 3.7% |
| Austrian | 55 | 0.3% |
| Bhutanese | 8 | 0.0% |
| Brazilian | 17 | 0.1% |
| British | 22 | 0.1% |
| Cajun | 111 | 0.6% |
| Canadian | 9 | 0.1% |
| Central American | 561 | 3.0% |
| Cherokee | 113 | 0.6% |
| Chickasaw | 18 | 0.1% |
| Czech | 110 | 0.6% |
| Danish | 78 | 0.4% |
| Dutch | 122 | 0.7% |
| Eastern European | 14 | 0.1% |
| English | 728 | 3.9% |
| European | 80 | 0.4% |
| Finnish | 15 | 0.1% |
| French | 303 | 1.6% |
| French Canadian | 70 | 0.4% |
| German | 1,084 | 5.9% |
| Guamanian / Chamorro | 19 | 0.1% |
| Guatemalan | 22 | 0.1% |
| Honduran | 386 | 2.1% |
| Hopi | 124 | 0.7% |
| Hungarian | 21 | 0.1% |
| Indian (Asian) | 33 | 0.2% |
| Iranian | 9 | 0.1% |
| Irish | 762 | 4.1% |
| Iroquois | 7 | 0.0% |
| Italian | 303 | 1.6% |
| Korean | 699 | 3.8% |
| Malaysian | 28 | 0.2% |
| Mexican | 4,098 | 22.2% |
| Native Hawaiian | 4 | 0.0% |
| Northern European | 15 | 0.1% |
| Norwegian | 64 | 0.4% |
| Polish | 85 | 0.5% |
| Puerto Rican | 199 | 1.1% |
| Salvadoran | 153 | 0.8% |
| Samoan | 4 | 0.0% |
| Scandinavian | 45 | 0.2% |
| Scotch-Irish | 181 | 1.0% |
| Scottish | 88 | 0.5% |
| Serbian | 19 | 0.1% |
| Sioux | 7 | 0.0% |
| South American | 39 | 0.2% |
| Spaniard | 91 | 0.5% |
| Spanish | 61 | 0.3% |
| Sri Lankan | 82 | 0.4% |
| Subsaharan African | 54 | 0.3% |
| Swiss | 30 | 0.2% |
| Thai | 59 | 0.3% |
| Trinidadian and Tobagonian | 9 | 0.1% |
| Ukrainian | 5 | 0.0% |
| Uruguayan | 39 | 0.2% |
| Welsh | 47 | 0.3% | View All 57 Rows |
Immigrants in La Marque
The most numerous immigrant groups reported in La Marque came from Latin America (962 | 5.2%), Central America (911 | 4.9%), Mexico (544 | 2.9%), Asia (245 | 1.3%), and Honduras (218 | 1.2%), together accounting for 15.6% of all La Marque residents.
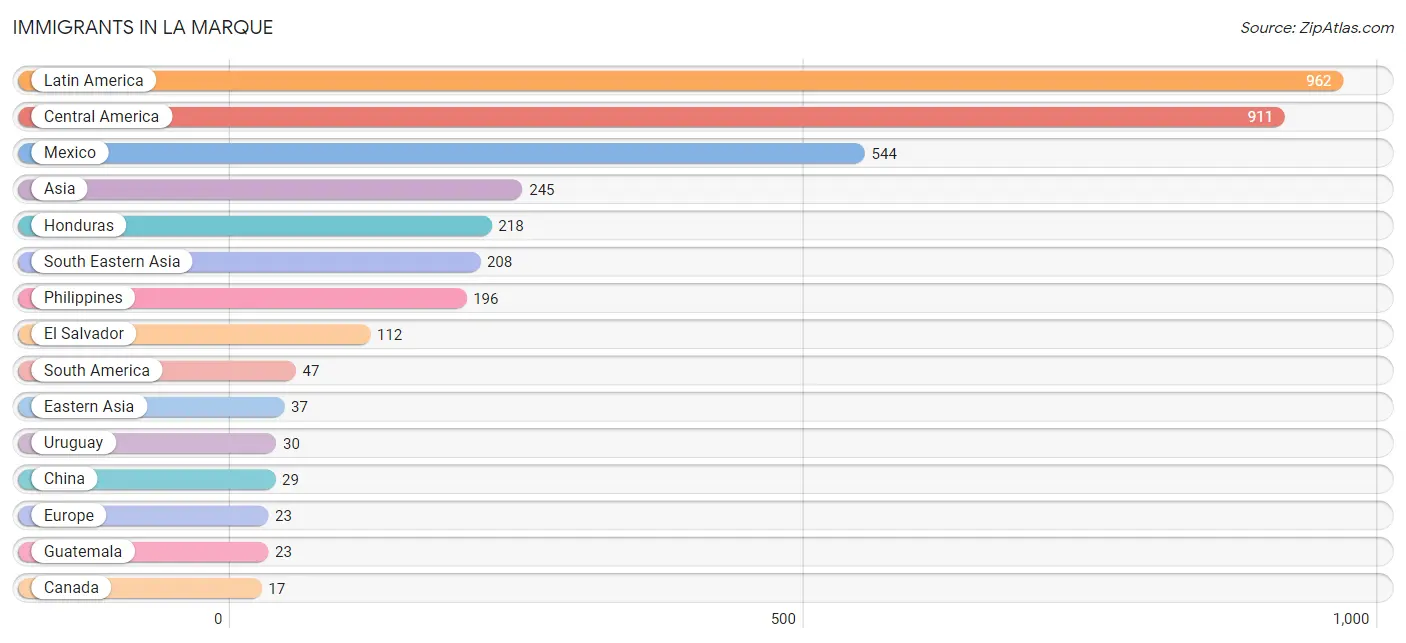
| Immigration Origin | # Population | % Population |
| Asia | 245 | 1.3% |
| Canada | 17 | 0.1% |
| Caribbean | 4 | 0.0% |
| Central America | 911 | 4.9% |
| China | 29 | 0.2% |
| Colombia | 17 | 0.1% |
| Costa Rica | 3 | 0.0% |
| Eastern Asia | 37 | 0.2% |
| El Salvador | 112 | 0.6% |
| Europe | 23 | 0.1% |
| Greece | 14 | 0.1% |
| Guatemala | 23 | 0.1% |
| Honduras | 218 | 1.2% |
| Japan | 8 | 0.0% |
| Laos | 12 | 0.1% |
| Latin America | 962 | 5.2% |
| Mexico | 544 | 2.9% |
| Nicaragua | 4 | 0.0% |
| Philippines | 196 | 1.1% |
| South America | 47 | 0.3% |
| South Eastern Asia | 208 | 1.1% |
| Southern Europe | 14 | 0.1% |
| Switzerland | 9 | 0.1% |
| Trinidad and Tobago | 4 | 0.0% |
| Uruguay | 30 | 0.2% |
| Western Europe | 9 | 0.1% | View All 26 Rows |
Sex and Age in La Marque
Sex and Age in La Marque
The most populous age groups in La Marque are 10 to 14 Years (872 | 10.1%) for men and 60 to 64 Years (790 | 8.1%) for women.
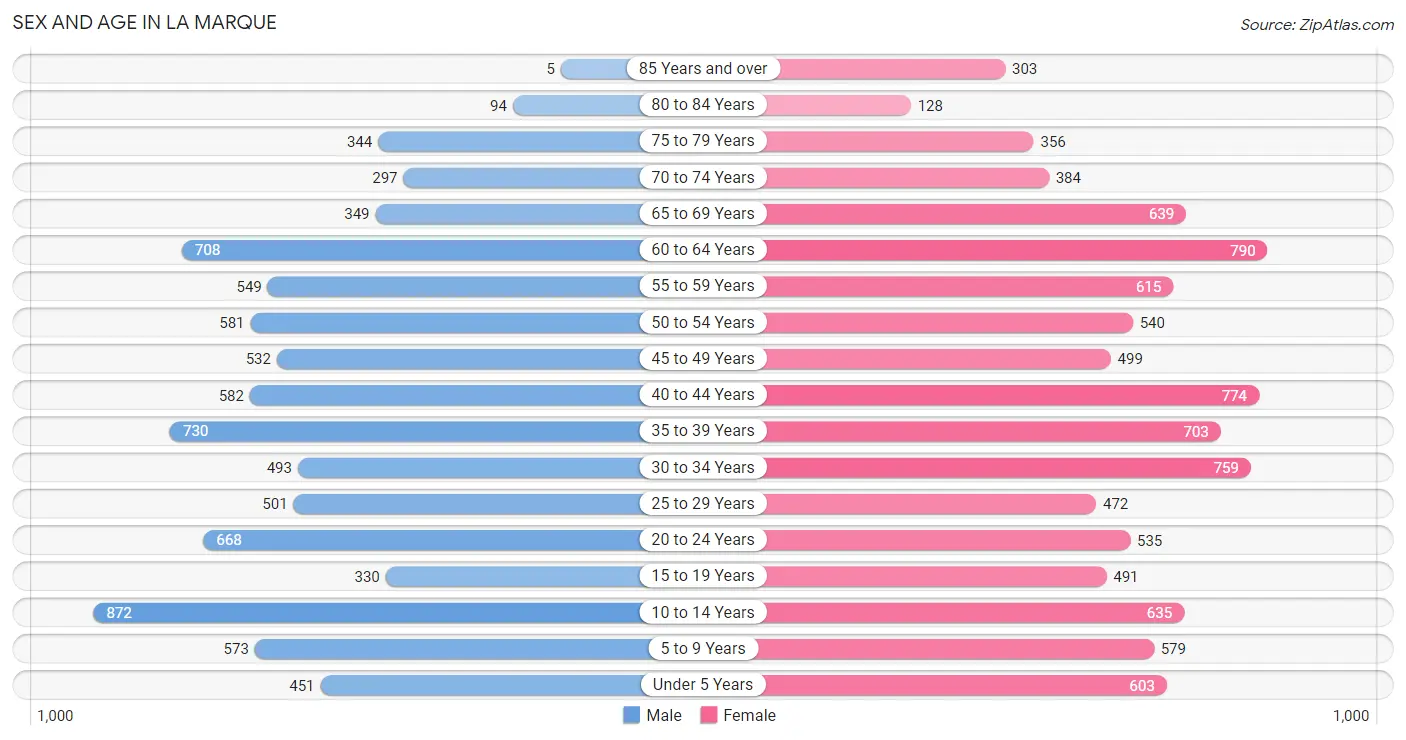
| Age Bracket | Male | Female |
| Under 5 Years | 451 (5.2%) | 603 (6.1%) |
| 5 to 9 Years | 573 (6.6%) | 579 (5.9%) |
| 10 to 14 Years | 872 (10.1%) | 635 (6.5%) |
| 15 to 19 Years | 330 (3.8%) | 491 (5.0%) |
| 20 to 24 Years | 668 (7.7%) | 535 (5.5%) |
| 25 to 29 Years | 501 (5.8%) | 472 (4.8%) |
| 30 to 34 Years | 493 (5.7%) | 759 (7.7%) |
| 35 to 39 Years | 730 (8.4%) | 703 (7.2%) |
| 40 to 44 Years | 582 (6.7%) | 774 (7.9%) |
| 45 to 49 Years | 532 (6.1%) | 499 (5.1%) |
| 50 to 54 Years | 581 (6.7%) | 540 (5.5%) |
| 55 to 59 Years | 549 (6.3%) | 615 (6.3%) |
| 60 to 64 Years | 708 (8.2%) | 790 (8.1%) |
| 65 to 69 Years | 349 (4.0%) | 639 (6.5%) |
| 70 to 74 Years | 297 (3.4%) | 384 (3.9%) |
| 75 to 79 Years | 344 (4.0%) | 356 (3.6%) |
| 80 to 84 Years | 94 (1.1%) | 128 (1.3%) |
| 85 Years and over | 5 (0.1%) | 303 (3.1%) |
| Total | 8,659 (100.0%) | 9,805 (100.0%) |
Families and Households in La Marque
Median Family Size in La Marque
The median family size in La Marque is 3.23 persons per family, with married-couple families (3,129 | 67.7%) accounting for the largest median family size of 3.34 persons per family. On the other hand, single female/mother families (1,228 | 26.6%) represent the smallest median family size with 2.99 persons per family.
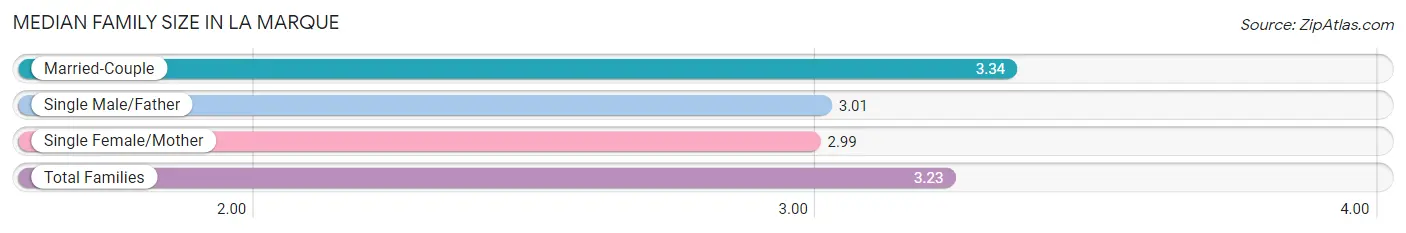
| Family Type | # Families | Family Size |
| Married-Couple | 3,129 (67.7%) | 3.34 |
| Single Male/Father | 265 (5.7%) | 3.01 |
| Single Female/Mother | 1,228 (26.6%) | 2.99 |
| Total Families | 4,622 (100.0%) | 3.23 |
Median Household Size in La Marque
The median household size in La Marque is 2.60 persons per household, with single male/father households (265 | 3.8%) accounting for the largest median household size of 3.56 persons per household. non-family households (2,421 | 34.4%) represent the smallest median household size with 1.18 persons per household.
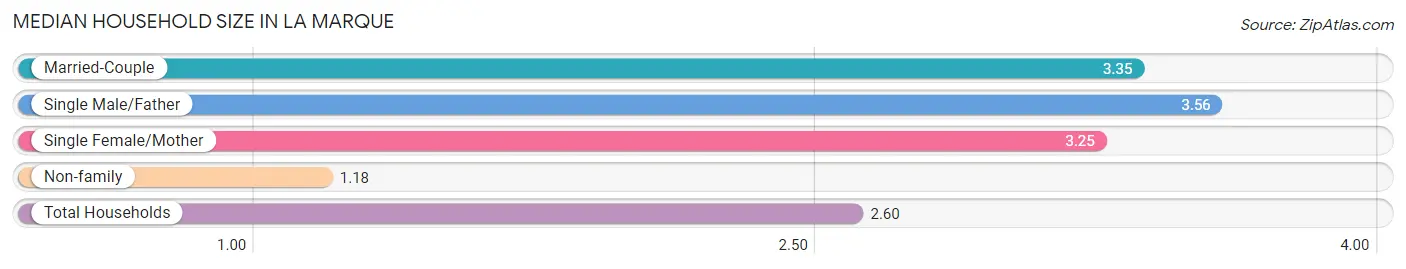
| Household Type | # Households | Household Size |
| Married-Couple | 3,129 (44.4%) | 3.35 |
| Single Male/Father | 265 (3.8%) | 3.56 |
| Single Female/Mother | 1,228 (17.4%) | 3.25 |
| Non-family | 2,421 (34.4%) | 1.18 |
| Total Households | 7,043 (100.0%) | 2.60 |
Household Size by Marriage Status in La Marque
Out of a total of 7,043 households in La Marque, 4,622 (65.6%) are family households, while 2,421 (34.4%) are nonfamily households. The most numerous type of family households are 2-person households, comprising 1,664, and the most common type of nonfamily households are 1-person households, comprising 2,003.
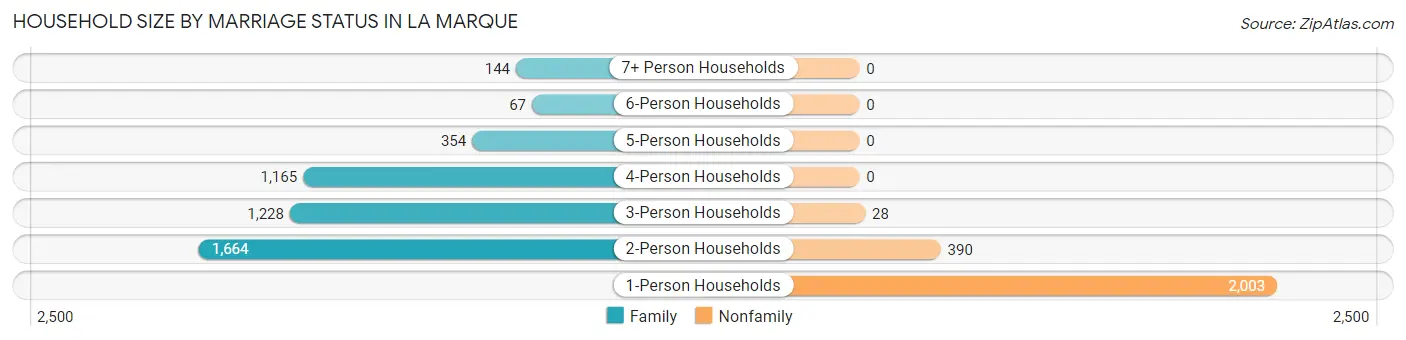
| Household Size | Family Households | Nonfamily Households |
| 1-Person Households | - | 2,003 (28.4%) |
| 2-Person Households | 1,664 (23.6%) | 390 (5.5%) |
| 3-Person Households | 1,228 (17.4%) | 28 (0.4%) |
| 4-Person Households | 1,165 (16.5%) | 0 (0.0%) |
| 5-Person Households | 354 (5.0%) | 0 (0.0%) |
| 6-Person Households | 67 (0.9%) | 0 (0.0%) |
| 7+ Person Households | 144 (2.0%) | 0 (0.0%) |
| Total | 4,622 (65.6%) | 2,421 (34.4%) |
Female Fertility in La Marque
Fertility by Age in La Marque
Average fertility rate in La Marque is 37.0 births per 1,000 women. Women in the age bracket of 20 to 34 years have the highest fertility rate with 81.0 births per 1,000 women. Women in the age bracket of 20 to 34 years acount for 88.3% of all women with births.
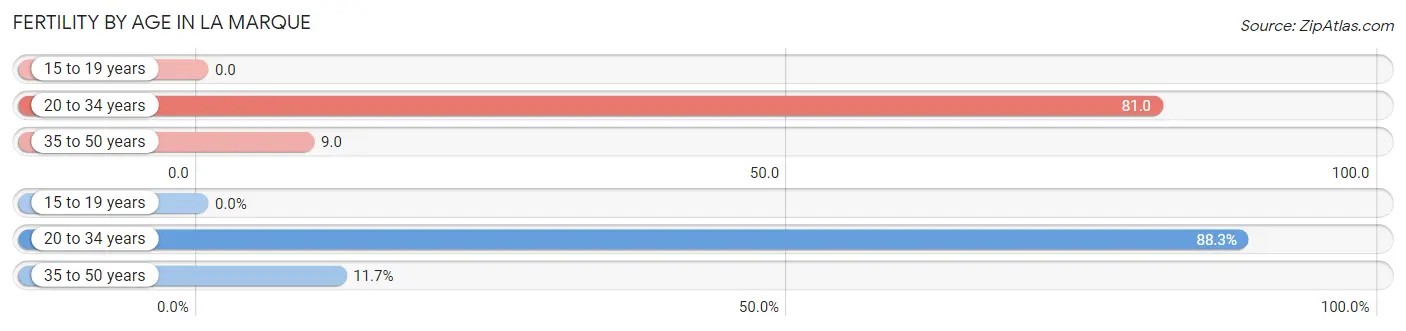
| Age Bracket | Women with Births | Births / 1,000 Women |
| 15 to 19 years | 0 (0.0%) | 0.0 |
| 20 to 34 years | 143 (88.3%) | 81.0 |
| 35 to 50 years | 19 (11.7%) | 9.0 |
| Total | 162 (100.0%) | 37.0 |
Fertility by Age by Marriage Status in La Marque
68.5% of women with births (162) in La Marque are married. The highest percentage of unmarried women with births falls into 35 to 50 years age bracket with 36.8% of them unmarried at the time of birth, while the lowest percentage of unmarried women with births belong to 20 to 34 years age bracket with 30.8% of them unmarried.
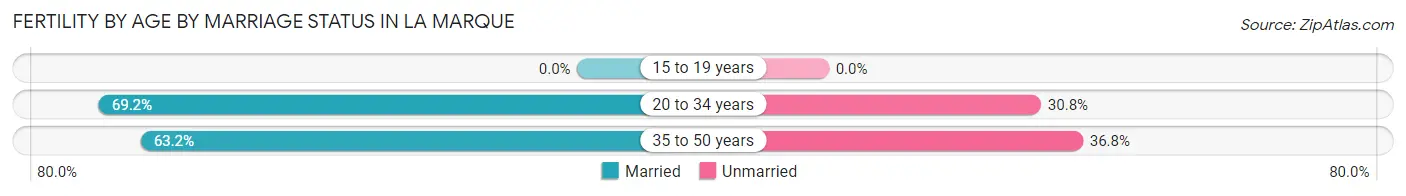
| Age Bracket | Married | Unmarried |
| 15 to 19 years | 0 (0.0%) | 0 (0.0%) |
| 20 to 34 years | 99 (69.2%) | 44 (30.8%) |
| 35 to 50 years | 12 (63.2%) | 7 (36.8%) |
| Total | 111 (68.5%) | 51 (31.5%) |
Fertility by Education in La Marque
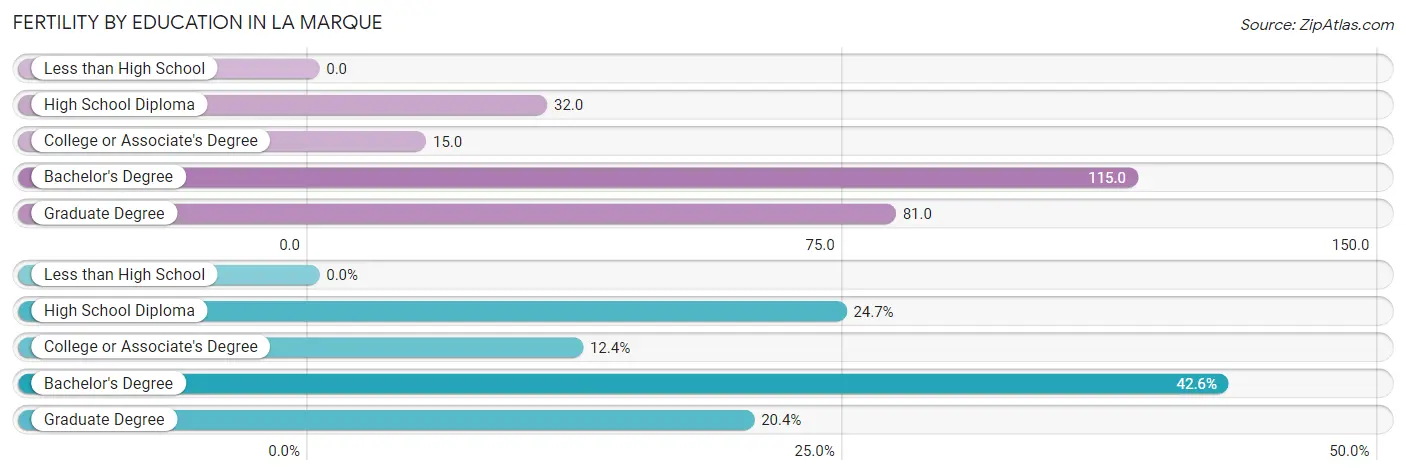
| Educational Attainment | Women with Births | Births / 1,000 Women |
| Less than High School | 0 (0.0%) | 0.0 |
| High School Diploma | 40 (24.7%) | 32.0 |
| College or Associate's Degree | 20 (12.3%) | 15.0 |
| Bachelor's Degree | 69 (42.6%) | 115.0 |
| Graduate Degree | 33 (20.4%) | 81.0 |
| Total | 162 (100.0%) | 37.0 |
Fertility by Education by Marriage Status in La Marque
31.5% of women with births in La Marque are unmarried. Women with the educational attainment of high school diploma are most likely to be married with 100.0% of them married at childbirth, while women with the educational attainment of college or associate's degree are least likely to be married with 100.0% of them unmarried at childbirth.
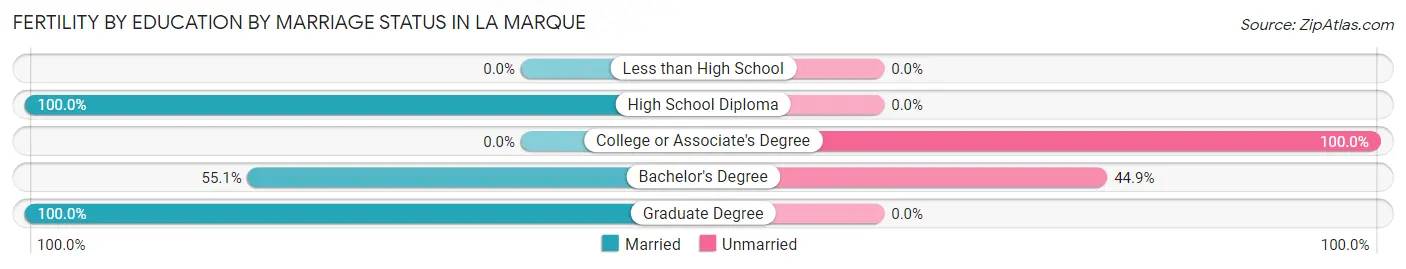
| Educational Attainment | Married | Unmarried |
| Less than High School | 0 (0.0%) | 0 (0.0%) |
| High School Diploma | 40 (100.0%) | 0 (0.0%) |
| College or Associate's Degree | 0 (0.0%) | 20 (100.0%) |
| Bachelor's Degree | 38 (55.1%) | 31 (44.9%) |
| Graduate Degree | 33 (100.0%) | 0 (0.0%) |
| Total | 111 (68.5%) | 51 (31.5%) |
Employment Characteristics in La Marque
Employment by Class of Employer in La Marque
Among the 8,225 employed individuals in La Marque, private company employees (5,109 | 62.1%), not-for-profit organizations (818 | 10.0%), and local government employees (792 | 9.6%) make up the most common classes of employment.
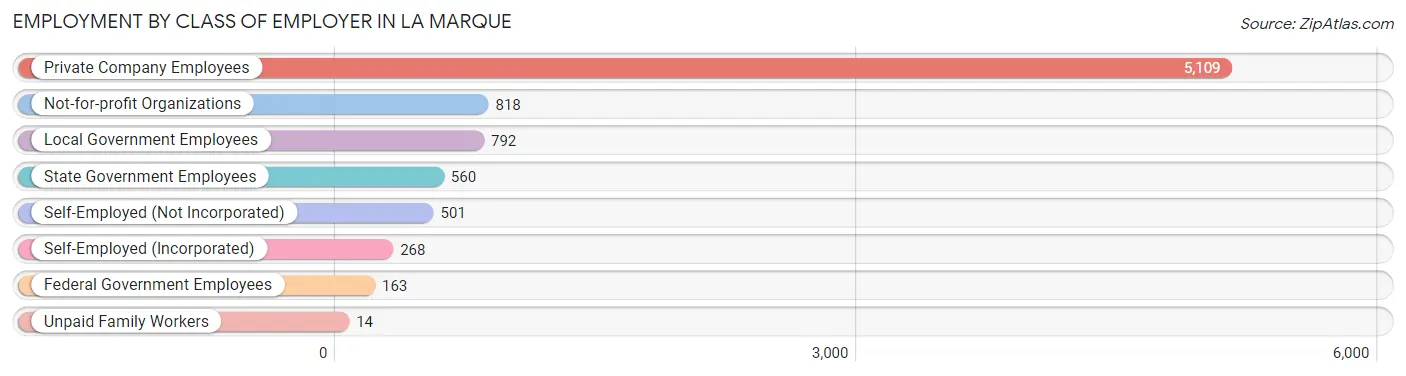
| Employer Class | # Employees | % Employees |
| Private Company Employees | 5,109 | 62.1% |
| Self-Employed (Incorporated) | 268 | 3.3% |
| Self-Employed (Not Incorporated) | 501 | 6.1% |
| Not-for-profit Organizations | 818 | 10.0% |
| Local Government Employees | 792 | 9.6% |
| State Government Employees | 560 | 6.8% |
| Federal Government Employees | 163 | 2.0% |
| Unpaid Family Workers | 14 | 0.2% |
| Total | 8,225 | 100.0% |
Employment Status by Age in La Marque
According to the labor force statistics for La Marque, out of the total population over 16 years of age (14,533), 63.0% or 9,156 individuals are in the labor force, with 8.5% or 778 of them unemployed. The age group with the highest labor force participation rate is 25 to 29 years, with 88.0% or 856 individuals in the labor force. Within the labor force, the 20 to 24 years age range has the highest percentage of unemployed individuals, with 29.9% or 300 of them being unemployed.
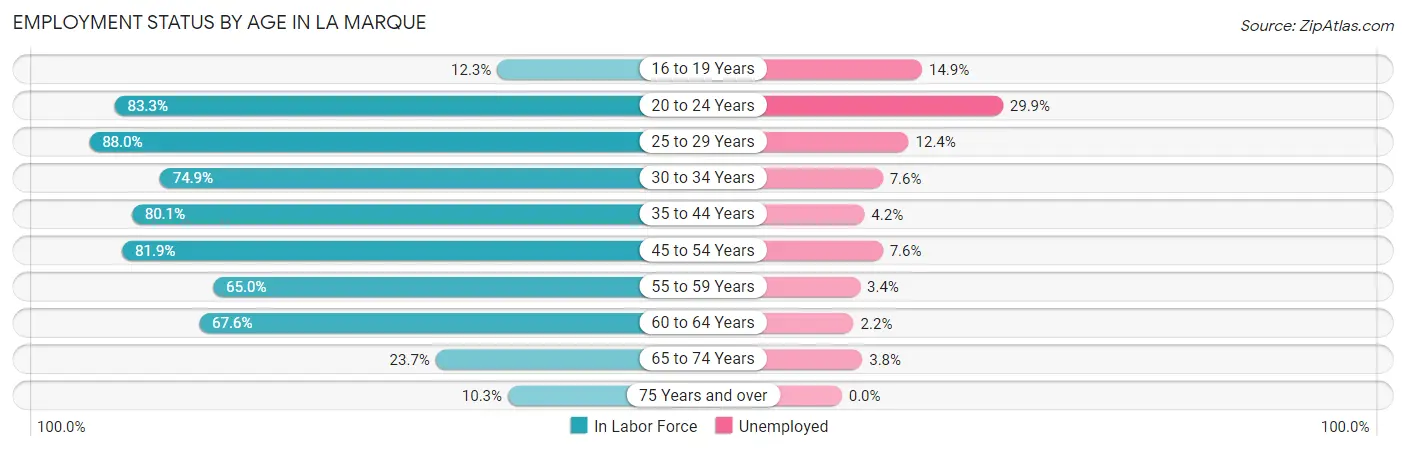
| Age Bracket | In Labor Force | Unemployed |
| 16 to 19 Years | 74 (12.3%) | 11 (14.9%) |
| 20 to 24 Years | 1,002 (83.3%) | 300 (29.9%) |
| 25 to 29 Years | 856 (88.0%) | 106 (12.4%) |
| 30 to 34 Years | 938 (74.9%) | 71 (7.6%) |
| 35 to 44 Years | 2,234 (80.1%) | 94 (4.2%) |
| 45 to 54 Years | 1,762 (81.9%) | 134 (7.6%) |
| 55 to 59 Years | 757 (65.0%) | 26 (3.4%) |
| 60 to 64 Years | 1,013 (67.6%) | 22 (2.2%) |
| 65 to 74 Years | 396 (23.7%) | 15 (3.8%) |
| 75 Years and over | 127 (10.3%) | 0 (0.0%) |
| Total | 9,156 (63.0%) | 778 (8.5%) |
Employment Status by Educational Attainment in La Marque
According to labor force statistics for La Marque, 76.9% of individuals (7,558) out of the total population between 25 and 64 years of age (9,828) are in the labor force, with 6.0% or 453 of them being unemployed. The group with the highest labor force participation rate are those with the educational attainment of bachelor's degree or higher, with 89.1% or 1,860 individuals in the labor force. Within the labor force, individuals with bachelor's degree or higher education have the highest percentage of unemployment, with 9.8% or 182 of them being unemployed.
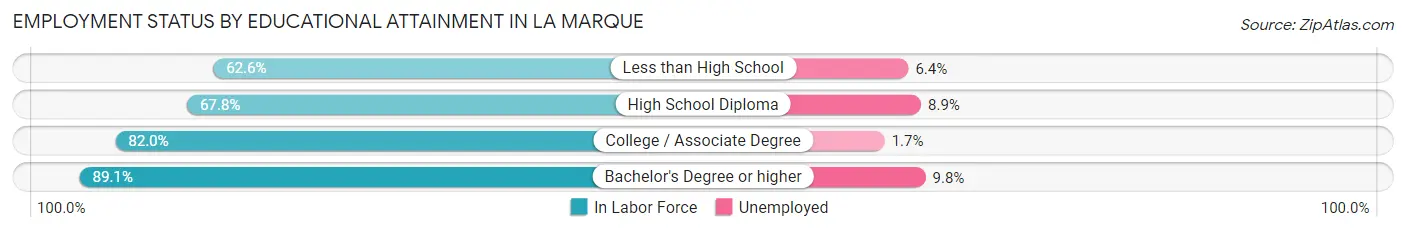
| Educational Attainment | In Labor Force | Unemployed |
| Less than High School | 791 (62.6%) | 81 (6.4%) |
| High School Diploma | 1,920 (67.8%) | 252 (8.9%) |
| College / Associate Degree | 2,989 (82.0%) | 62 (1.7%) |
| Bachelor's Degree or higher | 1,860 (89.1%) | 205 (9.8%) |
| Total | 7,558 (76.9%) | 590 (6.0%) |
Employment Occupations by Sex in La Marque
Management, Business, Science and Arts Occupations
The most common Management, Business, Science and Arts occupations in La Marque are Management (791 | 9.5%), Community & Social Service (768 | 9.2%), Computers, Engineering & Science (553 | 6.6%), Health Diagnosing & Treating (543 | 6.5%), and Education Instruction & Library (502 | 6.0%).
Management, Business, Science and Arts Occupations by Sex
Within the Management, Business, Science and Arts occupations in La Marque, the most male-oriented occupations are Legal Services & Support (100.0%), Architecture & Engineering (85.6%), and Life, Physical & Social Science (73.2%), while the most female-oriented occupations are Health Technologists (100.0%), Health Diagnosing & Treating (86.2%), and Business & Financial (62.5%).
| Occupation | Male | Female |
| Management | 416 (52.6%) | 375 (47.4%) |
| Business & Financial | 150 (37.5%) | 250 (62.5%) |
| Computers, Engineering & Science | 400 (72.3%) | 153 (27.7%) |
| Computers & Mathematics | 150 (58.8%) | 105 (41.2%) |
| Architecture & Engineering | 220 (85.6%) | 37 (14.4%) |
| Life, Physical & Social Science | 30 (73.2%) | 11 (26.8%) |
| Community & Social Service | 348 (45.3%) | 420 (54.7%) |
| Education, Arts & Media | 69 (49.3%) | 71 (50.7%) |
| Legal Services & Support | 40 (100.0%) | 0 (0.0%) |
| Education Instruction & Library | 200 (39.8%) | 302 (60.2%) |
| Arts, Media & Entertainment | 39 (45.4%) | 47 (54.6%) |
| Health Diagnosing & Treating | 75 (13.8%) | 468 (86.2%) |
| Health Technologists | 0 (0.0%) | 281 (100.0%) |
| Total (Category) | 1,389 (45.5%) | 1,666 (54.5%) |
| Total (Overall) | 4,345 (52.0%) | 4,016 (48.0%) |
Services Occupations
The most common Services occupations in La Marque are Healthcare Support (517 | 6.2%), Security & Protection (455 | 5.4%), Cleaning & Maintenance (356 | 4.3%), Food Preparation & Serving (290 | 3.5%), and Firefighting & Prevention (285 | 3.4%).
Services Occupations by Sex
Within the Services occupations in La Marque, the most male-oriented occupations are Firefighting & Prevention (78.6%), Security & Protection (62.4%), and Cleaning & Maintenance (56.7%), while the most female-oriented occupations are Healthcare Support (81.8%), Food Preparation & Serving (74.1%), and Law Enforcement (64.7%).
| Occupation | Male | Female |
| Healthcare Support | 94 (18.2%) | 423 (81.8%) |
| Security & Protection | 284 (62.4%) | 171 (37.6%) |
| Firefighting & Prevention | 224 (78.6%) | 61 (21.4%) |
| Law Enforcement | 60 (35.3%) | 110 (64.7%) |
| Food Preparation & Serving | 75 (25.9%) | 215 (74.1%) |
| Cleaning & Maintenance | 202 (56.7%) | 154 (43.3%) |
| Personal Care & Service | 83 (53.2%) | 73 (46.8%) |
| Total (Category) | 738 (41.6%) | 1,036 (58.4%) |
| Total (Overall) | 4,345 (52.0%) | 4,016 (48.0%) |
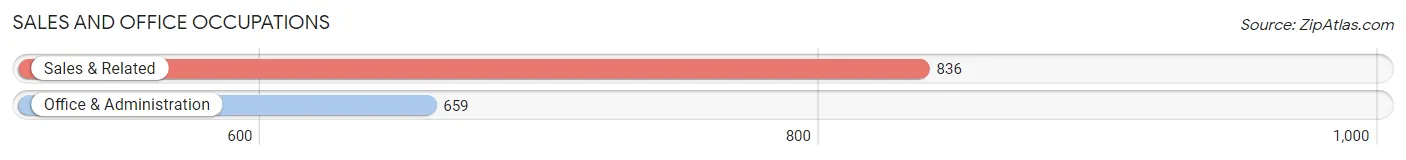
Sales and Office Occupations
The most common Sales and Office occupations in La Marque are Sales & Related (836 | 10.0%), and Office & Administration (659 | 7.9%).
Sales and Office Occupations by Sex
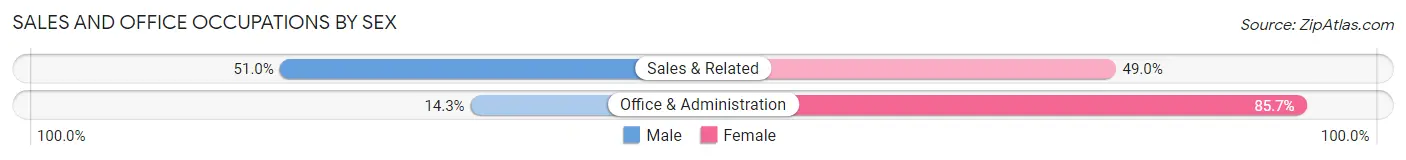
| Occupation | Male | Female |
| Sales & Related | 426 (51.0%) | 410 (49.0%) |
| Office & Administration | 94 (14.3%) | 565 (85.7%) |
| Total (Category) | 520 (34.8%) | 975 (65.2%) |
| Total (Overall) | 4,345 (52.0%) | 4,016 (48.0%) |
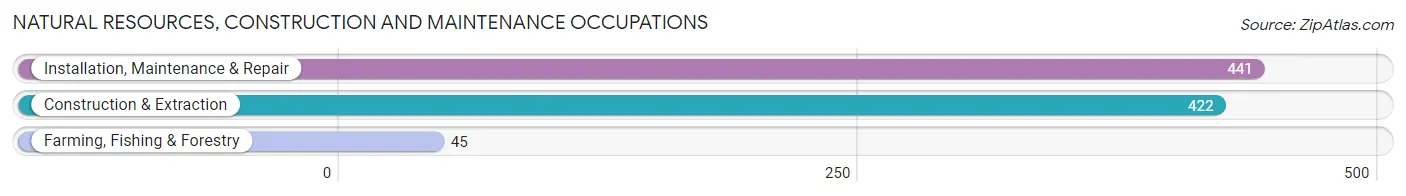
Natural Resources, Construction and Maintenance Occupations
The most common Natural Resources, Construction and Maintenance occupations in La Marque are Installation, Maintenance & Repair (441 | 5.3%), Construction & Extraction (422 | 5.1%), and Farming, Fishing & Forestry (45 | 0.5%).
Natural Resources, Construction and Maintenance Occupations by Sex
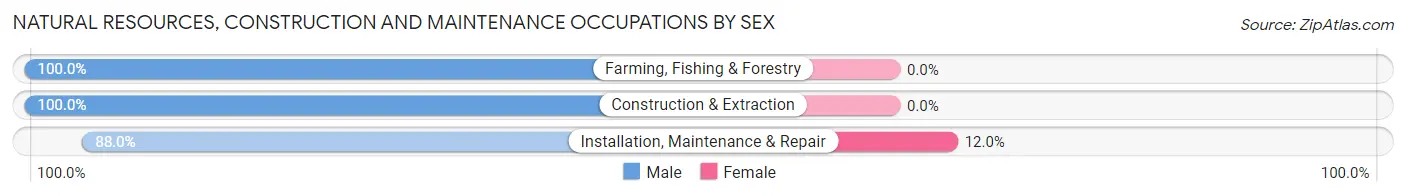
| Occupation | Male | Female |
| Farming, Fishing & Forestry | 45 (100.0%) | 0 (0.0%) |
| Construction & Extraction | 422 (100.0%) | 0 (0.0%) |
| Installation, Maintenance & Repair | 388 (88.0%) | 53 (12.0%) |
| Total (Category) | 855 (94.2%) | 53 (5.8%) |
| Total (Overall) | 4,345 (52.0%) | 4,016 (48.0%) |
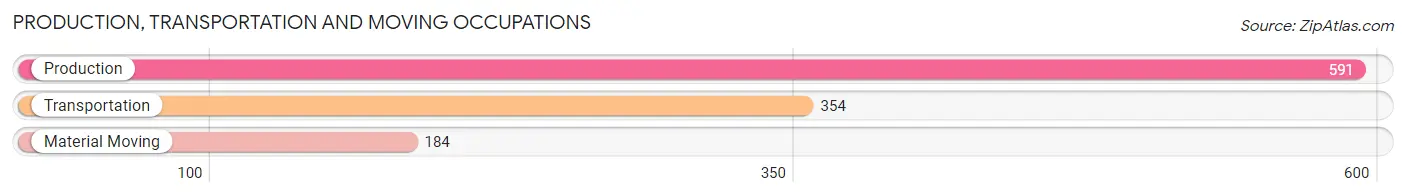
Production, Transportation and Moving Occupations
The most common Production, Transportation and Moving occupations in La Marque are Production (591 | 7.1%), Transportation (354 | 4.2%), and Material Moving (184 | 2.2%).
Production, Transportation and Moving Occupations by Sex
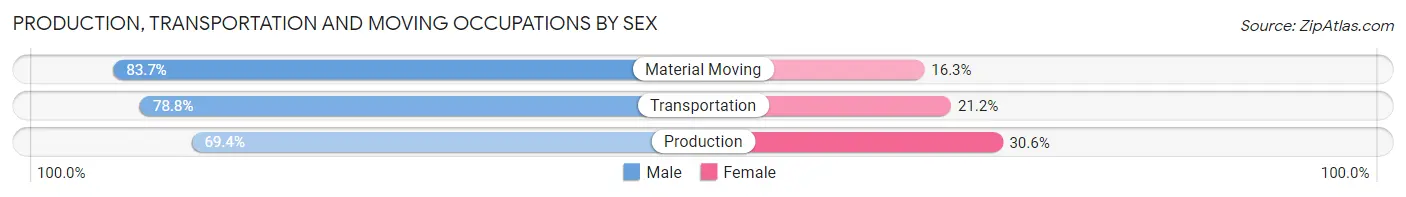
| Occupation | Male | Female |
| Production | 410 (69.4%) | 181 (30.6%) |
| Transportation | 279 (78.8%) | 75 (21.2%) |
| Material Moving | 154 (83.7%) | 30 (16.3%) |
| Total (Category) | 843 (74.7%) | 286 (25.3%) |
| Total (Overall) | 4,345 (52.0%) | 4,016 (48.0%) |
Employment Industries by Sex in La Marque
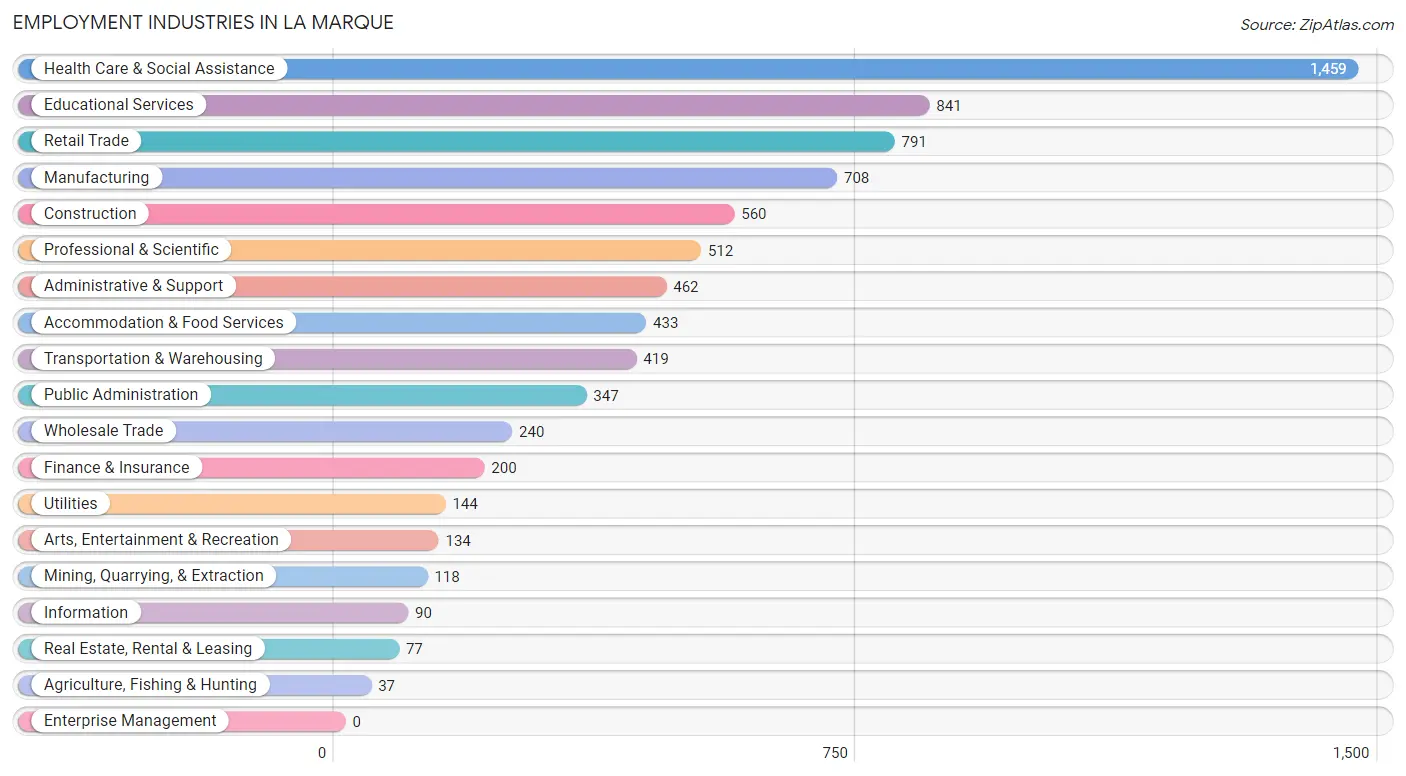
Employment Industries in La Marque
The major employment industries in La Marque include Health Care & Social Assistance (1,459 | 17.4%), Educational Services (841 | 10.1%), Retail Trade (791 | 9.5%), Manufacturing (708 | 8.5%), and Construction (560 | 6.7%).
Employment Industries by Sex in La Marque
The La Marque industries that see more men than women are Agriculture, Fishing & Hunting (100.0%), Mining, Quarrying, & Extraction (100.0%), and Utilities (95.1%), whereas the industries that tend to have a higher number of women are Health Care & Social Assistance (77.3%), Finance & Insurance (76.0%), and Educational Services (69.8%).
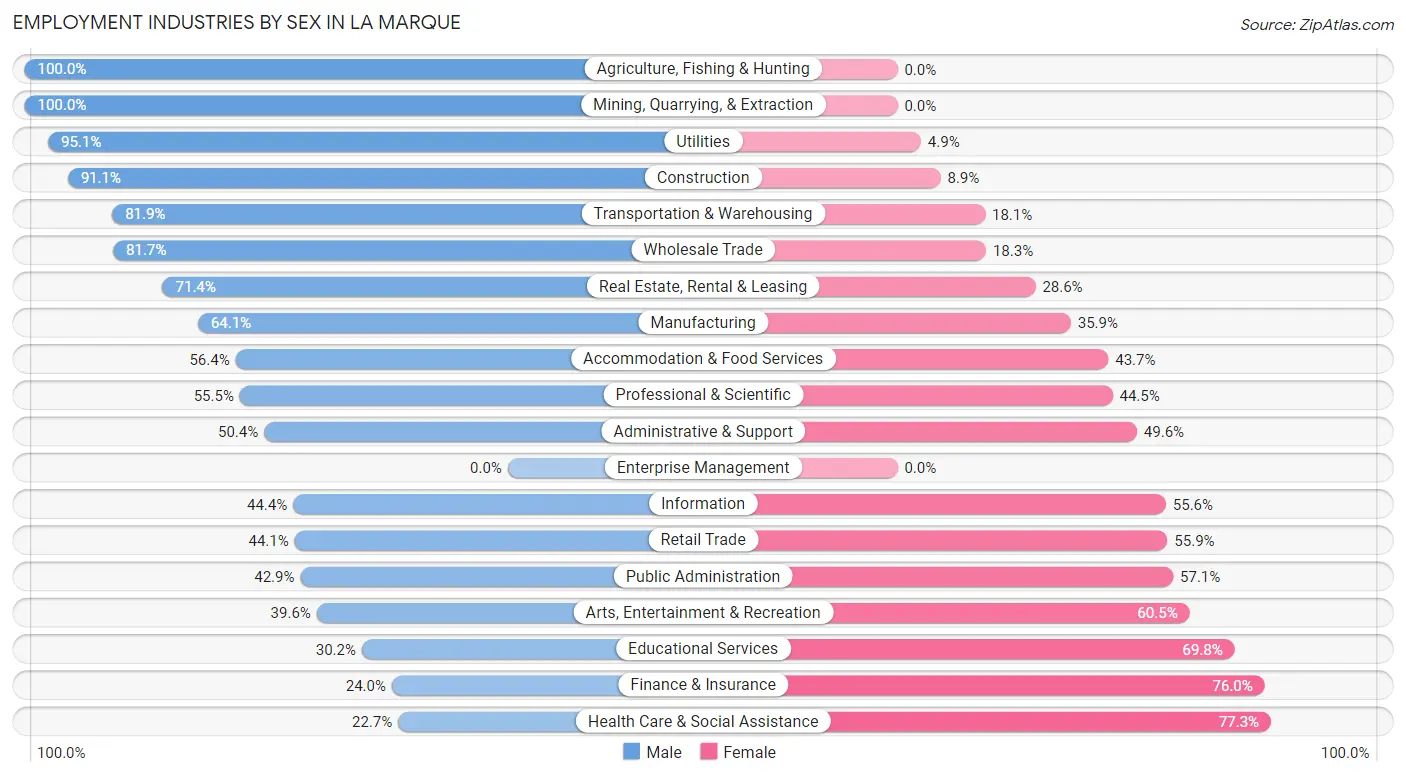
| Industry | Male | Female |
| Agriculture, Fishing & Hunting | 37 (100.0%) | 0 (0.0%) |
| Mining, Quarrying, & Extraction | 118 (100.0%) | 0 (0.0%) |
| Construction | 510 (91.1%) | 50 (8.9%) |
| Manufacturing | 454 (64.1%) | 254 (35.9%) |
| Wholesale Trade | 196 (81.7%) | 44 (18.3%) |
| Retail Trade | 349 (44.1%) | 442 (55.9%) |
| Transportation & Warehousing | 343 (81.9%) | 76 (18.1%) |
| Utilities | 137 (95.1%) | 7 (4.9%) |
| Information | 40 (44.4%) | 50 (55.6%) |
| Finance & Insurance | 48 (24.0%) | 152 (76.0%) |
| Real Estate, Rental & Leasing | 55 (71.4%) | 22 (28.6%) |
| Professional & Scientific | 284 (55.5%) | 228 (44.5%) |
| Enterprise Management | 0 (0.0%) | 0 (0.0%) |
| Administrative & Support | 233 (50.4%) | 229 (49.6%) |
| Educational Services | 254 (30.2%) | 587 (69.8%) |
| Health Care & Social Assistance | 331 (22.7%) | 1,128 (77.3%) |
| Arts, Entertainment & Recreation | 53 (39.6%) | 81 (60.5%) |
| Accommodation & Food Services | 244 (56.4%) | 189 (43.6%) |
| Public Administration | 149 (42.9%) | 198 (57.1%) |
| Total | 4,345 (52.0%) | 4,016 (48.0%) |
Education in La Marque
School Enrollment in La Marque
The most common levels of schooling among the 4,079 students in La Marque are elementary school (1,301 | 31.9%), middle school (951 | 23.3%), and college / undergraduate (662 | 16.2%).
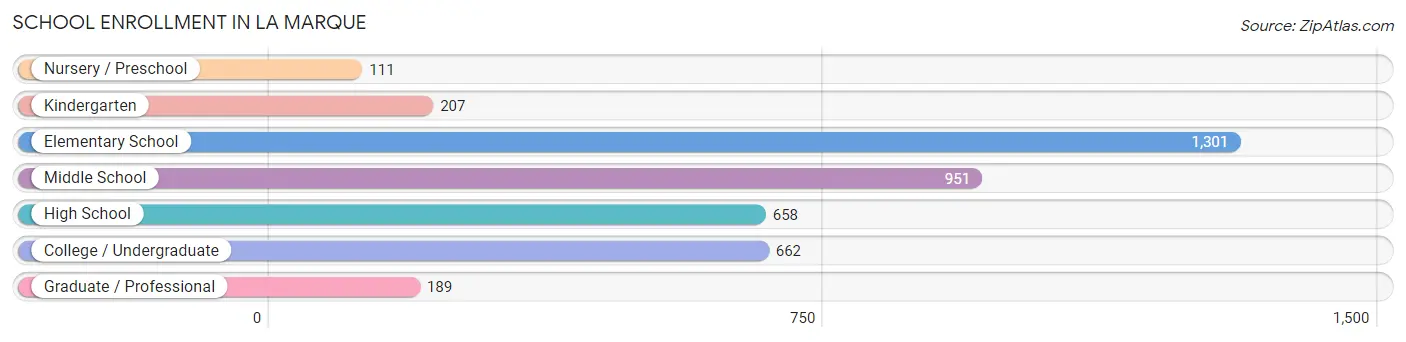
| School Level | # Students | % Students |
| Nursery / Preschool | 111 | 2.7% |
| Kindergarten | 207 | 5.1% |
| Elementary School | 1,301 | 31.9% |
| Middle School | 951 | 23.3% |
| High School | 658 | 16.1% |
| College / Undergraduate | 662 | 16.2% |
| Graduate / Professional | 189 | 4.6% |
| Total | 4,079 | 100.0% |
School Enrollment by Age by Funding Source in La Marque
Out of a total of 4,079 students who are enrolled in schools in La Marque, 514 (12.6%) attend a private institution, while the remaining 3,565 (87.4%) are enrolled in public schools. The age group of 35 years and over has the highest likelihood of being enrolled in private schools, with 105 (37.9% in the age bracket) enrolled. Conversely, the age group of 18 to 19 year olds has the lowest likelihood of being enrolled in a private school, with 172 (100.0% in the age bracket) attending a public institution.
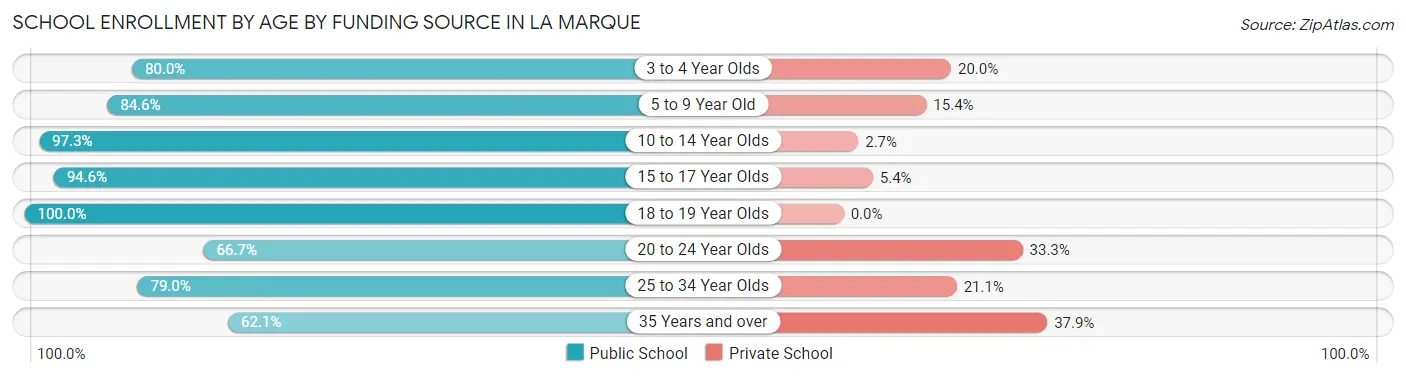
| Age Bracket | Public School | Private School |
| 3 to 4 Year Olds | 28 (80.0%) | 7 (20.0%) |
| 5 to 9 Year Old | 950 (84.6%) | 173 (15.4%) |
| 10 to 14 Year Olds | 1,432 (97.3%) | 40 (2.7%) |
| 15 to 17 Year Olds | 453 (94.6%) | 26 (5.4%) |
| 18 to 19 Year Olds | 172 (100.0%) | 0 (0.0%) |
| 20 to 24 Year Olds | 284 (66.7%) | 142 (33.3%) |
| 25 to 34 Year Olds | 75 (78.9%) | 20 (21.0%) |
| 35 Years and over | 172 (62.1%) | 105 (37.9%) |
| Total | 3,565 (87.4%) | 514 (12.6%) |
Educational Attainment by Field of Study in La Marque
Education (349 | 12.5%), psychology (320 | 11.4%), arts & humanities (308 | 11.0%), business (298 | 10.6%), and science & technology (295 | 10.5%) are the most common fields of study among 2,799 individuals in La Marque who have obtained a bachelor's degree or higher.
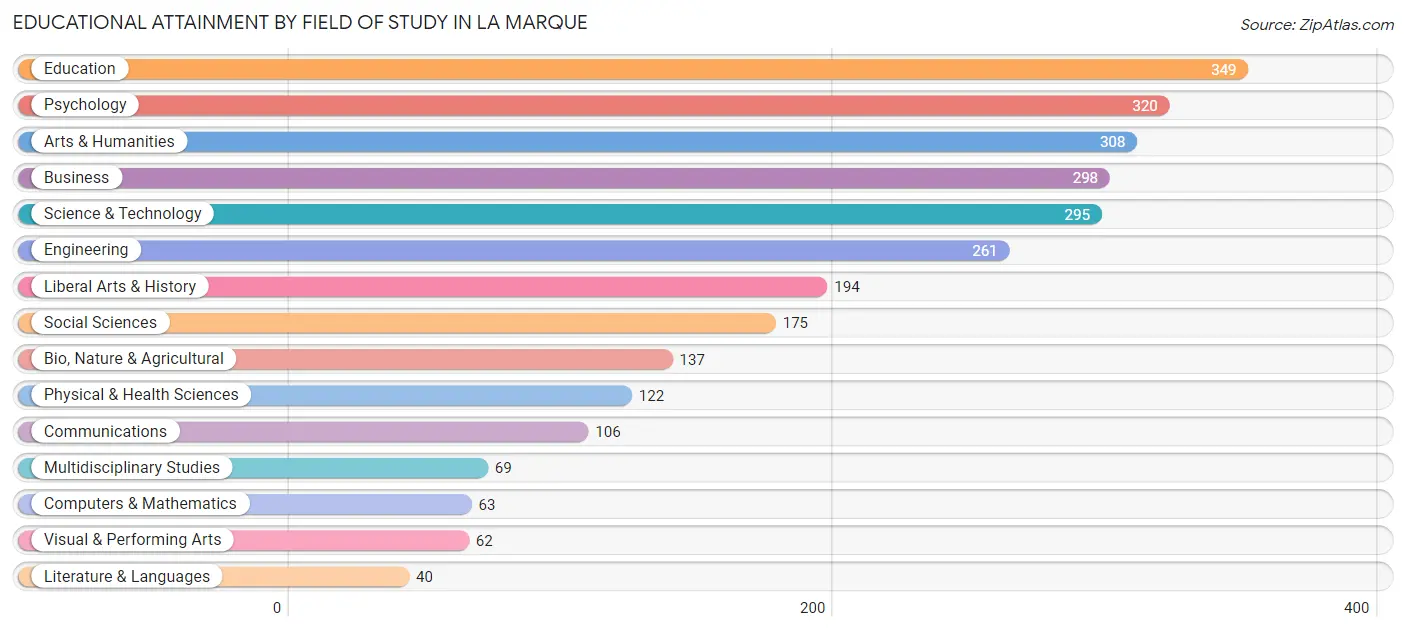
| Field of Study | # Graduates | % Graduates |
| Computers & Mathematics | 63 | 2.2% |
| Bio, Nature & Agricultural | 137 | 4.9% |
| Physical & Health Sciences | 122 | 4.4% |
| Psychology | 320 | 11.4% |
| Social Sciences | 175 | 6.2% |
| Engineering | 261 | 9.3% |
| Multidisciplinary Studies | 69 | 2.5% |
| Science & Technology | 295 | 10.5% |
| Business | 298 | 10.6% |
| Education | 349 | 12.5% |
| Literature & Languages | 40 | 1.4% |
| Liberal Arts & History | 194 | 6.9% |
| Visual & Performing Arts | 62 | 2.2% |
| Communications | 106 | 3.8% |
| Arts & Humanities | 308 | 11.0% |
| Total | 2,799 | 100.0% |
Transportation & Commute in La Marque
Vehicle Availability by Sex in La Marque
The most prevalent vehicle ownership categories in La Marque are males with 2 vehicles (2,378, accounting for 55.0%) and females with 2 vehicles (1,748, making up 61.0%).
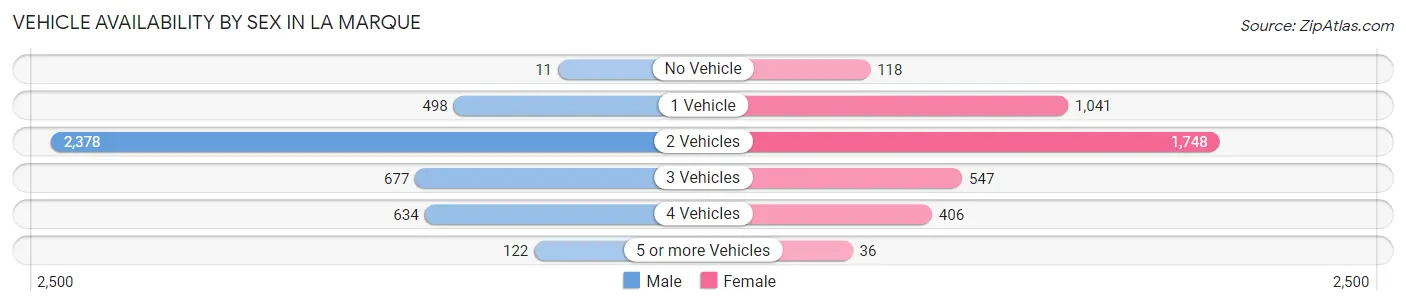
| Vehicles Available | Male | Female |
| No Vehicle | 11 (0.3%) | 118 (3.0%) |
| 1 Vehicle | 498 (11.5%) | 1,041 (26.7%) |
| 2 Vehicles | 2,378 (55.0%) | 1,748 (44.9%) |
| 3 Vehicles | 677 (15.7%) | 547 (14.0%) |
| 4 Vehicles | 634 (14.7%) | 406 (10.4%) |
| 5 or more Vehicles | 122 (2.8%) | 36 (0.9%) |
| Total | 4,320 (100.0%) | 3,896 (100.0%) |
Commute Time in La Marque
The most frequently occuring commute durations in La Marque are 30 to 34 minutes (1,478 commuters, 19.1%), 15 to 19 minutes (1,180 commuters, 15.2%), and 20 to 24 minutes (944 commuters, 12.2%).
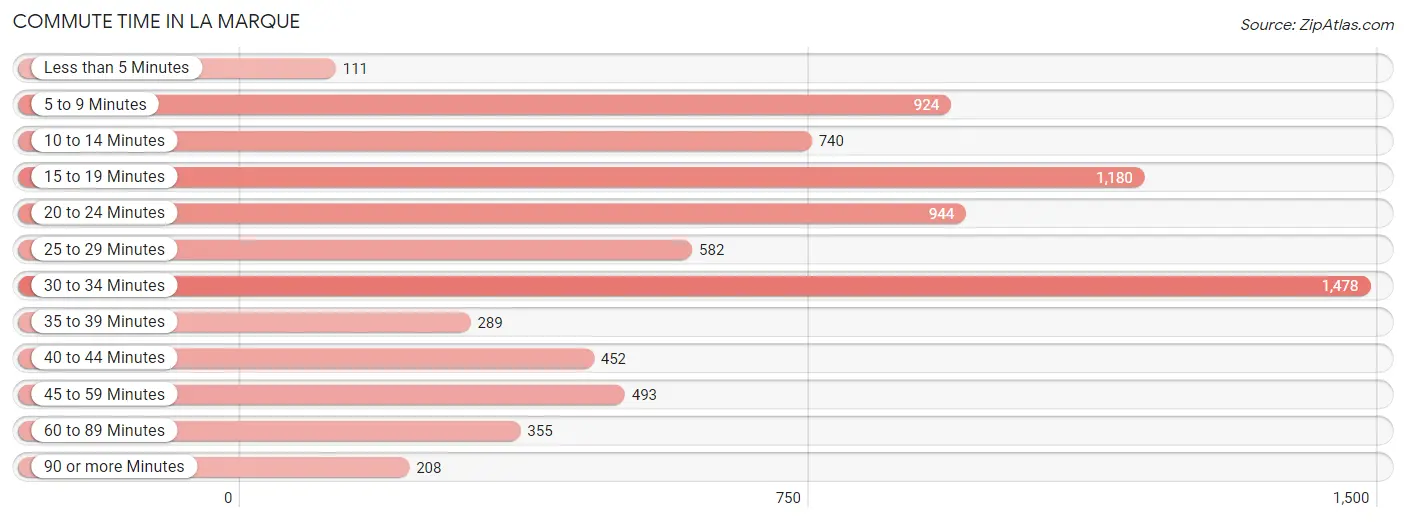
| Commute Time | # Commuters | % Commuters |
| Less than 5 Minutes | 111 | 1.4% |
| 5 to 9 Minutes | 924 | 11.9% |
| 10 to 14 Minutes | 740 | 9.5% |
| 15 to 19 Minutes | 1,180 | 15.2% |
| 20 to 24 Minutes | 944 | 12.2% |
| 25 to 29 Minutes | 582 | 7.5% |
| 30 to 34 Minutes | 1,478 | 19.1% |
| 35 to 39 Minutes | 289 | 3.7% |
| 40 to 44 Minutes | 452 | 5.8% |
| 45 to 59 Minutes | 493 | 6.4% |
| 60 to 89 Minutes | 355 | 4.6% |
| 90 or more Minutes | 208 | 2.7% |
Commute Time by Sex in La Marque
The most common commute times in La Marque are 20 to 24 minutes (731 commuters, 17.7%) for males and 30 to 34 minutes (798 commuters, 22.0%) for females.
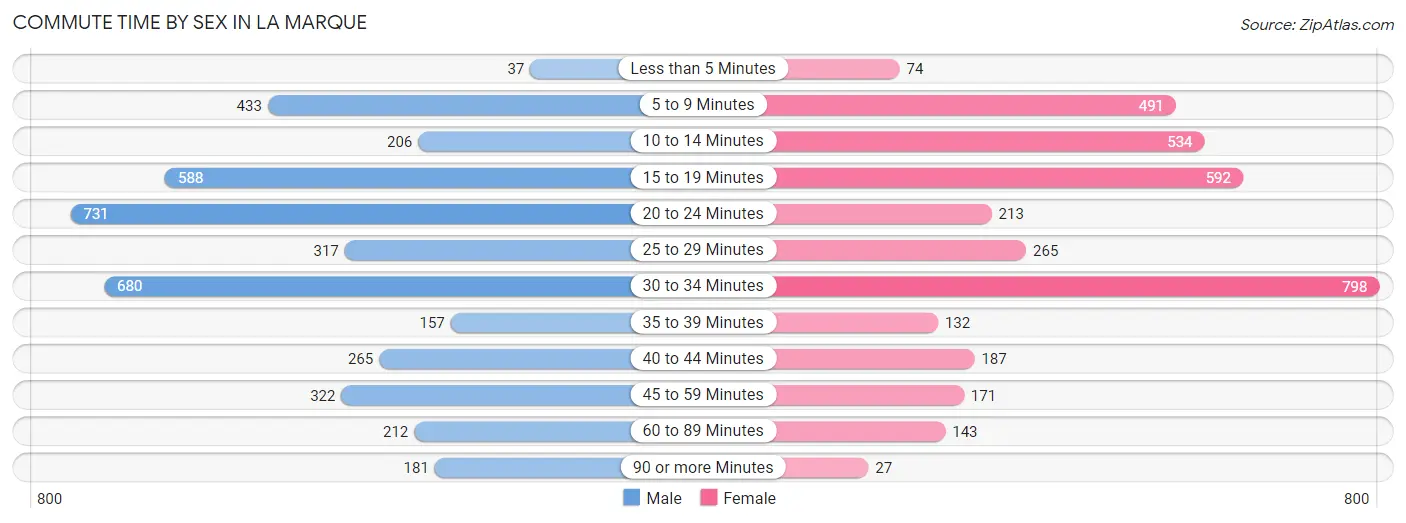
| Commute Time | Male | Female |
| Less than 5 Minutes | 37 (0.9%) | 74 (2.0%) |
| 5 to 9 Minutes | 433 (10.5%) | 491 (13.5%) |
| 10 to 14 Minutes | 206 (5.0%) | 534 (14.7%) |
| 15 to 19 Minutes | 588 (14.2%) | 592 (16.3%) |
| 20 to 24 Minutes | 731 (17.7%) | 213 (5.9%) |
| 25 to 29 Minutes | 317 (7.7%) | 265 (7.3%) |
| 30 to 34 Minutes | 680 (16.5%) | 798 (22.0%) |
| 35 to 39 Minutes | 157 (3.8%) | 132 (3.6%) |
| 40 to 44 Minutes | 265 (6.4%) | 187 (5.2%) |
| 45 to 59 Minutes | 322 (7.8%) | 171 (4.7%) |
| 60 to 89 Minutes | 212 (5.1%) | 143 (3.9%) |
| 90 or more Minutes | 181 (4.4%) | 27 (0.7%) |
Time of Departure to Work by Sex in La Marque
The most frequent times of departure to work in La Marque are 6:00 AM to 6:29 AM (633, 15.3%) for males and 8:00 AM to 8:29 AM (510, 14.1%) for females.
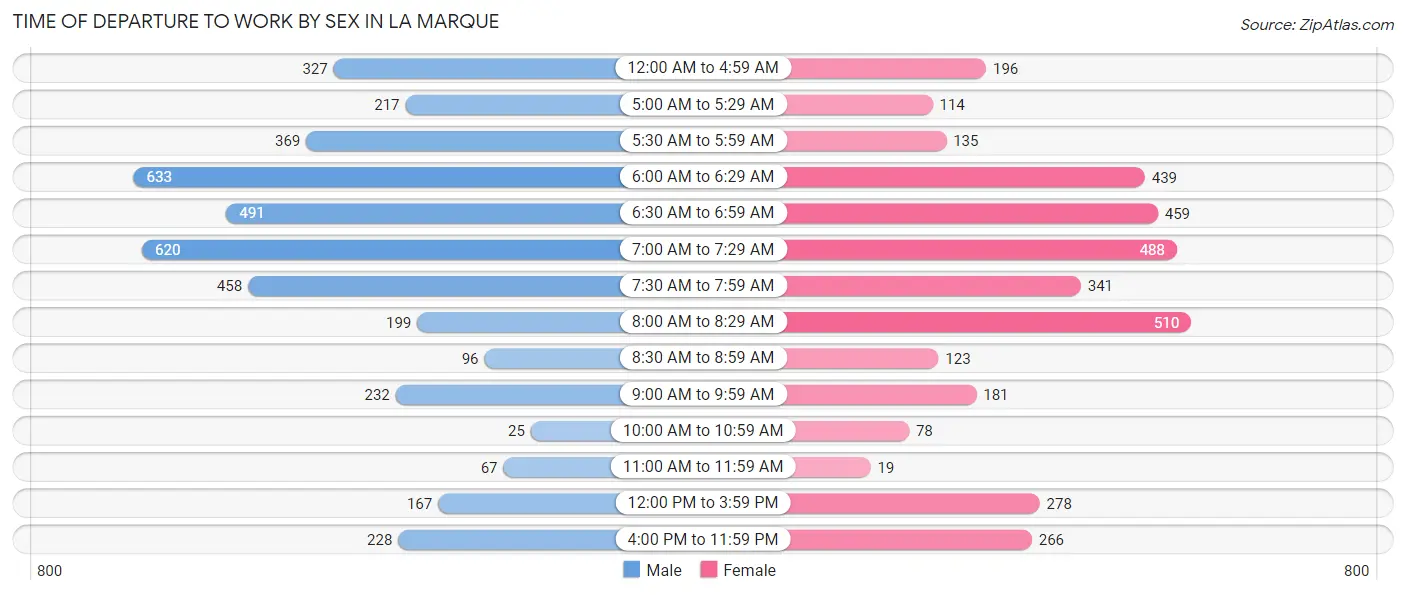
| Time of Departure | Male | Female |
| 12:00 AM to 4:59 AM | 327 (7.9%) | 196 (5.4%) |
| 5:00 AM to 5:29 AM | 217 (5.3%) | 114 (3.1%) |
| 5:30 AM to 5:59 AM | 369 (8.9%) | 135 (3.7%) |
| 6:00 AM to 6:29 AM | 633 (15.3%) | 439 (12.1%) |
| 6:30 AM to 6:59 AM | 491 (11.9%) | 459 (12.7%) |
| 7:00 AM to 7:29 AM | 620 (15.0%) | 488 (13.5%) |
| 7:30 AM to 7:59 AM | 458 (11.1%) | 341 (9.4%) |
| 8:00 AM to 8:29 AM | 199 (4.8%) | 510 (14.1%) |
| 8:30 AM to 8:59 AM | 96 (2.3%) | 123 (3.4%) |
| 9:00 AM to 9:59 AM | 232 (5.6%) | 181 (5.0%) |
| 10:00 AM to 10:59 AM | 25 (0.6%) | 78 (2.1%) |
| 11:00 AM to 11:59 AM | 67 (1.6%) | 19 (0.5%) |
| 12:00 PM to 3:59 PM | 167 (4.0%) | 278 (7.7%) |
| 4:00 PM to 11:59 PM | 228 (5.5%) | 266 (7.3%) |
| Total | 4,129 (100.0%) | 3,627 (100.0%) |
Housing Occupancy in La Marque
Occupancy by Ownership in La Marque
Of the total 7,043 dwellings in La Marque, owner-occupied units account for 5,243 (74.4%), while renter-occupied units make up 1,800 (25.6%).
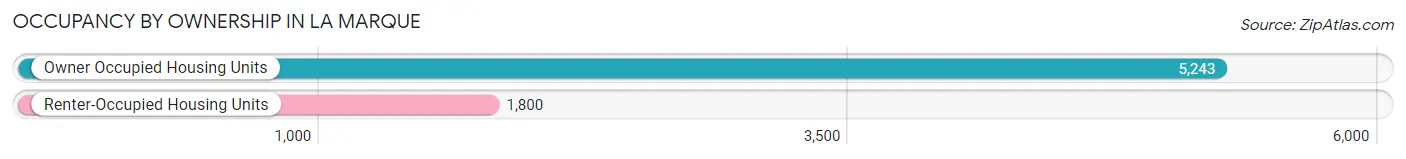
| Occupancy | # Housing Units | % Housing Units |
| Owner Occupied Housing Units | 5,243 | 74.4% |
| Renter-Occupied Housing Units | 1,800 | 25.6% |
| Total Occupied Housing Units | 7,043 | 100.0% |
Occupancy by Household Size in La Marque
| Household Size | # Housing Units | % Housing Units |
| 1-Person Household | 2,003 | 28.4% |
| 2-Person Household | 2,054 | 29.2% |
| 3-Person Household | 1,256 | 17.8% |
| 4+ Person Household | 1,730 | 24.6% |
| Total Housing Units | 7,043 | 100.0% |
Occupancy by Ownership by Household Size in La Marque
| Household Size | Owner-occupied | Renter-occupied |
| 1-Person Household | 1,374 (68.6%) | 629 (31.4%) |
| 2-Person Household | 1,535 (74.7%) | 519 (25.3%) |
| 3-Person Household | 984 (78.3%) | 272 (21.7%) |
| 4+ Person Household | 1,350 (78.0%) | 380 (22.0%) |
| Total Housing Units | 5,243 (74.4%) | 1,800 (25.6%) |
Occupancy by Educational Attainment in La Marque
| Household Size | Owner-occupied | Renter-occupied |
| Less than High School | 437 (51.5%) | 411 (48.5%) |
| High School Diploma | 1,540 (81.5%) | 349 (18.5%) |
| College/Associate Degree | 2,060 (74.9%) | 689 (25.1%) |
| Bachelor's Degree or higher | 1,206 (77.5%) | 351 (22.5%) |
Occupancy by Age of Householder in La Marque
| Age Bracket | # Households | % Households |
| Under 35 Years | 1,116 | 15.9% |
| 35 to 44 Years | 1,232 | 17.5% |
| 45 to 54 Years | 1,293 | 18.4% |
| 55 to 64 Years | 1,539 | 21.8% |
| 65 to 74 Years | 983 | 14.0% |
| 75 to 84 Years | 649 | 9.2% |
| 85 Years and Over | 231 | 3.3% |
| Total | 7,043 | 100.0% |
Housing Finances in La Marque
Median Income by Occupancy in La Marque
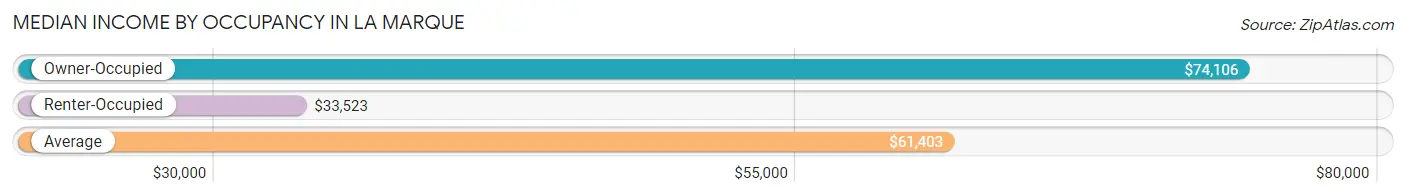
| Occupancy Type | # Households | Median Income |
| Owner-Occupied | 5,243 (74.4%) | $74,106 |
| Renter-Occupied | 1,800 (25.6%) | $33,523 |
| Average | 7,043 (100.0%) | $61,403 |
Occupancy by Householder Income Bracket in La Marque
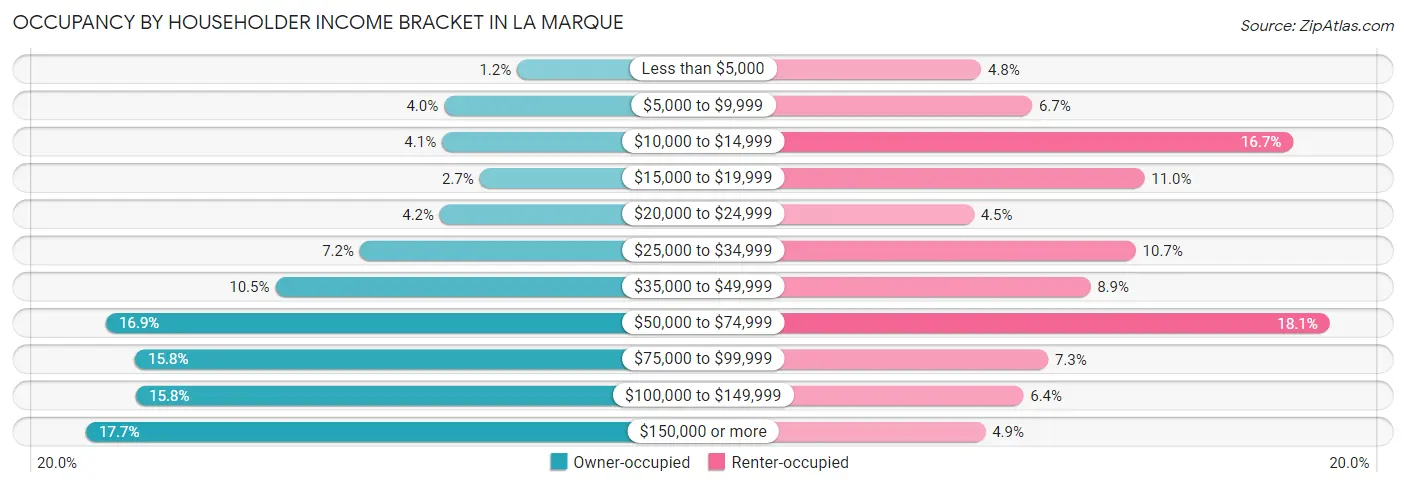
| Income Bracket | Owner-occupied | Renter-occupied |
| Less than $5,000 | 65 (1.2%) | 86 (4.8%) |
| $5,000 to $9,999 | 211 (4.0%) | 121 (6.7%) |
| $10,000 to $14,999 | 215 (4.1%) | 300 (16.7%) |
| $15,000 to $19,999 | 140 (2.7%) | 198 (11.0%) |
| $20,000 to $24,999 | 219 (4.2%) | 81 (4.5%) |
| $25,000 to $34,999 | 379 (7.2%) | 192 (10.7%) |
| $35,000 to $49,999 | 548 (10.4%) | 161 (8.9%) |
| $50,000 to $74,999 | 886 (16.9%) | 325 (18.1%) |
| $75,000 to $99,999 | 828 (15.8%) | 132 (7.3%) |
| $100,000 to $149,999 | 826 (15.8%) | 115 (6.4%) |
| $150,000 or more | 926 (17.7%) | 89 (4.9%) |
| Total | 5,243 (100.0%) | 1,800 (100.0%) |
Monthly Housing Cost Tiers in La Marque
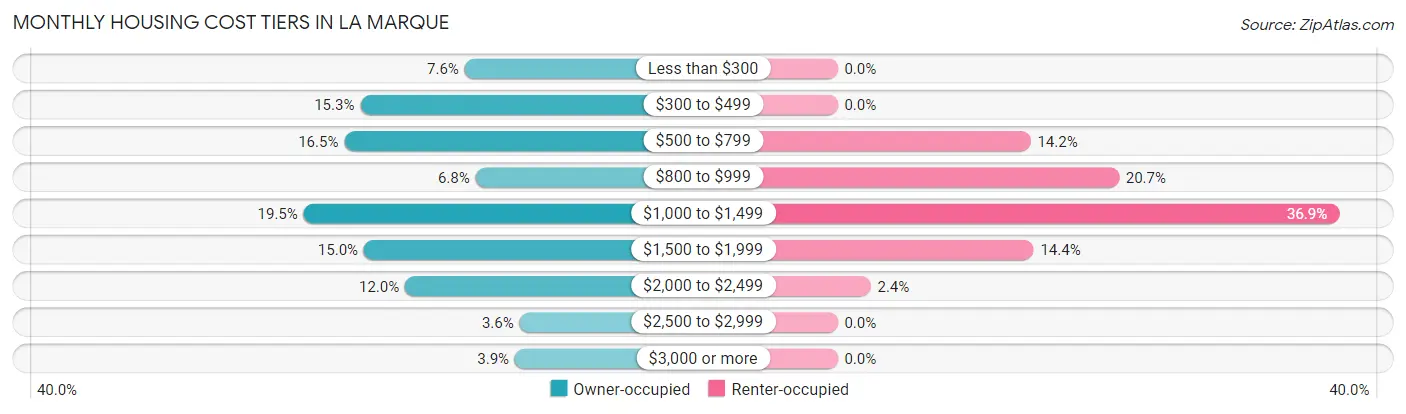
| Monthly Cost | Owner-occupied | Renter-occupied |
| Less than $300 | 398 (7.6%) | 0 (0.0%) |
| $300 to $499 | 801 (15.3%) | 0 (0.0%) |
| $500 to $799 | 863 (16.5%) | 256 (14.2%) |
| $800 to $999 | 356 (6.8%) | 373 (20.7%) |
| $1,000 to $1,499 | 1,020 (19.5%) | 665 (36.9%) |
| $1,500 to $1,999 | 787 (15.0%) | 260 (14.4%) |
| $2,000 to $2,499 | 628 (12.0%) | 44 (2.4%) |
| $2,500 to $2,999 | 186 (3.5%) | 0 (0.0%) |
| $3,000 or more | 204 (3.9%) | 0 (0.0%) |
| Total | 5,243 (100.0%) | 1,800 (100.0%) |
Physical Housing Characteristics in La Marque
Housing Structures in La Marque
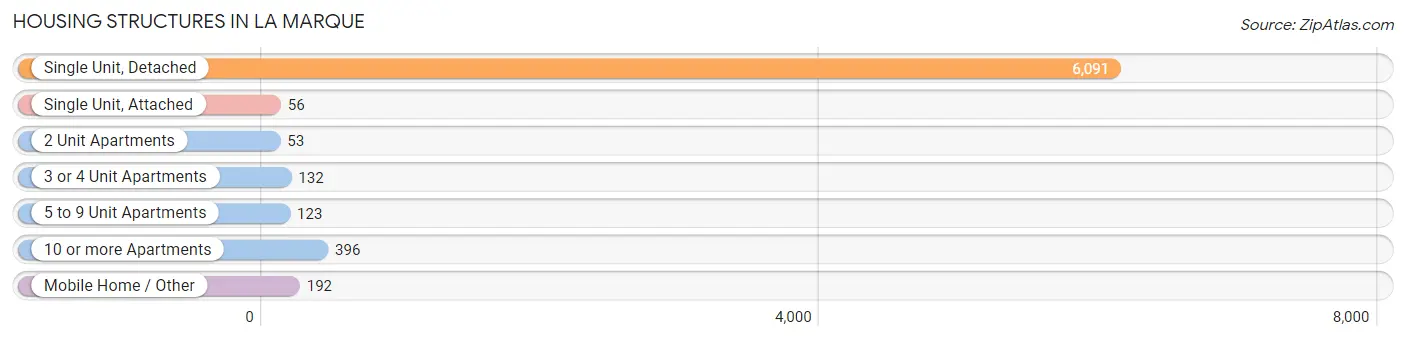
| Structure Type | # Housing Units | % Housing Units |
| Single Unit, Detached | 6,091 | 86.5% |
| Single Unit, Attached | 56 | 0.8% |
| 2 Unit Apartments | 53 | 0.7% |
| 3 or 4 Unit Apartments | 132 | 1.9% |
| 5 to 9 Unit Apartments | 123 | 1.8% |
| 10 or more Apartments | 396 | 5.6% |
| Mobile Home / Other | 192 | 2.7% |
| Total | 7,043 | 100.0% |
Housing Structures by Occupancy in La Marque
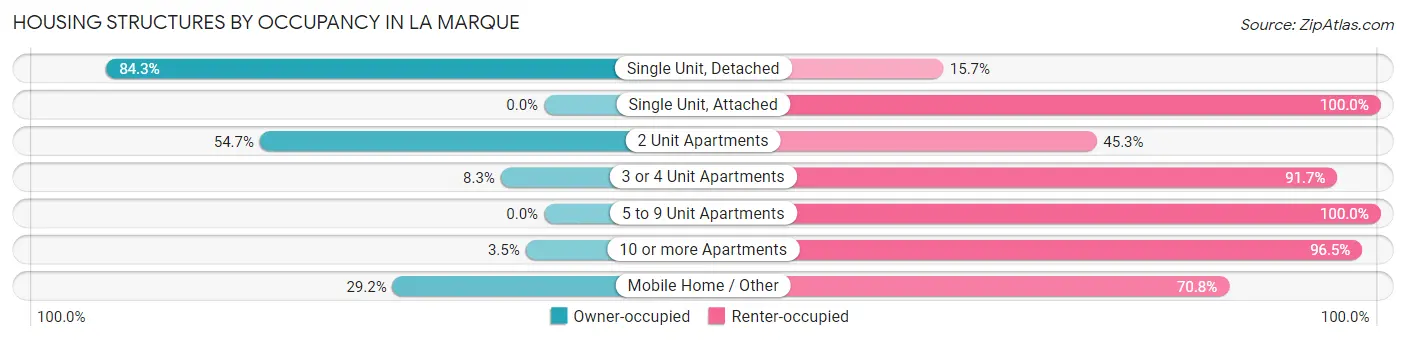
| Structure Type | Owner-occupied | Renter-occupied |
| Single Unit, Detached | 5,133 (84.3%) | 958 (15.7%) |
| Single Unit, Attached | 0 (0.0%) | 56 (100.0%) |
| 2 Unit Apartments | 29 (54.7%) | 24 (45.3%) |
| 3 or 4 Unit Apartments | 11 (8.3%) | 121 (91.7%) |
| 5 to 9 Unit Apartments | 0 (0.0%) | 123 (100.0%) |
| 10 or more Apartments | 14 (3.5%) | 382 (96.5%) |
| Mobile Home / Other | 56 (29.2%) | 136 (70.8%) |
| Total | 5,243 (74.4%) | 1,800 (25.6%) |
Housing Structures by Number of Rooms in La Marque
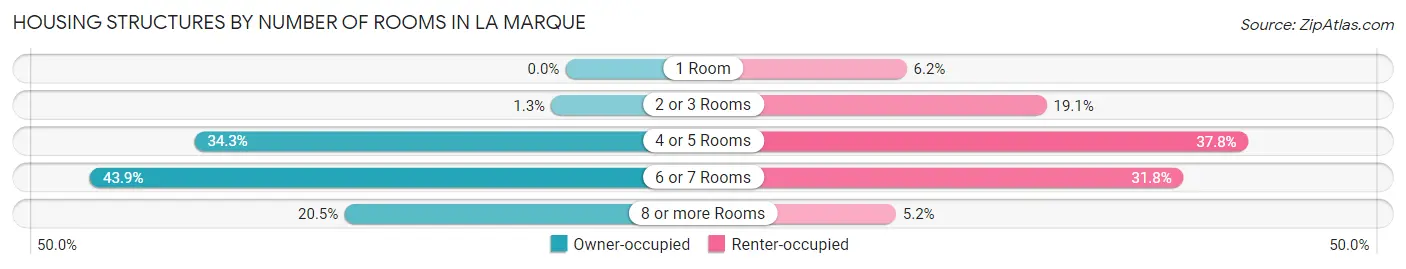
| Number of Rooms | Owner-occupied | Renter-occupied |
| 1 Room | 0 (0.0%) | 111 (6.2%) |
| 2 or 3 Rooms | 69 (1.3%) | 344 (19.1%) |
| 4 or 5 Rooms | 1,798 (34.3%) | 680 (37.8%) |
| 6 or 7 Rooms | 2,304 (43.9%) | 572 (31.8%) |
| 8 or more Rooms | 1,072 (20.4%) | 93 (5.2%) |
| Total | 5,243 (100.0%) | 1,800 (100.0%) |
Housing Structure by Heating Type in La Marque

| Heating Type | Owner-occupied | Renter-occupied |
| Utility Gas | 3,344 (63.8%) | 546 (30.3%) |
| Bottled, Tank, or LP Gas | 45 (0.9%) | 32 (1.8%) |
| Electricity | 1,769 (33.7%) | 1,196 (66.4%) |
| Fuel Oil or Kerosene | 0 (0.0%) | 0 (0.0%) |
| Coal or Coke | 0 (0.0%) | 0 (0.0%) |
| All other Fuels | 63 (1.2%) | 0 (0.0%) |
| No Fuel Used | 22 (0.4%) | 26 (1.4%) |
| Total | 5,243 (100.0%) | 1,800 (100.0%) |
Household Vehicle Usage in La Marque
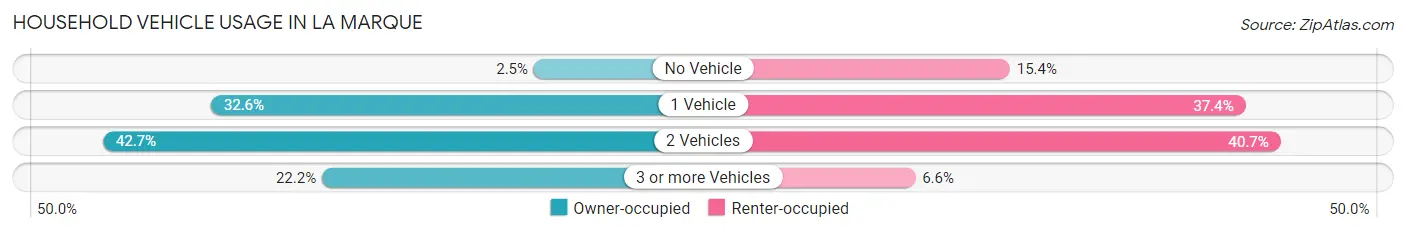
| Vehicles per Household | Owner-occupied | Renter-occupied |
| No Vehicle | 129 (2.5%) | 277 (15.4%) |
| 1 Vehicle | 1,710 (32.6%) | 673 (37.4%) |
| 2 Vehicles | 2,238 (42.7%) | 732 (40.7%) |
| 3 or more Vehicles | 1,166 (22.2%) | 118 (6.6%) |
| Total | 5,243 (100.0%) | 1,800 (100.0%) |
Real Estate & Mortgages in La Marque
Real Estate and Mortgage Overview in La Marque
| Characteristic | Without Mortgage | With Mortgage |
| Housing Units | 2,174 | 3,069 |
| Median Property Value | $130,800 | $195,600 |
| Median Household Income | $54,492 | $656 |
| Monthly Housing Costs | $480 | $204 |
| Real Estate Taxes | $1,383 | $135 |
Property Value by Mortgage Status in La Marque
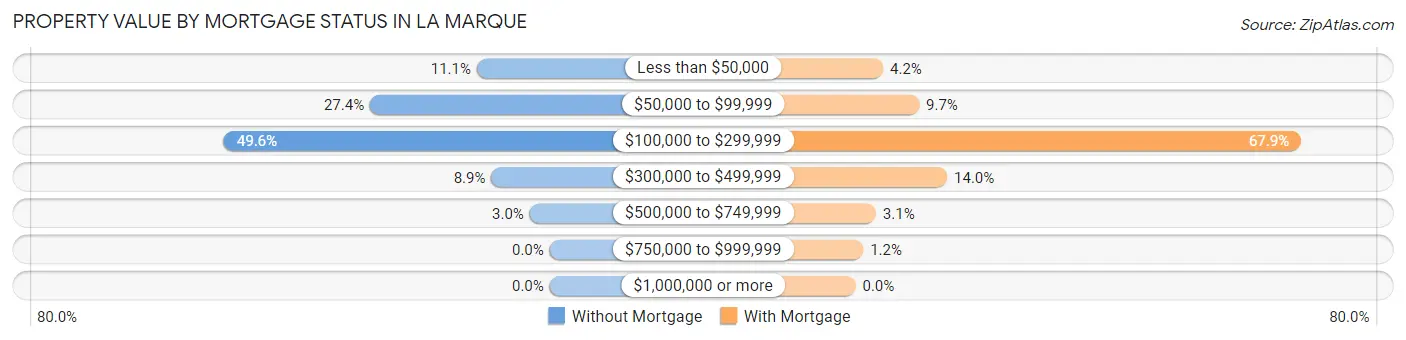
| Property Value | Without Mortgage | With Mortgage |
| Less than $50,000 | 241 (11.1%) | 129 (4.2%) |
| $50,000 to $99,999 | 595 (27.4%) | 297 (9.7%) |
| $100,000 to $299,999 | 1,079 (49.6%) | 2,084 (67.9%) |
| $300,000 to $499,999 | 193 (8.9%) | 428 (14.0%) |
| $500,000 to $749,999 | 66 (3.0%) | 95 (3.1%) |
| $750,000 to $999,999 | 0 (0.0%) | 36 (1.2%) |
| $1,000,000 or more | 0 (0.0%) | 0 (0.0%) |
| Total | 2,174 (100.0%) | 3,069 (100.0%) |
Household Income by Mortgage Status in La Marque
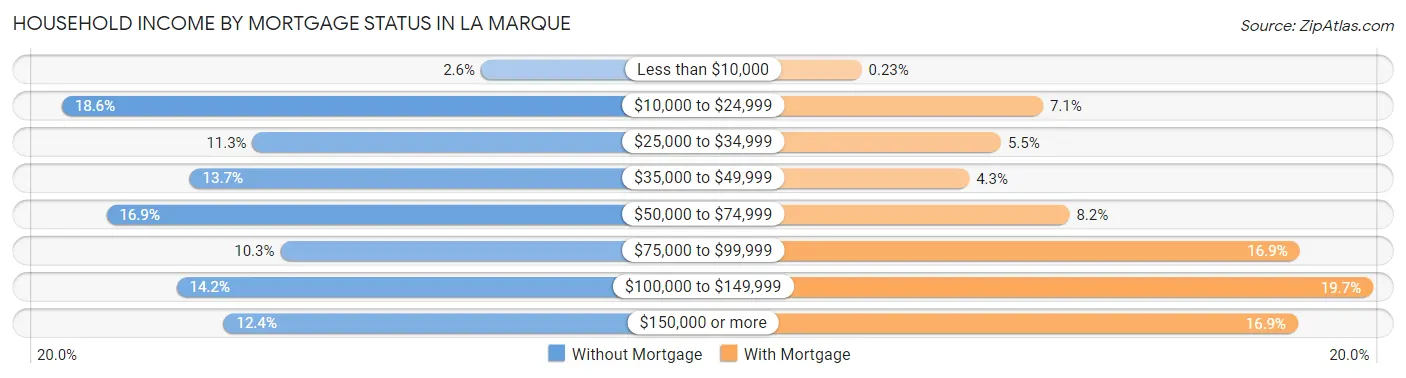
| Household Income | Without Mortgage | With Mortgage |
| Less than $10,000 | 57 (2.6%) | 7 (0.2%) |
| $10,000 to $24,999 | 404 (18.6%) | 219 (7.1%) |
| $25,000 to $34,999 | 246 (11.3%) | 170 (5.5%) |
| $35,000 to $49,999 | 298 (13.7%) | 133 (4.3%) |
| $50,000 to $74,999 | 367 (16.9%) | 250 (8.2%) |
| $75,000 to $99,999 | 223 (10.3%) | 519 (16.9%) |
| $100,000 to $149,999 | 309 (14.2%) | 605 (19.7%) |
| $150,000 or more | 270 (12.4%) | 517 (16.9%) |
| Total | 2,174 (100.0%) | 3,069 (100.0%) |
Property Value to Household Income Ratio in La Marque
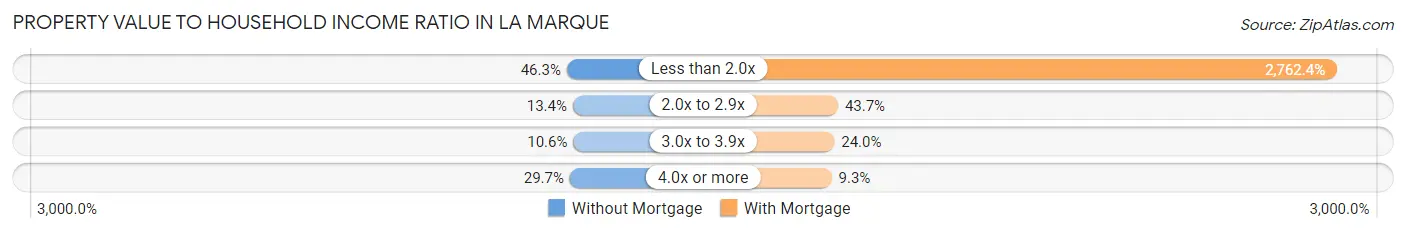
| Value-to-Income Ratio | Without Mortgage | With Mortgage |
| Less than 2.0x | 1,006 (46.3%) | 84,779 (2,762.4%) |
| 2.0x to 2.9x | 291 (13.4%) | 1,341 (43.7%) |
| 3.0x to 3.9x | 231 (10.6%) | 737 (24.0%) |
| 4.0x or more | 646 (29.7%) | 284 (9.2%) |
| Total | 2,174 (100.0%) | 3,069 (100.0%) |
Real Estate Taxes by Mortgage Status in La Marque
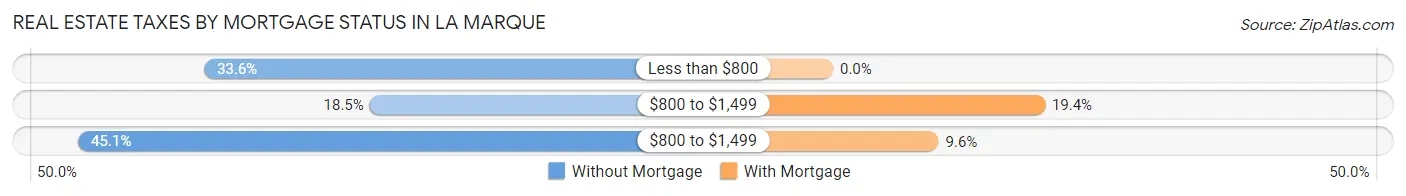
| Property Taxes | Without Mortgage | With Mortgage |
| Less than $800 | 731 (33.6%) | 0 (0.0%) |
| $800 to $1,499 | 402 (18.5%) | 594 (19.4%) |
| $800 to $1,499 | 981 (45.1%) | 296 (9.6%) |
| Total | 2,174 (100.0%) | 3,069 (100.0%) |
Health & Disability in La Marque
Health Insurance Coverage by Age in La Marque
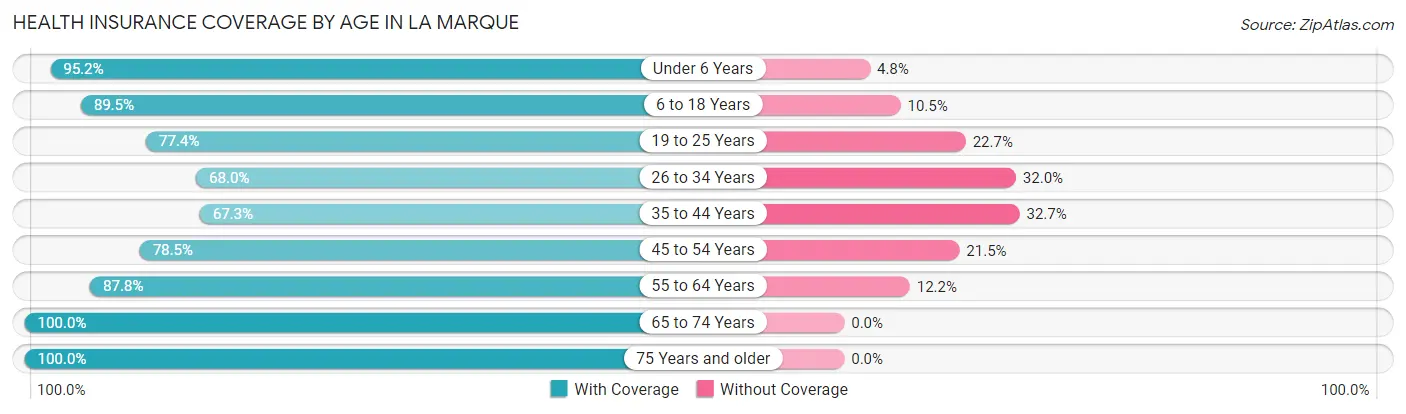
| Age Bracket | With Coverage | Without Coverage |
| Under 6 Years | 1,150 (95.2%) | 58 (4.8%) |
| 6 to 18 Years | 2,893 (89.5%) | 339 (10.5%) |
| 19 to 25 Years | 1,076 (77.3%) | 315 (22.7%) |
| 26 to 34 Years | 1,449 (68.0%) | 682 (32.0%) |
| 35 to 44 Years | 1,864 (67.3%) | 905 (32.7%) |
| 45 to 54 Years | 1,690 (78.5%) | 462 (21.5%) |
| 55 to 64 Years | 2,335 (87.8%) | 325 (12.2%) |
| 65 to 74 Years | 1,645 (100.0%) | 0 (0.0%) |
| 75 Years and older | 1,153 (100.0%) | 0 (0.0%) |
| Total | 15,255 (83.2%) | 3,086 (16.8%) |
Health Insurance Coverage by Citizenship Status in La Marque
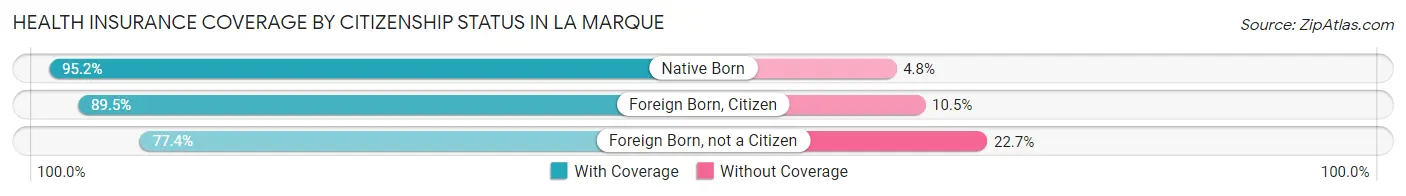
| Citizenship Status | With Coverage | Without Coverage |
| Native Born | 1,150 (95.2%) | 58 (4.8%) |
| Foreign Born, Citizen | 2,893 (89.5%) | 339 (10.5%) |
| Foreign Born, not a Citizen | 1,076 (77.3%) | 315 (22.7%) |
Health Insurance Coverage by Household Income in La Marque
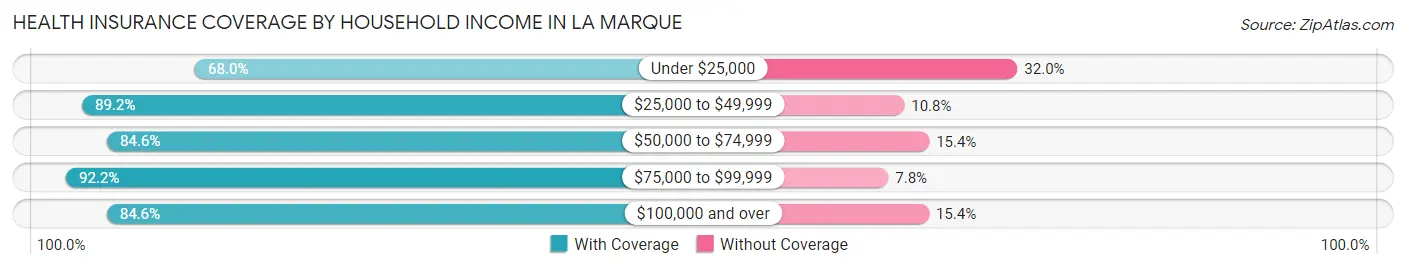
| Household Income | With Coverage | Without Coverage |
| Under $25,000 | 2,254 (68.0%) | 1,059 (32.0%) |
| $25,000 to $49,999 | 2,236 (89.2%) | 270 (10.8%) |
| $50,000 to $74,999 | 2,936 (84.6%) | 536 (15.4%) |
| $75,000 to $99,999 | 2,334 (92.2%) | 197 (7.8%) |
| $100,000 and over | 5,453 (84.6%) | 993 (15.4%) |
Public vs Private Health Insurance Coverage by Age in La Marque
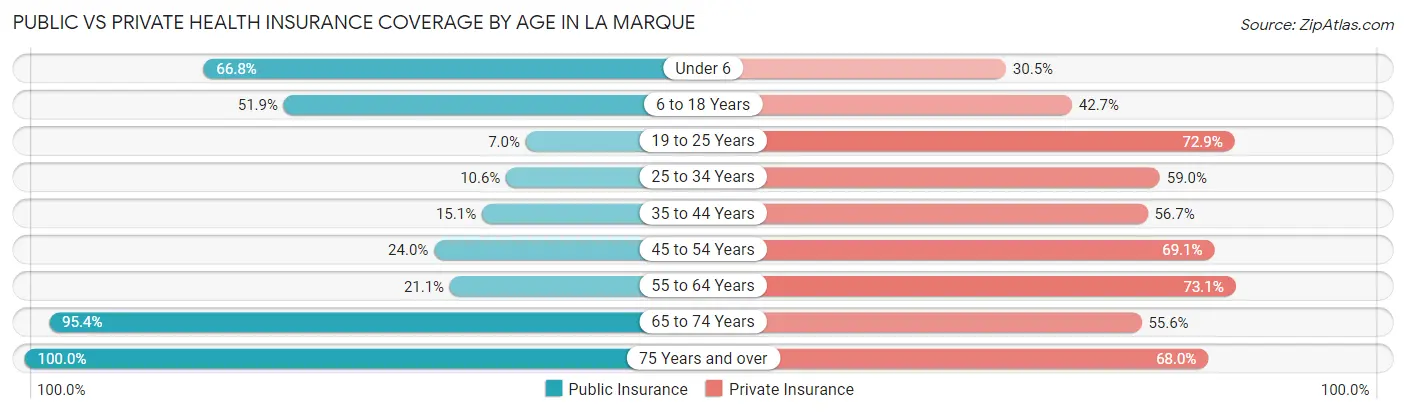
| Age Bracket | Public Insurance | Private Insurance |
| Under 6 | 807 (66.8%) | 368 (30.5%) |
| 6 to 18 Years | 1,677 (51.9%) | 1,380 (42.7%) |
| 19 to 25 Years | 97 (7.0%) | 1,014 (72.9%) |
| 25 to 34 Years | 226 (10.6%) | 1,258 (59.0%) |
| 35 to 44 Years | 418 (15.1%) | 1,571 (56.7%) |
| 45 to 54 Years | 516 (24.0%) | 1,488 (69.1%) |
| 55 to 64 Years | 560 (21.0%) | 1,944 (73.1%) |
| 65 to 74 Years | 1,570 (95.4%) | 915 (55.6%) |
| 75 Years and over | 1,153 (100.0%) | 784 (68.0%) |
| Total | 7,024 (38.3%) | 10,722 (58.5%) |
Disability Status by Sex by Age in La Marque

| Age Bracket | Male | Female |
| Under 5 Years | 0 (0.0%) | 0 (0.0%) |
| 5 to 17 Years | 53 (3.2%) | 57 (3.7%) |
| 18 to 34 Years | 112 (6.2%) | 170 (8.7%) |
| 35 to 64 Years | 755 (20.6%) | 589 (15.0%) |
| 65 to 74 Years | 117 (18.3%) | 352 (35.0%) |
| 75 Years and over | 210 (47.9%) | 254 (35.5%) |
Disability Class by Sex by Age in La Marque
Disability Class: Hearing Difficulty
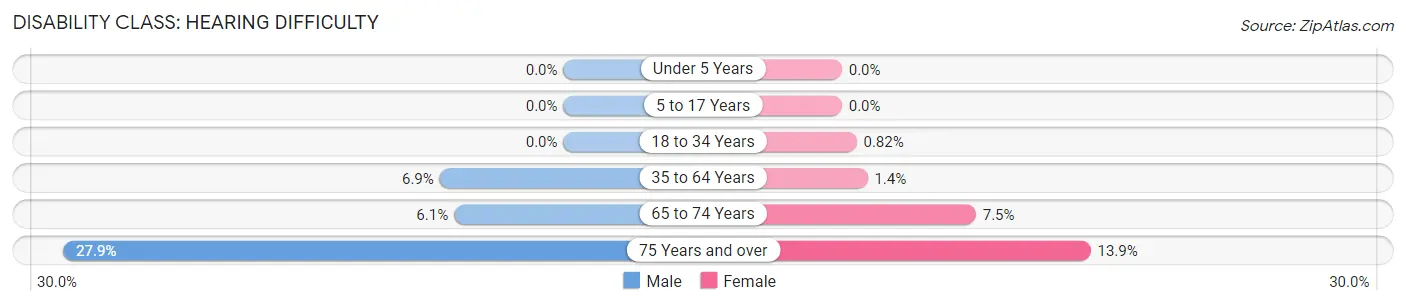
| Age Bracket | Male | Female |
| Under 5 Years | 0 (0.0%) | 0 (0.0%) |
| 5 to 17 Years | 0 (0.0%) | 0 (0.0%) |
| 18 to 34 Years | 0 (0.0%) | 16 (0.8%) |
| 35 to 64 Years | 252 (6.9%) | 56 (1.4%) |
| 65 to 74 Years | 39 (6.1%) | 75 (7.5%) |
| 75 Years and over | 122 (27.9%) | 99 (13.9%) |
Disability Class: Vision Difficulty
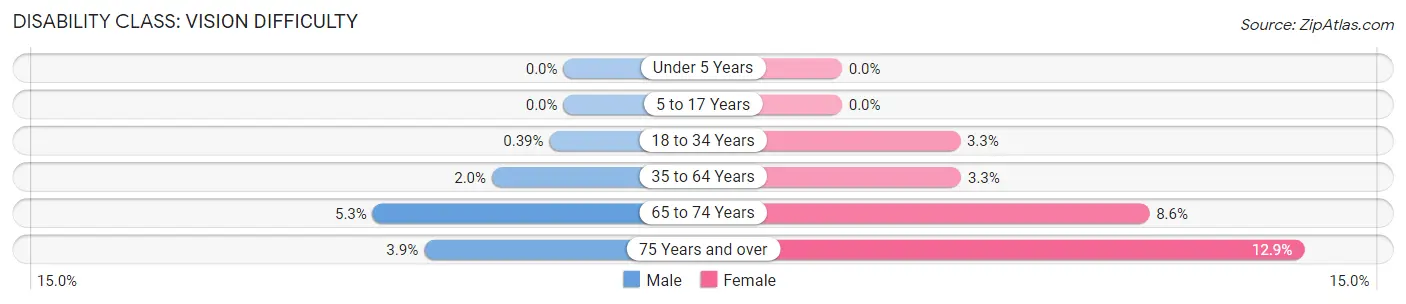
| Age Bracket | Male | Female |
| Under 5 Years | 0 (0.0%) | 0 (0.0%) |
| 5 to 17 Years | 0 (0.0%) | 0 (0.0%) |
| 18 to 34 Years | 7 (0.4%) | 64 (3.3%) |
| 35 to 64 Years | 73 (2.0%) | 130 (3.3%) |
| 65 to 74 Years | 34 (5.3%) | 86 (8.6%) |
| 75 Years and over | 17 (3.9%) | 92 (12.9%) |
Disability Class: Cognitive Difficulty
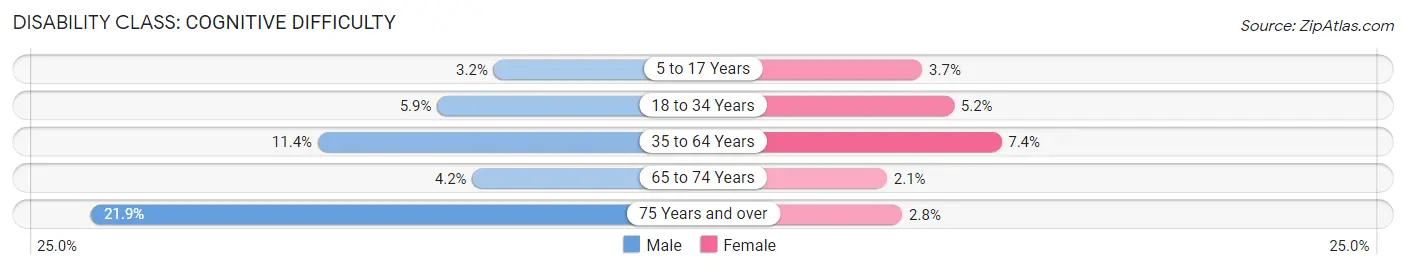
| Age Bracket | Male | Female |
| 5 to 17 Years | 53 (3.2%) | 57 (3.7%) |
| 18 to 34 Years | 105 (5.9%) | 101 (5.2%) |
| 35 to 64 Years | 417 (11.4%) | 290 (7.4%) |
| 65 to 74 Years | 27 (4.2%) | 21 (2.1%) |
| 75 Years and over | 96 (21.9%) | 20 (2.8%) |
Disability Class: Ambulatory Difficulty
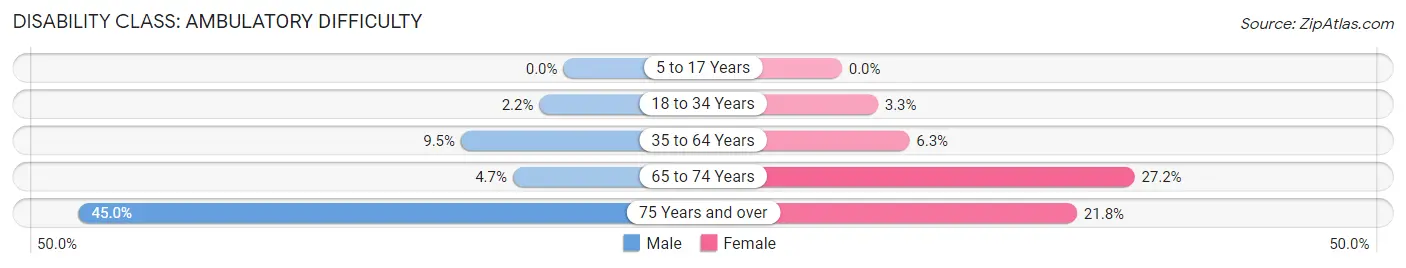
| Age Bracket | Male | Female |
| 5 to 17 Years | 0 (0.0%) | 0 (0.0%) |
| 18 to 34 Years | 40 (2.2%) | 65 (3.3%) |
| 35 to 64 Years | 348 (9.5%) | 246 (6.3%) |
| 65 to 74 Years | 30 (4.7%) | 273 (27.2%) |
| 75 Years and over | 197 (45.0%) | 156 (21.8%) |
Disability Class: Self-Care Difficulty
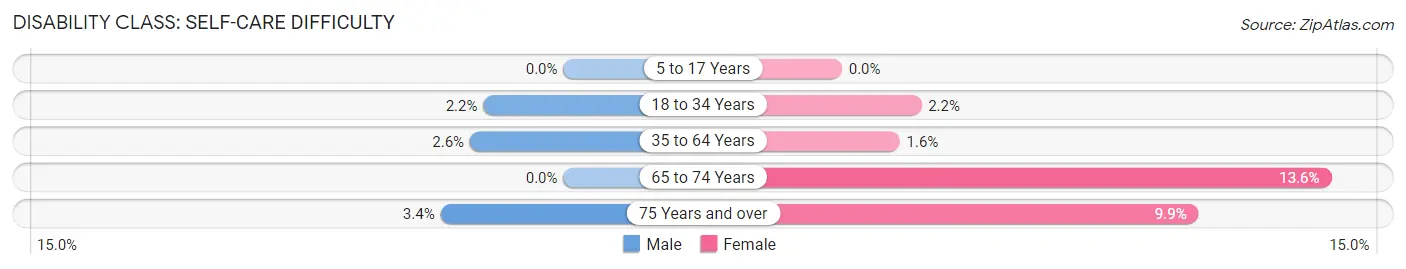
| Age Bracket | Male | Female |
| 5 to 17 Years | 0 (0.0%) | 0 (0.0%) |
| 18 to 34 Years | 40 (2.2%) | 43 (2.2%) |
| 35 to 64 Years | 95 (2.6%) | 63 (1.6%) |
| 65 to 74 Years | 0 (0.0%) | 137 (13.6%) |
| 75 Years and over | 15 (3.4%) | 71 (9.9%) |
Technology Access in La Marque
Computing Device Access in La Marque
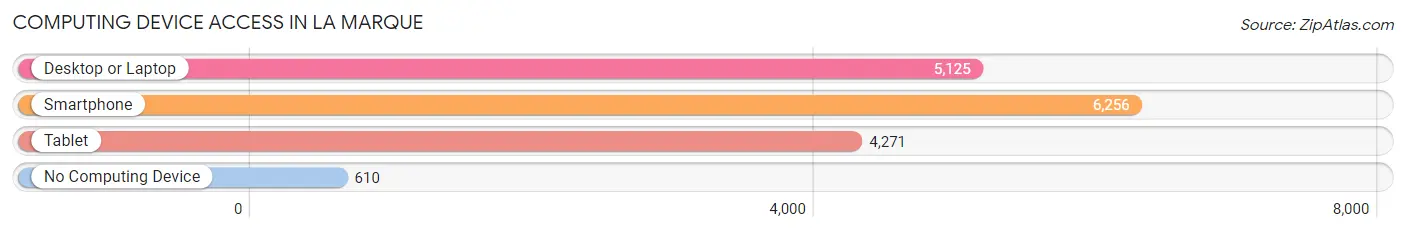
| Device Type | # Households | % Households |
| Desktop or Laptop | 5,125 | 72.8% |
| Smartphone | 6,256 | 88.8% |
| Tablet | 4,271 | 60.6% |
| No Computing Device | 610 | 8.7% |
| Total | 7,043 | 100.0% |
Internet Access in La Marque
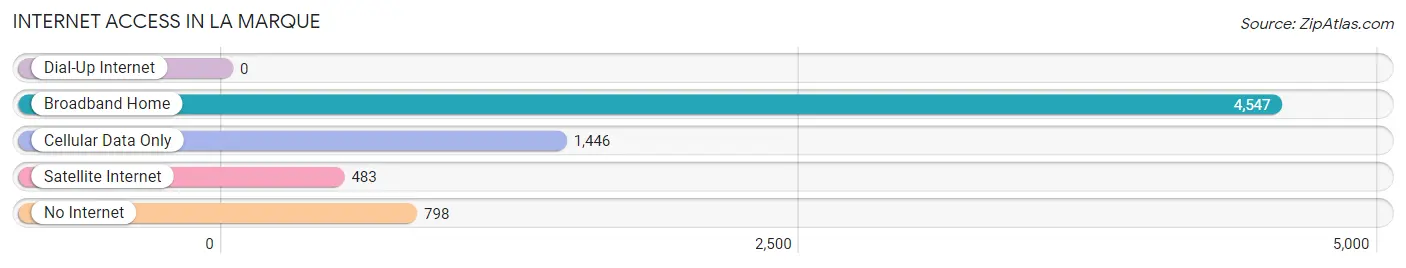
| Internet Type | # Households | % Households |
| Dial-Up Internet | 0 | 0.0% |
| Broadband Home | 4,547 | 64.6% |
| Cellular Data Only | 1,446 | 20.5% |
| Satellite Internet | 483 | 6.9% |
| No Internet | 798 | 11.3% |
| Total | 7,043 | 100.0% |
La Marque Summary
La Marque, Texas is a city located in Galveston County, Texas, United States. The city is located on the Gulf Coast, approximately 25 miles southeast of Houston. As of the 2010 census, the city had a population of 14,509. La Marque is part of the Houston–The Woodlands–Sugar Land metropolitan area.
History
La Marque was founded in 1891 by French settlers who named the city after the French phrase “la marque,” which translates to “the mark.” The city was originally a small farming community, but it grew rapidly after the discovery of oil in the area in the early 1900s. The city was incorporated in 1912 and has since become a major industrial center.
Geography
La Marque is located at 29°23′N 94°58′W (29.38, -94.97). According to the United States Census Bureau, the city has a total area of 8.3 square miles (21.5 km2), of which 8.2 square miles (21.3 km2) is land and 0.1 square miles (0.2 km2) is water.
Economy
La Marque’s economy is largely based on the oil and gas industry. The city is home to several major oil and gas companies, including Chevron, Shell, and ExxonMobil. The city is also home to several manufacturing companies, including a paper mill and a chemical plant.
Demographics
As of the 2010 census, there were 14,509 people, 5,093 households, and 3,541 families residing in the city. The population density was 1,764.3 people per square mile (683.2/km2). There were 5,717 housing units at an average density of 697.3 per square mile (269.3/km2). The racial makeup of the city was 63.2% White, 22.2% African American, 0.7% Native American, 0.7% Asian, 0.1% Pacific Islander, 10.7% from other races, and 2.4% from two or more races. Hispanic or Latino of any race were 24.2% of the population.
The median income for a household in the city was $37,917, and the median income for a family was $45,917. Males had a median income of $35,917 versus $25,917 for females. The per capita income for the city was $17,917. About 14.2% of families and 17.2% of the population were below the poverty line, including 24.2% of those under age 18 and 11.2% of those age 65 or over.
La Marque is a diverse city with a rich history and a vibrant economy. The city is home to a variety of industries, including oil and gas, manufacturing, and paper mills. The city is also home to a diverse population, with a mix of races and ethnicities. La Marque is a great place to live, work, and play.
Common Questions
What is Per Capita Income in La Marque?
Per Capita income in La Marque is $31,191.
What is the Median Family Income in La Marque?
Median Family Income in La Marque is $76,492.
What is the Median Household income in La Marque?
Median Household Income in La Marque is $61,403.
What is Income or Wage Gap in La Marque?
Income or Wage Gap in La Marque is 27.8%.
Women in La Marque earn 72.2 cents for every dollar earned by a man.
What is Family Income Deficit in La Marque?
Family Income Deficit in La Marque is $13,554.
Families that are below poverty line in La Marque earn $13,554 less on average than the poverty threshold level.
What is Inequality or Gini Index in La Marque?
Inequality or Gini Index in La Marque is 0.46.
What is the Total Population of La Marque?
Total Population of La Marque is 18,464.
What is the Total Male Population of La Marque?
Total Male Population of La Marque is 8,659.
What is the Total Female Population of La Marque?
Total Female Population of La Marque is 9,805.
What is the Ratio of Males per 100 Females in La Marque?
There are 88.31 Males per 100 Females in La Marque.
What is the Ratio of Females per 100 Males in La Marque?
There are 113.23 Females per 100 Males in La Marque.
What is the Median Population Age in La Marque?
Median Population Age in La Marque is 39.6 Years.
What is the Average Family Size in La Marque
Average Family Size in La Marque is 3.2 People.
What is the Average Household Size in La Marque
Average Household Size in La Marque is 2.6 People.
How Large is the Labor Force in La Marque?
There are 9,156 People in the Labor Forcein in La Marque.
What is the Percentage of People in the Labor Force in La Marque?
63.0% of People are in the Labor Force in La Marque.
What is the Unemployment Rate in La Marque?
Unemployment Rate in La Marque is 8.5%.