Runaway Bay, TX Map & Demographics
Runaway Bay Map
Runaway Bay Overview
$45,192
PER CAPITA INCOME
$117,941
AVG FAMILY INCOME
$91,719
AVG HOUSEHOLD INCOME
32.3%
WAGE / INCOME GAP [ % ]
67.7¢/ $1
WAGE / INCOME GAP [ $ ]
0.38
INEQUALITY / GINI INDEX
1,648
TOTAL POPULATION
910
MALE POPULATION
738
FEMALE POPULATION
123.31
MALES / 100 FEMALES
81.10
FEMALES / 100 MALES
51.6
MEDIAN AGE
2.7
AVG FAMILY SIZE
2.3
AVG HOUSEHOLD SIZE
800
LABOR FORCE [ PEOPLE ]
56.0%
PERCENT IN LABOR FORCE
4.4%
UNEMPLOYMENT RATE
Runaway Bay Area Codes
Income in Runaway Bay
Income Overview in Runaway Bay
Per Capita Income in Runaway Bay is $45,192, while median incomes of families and households are $117,941 and $91,719 respectively.
| Characteristic | Number | Measure |
| Per Capita Income | 1,648 | $45,192 |
| Median Family Income | 506 | $117,941 |
| Mean Family Income | 506 | $122,629 |
| Median Household Income | 715 | $91,719 |
| Mean Household Income | 715 | $105,590 |
| Income Deficit | 506 | $0 |
| Wage / Income Gap (%) | 1,648 | 32.26% |
| Wage / Income Gap ($) | 1,648 | 67.74¢ per $1 |
| Gini / Inequality Index | 1,648 | 0.38 |
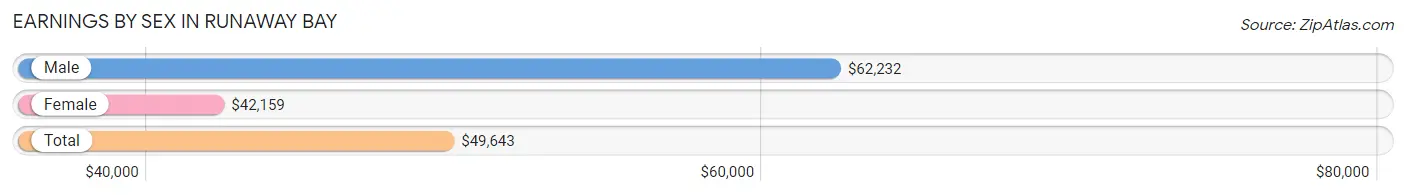
Earnings by Sex in Runaway Bay
Average Earnings in Runaway Bay are $49,643, $62,232 for men and $42,159 for women, a difference of 32.3%.
| Sex | Number | Average Earnings |
| Male | 507 (62.0%) | $62,232 |
| Female | 311 (38.0%) | $42,159 |
| Total | 818 (100.0%) | $49,643 |
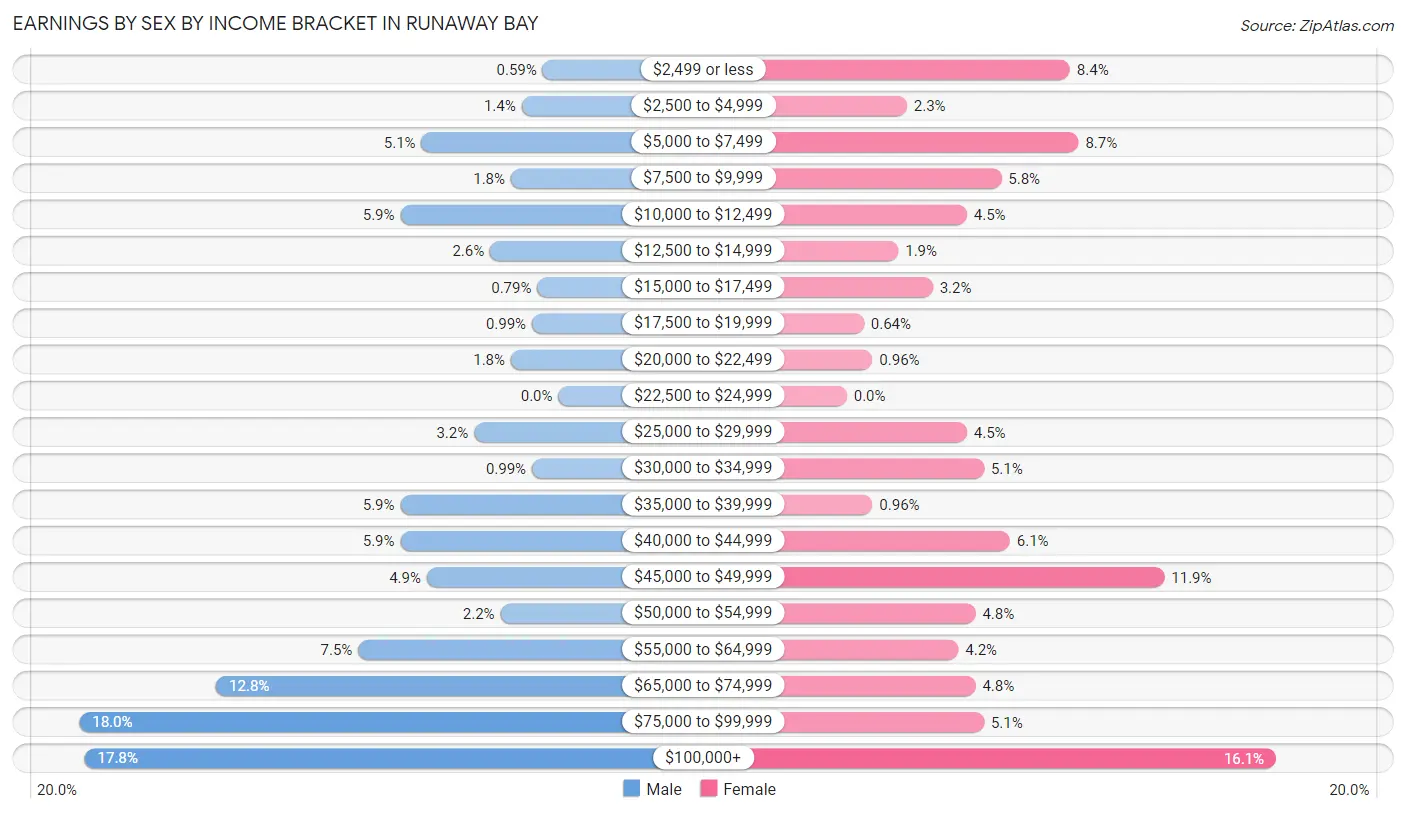
Earnings by Sex by Income Bracket in Runaway Bay
The most common earnings brackets in Runaway Bay are $75,000 to $99,999 for men (91 | 17.9%) and $100,000+ for women (50 | 16.1%).
| Income | Male | Female |
| $2,499 or less | 3 (0.6%) | 26 (8.4%) |
| $2,500 to $4,999 | 7 (1.4%) | 7 (2.2%) |
| $5,000 to $7,499 | 26 (5.1%) | 27 (8.7%) |
| $7,500 to $9,999 | 9 (1.8%) | 18 (5.8%) |
| $10,000 to $12,499 | 30 (5.9%) | 14 (4.5%) |
| $12,500 to $14,999 | 13 (2.6%) | 6 (1.9%) |
| $15,000 to $17,499 | 4 (0.8%) | 10 (3.2%) |
| $17,500 to $19,999 | 5 (1.0%) | 2 (0.6%) |
| $20,000 to $22,499 | 9 (1.8%) | 3 (1.0%) |
| $22,500 to $24,999 | 0 (0.0%) | 0 (0.0%) |
| $25,000 to $29,999 | 16 (3.2%) | 14 (4.5%) |
| $30,000 to $34,999 | 5 (1.0%) | 16 (5.1%) |
| $35,000 to $39,999 | 30 (5.9%) | 3 (1.0%) |
| $40,000 to $44,999 | 30 (5.9%) | 19 (6.1%) |
| $45,000 to $49,999 | 25 (4.9%) | 37 (11.9%) |
| $50,000 to $54,999 | 11 (2.2%) | 15 (4.8%) |
| $55,000 to $64,999 | 38 (7.5%) | 13 (4.2%) |
| $65,000 to $74,999 | 65 (12.8%) | 15 (4.8%) |
| $75,000 to $99,999 | 91 (17.9%) | 16 (5.1%) |
| $100,000+ | 90 (17.7%) | 50 (16.1%) |
| Total | 507 (100.0%) | 311 (100.0%) |
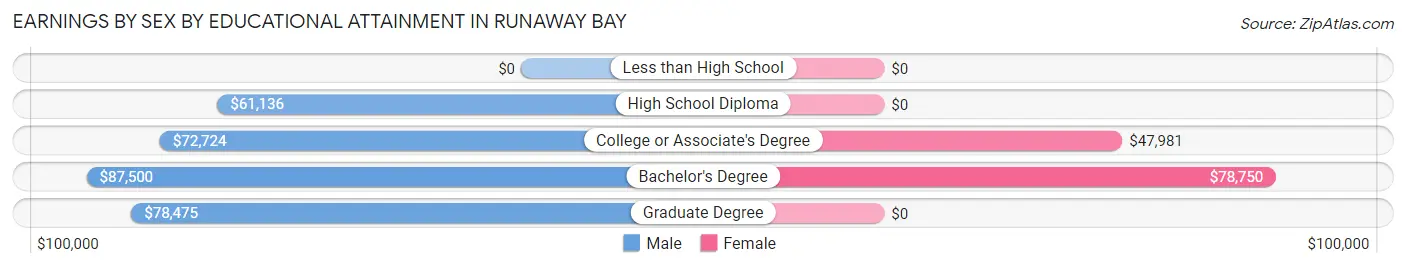
Earnings by Sex by Educational Attainment in Runaway Bay
Average earnings in Runaway Bay are $73,367 for men and $47,386 for women, a difference of 35.4%. Men with an educational attainment of bachelor's degree enjoy the highest average annual earnings of $87,500, while those with high school diploma education earn the least with $61,136. Women with an educational attainment of bachelor's degree earn the most with the average annual earnings of $78,750, while those with college or associate's degree education have the smallest earnings of $47,981.
| Educational Attainment | Male Income | Female Income |
| Less than High School | - | - |
| High School Diploma | $61,136 | $0 |
| College or Associate's Degree | $72,724 | $47,981 |
| Bachelor's Degree | $87,500 | $78,750 |
| Graduate Degree | $78,475 | $0 |
| Total | $73,367 | $47,386 |
Family Income in Runaway Bay
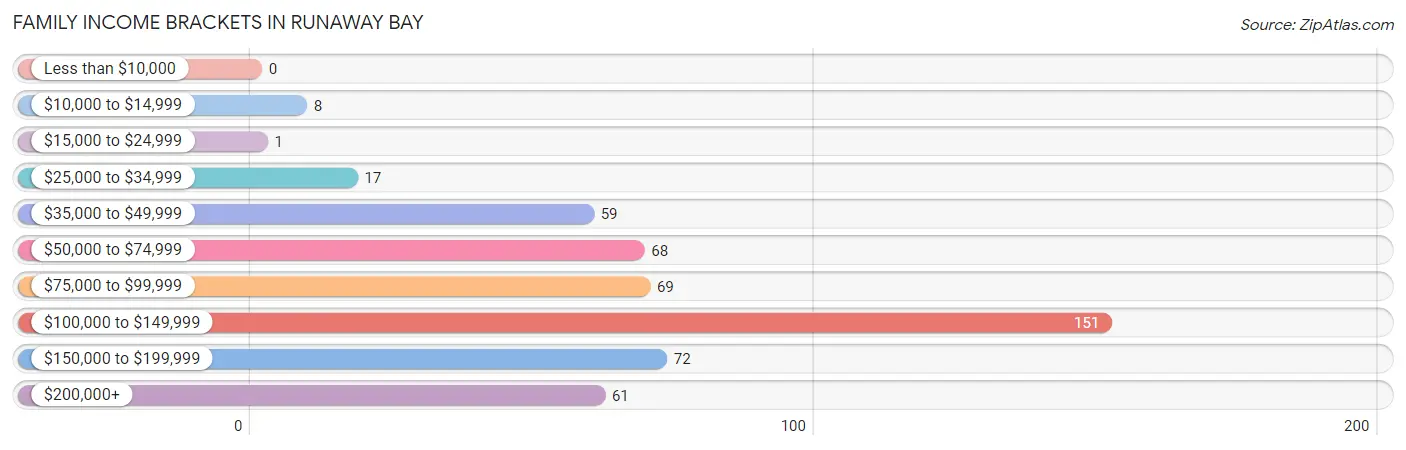
Family Income Brackets in Runaway Bay
According to the Runaway Bay family income data, there are 151 families falling into the $100,000 to $149,999 income range, which is the most common income bracket and makes up 29.8% of all families.
| Income Bracket | # Families | % Families |
| Less than $10,000 | 0 | 0.0% |
| $10,000 to $14,999 | 8 | 1.6% |
| $15,000 to $24,999 | 1 | 0.2% |
| $25,000 to $34,999 | 17 | 3.4% |
| $35,000 to $49,999 | 59 | 11.7% |
| $50,000 to $74,999 | 68 | 13.4% |
| $75,000 to $99,999 | 69 | 13.6% |
| $100,000 to $149,999 | 151 | 29.8% |
| $150,000 to $199,999 | 72 | 14.2% |
| $200,000+ | 61 | 12.1% |
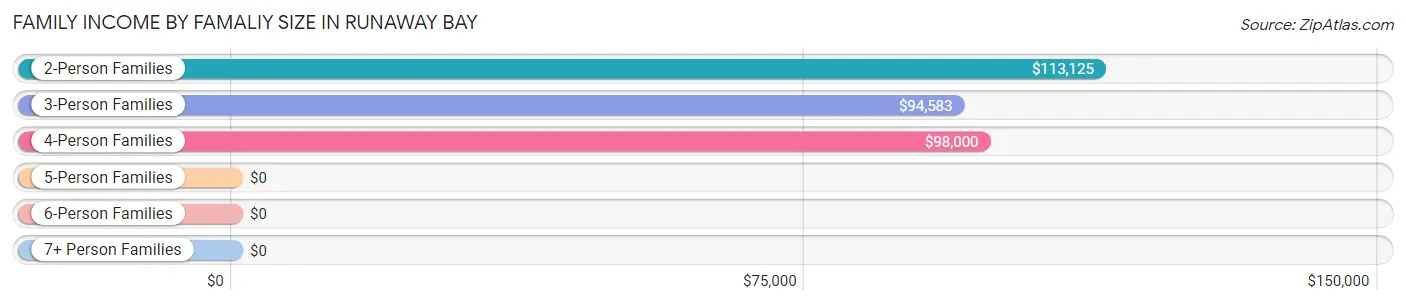
Family Income by Famaliy Size in Runaway Bay
2-person families (320 | 63.2%) account for the highest median family income in Runaway Bay with $113,125 per family, while 2-person families (320 | 63.2%) have the highest median income of $56,562 per family member.
| Income Bracket | # Families | Median Income |
| 2-Person Families | 320 (63.2%) | $113,125 |
| 3-Person Families | 75 (14.8%) | $94,583 |
| 4-Person Families | 38 (7.5%) | $98,000 |
| 5-Person Families | 58 (11.5%) | $0 |
| 6-Person Families | 2 (0.4%) | $0 |
| 7+ Person Families | 13 (2.6%) | $0 |
| Total | 506 (100.0%) | $117,941 |
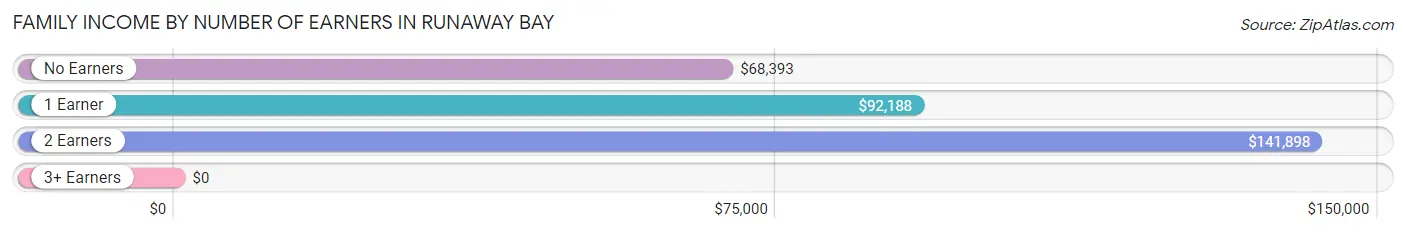
Family Income by Number of Earners in Runaway Bay
| Number of Earners | # Families | Median Income |
| No Earners | 99 (19.6%) | $68,393 |
| 1 Earner | 168 (33.2%) | $92,188 |
| 2 Earners | 183 (36.2%) | $141,898 |
| 3+ Earners | 56 (11.1%) | $0 |
| Total | 506 (100.0%) | $117,941 |
Household Income in Runaway Bay
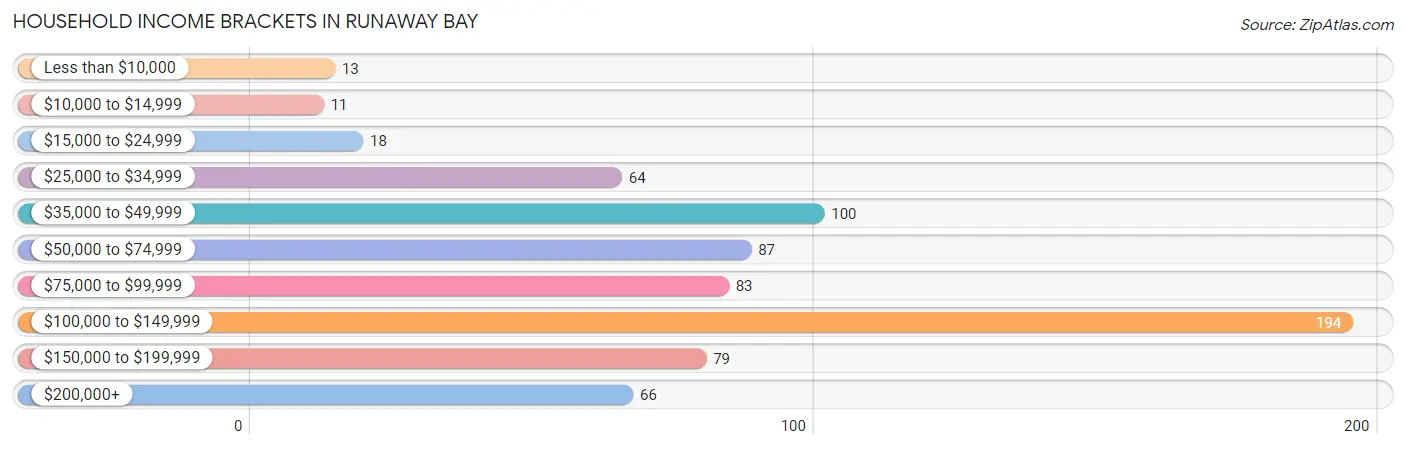
Household Income Brackets in Runaway Bay
With 194 households falling in the category, the $100,000 to $149,999 income range is the most frequent in Runaway Bay, accounting for 27.1% of all households. In contrast, only 11 households (1.5%) fall into the $10,000 to $14,999 income bracket, making it the least populous group.
| Income Bracket | # Households | % Households |
| Less than $10,000 | 13 | 1.8% |
| $10,000 to $14,999 | 11 | 1.5% |
| $15,000 to $24,999 | 18 | 2.5% |
| $25,000 to $34,999 | 64 | 9.0% |
| $35,000 to $49,999 | 100 | 14.0% |
| $50,000 to $74,999 | 87 | 12.2% |
| $75,000 to $99,999 | 83 | 11.6% |
| $100,000 to $149,999 | 194 | 27.1% |
| $150,000 to $199,999 | 79 | 11.0% |
| $200,000+ | 66 | 9.2% |
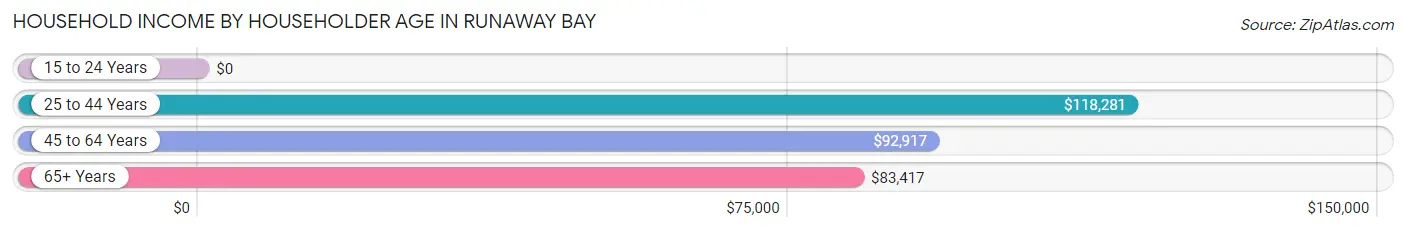
Household Income by Householder Age in Runaway Bay
The median household income in Runaway Bay is $91,719, with the highest median household income of $118,281 found in the 25 to 44 years age bracket for the primary householder. A total of 125 households (17.5%) fall into this category. Meanwhile, the 15 to 24 years age bracket for the primary householder has the lowest median household income of $0, with 14 households (2.0%) in this group.
| Income Bracket | # Households | Median Income |
| 15 to 24 Years | 14 (2.0%) | $0 |
| 25 to 44 Years | 125 (17.5%) | $118,281 |
| 45 to 64 Years | 257 (35.9%) | $92,917 |
| 65+ Years | 319 (44.6%) | $83,417 |
| Total | 715 (100.0%) | $91,719 |
Poverty in Runaway Bay
Income Below Poverty by Sex and Age in Runaway Bay
With 3.4% poverty level for males and 7.3% for females among the residents of Runaway Bay, 18 to 24 year old males and 18 to 24 year old females are the most vulnerable to poverty, with 12 males (15.0%) and 8 females (22.2%) in their respective age groups living below the poverty level.
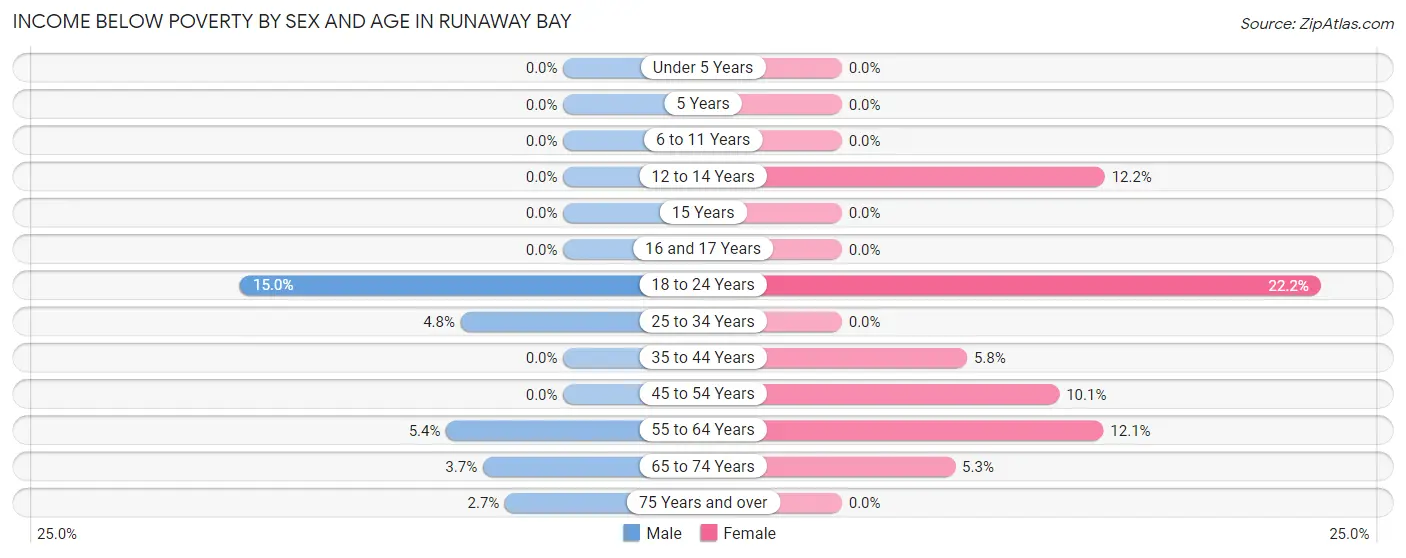
| Age Bracket | Male | Female |
| Under 5 Years | 0 (0.0%) | 0 (0.0%) |
| 5 Years | 0 (0.0%) | 0 (0.0%) |
| 6 to 11 Years | 0 (0.0%) | 0 (0.0%) |
| 12 to 14 Years | 0 (0.0%) | 5 (12.2%) |
| 15 Years | 0 (0.0%) | 0 (0.0%) |
| 16 and 17 Years | 0 (0.0%) | 0 (0.0%) |
| 18 to 24 Years | 12 (15.0%) | 8 (22.2%) |
| 25 to 34 Years | 3 (4.8%) | 0 (0.0%) |
| 35 to 44 Years | 0 (0.0%) | 5 (5.8%) |
| 45 to 54 Years | 0 (0.0%) | 11 (10.1%) |
| 55 to 64 Years | 7 (5.4%) | 17 (12.1%) |
| 65 to 74 Years | 6 (3.7%) | 8 (5.3%) |
| 75 Years and over | 3 (2.7%) | 0 (0.0%) |
| Total | 31 (3.4%) | 54 (7.3%) |
Income Above Poverty by Sex and Age in Runaway Bay
According to the poverty statistics in Runaway Bay, males aged under 5 years and females aged under 5 years are the age groups that are most secure financially, with 100.0% of males and 100.0% of females in these age groups living above the poverty line.
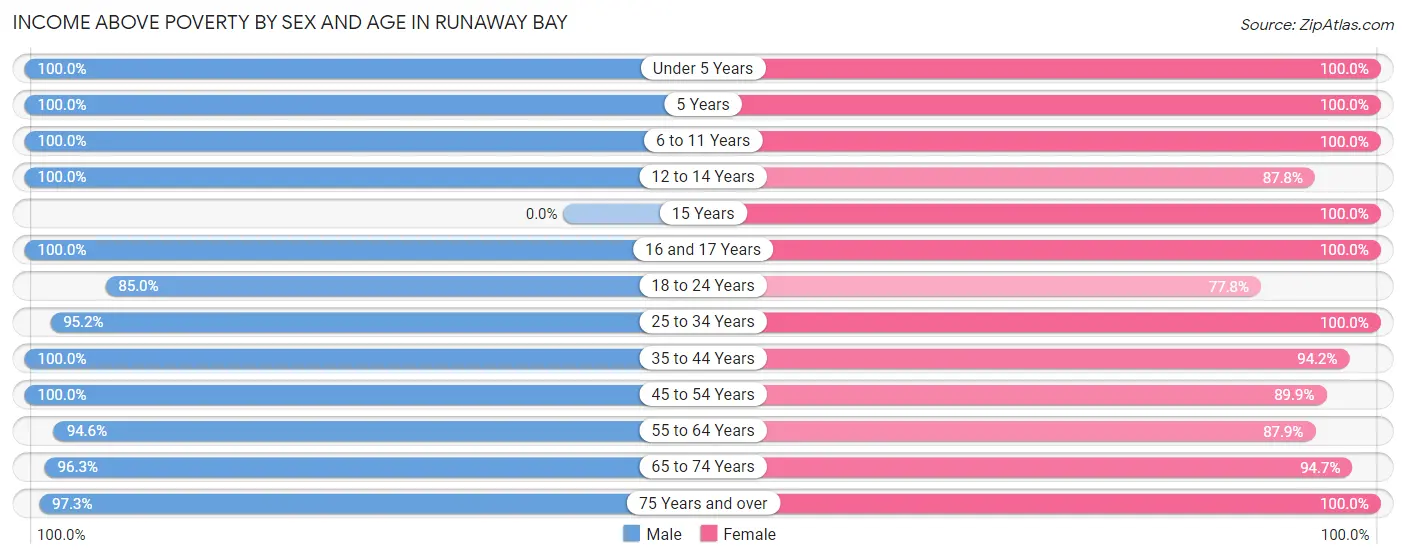
| Age Bracket | Male | Female |
| Under 5 Years | 44 (100.0%) | 13 (100.0%) |
| 5 Years | 10 (100.0%) | 11 (100.0%) |
| 6 to 11 Years | 33 (100.0%) | 12 (100.0%) |
| 12 to 14 Years | 43 (100.0%) | 36 (87.8%) |
| 15 Years | 0 (0.0%) | 7 (100.0%) |
| 16 and 17 Years | 37 (100.0%) | 9 (100.0%) |
| 18 to 24 Years | 68 (85.0%) | 28 (77.8%) |
| 25 to 34 Years | 60 (95.2%) | 37 (100.0%) |
| 35 to 44 Years | 98 (100.0%) | 81 (94.2%) |
| 45 to 54 Years | 95 (100.0%) | 98 (89.9%) |
| 55 to 64 Years | 122 (94.6%) | 123 (87.9%) |
| 65 to 74 Years | 155 (96.3%) | 144 (94.7%) |
| 75 Years and over | 108 (97.3%) | 85 (100.0%) |
| Total | 873 (96.6%) | 684 (92.7%) |
Income Below Poverty Among Married-Couple Families in Runaway Bay
The poverty statistics for married-couple families in Runaway Bay show that 0.7% or 3 of the total 454 families live below the poverty line. Families with no children have the highest poverty rate of 0.9%, comprising of 3 families. On the other hand, families with 1 or 2 children have the lowest poverty rate of 0.0%, which includes 0 families.
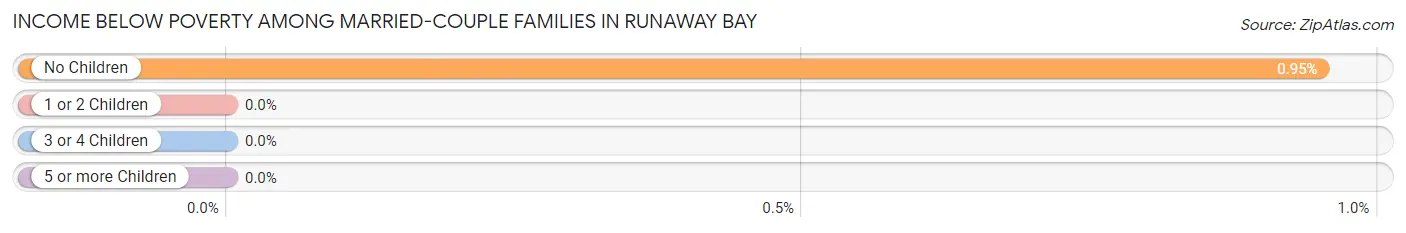
| Children | Above Poverty | Below Poverty |
| No Children | 314 (99.1%) | 3 (0.9%) |
| 1 or 2 Children | 93 (100.0%) | 0 (0.0%) |
| 3 or 4 Children | 41 (100.0%) | 0 (0.0%) |
| 5 or more Children | 3 (100.0%) | 0 (0.0%) |
| Total | 451 (99.3%) | 3 (0.7%) |
Income Below Poverty Among Single-Parent Households in Runaway Bay
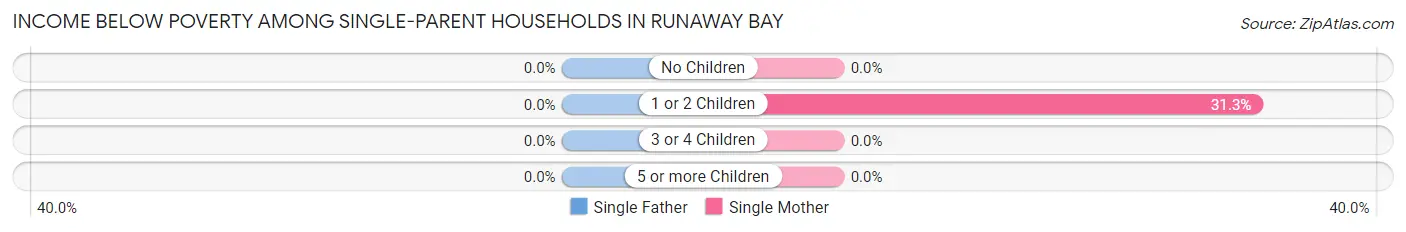
| Children | Single Father | Single Mother |
| No Children | 0 (0.0%) | 0 (0.0%) |
| 1 or 2 Children | 0 (0.0%) | 5 (31.2%) |
| 3 or 4 Children | 0 (0.0%) | 0 (0.0%) |
| 5 or more Children | 0 (0.0%) | 0 (0.0%) |
| Total | 0 (0.0%) | 5 (16.7%) |
Income Below Poverty Among Married-Couple vs Single-Parent Households in Runaway Bay
The poverty data for Runaway Bay shows that 3 of the married-couple family households (0.7%) and 5 of the single-parent households (9.6%) are living below the poverty level. Within the married-couple family households, those with no children have the highest poverty rate, with 3 households (0.9%) falling below the poverty line. Among the single-parent households, those with 1 or 2 children have the highest poverty rate, with 5 household (31.2%) living below poverty.
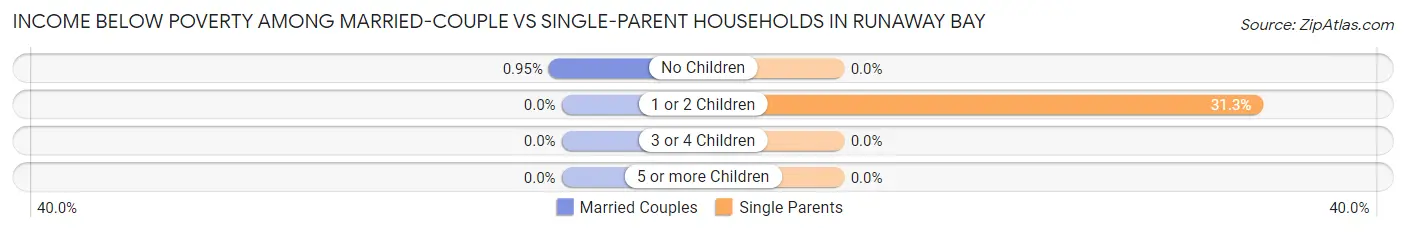
| Children | Married-Couple Families | Single-Parent Households |
| No Children | 3 (0.9%) | 0 (0.0%) |
| 1 or 2 Children | 0 (0.0%) | 5 (31.2%) |
| 3 or 4 Children | 0 (0.0%) | 0 (0.0%) |
| 5 or more Children | 0 (0.0%) | 0 (0.0%) |
| Total | 3 (0.7%) | 5 (9.6%) |
Race in Runaway Bay
The most populous races in Runaway Bay are White / Caucasian (1,469 | 89.1%), Two or more Races (97 | 5.9%), and Hispanic or Latino (83 | 5.0%).
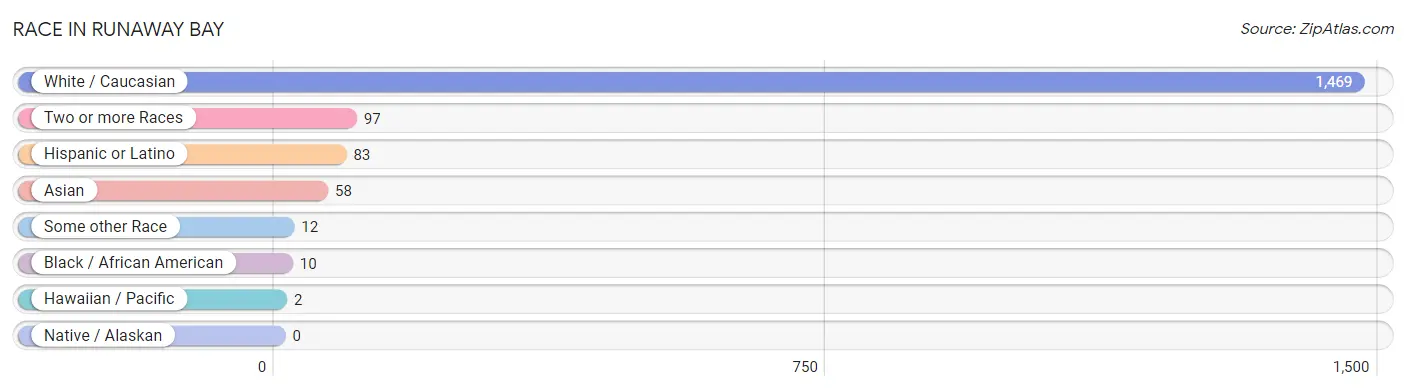
| Race | # Population | % Population |
| Asian | 58 | 3.5% |
| Black / African American | 10 | 0.6% |
| Hawaiian / Pacific | 2 | 0.1% |
| Hispanic or Latino | 83 | 5.0% |
| Native / Alaskan | 0 | 0.0% |
| White / Caucasian | 1,469 | 89.1% |
| Two or more Races | 97 | 5.9% |
| Some other Race | 12 | 0.7% |
| Total | 1,648 | 100.0% |
Ancestry in Runaway Bay
The most populous ancestries reported in Runaway Bay are German (242 | 14.7%), Irish (212 | 12.9%), English (184 | 11.2%), American (152 | 9.2%), and Scottish (49 | 3.0%), together accounting for 50.9% of all Runaway Bay residents.
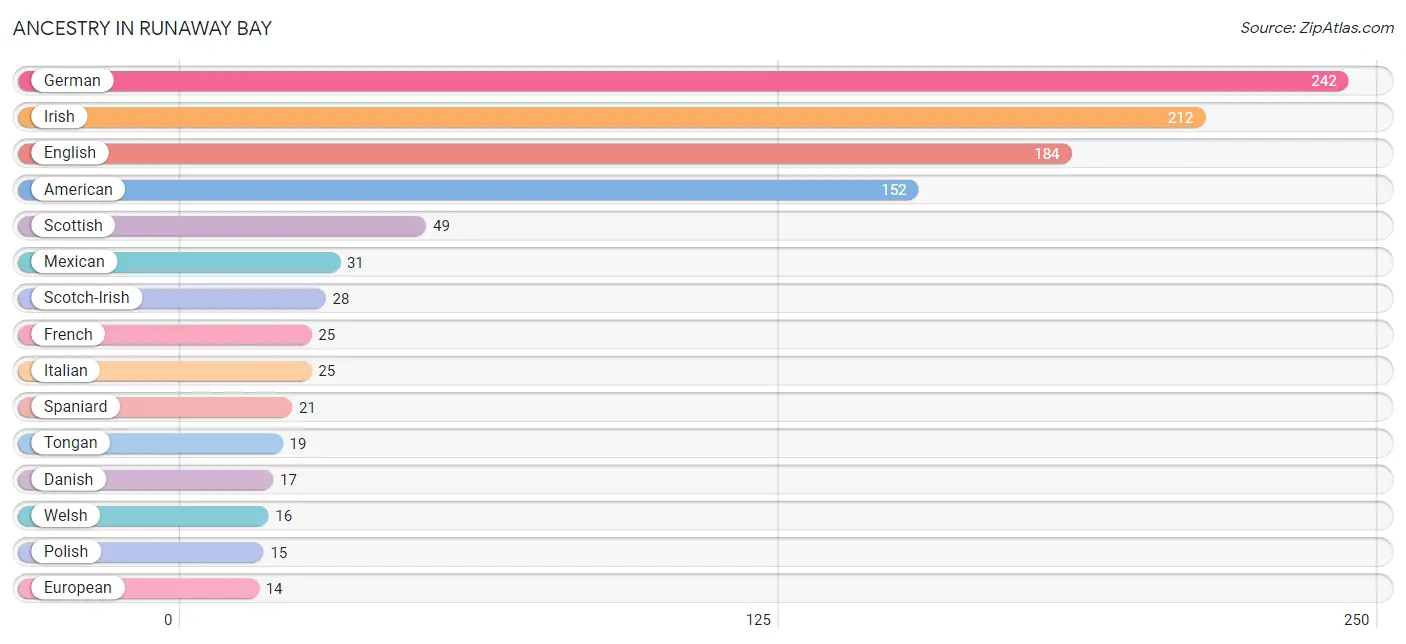
| Ancestry | # Population | % Population |
| American | 152 | 9.2% |
| Bhutanese | 1 | 0.1% |
| Celtic | 3 | 0.2% |
| Cherokee | 4 | 0.2% |
| Danish | 17 | 1.0% |
| Dutch | 8 | 0.5% |
| English | 184 | 11.2% |
| European | 14 | 0.9% |
| French | 25 | 1.5% |
| German | 242 | 14.7% |
| Greek | 3 | 0.2% |
| Hungarian | 10 | 0.6% |
| Irish | 212 | 12.9% |
| Italian | 25 | 1.5% |
| Mexican | 31 | 1.9% |
| Northern European | 3 | 0.2% |
| Norwegian | 8 | 0.5% |
| Polish | 15 | 0.9% |
| Portuguese | 3 | 0.2% |
| Puerto Rican | 14 | 0.9% |
| Scandinavian | 14 | 0.9% |
| Scotch-Irish | 28 | 1.7% |
| Scottish | 49 | 3.0% |
| Spaniard | 21 | 1.3% |
| Swedish | 11 | 0.7% |
| Swiss | 4 | 0.2% |
| Thai | 8 | 0.5% |
| Tongan | 19 | 1.1% |
| Welsh | 16 | 1.0% | View All 29 Rows |
Immigrants in Runaway Bay
The most numerous immigrant groups reported in Runaway Bay came from Asia (42 | 2.5%), Nepal (23 | 1.4%), South Central Asia (23 | 1.4%), South Eastern Asia (18 | 1.1%), and Vietnam (18 | 1.1%), together accounting for 7.5% of all Runaway Bay residents.
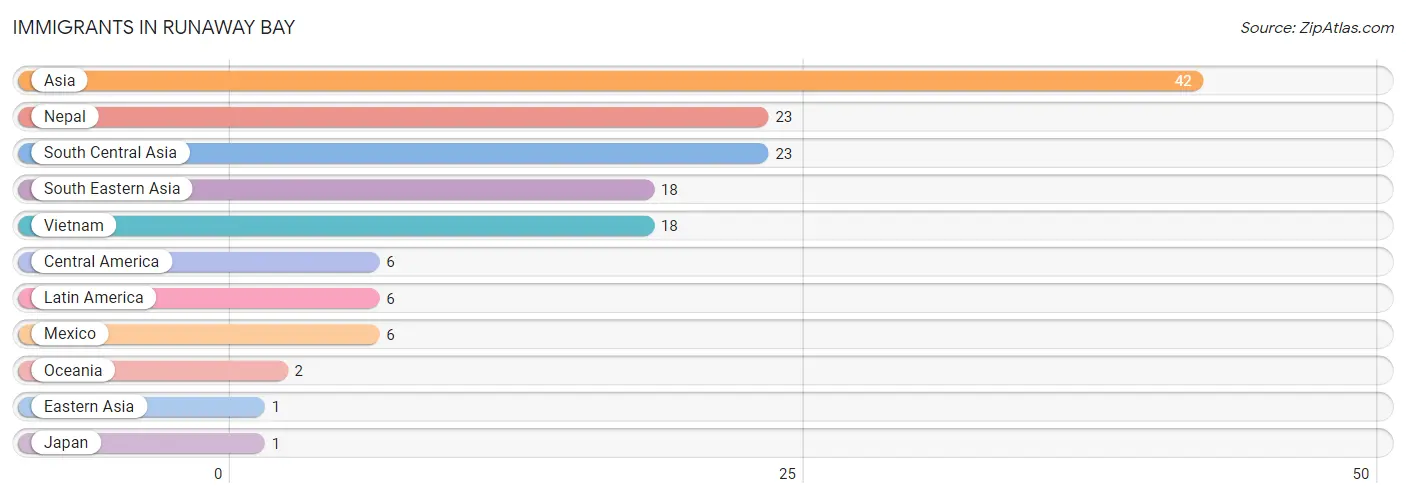
| Immigration Origin | # Population | % Population |
| Asia | 42 | 2.5% |
| Central America | 6 | 0.4% |
| Eastern Asia | 1 | 0.1% |
| Japan | 1 | 0.1% |
| Latin America | 6 | 0.4% |
| Mexico | 6 | 0.4% |
| Nepal | 23 | 1.4% |
| Oceania | 2 | 0.1% |
| South Central Asia | 23 | 1.4% |
| South Eastern Asia | 18 | 1.1% |
| Vietnam | 18 | 1.1% | View All 11 Rows |
Sex and Age in Runaway Bay
Sex and Age in Runaway Bay
The most populous age groups in Runaway Bay are 65 to 69 Years (121 | 13.3%) for men and 70 to 74 Years (91 | 12.3%) for women.
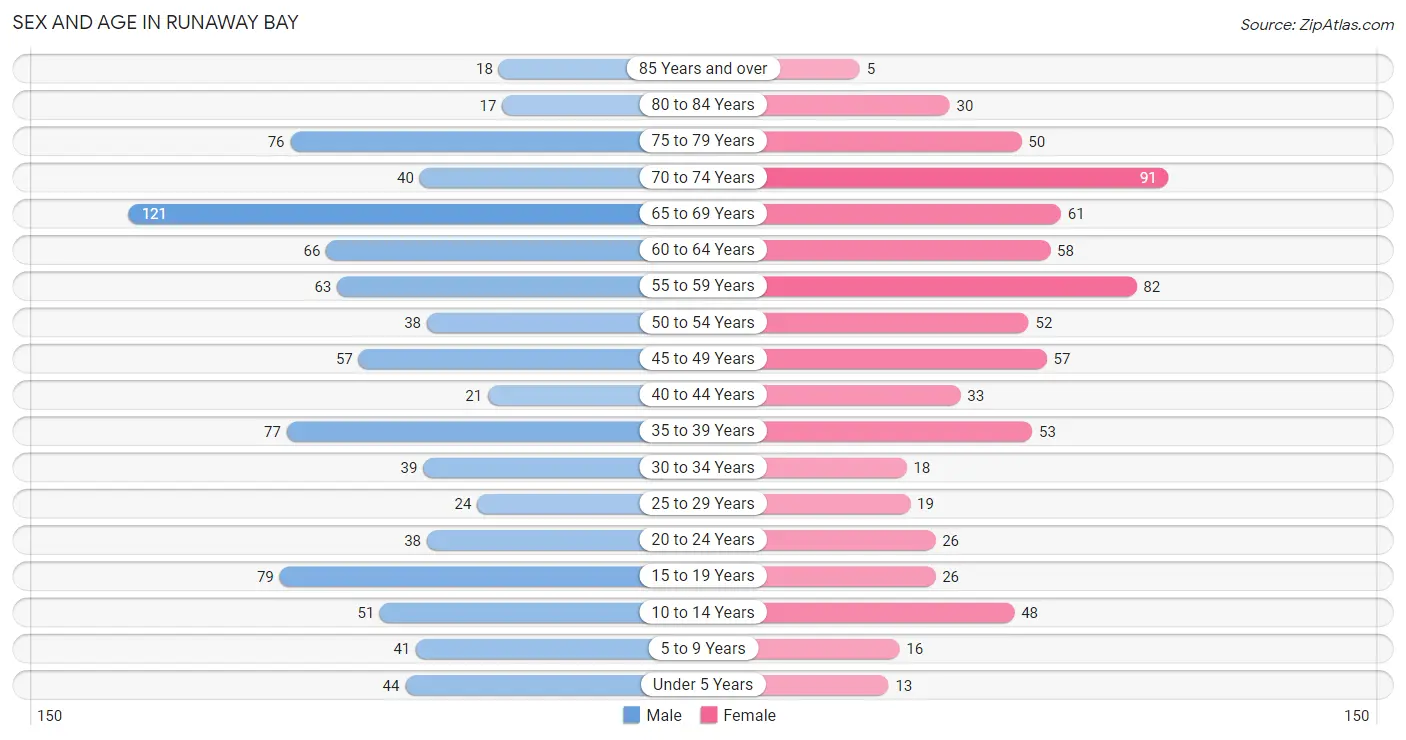
| Age Bracket | Male | Female |
| Under 5 Years | 44 (4.8%) | 13 (1.8%) |
| 5 to 9 Years | 41 (4.5%) | 16 (2.2%) |
| 10 to 14 Years | 51 (5.6%) | 48 (6.5%) |
| 15 to 19 Years | 79 (8.7%) | 26 (3.5%) |
| 20 to 24 Years | 38 (4.2%) | 26 (3.5%) |
| 25 to 29 Years | 24 (2.6%) | 19 (2.6%) |
| 30 to 34 Years | 39 (4.3%) | 18 (2.4%) |
| 35 to 39 Years | 77 (8.5%) | 53 (7.2%) |
| 40 to 44 Years | 21 (2.3%) | 33 (4.5%) |
| 45 to 49 Years | 57 (6.3%) | 57 (7.7%) |
| 50 to 54 Years | 38 (4.2%) | 52 (7.0%) |
| 55 to 59 Years | 63 (6.9%) | 82 (11.1%) |
| 60 to 64 Years | 66 (7.2%) | 58 (7.9%) |
| 65 to 69 Years | 121 (13.3%) | 61 (8.3%) |
| 70 to 74 Years | 40 (4.4%) | 91 (12.3%) |
| 75 to 79 Years | 76 (8.4%) | 50 (6.8%) |
| 80 to 84 Years | 17 (1.9%) | 30 (4.1%) |
| 85 Years and over | 18 (2.0%) | 5 (0.7%) |
| Total | 910 (100.0%) | 738 (100.0%) |
Families and Households in Runaway Bay
Median Family Size in Runaway Bay
The median family size in Runaway Bay is 2.72 persons per family, with single female/mother families (30 | 5.9%) accounting for the largest median family size of 3.17 persons per family. On the other hand, single male/father families (22 | 4.3%) represent the smallest median family size with 2.14 persons per family.
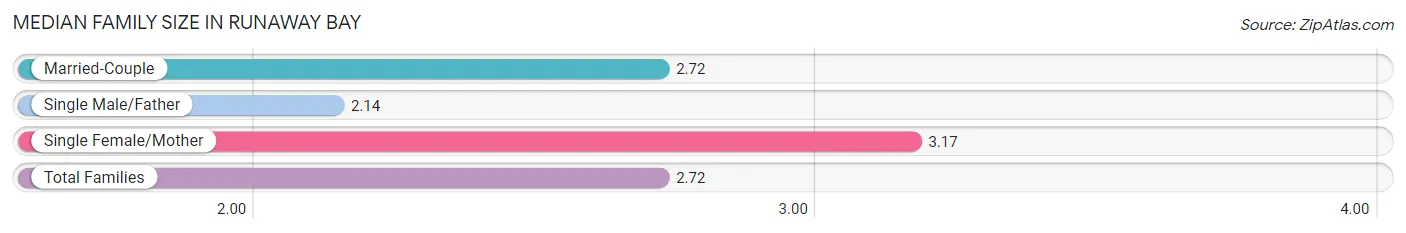
| Family Type | # Families | Family Size |
| Married-Couple | 454 (89.7%) | 2.72 |
| Single Male/Father | 22 (4.3%) | 2.14 |
| Single Female/Mother | 30 (5.9%) | 3.17 |
| Total Families | 506 (100.0%) | 2.72 |
Median Household Size in Runaway Bay
The median household size in Runaway Bay is 2.30 persons per household, with single female/mother households (30 | 4.2%) accounting for the largest median household size of 3.3 persons per household. non-family households (209 | 29.2%) represent the smallest median household size with 1.17 persons per household.
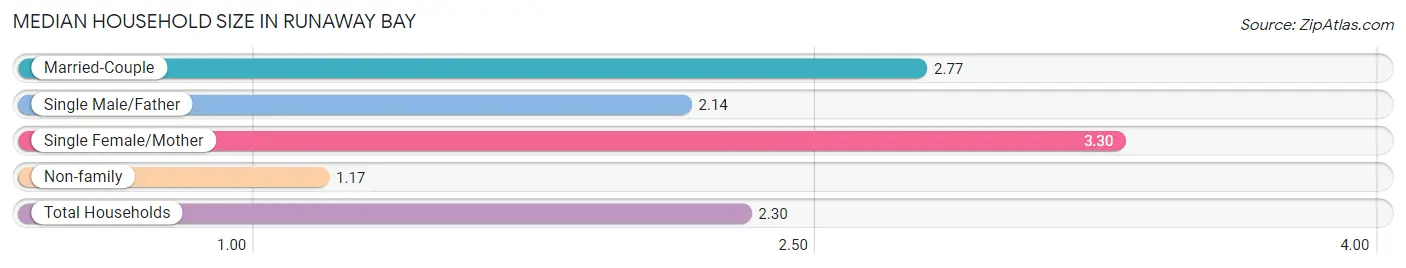
| Household Type | # Households | Household Size |
| Married-Couple | 454 (63.5%) | 2.77 |
| Single Male/Father | 22 (3.1%) | 2.14 |
| Single Female/Mother | 30 (4.2%) | 3.30 |
| Non-family | 209 (29.2%) | 1.17 |
| Total Households | 715 (100.0%) | 2.30 |
Household Size by Marriage Status in Runaway Bay
Out of a total of 715 households in Runaway Bay, 506 (70.8%) are family households, while 209 (29.2%) are nonfamily households. The most numerous type of family households are 2-person households, comprising 310, and the most common type of nonfamily households are 1-person households, comprising 180.
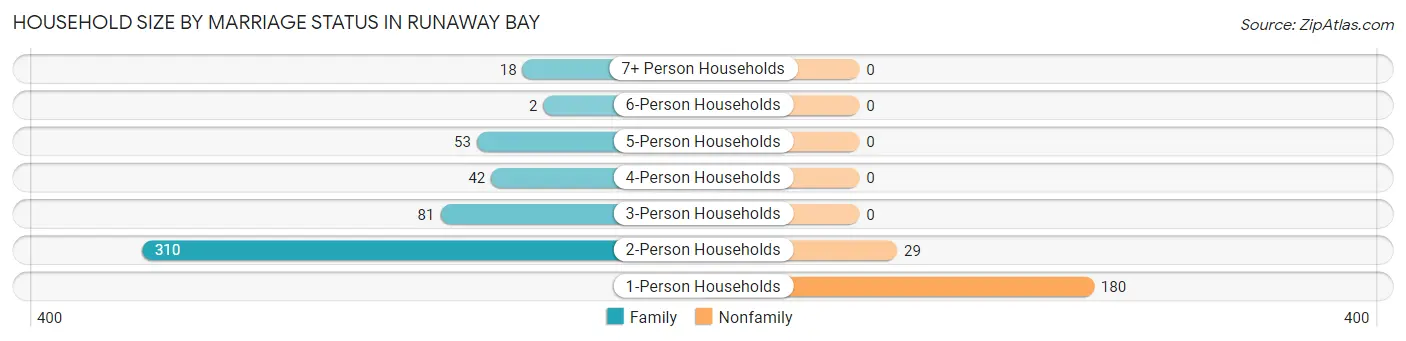
| Household Size | Family Households | Nonfamily Households |
| 1-Person Households | - | 180 (25.2%) |
| 2-Person Households | 310 (43.4%) | 29 (4.1%) |
| 3-Person Households | 81 (11.3%) | 0 (0.0%) |
| 4-Person Households | 42 (5.9%) | 0 (0.0%) |
| 5-Person Households | 53 (7.4%) | 0 (0.0%) |
| 6-Person Households | 2 (0.3%) | 0 (0.0%) |
| 7+ Person Households | 18 (2.5%) | 0 (0.0%) |
| Total | 506 (70.8%) | 209 (29.2%) |
Female Fertility in Runaway Bay
Fertility by Age in Runaway Bay
Average fertility rate in Runaway Bay is 46.0 births per 1,000 women. Women in the age bracket of 20 to 34 years have the highest fertility rate with 143.0 births per 1,000 women. Women in the age bracket of 20 to 34 years acount for 81.8% of all women with births.
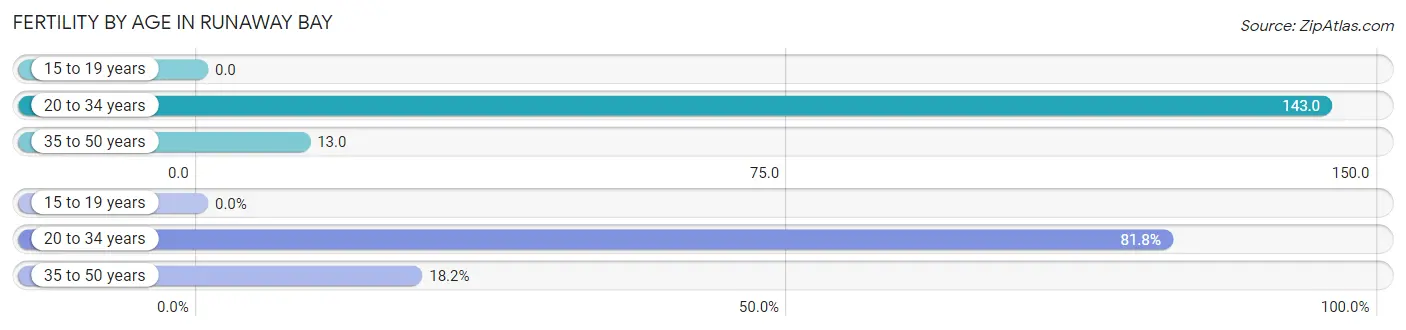
| Age Bracket | Women with Births | Births / 1,000 Women |
| 15 to 19 years | 0 (0.0%) | 0.0 |
| 20 to 34 years | 9 (81.8%) | 143.0 |
| 35 to 50 years | 2 (18.2%) | 13.0 |
| Total | 11 (100.0%) | 46.0 |
Fertility by Age by Marriage Status in Runaway Bay
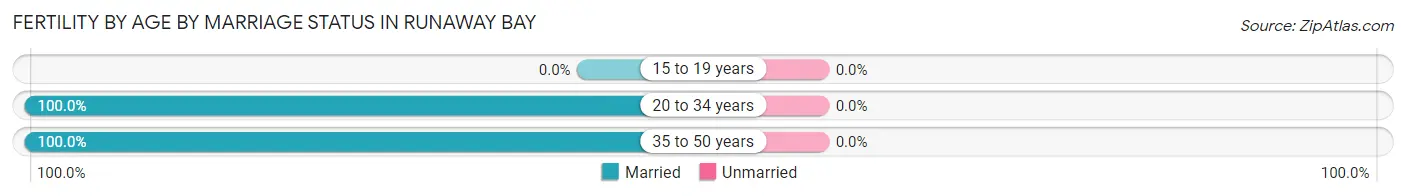
| Age Bracket | Married | Unmarried |
| 15 to 19 years | 0 (0.0%) | 0 (0.0%) |
| 20 to 34 years | 9 (100.0%) | 0 (0.0%) |
| 35 to 50 years | 2 (100.0%) | 0 (0.0%) |
| Total | 11 (100.0%) | 0 (0.0%) |
Fertility by Education in Runaway Bay
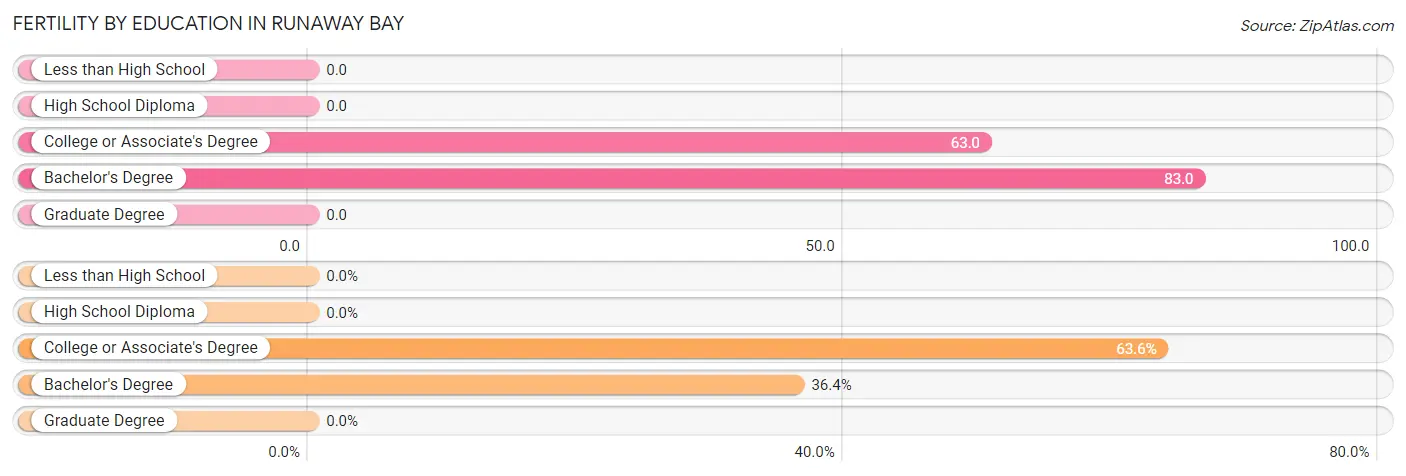
| Educational Attainment | Women with Births | Births / 1,000 Women |
| Less than High School | 0 (0.0%) | 0.0 |
| High School Diploma | 0 (0.0%) | 0.0 |
| College or Associate's Degree | 7 (63.6%) | 63.0 |
| Bachelor's Degree | 4 (36.4%) | 83.0 |
| Graduate Degree | 0 (0.0%) | 0.0 |
| Total | 11 (100.0%) | 46.0 |
Fertility by Education by Marriage Status in Runaway Bay
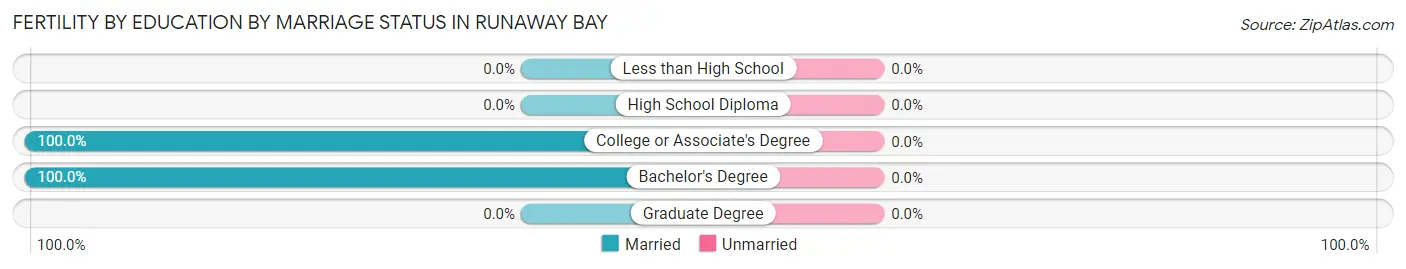
| Educational Attainment | Married | Unmarried |
| Less than High School | 0 (0.0%) | 0 (0.0%) |
| High School Diploma | 0 (0.0%) | 0 (0.0%) |
| College or Associate's Degree | 7 (100.0%) | 0 (0.0%) |
| Bachelor's Degree | 4 (100.0%) | 0 (0.0%) |
| Graduate Degree | 0 (0.0%) | 0 (0.0%) |
| Total | 11 (100.0%) | 0 (0.0%) |
Employment Characteristics in Runaway Bay
Employment by Class of Employer in Runaway Bay
Among the 764 employed individuals in Runaway Bay, private company employees (437 | 57.2%), self-employed (not incorporated) (104 | 13.6%), and local government employees (60 | 7.9%) make up the most common classes of employment.
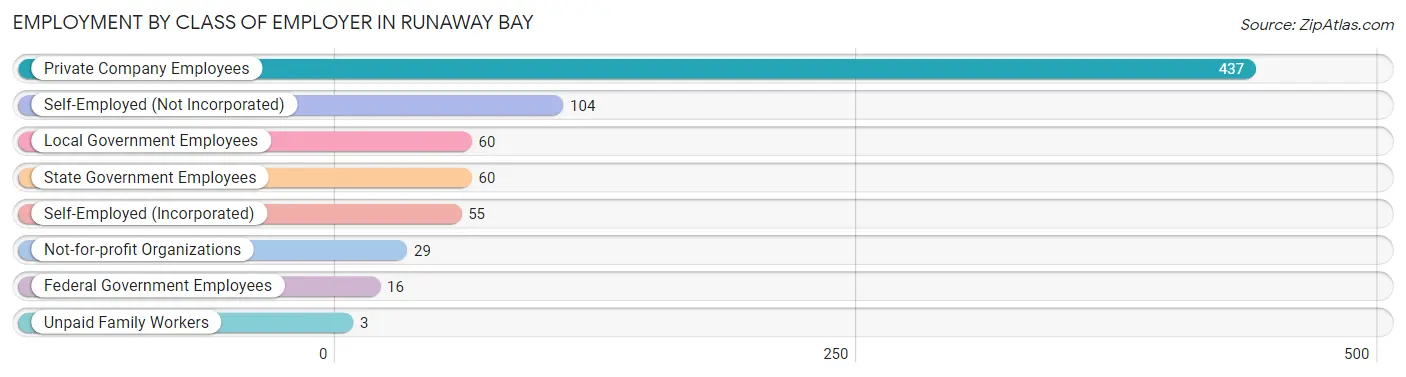
| Employer Class | # Employees | % Employees |
| Private Company Employees | 437 | 57.2% |
| Self-Employed (Incorporated) | 55 | 7.2% |
| Self-Employed (Not Incorporated) | 104 | 13.6% |
| Not-for-profit Organizations | 29 | 3.8% |
| Local Government Employees | 60 | 7.9% |
| State Government Employees | 60 | 7.9% |
| Federal Government Employees | 16 | 2.1% |
| Unpaid Family Workers | 3 | 0.4% |
| Total | 764 | 100.0% |
Employment Status by Age in Runaway Bay
According to the labor force statistics for Runaway Bay, out of the total population over 16 years of age (1,428), 56.0% or 800 individuals are in the labor force, with 4.4% or 35 of them unemployed. The age group with the highest labor force participation rate is 20 to 24 years, with 87.5% or 56 individuals in the labor force. Within the labor force, the 20 to 24 years age range has the highest percentage of unemployed individuals, with 21.4% or 12 of them being unemployed.
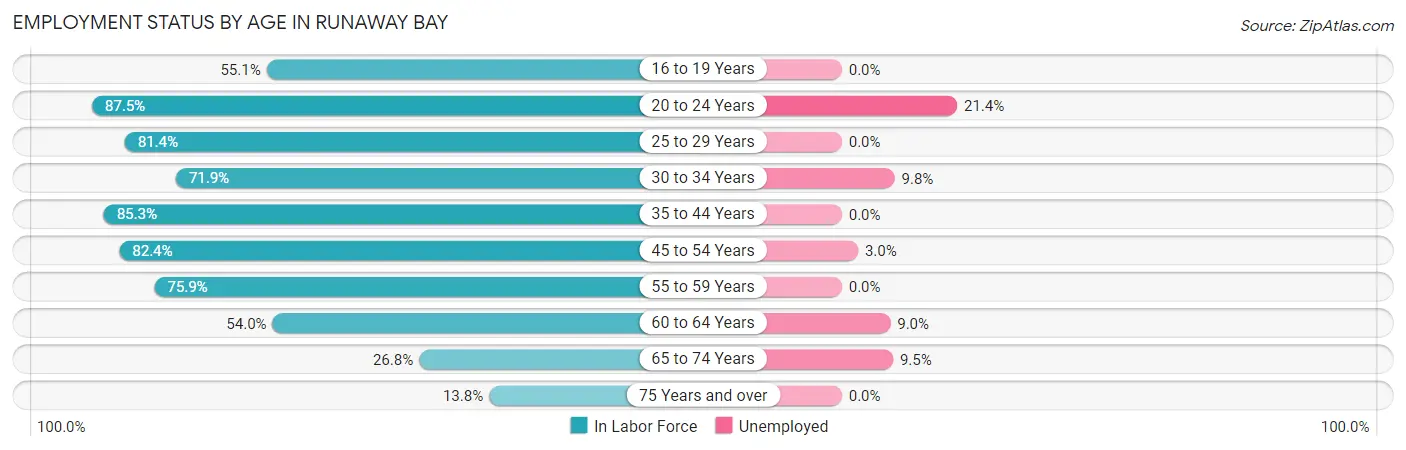
| Age Bracket | In Labor Force | Unemployed |
| 16 to 19 Years | 54 (55.1%) | 0 (0.0%) |
| 20 to 24 Years | 56 (87.5%) | 12 (21.4%) |
| 25 to 29 Years | 35 (81.4%) | 0 (0.0%) |
| 30 to 34 Years | 41 (71.9%) | 4 (9.8%) |
| 35 to 44 Years | 157 (85.3%) | 0 (0.0%) |
| 45 to 54 Years | 168 (82.4%) | 5 (3.0%) |
| 55 to 59 Years | 110 (75.9%) | 0 (0.0%) |
| 60 to 64 Years | 67 (54.0%) | 6 (9.0%) |
| 65 to 74 Years | 84 (26.8%) | 8 (9.5%) |
| 75 Years and over | 27 (13.8%) | 0 (0.0%) |
| Total | 800 (56.0%) | 35 (4.4%) |
Employment Status by Educational Attainment in Runaway Bay
According to labor force statistics for Runaway Bay, 76.4% of individuals (578) out of the total population between 25 and 64 years of age (757) are in the labor force, with 2.6% or 15 of them being unemployed. The group with the highest labor force participation rate are those with the educational attainment of college / associate degree, with 83.1% or 256 individuals in the labor force. Within the labor force, individuals with college / associate degree education have the highest percentage of unemployment, with 4.3% or 11 of them being unemployed.
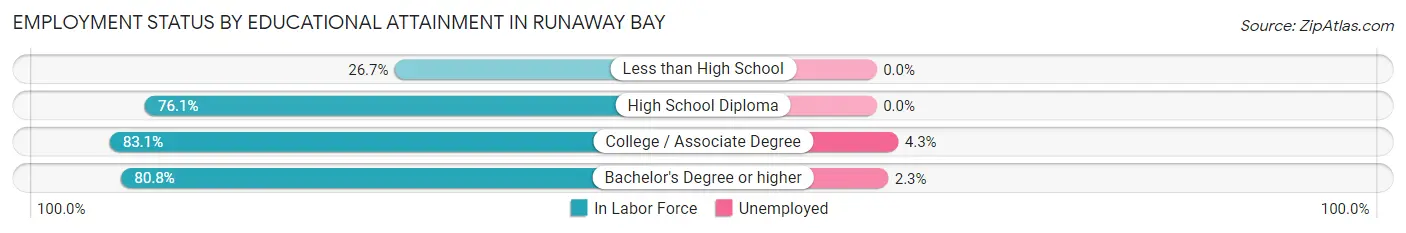
| Educational Attainment | In Labor Force | Unemployed |
| Less than High School | 16 (26.7%) | 0 (0.0%) |
| High School Diploma | 134 (76.1%) | 0 (0.0%) |
| College / Associate Degree | 256 (83.1%) | 13 (4.3%) |
| Bachelor's Degree or higher | 172 (80.8%) | 5 (2.3%) |
| Total | 578 (76.4%) | 20 (2.6%) |
Employment Occupations by Sex in Runaway Bay
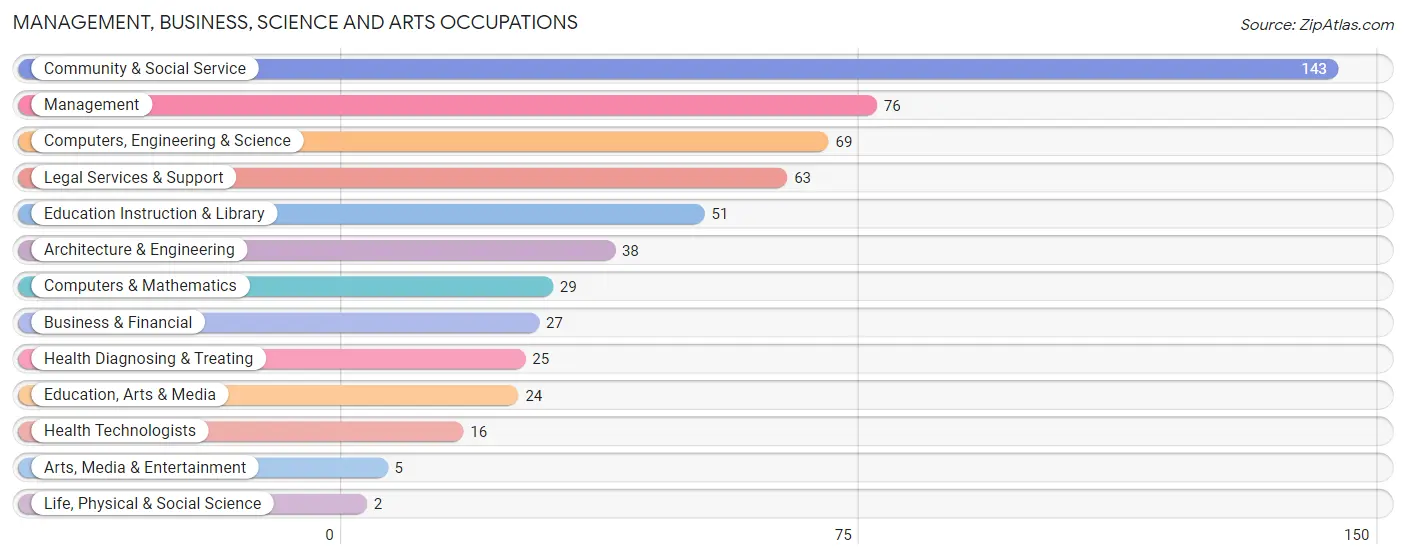
Management, Business, Science and Arts Occupations
The most common Management, Business, Science and Arts occupations in Runaway Bay are Community & Social Service (143 | 18.7%), Management (76 | 10.0%), Computers, Engineering & Science (69 | 9.0%), Legal Services & Support (63 | 8.3%), and Education Instruction & Library (51 | 6.7%).
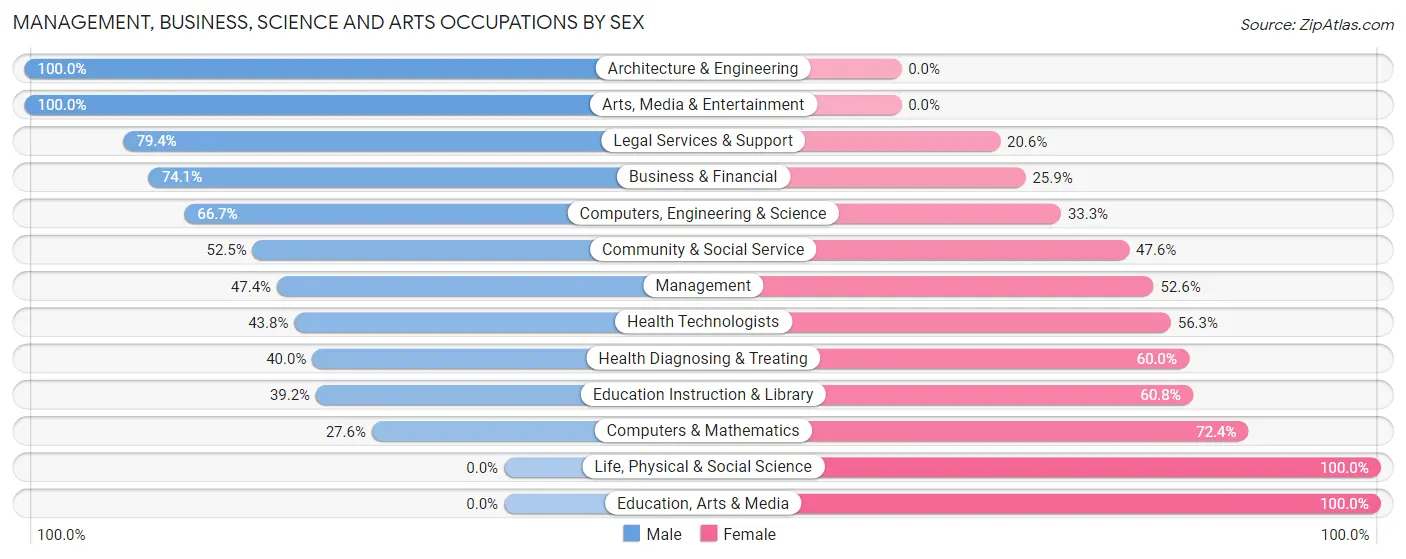
Management, Business, Science and Arts Occupations by Sex
Within the Management, Business, Science and Arts occupations in Runaway Bay, the most male-oriented occupations are Architecture & Engineering (100.0%), Arts, Media & Entertainment (100.0%), and Legal Services & Support (79.4%), while the most female-oriented occupations are Life, Physical & Social Science (100.0%), Education, Arts & Media (100.0%), and Computers & Mathematics (72.4%).
| Occupation | Male | Female |
| Management | 36 (47.4%) | 40 (52.6%) |
| Business & Financial | 20 (74.1%) | 7 (25.9%) |
| Computers, Engineering & Science | 46 (66.7%) | 23 (33.3%) |
| Computers & Mathematics | 8 (27.6%) | 21 (72.4%) |
| Architecture & Engineering | 38 (100.0%) | 0 (0.0%) |
| Life, Physical & Social Science | 0 (0.0%) | 2 (100.0%) |
| Community & Social Service | 75 (52.4%) | 68 (47.5%) |
| Education, Arts & Media | 0 (0.0%) | 24 (100.0%) |
| Legal Services & Support | 50 (79.4%) | 13 (20.6%) |
| Education Instruction & Library | 20 (39.2%) | 31 (60.8%) |
| Arts, Media & Entertainment | 5 (100.0%) | 0 (0.0%) |
| Health Diagnosing & Treating | 10 (40.0%) | 15 (60.0%) |
| Health Technologists | 7 (43.8%) | 9 (56.2%) |
| Total (Category) | 187 (55.0%) | 153 (45.0%) |
| Total (Overall) | 488 (63.9%) | 276 (36.1%) |
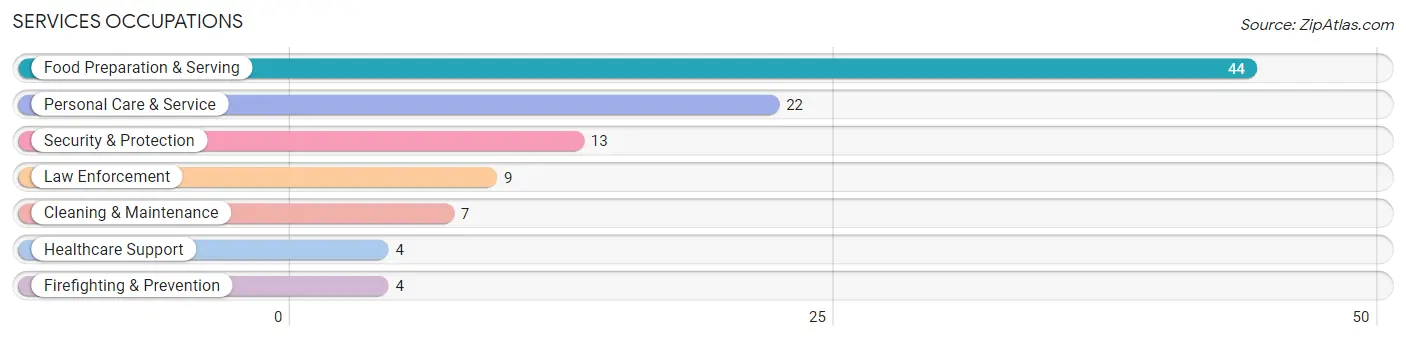
Services Occupations
The most common Services occupations in Runaway Bay are Food Preparation & Serving (44 | 5.8%), Personal Care & Service (22 | 2.9%), Security & Protection (13 | 1.7%), Law Enforcement (9 | 1.2%), and Cleaning & Maintenance (7 | 0.9%).
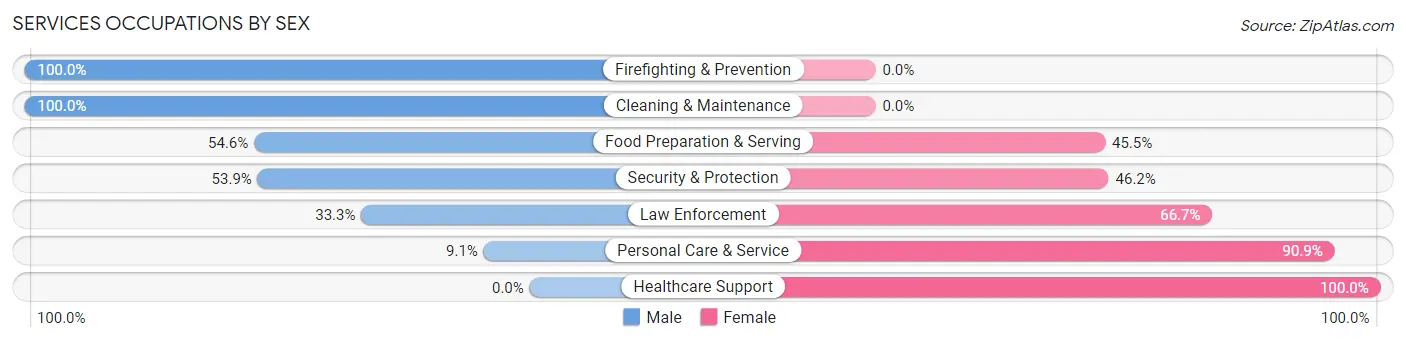
Services Occupations by Sex
Within the Services occupations in Runaway Bay, the most male-oriented occupations are Firefighting & Prevention (100.0%), Cleaning & Maintenance (100.0%), and Food Preparation & Serving (54.5%), while the most female-oriented occupations are Healthcare Support (100.0%), Personal Care & Service (90.9%), and Law Enforcement (66.7%).
| Occupation | Male | Female |
| Healthcare Support | 0 (0.0%) | 4 (100.0%) |
| Security & Protection | 7 (53.8%) | 6 (46.2%) |
| Firefighting & Prevention | 4 (100.0%) | 0 (0.0%) |
| Law Enforcement | 3 (33.3%) | 6 (66.7%) |
| Food Preparation & Serving | 24 (54.5%) | 20 (45.5%) |
| Cleaning & Maintenance | 7 (100.0%) | 0 (0.0%) |
| Personal Care & Service | 2 (9.1%) | 20 (90.9%) |
| Total (Category) | 40 (44.4%) | 50 (55.6%) |
| Total (Overall) | 488 (63.9%) | 276 (36.1%) |
Sales and Office Occupations
The most common Sales and Office occupations in Runaway Bay are Sales & Related (70 | 9.2%), and Office & Administration (64 | 8.4%).
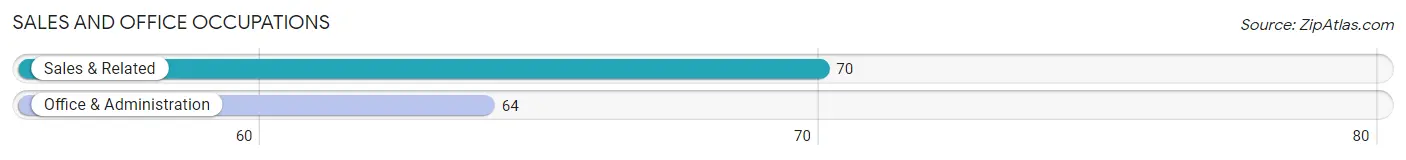
Sales and Office Occupations by Sex
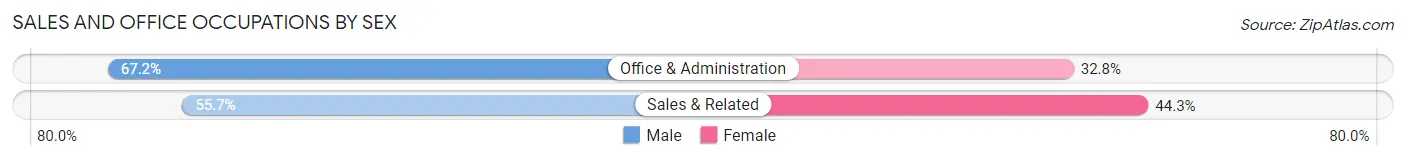
| Occupation | Male | Female |
| Sales & Related | 39 (55.7%) | 31 (44.3%) |
| Office & Administration | 43 (67.2%) | 21 (32.8%) |
| Total (Category) | 82 (61.2%) | 52 (38.8%) |
| Total (Overall) | 488 (63.9%) | 276 (36.1%) |
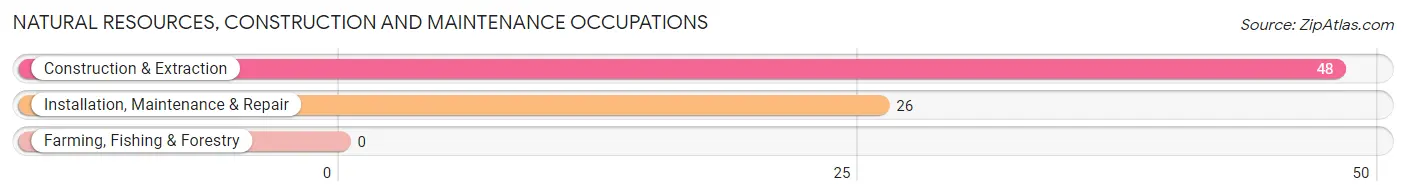
Natural Resources, Construction and Maintenance Occupations
The most common Natural Resources, Construction and Maintenance occupations in Runaway Bay are Construction & Extraction (48 | 6.3%), and Installation, Maintenance & Repair (26 | 3.4%).
Natural Resources, Construction and Maintenance Occupations by Sex
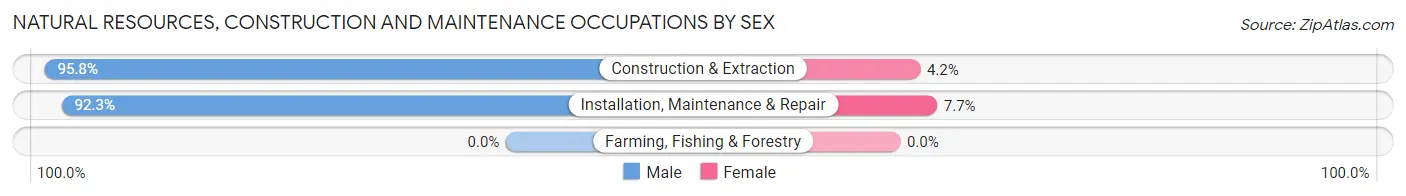
| Occupation | Male | Female |
| Farming, Fishing & Forestry | 0 (0.0%) | 0 (0.0%) |
| Construction & Extraction | 46 (95.8%) | 2 (4.2%) |
| Installation, Maintenance & Repair | 24 (92.3%) | 2 (7.7%) |
| Total (Category) | 70 (94.6%) | 4 (5.4%) |
| Total (Overall) | 488 (63.9%) | 276 (36.1%) |
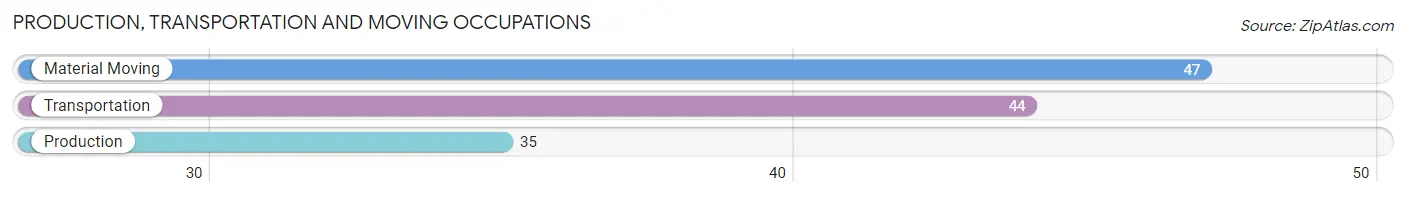
Production, Transportation and Moving Occupations
The most common Production, Transportation and Moving occupations in Runaway Bay are Material Moving (47 | 6.1%), Transportation (44 | 5.8%), and Production (35 | 4.6%).
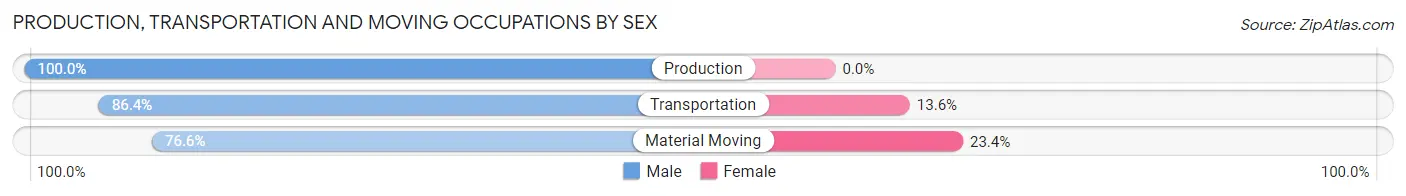
Production, Transportation and Moving Occupations by Sex
| Occupation | Male | Female |
| Production | 35 (100.0%) | 0 (0.0%) |
| Transportation | 38 (86.4%) | 6 (13.6%) |
| Material Moving | 36 (76.6%) | 11 (23.4%) |
| Total (Category) | 109 (86.5%) | 17 (13.5%) |
| Total (Overall) | 488 (63.9%) | 276 (36.1%) |
Employment Industries by Sex in Runaway Bay
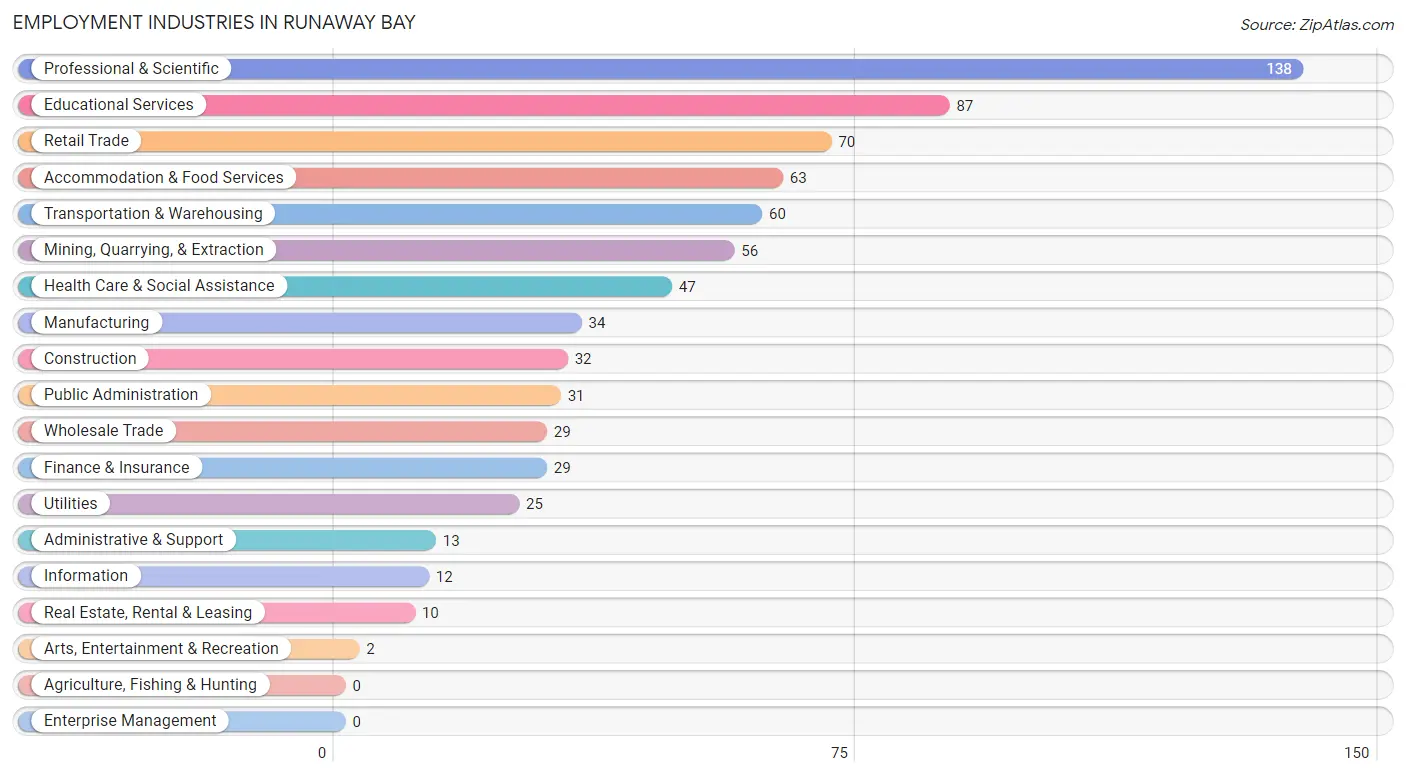
Employment Industries in Runaway Bay
The major employment industries in Runaway Bay include Professional & Scientific (138 | 18.1%), Educational Services (87 | 11.4%), Retail Trade (70 | 9.2%), Accommodation & Food Services (63 | 8.3%), and Transportation & Warehousing (60 | 7.9%).
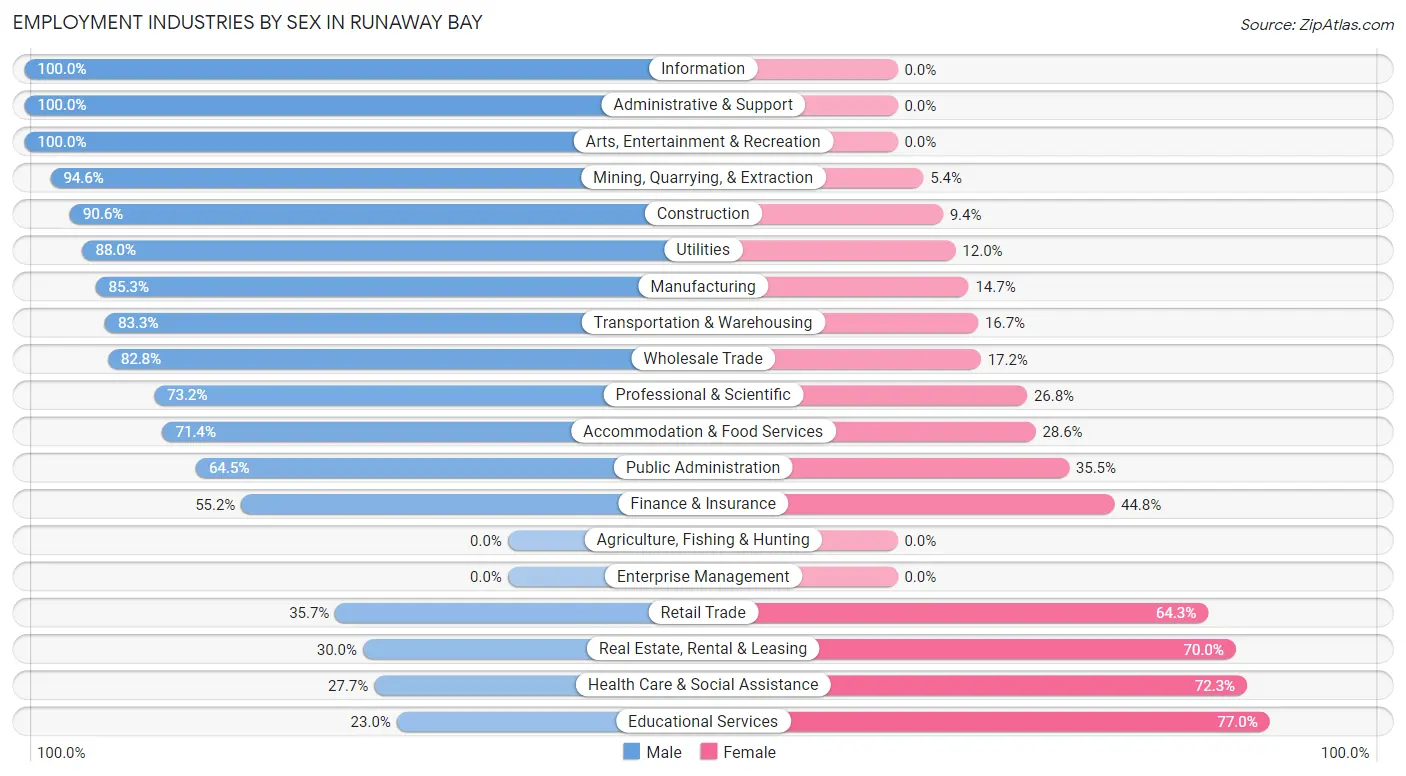
Employment Industries by Sex in Runaway Bay
The Runaway Bay industries that see more men than women are Information (100.0%), Administrative & Support (100.0%), and Arts, Entertainment & Recreation (100.0%), whereas the industries that tend to have a higher number of women are Educational Services (77.0%), Health Care & Social Assistance (72.3%), and Real Estate, Rental & Leasing (70.0%).
| Industry | Male | Female |
| Agriculture, Fishing & Hunting | 0 (0.0%) | 0 (0.0%) |
| Mining, Quarrying, & Extraction | 53 (94.6%) | 3 (5.4%) |
| Construction | 29 (90.6%) | 3 (9.4%) |
| Manufacturing | 29 (85.3%) | 5 (14.7%) |
| Wholesale Trade | 24 (82.8%) | 5 (17.2%) |
| Retail Trade | 25 (35.7%) | 45 (64.3%) |
| Transportation & Warehousing | 50 (83.3%) | 10 (16.7%) |
| Utilities | 22 (88.0%) | 3 (12.0%) |
| Information | 12 (100.0%) | 0 (0.0%) |
| Finance & Insurance | 16 (55.2%) | 13 (44.8%) |
| Real Estate, Rental & Leasing | 3 (30.0%) | 7 (70.0%) |
| Professional & Scientific | 101 (73.2%) | 37 (26.8%) |
| Enterprise Management | 0 (0.0%) | 0 (0.0%) |
| Administrative & Support | 13 (100.0%) | 0 (0.0%) |
| Educational Services | 20 (23.0%) | 67 (77.0%) |
| Health Care & Social Assistance | 13 (27.7%) | 34 (72.3%) |
| Arts, Entertainment & Recreation | 2 (100.0%) | 0 (0.0%) |
| Accommodation & Food Services | 45 (71.4%) | 18 (28.6%) |
| Public Administration | 20 (64.5%) | 11 (35.5%) |
| Total | 488 (63.9%) | 276 (36.1%) |
Education in Runaway Bay
School Enrollment in Runaway Bay
The most common levels of schooling among the 226 students in Runaway Bay are high school (72 | 31.9%), middle school (58 | 25.7%), and elementary school (38 | 16.8%).
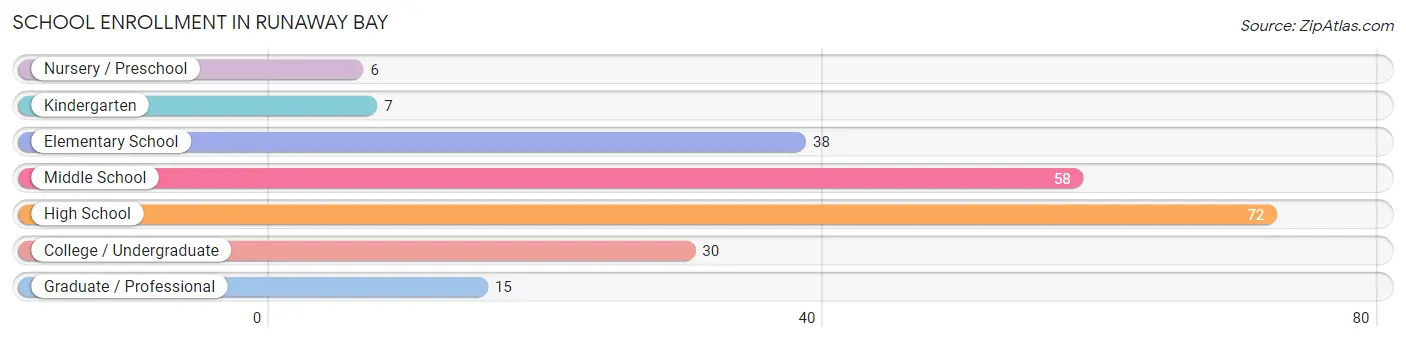
| School Level | # Students | % Students |
| Nursery / Preschool | 6 | 2.6% |
| Kindergarten | 7 | 3.1% |
| Elementary School | 38 | 16.8% |
| Middle School | 58 | 25.7% |
| High School | 72 | 31.9% |
| College / Undergraduate | 30 | 13.3% |
| Graduate / Professional | 15 | 6.6% |
| Total | 226 | 100.0% |
School Enrollment by Age by Funding Source in Runaway Bay
Out of a total of 226 students who are enrolled in schools in Runaway Bay, 75 (33.2%) attend a private institution, while the remaining 151 (66.8%) are enrolled in public schools. The age group of 3 to 4 year olds has the highest likelihood of being enrolled in private schools, with 2 (100.0% in the age bracket) enrolled. Conversely, the age group of 10 to 14 year olds has the lowest likelihood of being enrolled in a private school, with 90 (90.9% in the age bracket) attending a public institution.
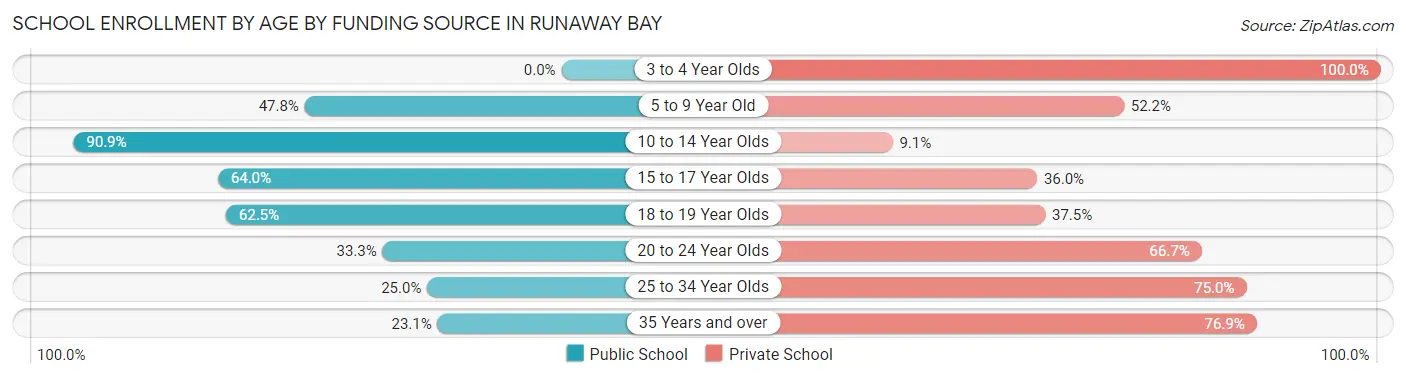
| Age Bracket | Public School | Private School |
| 3 to 4 Year Olds | 0 (0.0%) | 2 (100.0%) |
| 5 to 9 Year Old | 22 (47.8%) | 24 (52.2%) |
| 10 to 14 Year Olds | 90 (90.9%) | 9 (9.1%) |
| 15 to 17 Year Olds | 16 (64.0%) | 9 (36.0%) |
| 18 to 19 Year Olds | 15 (62.5%) | 9 (37.5%) |
| 20 to 24 Year Olds | 3 (33.3%) | 6 (66.7%) |
| 25 to 34 Year Olds | 2 (25.0%) | 6 (75.0%) |
| 35 Years and over | 3 (23.1%) | 10 (76.9%) |
| Total | 151 (66.8%) | 75 (33.2%) |
Educational Attainment by Field of Study in Runaway Bay
Business (129 | 28.5%), education (122 | 27.0%), liberal arts & history (36 | 8.0%), science & technology (33 | 7.3%), and visual & performing arts (30 | 6.6%) are the most common fields of study among 452 individuals in Runaway Bay who have obtained a bachelor's degree or higher.
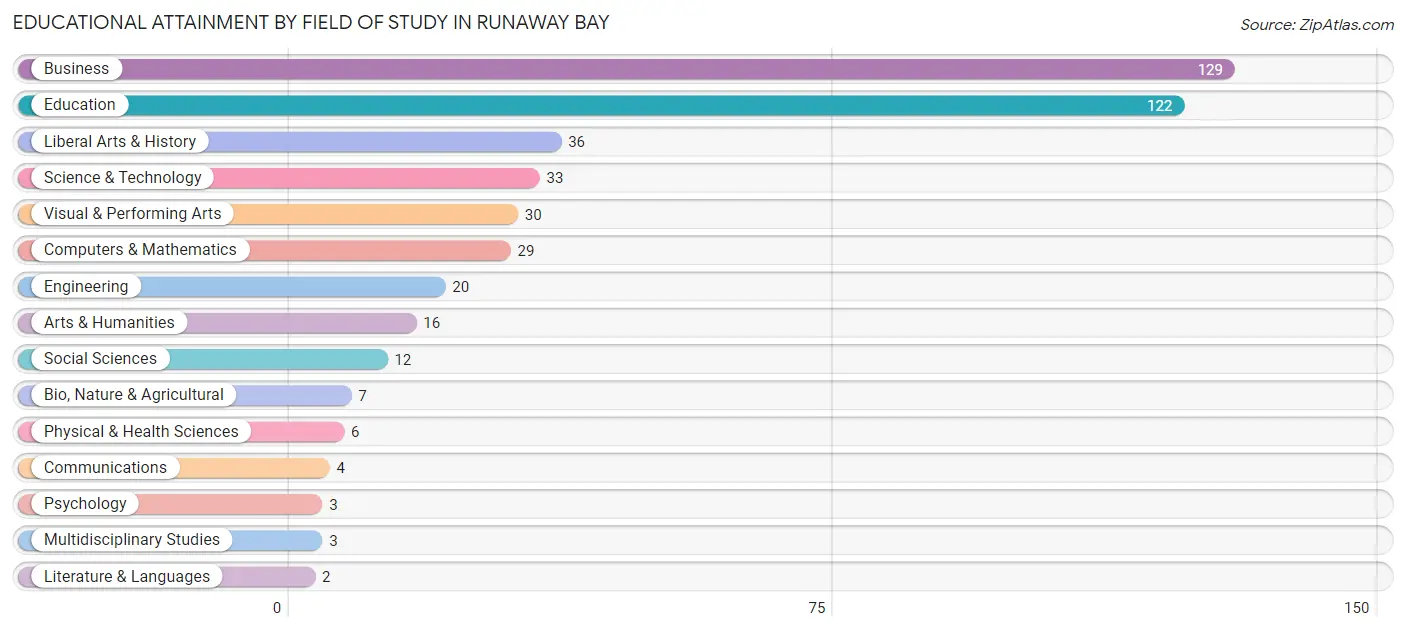
| Field of Study | # Graduates | % Graduates |
| Computers & Mathematics | 29 | 6.4% |
| Bio, Nature & Agricultural | 7 | 1.5% |
| Physical & Health Sciences | 6 | 1.3% |
| Psychology | 3 | 0.7% |
| Social Sciences | 12 | 2.6% |
| Engineering | 20 | 4.4% |
| Multidisciplinary Studies | 3 | 0.7% |
| Science & Technology | 33 | 7.3% |
| Business | 129 | 28.5% |
| Education | 122 | 27.0% |
| Literature & Languages | 2 | 0.4% |
| Liberal Arts & History | 36 | 8.0% |
| Visual & Performing Arts | 30 | 6.6% |
| Communications | 4 | 0.9% |
| Arts & Humanities | 16 | 3.5% |
| Total | 452 | 100.0% |
Transportation & Commute in Runaway Bay
Vehicle Availability by Sex in Runaway Bay
The most prevalent vehicle ownership categories in Runaway Bay are males with 2 vehicles (162, accounting for 33.2%) and females with 2 vehicles (96, making up 58.7%).
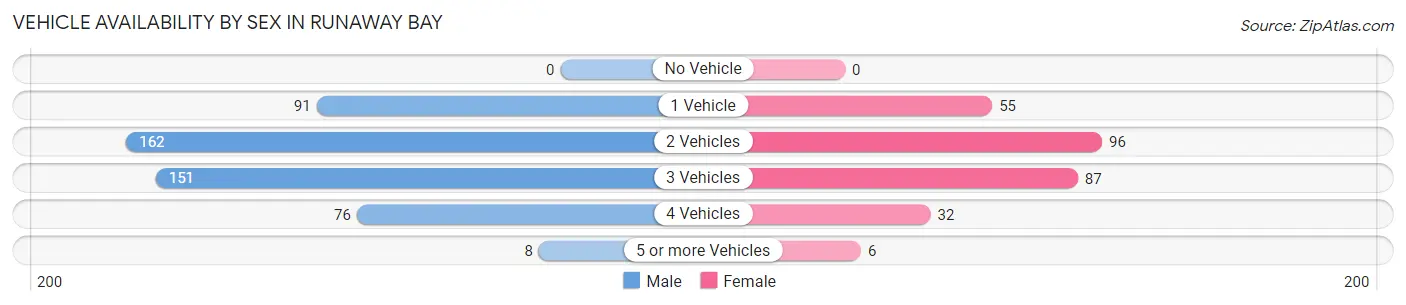
| Vehicles Available | Male | Female |
| No Vehicle | 0 (0.0%) | 0 (0.0%) |
| 1 Vehicle | 91 (18.6%) | 55 (19.9%) |
| 2 Vehicles | 162 (33.2%) | 96 (34.8%) |
| 3 Vehicles | 151 (30.9%) | 87 (31.5%) |
| 4 Vehicles | 76 (15.6%) | 32 (11.6%) |
| 5 or more Vehicles | 8 (1.6%) | 6 (2.2%) |
| Total | 488 (100.0%) | 276 (100.0%) |
Commute Time in Runaway Bay
The most frequently occuring commute durations in Runaway Bay are 30 to 34 minutes (163 commuters, 25.4%), 15 to 19 minutes (99 commuters, 15.4%), and 60 to 89 minutes (69 commuters, 10.7%).
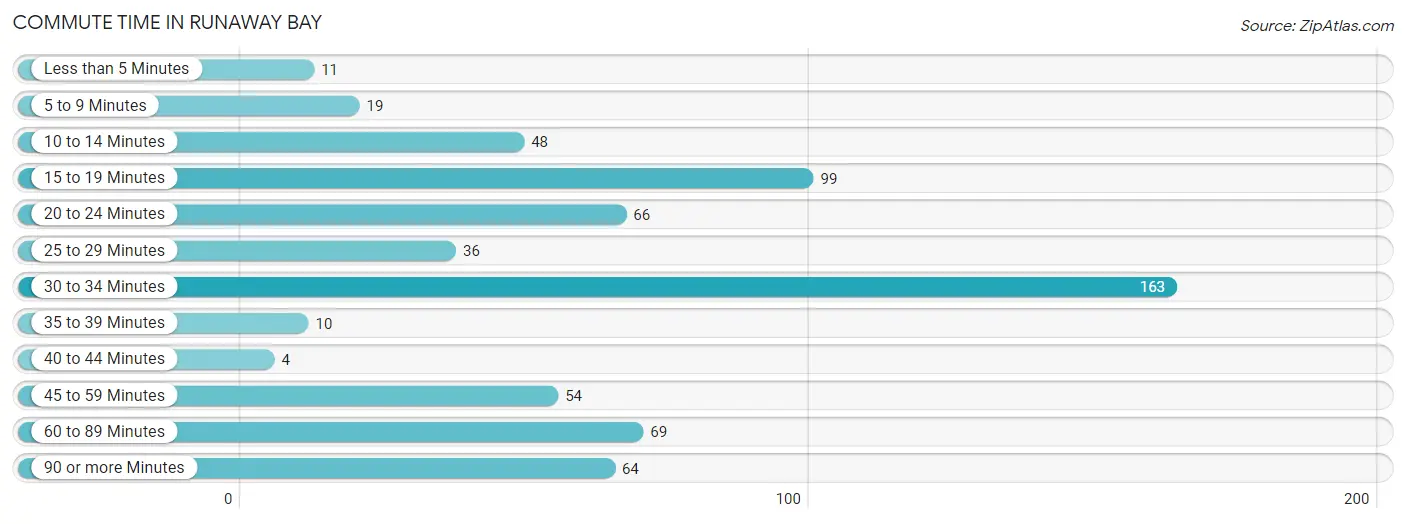
| Commute Time | # Commuters | % Commuters |
| Less than 5 Minutes | 11 | 1.7% |
| 5 to 9 Minutes | 19 | 2.9% |
| 10 to 14 Minutes | 48 | 7.5% |
| 15 to 19 Minutes | 99 | 15.4% |
| 20 to 24 Minutes | 66 | 10.3% |
| 25 to 29 Minutes | 36 | 5.6% |
| 30 to 34 Minutes | 163 | 25.4% |
| 35 to 39 Minutes | 10 | 1.6% |
| 40 to 44 Minutes | 4 | 0.6% |
| 45 to 59 Minutes | 54 | 8.4% |
| 60 to 89 Minutes | 69 | 10.7% |
| 90 or more Minutes | 64 | 10.0% |
Commute Time by Sex in Runaway Bay
The most common commute times in Runaway Bay are 30 to 34 minutes (96 commuters, 22.8%) for males and 30 to 34 minutes (67 commuters, 30.2%) for females.
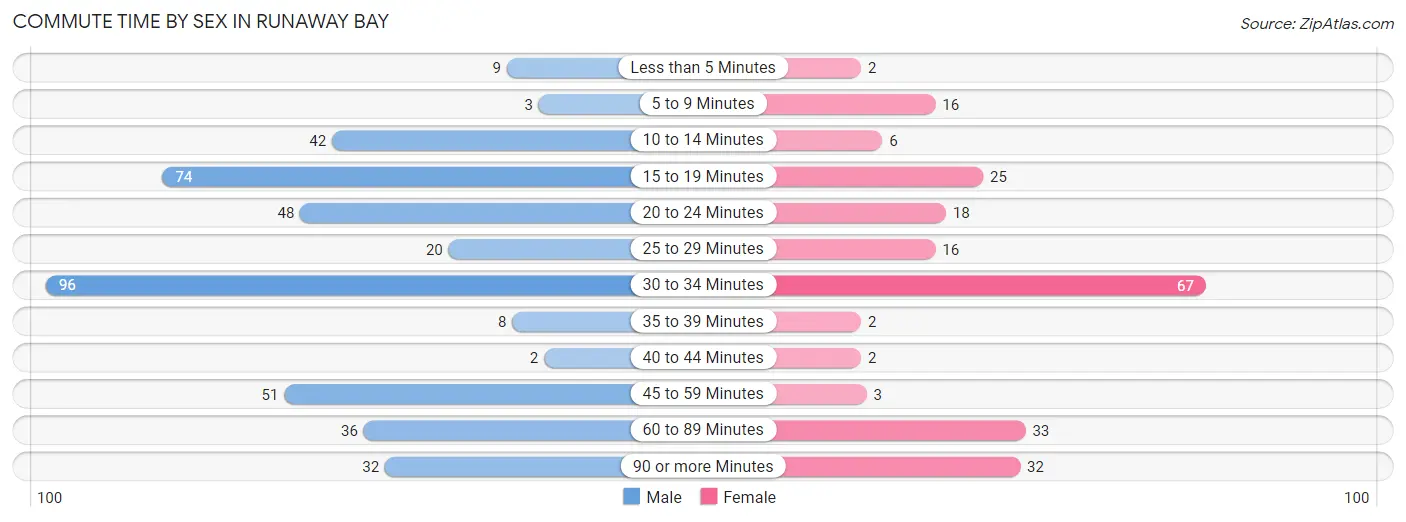
| Commute Time | Male | Female |
| Less than 5 Minutes | 9 (2.1%) | 2 (0.9%) |
| 5 to 9 Minutes | 3 (0.7%) | 16 (7.2%) |
| 10 to 14 Minutes | 42 (10.0%) | 6 (2.7%) |
| 15 to 19 Minutes | 74 (17.6%) | 25 (11.3%) |
| 20 to 24 Minutes | 48 (11.4%) | 18 (8.1%) |
| 25 to 29 Minutes | 20 (4.8%) | 16 (7.2%) |
| 30 to 34 Minutes | 96 (22.8%) | 67 (30.2%) |
| 35 to 39 Minutes | 8 (1.9%) | 2 (0.9%) |
| 40 to 44 Minutes | 2 (0.5%) | 2 (0.9%) |
| 45 to 59 Minutes | 51 (12.1%) | 3 (1.3%) |
| 60 to 89 Minutes | 36 (8.6%) | 33 (14.9%) |
| 90 or more Minutes | 32 (7.6%) | 32 (14.4%) |
Time of Departure to Work by Sex in Runaway Bay
The most frequent times of departure to work in Runaway Bay are 7:30 AM to 7:59 AM (86, 20.4%) for males and 8:00 AM to 8:29 AM (49, 22.1%) for females.
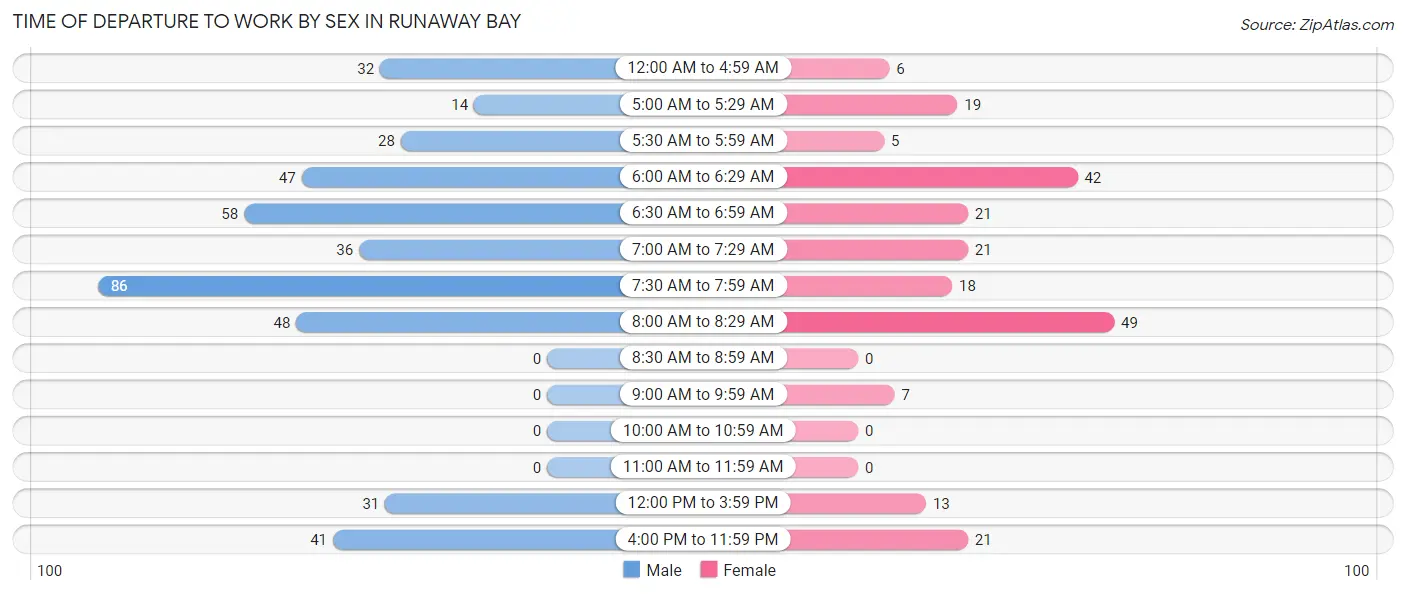
| Time of Departure | Male | Female |
| 12:00 AM to 4:59 AM | 32 (7.6%) | 6 (2.7%) |
| 5:00 AM to 5:29 AM | 14 (3.3%) | 19 (8.6%) |
| 5:30 AM to 5:59 AM | 28 (6.7%) | 5 (2.2%) |
| 6:00 AM to 6:29 AM | 47 (11.2%) | 42 (18.9%) |
| 6:30 AM to 6:59 AM | 58 (13.8%) | 21 (9.5%) |
| 7:00 AM to 7:29 AM | 36 (8.6%) | 21 (9.5%) |
| 7:30 AM to 7:59 AM | 86 (20.4%) | 18 (8.1%) |
| 8:00 AM to 8:29 AM | 48 (11.4%) | 49 (22.1%) |
| 8:30 AM to 8:59 AM | 0 (0.0%) | 0 (0.0%) |
| 9:00 AM to 9:59 AM | 0 (0.0%) | 7 (3.2%) |
| 10:00 AM to 10:59 AM | 0 (0.0%) | 0 (0.0%) |
| 11:00 AM to 11:59 AM | 0 (0.0%) | 0 (0.0%) |
| 12:00 PM to 3:59 PM | 31 (7.4%) | 13 (5.9%) |
| 4:00 PM to 11:59 PM | 41 (9.7%) | 21 (9.5%) |
| Total | 421 (100.0%) | 222 (100.0%) |
Housing Occupancy in Runaway Bay
Occupancy by Ownership in Runaway Bay
Of the total 715 dwellings in Runaway Bay, owner-occupied units account for 579 (81.0%), while renter-occupied units make up 136 (19.0%).
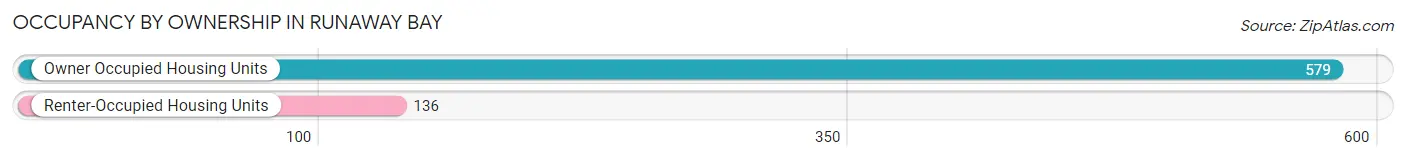
| Occupancy | # Housing Units | % Housing Units |
| Owner Occupied Housing Units | 579 | 81.0% |
| Renter-Occupied Housing Units | 136 | 19.0% |
| Total Occupied Housing Units | 715 | 100.0% |
Occupancy by Household Size in Runaway Bay
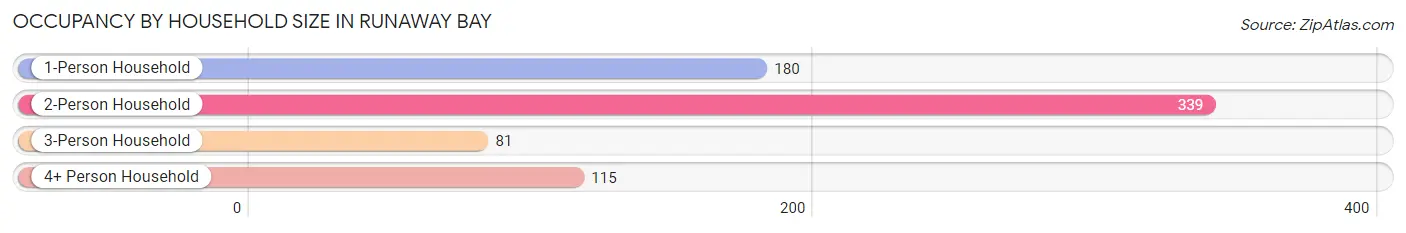
| Household Size | # Housing Units | % Housing Units |
| 1-Person Household | 180 | 25.2% |
| 2-Person Household | 339 | 47.4% |
| 3-Person Household | 81 | 11.3% |
| 4+ Person Household | 115 | 16.1% |
| Total Housing Units | 715 | 100.0% |
Occupancy by Ownership by Household Size in Runaway Bay
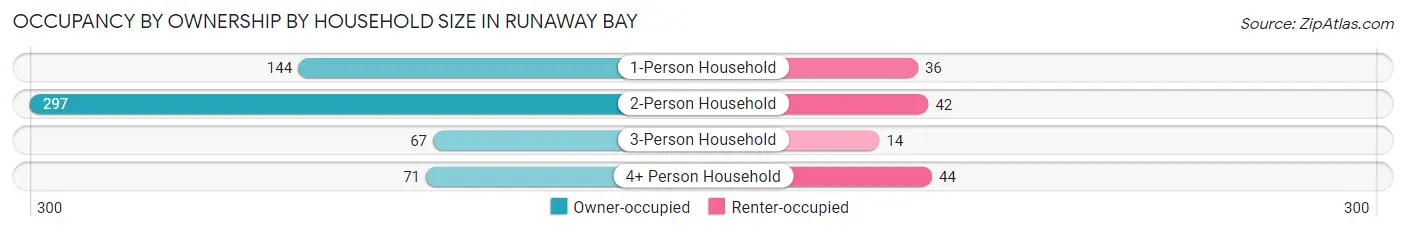
| Household Size | Owner-occupied | Renter-occupied |
| 1-Person Household | 144 (80.0%) | 36 (20.0%) |
| 2-Person Household | 297 (87.6%) | 42 (12.4%) |
| 3-Person Household | 67 (82.7%) | 14 (17.3%) |
| 4+ Person Household | 71 (61.7%) | 44 (38.3%) |
| Total Housing Units | 579 (81.0%) | 136 (19.0%) |
Occupancy by Educational Attainment in Runaway Bay
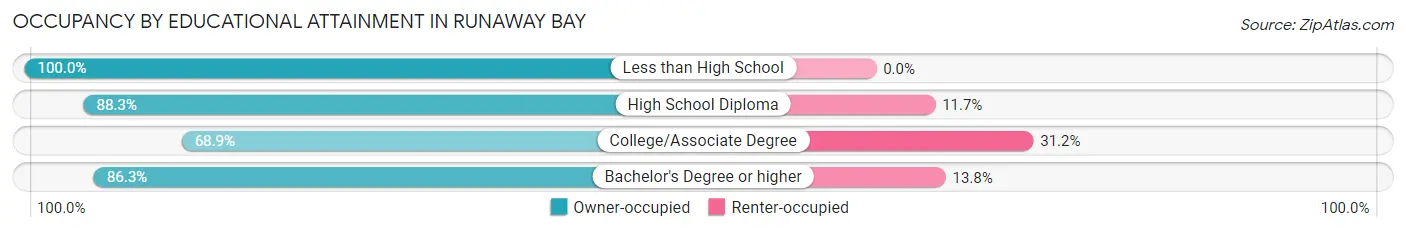
| Household Size | Owner-occupied | Renter-occupied |
| Less than High School | 9 (100.0%) | 0 (0.0%) |
| High School Diploma | 151 (88.3%) | 20 (11.7%) |
| College/Associate Degree | 168 (68.9%) | 76 (31.1%) |
| Bachelor's Degree or higher | 251 (86.3%) | 40 (13.8%) |
Occupancy by Age of Householder in Runaway Bay
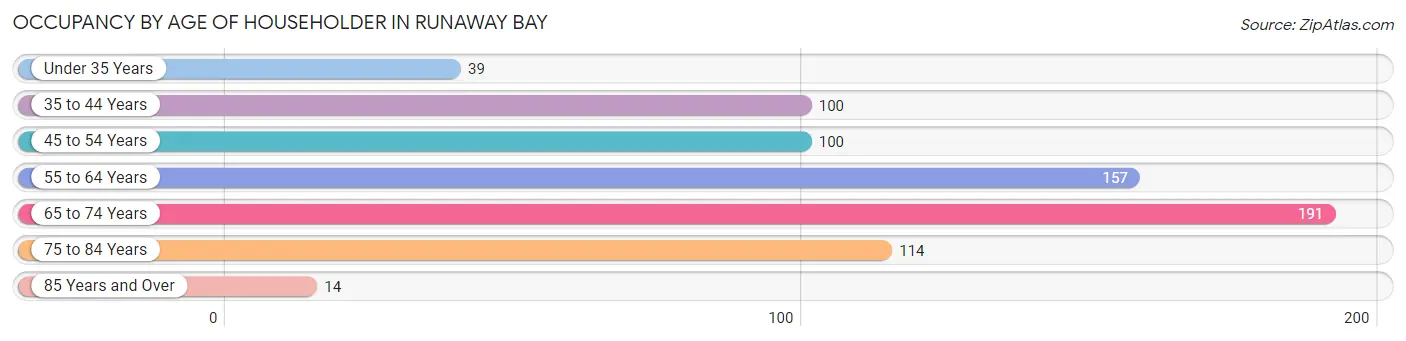
| Age Bracket | # Households | % Households |
| Under 35 Years | 39 | 5.4% |
| 35 to 44 Years | 100 | 14.0% |
| 45 to 54 Years | 100 | 14.0% |
| 55 to 64 Years | 157 | 22.0% |
| 65 to 74 Years | 191 | 26.7% |
| 75 to 84 Years | 114 | 15.9% |
| 85 Years and Over | 14 | 2.0% |
| Total | 715 | 100.0% |
Housing Finances in Runaway Bay
Median Income by Occupancy in Runaway Bay
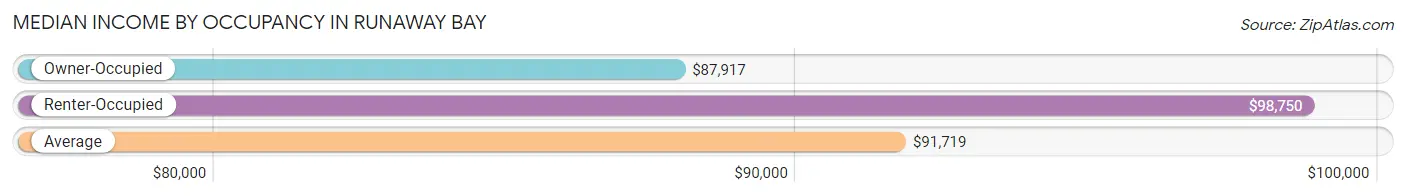
| Occupancy Type | # Households | Median Income |
| Owner-Occupied | 579 (81.0%) | $87,917 |
| Renter-Occupied | 136 (19.0%) | $98,750 |
| Average | 715 (100.0%) | $91,719 |
Occupancy by Householder Income Bracket in Runaway Bay
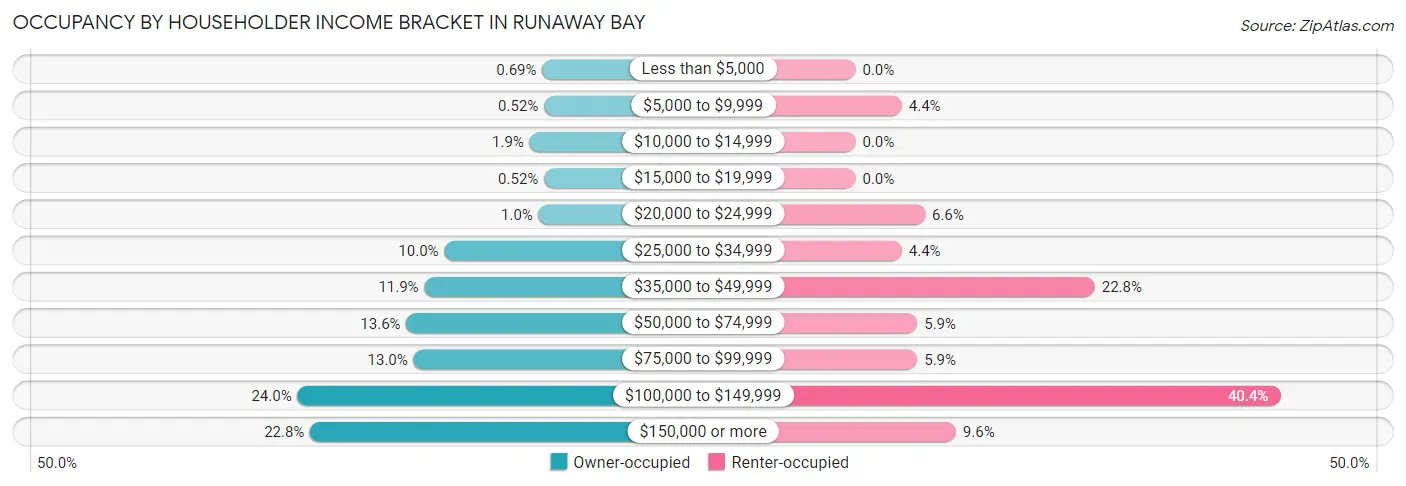
| Income Bracket | Owner-occupied | Renter-occupied |
| Less than $5,000 | 4 (0.7%) | 0 (0.0%) |
| $5,000 to $9,999 | 3 (0.5%) | 6 (4.4%) |
| $10,000 to $14,999 | 11 (1.9%) | 0 (0.0%) |
| $15,000 to $19,999 | 3 (0.5%) | 0 (0.0%) |
| $20,000 to $24,999 | 6 (1.0%) | 9 (6.6%) |
| $25,000 to $34,999 | 58 (10.0%) | 6 (4.4%) |
| $35,000 to $49,999 | 69 (11.9%) | 31 (22.8%) |
| $50,000 to $74,999 | 79 (13.6%) | 8 (5.9%) |
| $75,000 to $99,999 | 75 (13.0%) | 8 (5.9%) |
| $100,000 to $149,999 | 139 (24.0%) | 55 (40.4%) |
| $150,000 or more | 132 (22.8%) | 13 (9.6%) |
| Total | 579 (100.0%) | 136 (100.0%) |
Monthly Housing Cost Tiers in Runaway Bay
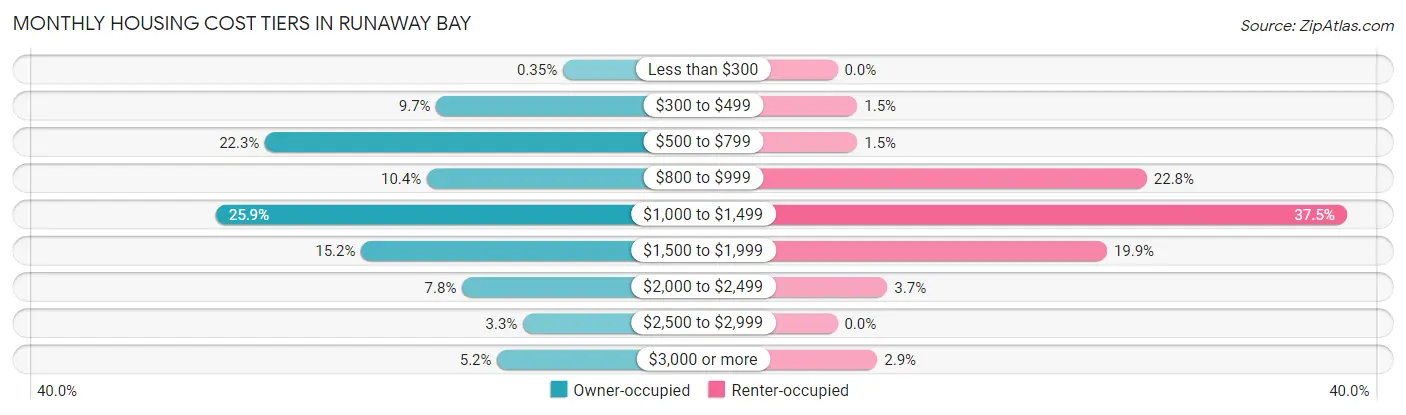
| Monthly Cost | Owner-occupied | Renter-occupied |
| Less than $300 | 2 (0.4%) | 0 (0.0%) |
| $300 to $499 | 56 (9.7%) | 2 (1.5%) |
| $500 to $799 | 129 (22.3%) | 2 (1.5%) |
| $800 to $999 | 60 (10.4%) | 31 (22.8%) |
| $1,000 to $1,499 | 150 (25.9%) | 51 (37.5%) |
| $1,500 to $1,999 | 88 (15.2%) | 27 (19.9%) |
| $2,000 to $2,499 | 45 (7.8%) | 5 (3.7%) |
| $2,500 to $2,999 | 19 (3.3%) | 0 (0.0%) |
| $3,000 or more | 30 (5.2%) | 4 (2.9%) |
| Total | 579 (100.0%) | 136 (100.0%) |
Physical Housing Characteristics in Runaway Bay
Housing Structures in Runaway Bay
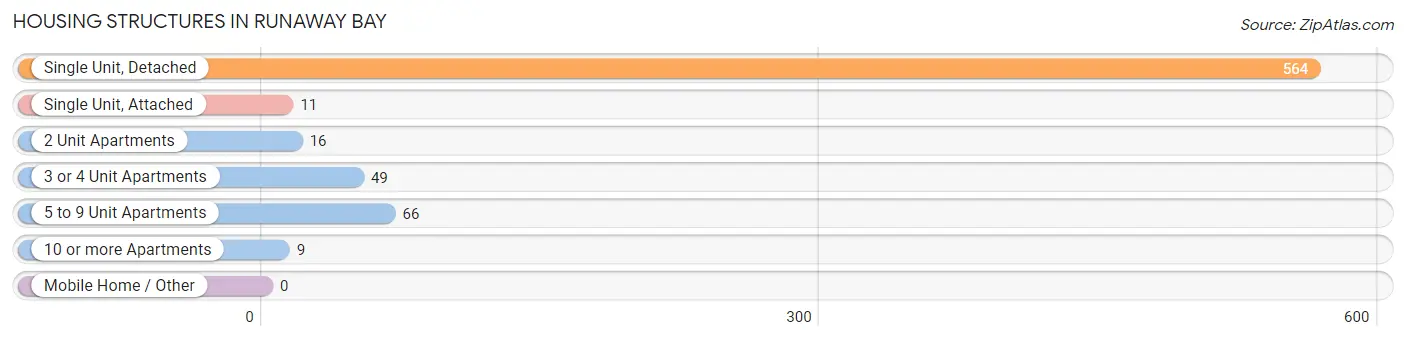
| Structure Type | # Housing Units | % Housing Units |
| Single Unit, Detached | 564 | 78.9% |
| Single Unit, Attached | 11 | 1.5% |
| 2 Unit Apartments | 16 | 2.2% |
| 3 or 4 Unit Apartments | 49 | 6.9% |
| 5 to 9 Unit Apartments | 66 | 9.2% |
| 10 or more Apartments | 9 | 1.3% |
| Mobile Home / Other | 0 | 0.0% |
| Total | 715 | 100.0% |
Housing Structures by Occupancy in Runaway Bay
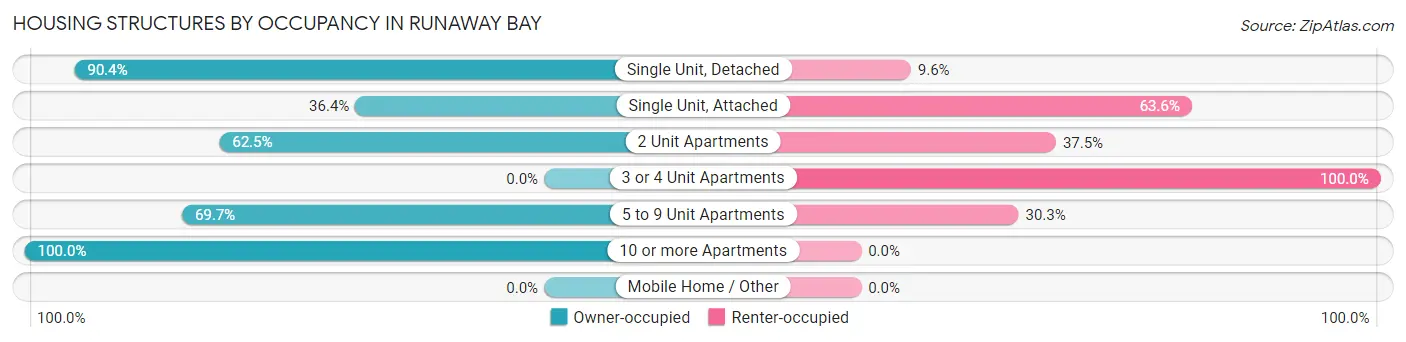
| Structure Type | Owner-occupied | Renter-occupied |
| Single Unit, Detached | 510 (90.4%) | 54 (9.6%) |
| Single Unit, Attached | 4 (36.4%) | 7 (63.6%) |
| 2 Unit Apartments | 10 (62.5%) | 6 (37.5%) |
| 3 or 4 Unit Apartments | 0 (0.0%) | 49 (100.0%) |
| 5 to 9 Unit Apartments | 46 (69.7%) | 20 (30.3%) |
| 10 or more Apartments | 9 (100.0%) | 0 (0.0%) |
| Mobile Home / Other | 0 (0.0%) | 0 (0.0%) |
| Total | 579 (81.0%) | 136 (19.0%) |
Housing Structures by Number of Rooms in Runaway Bay
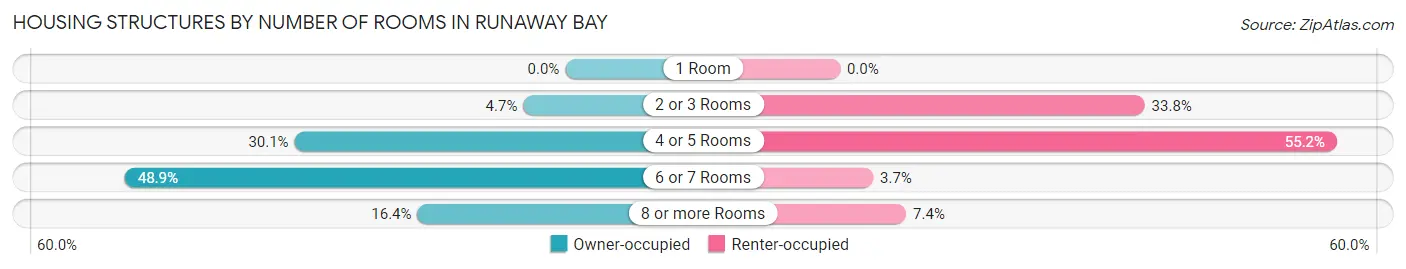
| Number of Rooms | Owner-occupied | Renter-occupied |
| 1 Room | 0 (0.0%) | 0 (0.0%) |
| 2 or 3 Rooms | 27 (4.7%) | 46 (33.8%) |
| 4 or 5 Rooms | 174 (30.0%) | 75 (55.1%) |
| 6 or 7 Rooms | 283 (48.9%) | 5 (3.7%) |
| 8 or more Rooms | 95 (16.4%) | 10 (7.3%) |
| Total | 579 (100.0%) | 136 (100.0%) |
Housing Structure by Heating Type in Runaway Bay
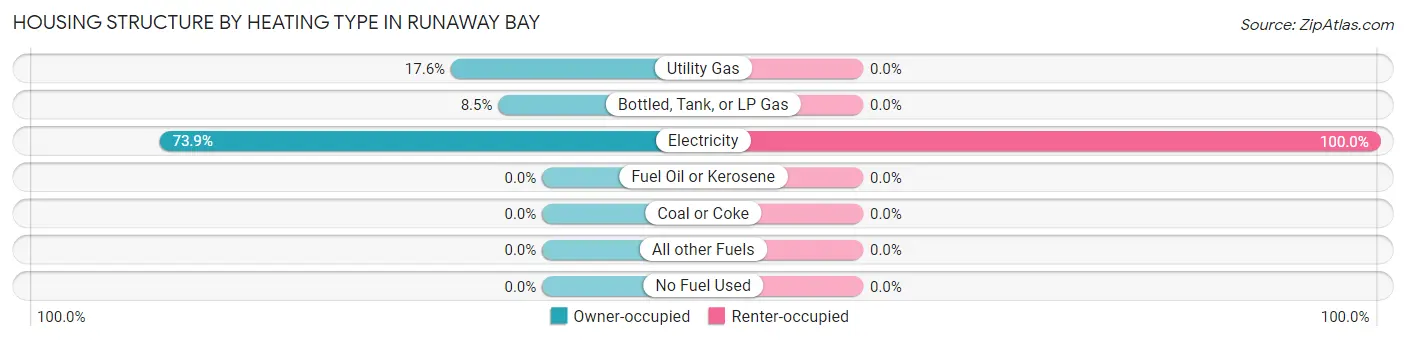
| Heating Type | Owner-occupied | Renter-occupied |
| Utility Gas | 102 (17.6%) | 0 (0.0%) |
| Bottled, Tank, or LP Gas | 49 (8.5%) | 0 (0.0%) |
| Electricity | 428 (73.9%) | 136 (100.0%) |
| Fuel Oil or Kerosene | 0 (0.0%) | 0 (0.0%) |
| Coal or Coke | 0 (0.0%) | 0 (0.0%) |
| All other Fuels | 0 (0.0%) | 0 (0.0%) |
| No Fuel Used | 0 (0.0%) | 0 (0.0%) |
| Total | 579 (100.0%) | 136 (100.0%) |
Household Vehicle Usage in Runaway Bay
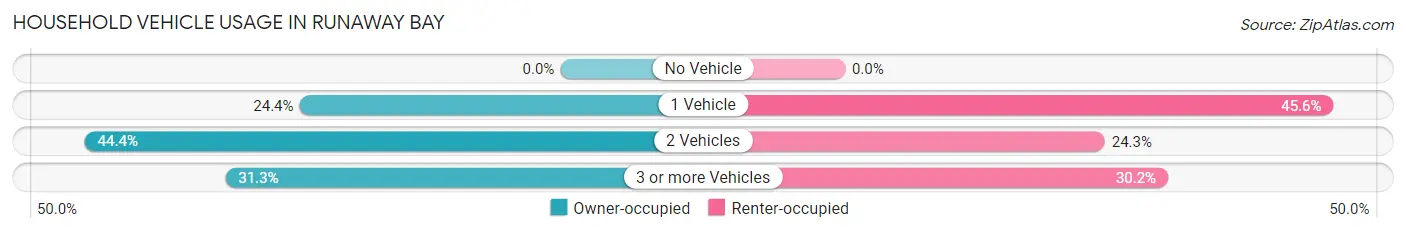
| Vehicles per Household | Owner-occupied | Renter-occupied |
| No Vehicle | 0 (0.0%) | 0 (0.0%) |
| 1 Vehicle | 141 (24.3%) | 62 (45.6%) |
| 2 Vehicles | 257 (44.4%) | 33 (24.3%) |
| 3 or more Vehicles | 181 (31.3%) | 41 (30.1%) |
| Total | 579 (100.0%) | 136 (100.0%) |
Real Estate & Mortgages in Runaway Bay
Real Estate and Mortgage Overview in Runaway Bay
| Characteristic | Without Mortgage | With Mortgage |
| Housing Units | 296 | 283 |
| Median Property Value | $231,100 | $238,800 |
| Median Household Income | $101,250 | $74 |
| Monthly Housing Costs | $769 | $30 |
| Real Estate Taxes | $3,478 | $11 |
Property Value by Mortgage Status in Runaway Bay
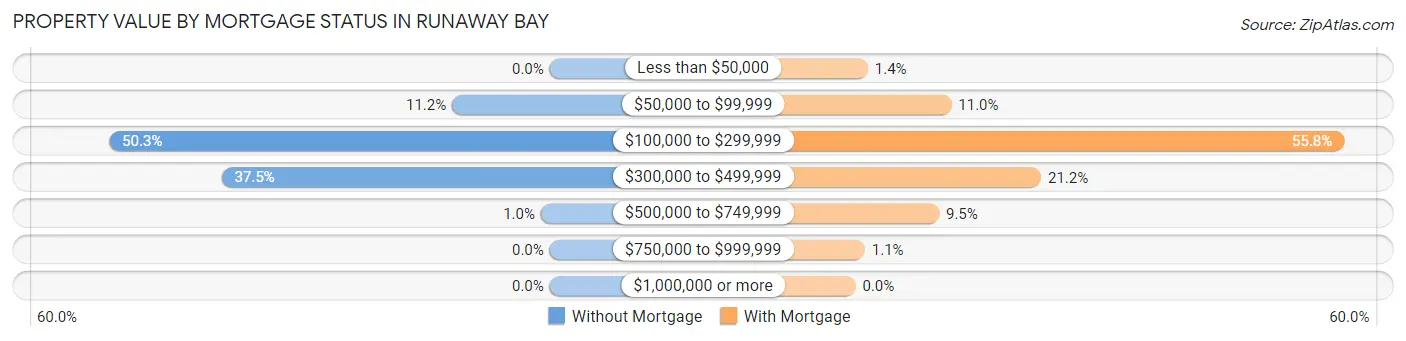
| Property Value | Without Mortgage | With Mortgage |
| Less than $50,000 | 0 (0.0%) | 4 (1.4%) |
| $50,000 to $99,999 | 33 (11.2%) | 31 (11.0%) |
| $100,000 to $299,999 | 149 (50.3%) | 158 (55.8%) |
| $300,000 to $499,999 | 111 (37.5%) | 60 (21.2%) |
| $500,000 to $749,999 | 3 (1.0%) | 27 (9.5%) |
| $750,000 to $999,999 | 0 (0.0%) | 3 (1.1%) |
| $1,000,000 or more | 0 (0.0%) | 0 (0.0%) |
| Total | 296 (100.0%) | 283 (100.0%) |
Household Income by Mortgage Status in Runaway Bay
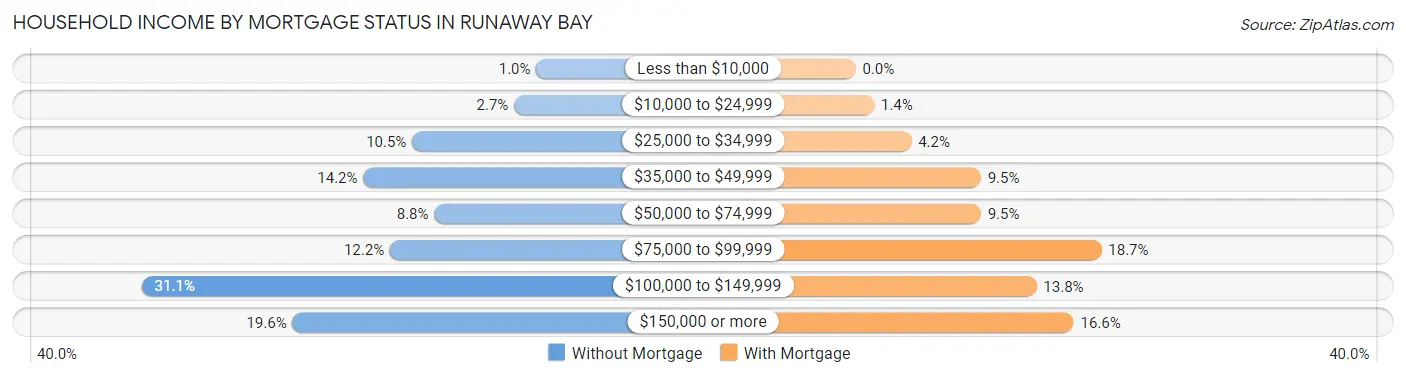
| Household Income | Without Mortgage | With Mortgage |
| Less than $10,000 | 3 (1.0%) | 0 (0.0%) |
| $10,000 to $24,999 | 8 (2.7%) | 4 (1.4%) |
| $25,000 to $34,999 | 31 (10.5%) | 12 (4.2%) |
| $35,000 to $49,999 | 42 (14.2%) | 27 (9.5%) |
| $50,000 to $74,999 | 26 (8.8%) | 27 (9.5%) |
| $75,000 to $99,999 | 36 (12.2%) | 53 (18.7%) |
| $100,000 to $149,999 | 92 (31.1%) | 39 (13.8%) |
| $150,000 or more | 58 (19.6%) | 47 (16.6%) |
| Total | 296 (100.0%) | 283 (100.0%) |
Property Value to Household Income Ratio in Runaway Bay
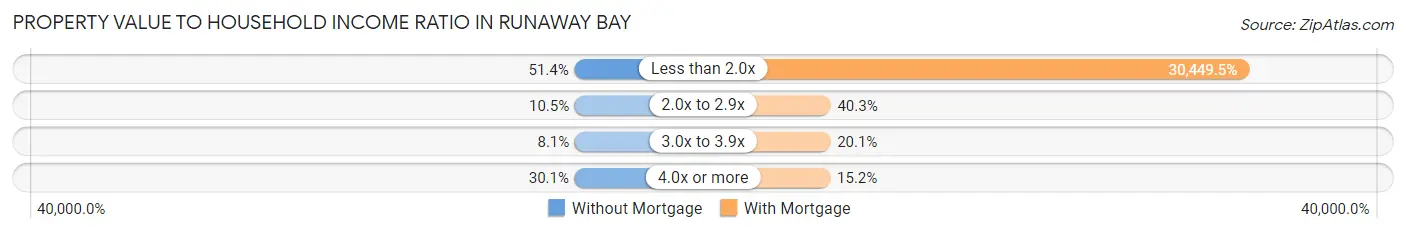
| Value-to-Income Ratio | Without Mortgage | With Mortgage |
| Less than 2.0x | 152 (51.3%) | 86,172 (30,449.5%) |
| 2.0x to 2.9x | 31 (10.5%) | 114 (40.3%) |
| 3.0x to 3.9x | 24 (8.1%) | 57 (20.1%) |
| 4.0x or more | 89 (30.1%) | 43 (15.2%) |
| Total | 296 (100.0%) | 283 (100.0%) |
Real Estate Taxes by Mortgage Status in Runaway Bay
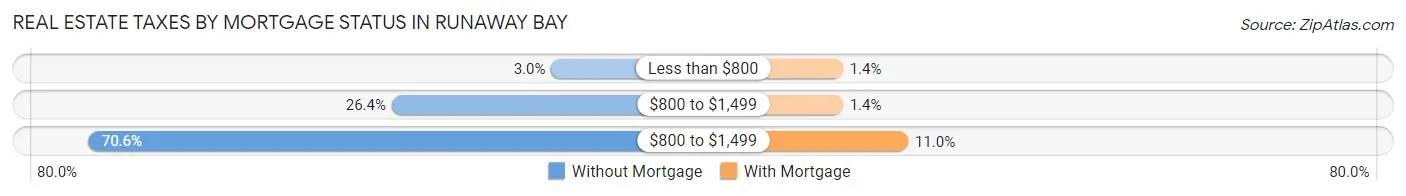
| Property Taxes | Without Mortgage | With Mortgage |
| Less than $800 | 9 (3.0%) | 4 (1.4%) |
| $800 to $1,499 | 78 (26.4%) | 4 (1.4%) |
| $800 to $1,499 | 209 (70.6%) | 31 (11.0%) |
| Total | 296 (100.0%) | 283 (100.0%) |
Health & Disability in Runaway Bay
Health Insurance Coverage by Age in Runaway Bay
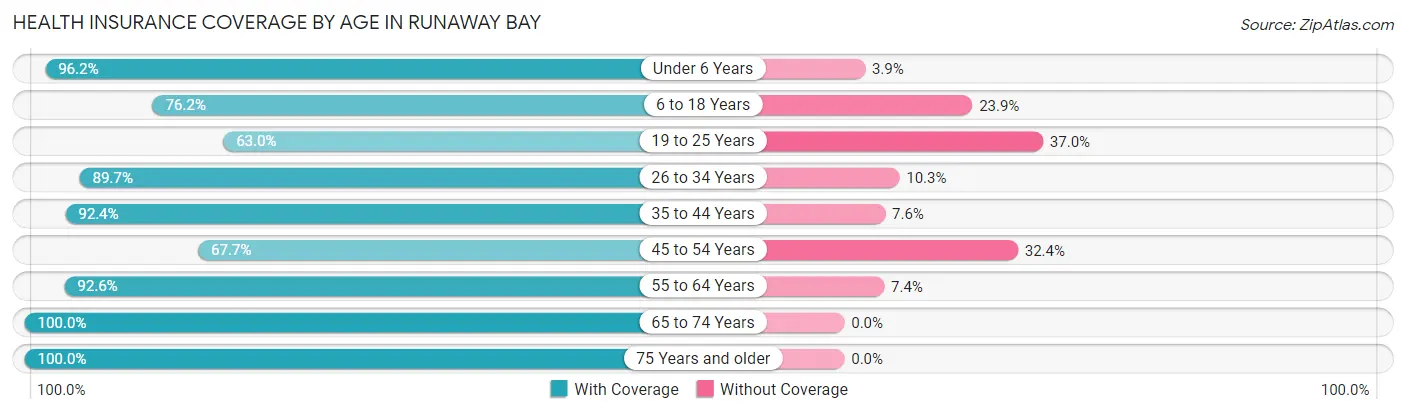
| Age Bracket | With Coverage | Without Coverage |
| Under 6 Years | 75 (96.2%) | 3 (3.8%) |
| 6 to 18 Years | 166 (76.1%) | 52 (23.8%) |
| 19 to 25 Years | 68 (63.0%) | 40 (37.0%) |
| 26 to 34 Years | 70 (89.7%) | 8 (10.3%) |
| 35 to 44 Years | 170 (92.4%) | 14 (7.6%) |
| 45 to 54 Years | 138 (67.6%) | 66 (32.4%) |
| 55 to 64 Years | 249 (92.6%) | 20 (7.4%) |
| 65 to 74 Years | 313 (100.0%) | 0 (0.0%) |
| 75 Years and older | 196 (100.0%) | 0 (0.0%) |
| Total | 1,445 (87.7%) | 203 (12.3%) |
Health Insurance Coverage by Citizenship Status in Runaway Bay
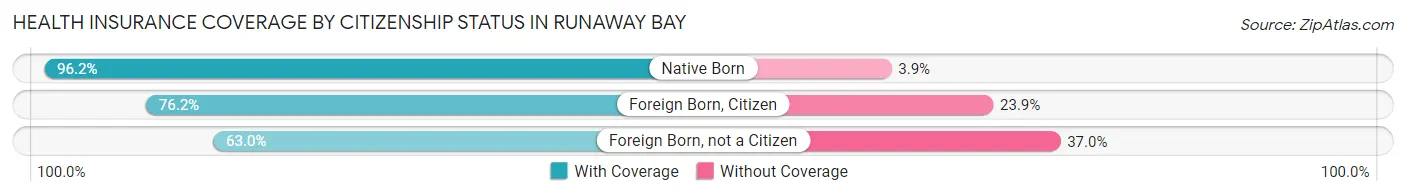
| Citizenship Status | With Coverage | Without Coverage |
| Native Born | 75 (96.2%) | 3 (3.8%) |
| Foreign Born, Citizen | 166 (76.1%) | 52 (23.8%) |
| Foreign Born, not a Citizen | 68 (63.0%) | 40 (37.0%) |
Health Insurance Coverage by Household Income in Runaway Bay
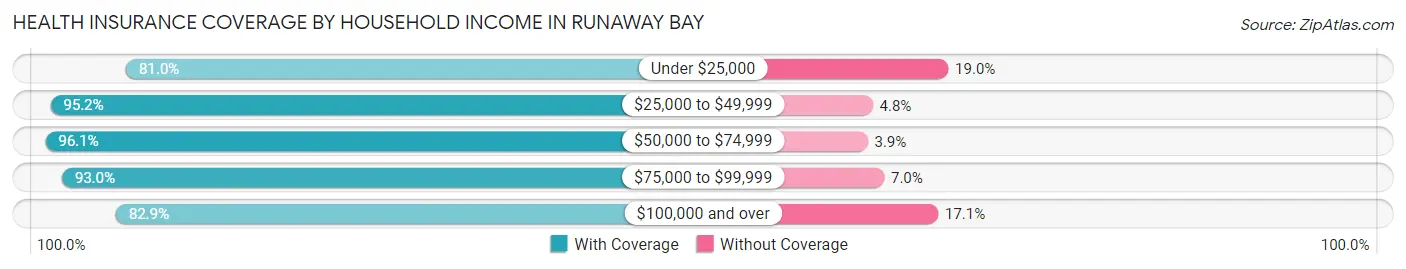
| Household Income | With Coverage | Without Coverage |
| Under $25,000 | 64 (81.0%) | 15 (19.0%) |
| $25,000 to $49,999 | 276 (95.2%) | 14 (4.8%) |
| $50,000 to $74,999 | 198 (96.1%) | 8 (3.9%) |
| $75,000 to $99,999 | 160 (93.0%) | 12 (7.0%) |
| $100,000 and over | 747 (82.9%) | 154 (17.1%) |
Public vs Private Health Insurance Coverage by Age in Runaway Bay
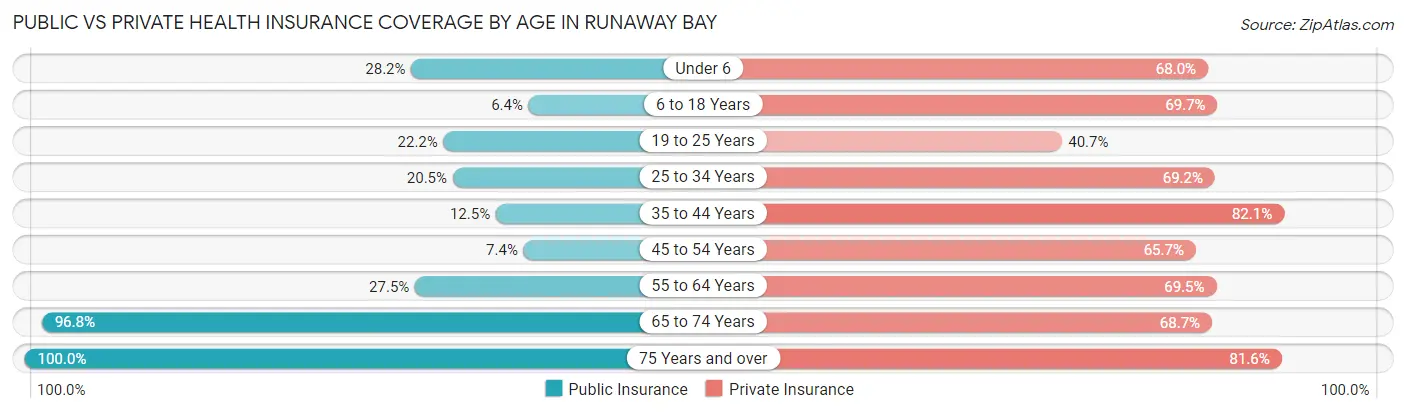
| Age Bracket | Public Insurance | Private Insurance |
| Under 6 | 22 (28.2%) | 53 (67.9%) |
| 6 to 18 Years | 14 (6.4%) | 152 (69.7%) |
| 19 to 25 Years | 24 (22.2%) | 44 (40.7%) |
| 25 to 34 Years | 16 (20.5%) | 54 (69.2%) |
| 35 to 44 Years | 23 (12.5%) | 151 (82.1%) |
| 45 to 54 Years | 15 (7.3%) | 134 (65.7%) |
| 55 to 64 Years | 74 (27.5%) | 187 (69.5%) |
| 65 to 74 Years | 303 (96.8%) | 215 (68.7%) |
| 75 Years and over | 196 (100.0%) | 160 (81.6%) |
| Total | 687 (41.7%) | 1,150 (69.8%) |
Disability Status by Sex by Age in Runaway Bay
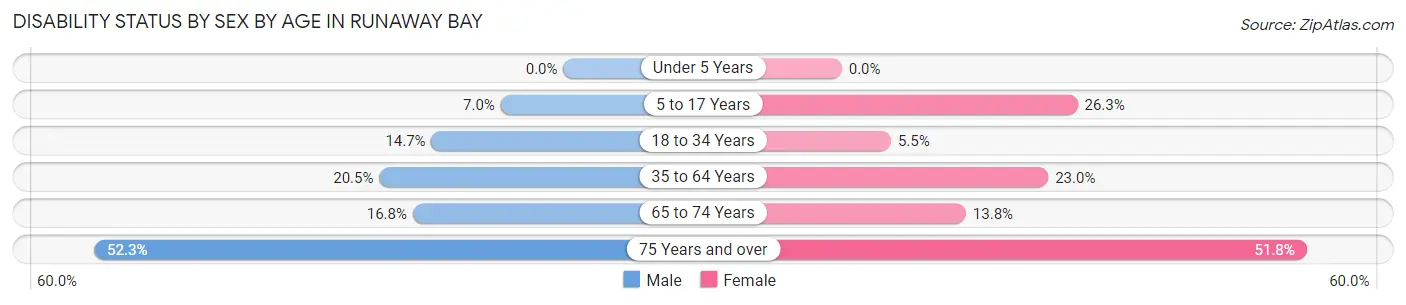
| Age Bracket | Male | Female |
| Under 5 Years | 0 (0.0%) | 0 (0.0%) |
| 5 to 17 Years | 9 (7.0%) | 21 (26.3%) |
| 18 to 34 Years | 21 (14.7%) | 4 (5.5%) |
| 35 to 64 Years | 66 (20.5%) | 77 (23.0%) |
| 65 to 74 Years | 27 (16.8%) | 21 (13.8%) |
| 75 Years and over | 58 (52.2%) | 44 (51.8%) |
Disability Class by Sex by Age in Runaway Bay
Disability Class: Hearing Difficulty
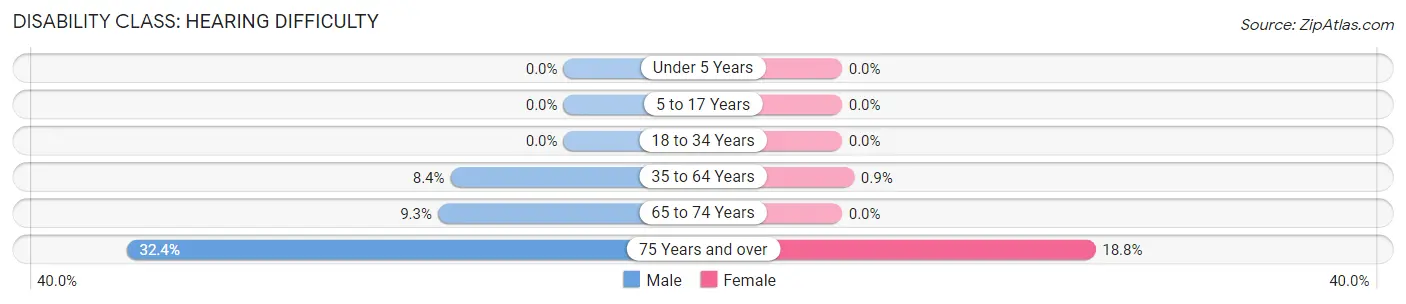
| Age Bracket | Male | Female |
| Under 5 Years | 0 (0.0%) | 0 (0.0%) |
| 5 to 17 Years | 0 (0.0%) | 0 (0.0%) |
| 18 to 34 Years | 0 (0.0%) | 0 (0.0%) |
| 35 to 64 Years | 27 (8.4%) | 3 (0.9%) |
| 65 to 74 Years | 15 (9.3%) | 0 (0.0%) |
| 75 Years and over | 36 (32.4%) | 16 (18.8%) |
Disability Class: Vision Difficulty
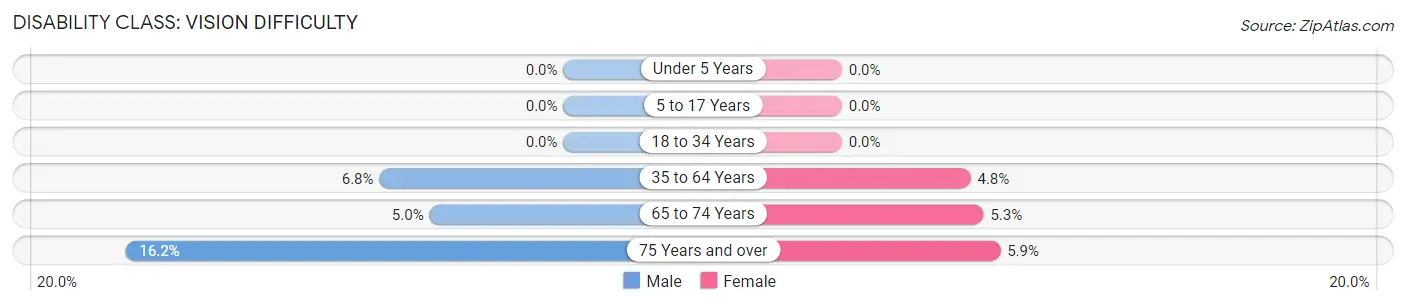
| Age Bracket | Male | Female |
| Under 5 Years | 0 (0.0%) | 0 (0.0%) |
| 5 to 17 Years | 0 (0.0%) | 0 (0.0%) |
| 18 to 34 Years | 0 (0.0%) | 0 (0.0%) |
| 35 to 64 Years | 22 (6.8%) | 16 (4.8%) |
| 65 to 74 Years | 8 (5.0%) | 8 (5.3%) |
| 75 Years and over | 18 (16.2%) | 5 (5.9%) |
Disability Class: Cognitive Difficulty
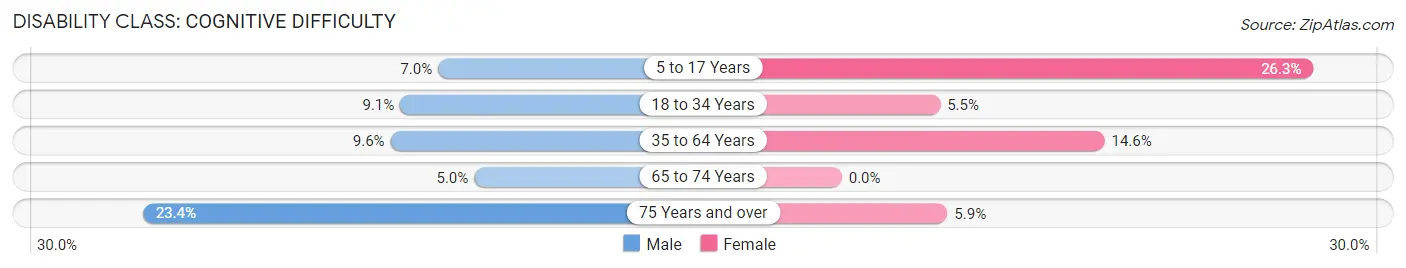
| Age Bracket | Male | Female |
| 5 to 17 Years | 9 (7.0%) | 21 (26.3%) |
| 18 to 34 Years | 13 (9.1%) | 4 (5.5%) |
| 35 to 64 Years | 31 (9.6%) | 49 (14.6%) |
| 65 to 74 Years | 8 (5.0%) | 0 (0.0%) |
| 75 Years and over | 26 (23.4%) | 5 (5.9%) |
Disability Class: Ambulatory Difficulty
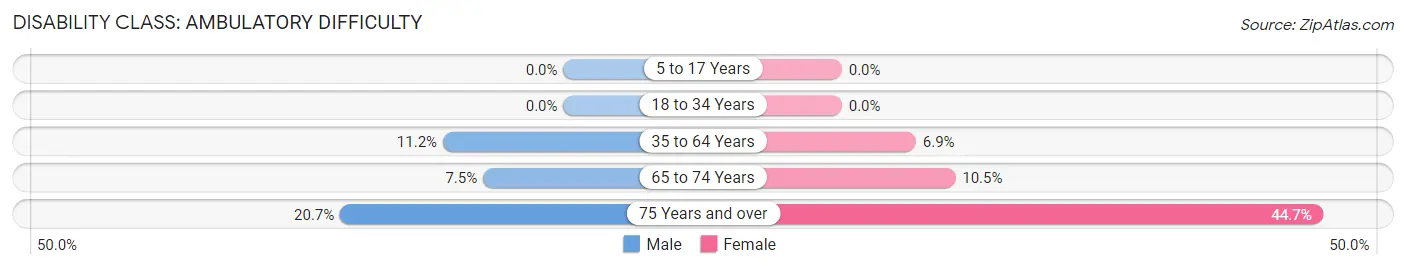
| Age Bracket | Male | Female |
| 5 to 17 Years | 0 (0.0%) | 0 (0.0%) |
| 18 to 34 Years | 0 (0.0%) | 0 (0.0%) |
| 35 to 64 Years | 36 (11.2%) | 23 (6.9%) |
| 65 to 74 Years | 12 (7.4%) | 16 (10.5%) |
| 75 Years and over | 23 (20.7%) | 38 (44.7%) |
Disability Class: Self-Care Difficulty
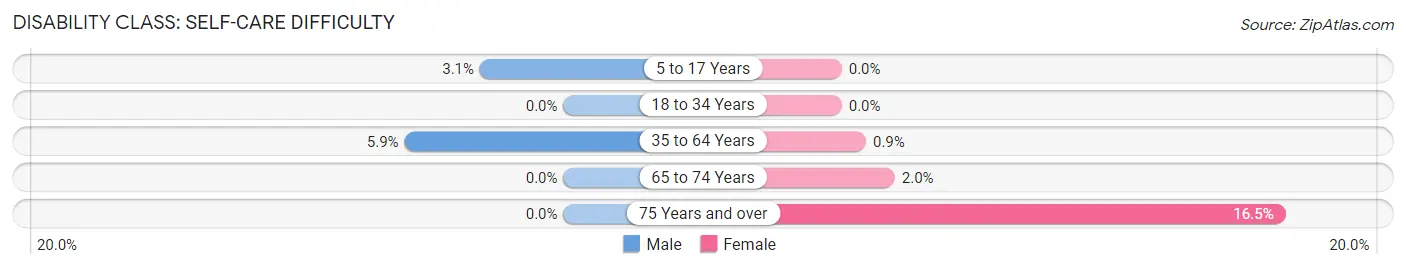
| Age Bracket | Male | Female |
| 5 to 17 Years | 4 (3.1%) | 0 (0.0%) |
| 18 to 34 Years | 0 (0.0%) | 0 (0.0%) |
| 35 to 64 Years | 19 (5.9%) | 3 (0.9%) |
| 65 to 74 Years | 0 (0.0%) | 3 (2.0%) |
| 75 Years and over | 0 (0.0%) | 14 (16.5%) |
Technology Access in Runaway Bay
Computing Device Access in Runaway Bay
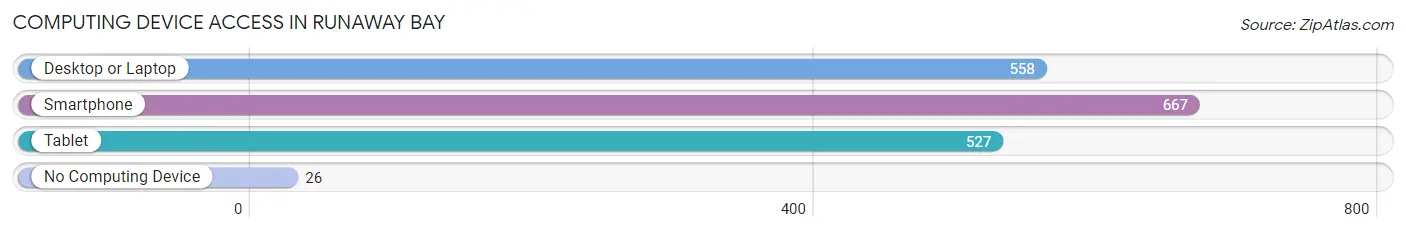
| Device Type | # Households | % Households |
| Desktop or Laptop | 558 | 78.0% |
| Smartphone | 667 | 93.3% |
| Tablet | 527 | 73.7% |
| No Computing Device | 26 | 3.6% |
| Total | 715 | 100.0% |
Internet Access in Runaway Bay
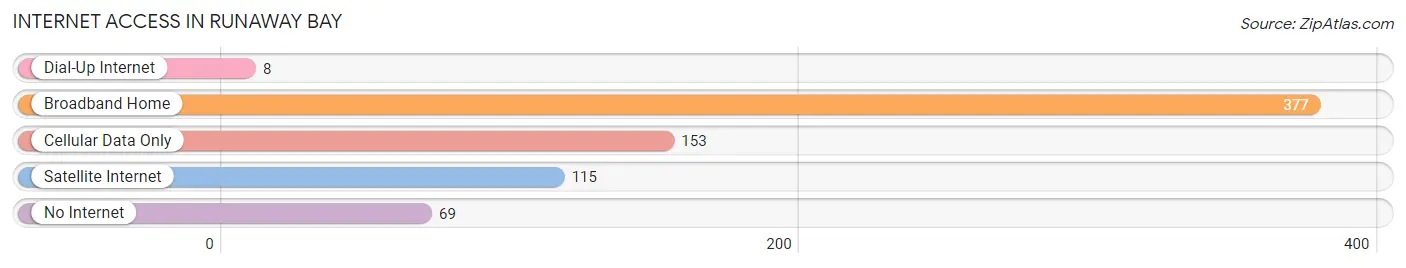
| Internet Type | # Households | % Households |
| Dial-Up Internet | 8 | 1.1% |
| Broadband Home | 377 | 52.7% |
| Cellular Data Only | 153 | 21.4% |
| Satellite Internet | 115 | 16.1% |
| No Internet | 69 | 9.7% |
| Total | 715 | 100.0% |
Runaway Bay Summary
Runaway Bay, Texas is a small town located in the northern part of the state, on the shores of Lake Bridgeport. It is part of the Dallas-Fort Worth-Arlington metropolitan area and is situated in Wise County. The town was founded in the late 1950s and has since grown to a population of around 1,500 people.
History
Runaway Bay was founded in the late 1950s by a group of developers who wanted to create a resort community on the shores of Lake Bridgeport. The town was named after the nearby Runaway Bay Marina, which was built in the early 1960s. The marina was a popular destination for boaters and fishermen, and the town quickly grew in popularity as a vacation destination.
In the 1970s, the town began to expand and develop, with the construction of a golf course, a shopping center, and a number of residential neighborhoods. The town also began to attract more businesses, including a bank, a grocery store, and a post office.
Geography
Runaway Bay is located in the northern part of Texas, on the shores of Lake Bridgeport. The town is situated in Wise County, and is part of the Dallas-Fort Worth-Arlington metropolitan area. The town is located about 30 miles northwest of Fort Worth, and about 60 miles south of Oklahoma City.
The town is situated on a peninsula, surrounded by the lake on three sides. The terrain is mostly flat, with some rolling hills in the area. The climate is generally mild, with hot summers and mild winters.
Economy
The economy of Runaway Bay is largely based on tourism and recreation. The town is a popular destination for boaters and fishermen, and the nearby marina is a popular spot for boat rentals. The town also has a number of restaurants, bars, and shops, as well as a golf course and a shopping center.
The town also has a number of businesses, including a bank, a grocery store, and a post office. The town is also home to a number of manufacturing and industrial businesses, including a plastics factory and a metal fabrication plant.
Demographics
As of the 2010 census, the population of Runaway Bay was 1,500 people. The racial makeup of the town was 94.7% White, 0.7% African American, 0.7% Native American, 0.7% Asian, 0.7% from other races, and 2.3% from two or more races. Hispanic or Latino of any race were 4.7% of the population.
The median household income in Runaway Bay was $45,000, and the median family income was $50,000. The per capita income was $20,000. About 8.7% of families and 10.7% of the population were below the poverty line.
Runaway Bay is a small town with a rich history and a vibrant economy. The town is a popular destination for boaters and fishermen, and is home to a number of businesses and recreational activities. The town has a diverse population, and is a great place to live and work.
Common Questions
What is Per Capita Income in Runaway Bay?
Per Capita income in Runaway Bay is $45,192.
What is the Median Family Income in Runaway Bay?
Median Family Income in Runaway Bay is $117,941.
What is the Median Household income in Runaway Bay?
Median Household Income in Runaway Bay is $91,719.
What is Income or Wage Gap in Runaway Bay?
Income or Wage Gap in Runaway Bay is 32.3%.
Women in Runaway Bay earn 67.7 cents for every dollar earned by a man.
What is Inequality or Gini Index in Runaway Bay?
Inequality or Gini Index in Runaway Bay is 0.38.
What is the Total Population of Runaway Bay?
Total Population of Runaway Bay is 1,648.
What is the Total Male Population of Runaway Bay?
Total Male Population of Runaway Bay is 910.
What is the Total Female Population of Runaway Bay?
Total Female Population of Runaway Bay is 738.
What is the Ratio of Males per 100 Females in Runaway Bay?
There are 123.31 Males per 100 Females in Runaway Bay.
What is the Ratio of Females per 100 Males in Runaway Bay?
There are 81.10 Females per 100 Males in Runaway Bay.
What is the Median Population Age in Runaway Bay?
Median Population Age in Runaway Bay is 51.6 Years.
What is the Average Family Size in Runaway Bay
Average Family Size in Runaway Bay is 2.7 People.
What is the Average Household Size in Runaway Bay
Average Household Size in Runaway Bay is 2.3 People.
How Large is the Labor Force in Runaway Bay?
There are 800 People in the Labor Forcein in Runaway Bay.
What is the Percentage of People in the Labor Force in Runaway Bay?
56.0% of People are in the Labor Force in Runaway Bay.
What is the Unemployment Rate in Runaway Bay?
Unemployment Rate in Runaway Bay is 4.4%.