Zip Codes with the Highest Percentage of Families with Income Above $100,000 in Tennessee
RELATED REPORTS & OPTIONS
Family Income | $100k+
Tennessee
Compare Zip Codes
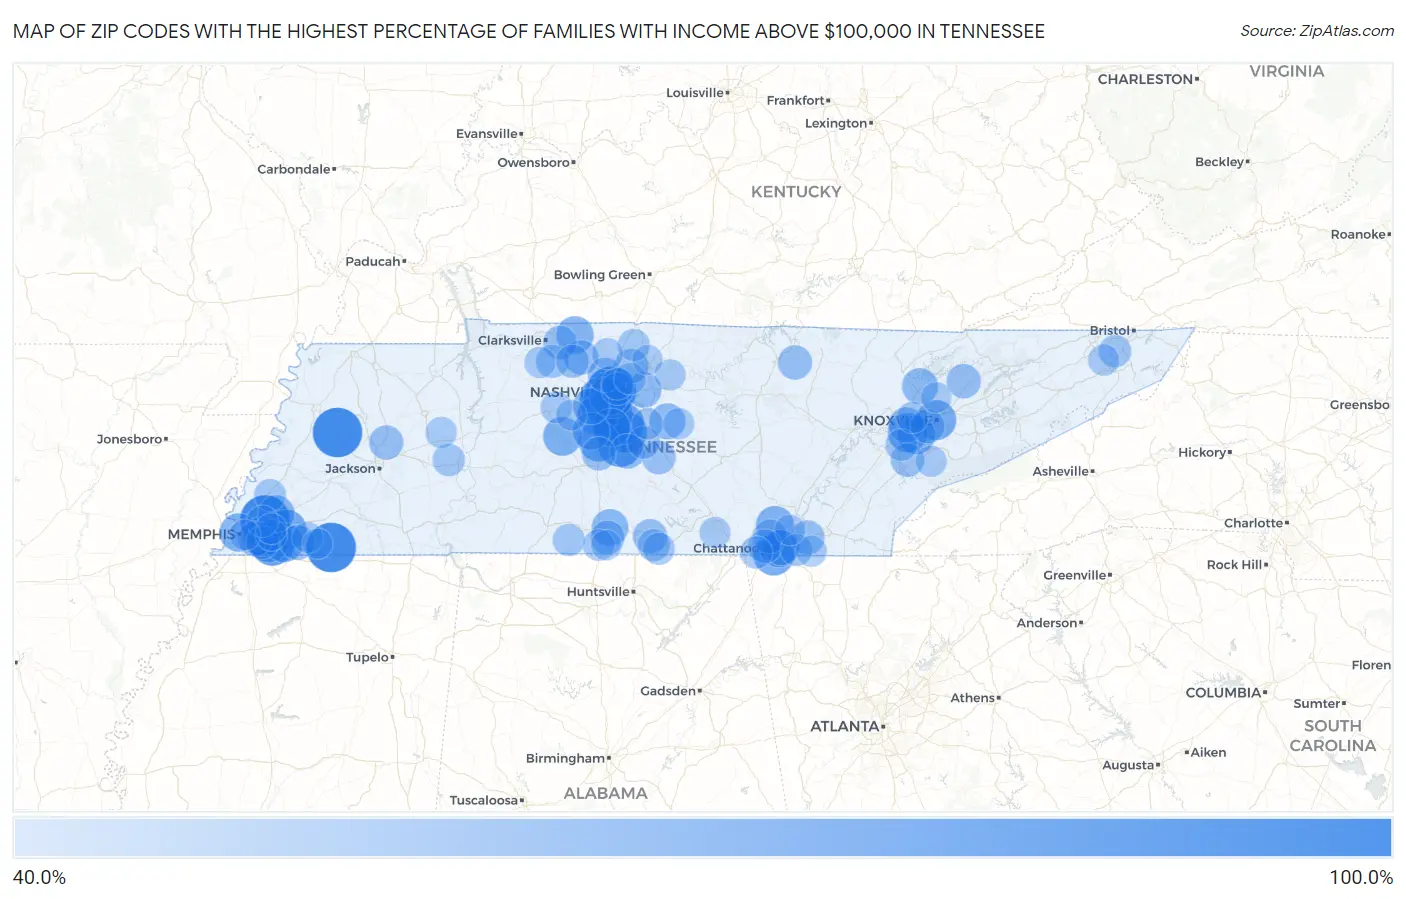
Map of Zip Codes with the Highest Percentage of Families with Income Above $100,000 in Tennessee
40.0%
100.0%
Zip Codes with the Highest Percentage of Families with Income Above $100,000 in Tennessee
| Zip Code | Families with Income > $100k | vs State | vs National | |
| 1. | 37201 | 100.0% | 38.3%(+61.7)#1 | 46.1%(+53.9)#15 |
| 2. | 38029 | 100.0% | 38.3%(+61.7)#2 | 46.1%(+53.9)#218 |
| 3. | 38021 | 100.0% | 38.3%(+61.7)#4 | 46.1%(+53.9)#267 |
| 4. | 38046 | 100.0% | 38.3%(+61.7)#5 | 46.1%(+53.9)#268 |
| 5. | 38139 | 83.9% | 38.3%(+45.6)#6 | 46.1%(+37.8)#676 |
| 6. | 37046 | 83.7% | 38.3%(+45.4)#7 | 46.1%(+37.6)#693 |
| 7. | 37215 | 83.5% | 38.3%(+45.2)#8 | 46.1%(+37.4)#703 |
| 8. | 37205 | 82.7% | 38.3%(+44.4)#9 | 46.1%(+36.6)#751 |
| 9. | 37027 | 79.7% | 38.3%(+41.4)#10 | 46.1%(+33.6)#1,054 |
| 10. | 37014 | 77.1% | 38.3%(+38.8)#11 | 46.1%(+31.0)#1,394 |
| 11. | 37220 | 76.8% | 38.3%(+38.5)#12 | 46.1%(+30.7)#1,437 |
| 12. | 37135 | 76.0% | 38.3%(+37.7)#13 | 46.1%(+29.9)#1,559 |
| 13. | 37350 | 75.5% | 38.3%(+37.2)#14 | 46.1%(+29.4)#1,632 |
| 14. | 38028 | 75.4% | 38.3%(+37.1)#15 | 46.1%(+29.3)#1,645 |
| 15. | 37219 | 75.2% | 38.3%(+36.9)#16 | 46.1%(+29.1)#1,680 |
| 16. | 37069 | 75.0% | 38.3%(+36.7)#17 | 46.1%(+28.9)#1,698 |
| 17. | 37179 | 74.1% | 38.3%(+35.8)#18 | 46.1%(+28.0)#1,860 |
| 18. | 37902 | 73.1% | 38.3%(+34.8)#19 | 46.1%(+27.0)#2,027 |
| 19. | 38138 | 72.5% | 38.3%(+34.2)#20 | 46.1%(+26.4)#2,134 |
| 20. | 38120 | 72.3% | 38.3%(+34.0)#21 | 46.1%(+26.2)#2,173 |
| 21. | 37934 | 71.7% | 38.3%(+33.4)#22 | 46.1%(+25.6)#2,276 |
| 22. | 38017 | 71.2% | 38.3%(+32.9)#23 | 46.1%(+25.1)#2,359 |
| 23. | 37204 | 70.9% | 38.3%(+32.6)#24 | 46.1%(+24.8)#2,428 |
| 24. | 37212 | 70.1% | 38.3%(+31.8)#25 | 46.1%(+24.0)#2,576 |
| 25. | 38476 | 69.6% | 38.3%(+31.3)#26 | 46.1%(+23.5)#2,699 |
| 26. | 37922 | 68.8% | 38.3%(+30.5)#27 | 46.1%(+22.7)#2,852 |
| 27. | 37067 | 68.5% | 38.3%(+30.2)#28 | 46.1%(+22.4)#2,915 |
| 28. | 38103 | 68.5% | 38.3%(+30.2)#29 | 46.1%(+22.4)#2,920 |
| 29. | 37377 | 67.6% | 38.3%(+29.3)#30 | 46.1%(+21.5)#3,122 |
| 30. | 37010 | 66.2% | 38.3%(+27.9)#31 | 46.1%(+20.1)#3,451 |
| 31. | 37064 | 65.5% | 38.3%(+27.2)#32 | 46.1%(+19.4)#3,602 |
| 32. | 37408 | 64.9% | 38.3%(+26.6)#33 | 46.1%(+18.8)#3,778 |
| 33. | 38002 | 64.2% | 38.3%(+25.9)#34 | 46.1%(+18.1)#3,940 |
| 34. | 38459 | 64.0% | 38.3%(+25.7)#35 | 46.1%(+17.9)#4,019 |
| 35. | 37221 | 63.1% | 38.3%(+24.8)#36 | 46.1%(+17.0)#4,249 |
| 36. | 37828 | 62.2% | 38.3%(+23.9)#37 | 46.1%(+16.1)#4,507 |
| 37. | 37085 | 61.8% | 38.3%(+23.5)#38 | 46.1%(+15.7)#4,611 |
| 38. | 37122 | 60.5% | 38.3%(+22.2)#39 | 46.1%(+14.4)#4,992 |
| 39. | 37403 | 60.4% | 38.3%(+22.1)#40 | 46.1%(+14.3)#5,033 |
| 40. | 37932 | 60.2% | 38.3%(+21.9)#41 | 46.1%(+14.1)#5,070 |
| 41. | 38117 | 59.2% | 38.3%(+20.9)#42 | 46.1%(+13.1)#5,383 |
| 42. | 38066 | 58.9% | 38.3%(+20.6)#43 | 46.1%(+12.8)#5,492 |
| 43. | 37060 | 58.9% | 38.3%(+20.6)#44 | 46.1%(+12.8)#5,493 |
| 44. | 37146 | 57.8% | 38.3%(+19.5)#45 | 46.1%(+11.7)#5,848 |
| 45. | 37075 | 57.7% | 38.3%(+19.4)#46 | 46.1%(+11.6)#5,866 |
| 46. | 37189 | 57.6% | 38.3%(+19.3)#47 | 46.1%(+11.5)#5,925 |
| 47. | 37348 | 57.4% | 38.3%(+19.1)#48 | 46.1%(+11.3)#5,995 |
| 48. | 38543 | 57.4% | 38.3%(+19.1)#49 | 46.1%(+11.3)#5,998 |
| 49. | 37363 | 57.2% | 38.3%(+18.9)#50 | 46.1%(+11.1)#6,026 |
| 50. | 37848 | 57.2% | 38.3%(+18.9)#51 | 46.1%(+11.1)#6,052 |
| 51. | 37919 | 57.1% | 38.3%(+18.8)#52 | 46.1%(+11.0)#6,060 |
| 52. | 38355 | 57.1% | 38.3%(+18.8)#53 | 46.1%(+11.0)#6,070 |
| 53. | 37405 | 56.2% | 38.3%(+17.9)#54 | 46.1%(+10.1)#6,367 |
| 54. | 38453 | 56.2% | 38.3%(+17.9)#55 | 46.1%(+10.1)#6,383 |
| 55. | 37419 | 56.0% | 38.3%(+17.7)#56 | 46.1%(+9.90)#6,440 |
| 56. | 37174 | 55.8% | 38.3%(+17.5)#57 | 46.1%(+9.70)#6,503 |
| 57. | 37037 | 55.7% | 38.3%(+17.4)#58 | 46.1%(+9.60)#6,553 |
| 58. | 37043 | 55.3% | 38.3%(+17.0)#59 | 46.1%(+9.20)#6,682 |
| 59. | 37742 | 55.3% | 38.3%(+17.0)#60 | 46.1%(+9.20)#6,698 |
| 60. | 37171 | 54.5% | 38.3%(+16.2)#61 | 46.1%(+8.40)#6,996 |
| 61. | 37035 | 54.4% | 38.3%(+16.1)#62 | 46.1%(+8.30)#7,033 |
| 62. | 38119 | 53.8% | 38.3%(+15.5)#63 | 46.1%(+7.70)#7,239 |
| 63. | 37206 | 52.8% | 38.3%(+14.5)#64 | 46.1%(+6.70)#7,615 |
| 64. | 37686 | 52.4% | 38.3%(+14.1)#65 | 46.1%(+6.30)#7,807 |
| 65. | 37128 | 52.3% | 38.3%(+14.0)#66 | 46.1%(+6.20)#7,834 |
| 66. | 38328 | 52.3% | 38.3%(+14.0)#67 | 46.1%(+6.20)#7,866 |
| 67. | 37396 | 52.0% | 38.3%(+13.7)#68 | 46.1%(+5.90)#8,013 |
| 68. | 37335 | 51.6% | 38.3%(+13.3)#69 | 46.1%(+5.50)#8,171 |
| 69. | 37048 | 51.4% | 38.3%(+13.1)#70 | 46.1%(+5.30)#8,243 |
| 70. | 38460 | 51.4% | 38.3%(+13.1)#71 | 46.1%(+5.30)#8,256 |
| 71. | 37328 | 51.2% | 38.3%(+12.9)#72 | 46.1%(+5.10)#8,341 |
| 72. | 37216 | 51.0% | 38.3%(+12.7)#73 | 46.1%(+4.90)#8,405 |
| 73. | 37772 | 50.9% | 38.3%(+12.6)#74 | 46.1%(+4.80)#8,453 |
| 74. | 38004 | 50.8% | 38.3%(+12.5)#75 | 46.1%(+4.70)#8,497 |
| 75. | 37421 | 50.5% | 38.3%(+12.2)#76 | 46.1%(+4.40)#8,602 |
| 76. | 38018 | 50.2% | 38.3%(+11.9)#77 | 46.1%(+4.10)#8,718 |
| 77. | 37029 | 50.1% | 38.3%(+11.8)#78 | 46.1%(+4.00)#8,769 |
| 78. | 37138 | 50.0% | 38.3%(+11.7)#79 | 46.1%(+3.90)#8,801 |
| 79. | 38455 | 50.0% | 38.3%(+11.7)#80 | 46.1%(+3.90)#8,863 |
| 80. | 38135 | 49.9% | 38.3%(+11.6)#81 | 46.1%(+3.80)#8,909 |
| 81. | 37931 | 49.5% | 38.3%(+11.2)#82 | 46.1%(+3.40)#9,051 |
| 82. | 37129 | 49.3% | 38.3%(+11.0)#83 | 46.1%(+3.20)#9,141 |
| 83. | 37615 | 49.3% | 38.3%(+11.0)#84 | 46.1%(+3.20)#9,149 |
| 84. | 37052 | 49.2% | 38.3%(+10.9)#85 | 46.1%(+3.10)#9,204 |
| 85. | 37302 | 48.9% | 38.3%(+10.6)#86 | 46.1%(+2.80)#9,324 |
| 86. | 38387 | 48.9% | 38.3%(+10.6)#87 | 46.1%(+2.80)#9,337 |
| 87. | 37073 | 48.8% | 38.3%(+10.5)#88 | 46.1%(+2.70)#9,363 |
| 88. | 37087 | 48.7% | 38.3%(+10.4)#89 | 46.1%(+2.60)#9,393 |
| 89. | 37118 | 48.7% | 38.3%(+10.4)#90 | 46.1%(+2.60)#9,424 |
| 90. | 37803 | 48.3% | 38.3%(+10.0)#91 | 46.1%(+2.20)#9,595 |
| 91. | 37375 | 48.2% | 38.3%(+9.90)#92 | 46.1%(+2.10)#9,658 |
| 92. | 38076 | 48.2% | 38.3%(+9.90)#93 | 46.1%(+2.10)#9,675 |
| 93. | 38016 | 48.0% | 38.3%(+9.70)#94 | 46.1%(+1.90)#9,733 |
| 94. | 38104 | 48.0% | 38.3%(+9.70)#95 | 46.1%(+1.90)#9,743 |
| 95. | 37062 | 47.9% | 38.3%(+9.60)#96 | 46.1%(+1.80)#9,809 |
| 96. | 37938 | 47.5% | 38.3%(+9.20)#97 | 46.1%(+1.40)#10,032 |
| 97. | 37343 | 47.4% | 38.3%(+9.10)#98 | 46.1%(+1.30)#10,069 |
| 98. | 37066 | 46.7% | 38.3%(+8.40)#99 | 46.1%(+0.600)#10,439 |
| 99. | 38449 | 46.6% | 38.3%(+8.30)#100 | 46.1%(+0.500)#10,519 |
| 100. | 38057 | 46.5% | 38.3%(+8.20)#101 | 46.1%(+0.400)#10,570 |
Common Questions
What are the Top 10 Zip Codes with the Highest Percentage of Families with Income Above $100,000 in Tennessee?
Top 10 Zip Codes with the Highest Percentage of Families with Income Above $100,000 in Tennessee are:
What zip code has the Highest Percentage of Families with Income Above $100,000 in Tennessee?
37201 has the Highest Percentage of Families with Income Above $100,000 in Tennessee with 100.0%.
What is the Percentage of Families with Income Above $100,000 in the State of Tennessee?
Percentage of Families with Income Above $100,000 in Tennessee is 38.3%.
What is the Percentage of Families with Income Above $100,000 in the United States?
Percentage of Families with Income Above $100,000 in the United States is 46.1%.