Zip Codes with the Highest Percentage of Families with Income Above $100,000 in Memphis, TN
RELATED REPORTS & OPTIONS
Family Income | $100k+
Memphis
Compare Zip Codes
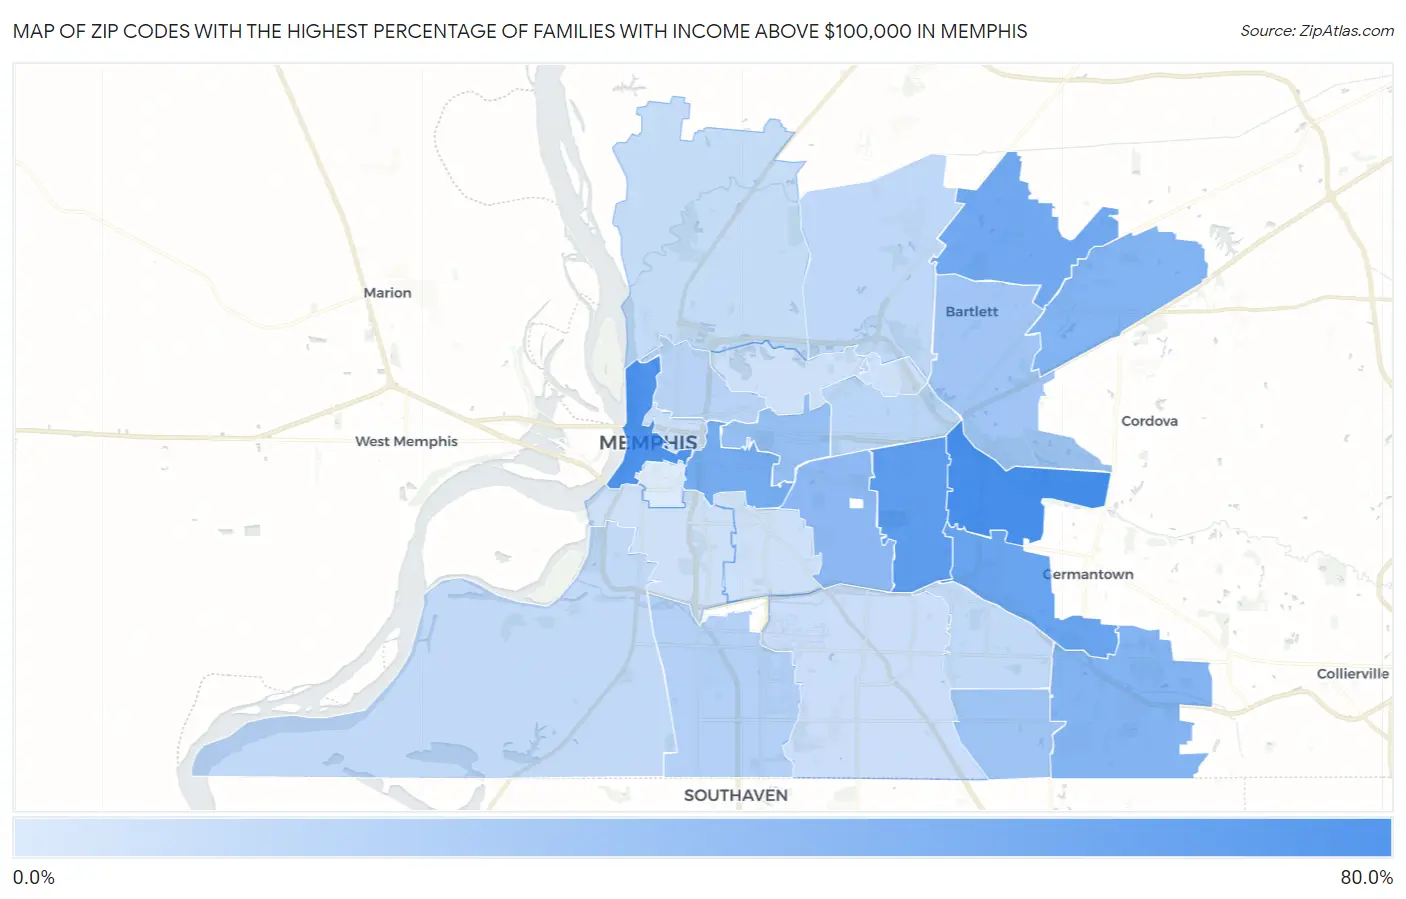
Map of Zip Codes with the Highest Percentage of Families with Income Above $100,000 in Memphis
5.3%
72.3%
Zip Codes with the Highest Percentage of Families with Income Above $100,000 in Memphis, TN
| Zip Code | Families with Income > $100k | vs State | vs National | |
| 1. | 38120 | 72.3% | 38.3%(+34.0)#20 | 46.1%(+26.2)#2,173 |
| 2. | 38103 | 68.5% | 38.3%(+30.2)#28 | 46.1%(+22.4)#2,920 |
| 3. | 38117 | 59.2% | 38.3%(+20.9)#41 | 46.1%(+13.1)#5,383 |
| 4. | 38119 | 53.8% | 38.3%(+15.5)#62 | 46.1%(+7.70)#7,239 |
| 5. | 38135 | 49.9% | 38.3%(+11.6)#80 | 46.1%(+3.80)#8,909 |
| 6. | 38104 | 48.0% | 38.3%(+9.70)#94 | 46.1%(+1.90)#9,743 |
| 7. | 38133 | 43.0% | 38.3%(+4.70)#121 | 46.1%(-3.10)#12,487 |
| 8. | 38125 | 41.4% | 38.3%(+3.10)#135 | 46.1%(-4.70)#13,480 |
| 9. | 38111 | 37.7% | 38.3%(-0.600)#173 | 46.1%(-8.40)#15,965 |
| 10. | 38112 | 33.0% | 38.3%(-5.30)#246 | 46.1%(-13.1)#19,304 |
| 11. | 38141 | 29.0% | 38.3%(-9.30)#319 | 46.1%(-17.1)#22,109 |
| 12. | 38134 | 28.3% | 38.3%(-10.00)#336 | 46.1%(-17.8)#22,572 |
| 13. | 38116 | 20.8% | 38.3%(-17.5)#480 | 46.1%(-25.3)#26,876 |
| 14. | 38107 | 19.3% | 38.3%(-19.0)#495 | 46.1%(-26.8)#27,560 |
| 15. | 38122 | 17.8% | 38.3%(-20.5)#513 | 46.1%(-28.3)#28,139 |
| 16. | 38128 | 16.1% | 38.3%(-22.2)#535 | 46.1%(-30.0)#28,750 |
| 17. | 38109 | 15.6% | 38.3%(-22.7)#540 | 46.1%(-30.5)#28,905 |
| 18. | 38115 | 15.0% | 38.3%(-23.3)#545 | 46.1%(-31.1)#29,095 |
| 19. | 38127 | 13.2% | 38.3%(-25.1)#569 | 46.1%(-32.9)#29,647 |
| 20. | 38118 | 12.0% | 38.3%(-26.3)#574 | 46.1%(-34.1)#29,939 |
| 21. | 38105 | 12.0% | 38.3%(-26.3)#575 | 46.1%(-34.1)#29,946 |
| 22. | 38114 | 10.6% | 38.3%(-27.7)#582 | 46.1%(-35.5)#30,225 |
| 23. | 38106 | 10.2% | 38.3%(-28.1)#583 | 46.1%(-35.9)#30,292 |
| 24. | 38108 | 10.2% | 38.3%(-28.1)#584 | 46.1%(-35.9)#30,293 |
| 25. | 38126 | 5.3% | 38.3%(-33.0)#597 | 46.1%(-40.8)#30,948 |
1
Common Questions
What are the Top 10 Zip Codes with the Highest Percentage of Families with Income Above $100,000 in Memphis, TN?
Top 10 Zip Codes with the Highest Percentage of Families with Income Above $100,000 in Memphis, TN are:
What zip code has the Highest Percentage of Families with Income Above $100,000 in Memphis, TN?
38120 has the Highest Percentage of Families with Income Above $100,000 in Memphis, TN with 72.3%.
What is the Percentage of Families with Income Above $100,000 in Memphis, TN?
Percentage of Families with Income Above $100,000 in Memphis is 28.1%.
What is the Percentage of Families with Income Above $100,000 in Tennessee?
Percentage of Families with Income Above $100,000 in Tennessee is 38.3%.
What is the Percentage of Families with Income Above $100,000 in the United States?
Percentage of Families with Income Above $100,000 in the United States is 46.1%.