Eureka Mill, SC Map & Demographics
Eureka Mill Map
Eureka Mill Overview
$22,135
PER CAPITA INCOME
$53,229
AVG FAMILY INCOME
$33,802
AVG HOUSEHOLD INCOME
57.8%
WAGE / INCOME GAP [ % ]
42.2¢/ $1
WAGE / INCOME GAP [ $ ]
0.49
INEQUALITY / GINI INDEX
1,889
TOTAL POPULATION
858
MALE POPULATION
1,031
FEMALE POPULATION
83.22
MALES / 100 FEMALES
120.16
FEMALES / 100 MALES
42.6
MEDIAN AGE
3.2
AVG FAMILY SIZE
2.6
AVG HOUSEHOLD SIZE
929
LABOR FORCE [ PEOPLE ]
60.3%
PERCENT IN LABOR FORCE
9.6%
UNEMPLOYMENT RATE
Income in Eureka Mill
Income Overview in Eureka Mill
Per Capita Income in Eureka Mill is $22,135, while median incomes of families and households are $53,229 and $33,802 respectively.
| Characteristic | Number | Measure |
| Per Capita Income | 1,889 | $22,135 |
| Median Family Income | 501 | $53,229 |
| Mean Family Income | 501 | $64,512 |
| Median Household Income | 710 | $33,802 |
| Mean Household Income | 710 | $52,098 |
| Income Deficit | 501 | $0 |
| Wage / Income Gap (%) | 1,889 | 57.80% |
| Wage / Income Gap ($) | 1,889 | 42.20¢ per $1 |
| Gini / Inequality Index | 1,889 | 0.49 |
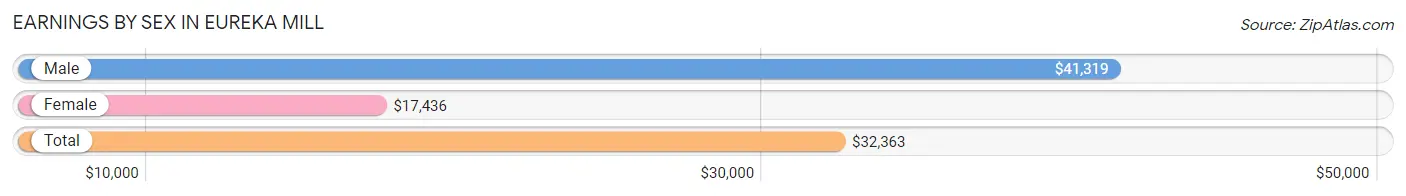
Earnings by Sex in Eureka Mill
Average Earnings in Eureka Mill are $32,363, $41,319 for men and $17,436 for women, a difference of 57.8%.
| Sex | Number | Average Earnings |
| Male | 377 (44.1%) | $41,319 |
| Female | 478 (55.9%) | $17,436 |
| Total | 855 (100.0%) | $32,363 |
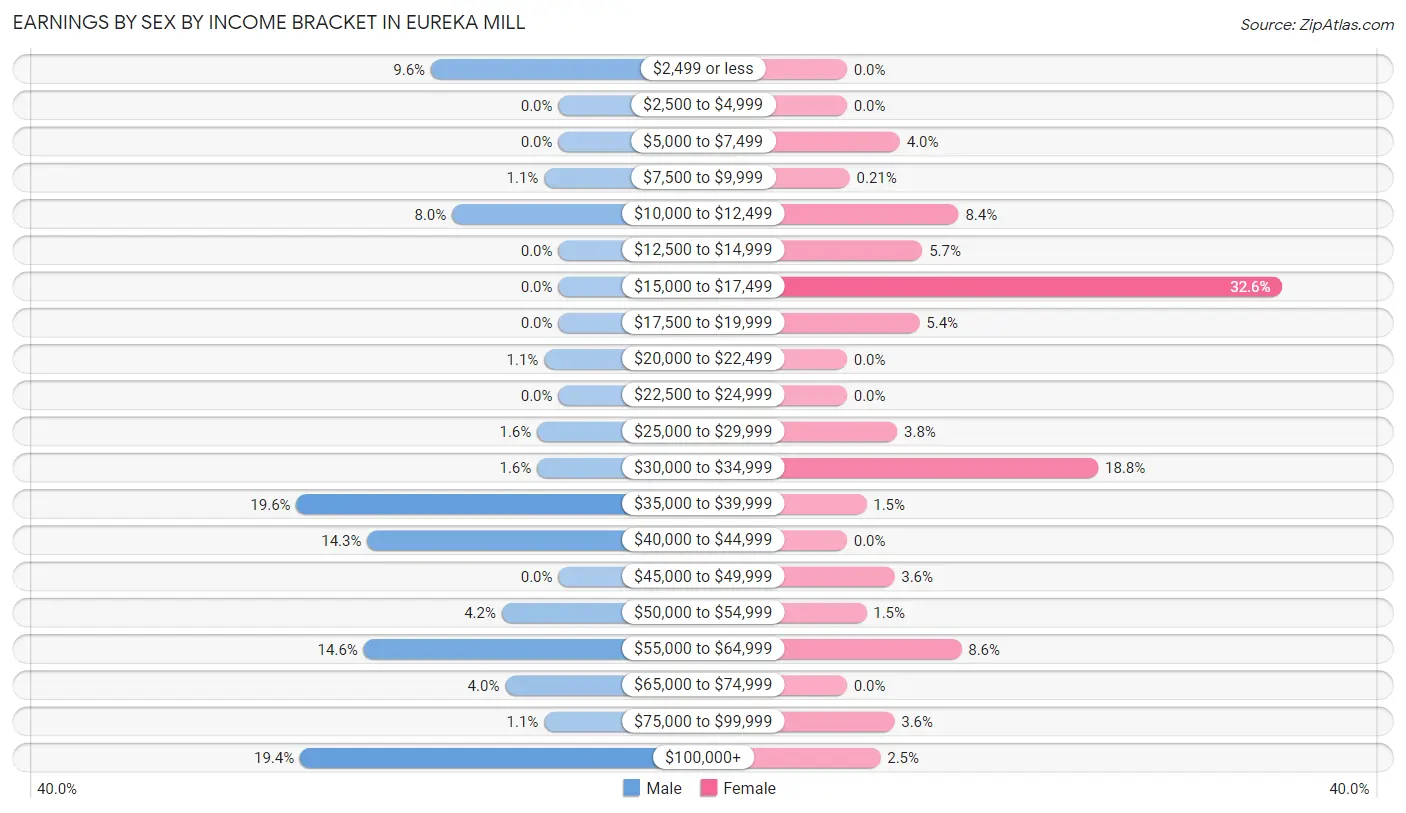
Earnings by Sex by Income Bracket in Eureka Mill
The most common earnings brackets in Eureka Mill are $35,000 to $39,999 for men (74 | 19.6%) and $15,000 to $17,499 for women (156 | 32.6%).
| Income | Male | Female |
| $2,499 or less | 36 (9.6%) | 0 (0.0%) |
| $2,500 to $4,999 | 0 (0.0%) | 0 (0.0%) |
| $5,000 to $7,499 | 0 (0.0%) | 19 (4.0%) |
| $7,500 to $9,999 | 4 (1.1%) | 1 (0.2%) |
| $10,000 to $12,499 | 30 (8.0%) | 40 (8.4%) |
| $12,500 to $14,999 | 0 (0.0%) | 27 (5.7%) |
| $15,000 to $17,499 | 0 (0.0%) | 156 (32.6%) |
| $17,500 to $19,999 | 0 (0.0%) | 26 (5.4%) |
| $20,000 to $22,499 | 4 (1.1%) | 0 (0.0%) |
| $22,500 to $24,999 | 0 (0.0%) | 0 (0.0%) |
| $25,000 to $29,999 | 6 (1.6%) | 18 (3.8%) |
| $30,000 to $34,999 | 6 (1.6%) | 90 (18.8%) |
| $35,000 to $39,999 | 74 (19.6%) | 7 (1.5%) |
| $40,000 to $44,999 | 54 (14.3%) | 0 (0.0%) |
| $45,000 to $49,999 | 0 (0.0%) | 17 (3.6%) |
| $50,000 to $54,999 | 16 (4.2%) | 7 (1.5%) |
| $55,000 to $64,999 | 55 (14.6%) | 41 (8.6%) |
| $65,000 to $74,999 | 15 (4.0%) | 0 (0.0%) |
| $75,000 to $99,999 | 4 (1.1%) | 17 (3.6%) |
| $100,000+ | 73 (19.4%) | 12 (2.5%) |
| Total | 377 (100.0%) | 478 (100.0%) |
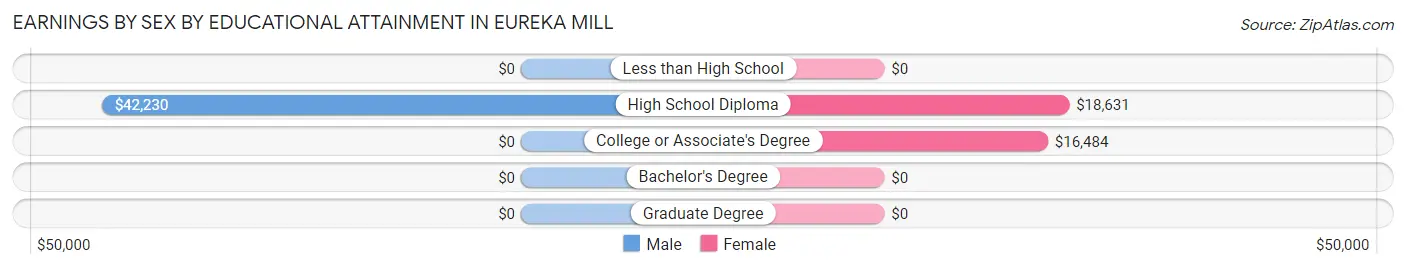
Earnings by Sex by Educational Attainment in Eureka Mill
Average earnings in Eureka Mill are $42,338 for men and $18,221 for women, a difference of 57.0%. Men with an educational attainment of high school diploma enjoy the highest average annual earnings of $42,230, while those with high school diploma education earn the least with $42,230. Women with an educational attainment of high school diploma earn the most with the average annual earnings of $18,631, while those with college or associate's degree education have the smallest earnings of $16,484.
| Educational Attainment | Male Income | Female Income |
| Less than High School | - | - |
| High School Diploma | $42,230 | $18,631 |
| College or Associate's Degree | - | - |
| Bachelor's Degree | - | - |
| Graduate Degree | - | - |
| Total | $42,338 | $18,221 |
Family Income in Eureka Mill
Family Income Brackets in Eureka Mill
According to the Eureka Mill family income data, there are 128 families falling into the $15,000 to $24,999 income range, which is the most common income bracket and makes up 25.6% of all families.
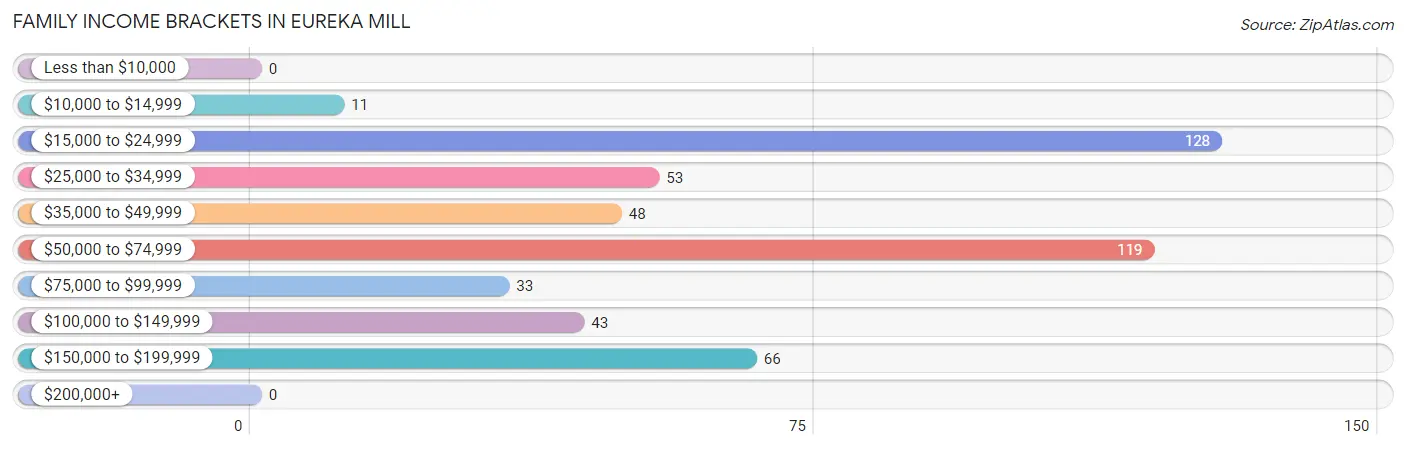
| Income Bracket | # Families | % Families |
| Less than $10,000 | 0 | 0.0% |
| $10,000 to $14,999 | 11 | 2.2% |
| $15,000 to $24,999 | 128 | 25.5% |
| $25,000 to $34,999 | 53 | 10.6% |
| $35,000 to $49,999 | 48 | 9.6% |
| $50,000 to $74,999 | 119 | 23.8% |
| $75,000 to $99,999 | 33 | 6.6% |
| $100,000 to $149,999 | 43 | 8.6% |
| $150,000 to $199,999 | 66 | 13.2% |
| $200,000+ | 0 | 0.0% |
Family Income by Famaliy Size in Eureka Mill
4-person families (104 | 20.8%) account for the highest median family income in Eureka Mill with $72,222 per family, while 4-person families (104 | 20.8%) have the highest median income of $18,056 per family member.
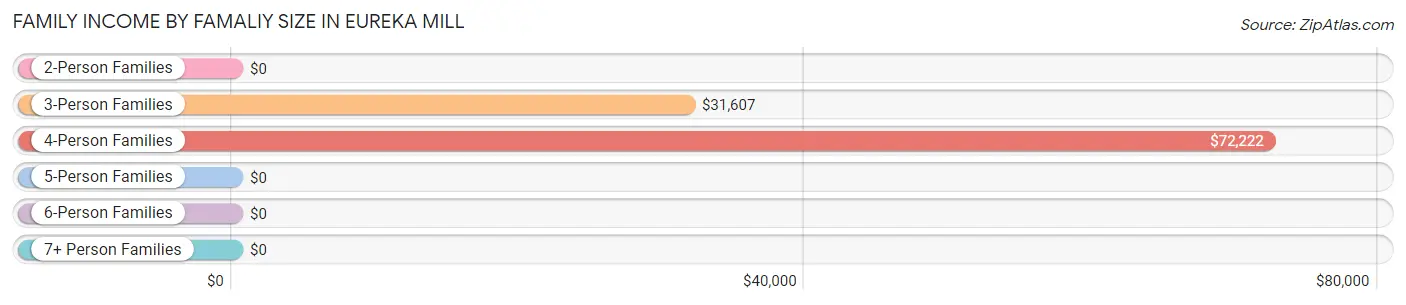
| Income Bracket | # Families | Median Income |
| 2-Person Families | 294 (58.7%) | $0 |
| 3-Person Families | 43 (8.6%) | $31,607 |
| 4-Person Families | 104 (20.8%) | $72,222 |
| 5-Person Families | 8 (1.6%) | $0 |
| 6-Person Families | 12 (2.4%) | $0 |
| 7+ Person Families | 40 (8.0%) | $0 |
| Total | 501 (100.0%) | $53,229 |
Family Income by Number of Earners in Eureka Mill
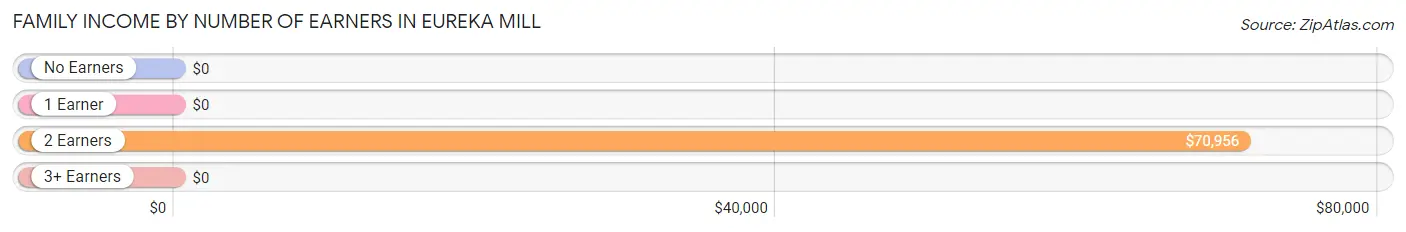
| Number of Earners | # Families | Median Income |
| No Earners | 14 (2.8%) | $0 |
| 1 Earner | 248 (49.5%) | $0 |
| 2 Earners | 217 (43.3%) | $70,956 |
| 3+ Earners | 22 (4.4%) | $0 |
| Total | 501 (100.0%) | $53,229 |
Household Income in Eureka Mill
Household Income Brackets in Eureka Mill
With 161 households falling in the category, the $15,000 to $24,999 income range is the most frequent in Eureka Mill, accounting for 22.7% of all households.
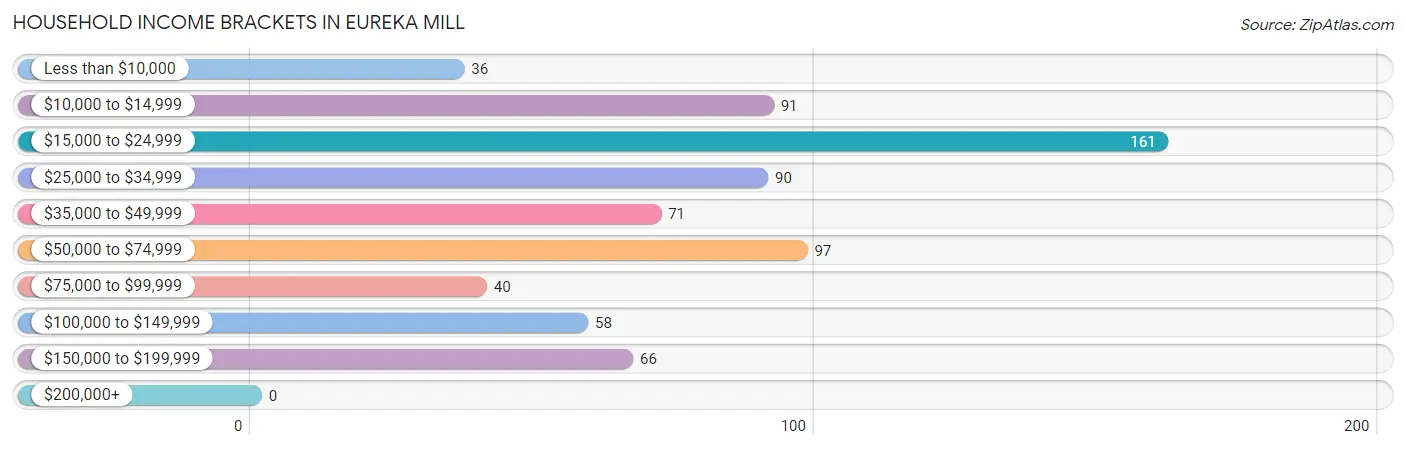
| Income Bracket | # Households | % Households |
| Less than $10,000 | 36 | 5.1% |
| $10,000 to $14,999 | 91 | 12.8% |
| $15,000 to $24,999 | 161 | 22.7% |
| $25,000 to $34,999 | 90 | 12.7% |
| $35,000 to $49,999 | 71 | 10.0% |
| $50,000 to $74,999 | 97 | 13.7% |
| $75,000 to $99,999 | 40 | 5.6% |
| $100,000 to $149,999 | 58 | 8.2% |
| $150,000 to $199,999 | 66 | 9.3% |
| $200,000+ | 0 | 0.0% |
Household Income by Householder Age in Eureka Mill
The median household income in Eureka Mill is $33,802, with the highest median household income of $54,444 found in the 45 to 64 years age bracket for the primary householder. A total of 240 households (33.8%) fall into this category.
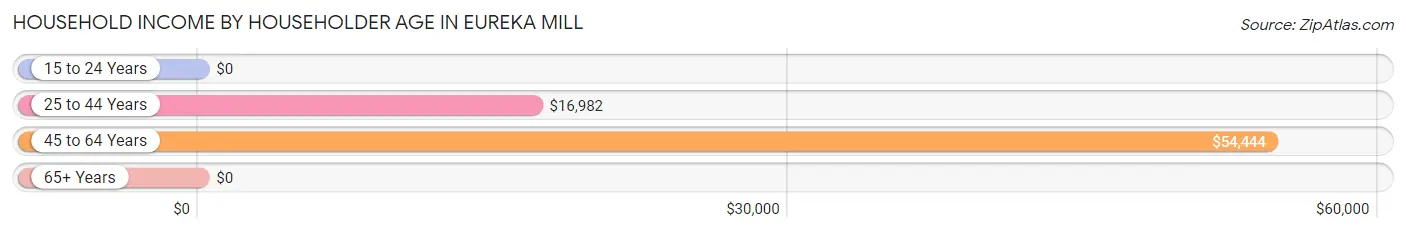
| Income Bracket | # Households | Median Income |
| 15 to 24 Years | 0 (0.0%) | $0 |
| 25 to 44 Years | 237 (33.4%) | $16,982 |
| 45 to 64 Years | 240 (33.8%) | $54,444 |
| 65+ Years | 233 (32.8%) | $0 |
| Total | 710 (100.0%) | $33,802 |
Poverty in Eureka Mill
Income Below Poverty by Sex and Age in Eureka Mill
With 25.1% poverty level for males and 48.9% for females among the residents of Eureka Mill, 25 to 34 year old males and 12 to 14 year old females are the most vulnerable to poverty, with 60 males (71.4%) and 38 females (100.0%) in their respective age groups living below the poverty level.
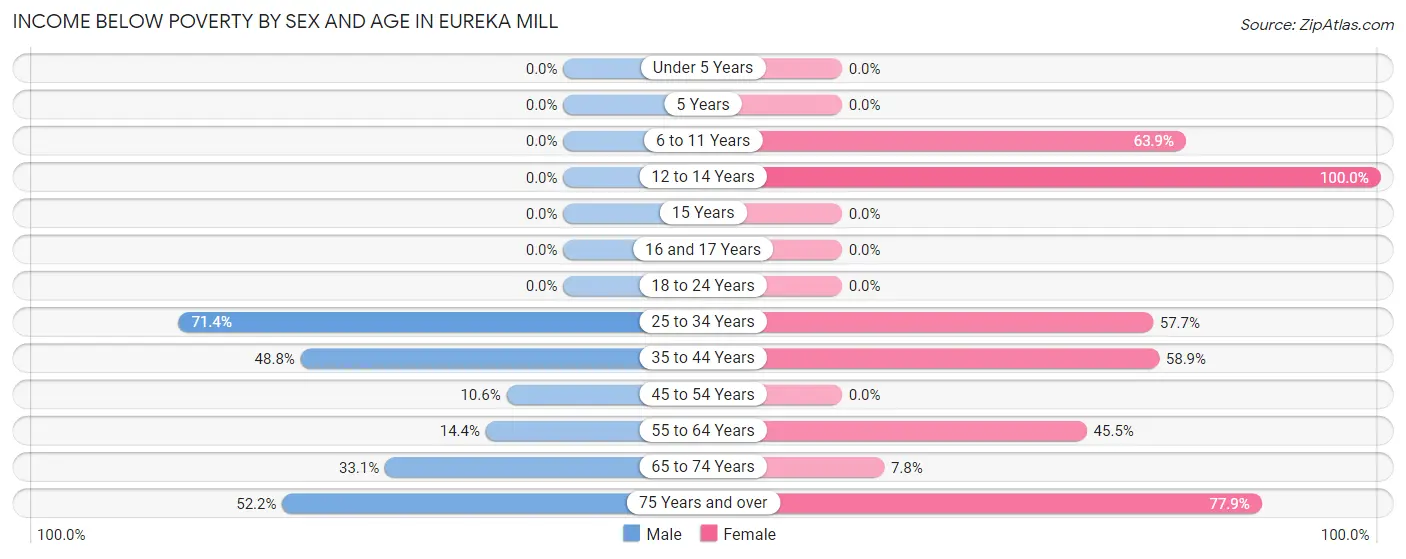
| Age Bracket | Male | Female |
| Under 5 Years | 0 (0.0%) | 0 (0.0%) |
| 5 Years | 0 (0.0%) | 0 (0.0%) |
| 6 to 11 Years | 0 (0.0%) | 136 (63.8%) |
| 12 to 14 Years | 0 (0.0%) | 38 (100.0%) |
| 15 Years | 0 (0.0%) | 0 (0.0%) |
| 16 and 17 Years | 0 (0.0%) | 0 (0.0%) |
| 18 to 24 Years | 0 (0.0%) | 0 (0.0%) |
| 25 to 34 Years | 60 (71.4%) | 56 (57.7%) |
| 35 to 44 Years | 59 (48.8%) | 133 (58.9%) |
| 45 to 54 Years | 17 (10.6%) | 0 (0.0%) |
| 55 to 64 Years | 19 (14.4%) | 65 (45.5%) |
| 65 to 74 Years | 48 (33.1%) | 9 (7.8%) |
| 75 Years and over | 12 (52.2%) | 67 (77.9%) |
| Total | 215 (25.1%) | 504 (48.9%) |
Income Above Poverty by Sex and Age in Eureka Mill
According to the poverty statistics in Eureka Mill, males aged 5 years and females aged under 5 years are the age groups that are most secure financially, with 100.0% of males and 100.0% of females in these age groups living above the poverty line.
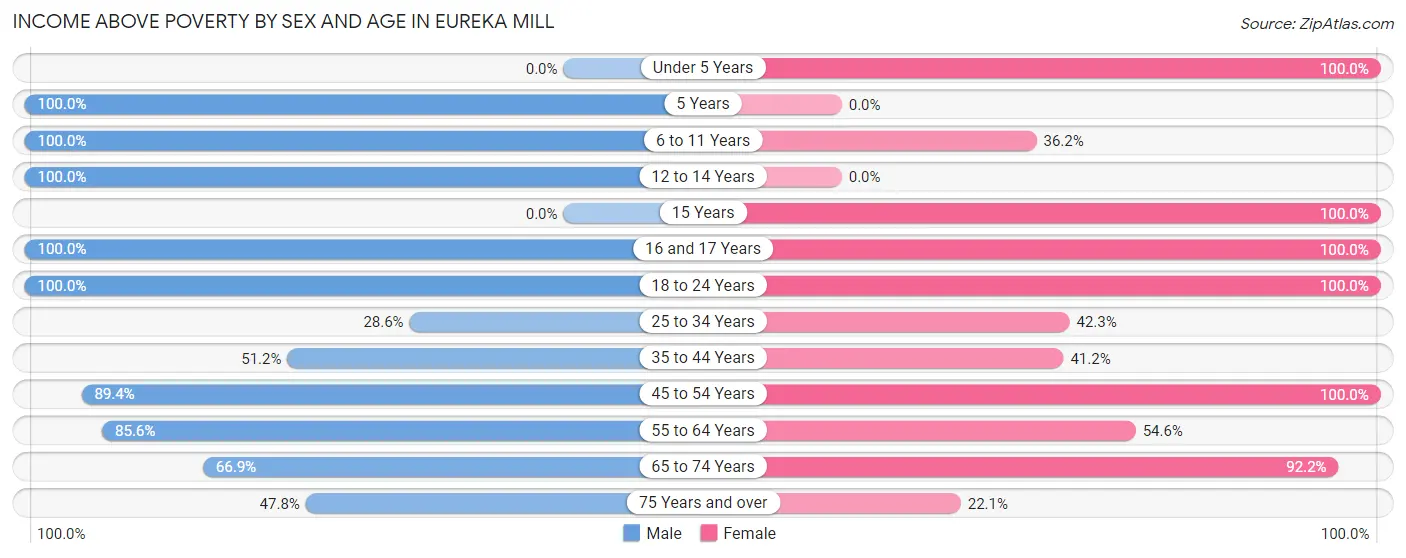
| Age Bracket | Male | Female |
| Under 5 Years | 0 (0.0%) | 26 (100.0%) |
| 5 Years | 11 (100.0%) | 0 (0.0%) |
| 6 to 11 Years | 41 (100.0%) | 77 (36.1%) |
| 12 to 14 Years | 10 (100.0%) | 0 (0.0%) |
| 15 Years | 0 (0.0%) | 9 (100.0%) |
| 16 and 17 Years | 31 (100.0%) | 9 (100.0%) |
| 18 to 24 Years | 99 (100.0%) | 23 (100.0%) |
| 25 to 34 Years | 24 (28.6%) | 41 (42.3%) |
| 35 to 44 Years | 62 (51.2%) | 93 (41.1%) |
| 45 to 54 Years | 144 (89.4%) | 46 (100.0%) |
| 55 to 64 Years | 113 (85.6%) | 78 (54.5%) |
| 65 to 74 Years | 97 (66.9%) | 106 (92.2%) |
| 75 Years and over | 11 (47.8%) | 19 (22.1%) |
| Total | 643 (74.9%) | 527 (51.1%) |
Income Below Poverty Among Married-Couple Families in Eureka Mill
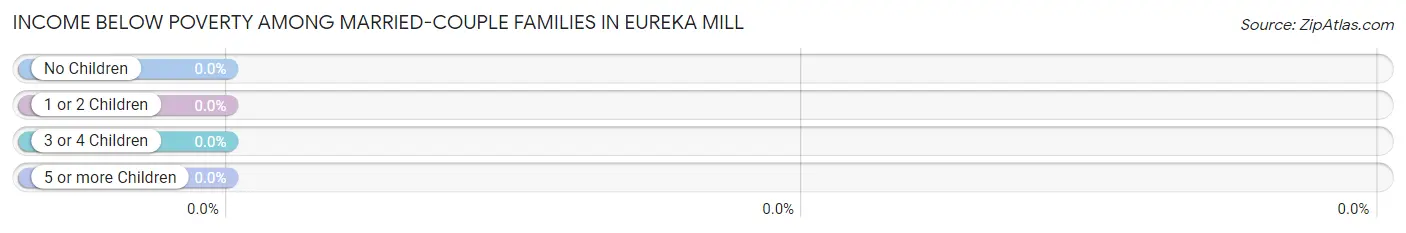
| Children | Above Poverty | Below Poverty |
| No Children | 140 (100.0%) | 0 (0.0%) |
| 1 or 2 Children | 72 (100.0%) | 0 (0.0%) |
| 3 or 4 Children | 16 (100.0%) | 0 (0.0%) |
| 5 or more Children | 0 (0.0%) | 0 (0.0%) |
| Total | 228 (100.0%) | 0 (0.0%) |
Income Below Poverty Among Single-Parent Households in Eureka Mill
According to the poverty data in Eureka Mill, 39.3% or 11 single-father households and 68.6% or 168 single-mother households are living below the poverty line. Among single-father households, those with no children have the highest poverty rate, with 11 households (39.3%) experiencing poverty. Likewise, among single-mother households, those with 1 or 2 children have the highest poverty rate, with 168 households (83.2%) falling below the poverty line.
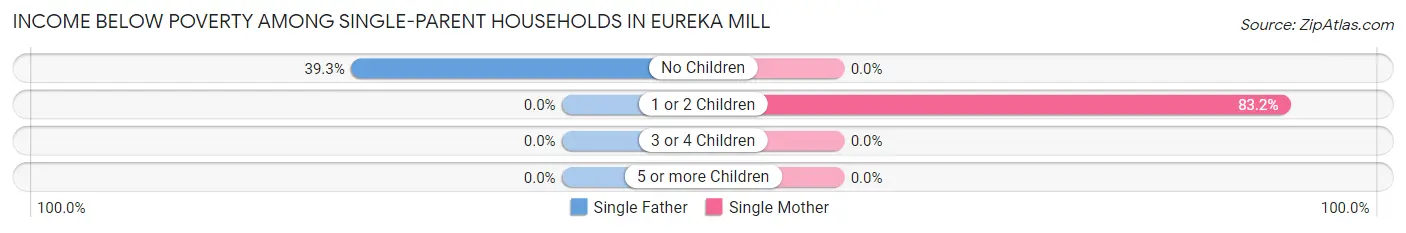
| Children | Single Father | Single Mother |
| No Children | 11 (39.3%) | 0 (0.0%) |
| 1 or 2 Children | 0 (0.0%) | 168 (83.2%) |
| 3 or 4 Children | 0 (0.0%) | 0 (0.0%) |
| 5 or more Children | 0 (0.0%) | 0 (0.0%) |
| Total | 11 (39.3%) | 168 (68.6%) |
Income Below Poverty Among Married-Couple vs Single-Parent Households in Eureka Mill
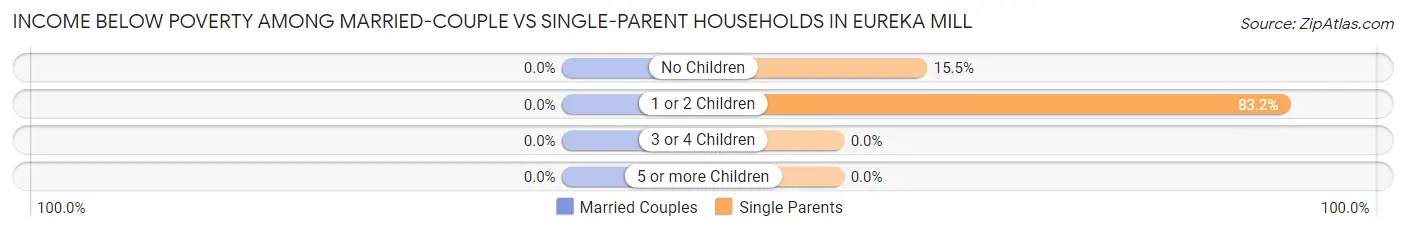
| Children | Married-Couple Families | Single-Parent Households |
| No Children | 0 (0.0%) | 11 (15.5%) |
| 1 or 2 Children | 0 (0.0%) | 168 (83.2%) |
| 3 or 4 Children | 0 (0.0%) | 0 (0.0%) |
| 5 or more Children | 0 (0.0%) | 0 (0.0%) |
| Total | 0 (0.0%) | 179 (65.6%) |
Race in Eureka Mill
The most populous races in Eureka Mill are Black / African American (1,207 | 63.9%), White / Caucasian (672 | 35.6%), and Two or more Races (7 | 0.4%).
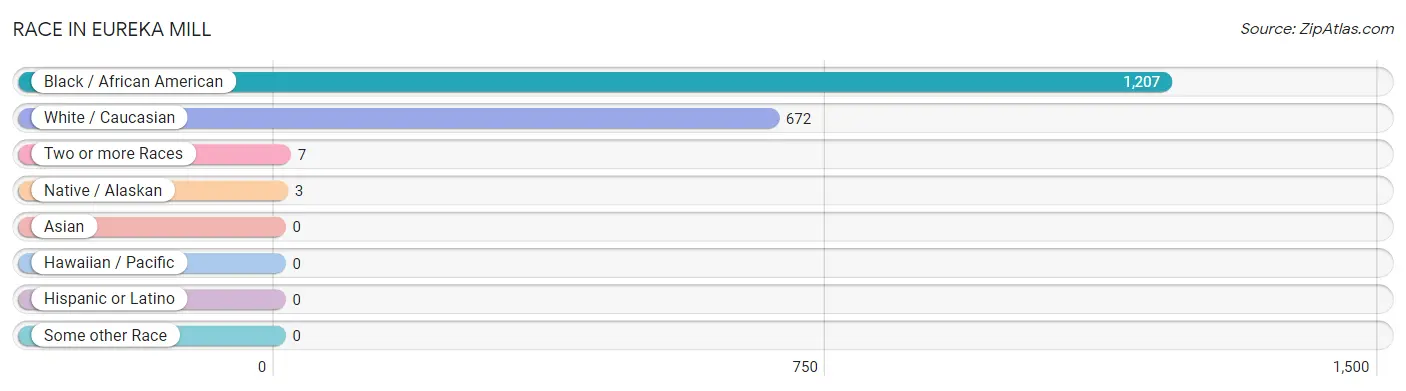
| Race | # Population | % Population |
| Asian | 0 | 0.0% |
| Black / African American | 1,207 | 63.9% |
| Hawaiian / Pacific | 0 | 0.0% |
| Hispanic or Latino | 0 | 0.0% |
| Native / Alaskan | 3 | 0.2% |
| White / Caucasian | 672 | 35.6% |
| Two or more Races | 7 | 0.4% |
| Some other Race | 0 | 0.0% |
| Total | 1,889 | 100.0% |
Ancestry in Eureka Mill
The most populous ancestries reported in Eureka Mill are American (250 | 13.2%), African (206 | 10.9%), Subsaharan African (206 | 10.9%), German (113 | 6.0%), and English (49 | 2.6%), together accounting for 43.6% of all Eureka Mill residents.
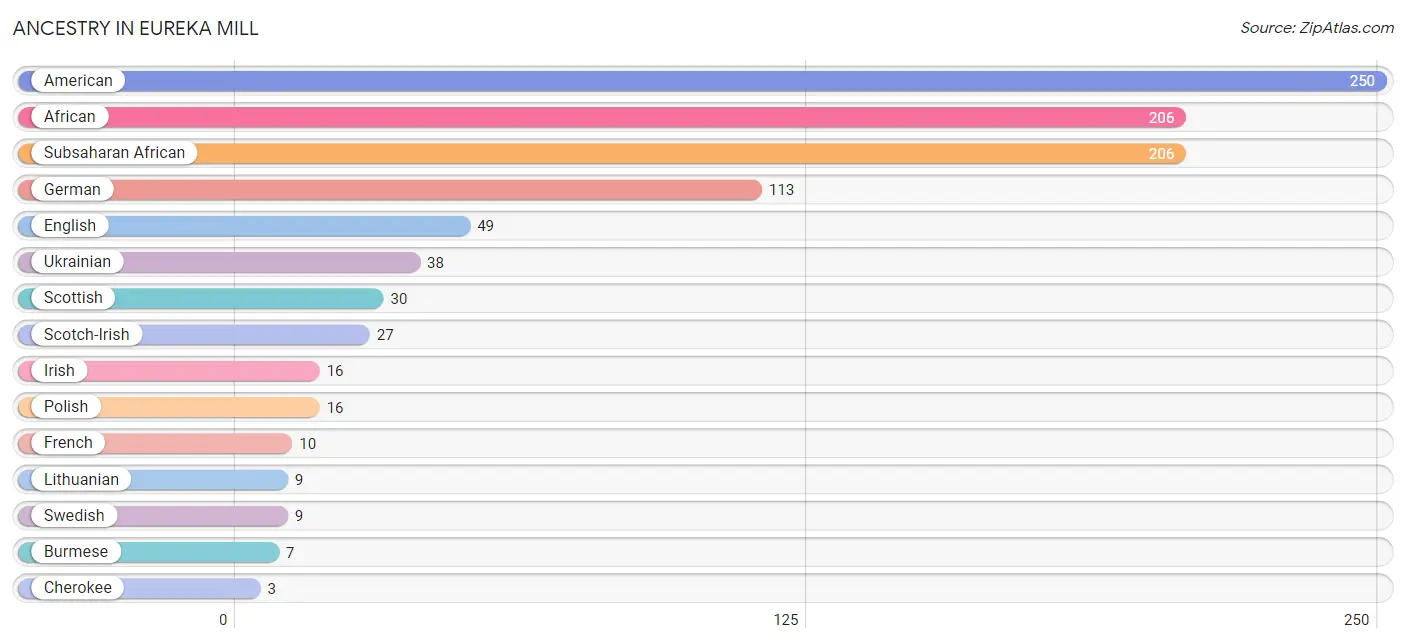
| Ancestry | # Population | % Population |
| African | 206 | 10.9% |
| American | 250 | 13.2% |
| Burmese | 7 | 0.4% |
| Cherokee | 3 | 0.2% |
| English | 49 | 2.6% |
| French | 10 | 0.5% |
| German | 113 | 6.0% |
| Irish | 16 | 0.9% |
| Lithuanian | 9 | 0.5% |
| Polish | 16 | 0.9% |
| Scotch-Irish | 27 | 1.4% |
| Scottish | 30 | 1.6% |
| Subsaharan African | 206 | 10.9% |
| Swedish | 9 | 0.5% |
| Ukrainian | 38 | 2.0% | View All 15 Rows |
Immigrants in Eureka Mill

| Immigration Origin | # Population | % Population | View All 0 Rows |
Sex and Age in Eureka Mill
Sex and Age in Eureka Mill
The most populous age groups in Eureka Mill are 35 to 39 Years (94 | 11.0%) for men and 10 to 14 Years (196 | 19.0%) for women.
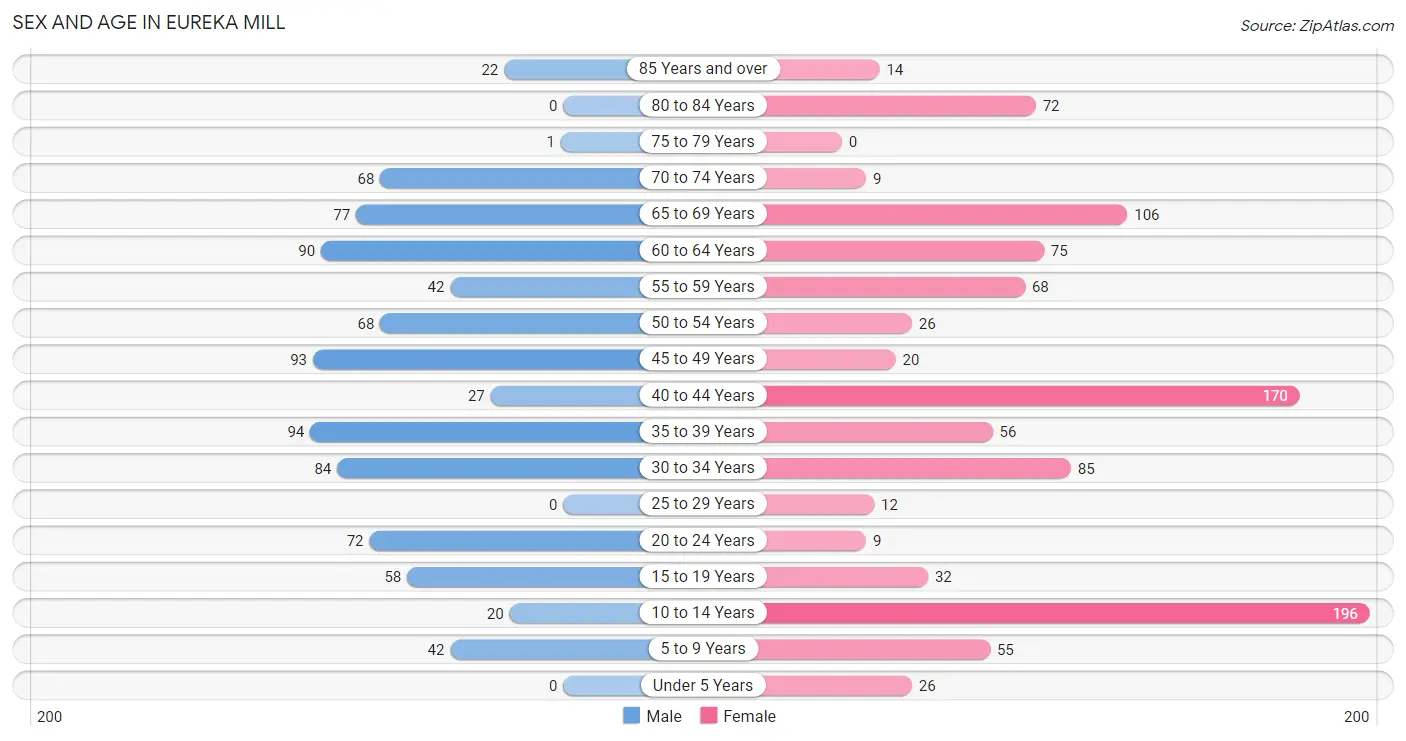
| Age Bracket | Male | Female |
| Under 5 Years | 0 (0.0%) | 26 (2.5%) |
| 5 to 9 Years | 42 (4.9%) | 55 (5.3%) |
| 10 to 14 Years | 20 (2.3%) | 196 (19.0%) |
| 15 to 19 Years | 58 (6.8%) | 32 (3.1%) |
| 20 to 24 Years | 72 (8.4%) | 9 (0.9%) |
| 25 to 29 Years | 0 (0.0%) | 12 (1.2%) |
| 30 to 34 Years | 84 (9.8%) | 85 (8.2%) |
| 35 to 39 Years | 94 (11.0%) | 56 (5.4%) |
| 40 to 44 Years | 27 (3.2%) | 170 (16.5%) |
| 45 to 49 Years | 93 (10.8%) | 20 (1.9%) |
| 50 to 54 Years | 68 (7.9%) | 26 (2.5%) |
| 55 to 59 Years | 42 (4.9%) | 68 (6.6%) |
| 60 to 64 Years | 90 (10.5%) | 75 (7.3%) |
| 65 to 69 Years | 77 (9.0%) | 106 (10.3%) |
| 70 to 74 Years | 68 (7.9%) | 9 (0.9%) |
| 75 to 79 Years | 1 (0.1%) | 0 (0.0%) |
| 80 to 84 Years | 0 (0.0%) | 72 (7.0%) |
| 85 Years and over | 22 (2.6%) | 14 (1.4%) |
| Total | 858 (100.0%) | 1,031 (100.0%) |
Families and Households in Eureka Mill
Median Family Size in Eureka Mill
The median family size in Eureka Mill is 3.18 persons per family, with married-couple families (228 | 45.5%) accounting for the largest median family size of 3.67 persons per family. On the other hand, single male/father families (28 | 5.6%) represent the smallest median family size with 1.71 persons per family.
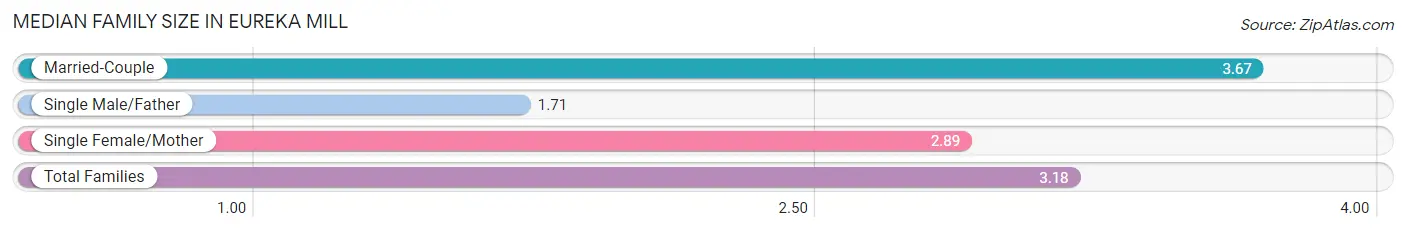
| Family Type | # Families | Family Size |
| Married-Couple | 228 (45.5%) | 3.67 |
| Single Male/Father | 28 (5.6%) | 1.71 |
| Single Female/Mother | 245 (48.9%) | 2.89 |
| Total Families | 501 (100.0%) | 3.18 |
Median Household Size in Eureka Mill
The median household size in Eureka Mill is 2.65 persons per household, with married-couple households (228 | 32.1%) accounting for the largest median household size of 3.67 persons per household. non-family households (209 | 29.4%) represent the smallest median household size with 1.21 persons per household.
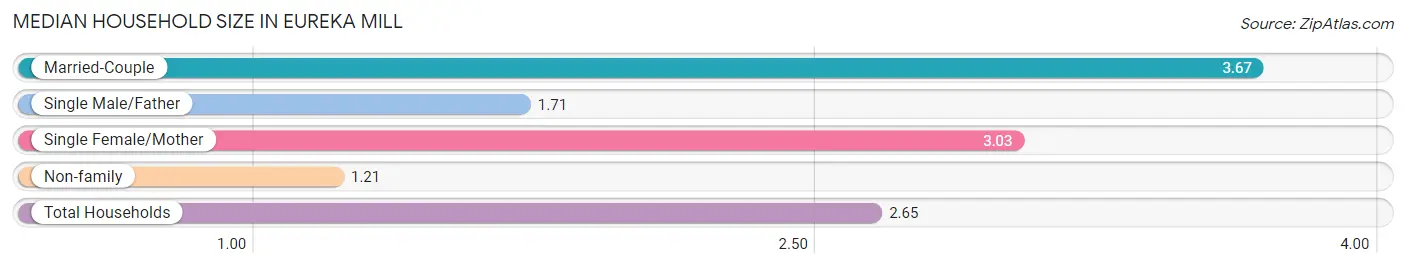
| Household Type | # Households | Household Size |
| Married-Couple | 228 (32.1%) | 3.67 |
| Single Male/Father | 28 (3.9%) | 1.71 |
| Single Female/Mother | 245 (34.5%) | 3.03 |
| Non-family | 209 (29.4%) | 1.21 |
| Total Households | 710 (100.0%) | 2.65 |
Household Size by Marriage Status in Eureka Mill
Out of a total of 710 households in Eureka Mill, 501 (70.6%) are family households, while 209 (29.4%) are nonfamily households. The most numerous type of family households are 2-person households, comprising 279, and the most common type of nonfamily households are 1-person households, comprising 171.
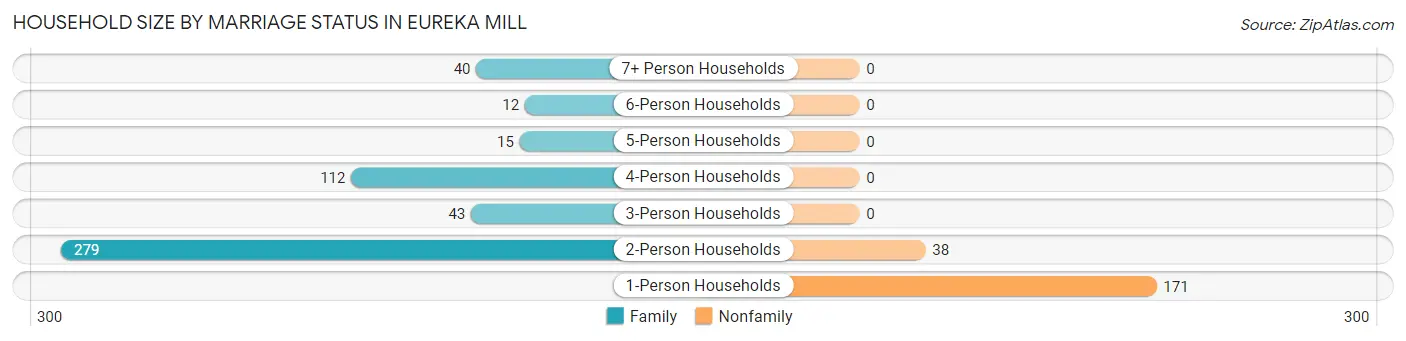
| Household Size | Family Households | Nonfamily Households |
| 1-Person Households | - | 171 (24.1%) |
| 2-Person Households | 279 (39.3%) | 38 (5.3%) |
| 3-Person Households | 43 (6.1%) | 0 (0.0%) |
| 4-Person Households | 112 (15.8%) | 0 (0.0%) |
| 5-Person Households | 15 (2.1%) | 0 (0.0%) |
| 6-Person Households | 12 (1.7%) | 0 (0.0%) |
| 7+ Person Households | 40 (5.6%) | 0 (0.0%) |
| Total | 501 (70.6%) | 209 (29.4%) |
Female Fertility in Eureka Mill
Fertility by Age in Eureka Mill
Average fertility rate in Eureka Mill is 55.0 births per 1,000 women. Women in the age bracket of 20 to 34 years have the highest fertility rate with 85.0 births per 1,000 women. Women in the age bracket of 35 to 50 years acount for 57.1% of all women with births.
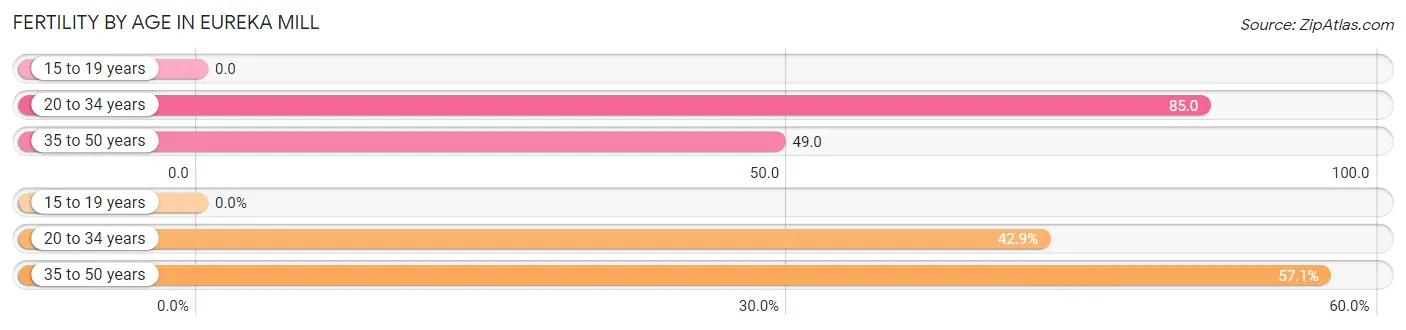
| Age Bracket | Women with Births | Births / 1,000 Women |
| 15 to 19 years | 0 (0.0%) | 0.0 |
| 20 to 34 years | 9 (42.9%) | 85.0 |
| 35 to 50 years | 12 (57.1%) | 49.0 |
| Total | 21 (100.0%) | 55.0 |
Fertility by Age by Marriage Status in Eureka Mill
57.1% of women with births (21) in Eureka Mill are married. The highest percentage of unmarried women with births falls into 20 to 34 years age bracket with 100.0% of them unmarried at the time of birth, while the lowest percentage of unmarried women with births belong to 35 to 50 years age bracket with 0.0% of them unmarried.
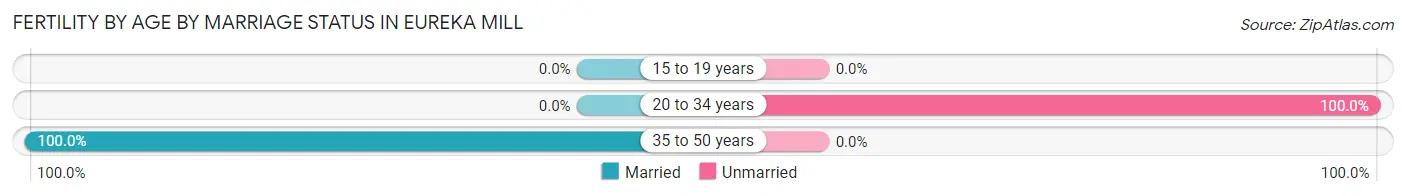
| Age Bracket | Married | Unmarried |
| 15 to 19 years | 0 (0.0%) | 0 (0.0%) |
| 20 to 34 years | 0 (0.0%) | 9 (100.0%) |
| 35 to 50 years | 12 (100.0%) | 0 (0.0%) |
| Total | 12 (57.1%) | 9 (42.9%) |
Fertility by Education in Eureka Mill
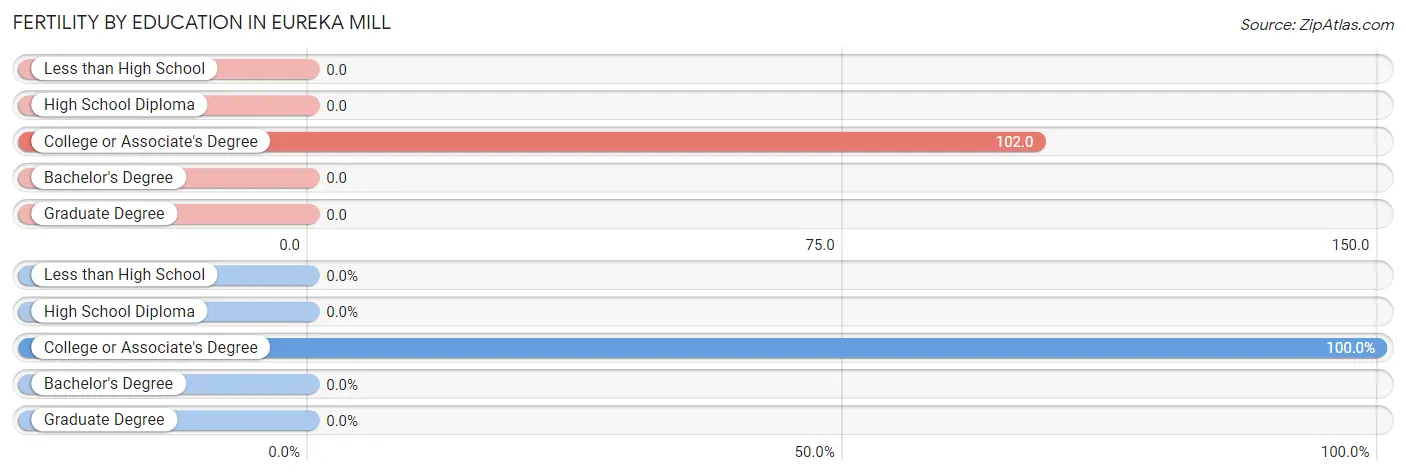
| Educational Attainment | Women with Births | Births / 1,000 Women |
| Less than High School | 0 (0.0%) | 0.0 |
| High School Diploma | 0 (0.0%) | 0.0 |
| College or Associate's Degree | 21 (100.0%) | 102.0 |
| Bachelor's Degree | 0 (0.0%) | 0.0 |
| Graduate Degree | 0 (0.0%) | 0.0 |
| Total | 21 (100.0%) | 55.0 |
Fertility by Education by Marriage Status in Eureka Mill
42.9% of women with births in Eureka Mill are unmarried. Women with the educational attainment of college or associate's degree are most likely to be married with 57.1% of them married at childbirth, while women with the educational attainment of college or associate's degree are least likely to be married with 42.9% of them unmarried at childbirth.
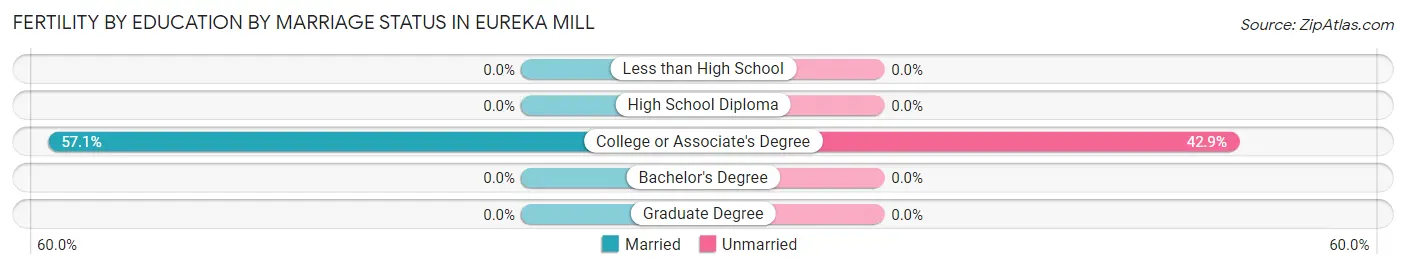
| Educational Attainment | Married | Unmarried |
| Less than High School | 0 (0.0%) | 0 (0.0%) |
| High School Diploma | 0 (0.0%) | 0 (0.0%) |
| College or Associate's Degree | 12 (57.1%) | 9 (42.9%) |
| Bachelor's Degree | 0 (0.0%) | 0 (0.0%) |
| Graduate Degree | 0 (0.0%) | 0 (0.0%) |
| Total | 12 (57.1%) | 9 (42.9%) |
Employment Characteristics in Eureka Mill
Employment by Class of Employer in Eureka Mill
Among the 825 employed individuals in Eureka Mill, private company employees (553 | 67.0%), local government employees (118 | 14.3%), and state government employees (102 | 12.4%) make up the most common classes of employment.
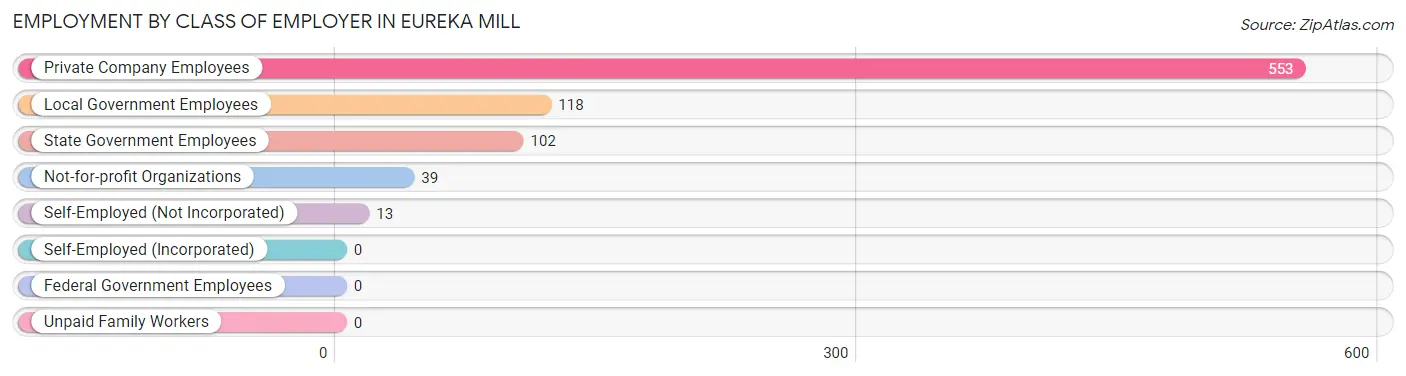
| Employer Class | # Employees | % Employees |
| Private Company Employees | 553 | 67.0% |
| Self-Employed (Incorporated) | 0 | 0.0% |
| Self-Employed (Not Incorporated) | 13 | 1.6% |
| Not-for-profit Organizations | 39 | 4.7% |
| Local Government Employees | 118 | 14.3% |
| State Government Employees | 102 | 12.4% |
| Federal Government Employees | 0 | 0.0% |
| Unpaid Family Workers | 0 | 0.0% |
| Total | 825 | 100.0% |
Employment Status by Age in Eureka Mill
According to the labor force statistics for Eureka Mill, out of the total population over 16 years of age (1,541), 60.3% or 929 individuals are in the labor force, with 9.6% or 89 of them unemployed. The age group with the highest labor force participation rate is 25 to 29 years, with 100.0% or 12 individuals in the labor force. Within the labor force, the 30 to 34 years age range has the highest percentage of unemployed individuals, with 35.5% or 60 of them being unemployed.
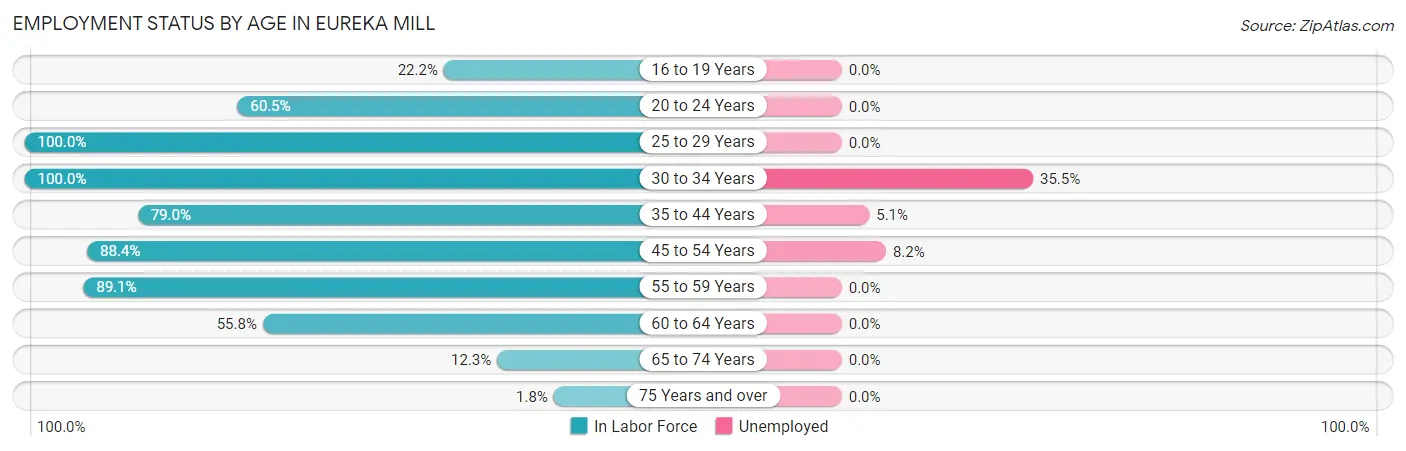
| Age Bracket | In Labor Force | Unemployed |
| 16 to 19 Years | 18 (22.2%) | 0 (0.0%) |
| 20 to 24 Years | 49 (60.5%) | 0 (0.0%) |
| 25 to 29 Years | 12 (100.0%) | 0 (0.0%) |
| 30 to 34 Years | 169 (100.0%) | 60 (35.5%) |
| 35 to 44 Years | 274 (79.0%) | 14 (5.1%) |
| 45 to 54 Years | 183 (88.4%) | 15 (8.2%) |
| 55 to 59 Years | 98 (89.1%) | 0 (0.0%) |
| 60 to 64 Years | 92 (55.8%) | 0 (0.0%) |
| 65 to 74 Years | 32 (12.3%) | 0 (0.0%) |
| 75 Years and over | 2 (1.8%) | 0 (0.0%) |
| Total | 929 (60.3%) | 89 (9.6%) |
Employment Status by Educational Attainment in Eureka Mill
According to labor force statistics for Eureka Mill, 82.0% of individuals (828) out of the total population between 25 and 64 years of age (1,010) are in the labor force, with 10.7% or 89 of them being unemployed. The group with the highest labor force participation rate are those with the educational attainment of bachelor's degree or higher, with 100.0% or 117 individuals in the labor force. Within the labor force, individuals with high school diploma education have the highest percentage of unemployment, with 20.3% or 75 of them being unemployed.
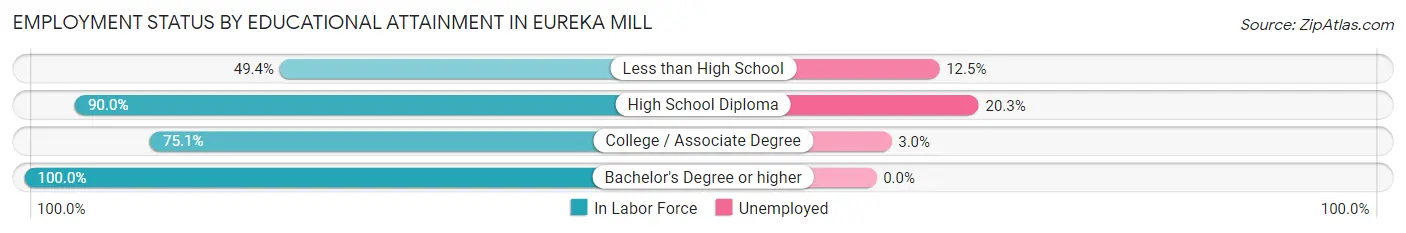
| Educational Attainment | In Labor Force | Unemployed |
| Less than High School | 40 (49.4%) | 10 (12.5%) |
| High School Diploma | 369 (90.0%) | 83 (20.3%) |
| College / Associate Degree | 302 (75.1%) | 12 (3.0%) |
| Bachelor's Degree or higher | 117 (100.0%) | 0 (0.0%) |
| Total | 828 (82.0%) | 108 (10.7%) |
Employment Occupations by Sex in Eureka Mill
Management, Business, Science and Arts Occupations
The most common Management, Business, Science and Arts occupations in Eureka Mill are Management (53 | 6.3%), Health Diagnosing & Treating (33 | 3.9%), Computers, Engineering & Science (20 | 2.4%), Computers & Mathematics (20 | 2.4%), and Business & Financial (6 | 0.7%).
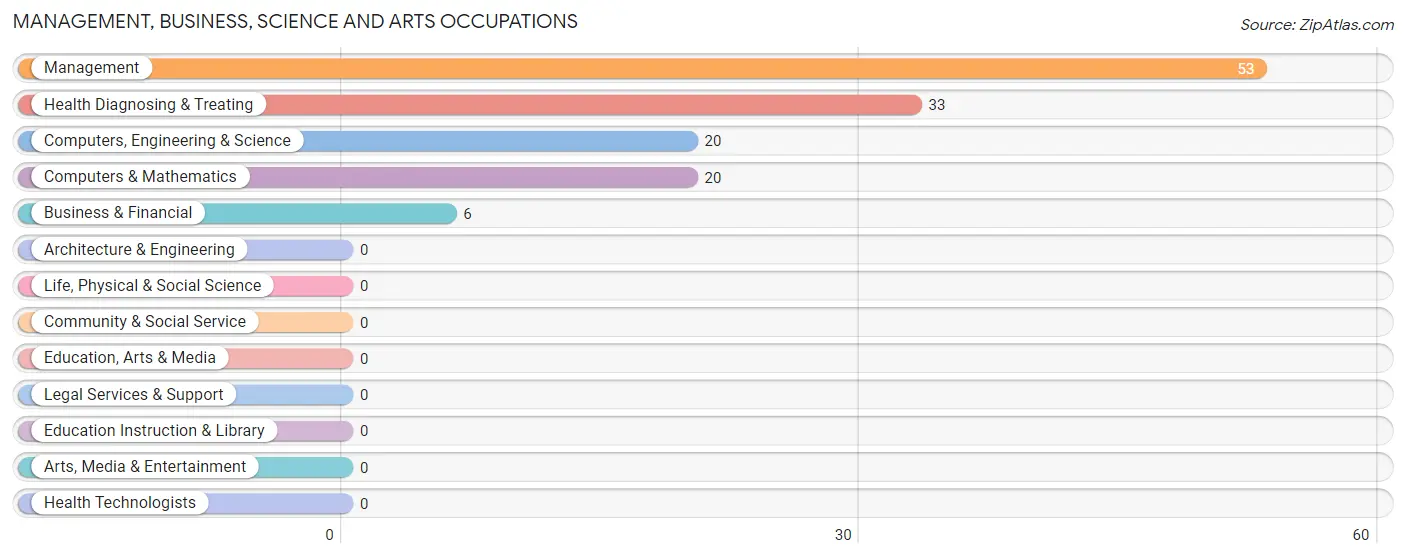
Management, Business, Science and Arts Occupations by Sex
Within the Management, Business, Science and Arts occupations in Eureka Mill, the most male-oriented occupations are Business & Financial (100.0%), Computers, Engineering & Science (100.0%), and Computers & Mathematics (100.0%), while the most female-oriented occupations are Health Diagnosing & Treating (100.0%), and Management (35.8%).
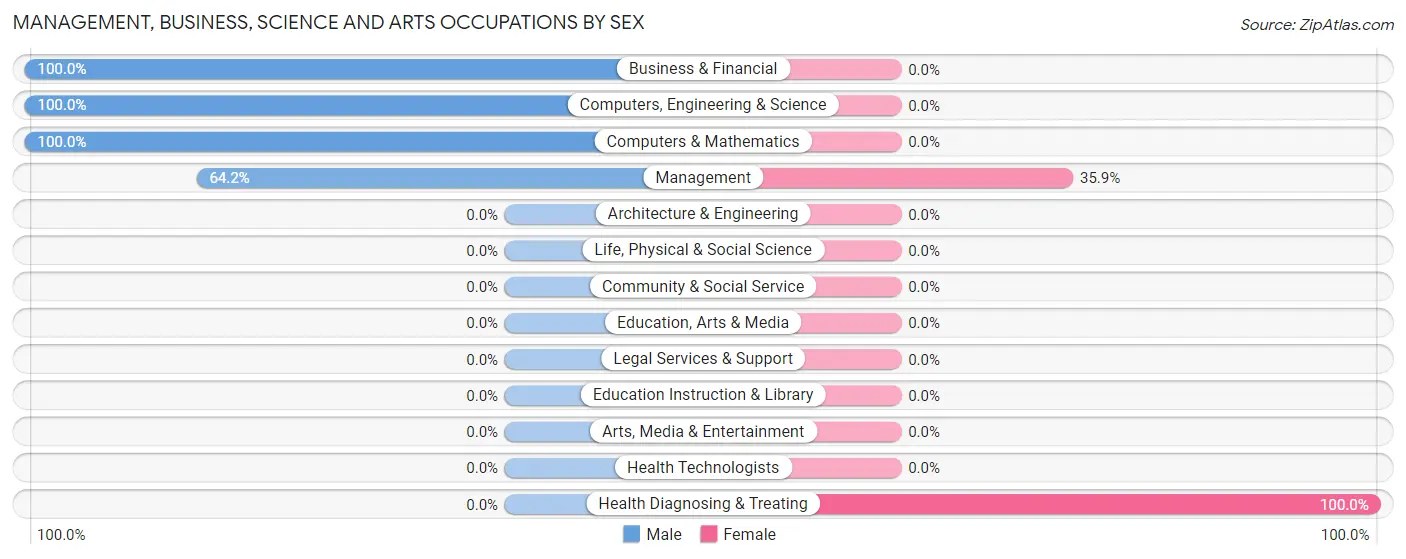
| Occupation | Male | Female |
| Management | 34 (64.1%) | 19 (35.8%) |
| Business & Financial | 6 (100.0%) | 0 (0.0%) |
| Computers, Engineering & Science | 20 (100.0%) | 0 (0.0%) |
| Computers & Mathematics | 20 (100.0%) | 0 (0.0%) |
| Architecture & Engineering | 0 (0.0%) | 0 (0.0%) |
| Life, Physical & Social Science | 0 (0.0%) | 0 (0.0%) |
| Community & Social Service | 0 (0.0%) | 0 (0.0%) |
| Education, Arts & Media | 0 (0.0%) | 0 (0.0%) |
| Legal Services & Support | 0 (0.0%) | 0 (0.0%) |
| Education Instruction & Library | 0 (0.0%) | 0 (0.0%) |
| Arts, Media & Entertainment | 0 (0.0%) | 0 (0.0%) |
| Health Diagnosing & Treating | 0 (0.0%) | 33 (100.0%) |
| Health Technologists | 0 (0.0%) | 0 (0.0%) |
| Total (Category) | 60 (53.6%) | 52 (46.4%) |
| Total (Overall) | 362 (43.1%) | 478 (56.9%) |
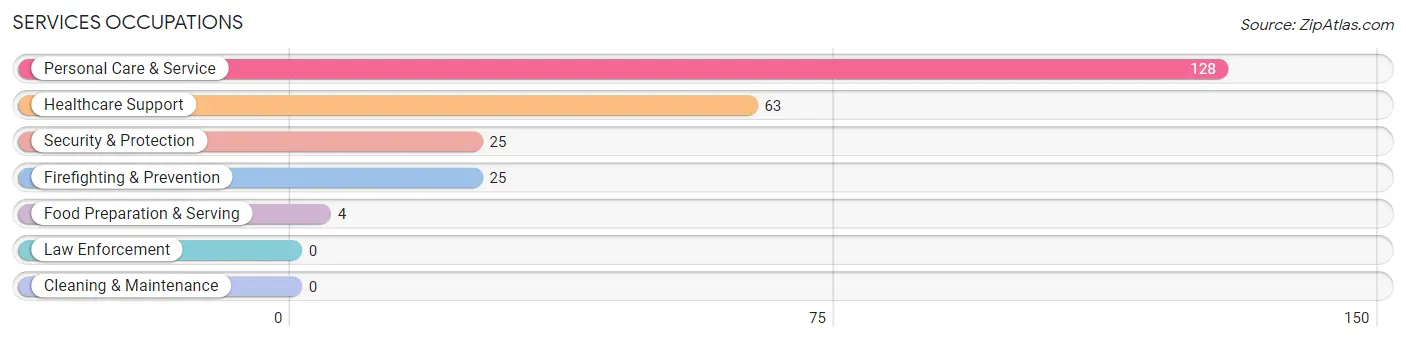
Services Occupations
The most common Services occupations in Eureka Mill are Personal Care & Service (128 | 15.2%), Healthcare Support (63 | 7.5%), Security & Protection (25 | 3.0%), Firefighting & Prevention (25 | 3.0%), and Food Preparation & Serving (4 | 0.5%).
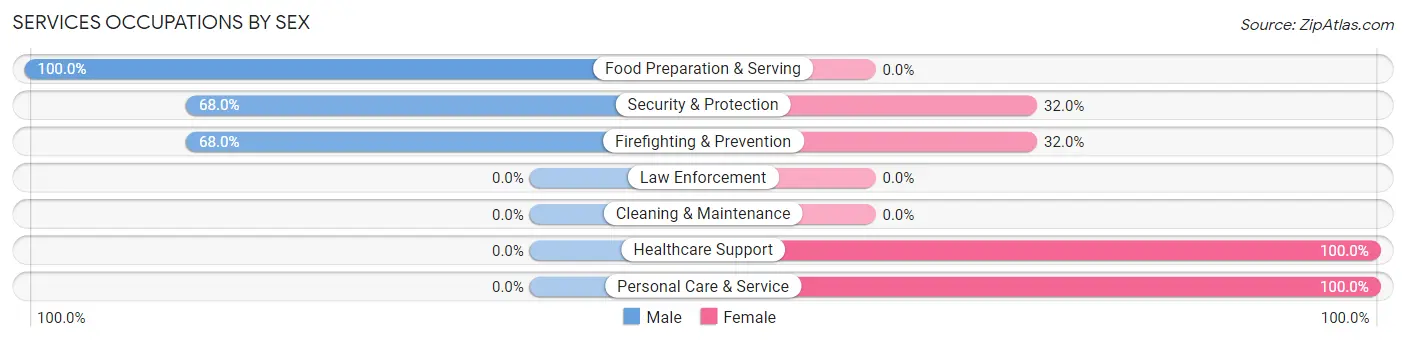
Services Occupations by Sex
Within the Services occupations in Eureka Mill, the most male-oriented occupations are Food Preparation & Serving (100.0%), Security & Protection (68.0%), and Firefighting & Prevention (68.0%), while the most female-oriented occupations are Healthcare Support (100.0%), Personal Care & Service (100.0%), and Security & Protection (32.0%).
| Occupation | Male | Female |
| Healthcare Support | 0 (0.0%) | 63 (100.0%) |
| Security & Protection | 17 (68.0%) | 8 (32.0%) |
| Firefighting & Prevention | 17 (68.0%) | 8 (32.0%) |
| Law Enforcement | 0 (0.0%) | 0 (0.0%) |
| Food Preparation & Serving | 4 (100.0%) | 0 (0.0%) |
| Cleaning & Maintenance | 0 (0.0%) | 0 (0.0%) |
| Personal Care & Service | 0 (0.0%) | 128 (100.0%) |
| Total (Category) | 21 (9.6%) | 199 (90.4%) |
| Total (Overall) | 362 (43.1%) | 478 (56.9%) |
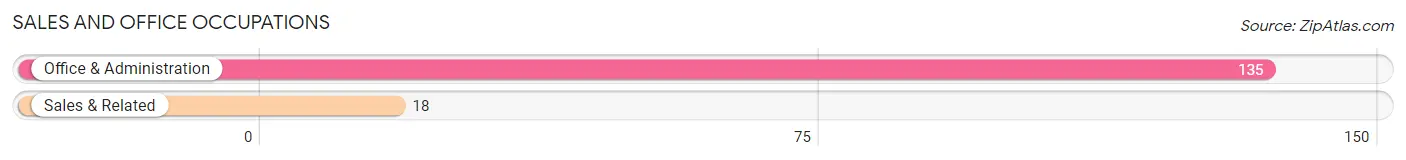
Sales and Office Occupations
The most common Sales and Office occupations in Eureka Mill are Office & Administration (135 | 16.1%), and Sales & Related (18 | 2.1%).
Sales and Office Occupations by Sex
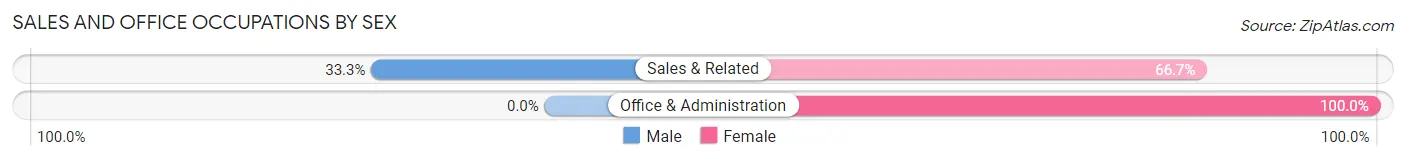
| Occupation | Male | Female |
| Sales & Related | 6 (33.3%) | 12 (66.7%) |
| Office & Administration | 0 (0.0%) | 135 (100.0%) |
| Total (Category) | 6 (3.9%) | 147 (96.1%) |
| Total (Overall) | 362 (43.1%) | 478 (56.9%) |
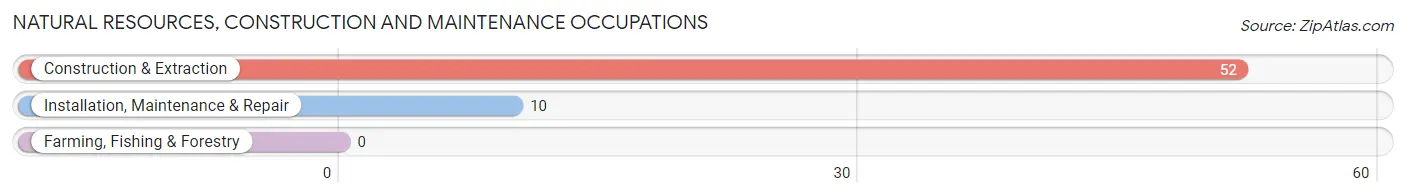
Natural Resources, Construction and Maintenance Occupations
The most common Natural Resources, Construction and Maintenance occupations in Eureka Mill are Construction & Extraction (52 | 6.2%), and Installation, Maintenance & Repair (10 | 1.2%).
Natural Resources, Construction and Maintenance Occupations by Sex
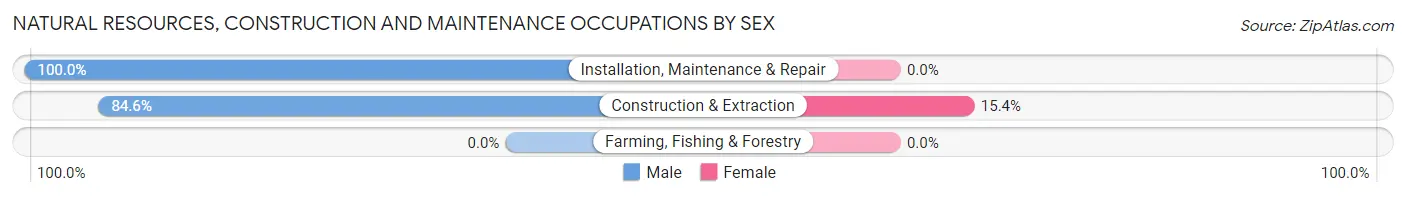
| Occupation | Male | Female |
| Farming, Fishing & Forestry | 0 (0.0%) | 0 (0.0%) |
| Construction & Extraction | 44 (84.6%) | 8 (15.4%) |
| Installation, Maintenance & Repair | 10 (100.0%) | 0 (0.0%) |
| Total (Category) | 54 (87.1%) | 8 (12.9%) |
| Total (Overall) | 362 (43.1%) | 478 (56.9%) |
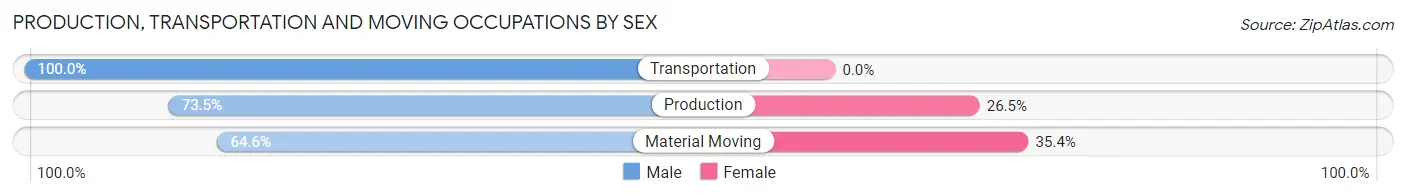
Production, Transportation and Moving Occupations
The most common Production, Transportation and Moving occupations in Eureka Mill are Material Moving (127 | 15.1%), Production (102 | 12.1%), and Transportation (64 | 7.6%).
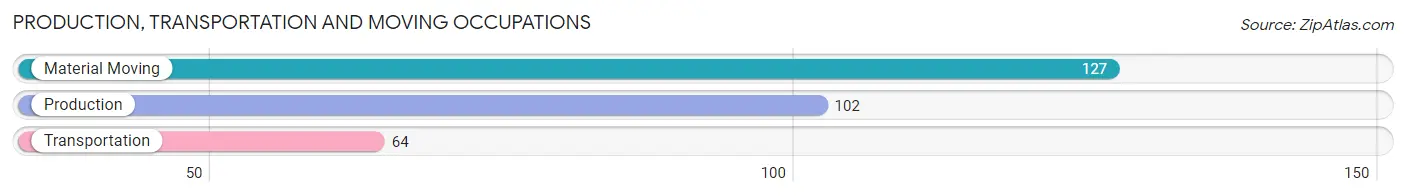
Production, Transportation and Moving Occupations by Sex
| Occupation | Male | Female |
| Production | 75 (73.5%) | 27 (26.5%) |
| Transportation | 64 (100.0%) | 0 (0.0%) |
| Material Moving | 82 (64.6%) | 45 (35.4%) |
| Total (Category) | 221 (75.4%) | 72 (24.6%) |
| Total (Overall) | 362 (43.1%) | 478 (56.9%) |
Employment Industries by Sex in Eureka Mill
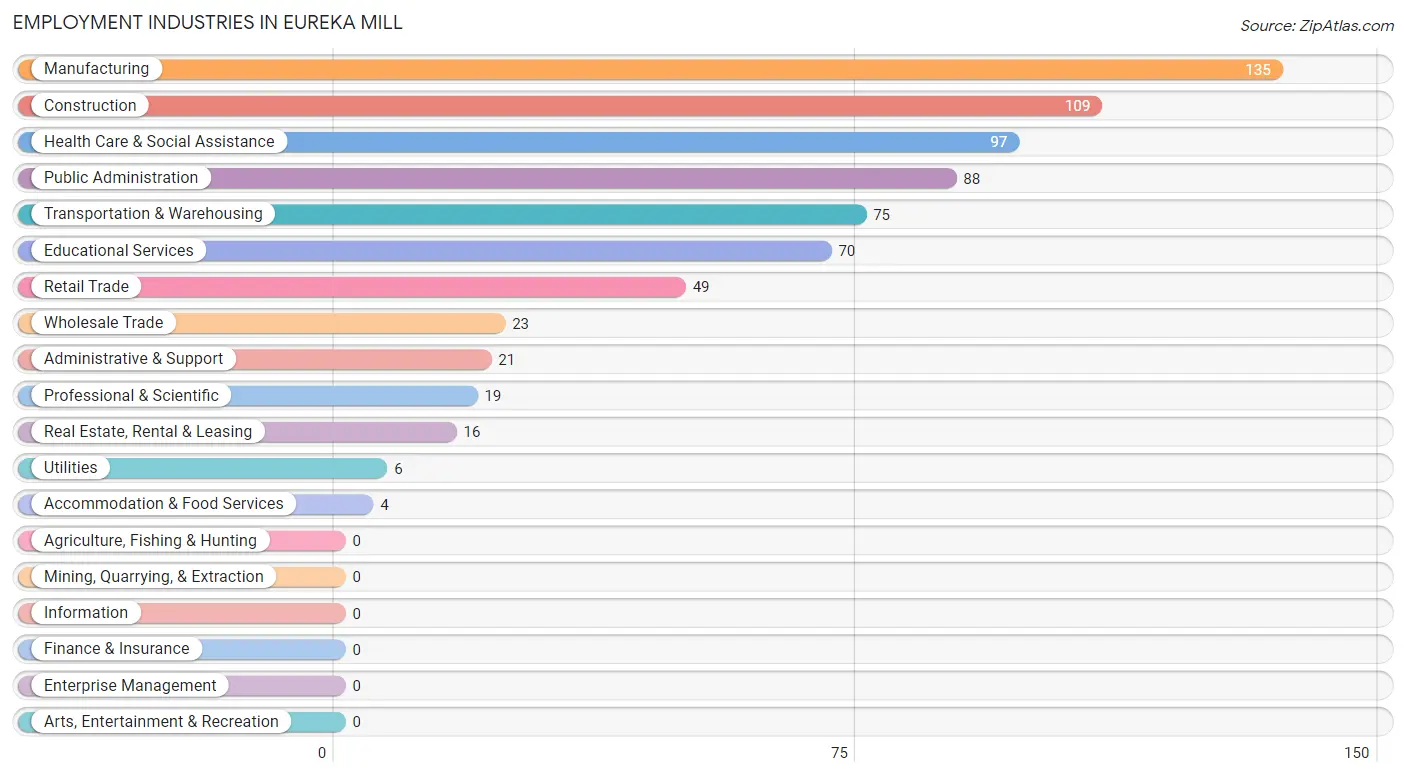
Employment Industries in Eureka Mill
The major employment industries in Eureka Mill include Manufacturing (135 | 16.1%), Construction (109 | 13.0%), Health Care & Social Assistance (97 | 11.6%), Public Administration (88 | 10.5%), and Transportation & Warehousing (75 | 8.9%).
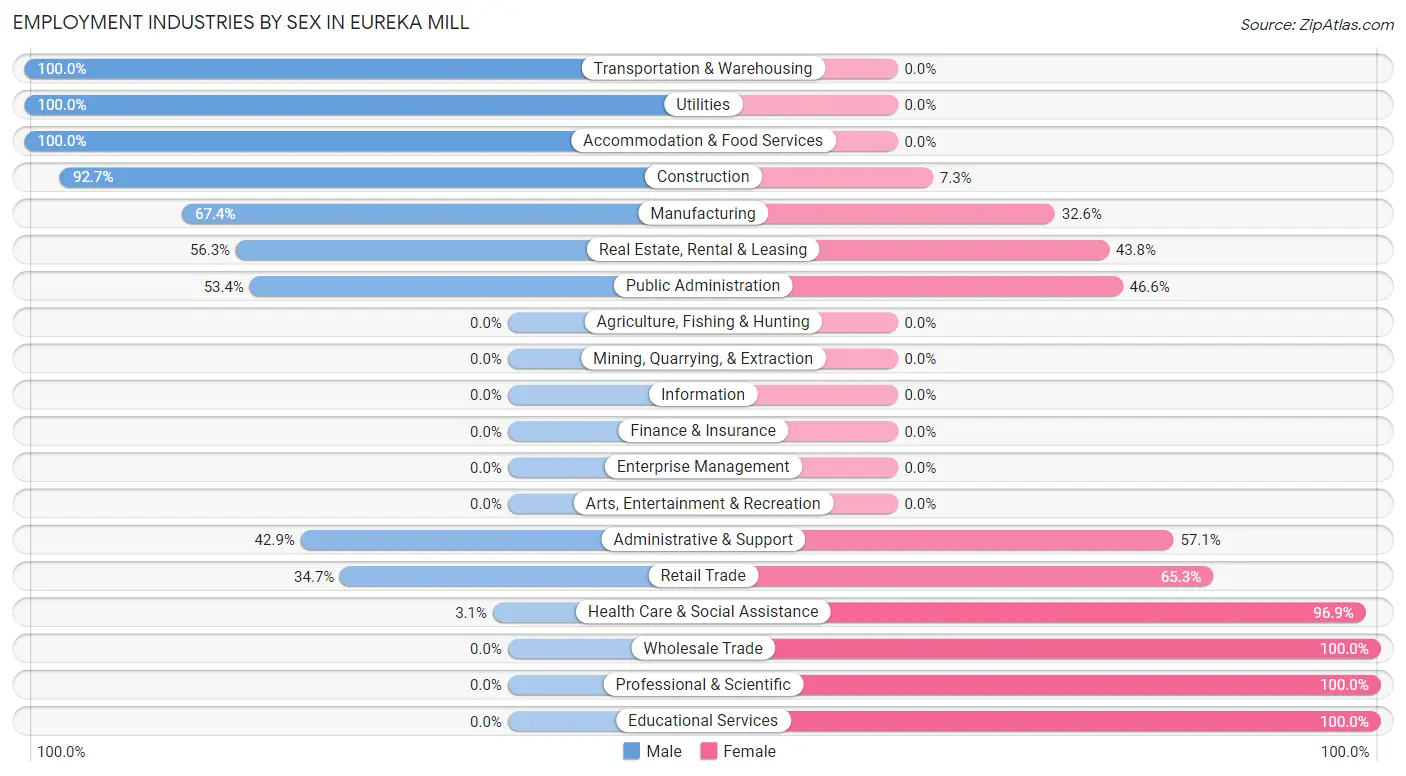
Employment Industries by Sex in Eureka Mill
The Eureka Mill industries that see more men than women are Transportation & Warehousing (100.0%), Utilities (100.0%), and Accommodation & Food Services (100.0%), whereas the industries that tend to have a higher number of women are Wholesale Trade (100.0%), Professional & Scientific (100.0%), and Educational Services (100.0%).
| Industry | Male | Female |
| Agriculture, Fishing & Hunting | 0 (0.0%) | 0 (0.0%) |
| Mining, Quarrying, & Extraction | 0 (0.0%) | 0 (0.0%) |
| Construction | 101 (92.7%) | 8 (7.3%) |
| Manufacturing | 91 (67.4%) | 44 (32.6%) |
| Wholesale Trade | 0 (0.0%) | 23 (100.0%) |
| Retail Trade | 17 (34.7%) | 32 (65.3%) |
| Transportation & Warehousing | 75 (100.0%) | 0 (0.0%) |
| Utilities | 6 (100.0%) | 0 (0.0%) |
| Information | 0 (0.0%) | 0 (0.0%) |
| Finance & Insurance | 0 (0.0%) | 0 (0.0%) |
| Real Estate, Rental & Leasing | 9 (56.2%) | 7 (43.8%) |
| Professional & Scientific | 0 (0.0%) | 19 (100.0%) |
| Enterprise Management | 0 (0.0%) | 0 (0.0%) |
| Administrative & Support | 9 (42.9%) | 12 (57.1%) |
| Educational Services | 0 (0.0%) | 70 (100.0%) |
| Health Care & Social Assistance | 3 (3.1%) | 94 (96.9%) |
| Arts, Entertainment & Recreation | 0 (0.0%) | 0 (0.0%) |
| Accommodation & Food Services | 4 (100.0%) | 0 (0.0%) |
| Public Administration | 47 (53.4%) | 41 (46.6%) |
| Total | 362 (43.1%) | 478 (56.9%) |
Education in Eureka Mill
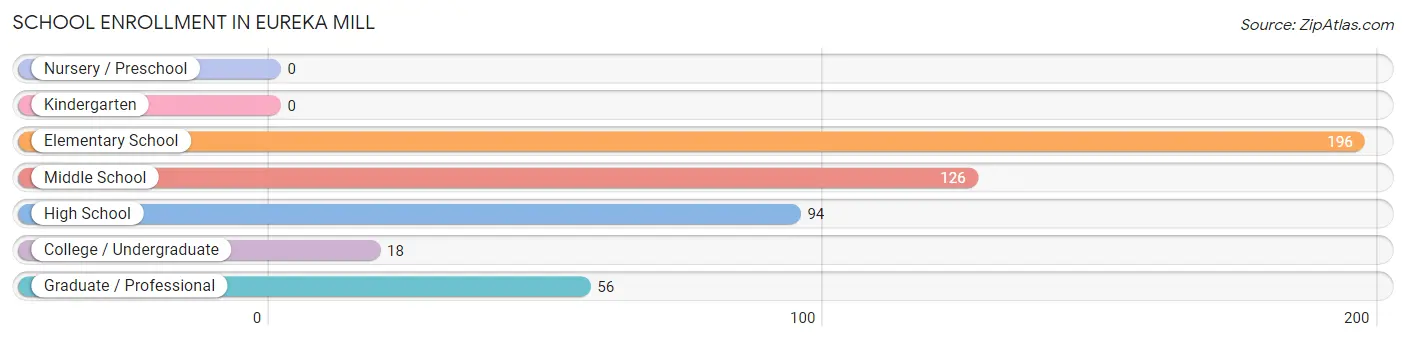
School Enrollment in Eureka Mill
The most common levels of schooling among the 490 students in Eureka Mill are elementary school (196 | 40.0%), middle school (126 | 25.7%), and high school (94 | 19.2%).
| School Level | # Students | % Students |
| Nursery / Preschool | 0 | 0.0% |
| Kindergarten | 0 | 0.0% |
| Elementary School | 196 | 40.0% |
| Middle School | 126 | 25.7% |
| High School | 94 | 19.2% |
| College / Undergraduate | 18 | 3.7% |
| Graduate / Professional | 56 | 11.4% |
| Total | 490 | 100.0% |
School Enrollment by Age by Funding Source in Eureka Mill
Out of a total of 490 students who are enrolled in schools in Eureka Mill, 81 (16.5%) attend a private institution, while the remaining 409 (83.5%) are enrolled in public schools. The age group of 25 to 34 year olds has the highest likelihood of being enrolled in private schools, with 56 (100.0% in the age bracket) enrolled. Conversely, the age group of 18 to 19 year olds has the lowest likelihood of being enrolled in a private school, with 41 (100.0% in the age bracket) attending a public institution.
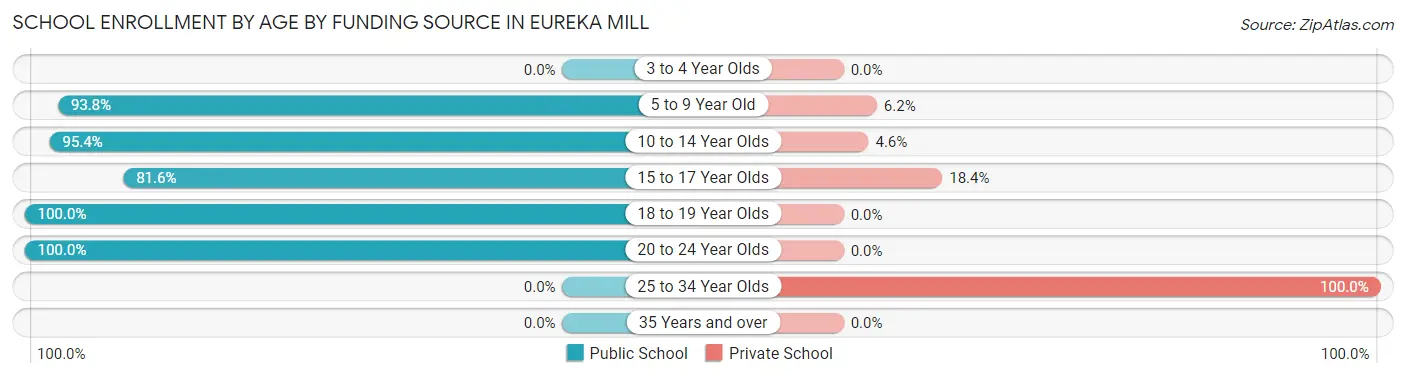
| Age Bracket | Public School | Private School |
| 3 to 4 Year Olds | 0 (0.0%) | 0 (0.0%) |
| 5 to 9 Year Old | 91 (93.8%) | 6 (6.2%) |
| 10 to 14 Year Olds | 206 (95.4%) | 10 (4.6%) |
| 15 to 17 Year Olds | 40 (81.6%) | 9 (18.4%) |
| 18 to 19 Year Olds | 41 (100.0%) | 0 (0.0%) |
| 20 to 24 Year Olds | 31 (100.0%) | 0 (0.0%) |
| 25 to 34 Year Olds | 0 (0.0%) | 56 (100.0%) |
| 35 Years and over | 0 (0.0%) | 0 (0.0%) |
| Total | 409 (83.5%) | 81 (16.5%) |
Educational Attainment by Field of Study in Eureka Mill
Business (79 | 48.2%), education (38 | 23.2%), liberal arts & history (20 | 12.2%), physical & health sciences (18 | 11.0%), and science & technology (9 | 5.5%) are the most common fields of study among 164 individuals in Eureka Mill who have obtained a bachelor's degree or higher.
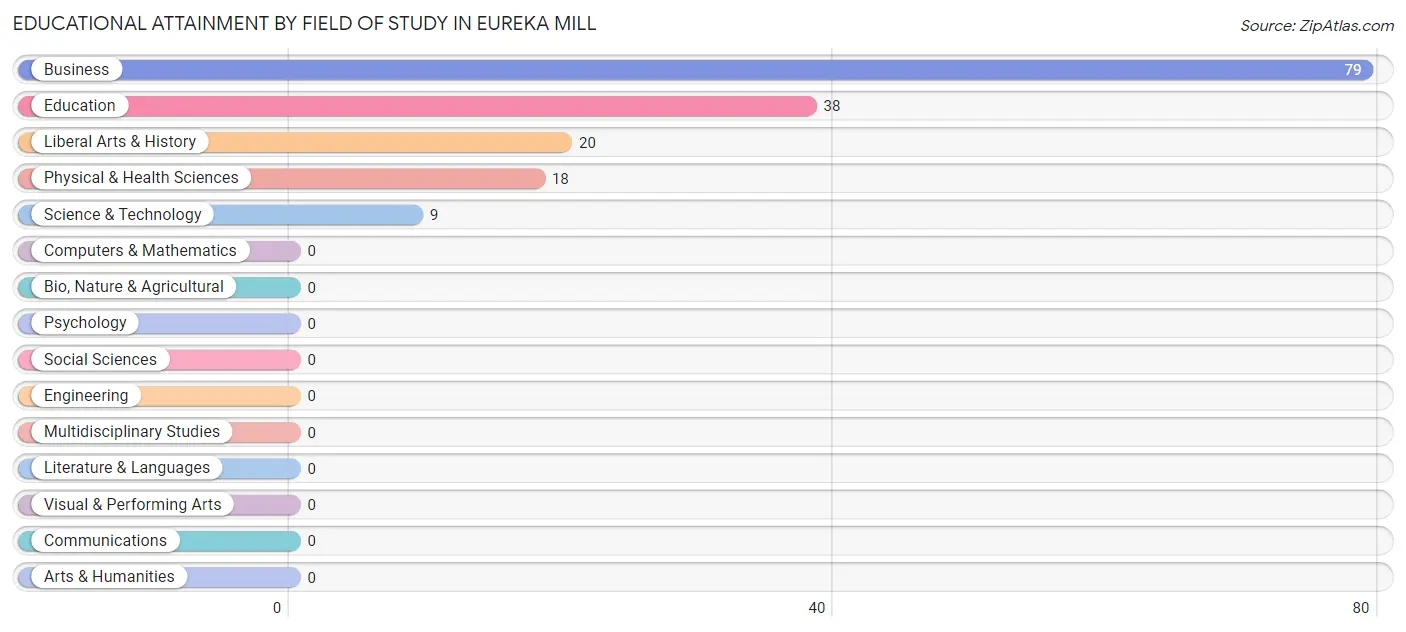
| Field of Study | # Graduates | % Graduates |
| Computers & Mathematics | 0 | 0.0% |
| Bio, Nature & Agricultural | 0 | 0.0% |
| Physical & Health Sciences | 18 | 11.0% |
| Psychology | 0 | 0.0% |
| Social Sciences | 0 | 0.0% |
| Engineering | 0 | 0.0% |
| Multidisciplinary Studies | 0 | 0.0% |
| Science & Technology | 9 | 5.5% |
| Business | 79 | 48.2% |
| Education | 38 | 23.2% |
| Literature & Languages | 0 | 0.0% |
| Liberal Arts & History | 20 | 12.2% |
| Visual & Performing Arts | 0 | 0.0% |
| Communications | 0 | 0.0% |
| Arts & Humanities | 0 | 0.0% |
| Total | 164 | 100.0% |
Transportation & Commute in Eureka Mill
Vehicle Availability by Sex in Eureka Mill
The most prevalent vehicle ownership categories in Eureka Mill are males with 2 vehicles (179, accounting for 50.1%) and females with 2 vehicles (121, making up 38.7%).
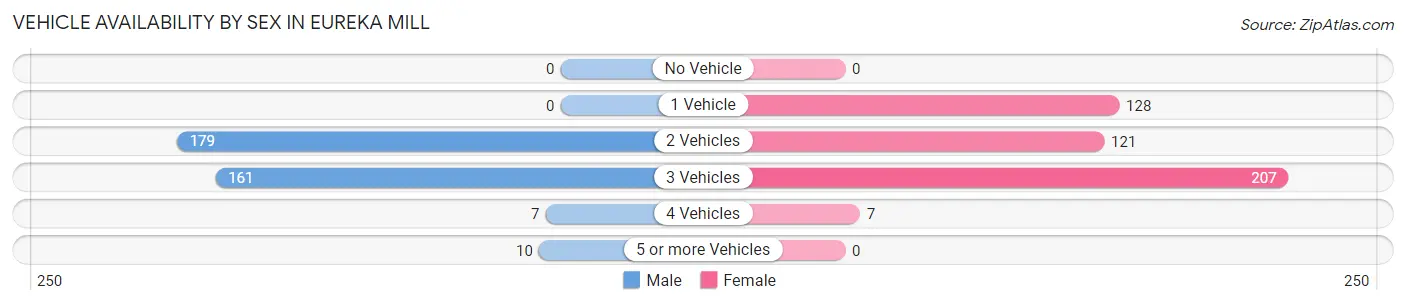
| Vehicles Available | Male | Female |
| No Vehicle | 0 (0.0%) | 0 (0.0%) |
| 1 Vehicle | 0 (0.0%) | 128 (27.7%) |
| 2 Vehicles | 179 (50.1%) | 121 (26.1%) |
| 3 Vehicles | 161 (45.1%) | 207 (44.7%) |
| 4 Vehicles | 7 (2.0%) | 7 (1.5%) |
| 5 or more Vehicles | 10 (2.8%) | 0 (0.0%) |
| Total | 357 (100.0%) | 463 (100.0%) |
Commute Time in Eureka Mill
The most frequently occuring commute durations in Eureka Mill are 5 to 9 minutes (186 commuters, 22.6%), 30 to 34 minutes (167 commuters, 20.2%), and 20 to 24 minutes (138 commuters, 16.7%).
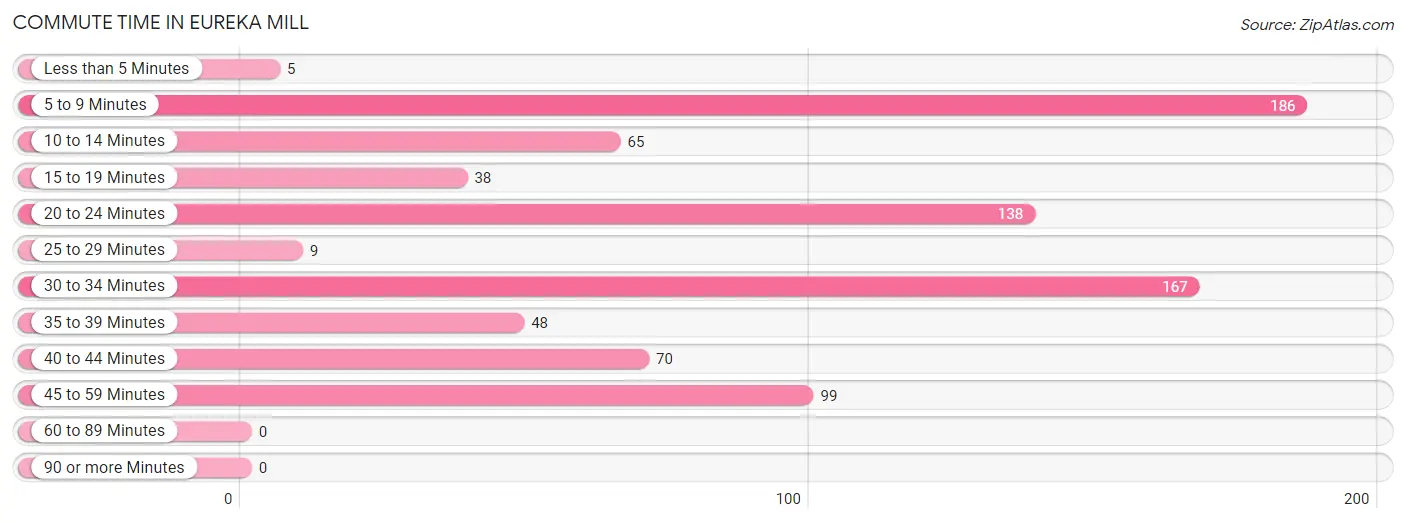
| Commute Time | # Commuters | % Commuters |
| Less than 5 Minutes | 5 | 0.6% |
| 5 to 9 Minutes | 186 | 22.6% |
| 10 to 14 Minutes | 65 | 7.9% |
| 15 to 19 Minutes | 38 | 4.6% |
| 20 to 24 Minutes | 138 | 16.7% |
| 25 to 29 Minutes | 9 | 1.1% |
| 30 to 34 Minutes | 167 | 20.2% |
| 35 to 39 Minutes | 48 | 5.8% |
| 40 to 44 Minutes | 70 | 8.5% |
| 45 to 59 Minutes | 99 | 12.0% |
| 60 to 89 Minutes | 0 | 0.0% |
| 90 or more Minutes | 0 | 0.0% |
Commute Time by Sex in Eureka Mill
The most common commute times in Eureka Mill are 20 to 24 minutes (117 commuters, 32.3%) for males and 5 to 9 minutes (155 commuters, 33.5%) for females.
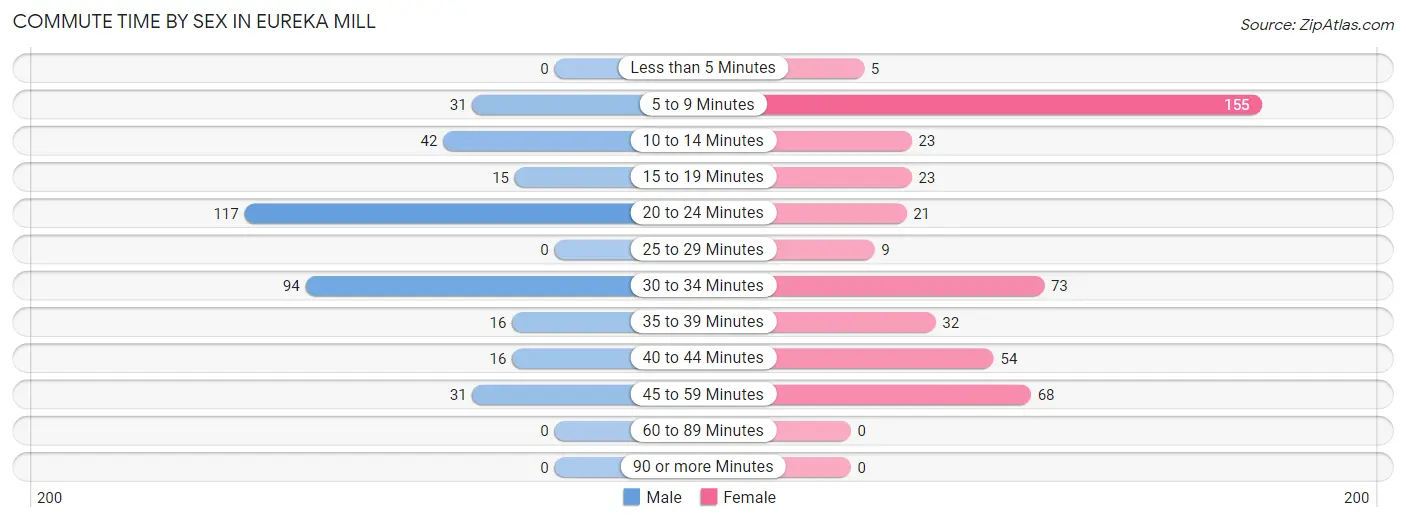
| Commute Time | Male | Female |
| Less than 5 Minutes | 0 (0.0%) | 5 (1.1%) |
| 5 to 9 Minutes | 31 (8.6%) | 155 (33.5%) |
| 10 to 14 Minutes | 42 (11.6%) | 23 (5.0%) |
| 15 to 19 Minutes | 15 (4.1%) | 23 (5.0%) |
| 20 to 24 Minutes | 117 (32.3%) | 21 (4.5%) |
| 25 to 29 Minutes | 0 (0.0%) | 9 (1.9%) |
| 30 to 34 Minutes | 94 (26.0%) | 73 (15.8%) |
| 35 to 39 Minutes | 16 (4.4%) | 32 (6.9%) |
| 40 to 44 Minutes | 16 (4.4%) | 54 (11.7%) |
| 45 to 59 Minutes | 31 (8.6%) | 68 (14.7%) |
| 60 to 89 Minutes | 0 (0.0%) | 0 (0.0%) |
| 90 or more Minutes | 0 (0.0%) | 0 (0.0%) |
Time of Departure to Work by Sex in Eureka Mill
The most frequent times of departure to work in Eureka Mill are 5:00 AM to 5:29 AM (67, 18.5%) for males and 5:30 AM to 5:59 AM (145, 31.3%) for females.
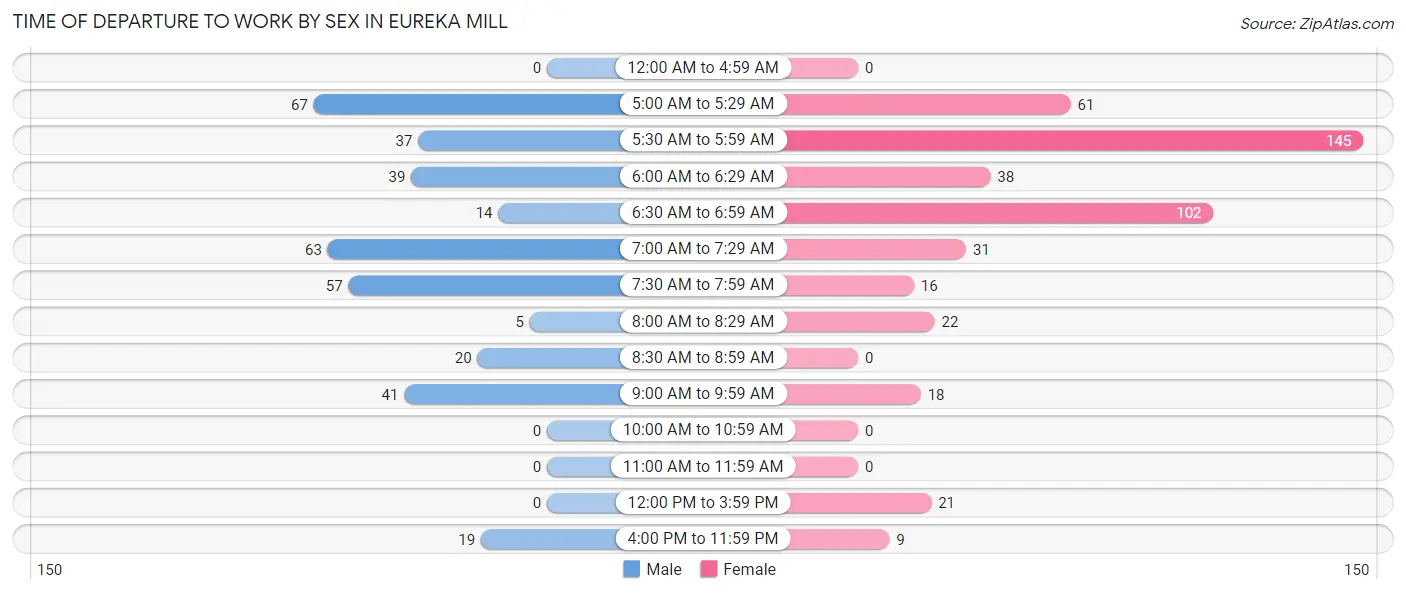
| Time of Departure | Male | Female |
| 12:00 AM to 4:59 AM | 0 (0.0%) | 0 (0.0%) |
| 5:00 AM to 5:29 AM | 67 (18.5%) | 61 (13.2%) |
| 5:30 AM to 5:59 AM | 37 (10.2%) | 145 (31.3%) |
| 6:00 AM to 6:29 AM | 39 (10.8%) | 38 (8.2%) |
| 6:30 AM to 6:59 AM | 14 (3.9%) | 102 (22.0%) |
| 7:00 AM to 7:29 AM | 63 (17.4%) | 31 (6.7%) |
| 7:30 AM to 7:59 AM | 57 (15.8%) | 16 (3.5%) |
| 8:00 AM to 8:29 AM | 5 (1.4%) | 22 (4.8%) |
| 8:30 AM to 8:59 AM | 20 (5.5%) | 0 (0.0%) |
| 9:00 AM to 9:59 AM | 41 (11.3%) | 18 (3.9%) |
| 10:00 AM to 10:59 AM | 0 (0.0%) | 0 (0.0%) |
| 11:00 AM to 11:59 AM | 0 (0.0%) | 0 (0.0%) |
| 12:00 PM to 3:59 PM | 0 (0.0%) | 21 (4.5%) |
| 4:00 PM to 11:59 PM | 19 (5.2%) | 9 (1.9%) |
| Total | 362 (100.0%) | 463 (100.0%) |
Housing Occupancy in Eureka Mill
Occupancy by Ownership in Eureka Mill
Of the total 710 dwellings in Eureka Mill, owner-occupied units account for 638 (89.9%), while renter-occupied units make up 72 (10.1%).
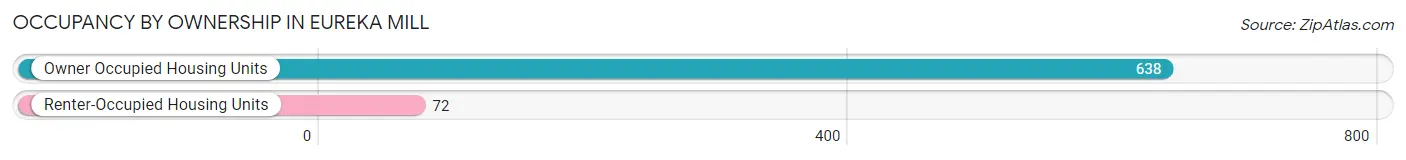
| Occupancy | # Housing Units | % Housing Units |
| Owner Occupied Housing Units | 638 | 89.9% |
| Renter-Occupied Housing Units | 72 | 10.1% |
| Total Occupied Housing Units | 710 | 100.0% |
Occupancy by Household Size in Eureka Mill
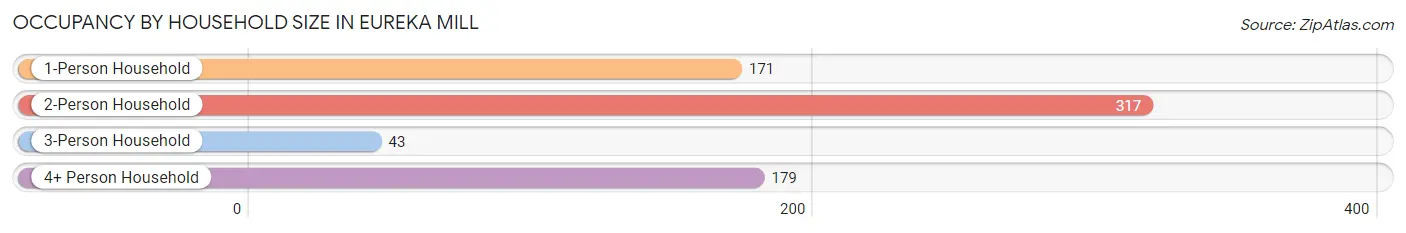
| Household Size | # Housing Units | % Housing Units |
| 1-Person Household | 171 | 24.1% |
| 2-Person Household | 317 | 44.7% |
| 3-Person Household | 43 | 6.1% |
| 4+ Person Household | 179 | 25.2% |
| Total Housing Units | 710 | 100.0% |
Occupancy by Ownership by Household Size in Eureka Mill
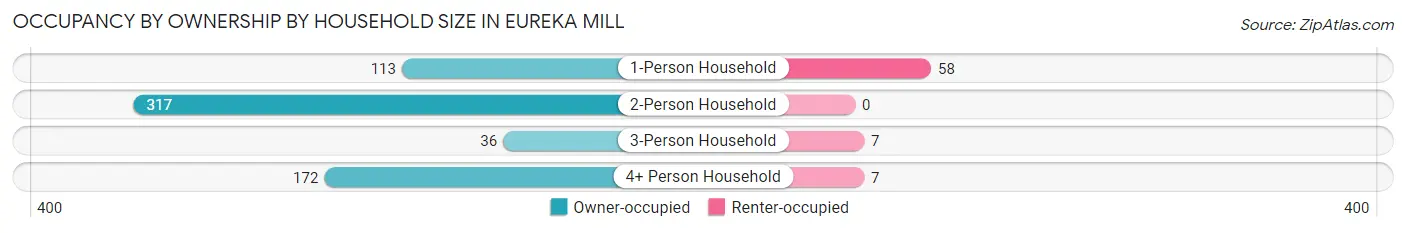
| Household Size | Owner-occupied | Renter-occupied |
| 1-Person Household | 113 (66.1%) | 58 (33.9%) |
| 2-Person Household | 317 (100.0%) | 0 (0.0%) |
| 3-Person Household | 36 (83.7%) | 7 (16.3%) |
| 4+ Person Household | 172 (96.1%) | 7 (3.9%) |
| Total Housing Units | 638 (89.9%) | 72 (10.1%) |
Occupancy by Educational Attainment in Eureka Mill
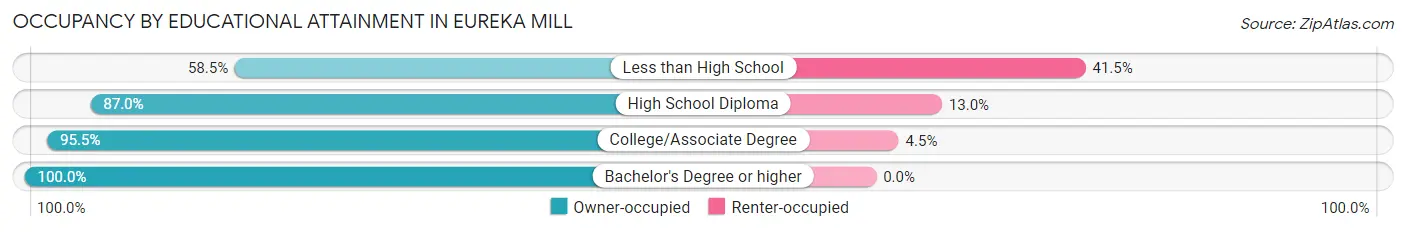
| Household Size | Owner-occupied | Renter-occupied |
| Less than High School | 31 (58.5%) | 22 (41.5%) |
| High School Diploma | 240 (87.0%) | 36 (13.0%) |
| College/Associate Degree | 300 (95.5%) | 14 (4.5%) |
| Bachelor's Degree or higher | 67 (100.0%) | 0 (0.0%) |
Occupancy by Age of Householder in Eureka Mill
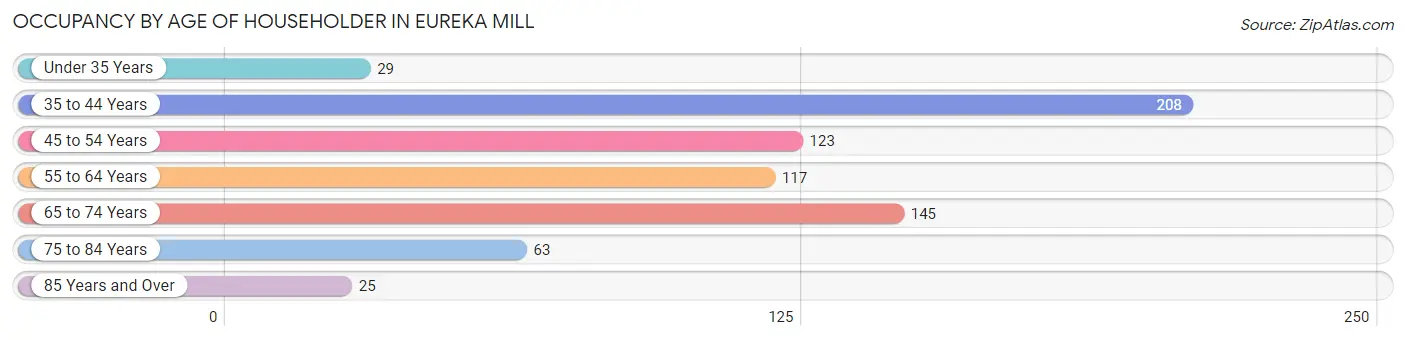
| Age Bracket | # Households | % Households |
| Under 35 Years | 29 | 4.1% |
| 35 to 44 Years | 208 | 29.3% |
| 45 to 54 Years | 123 | 17.3% |
| 55 to 64 Years | 117 | 16.5% |
| 65 to 74 Years | 145 | 20.4% |
| 75 to 84 Years | 63 | 8.9% |
| 85 Years and Over | 25 | 3.5% |
| Total | 710 | 100.0% |
Housing Finances in Eureka Mill
Median Income by Occupancy in Eureka Mill
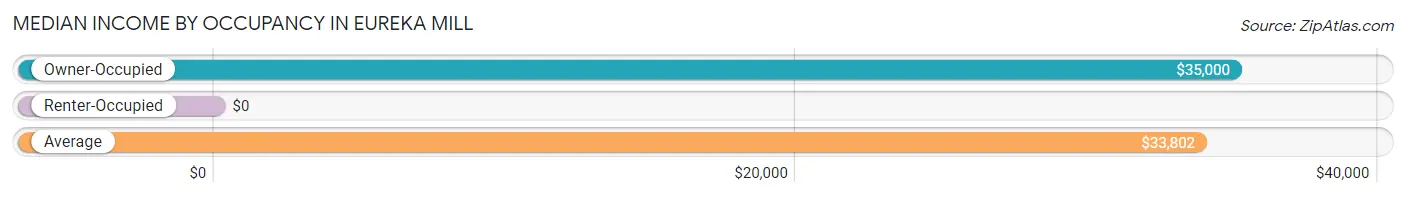
| Occupancy Type | # Households | Median Income |
| Owner-Occupied | 638 (89.9%) | $35,000 |
| Renter-Occupied | 72 (10.1%) | $0 |
| Average | 710 (100.0%) | $33,802 |
Occupancy by Householder Income Bracket in Eureka Mill
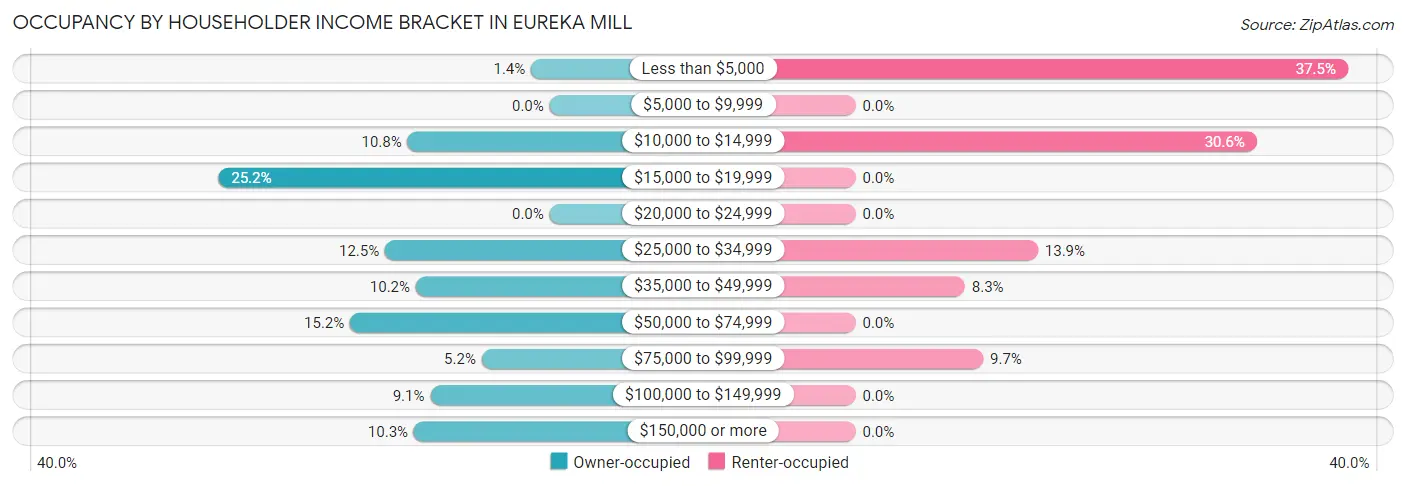
| Income Bracket | Owner-occupied | Renter-occupied |
| Less than $5,000 | 9 (1.4%) | 27 (37.5%) |
| $5,000 to $9,999 | 0 (0.0%) | 0 (0.0%) |
| $10,000 to $14,999 | 69 (10.8%) | 22 (30.6%) |
| $15,000 to $19,999 | 161 (25.2%) | 0 (0.0%) |
| $20,000 to $24,999 | 0 (0.0%) | 0 (0.0%) |
| $25,000 to $34,999 | 80 (12.5%) | 10 (13.9%) |
| $35,000 to $49,999 | 65 (10.2%) | 6 (8.3%) |
| $50,000 to $74,999 | 97 (15.2%) | 0 (0.0%) |
| $75,000 to $99,999 | 33 (5.2%) | 7 (9.7%) |
| $100,000 to $149,999 | 58 (9.1%) | 0 (0.0%) |
| $150,000 or more | 66 (10.3%) | 0 (0.0%) |
| Total | 638 (100.0%) | 72 (100.0%) |
Monthly Housing Cost Tiers in Eureka Mill
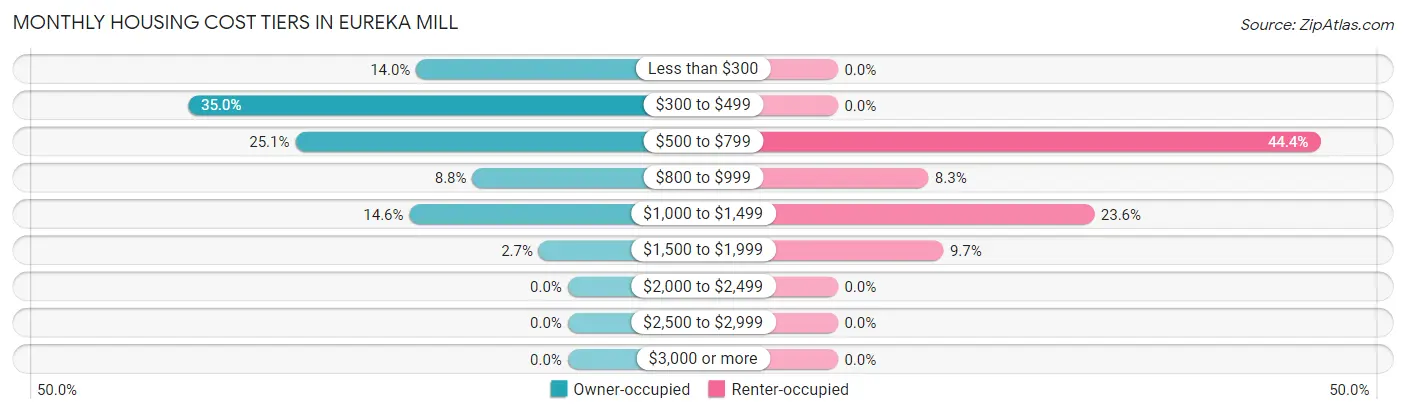
| Monthly Cost | Owner-occupied | Renter-occupied |
| Less than $300 | 89 (14.0%) | 0 (0.0%) |
| $300 to $499 | 223 (34.9%) | 0 (0.0%) |
| $500 to $799 | 160 (25.1%) | 32 (44.4%) |
| $800 to $999 | 56 (8.8%) | 6 (8.3%) |
| $1,000 to $1,499 | 93 (14.6%) | 17 (23.6%) |
| $1,500 to $1,999 | 17 (2.7%) | 7 (9.7%) |
| $2,000 to $2,499 | 0 (0.0%) | 0 (0.0%) |
| $2,500 to $2,999 | 0 (0.0%) | 0 (0.0%) |
| $3,000 or more | 0 (0.0%) | 0 (0.0%) |
| Total | 638 (100.0%) | 72 (100.0%) |
Physical Housing Characteristics in Eureka Mill
Housing Structures in Eureka Mill
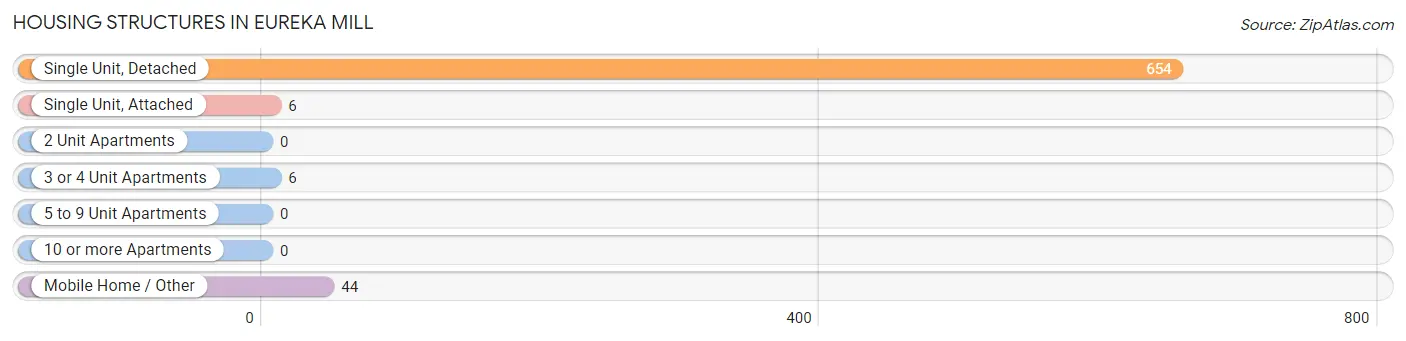
| Structure Type | # Housing Units | % Housing Units |
| Single Unit, Detached | 654 | 92.1% |
| Single Unit, Attached | 6 | 0.9% |
| 2 Unit Apartments | 0 | 0.0% |
| 3 or 4 Unit Apartments | 6 | 0.9% |
| 5 to 9 Unit Apartments | 0 | 0.0% |
| 10 or more Apartments | 0 | 0.0% |
| Mobile Home / Other | 44 | 6.2% |
| Total | 710 | 100.0% |
Housing Structures by Occupancy in Eureka Mill
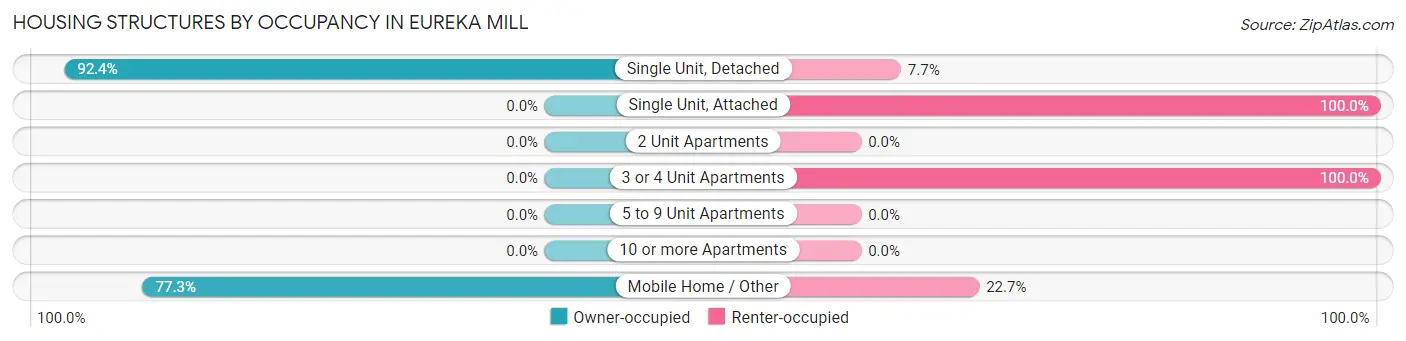
| Structure Type | Owner-occupied | Renter-occupied |
| Single Unit, Detached | 604 (92.3%) | 50 (7.6%) |
| Single Unit, Attached | 0 (0.0%) | 6 (100.0%) |
| 2 Unit Apartments | 0 (0.0%) | 0 (0.0%) |
| 3 or 4 Unit Apartments | 0 (0.0%) | 6 (100.0%) |
| 5 to 9 Unit Apartments | 0 (0.0%) | 0 (0.0%) |
| 10 or more Apartments | 0 (0.0%) | 0 (0.0%) |
| Mobile Home / Other | 34 (77.3%) | 10 (22.7%) |
| Total | 638 (89.9%) | 72 (10.1%) |
Housing Structures by Number of Rooms in Eureka Mill
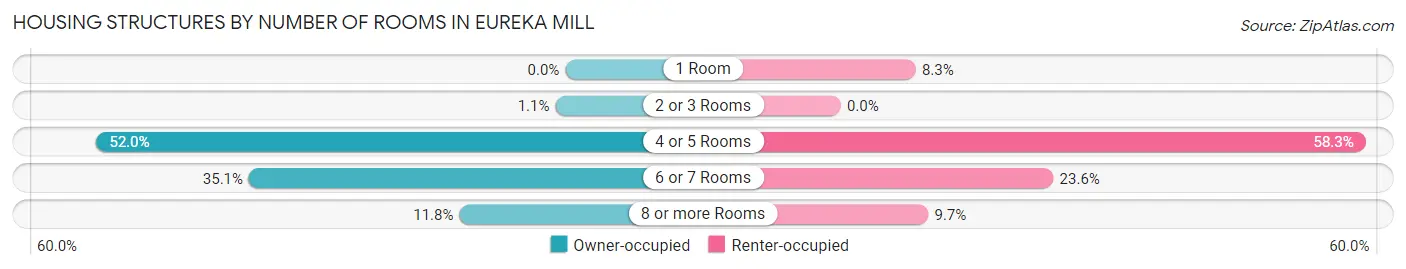
| Number of Rooms | Owner-occupied | Renter-occupied |
| 1 Room | 0 (0.0%) | 6 (8.3%) |
| 2 or 3 Rooms | 7 (1.1%) | 0 (0.0%) |
| 4 or 5 Rooms | 332 (52.0%) | 42 (58.3%) |
| 6 or 7 Rooms | 224 (35.1%) | 17 (23.6%) |
| 8 or more Rooms | 75 (11.8%) | 7 (9.7%) |
| Total | 638 (100.0%) | 72 (100.0%) |
Housing Structure by Heating Type in Eureka Mill
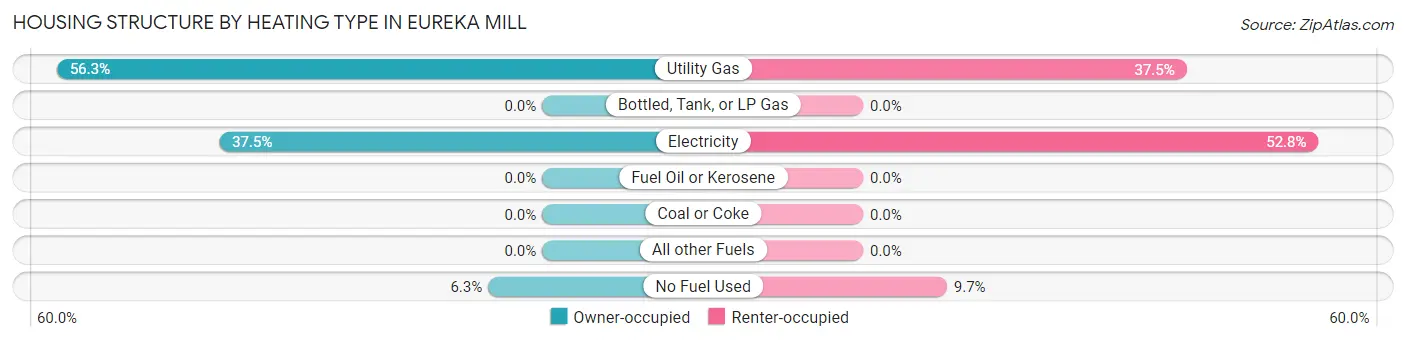
| Heating Type | Owner-occupied | Renter-occupied |
| Utility Gas | 359 (56.3%) | 27 (37.5%) |
| Bottled, Tank, or LP Gas | 0 (0.0%) | 0 (0.0%) |
| Electricity | 239 (37.5%) | 38 (52.8%) |
| Fuel Oil or Kerosene | 0 (0.0%) | 0 (0.0%) |
| Coal or Coke | 0 (0.0%) | 0 (0.0%) |
| All other Fuels | 0 (0.0%) | 0 (0.0%) |
| No Fuel Used | 40 (6.3%) | 7 (9.7%) |
| Total | 638 (100.0%) | 72 (100.0%) |
Household Vehicle Usage in Eureka Mill
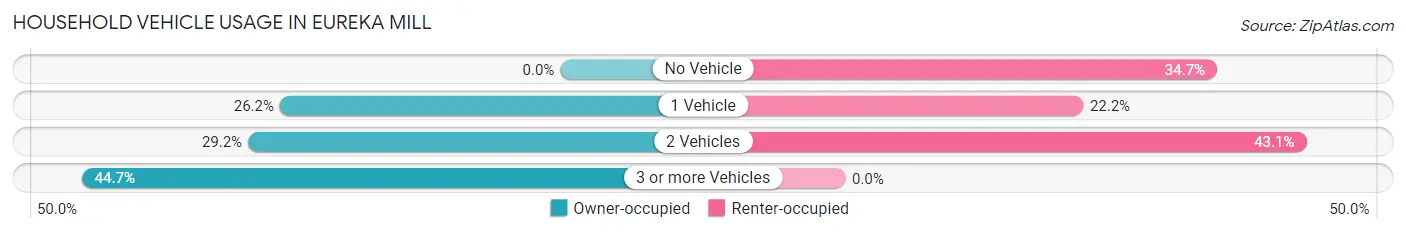
| Vehicles per Household | Owner-occupied | Renter-occupied |
| No Vehicle | 0 (0.0%) | 25 (34.7%) |
| 1 Vehicle | 167 (26.2%) | 16 (22.2%) |
| 2 Vehicles | 186 (29.1%) | 31 (43.1%) |
| 3 or more Vehicles | 285 (44.7%) | 0 (0.0%) |
| Total | 638 (100.0%) | 72 (100.0%) |
Real Estate & Mortgages in Eureka Mill
Real Estate and Mortgage Overview in Eureka Mill
| Characteristic | Without Mortgage | With Mortgage |
| Housing Units | 414 | 224 |
| Median Property Value | $152,100 | $184,400 |
| Median Household Income | - | - |
| Monthly Housing Costs | $331 | $0 |
| Real Estate Taxes | $682 | $29 |
Property Value by Mortgage Status in Eureka Mill
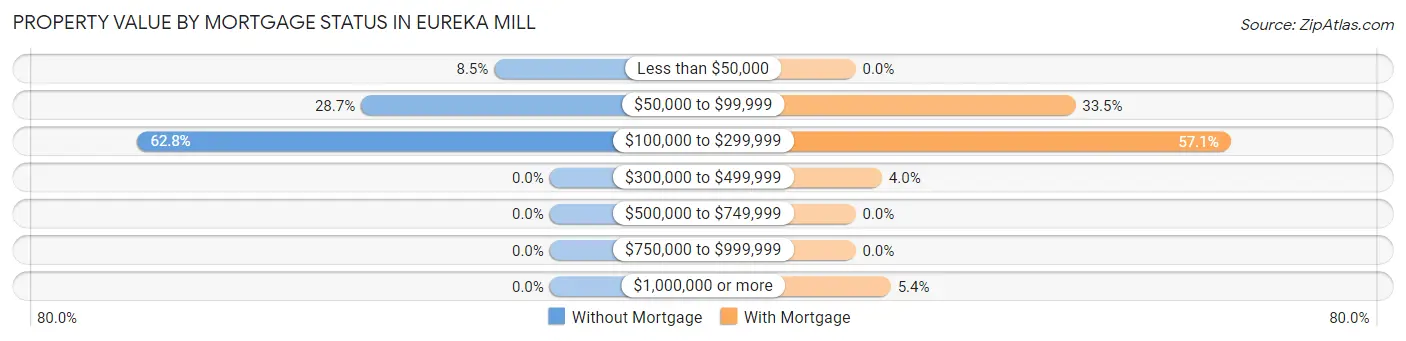
| Property Value | Without Mortgage | With Mortgage |
| Less than $50,000 | 35 (8.5%) | 0 (0.0%) |
| $50,000 to $99,999 | 119 (28.7%) | 75 (33.5%) |
| $100,000 to $299,999 | 260 (62.8%) | 128 (57.1%) |
| $300,000 to $499,999 | 0 (0.0%) | 9 (4.0%) |
| $500,000 to $749,999 | 0 (0.0%) | 0 (0.0%) |
| $750,000 to $999,999 | 0 (0.0%) | 0 (0.0%) |
| $1,000,000 or more | 0 (0.0%) | 12 (5.4%) |
| Total | 414 (100.0%) | 224 (100.0%) |
Household Income by Mortgage Status in Eureka Mill
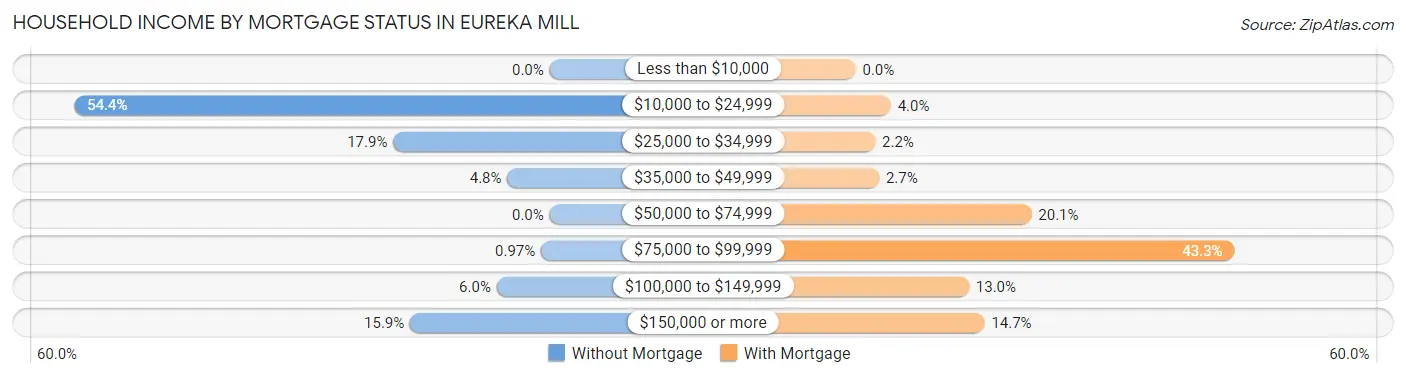
| Household Income | Without Mortgage | With Mortgage |
| Less than $10,000 | 0 (0.0%) | 0 (0.0%) |
| $10,000 to $24,999 | 225 (54.3%) | 9 (4.0%) |
| $25,000 to $34,999 | 74 (17.9%) | 5 (2.2%) |
| $35,000 to $49,999 | 20 (4.8%) | 6 (2.7%) |
| $50,000 to $74,999 | 0 (0.0%) | 45 (20.1%) |
| $75,000 to $99,999 | 4 (1.0%) | 97 (43.3%) |
| $100,000 to $149,999 | 25 (6.0%) | 29 (13.0%) |
| $150,000 or more | 66 (15.9%) | 33 (14.7%) |
| Total | 414 (100.0%) | 224 (100.0%) |
Property Value to Household Income Ratio in Eureka Mill
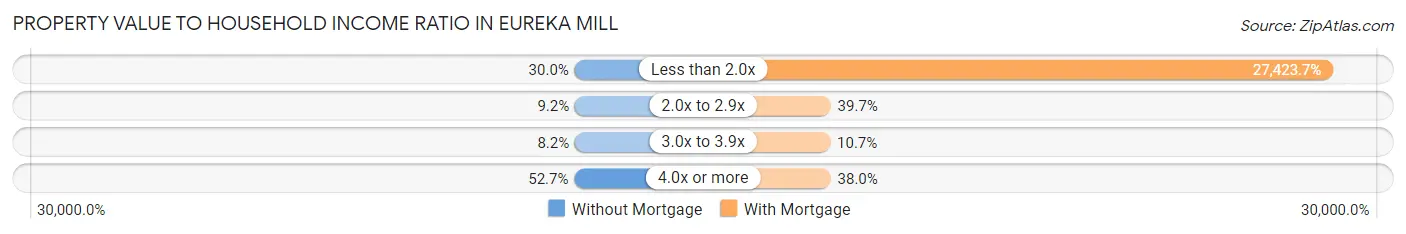
| Value-to-Income Ratio | Without Mortgage | With Mortgage |
| Less than 2.0x | 124 (29.9%) | 61,429 (27,423.7%) |
| 2.0x to 2.9x | 38 (9.2%) | 89 (39.7%) |
| 3.0x to 3.9x | 34 (8.2%) | 24 (10.7%) |
| 4.0x or more | 218 (52.7%) | 85 (38.0%) |
| Total | 414 (100.0%) | 224 (100.0%) |
Real Estate Taxes by Mortgage Status in Eureka Mill
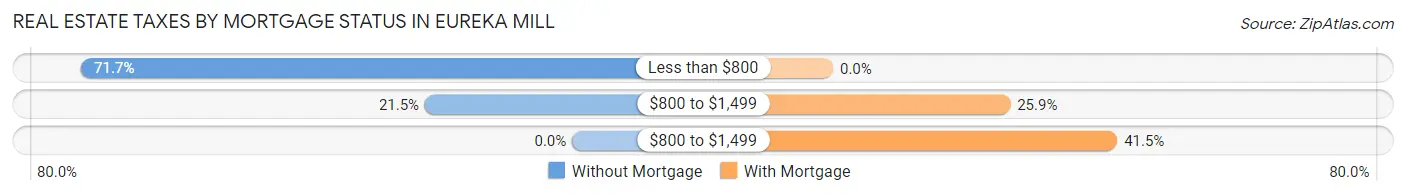
| Property Taxes | Without Mortgage | With Mortgage |
| Less than $800 | 297 (71.7%) | 0 (0.0%) |
| $800 to $1,499 | 89 (21.5%) | 58 (25.9%) |
| $800 to $1,499 | 0 (0.0%) | 93 (41.5%) |
| Total | 414 (100.0%) | 224 (100.0%) |
Health & Disability in Eureka Mill
Health Insurance Coverage by Age in Eureka Mill
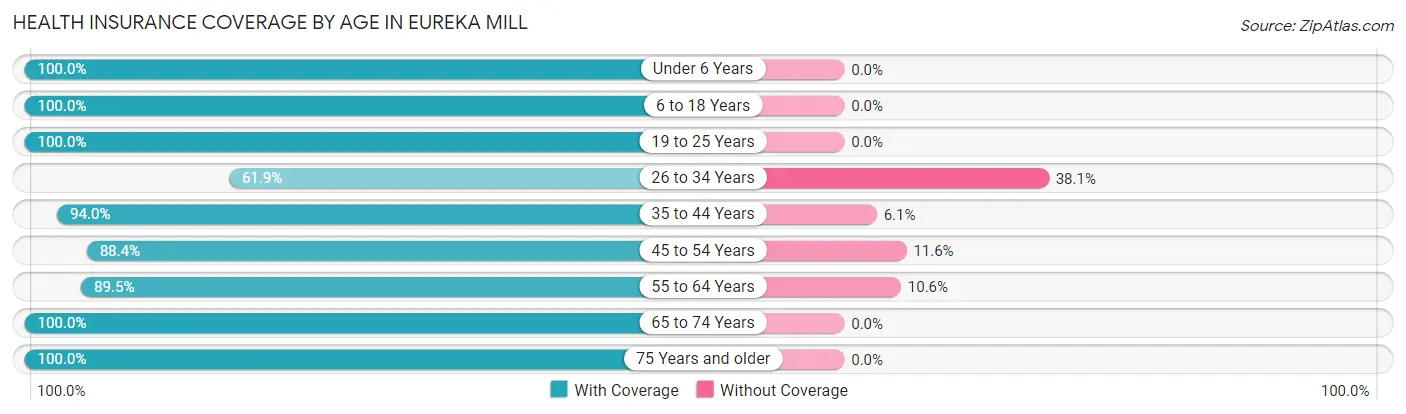
| Age Bracket | With Coverage | Without Coverage |
| Under 6 Years | 37 (100.0%) | 0 (0.0%) |
| 6 to 18 Years | 378 (100.0%) | 0 (0.0%) |
| 19 to 25 Years | 95 (100.0%) | 0 (0.0%) |
| 26 to 34 Years | 112 (61.9%) | 69 (38.1%) |
| 35 to 44 Years | 326 (94.0%) | 21 (6.0%) |
| 45 to 54 Years | 183 (88.4%) | 24 (11.6%) |
| 55 to 64 Years | 246 (89.4%) | 29 (10.5%) |
| 65 to 74 Years | 260 (100.0%) | 0 (0.0%) |
| 75 Years and older | 109 (100.0%) | 0 (0.0%) |
| Total | 1,746 (92.4%) | 143 (7.6%) |
Health Insurance Coverage by Citizenship Status in Eureka Mill
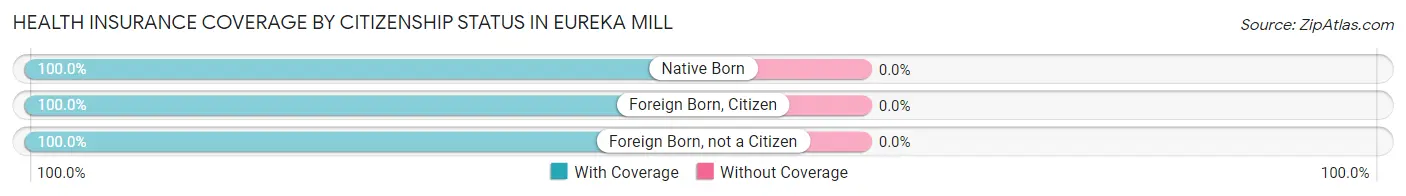
| Citizenship Status | With Coverage | Without Coverage |
| Native Born | 37 (100.0%) | 0 (0.0%) |
| Foreign Born, Citizen | 378 (100.0%) | 0 (0.0%) |
| Foreign Born, not a Citizen | 95 (100.0%) | 0 (0.0%) |
Health Insurance Coverage by Household Income in Eureka Mill
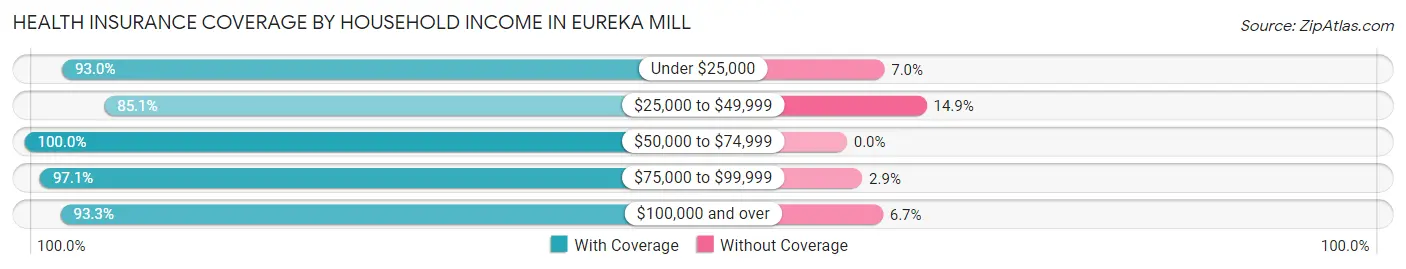
| Household Income | With Coverage | Without Coverage |
| Under $25,000 | 371 (93.0%) | 28 (7.0%) |
| $25,000 to $49,999 | 467 (85.1%) | 82 (14.9%) |
| $50,000 to $74,999 | 364 (100.0%) | 0 (0.0%) |
| $75,000 to $99,999 | 135 (97.1%) | 4 (2.9%) |
| $100,000 and over | 401 (93.3%) | 29 (6.7%) |
Public vs Private Health Insurance Coverage by Age in Eureka Mill
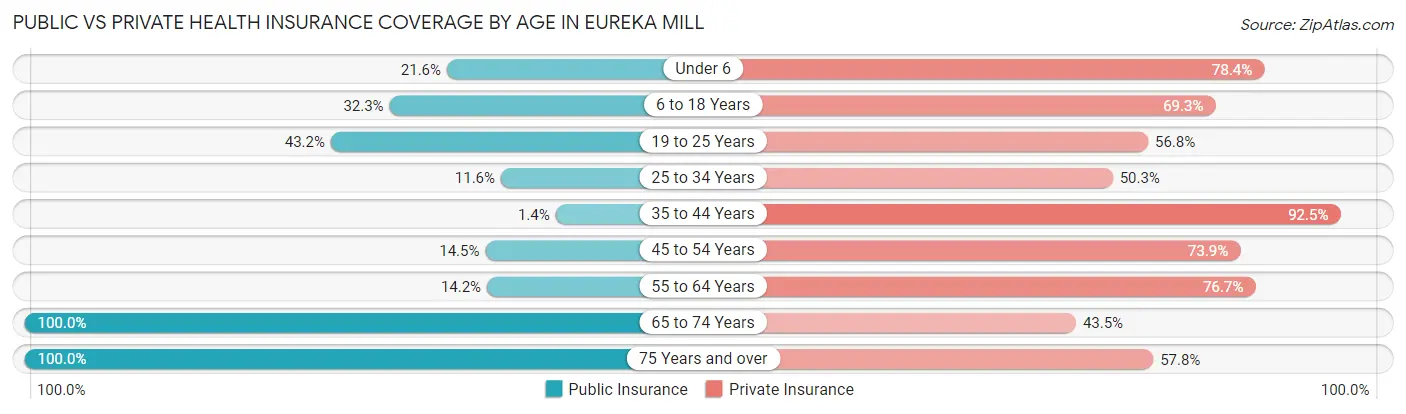
| Age Bracket | Public Insurance | Private Insurance |
| Under 6 | 8 (21.6%) | 29 (78.4%) |
| 6 to 18 Years | 122 (32.3%) | 262 (69.3%) |
| 19 to 25 Years | 41 (43.2%) | 54 (56.8%) |
| 25 to 34 Years | 21 (11.6%) | 91 (50.3%) |
| 35 to 44 Years | 5 (1.4%) | 321 (92.5%) |
| 45 to 54 Years | 30 (14.5%) | 153 (73.9%) |
| 55 to 64 Years | 39 (14.2%) | 211 (76.7%) |
| 65 to 74 Years | 260 (100.0%) | 113 (43.5%) |
| 75 Years and over | 109 (100.0%) | 63 (57.8%) |
| Total | 635 (33.6%) | 1,297 (68.7%) |
Disability Status by Sex by Age in Eureka Mill
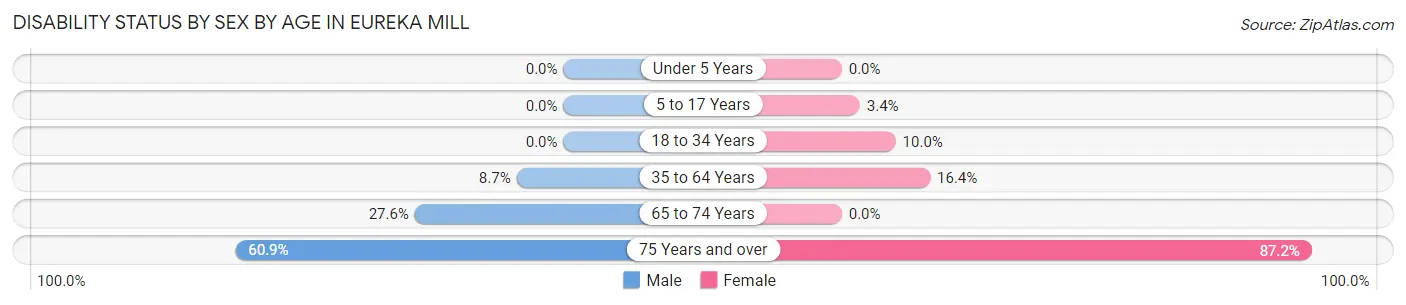
| Age Bracket | Male | Female |
| Under 5 Years | 0 (0.0%) | 0 (0.0%) |
| 5 to 17 Years | 0 (0.0%) | 9 (3.4%) |
| 18 to 34 Years | 0 (0.0%) | 12 (10.0%) |
| 35 to 64 Years | 36 (8.7%) | 68 (16.4%) |
| 65 to 74 Years | 40 (27.6%) | 0 (0.0%) |
| 75 Years and over | 14 (60.9%) | 75 (87.2%) |
Disability Class by Sex by Age in Eureka Mill
Disability Class: Hearing Difficulty
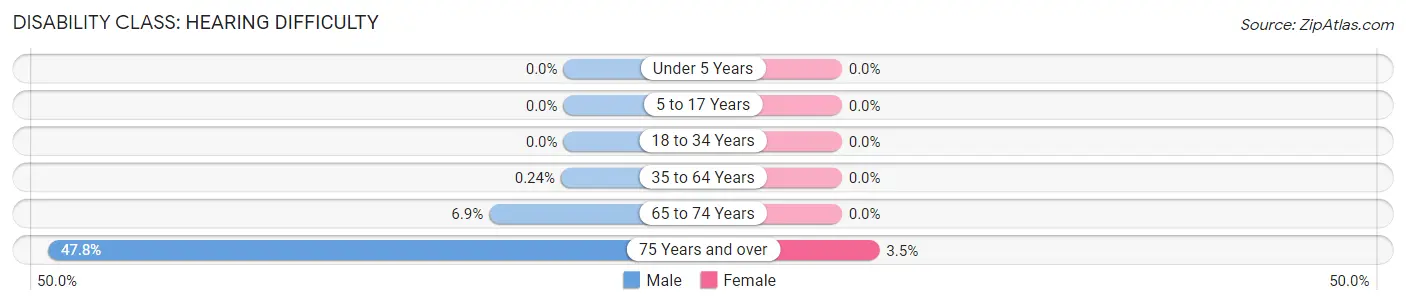
| Age Bracket | Male | Female |
| Under 5 Years | 0 (0.0%) | 0 (0.0%) |
| 5 to 17 Years | 0 (0.0%) | 0 (0.0%) |
| 18 to 34 Years | 0 (0.0%) | 0 (0.0%) |
| 35 to 64 Years | 1 (0.2%) | 0 (0.0%) |
| 65 to 74 Years | 10 (6.9%) | 0 (0.0%) |
| 75 Years and over | 11 (47.8%) | 3 (3.5%) |
Disability Class: Vision Difficulty
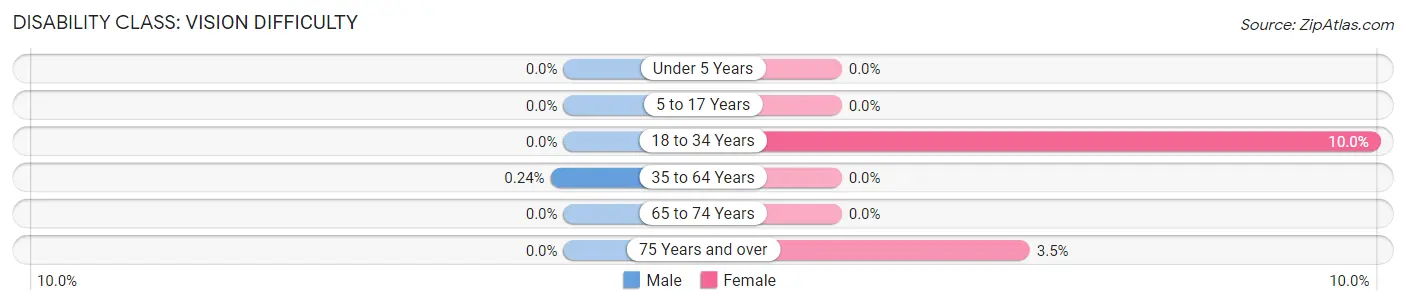
| Age Bracket | Male | Female |
| Under 5 Years | 0 (0.0%) | 0 (0.0%) |
| 5 to 17 Years | 0 (0.0%) | 0 (0.0%) |
| 18 to 34 Years | 0 (0.0%) | 12 (10.0%) |
| 35 to 64 Years | 1 (0.2%) | 0 (0.0%) |
| 65 to 74 Years | 0 (0.0%) | 0 (0.0%) |
| 75 Years and over | 0 (0.0%) | 3 (3.5%) |
Disability Class: Cognitive Difficulty
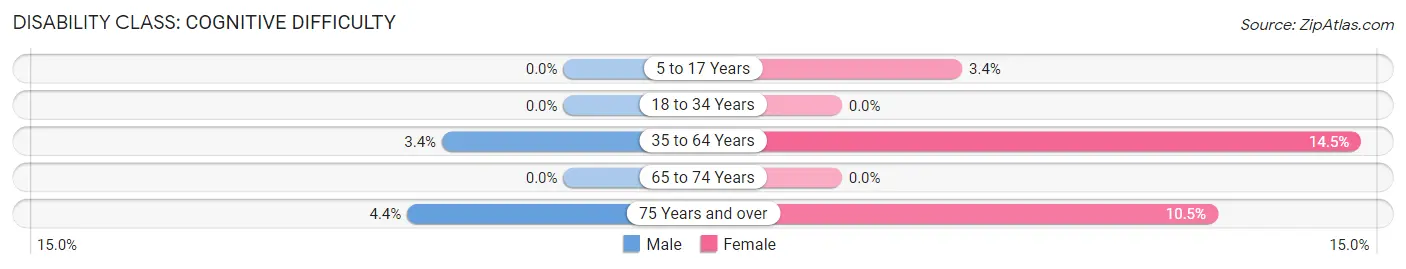
| Age Bracket | Male | Female |
| 5 to 17 Years | 0 (0.0%) | 9 (3.4%) |
| 18 to 34 Years | 0 (0.0%) | 0 (0.0%) |
| 35 to 64 Years | 14 (3.4%) | 60 (14.5%) |
| 65 to 74 Years | 0 (0.0%) | 0 (0.0%) |
| 75 Years and over | 1 (4.3%) | 9 (10.5%) |
Disability Class: Ambulatory Difficulty
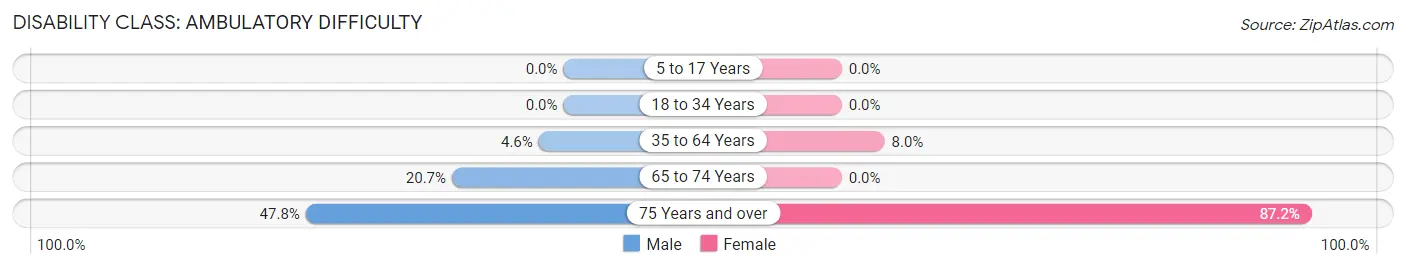
| Age Bracket | Male | Female |
| 5 to 17 Years | 0 (0.0%) | 0 (0.0%) |
| 18 to 34 Years | 0 (0.0%) | 0 (0.0%) |
| 35 to 64 Years | 19 (4.6%) | 33 (8.0%) |
| 65 to 74 Years | 30 (20.7%) | 0 (0.0%) |
| 75 Years and over | 11 (47.8%) | 75 (87.2%) |
Disability Class: Self-Care Difficulty
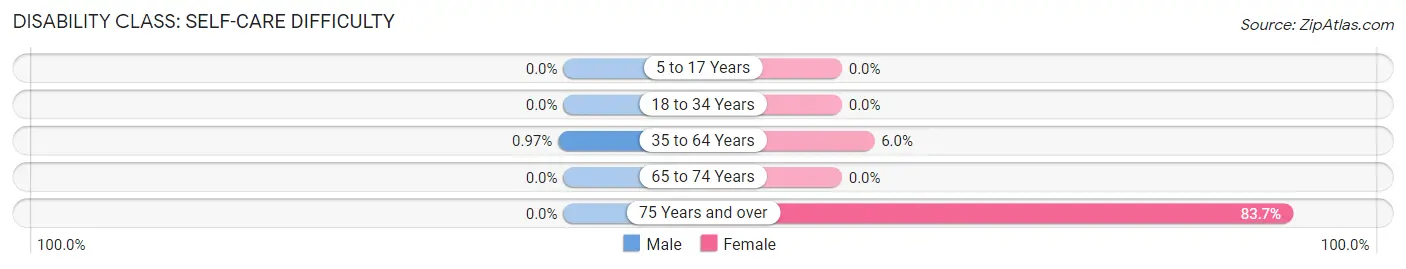
| Age Bracket | Male | Female |
| 5 to 17 Years | 0 (0.0%) | 0 (0.0%) |
| 18 to 34 Years | 0 (0.0%) | 0 (0.0%) |
| 35 to 64 Years | 4 (1.0%) | 25 (6.0%) |
| 65 to 74 Years | 0 (0.0%) | 0 (0.0%) |
| 75 Years and over | 0 (0.0%) | 72 (83.7%) |
Technology Access in Eureka Mill
Computing Device Access in Eureka Mill
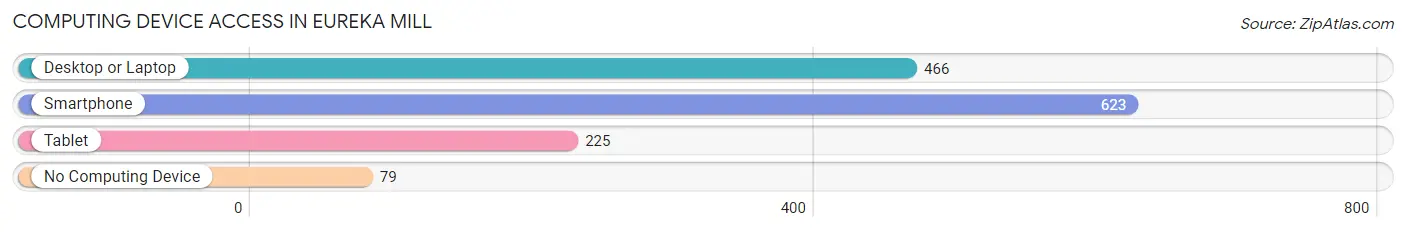
| Device Type | # Households | % Households |
| Desktop or Laptop | 466 | 65.6% |
| Smartphone | 623 | 87.7% |
| Tablet | 225 | 31.7% |
| No Computing Device | 79 | 11.1% |
| Total | 710 | 100.0% |
Internet Access in Eureka Mill
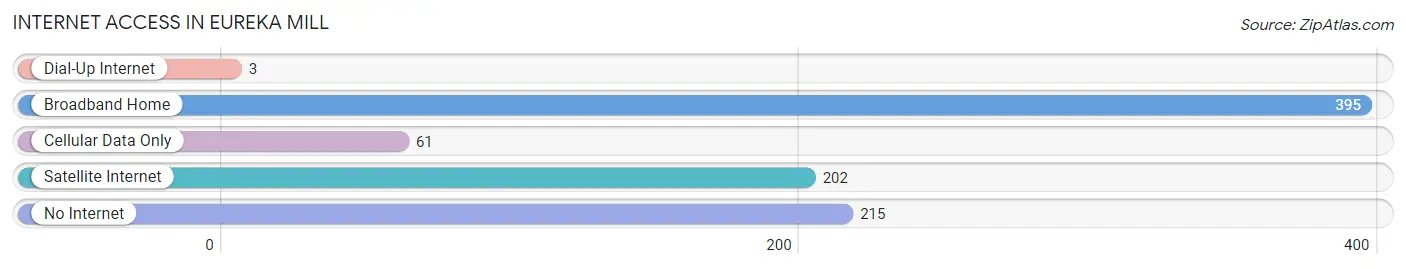
| Internet Type | # Households | % Households |
| Dial-Up Internet | 3 | 0.4% |
| Broadband Home | 395 | 55.6% |
| Cellular Data Only | 61 | 8.6% |
| Satellite Internet | 202 | 28.4% |
| No Internet | 215 | 30.3% |
| Total | 710 | 100.0% |
Eureka Mill Summary
Eureka Mill is a small unincorporated community located in the northern part of South Carolina, in the United States. It is situated in the northern part of Lancaster County, approximately 8 miles north of the city of Lancaster. The community is located along the Catawba River, and is home to a number of historic sites, including the Eureka Mill Historic District, which is listed on the National Register of Historic Places.
History
The area around Eureka Mill was first settled in the late 1700s by German and Scots-Irish immigrants. The community was originally known as “Catawba Ford”, and was located at the site of a ford across the Catawba River. In 1845, the Catawba Manufacturing Company was established at the site, and the community was renamed “Eureka Mill”. The mill was powered by the Catawba River, and was used to produce cotton yarn and cloth. The mill was destroyed by fire in 1871, but was rebuilt and continued to operate until the early 1900s.
In the late 1800s, Eureka Mill became a popular tourist destination, due to its proximity to the Catawba River and its scenic views. The community was also home to a number of churches, including the Eureka Mill Presbyterian Church, which was established in 1871.
Geography
Eureka Mill is located in the northern part of Lancaster County, approximately 8 miles north of the city of Lancaster. The community is situated along the Catawba River, and is bordered by the towns of Catawba and Heath Springs to the north, and the town of Kershaw to the south. The community is located in the Piedmont region of South Carolina, and is characterized by rolling hills and wooded areas.
Economy
The economy of Eureka Mill is largely based on agriculture and tourism. The area is home to a number of farms, which produce a variety of crops, including corn, soybeans, and cotton. The community is also home to a number of tourist attractions, including the Eureka Mill Historic District, which is listed on the National Register of Historic Places.
Demographics
As of the 2010 census, the population of Eureka Mill was 1,092. The racial makeup of the community was 94.3% White, 3.2% African American, 0.7% Native American, 0.2% Asian, and 1.6% from other races. The median household income in the community was $37,917, and the median home value was $117,500.
Eureka Mill is served by the Lancaster County School District, which includes two elementary schools, one middle school, and one high school. The community is also home to a number of churches, including the Eureka Mill Presbyterian Church, which was established in 1871.
Conclusion
Eureka Mill is a small unincorporated community located in the northern part of South Carolina. The community is situated along the Catawba River, and is home to a number of historic sites, including the Eureka Mill Historic District, which is listed on the National Register of Historic Places. The economy of Eureka Mill is largely based on agriculture and tourism, and the community is served by the Lancaster County School District. As of the 2010 census, the population of Eureka Mill was 1,092.
Common Questions
What is Per Capita Income in Eureka Mill?
Per Capita income in Eureka Mill is $22,135.
What is the Median Family Income in Eureka Mill?
Median Family Income in Eureka Mill is $53,229.
What is the Median Household income in Eureka Mill?
Median Household Income in Eureka Mill is $33,802.
What is Income or Wage Gap in Eureka Mill?
Income or Wage Gap in Eureka Mill is 57.8%.
Women in Eureka Mill earn 42.2 cents for every dollar earned by a man.
What is Inequality or Gini Index in Eureka Mill?
Inequality or Gini Index in Eureka Mill is 0.49.
What is the Total Population of Eureka Mill?
Total Population of Eureka Mill is 1,889.
What is the Total Male Population of Eureka Mill?
Total Male Population of Eureka Mill is 858.
What is the Total Female Population of Eureka Mill?
Total Female Population of Eureka Mill is 1,031.
What is the Ratio of Males per 100 Females in Eureka Mill?
There are 83.22 Males per 100 Females in Eureka Mill.
What is the Ratio of Females per 100 Males in Eureka Mill?
There are 120.16 Females per 100 Males in Eureka Mill.
What is the Median Population Age in Eureka Mill?
Median Population Age in Eureka Mill is 42.6 Years.
What is the Average Family Size in Eureka Mill
Average Family Size in Eureka Mill is 3.2 People.
What is the Average Household Size in Eureka Mill
Average Household Size in Eureka Mill is 2.6 People.
How Large is the Labor Force in Eureka Mill?
There are 929 People in the Labor Forcein in Eureka Mill.
What is the Percentage of People in the Labor Force in Eureka Mill?
60.3% of People are in the Labor Force in Eureka Mill.
What is the Unemployment Rate in Eureka Mill?
Unemployment Rate in Eureka Mill is 9.6%.