Oswego, SC Map & Demographics
Oswego Map
Oswego Overview
$16,098
PER CAPITA INCOME
$52,708
AVG FAMILY INCOME
$52,708
AVG HOUSEHOLD INCOME
0.36
INEQUALITY / GINI INDEX
352
TOTAL POPULATION
142
MALE POPULATION
210
FEMALE POPULATION
67.62
MALES / 100 FEMALES
147.89
FEMALES / 100 MALES
47.2
MEDIAN AGE
3.9
AVG FAMILY SIZE
3.9
AVG HOUSEHOLD SIZE
101
LABOR FORCE [ PEOPLE ]
50.0%
PERCENT IN LABOR FORCE
Oswego Area Codes
Income in Oswego
Income Overview in Oswego
Per Capita Income in Oswego is $16,098, while median incomes of families and households are $52,708 and $52,708 respectively.
| Characteristic | Number | Measure |
| Per Capita Income | 352 | $16,098 |
| Median Family Income | 90 | $52,708 |
| Mean Family Income | 90 | $60,380 |
| Median Household Income | 90 | $52,708 |
| Mean Household Income | 90 | $60,380 |
| Income Deficit | 90 | $0 |
| Wage / Income Gap (%) | 352 | 0.00% |
| Wage / Income Gap ($) | 352 | 100.00¢ per $1 |
| Gini / Inequality Index | 352 | 0.36 |
Earnings by Sex in Oswego
| Sex | Number | Average Earnings |
| Male | 53 (52.5%) | $0 |
| Female | 48 (47.5%) | $0 |
| Total | 101 (100.0%) | $0 |
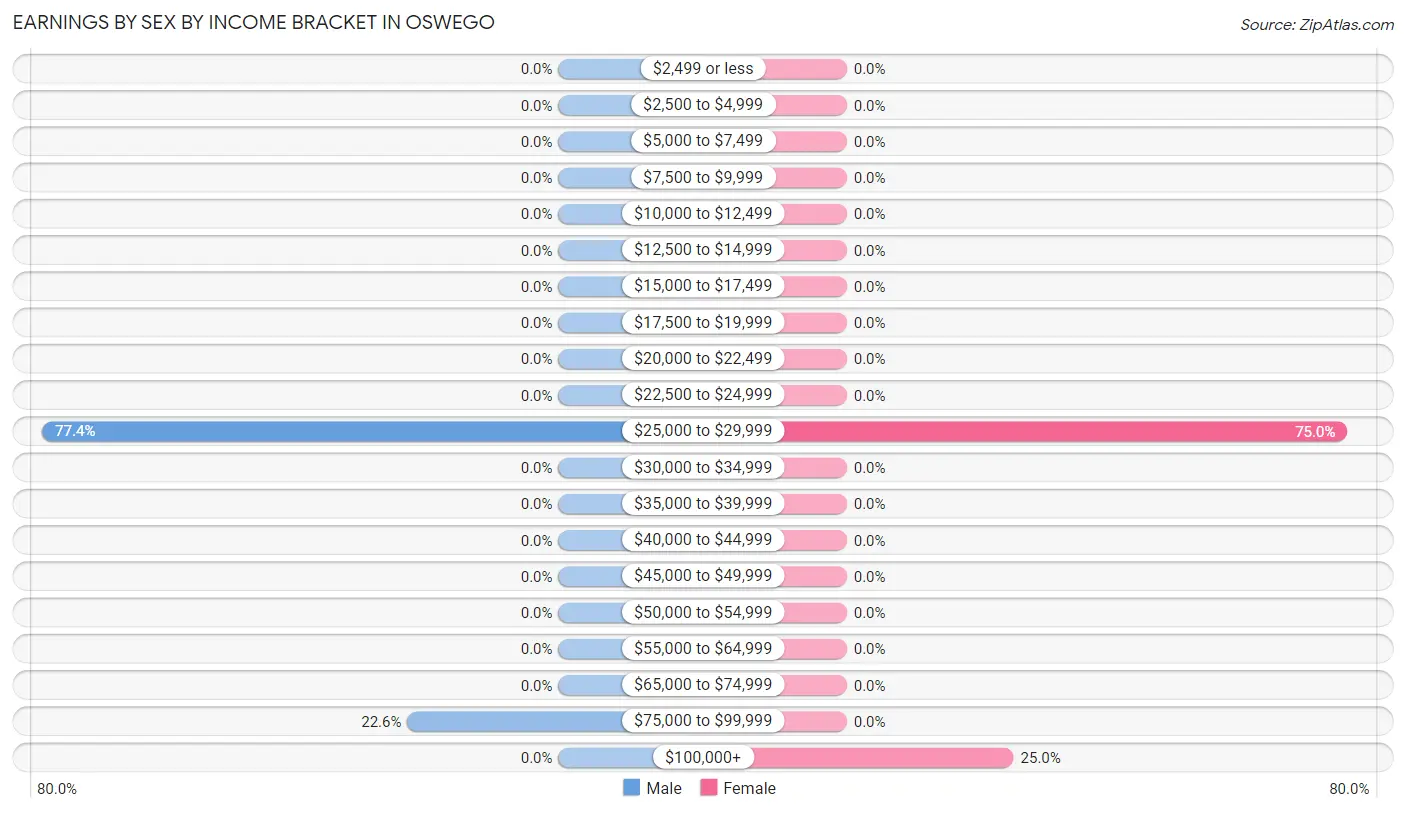
Earnings by Sex by Income Bracket in Oswego
The most common earnings brackets in Oswego are $25,000 to $29,999 for men (41 | 77.4%) and $25,000 to $29,999 for women (36 | 75.0%).
| Income | Male | Female |
| $2,499 or less | 0 (0.0%) | 0 (0.0%) |
| $2,500 to $4,999 | 0 (0.0%) | 0 (0.0%) |
| $5,000 to $7,499 | 0 (0.0%) | 0 (0.0%) |
| $7,500 to $9,999 | 0 (0.0%) | 0 (0.0%) |
| $10,000 to $12,499 | 0 (0.0%) | 0 (0.0%) |
| $12,500 to $14,999 | 0 (0.0%) | 0 (0.0%) |
| $15,000 to $17,499 | 0 (0.0%) | 0 (0.0%) |
| $17,500 to $19,999 | 0 (0.0%) | 0 (0.0%) |
| $20,000 to $22,499 | 0 (0.0%) | 0 (0.0%) |
| $22,500 to $24,999 | 0 (0.0%) | 0 (0.0%) |
| $25,000 to $29,999 | 41 (77.4%) | 36 (75.0%) |
| $30,000 to $34,999 | 0 (0.0%) | 0 (0.0%) |
| $35,000 to $39,999 | 0 (0.0%) | 0 (0.0%) |
| $40,000 to $44,999 | 0 (0.0%) | 0 (0.0%) |
| $45,000 to $49,999 | 0 (0.0%) | 0 (0.0%) |
| $50,000 to $54,999 | 0 (0.0%) | 0 (0.0%) |
| $55,000 to $64,999 | 0 (0.0%) | 0 (0.0%) |
| $65,000 to $74,999 | 0 (0.0%) | 0 (0.0%) |
| $75,000 to $99,999 | 12 (22.6%) | 0 (0.0%) |
| $100,000+ | 0 (0.0%) | 12 (25.0%) |
| Total | 53 (100.0%) | 48 (100.0%) |
Earnings by Sex by Educational Attainment in Oswego
| Educational Attainment | Male Income | Female Income |
| Less than High School | - | - |
| High School Diploma | - | - |
| College or Associate's Degree | - | - |
| Bachelor's Degree | - | - |
| Graduate Degree | - | - |
| Total | - | - |
Family Income in Oswego
Family Income Brackets in Oswego
According to the Oswego family income data, there are 42 families falling into the $25,000 to $34,999 income range, which is the most common income bracket and makes up 46.7% of all families.
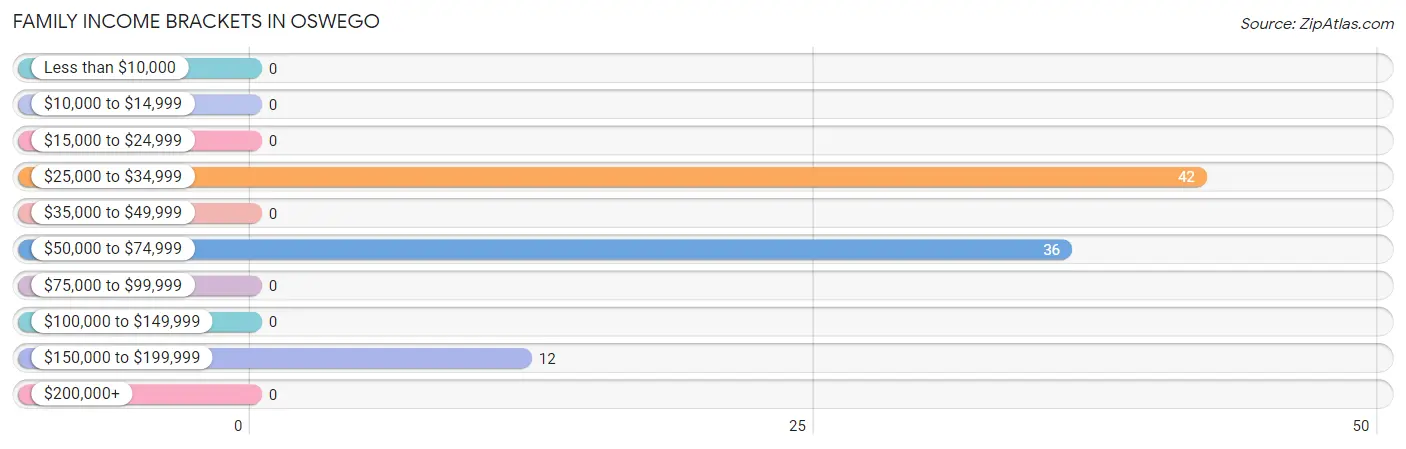
| Income Bracket | # Families | % Families |
| Less than $10,000 | 0 | 0.0% |
| $10,000 to $14,999 | 0 | 0.0% |
| $15,000 to $24,999 | 0 | 0.0% |
| $25,000 to $34,999 | 42 | 46.7% |
| $35,000 to $49,999 | 0 | 0.0% |
| $50,000 to $74,999 | 36 | 40.0% |
| $75,000 to $99,999 | 0 | 0.0% |
| $100,000 to $149,999 | 0 | 0.0% |
| $150,000 to $199,999 | 12 | 13.3% |
| $200,000+ | 0 | 0.0% |
Family Income by Famaliy Size in Oswego
| Income Bracket | # Families | Median Income |
| 2-Person Families | 36 (40.0%) | $0 |
| 3-Person Families | 0 (0.0%) | $0 |
| 4-Person Families | 12 (13.3%) | $0 |
| 5-Person Families | 42 (46.7%) | $0 |
| 6-Person Families | 0 (0.0%) | $0 |
| 7+ Person Families | 0 (0.0%) | $0 |
| Total | 90 (100.0%) | $52,708 |
Family Income by Number of Earners in Oswego
| Number of Earners | # Families | Median Income |
| No Earners | 42 (46.7%) | $0 |
| 1 Earner | 0 (0.0%) | $0 |
| 2 Earners | 48 (53.3%) | $0 |
| 3+ Earners | 0 (0.0%) | $0 |
| Total | 90 (100.0%) | $52,708 |
Household Income in Oswego
Household Income Brackets in Oswego
With 42 households falling in the category, the $25,000 to $34,999 income range is the most frequent in Oswego, accounting for 46.7% of all households.
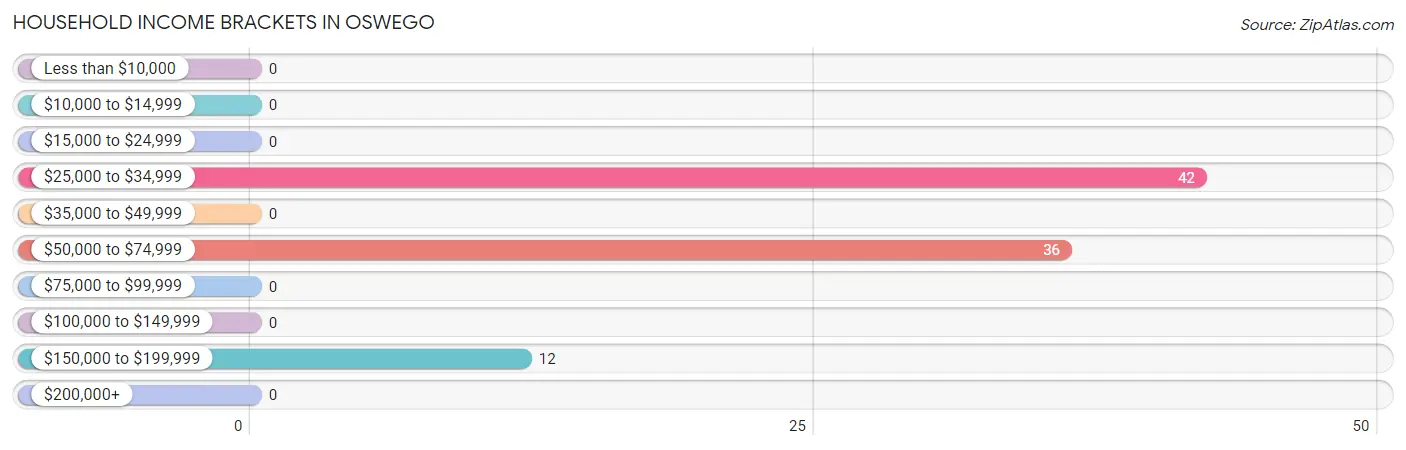
| Income Bracket | # Households | % Households |
| Less than $10,000 | 0 | 0.0% |
| $10,000 to $14,999 | 0 | 0.0% |
| $15,000 to $24,999 | 0 | 0.0% |
| $25,000 to $34,999 | 42 | 46.7% |
| $35,000 to $49,999 | 0 | 0.0% |
| $50,000 to $74,999 | 36 | 40.0% |
| $75,000 to $99,999 | 0 | 0.0% |
| $100,000 to $149,999 | 0 | 0.0% |
| $150,000 to $199,999 | 12 | 13.3% |
| $200,000+ | 0 | 0.0% |
Household Income by Householder Age in Oswego
The median household income in Oswego is $52,708, with the highest median household income of $52,708 found in the 45 to 64 years age bracket for the primary householder. A total of 90 households (100.0%) fall into this category.
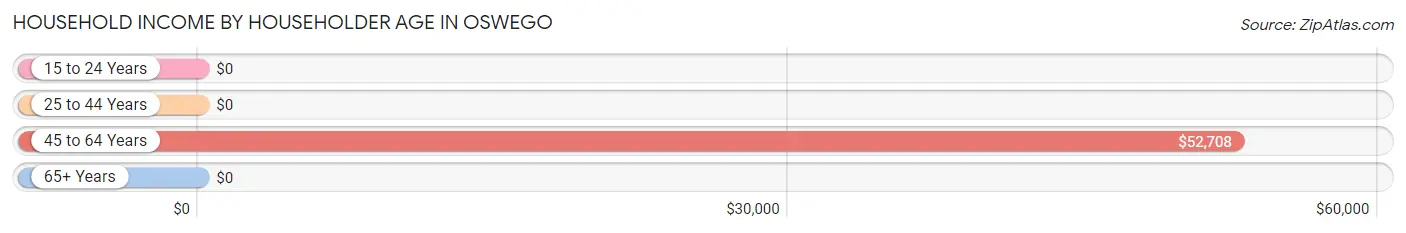
| Income Bracket | # Households | Median Income |
| 15 to 24 Years | 0 (0.0%) | $0 |
| 25 to 44 Years | 0 (0.0%) | $0 |
| 45 to 64 Years | 90 (100.0%) | $52,708 |
| 65+ Years | 0 (0.0%) | $0 |
| Total | 90 (100.0%) | $52,708 |
Poverty in Oswego
Income Below Poverty by Sex and Age in Oswego
With 62.7% poverty level for males and 65.7% for females among the residents of Oswego, 15 year old males and 12 to 14 year old females are the most vulnerable to poverty, with 42 males (100.0%) and 96 females (100.0%) in their respective age groups living below the poverty level.
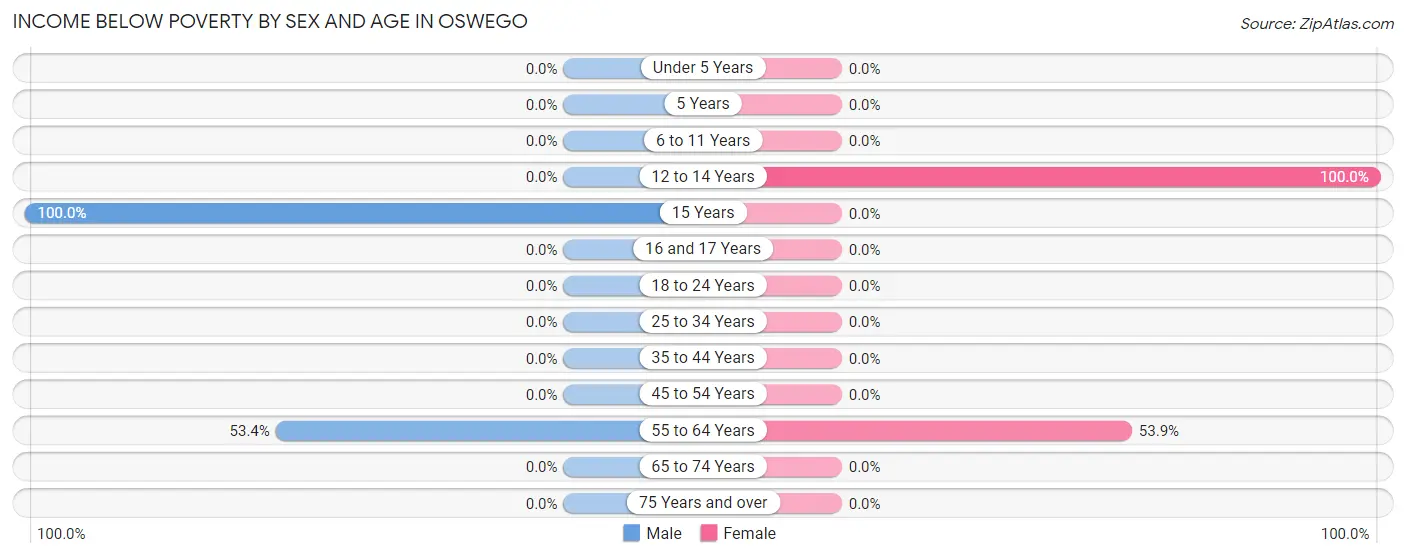
| Age Bracket | Male | Female |
| Under 5 Years | 0 (0.0%) | 0 (0.0%) |
| 5 Years | 0 (0.0%) | 0 (0.0%) |
| 6 to 11 Years | 0 (0.0%) | 0 (0.0%) |
| 12 to 14 Years | 0 (0.0%) | 96 (100.0%) |
| 15 Years | 42 (100.0%) | 0 (0.0%) |
| 16 and 17 Years | 0 (0.0%) | 0 (0.0%) |
| 18 to 24 Years | 0 (0.0%) | 0 (0.0%) |
| 25 to 34 Years | 0 (0.0%) | 0 (0.0%) |
| 35 to 44 Years | 0 (0.0%) | 0 (0.0%) |
| 45 to 54 Years | 0 (0.0%) | 0 (0.0%) |
| 55 to 64 Years | 47 (53.4%) | 42 (53.8%) |
| 65 to 74 Years | 0 (0.0%) | 0 (0.0%) |
| 75 Years and over | 0 (0.0%) | 0 (0.0%) |
| Total | 89 (62.7%) | 138 (65.7%) |
Income Above Poverty by Sex and Age in Oswego
According to the poverty statistics in Oswego, males aged 45 to 54 years and females aged 6 to 11 years are the age groups that are most secure financially, with 100.0% of males and 100.0% of females in these age groups living above the poverty line.
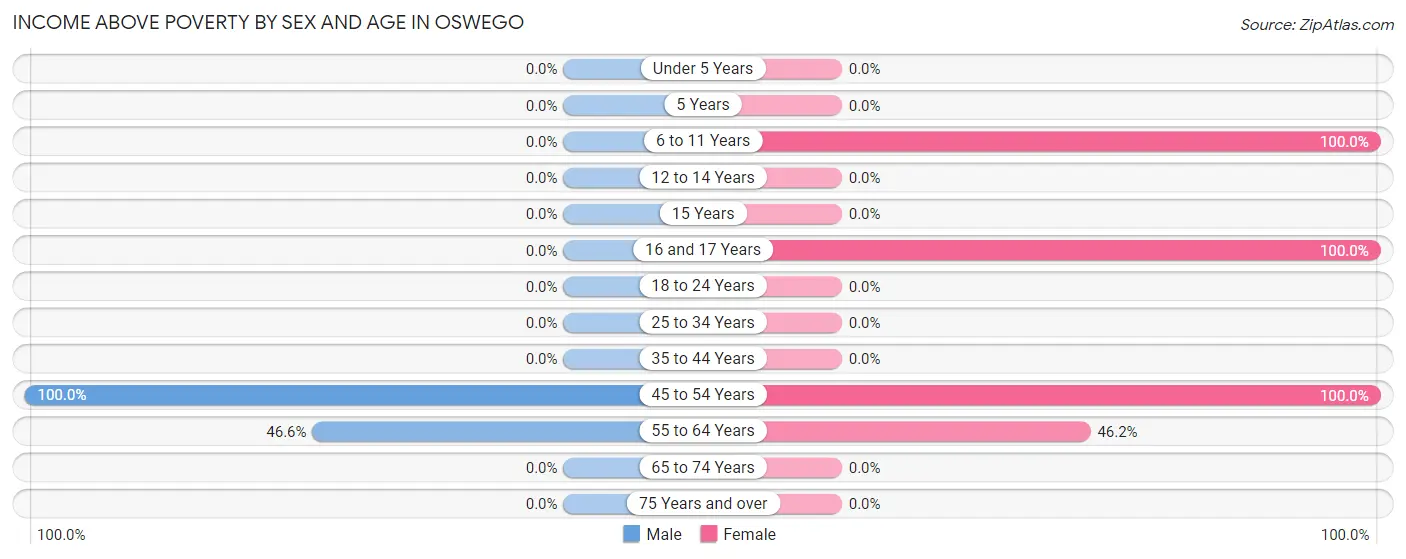
| Age Bracket | Male | Female |
| Under 5 Years | 0 (0.0%) | 0 (0.0%) |
| 5 Years | 0 (0.0%) | 0 (0.0%) |
| 6 to 11 Years | 0 (0.0%) | 12 (100.0%) |
| 12 to 14 Years | 0 (0.0%) | 0 (0.0%) |
| 15 Years | 0 (0.0%) | 0 (0.0%) |
| 16 and 17 Years | 0 (0.0%) | 12 (100.0%) |
| 18 to 24 Years | 0 (0.0%) | 0 (0.0%) |
| 25 to 34 Years | 0 (0.0%) | 0 (0.0%) |
| 35 to 44 Years | 0 (0.0%) | 0 (0.0%) |
| 45 to 54 Years | 12 (100.0%) | 12 (100.0%) |
| 55 to 64 Years | 41 (46.6%) | 36 (46.2%) |
| 65 to 74 Years | 0 (0.0%) | 0 (0.0%) |
| 75 Years and over | 0 (0.0%) | 0 (0.0%) |
| Total | 53 (37.3%) | 72 (34.3%) |
Income Below Poverty Among Married-Couple Families in Oswego
The poverty statistics for married-couple families in Oswego show that 46.7% or 42 of the total 90 families live below the poverty line. Families with 3 or 4 children have the highest poverty rate of 100.0%, comprising of 42 families. On the other hand, families with no children have the lowest poverty rate of 0.0%, which includes 0 families.
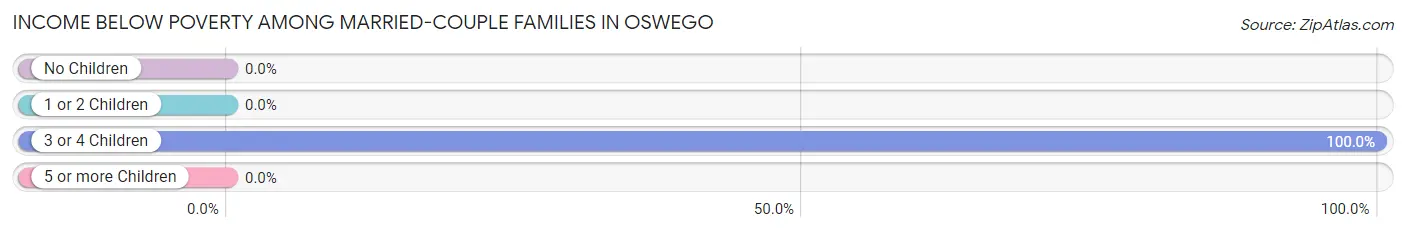
| Children | Above Poverty | Below Poverty |
| No Children | 36 (100.0%) | 0 (0.0%) |
| 1 or 2 Children | 12 (100.0%) | 0 (0.0%) |
| 3 or 4 Children | 0 (0.0%) | 42 (100.0%) |
| 5 or more Children | 0 (0.0%) | 0 (0.0%) |
| Total | 48 (53.3%) | 42 (46.7%) |
Income Below Poverty Among Single-Parent Households in Oswego
| Children | Single Father | Single Mother |
| No Children | 0 (0.0%) | 0 (0.0%) |
| 1 or 2 Children | 0 (0.0%) | 0 (0.0%) |
| 3 or 4 Children | 0 (0.0%) | 0 (0.0%) |
| 5 or more Children | 0 (0.0%) | 0 (0.0%) |
| Total | 0 (0.0%) | 0 (0.0%) |
Income Below Poverty Among Married-Couple vs Single-Parent Households in Oswego
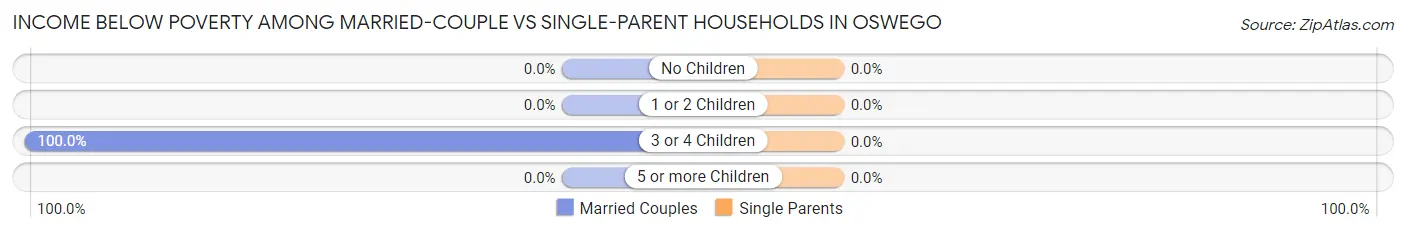
| Children | Married-Couple Families | Single-Parent Households |
| No Children | 0 (0.0%) | 0 (0.0%) |
| 1 or 2 Children | 0 (0.0%) | 0 (0.0%) |
| 3 or 4 Children | 42 (100.0%) | 0 (0.0%) |
| 5 or more Children | 0 (0.0%) | 0 (0.0%) |
| Total | 42 (46.7%) | 0 (0.0%) |
Race in Oswego
The most populous races in Oswego are , and White / Caucasian (352 | 100.0%).
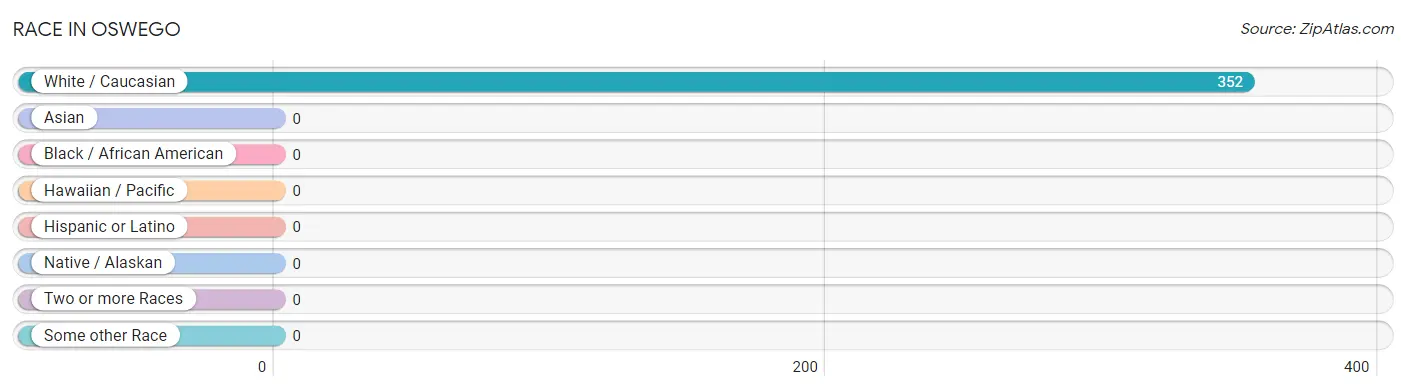
| Race | # Population | % Population |
| Asian | 0 | 0.0% |
| Black / African American | 0 | 0.0% |
| Hawaiian / Pacific | 0 | 0.0% |
| Hispanic or Latino | 0 | 0.0% |
| Native / Alaskan | 0 | 0.0% |
| White / Caucasian | 352 | 100.0% |
| Two or more Races | 0 | 0.0% |
| Some other Race | 0 | 0.0% |
| Total | 352 | 100.0% |
Ancestry in Oswego
The most populous ancestries reported in Oswego are English (48 | 13.6%), and Irish (36 | 10.2%), together accounting for 23.9% of all Oswego residents.
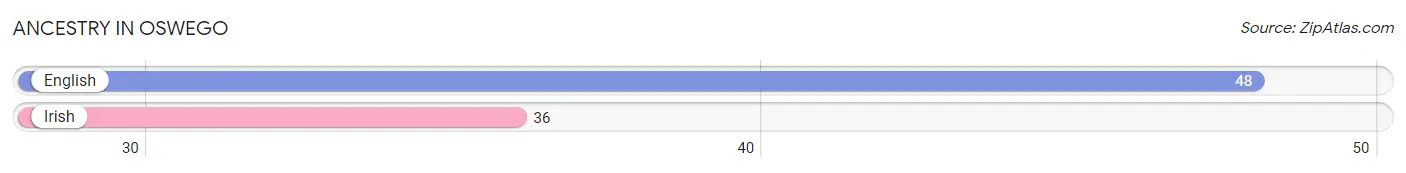
| Ancestry | # Population | % Population |
| English | 48 | 13.6% |
| Irish | 36 | 10.2% | View All 2 Rows |
Immigrants in Oswego

| Immigration Origin | # Population | % Population | View All 0 Rows |
Sex and Age in Oswego
Sex and Age in Oswego
The most populous age groups in Oswego are 60 to 64 Years (88 | 62.0%) for men and 10 to 14 Years (108 | 51.4%) for women.
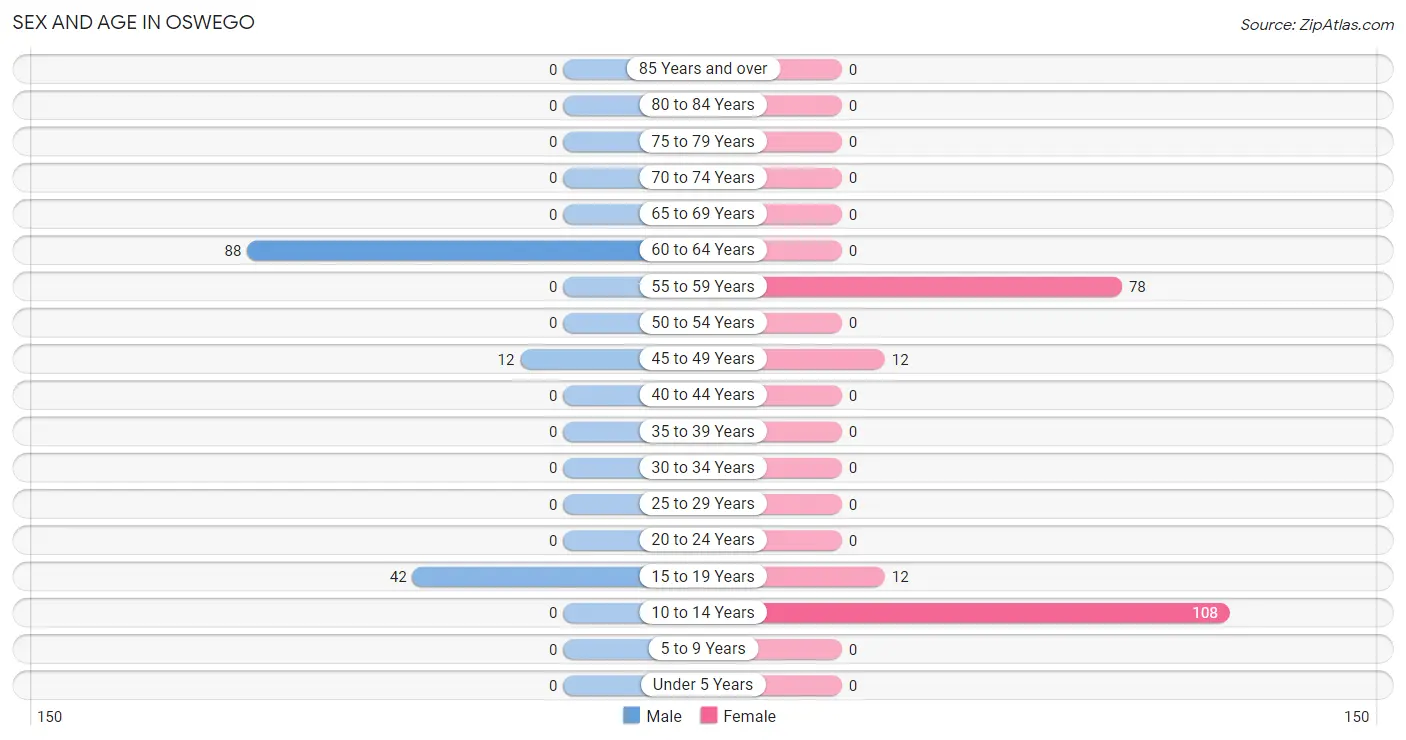
| Age Bracket | Male | Female |
| Under 5 Years | 0 (0.0%) | 0 (0.0%) |
| 5 to 9 Years | 0 (0.0%) | 0 (0.0%) |
| 10 to 14 Years | 0 (0.0%) | 108 (51.4%) |
| 15 to 19 Years | 42 (29.6%) | 12 (5.7%) |
| 20 to 24 Years | 0 (0.0%) | 0 (0.0%) |
| 25 to 29 Years | 0 (0.0%) | 0 (0.0%) |
| 30 to 34 Years | 0 (0.0%) | 0 (0.0%) |
| 35 to 39 Years | 0 (0.0%) | 0 (0.0%) |
| 40 to 44 Years | 0 (0.0%) | 0 (0.0%) |
| 45 to 49 Years | 12 (8.5%) | 12 (5.7%) |
| 50 to 54 Years | 0 (0.0%) | 0 (0.0%) |
| 55 to 59 Years | 0 (0.0%) | 78 (37.1%) |
| 60 to 64 Years | 88 (62.0%) | 0 (0.0%) |
| 65 to 69 Years | 0 (0.0%) | 0 (0.0%) |
| 70 to 74 Years | 0 (0.0%) | 0 (0.0%) |
| 75 to 79 Years | 0 (0.0%) | 0 (0.0%) |
| 80 to 84 Years | 0 (0.0%) | 0 (0.0%) |
| 85 Years and over | 0 (0.0%) | 0 (0.0%) |
| Total | 142 (100.0%) | 210 (100.0%) |
Families and Households in Oswego
Median Family Size in Oswego
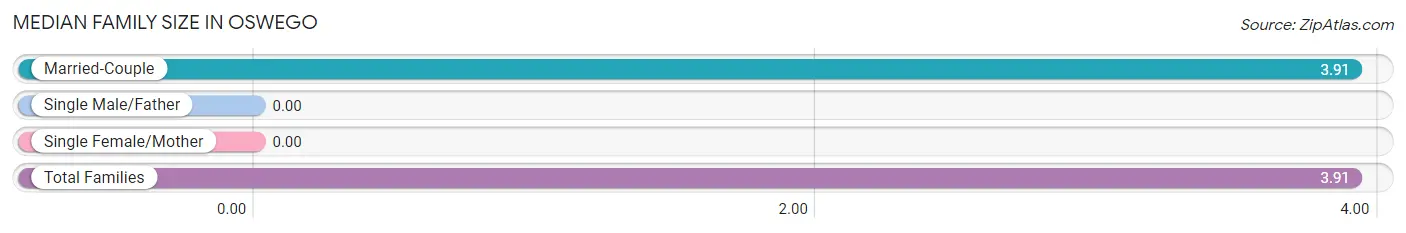
| Family Type | # Families | Family Size |
| Married-Couple | 90 (100.0%) | 3.91 |
| Single Male/Father | 0 (0.0%) | - |
| Single Female/Mother | 0 (0.0%) | - |
| Total Families | 90 (100.0%) | 3.91 |
Median Household Size in Oswego
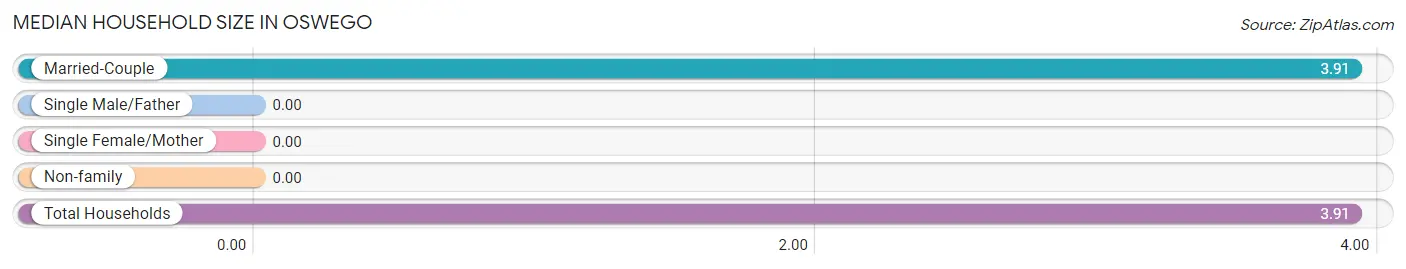
| Household Type | # Households | Household Size |
| Married-Couple | 90 (100.0%) | 3.91 |
| Single Male/Father | 0 (0.0%) | - |
| Single Female/Mother | 0 (0.0%) | - |
| Non-family | 0 (0.0%) | - |
| Total Households | 90 (100.0%) | 3.91 |
Household Size by Marriage Status in Oswego
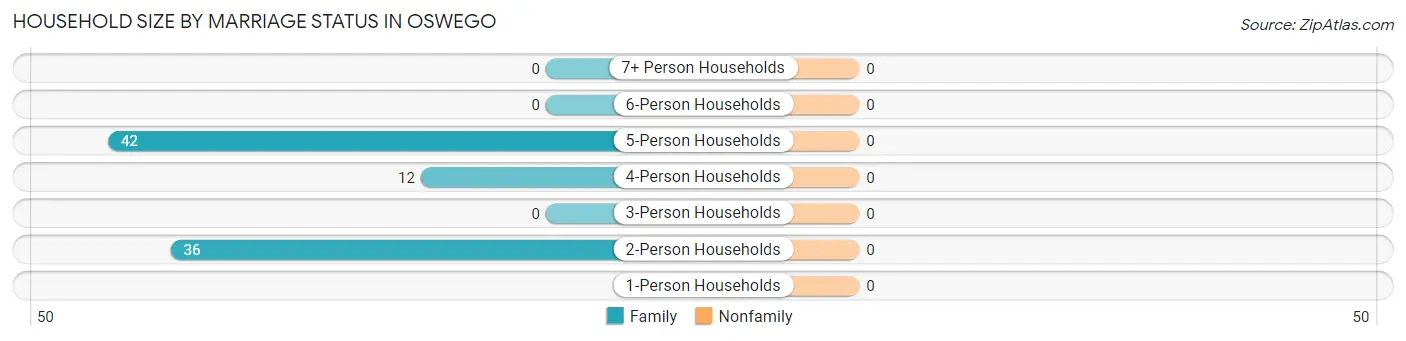
| Household Size | Family Households | Nonfamily Households |
| 1-Person Households | - | 0 (0.0%) |
| 2-Person Households | 36 (40.0%) | 0 (0.0%) |
| 3-Person Households | 0 (0.0%) | 0 (0.0%) |
| 4-Person Households | 12 (13.3%) | 0 (0.0%) |
| 5-Person Households | 42 (46.7%) | 0 (0.0%) |
| 6-Person Households | 0 (0.0%) | 0 (0.0%) |
| 7+ Person Households | 0 (0.0%) | 0 (0.0%) |
| Total | 90 (100.0%) | 0 (0.0%) |
Female Fertility in Oswego
Fertility by Age in Oswego
| Age Bracket | Women with Births | Births / 1,000 Women |
| 15 to 19 years | 0 (0.0%) | 0.0 |
| 20 to 34 years | 0 (0.0%) | 0.0 |
| 35 to 50 years | 0 (0.0%) | 0.0 |
| Total | 0 (0.0%) | 0.0 |
Fertility by Age by Marriage Status in Oswego
| Age Bracket | Married | Unmarried |
| 15 to 19 years | 0 (0.0%) | 0 (0.0%) |
| 20 to 34 years | 0 (0.0%) | 0 (0.0%) |
| 35 to 50 years | 0 (0.0%) | 0 (0.0%) |
| Total | 0 (0.0%) | 0 (0.0%) |
Fertility by Education in Oswego
| Educational Attainment | Women with Births | Births / 1,000 Women |
| Less than High School | 0 (0.0%) | 0.0 |
| High School Diploma | 0 (0.0%) | 0.0 |
| College or Associate's Degree | 0 (0.0%) | 0.0 |
| Bachelor's Degree | 0 (0.0%) | 0.0 |
| Graduate Degree | 0 (0.0%) | 0.0 |
| Total | 0 (0.0%) | 0.0 |
Fertility by Education by Marriage Status in Oswego
| Educational Attainment | Married | Unmarried |
| Less than High School | 0 (0.0%) | 0 (0.0%) |
| High School Diploma | 0 (0.0%) | 0 (0.0%) |
| College or Associate's Degree | 0 (0.0%) | 0 (0.0%) |
| Bachelor's Degree | 0 (0.0%) | 0 (0.0%) |
| Graduate Degree | 0 (0.0%) | 0 (0.0%) |
| Total | 0 (0.0%) | 0 (0.0%) |
Employment Characteristics in Oswego
Employment by Class of Employer in Oswego
Among the 65 employed individuals in Oswego, , and private company employees (65 | 100.0%) make up the most common classes of employment.
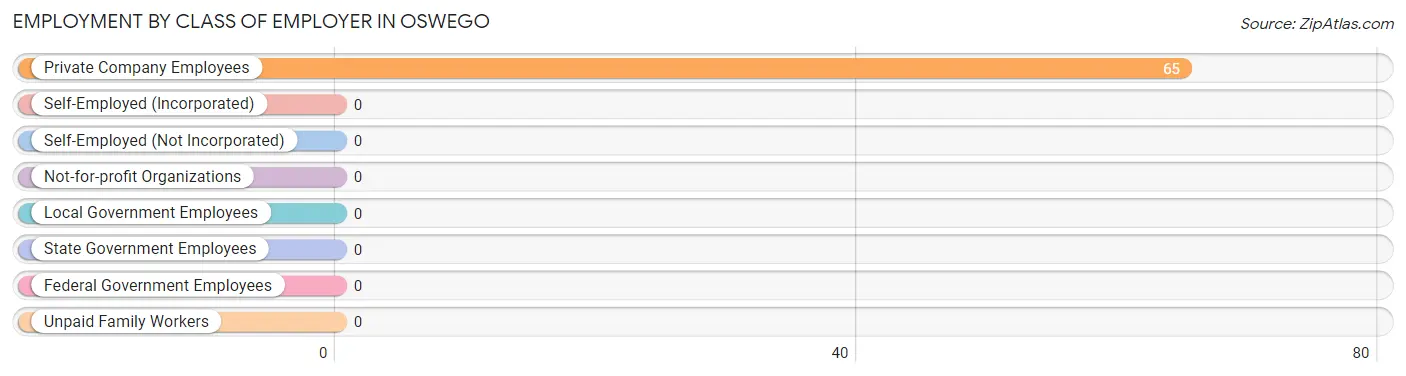
| Employer Class | # Employees | % Employees |
| Private Company Employees | 65 | 100.0% |
| Self-Employed (Incorporated) | 0 | 0.0% |
| Self-Employed (Not Incorporated) | 0 | 0.0% |
| Not-for-profit Organizations | 0 | 0.0% |
| Local Government Employees | 0 | 0.0% |
| State Government Employees | 0 | 0.0% |
| Federal Government Employees | 0 | 0.0% |
| Unpaid Family Workers | 0 | 0.0% |
| Total | 65 | 100.0% |
Employment Status by Age in Oswego
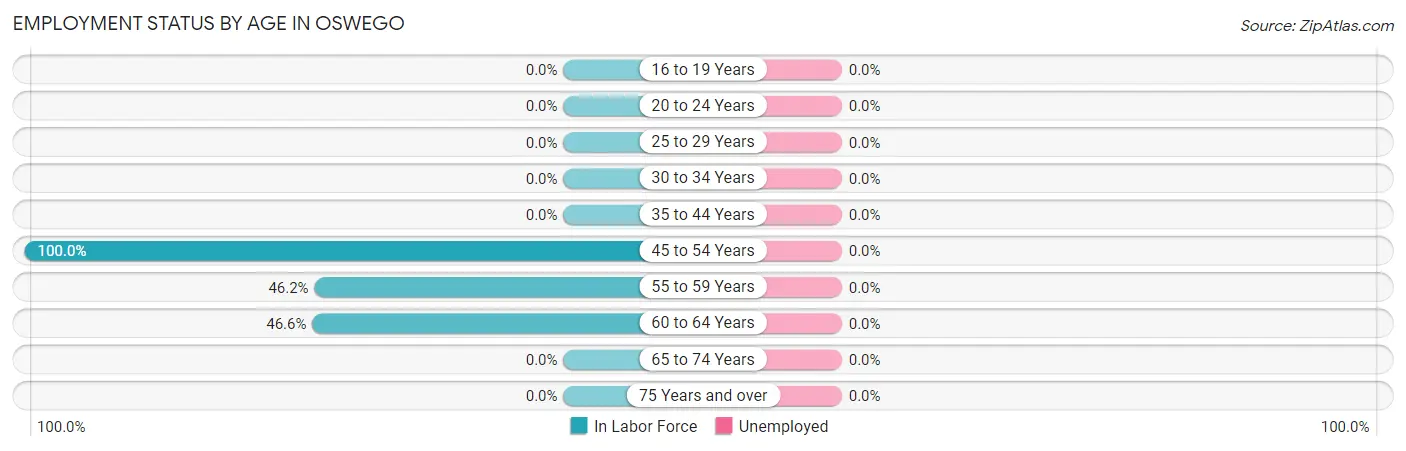
| Age Bracket | In Labor Force | Unemployed |
| 16 to 19 Years | 0 (0.0%) | 0 (0.0%) |
| 20 to 24 Years | 0 (0.0%) | 0 (0.0%) |
| 25 to 29 Years | 0 (0.0%) | 0 (0.0%) |
| 30 to 34 Years | 0 (0.0%) | 0 (0.0%) |
| 35 to 44 Years | 0 (0.0%) | 0 (0.0%) |
| 45 to 54 Years | 24 (100.0%) | 0 (0.0%) |
| 55 to 59 Years | 36 (46.2%) | 0 (0.0%) |
| 60 to 64 Years | 41 (46.6%) | 0 (0.0%) |
| 65 to 74 Years | 0 (0.0%) | 0 (0.0%) |
| 75 Years and over | 0 (0.0%) | 0 (0.0%) |
| Total | 101 (50.0%) | 0 (0.0%) |
Employment Status by Educational Attainment in Oswego
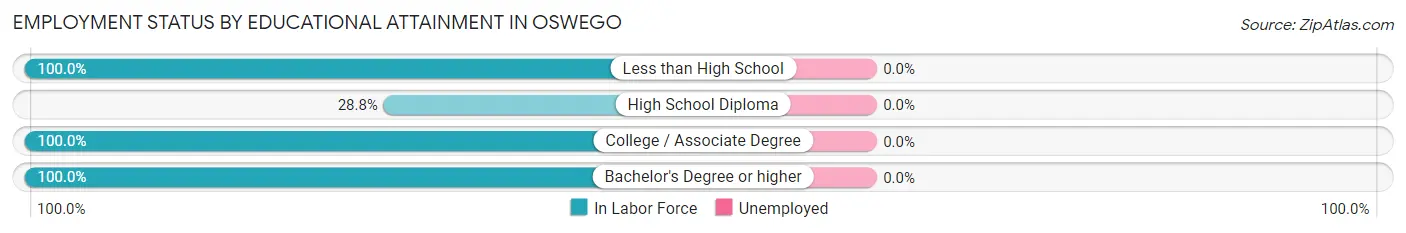
| Educational Attainment | In Labor Force | Unemployed |
| Less than High School | 41 (100.0%) | 0 (0.0%) |
| High School Diploma | 36 (28.8%) | 0 (0.0%) |
| College / Associate Degree | 12 (100.0%) | 0 (0.0%) |
| Bachelor's Degree or higher | 12 (100.0%) | 0 (0.0%) |
| Total | 101 (53.2%) | 0 (0.0%) |
Employment Occupations by Sex in Oswego
Management, Business, Science and Arts Occupations
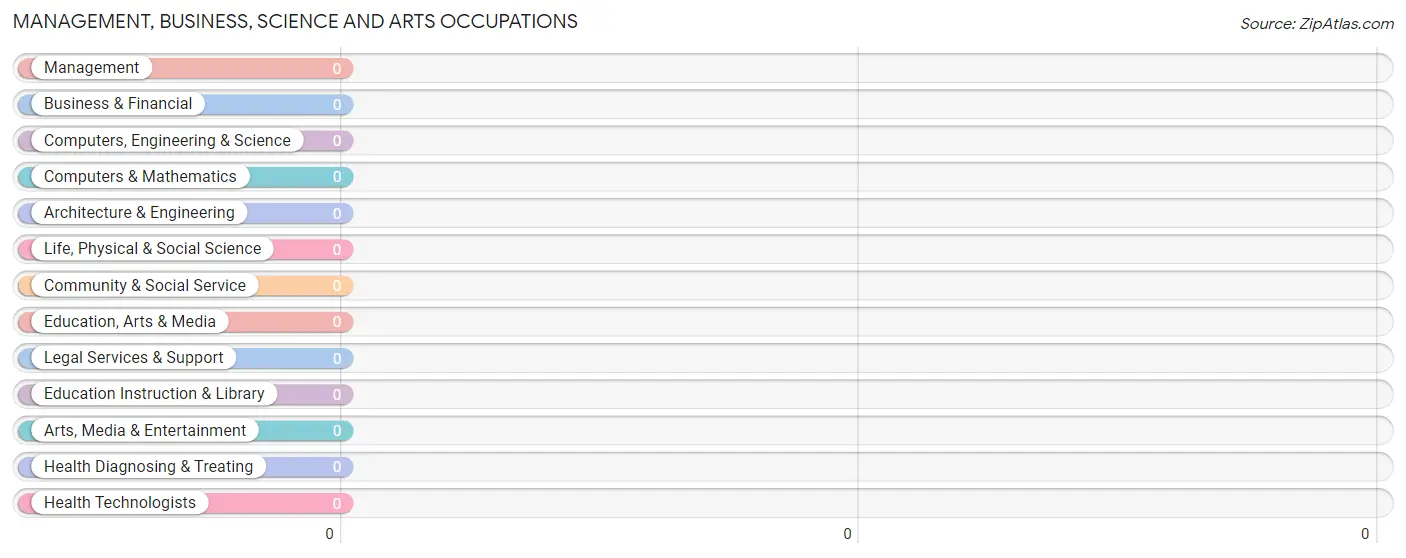
Management, Business, Science and Arts Occupations by Sex
| Occupation | Male | Female |
| Management | 0 (0.0%) | 0 (0.0%) |
| Business & Financial | 0 (0.0%) | 0 (0.0%) |
| Computers, Engineering & Science | 0 (0.0%) | 0 (0.0%) |
| Computers & Mathematics | 0 (0.0%) | 0 (0.0%) |
| Architecture & Engineering | 0 (0.0%) | 0 (0.0%) |
| Life, Physical & Social Science | 0 (0.0%) | 0 (0.0%) |
| Community & Social Service | 0 (0.0%) | 0 (0.0%) |
| Education, Arts & Media | 0 (0.0%) | 0 (0.0%) |
| Legal Services & Support | 0 (0.0%) | 0 (0.0%) |
| Education Instruction & Library | 0 (0.0%) | 0 (0.0%) |
| Arts, Media & Entertainment | 0 (0.0%) | 0 (0.0%) |
| Health Diagnosing & Treating | 0 (0.0%) | 0 (0.0%) |
| Health Technologists | 0 (0.0%) | 0 (0.0%) |
| Total (Category) | 0 (0.0%) | 0 (0.0%) |
| Total (Overall) | 53 (52.5%) | 48 (47.5%) |
Services Occupations
The most common Services occupations in Oswego are , and Cleaning & Maintenance (41 | 40.6%).
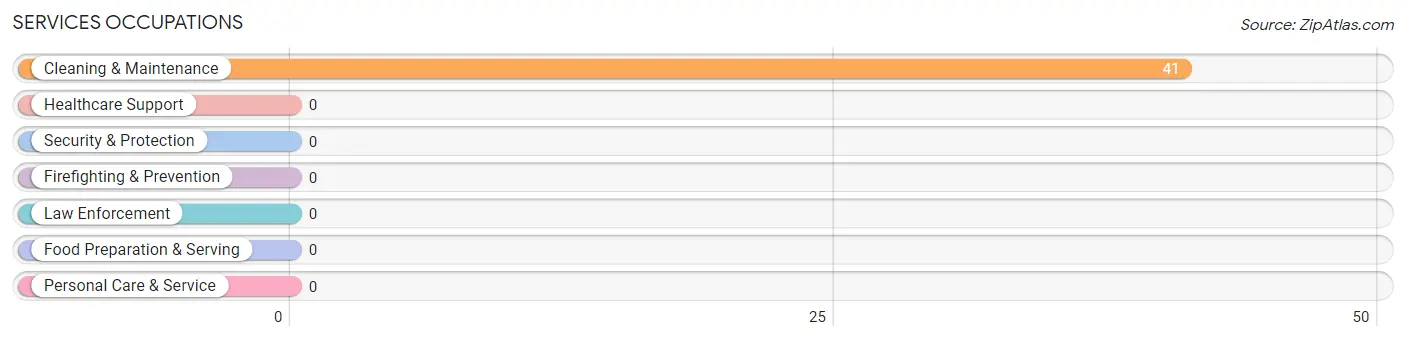
Services Occupations by Sex
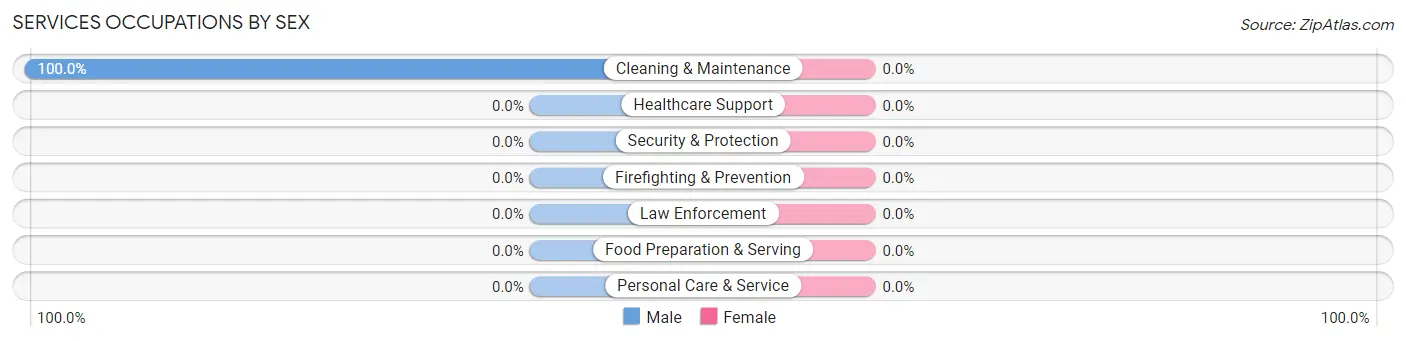
| Occupation | Male | Female |
| Healthcare Support | 0 (0.0%) | 0 (0.0%) |
| Security & Protection | 0 (0.0%) | 0 (0.0%) |
| Firefighting & Prevention | 0 (0.0%) | 0 (0.0%) |
| Law Enforcement | 0 (0.0%) | 0 (0.0%) |
| Food Preparation & Serving | 0 (0.0%) | 0 (0.0%) |
| Cleaning & Maintenance | 41 (100.0%) | 0 (0.0%) |
| Personal Care & Service | 0 (0.0%) | 0 (0.0%) |
| Total (Category) | 41 (100.0%) | 0 (0.0%) |
| Total (Overall) | 53 (52.5%) | 48 (47.5%) |
Sales and Office Occupations
The most common Sales and Office occupations in Oswego are , and Office & Administration (12 | 11.9%).
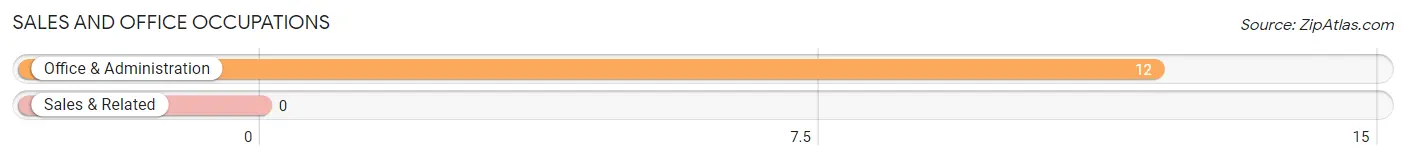
Sales and Office Occupations by Sex
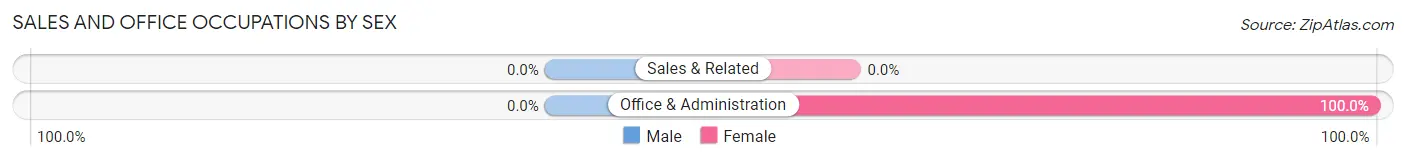
| Occupation | Male | Female |
| Sales & Related | 0 (0.0%) | 0 (0.0%) |
| Office & Administration | 0 (0.0%) | 12 (100.0%) |
| Total (Category) | 0 (0.0%) | 12 (100.0%) |
| Total (Overall) | 53 (52.5%) | 48 (47.5%) |
Natural Resources, Construction and Maintenance Occupations

Natural Resources, Construction and Maintenance Occupations by Sex
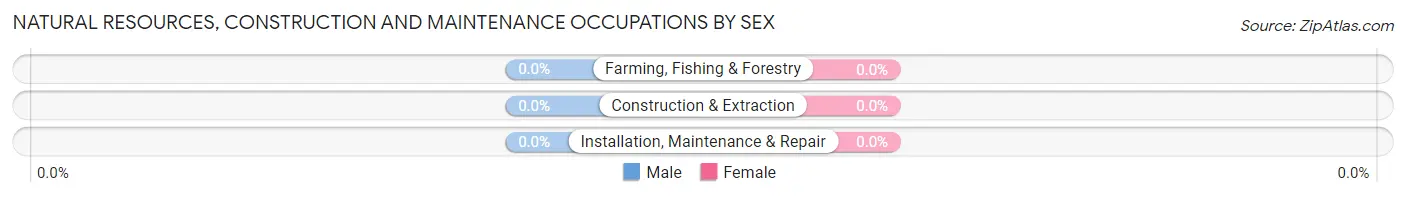
| Occupation | Male | Female |
| Farming, Fishing & Forestry | 0 (0.0%) | 0 (0.0%) |
| Construction & Extraction | 0 (0.0%) | 0 (0.0%) |
| Installation, Maintenance & Repair | 0 (0.0%) | 0 (0.0%) |
| Total (Category) | 0 (0.0%) | 0 (0.0%) |
| Total (Overall) | 53 (52.5%) | 48 (47.5%) |
Production, Transportation and Moving Occupations
The most common Production, Transportation and Moving occupations in Oswego are , and Production (48 | 47.5%).
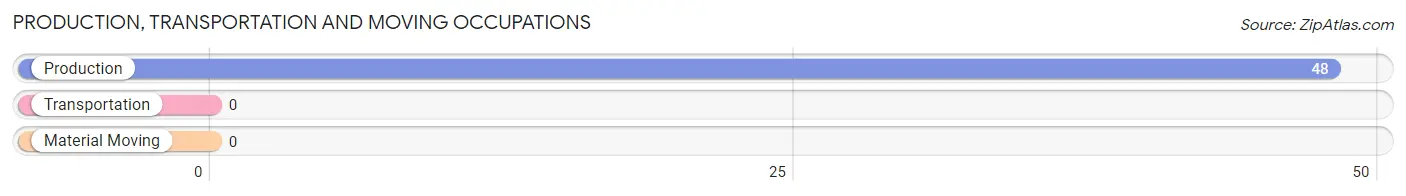
Production, Transportation and Moving Occupations by Sex
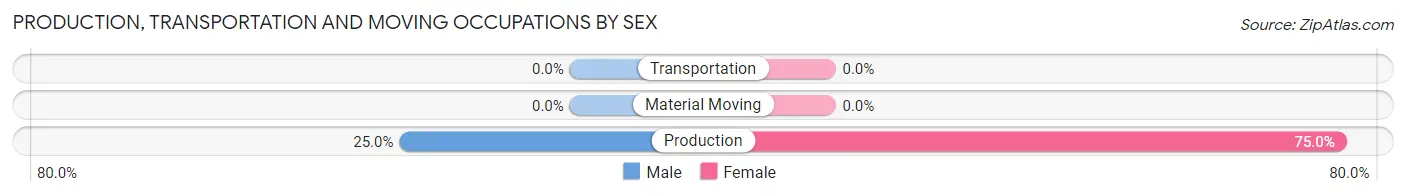
| Occupation | Male | Female |
| Production | 12 (25.0%) | 36 (75.0%) |
| Transportation | 0 (0.0%) | 0 (0.0%) |
| Material Moving | 0 (0.0%) | 0 (0.0%) |
| Total (Category) | 12 (25.0%) | 36 (75.0%) |
| Total (Overall) | 53 (52.5%) | 48 (47.5%) |
Employment Industries by Sex in Oswego
Employment Industries in Oswego
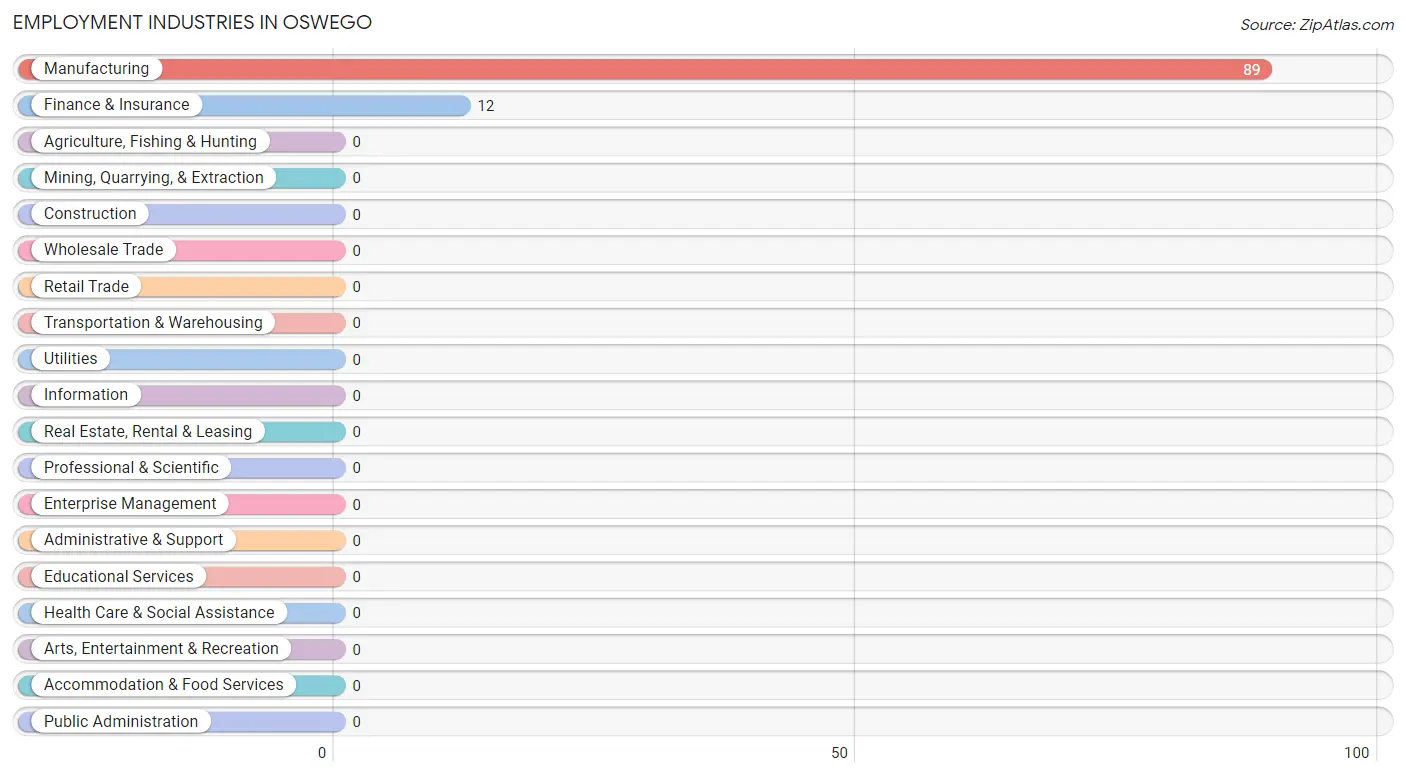
The major employment industries in Oswego include Manufacturing (89 | 88.1%), and Finance & Insurance (12 | 11.9%).
Employment Industries by Sex in Oswego
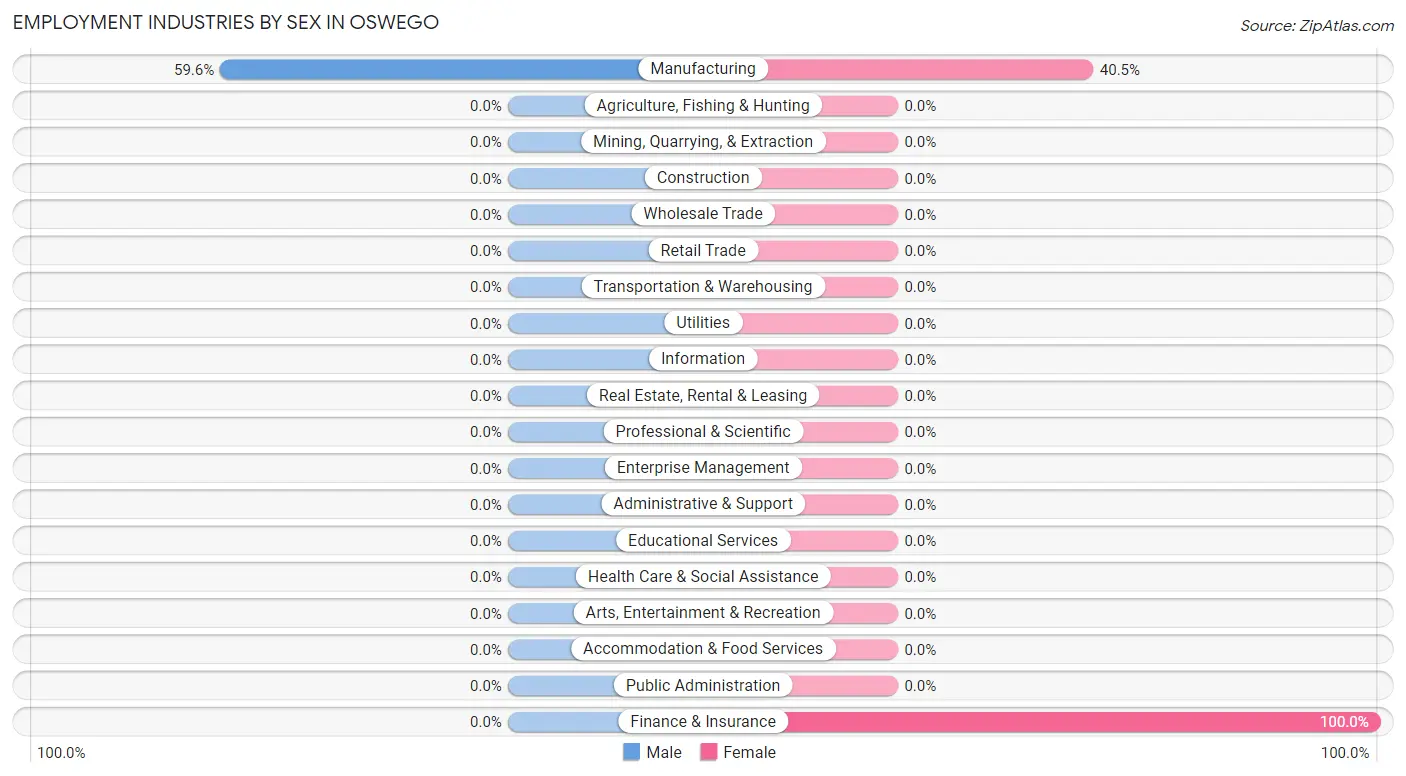
| Industry | Male | Female |
| Agriculture, Fishing & Hunting | 0 (0.0%) | 0 (0.0%) |
| Mining, Quarrying, & Extraction | 0 (0.0%) | 0 (0.0%) |
| Construction | 0 (0.0%) | 0 (0.0%) |
| Manufacturing | 53 (59.6%) | 36 (40.5%) |
| Wholesale Trade | 0 (0.0%) | 0 (0.0%) |
| Retail Trade | 0 (0.0%) | 0 (0.0%) |
| Transportation & Warehousing | 0 (0.0%) | 0 (0.0%) |
| Utilities | 0 (0.0%) | 0 (0.0%) |
| Information | 0 (0.0%) | 0 (0.0%) |
| Finance & Insurance | 0 (0.0%) | 12 (100.0%) |
| Real Estate, Rental & Leasing | 0 (0.0%) | 0 (0.0%) |
| Professional & Scientific | 0 (0.0%) | 0 (0.0%) |
| Enterprise Management | 0 (0.0%) | 0 (0.0%) |
| Administrative & Support | 0 (0.0%) | 0 (0.0%) |
| Educational Services | 0 (0.0%) | 0 (0.0%) |
| Health Care & Social Assistance | 0 (0.0%) | 0 (0.0%) |
| Arts, Entertainment & Recreation | 0 (0.0%) | 0 (0.0%) |
| Accommodation & Food Services | 0 (0.0%) | 0 (0.0%) |
| Public Administration | 0 (0.0%) | 0 (0.0%) |
| Total | 53 (52.5%) | 48 (47.5%) |
Education in Oswego
School Enrollment in Oswego
The most common levels of schooling among the 162 students in Oswego are middle school (108 | 66.7%), and high school (54 | 33.3%).
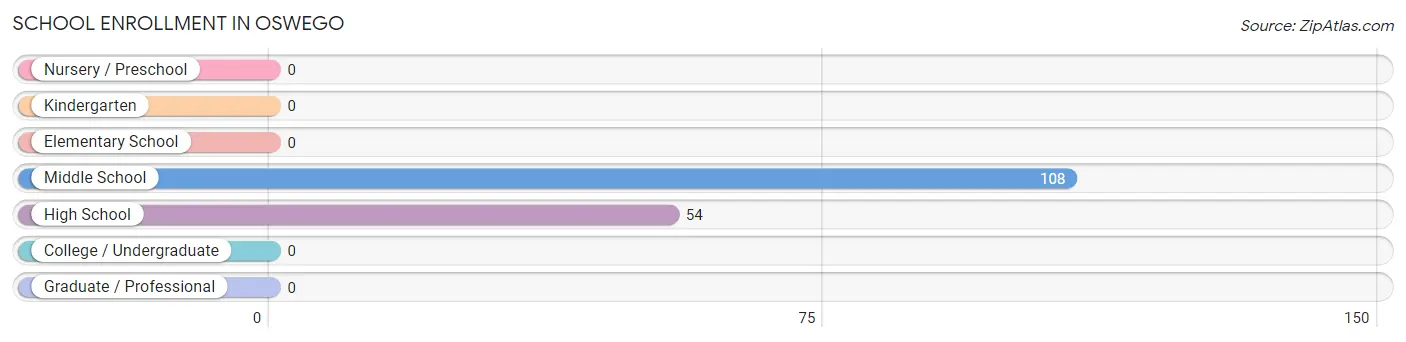
| School Level | # Students | % Students |
| Nursery / Preschool | 0 | 0.0% |
| Kindergarten | 0 | 0.0% |
| Elementary School | 0 | 0.0% |
| Middle School | 108 | 66.7% |
| High School | 54 | 33.3% |
| College / Undergraduate | 0 | 0.0% |
| Graduate / Professional | 0 | 0.0% |
| Total | 162 | 100.0% |
School Enrollment by Age by Funding Source in Oswego
Out of a total of 162 students who are enrolled in schools in Oswego, 24 (14.8%) attend a private institution, while the remaining 138 (85.2%) are enrolled in public schools. The age group of 15 to 17 year olds has the highest likelihood of being enrolled in private schools, with 12 (22.2% in the age bracket) enrolled. Conversely, the age group of 10 to 14 year olds has the lowest likelihood of being enrolled in a private school, with 96 (88.9% in the age bracket) attending a public institution.
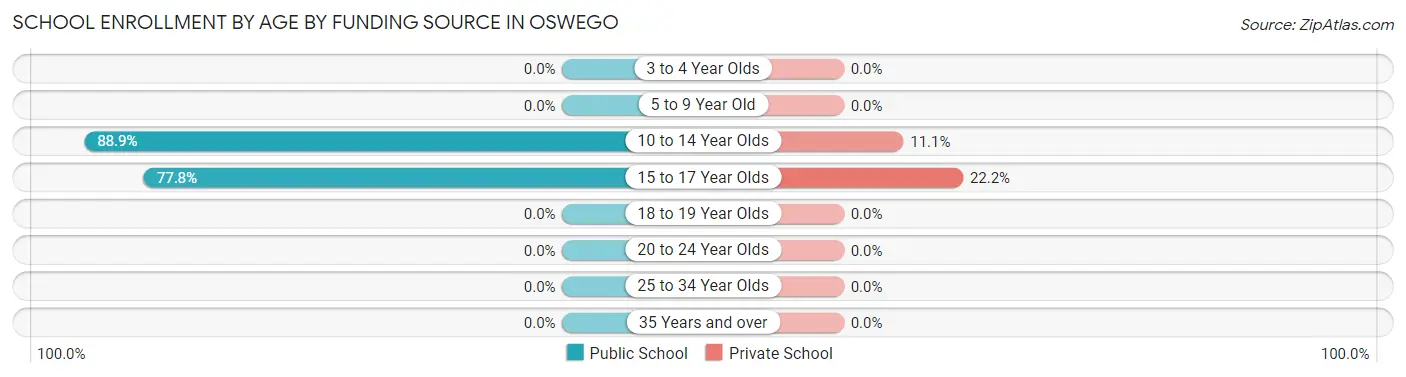
| Age Bracket | Public School | Private School |
| 3 to 4 Year Olds | 0 (0.0%) | 0 (0.0%) |
| 5 to 9 Year Old | 0 (0.0%) | 0 (0.0%) |
| 10 to 14 Year Olds | 96 (88.9%) | 12 (11.1%) |
| 15 to 17 Year Olds | 42 (77.8%) | 12 (22.2%) |
| 18 to 19 Year Olds | 0 (0.0%) | 0 (0.0%) |
| 20 to 24 Year Olds | 0 (0.0%) | 0 (0.0%) |
| 25 to 34 Year Olds | 0 (0.0%) | 0 (0.0%) |
| 35 Years and over | 0 (0.0%) | 0 (0.0%) |
| Total | 138 (85.2%) | 24 (14.8%) |
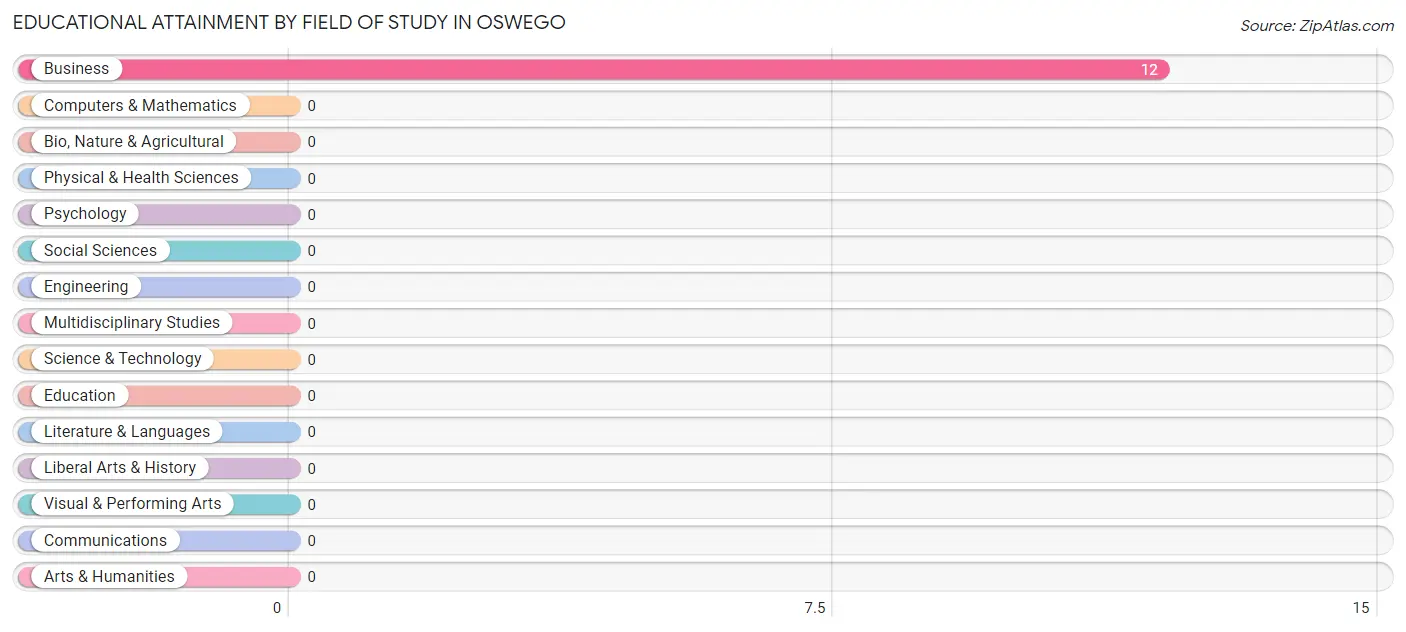
Educational Attainment by Field of Study in Oswego
, and business (12 | 100.0%) are the most common fields of study among 12 individuals in Oswego who have obtained a bachelor's degree or higher.
| Field of Study | # Graduates | % Graduates |
| Computers & Mathematics | 0 | 0.0% |
| Bio, Nature & Agricultural | 0 | 0.0% |
| Physical & Health Sciences | 0 | 0.0% |
| Psychology | 0 | 0.0% |
| Social Sciences | 0 | 0.0% |
| Engineering | 0 | 0.0% |
| Multidisciplinary Studies | 0 | 0.0% |
| Science & Technology | 0 | 0.0% |
| Business | 12 | 100.0% |
| Education | 0 | 0.0% |
| Literature & Languages | 0 | 0.0% |
| Liberal Arts & History | 0 | 0.0% |
| Visual & Performing Arts | 0 | 0.0% |
| Communications | 0 | 0.0% |
| Arts & Humanities | 0 | 0.0% |
| Total | 12 | 100.0% |
Transportation & Commute in Oswego
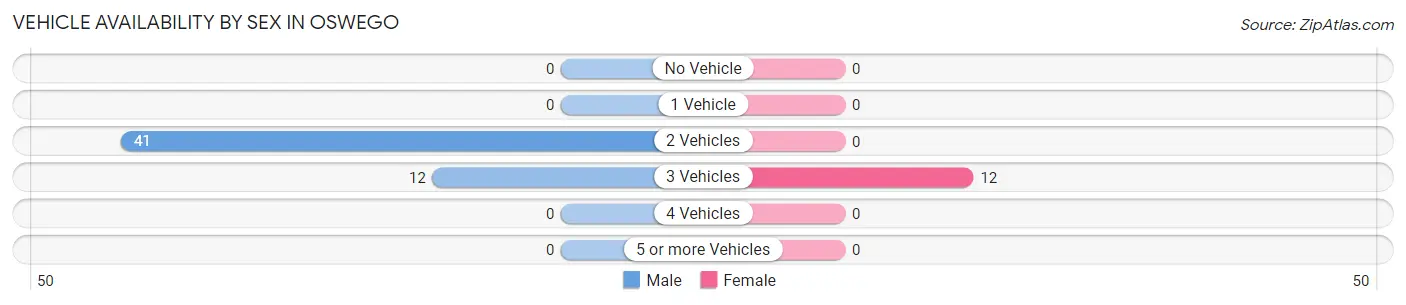
Vehicle Availability by Sex in Oswego
The most prevalent vehicle ownership categories in Oswego are males with 2 vehicles (41, accounting for 77.4%) and females with 2 vehicles (0, making up 341.7%).
| Vehicles Available | Male | Female |
| No Vehicle | 0 (0.0%) | 0 (0.0%) |
| 1 Vehicle | 0 (0.0%) | 0 (0.0%) |
| 2 Vehicles | 41 (77.4%) | 0 (0.0%) |
| 3 Vehicles | 12 (22.6%) | 12 (100.0%) |
| 4 Vehicles | 0 (0.0%) | 0 (0.0%) |
| 5 or more Vehicles | 0 (0.0%) | 0 (0.0%) |
| Total | 53 (100.0%) | 12 (100.0%) |
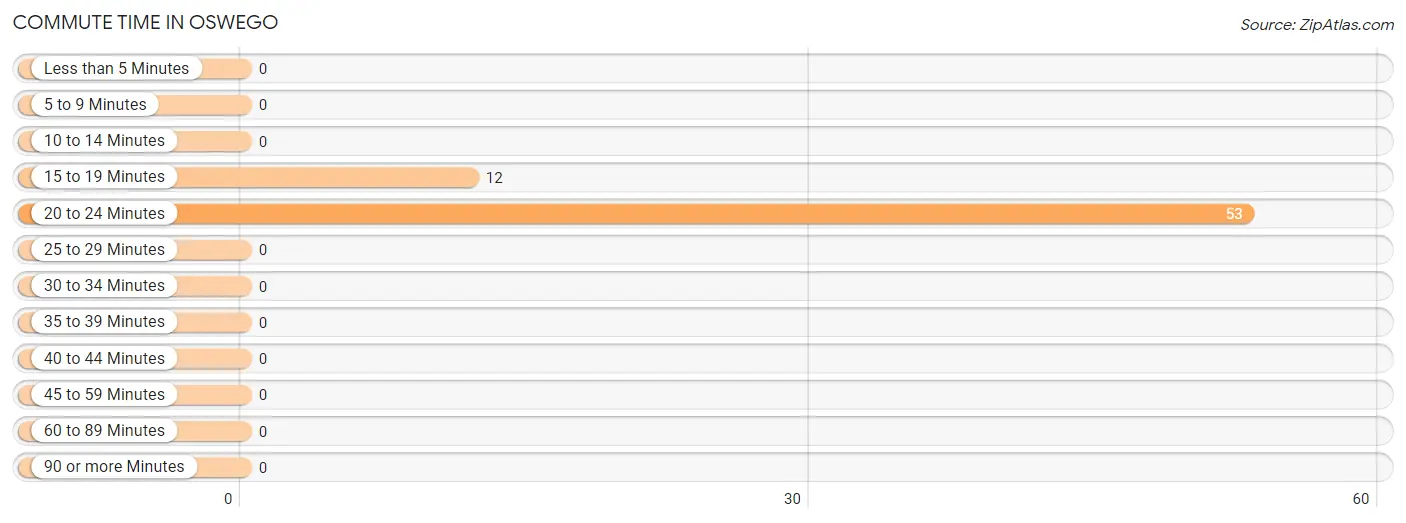
Commute Time in Oswego
The most frequently occuring commute durations in Oswego are 20 to 24 minutes (53 commuters, 81.5%), 15 to 19 minutes (12 commuters, 18.5%), and less than 5 minutes (0 commuters, 0.0%).
| Commute Time | # Commuters | % Commuters |
| Less than 5 Minutes | 0 | 0.0% |
| 5 to 9 Minutes | 0 | 0.0% |
| 10 to 14 Minutes | 0 | 0.0% |
| 15 to 19 Minutes | 12 | 18.5% |
| 20 to 24 Minutes | 53 | 81.5% |
| 25 to 29 Minutes | 0 | 0.0% |
| 30 to 34 Minutes | 0 | 0.0% |
| 35 to 39 Minutes | 0 | 0.0% |
| 40 to 44 Minutes | 0 | 0.0% |
| 45 to 59 Minutes | 0 | 0.0% |
| 60 to 89 Minutes | 0 | 0.0% |
| 90 or more Minutes | 0 | 0.0% |
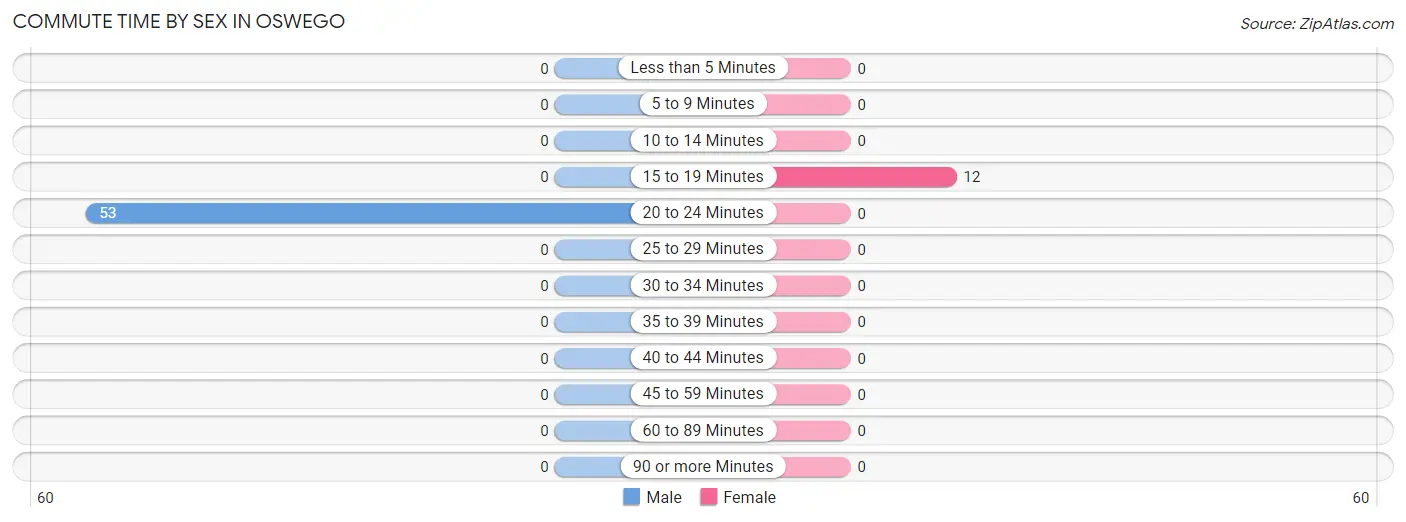
Commute Time by Sex in Oswego
The most common commute times in Oswego are 20 to 24 minutes (53 commuters, 100.0%) for males and 15 to 19 minutes (12 commuters, 100.0%) for females.
| Commute Time | Male | Female |
| Less than 5 Minutes | 0 (0.0%) | 0 (0.0%) |
| 5 to 9 Minutes | 0 (0.0%) | 0 (0.0%) |
| 10 to 14 Minutes | 0 (0.0%) | 0 (0.0%) |
| 15 to 19 Minutes | 0 (0.0%) | 12 (100.0%) |
| 20 to 24 Minutes | 53 (100.0%) | 0 (0.0%) |
| 25 to 29 Minutes | 0 (0.0%) | 0 (0.0%) |
| 30 to 34 Minutes | 0 (0.0%) | 0 (0.0%) |
| 35 to 39 Minutes | 0 (0.0%) | 0 (0.0%) |
| 40 to 44 Minutes | 0 (0.0%) | 0 (0.0%) |
| 45 to 59 Minutes | 0 (0.0%) | 0 (0.0%) |
| 60 to 89 Minutes | 0 (0.0%) | 0 (0.0%) |
| 90 or more Minutes | 0 (0.0%) | 0 (0.0%) |
Time of Departure to Work by Sex in Oswego
The most frequent times of departure to work in Oswego are 7:30 AM to 7:59 AM (41, 77.4%) for males and 8:00 AM to 8:29 AM (12, 100.0%) for females.
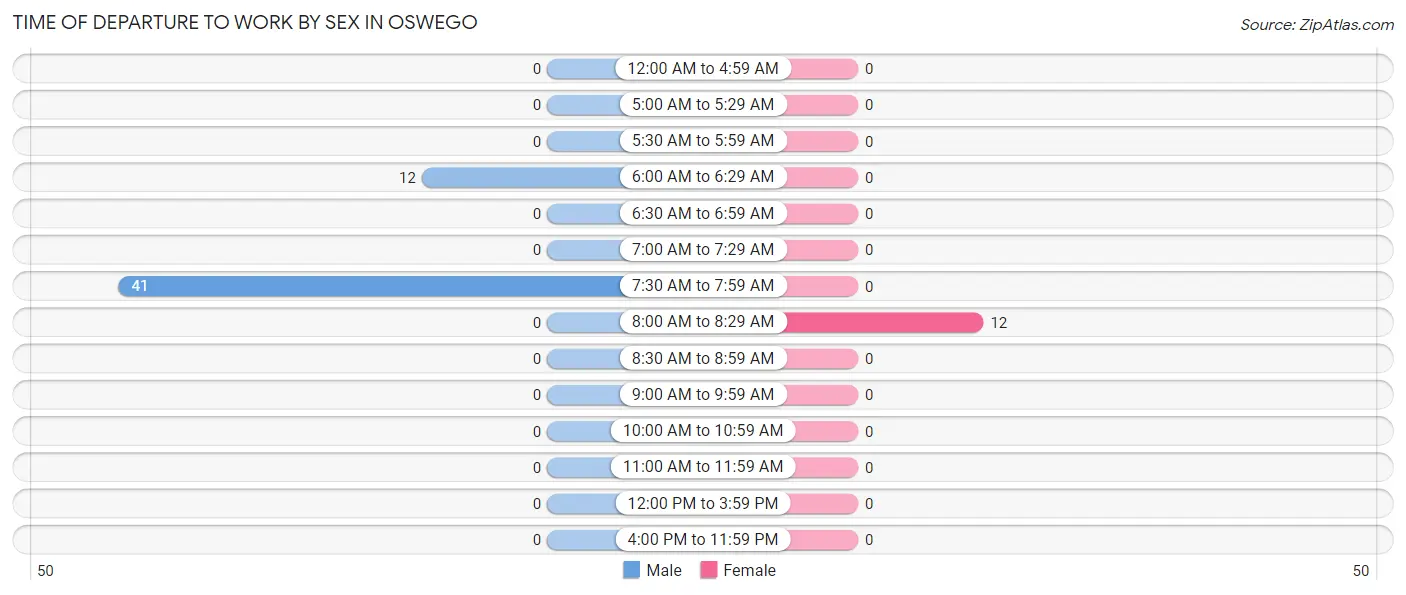
| Time of Departure | Male | Female |
| 12:00 AM to 4:59 AM | 0 (0.0%) | 0 (0.0%) |
| 5:00 AM to 5:29 AM | 0 (0.0%) | 0 (0.0%) |
| 5:30 AM to 5:59 AM | 0 (0.0%) | 0 (0.0%) |
| 6:00 AM to 6:29 AM | 12 (22.6%) | 0 (0.0%) |
| 6:30 AM to 6:59 AM | 0 (0.0%) | 0 (0.0%) |
| 7:00 AM to 7:29 AM | 0 (0.0%) | 0 (0.0%) |
| 7:30 AM to 7:59 AM | 41 (77.4%) | 0 (0.0%) |
| 8:00 AM to 8:29 AM | 0 (0.0%) | 12 (100.0%) |
| 8:30 AM to 8:59 AM | 0 (0.0%) | 0 (0.0%) |
| 9:00 AM to 9:59 AM | 0 (0.0%) | 0 (0.0%) |
| 10:00 AM to 10:59 AM | 0 (0.0%) | 0 (0.0%) |
| 11:00 AM to 11:59 AM | 0 (0.0%) | 0 (0.0%) |
| 12:00 PM to 3:59 PM | 0 (0.0%) | 0 (0.0%) |
| 4:00 PM to 11:59 PM | 0 (0.0%) | 0 (0.0%) |
| Total | 53 (100.0%) | 12 (100.0%) |
Housing Occupancy in Oswego
Occupancy by Ownership in Oswego
Of the total 90 dwellings in Oswego, owner-occupied units account for 90 (100.0%), while renter-occupied units make up 0 (0.0%).
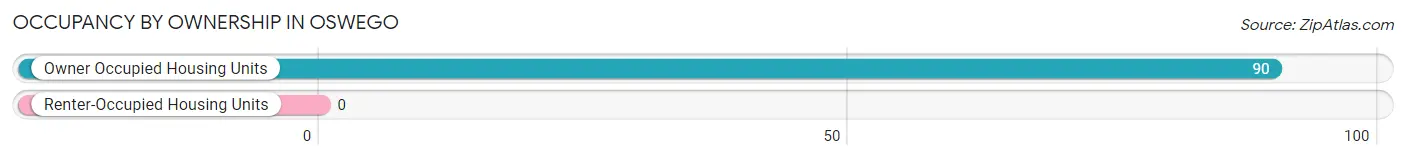
| Occupancy | # Housing Units | % Housing Units |
| Owner Occupied Housing Units | 90 | 100.0% |
| Renter-Occupied Housing Units | 0 | 0.0% |
| Total Occupied Housing Units | 90 | 100.0% |
Occupancy by Household Size in Oswego
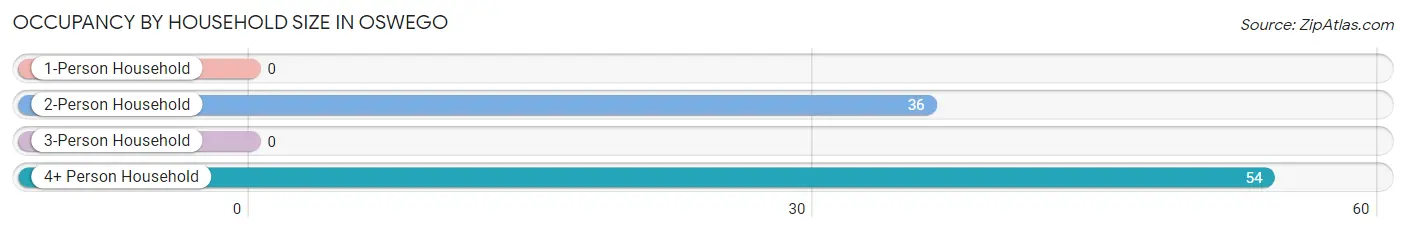
| Household Size | # Housing Units | % Housing Units |
| 1-Person Household | 0 | 0.0% |
| 2-Person Household | 36 | 40.0% |
| 3-Person Household | 0 | 0.0% |
| 4+ Person Household | 54 | 60.0% |
| Total Housing Units | 90 | 100.0% |
Occupancy by Ownership by Household Size in Oswego
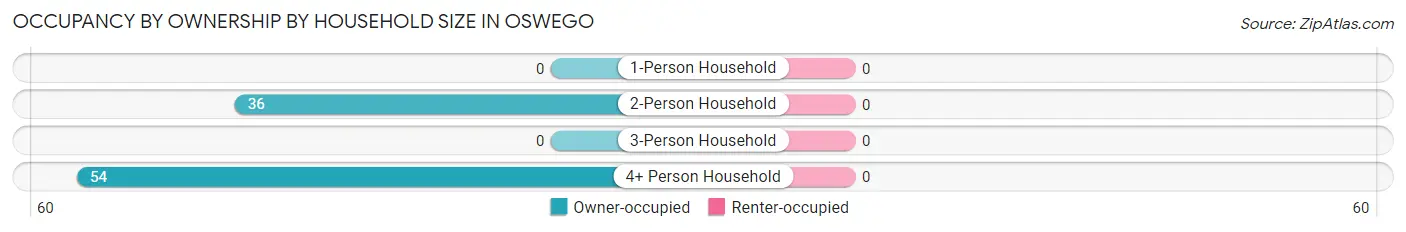
| Household Size | Owner-occupied | Renter-occupied |
| 1-Person Household | 0 (0.0%) | 0 (0.0%) |
| 2-Person Household | 36 (100.0%) | 0 (0.0%) |
| 3-Person Household | 0 (0.0%) | 0 (0.0%) |
| 4+ Person Household | 54 (100.0%) | 0 (0.0%) |
| Total Housing Units | 90 (100.0%) | 0 (0.0%) |
Occupancy by Educational Attainment in Oswego
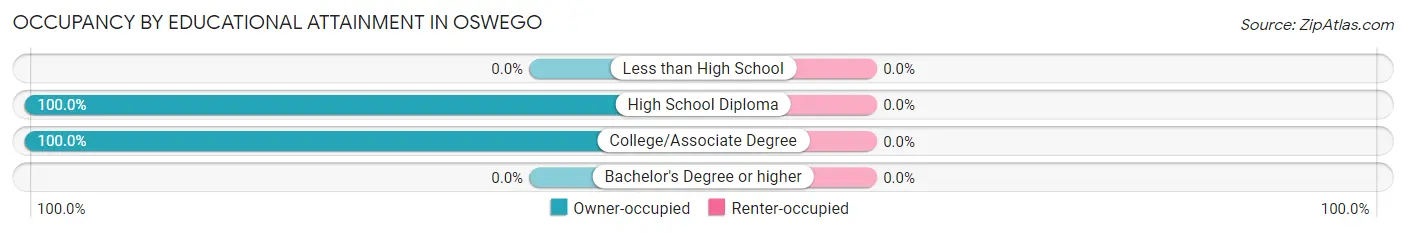
| Household Size | Owner-occupied | Renter-occupied |
| Less than High School | 0 (0.0%) | 0 (0.0%) |
| High School Diploma | 78 (100.0%) | 0 (0.0%) |
| College/Associate Degree | 12 (100.0%) | 0 (0.0%) |
| Bachelor's Degree or higher | 0 (0.0%) | 0 (0.0%) |
Occupancy by Age of Householder in Oswego
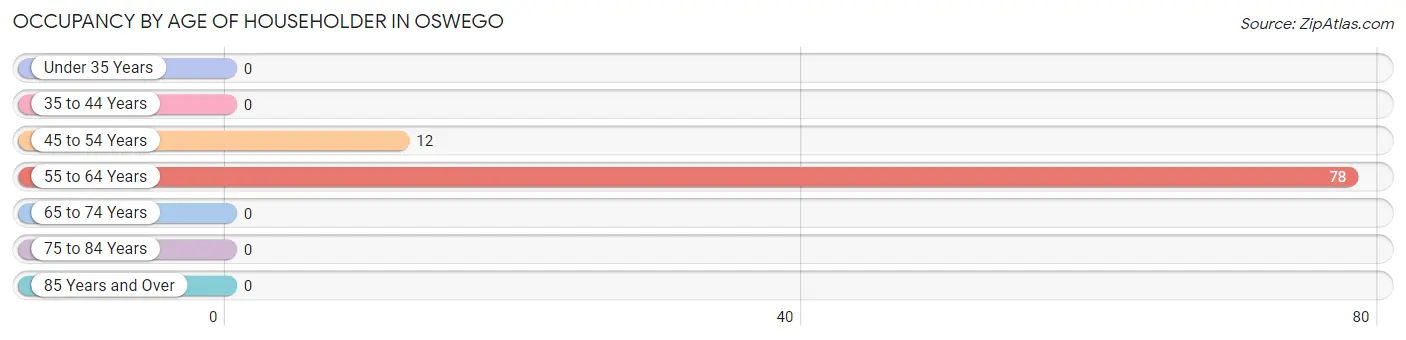
| Age Bracket | # Households | % Households |
| Under 35 Years | 0 | 0.0% |
| 35 to 44 Years | 0 | 0.0% |
| 45 to 54 Years | 12 | 13.3% |
| 55 to 64 Years | 78 | 86.7% |
| 65 to 74 Years | 0 | 0.0% |
| 75 to 84 Years | 0 | 0.0% |
| 85 Years and Over | 0 | 0.0% |
| Total | 90 | 100.0% |
Housing Finances in Oswego
Median Income by Occupancy in Oswego
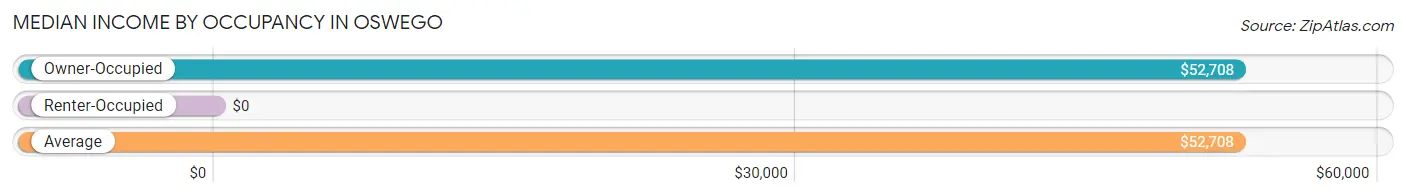
| Occupancy Type | # Households | Median Income |
| Owner-Occupied | 90 (100.0%) | $52,708 |
| Renter-Occupied | 0 (0.0%) | $0 |
| Average | 90 (100.0%) | $52,708 |
Occupancy by Householder Income Bracket in Oswego
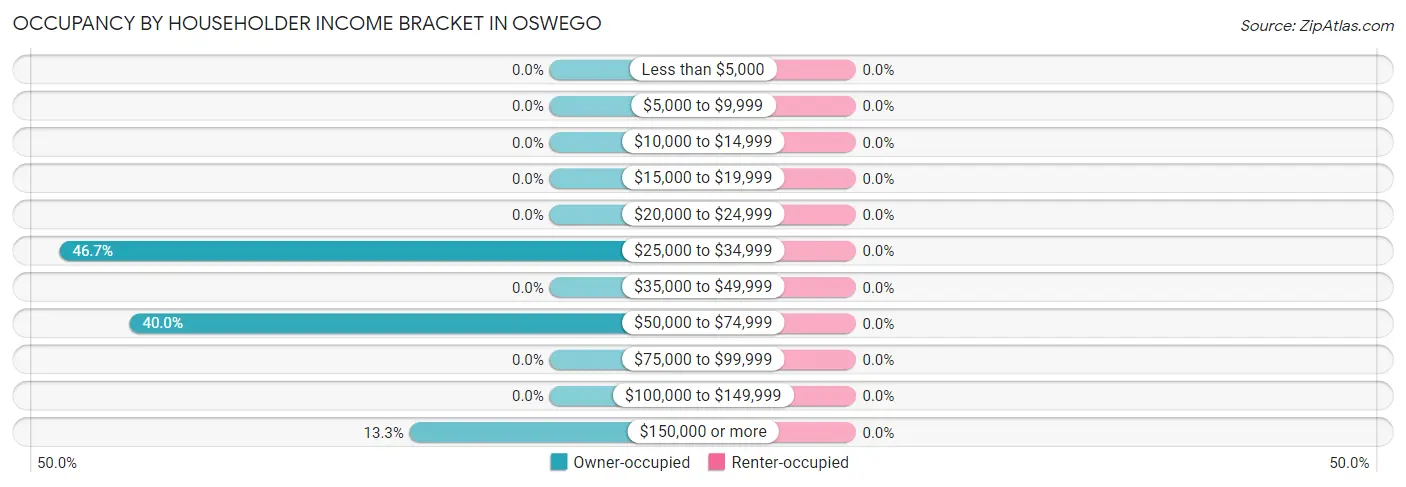
| Income Bracket | Owner-occupied | Renter-occupied |
| Less than $5,000 | 0 (0.0%) | 0 (0.0%) |
| $5,000 to $9,999 | 0 (0.0%) | 0 (0.0%) |
| $10,000 to $14,999 | 0 (0.0%) | 0 (0.0%) |
| $15,000 to $19,999 | 0 (0.0%) | 0 (0.0%) |
| $20,000 to $24,999 | 0 (0.0%) | 0 (0.0%) |
| $25,000 to $34,999 | 42 (46.7%) | 0 (0.0%) |
| $35,000 to $49,999 | 0 (0.0%) | 0 (0.0%) |
| $50,000 to $74,999 | 36 (40.0%) | 0 (0.0%) |
| $75,000 to $99,999 | 0 (0.0%) | 0 (0.0%) |
| $100,000 to $149,999 | 0 (0.0%) | 0 (0.0%) |
| $150,000 or more | 12 (13.3%) | 0 (0.0%) |
| Total | 90 (100.0%) | 0 (0.0%) |
Monthly Housing Cost Tiers in Oswego
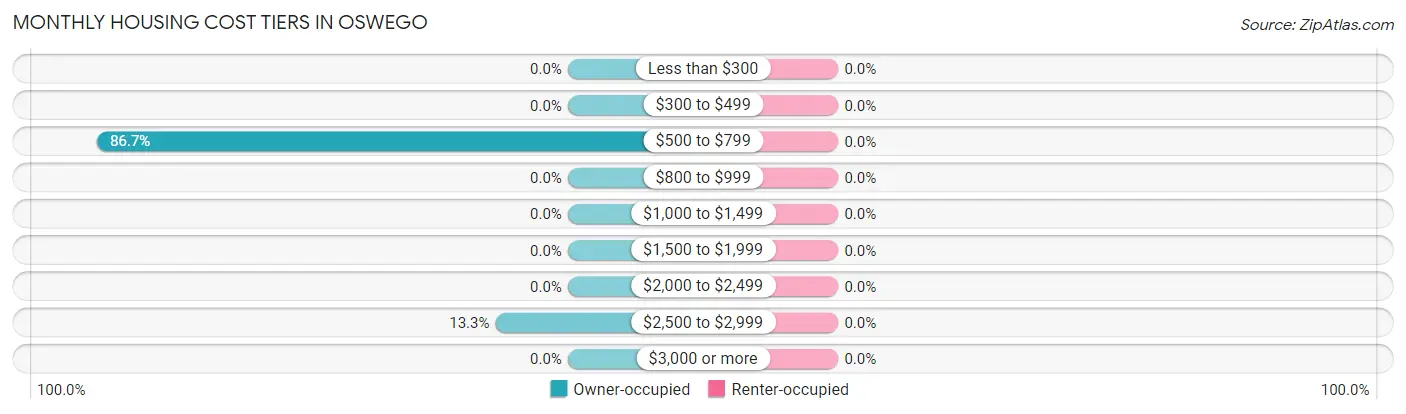
| Monthly Cost | Owner-occupied | Renter-occupied |
| Less than $300 | 0 (0.0%) | 0 (0.0%) |
| $300 to $499 | 0 (0.0%) | 0 (0.0%) |
| $500 to $799 | 78 (86.7%) | 0 (0.0%) |
| $800 to $999 | 0 (0.0%) | 0 (0.0%) |
| $1,000 to $1,499 | 0 (0.0%) | 0 (0.0%) |
| $1,500 to $1,999 | 0 (0.0%) | 0 (0.0%) |
| $2,000 to $2,499 | 0 (0.0%) | 0 (0.0%) |
| $2,500 to $2,999 | 12 (13.3%) | 0 (0.0%) |
| $3,000 or more | 0 (0.0%) | 0 (0.0%) |
| Total | 90 (100.0%) | 0 (0.0%) |
Physical Housing Characteristics in Oswego
Housing Structures in Oswego
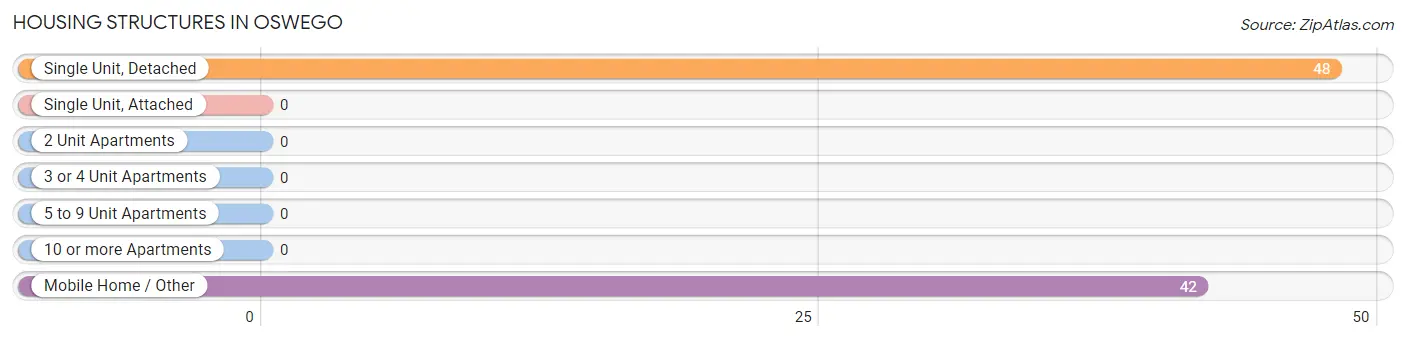
| Structure Type | # Housing Units | % Housing Units |
| Single Unit, Detached | 48 | 53.3% |
| Single Unit, Attached | 0 | 0.0% |
| 2 Unit Apartments | 0 | 0.0% |
| 3 or 4 Unit Apartments | 0 | 0.0% |
| 5 to 9 Unit Apartments | 0 | 0.0% |
| 10 or more Apartments | 0 | 0.0% |
| Mobile Home / Other | 42 | 46.7% |
| Total | 90 | 100.0% |
Housing Structures by Occupancy in Oswego
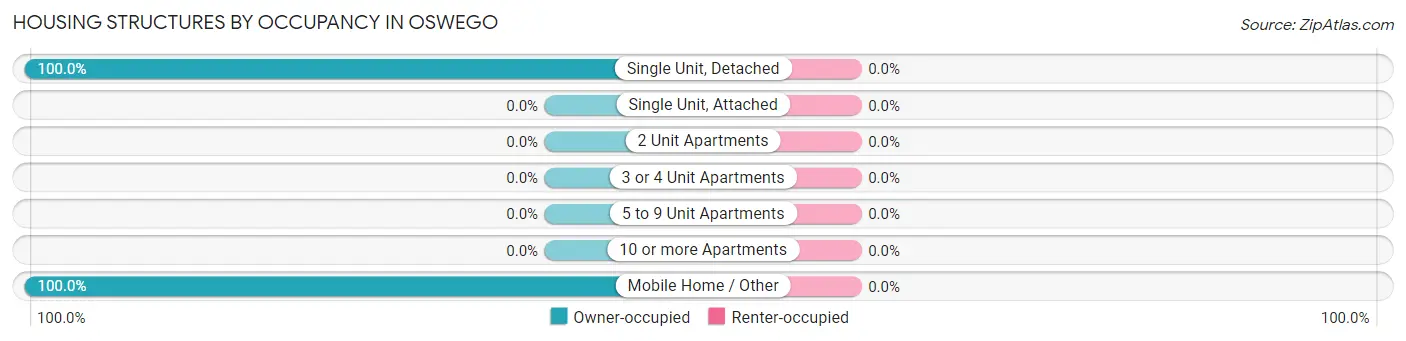
| Structure Type | Owner-occupied | Renter-occupied |
| Single Unit, Detached | 48 (100.0%) | 0 (0.0%) |
| Single Unit, Attached | 0 (0.0%) | 0 (0.0%) |
| 2 Unit Apartments | 0 (0.0%) | 0 (0.0%) |
| 3 or 4 Unit Apartments | 0 (0.0%) | 0 (0.0%) |
| 5 to 9 Unit Apartments | 0 (0.0%) | 0 (0.0%) |
| 10 or more Apartments | 0 (0.0%) | 0 (0.0%) |
| Mobile Home / Other | 42 (100.0%) | 0 (0.0%) |
| Total | 90 (100.0%) | 0 (0.0%) |
Housing Structures by Number of Rooms in Oswego
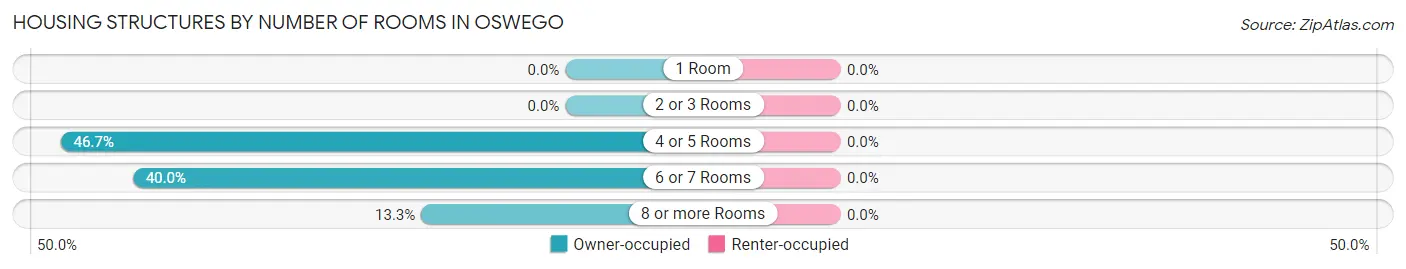
| Number of Rooms | Owner-occupied | Renter-occupied |
| 1 Room | 0 (0.0%) | 0 (0.0%) |
| 2 or 3 Rooms | 0 (0.0%) | 0 (0.0%) |
| 4 or 5 Rooms | 42 (46.7%) | 0 (0.0%) |
| 6 or 7 Rooms | 36 (40.0%) | 0 (0.0%) |
| 8 or more Rooms | 12 (13.3%) | 0 (0.0%) |
| Total | 90 (100.0%) | 0 (0.0%) |
Housing Structure by Heating Type in Oswego
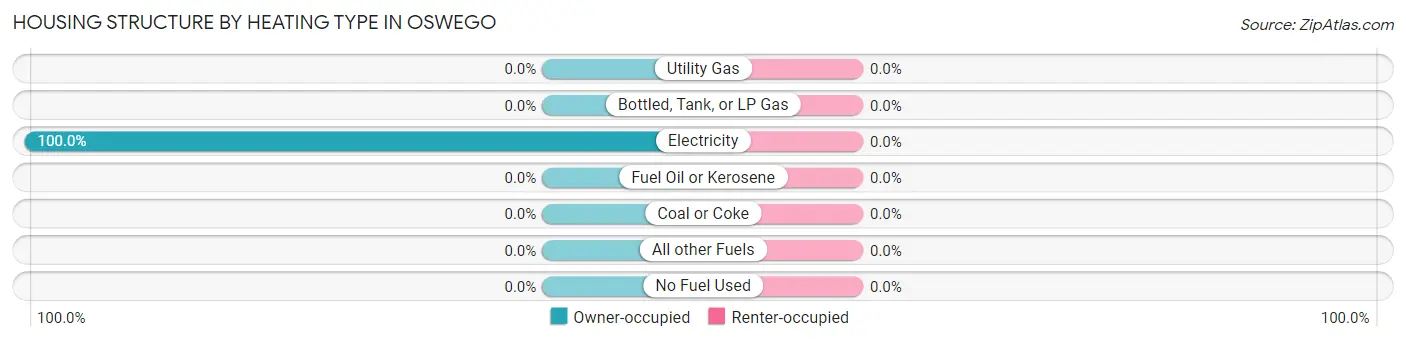
| Heating Type | Owner-occupied | Renter-occupied |
| Utility Gas | 0 (0.0%) | 0 (0.0%) |
| Bottled, Tank, or LP Gas | 0 (0.0%) | 0 (0.0%) |
| Electricity | 90 (100.0%) | 0 (0.0%) |
| Fuel Oil or Kerosene | 0 (0.0%) | 0 (0.0%) |
| Coal or Coke | 0 (0.0%) | 0 (0.0%) |
| All other Fuels | 0 (0.0%) | 0 (0.0%) |
| No Fuel Used | 0 (0.0%) | 0 (0.0%) |
| Total | 90 (100.0%) | 0 (0.0%) |
Household Vehicle Usage in Oswego
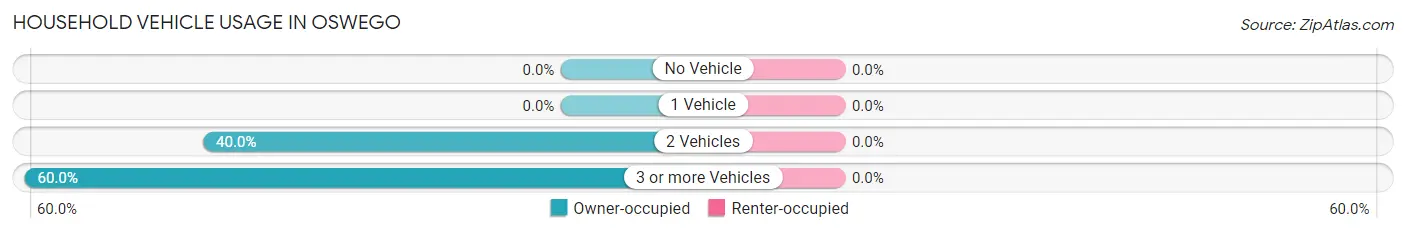
| Vehicles per Household | Owner-occupied | Renter-occupied |
| No Vehicle | 0 (0.0%) | 0 (0.0%) |
| 1 Vehicle | 0 (0.0%) | 0 (0.0%) |
| 2 Vehicles | 36 (40.0%) | 0 (0.0%) |
| 3 or more Vehicles | 54 (60.0%) | 0 (0.0%) |
| Total | 90 (100.0%) | 0 (0.0%) |
Real Estate & Mortgages in Oswego
Real Estate and Mortgage Overview in Oswego
| Characteristic | Without Mortgage | With Mortgage |
| Housing Units | 42 | 48 |
| Median Property Value | - | - |
| Median Household Income | - | - |
| Monthly Housing Costs | - | - |
| Real Estate Taxes | - | - |
Property Value by Mortgage Status in Oswego
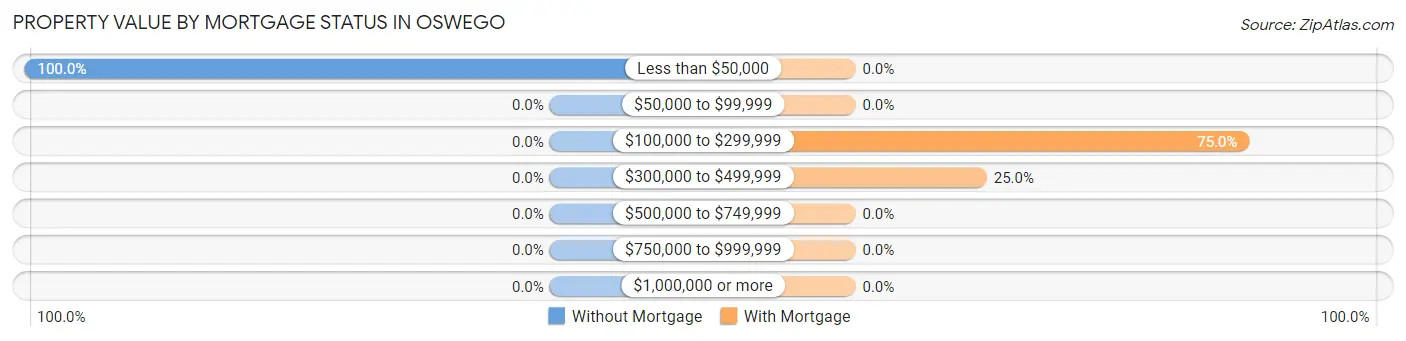
| Property Value | Without Mortgage | With Mortgage |
| Less than $50,000 | 42 (100.0%) | 0 (0.0%) |
| $50,000 to $99,999 | 0 (0.0%) | 0 (0.0%) |
| $100,000 to $299,999 | 0 (0.0%) | 36 (75.0%) |
| $300,000 to $499,999 | 0 (0.0%) | 12 (25.0%) |
| $500,000 to $749,999 | 0 (0.0%) | 0 (0.0%) |
| $750,000 to $999,999 | 0 (0.0%) | 0 (0.0%) |
| $1,000,000 or more | 0 (0.0%) | 0 (0.0%) |
| Total | 42 (100.0%) | 48 (100.0%) |
Household Income by Mortgage Status in Oswego
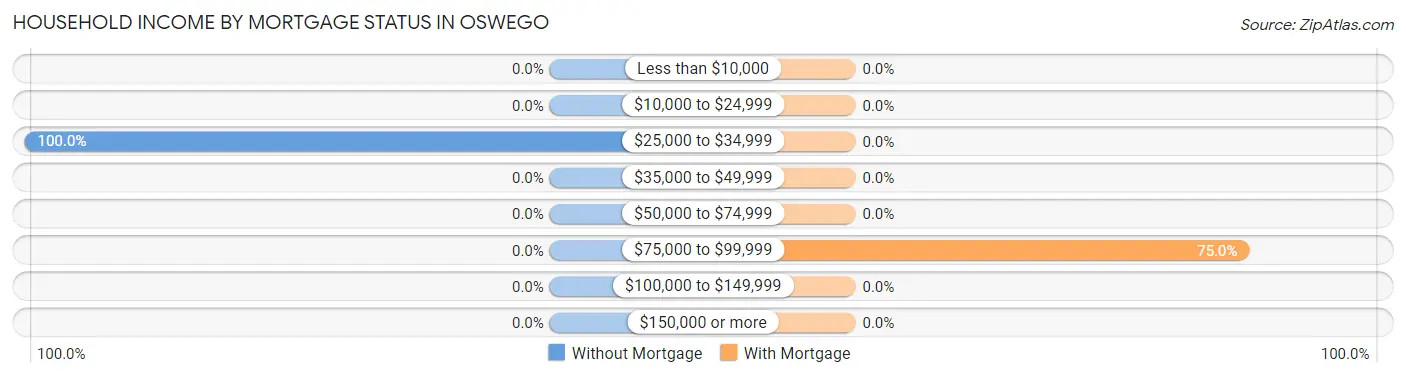
| Household Income | Without Mortgage | With Mortgage |
| Less than $10,000 | 0 (0.0%) | 0 (0.0%) |
| $10,000 to $24,999 | 0 (0.0%) | 0 (0.0%) |
| $25,000 to $34,999 | 42 (100.0%) | 0 (0.0%) |
| $35,000 to $49,999 | 0 (0.0%) | 0 (0.0%) |
| $50,000 to $74,999 | 0 (0.0%) | 0 (0.0%) |
| $75,000 to $99,999 | 0 (0.0%) | 36 (75.0%) |
| $100,000 to $149,999 | 0 (0.0%) | 0 (0.0%) |
| $150,000 or more | 0 (0.0%) | 0 (0.0%) |
| Total | 42 (100.0%) | 48 (100.0%) |
Property Value to Household Income Ratio in Oswego
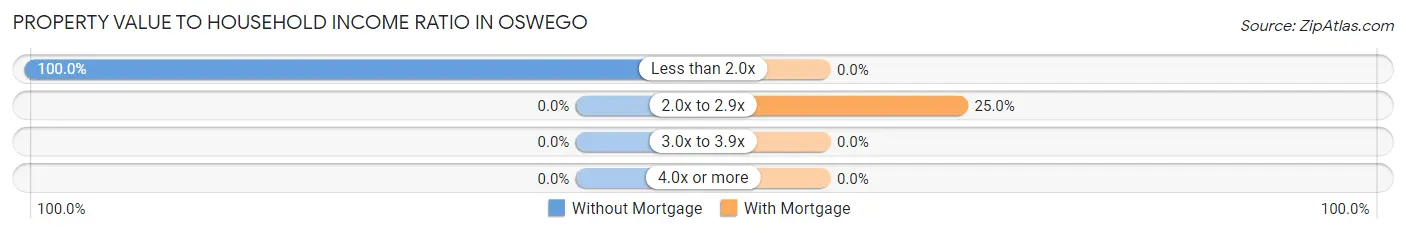
| Value-to-Income Ratio | Without Mortgage | With Mortgage |
| Less than 2.0x | 42 (100.0%) | 0 (0.0%) |
| 2.0x to 2.9x | 0 (0.0%) | 12 (25.0%) |
| 3.0x to 3.9x | 0 (0.0%) | 0 (0.0%) |
| 4.0x or more | 0 (0.0%) | 0 (0.0%) |
| Total | 42 (100.0%) | 48 (100.0%) |
Real Estate Taxes by Mortgage Status in Oswego
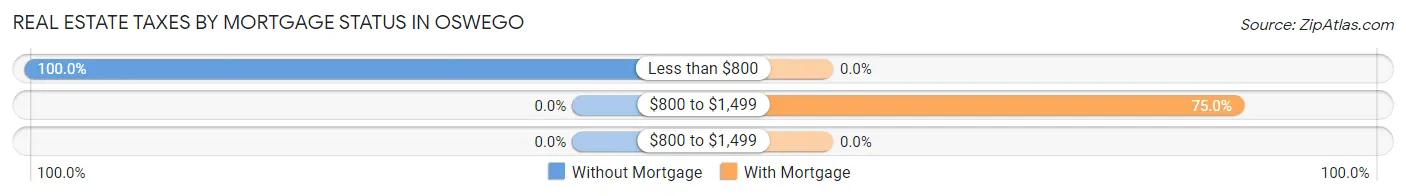
| Property Taxes | Without Mortgage | With Mortgage |
| Less than $800 | 42 (100.0%) | 0 (0.0%) |
| $800 to $1,499 | 0 (0.0%) | 36 (75.0%) |
| $800 to $1,499 | 0 (0.0%) | 0 (0.0%) |
| Total | 42 (100.0%) | 48 (100.0%) |
Health & Disability in Oswego
Health Insurance Coverage by Age in Oswego
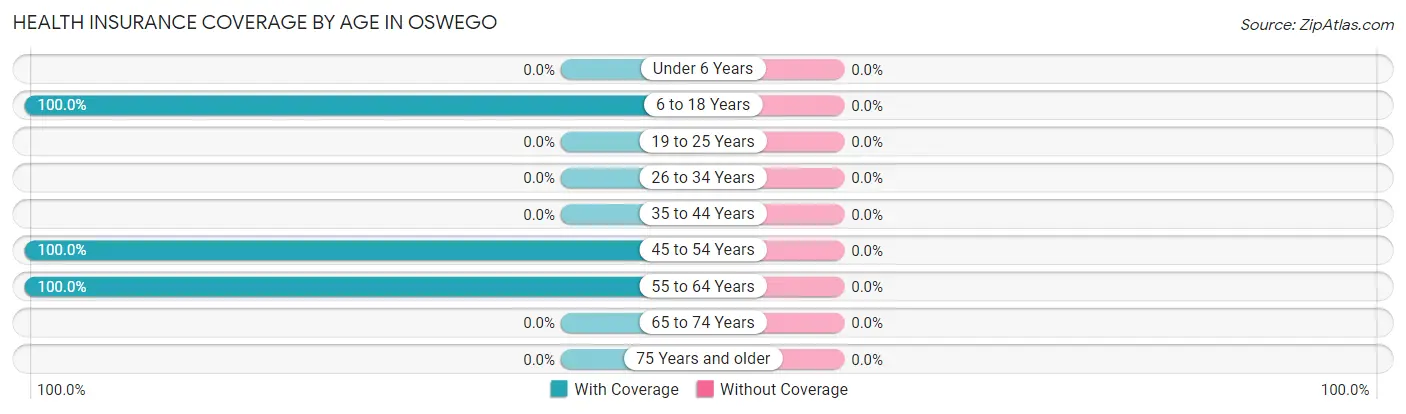
| Age Bracket | With Coverage | Without Coverage |
| Under 6 Years | 0 (0.0%) | 0 (0.0%) |
| 6 to 18 Years | 162 (100.0%) | 0 (0.0%) |
| 19 to 25 Years | 0 (0.0%) | 0 (0.0%) |
| 26 to 34 Years | 0 (0.0%) | 0 (0.0%) |
| 35 to 44 Years | 0 (0.0%) | 0 (0.0%) |
| 45 to 54 Years | 24 (100.0%) | 0 (0.0%) |
| 55 to 64 Years | 166 (100.0%) | 0 (0.0%) |
| 65 to 74 Years | 0 (0.0%) | 0 (0.0%) |
| 75 Years and older | 0 (0.0%) | 0 (0.0%) |
| Total | 352 (100.0%) | 0 (0.0%) |
Health Insurance Coverage by Citizenship Status in Oswego
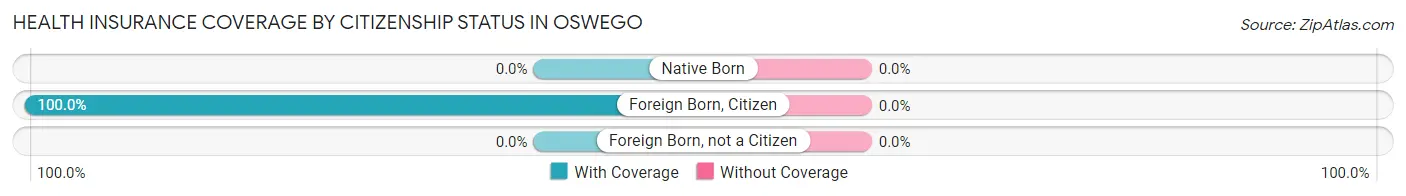
| Citizenship Status | With Coverage | Without Coverage |
| Native Born | 0 (0.0%) | 0 (0.0%) |
| Foreign Born, Citizen | 162 (100.0%) | 0 (0.0%) |
| Foreign Born, not a Citizen | 0 (0.0%) | 0 (0.0%) |
Health Insurance Coverage by Household Income in Oswego
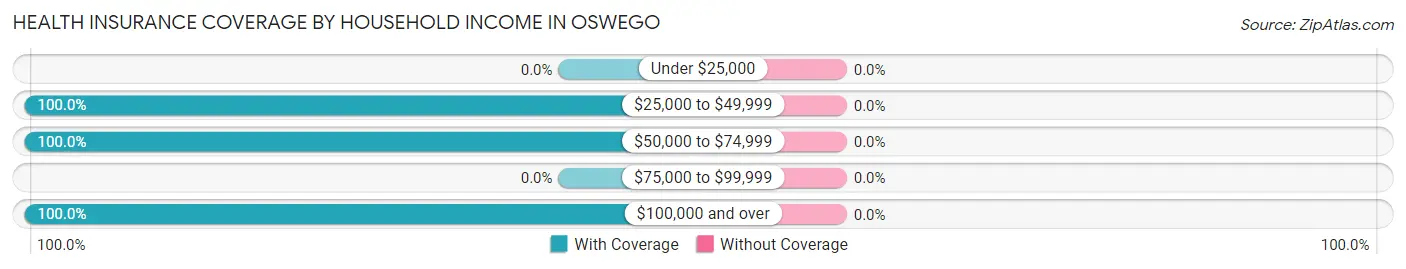
| Household Income | With Coverage | Without Coverage |
| Under $25,000 | 0 (0.0%) | 0 (0.0%) |
| $25,000 to $49,999 | 227 (100.0%) | 0 (0.0%) |
| $50,000 to $74,999 | 77 (100.0%) | 0 (0.0%) |
| $75,000 to $99,999 | 0 (0.0%) | 0 (0.0%) |
| $100,000 and over | 48 (100.0%) | 0 (0.0%) |
Public vs Private Health Insurance Coverage by Age in Oswego
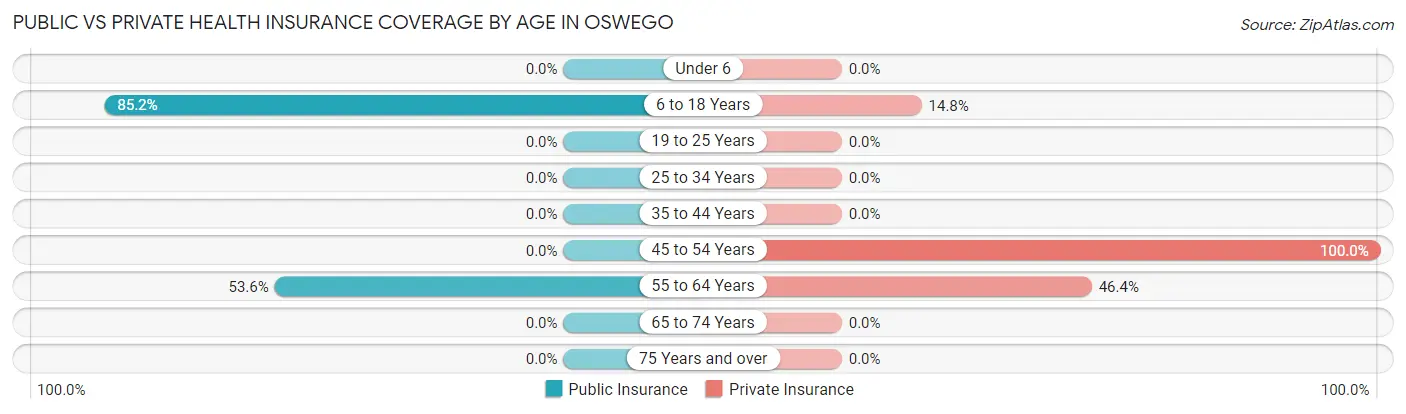
| Age Bracket | Public Insurance | Private Insurance |
| Under 6 | 0 (0.0%) | 0 (0.0%) |
| 6 to 18 Years | 138 (85.2%) | 24 (14.8%) |
| 19 to 25 Years | 0 (0.0%) | 0 (0.0%) |
| 25 to 34 Years | 0 (0.0%) | 0 (0.0%) |
| 35 to 44 Years | 0 (0.0%) | 0 (0.0%) |
| 45 to 54 Years | 0 (0.0%) | 24 (100.0%) |
| 55 to 64 Years | 89 (53.6%) | 77 (46.4%) |
| 65 to 74 Years | 0 (0.0%) | 0 (0.0%) |
| 75 Years and over | 0 (0.0%) | 0 (0.0%) |
| Total | 227 (64.5%) | 125 (35.5%) |
Disability Status by Sex by Age in Oswego
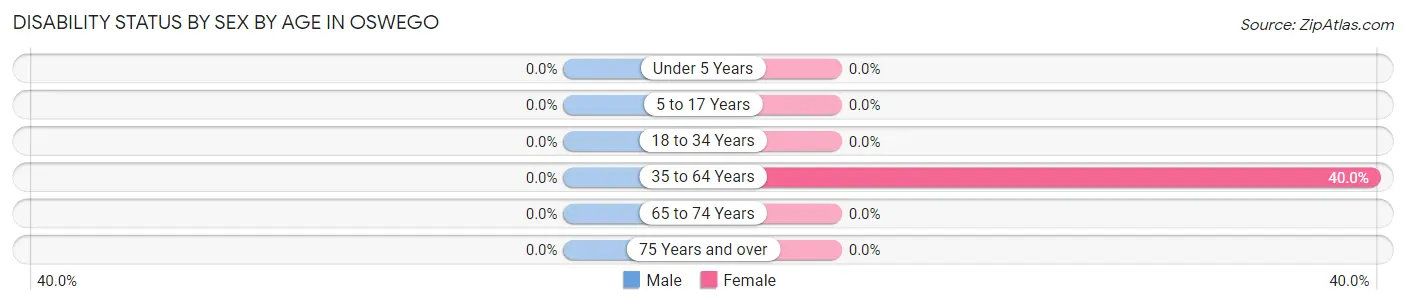
| Age Bracket | Male | Female |
| Under 5 Years | 0 (0.0%) | 0 (0.0%) |
| 5 to 17 Years | 0 (0.0%) | 0 (0.0%) |
| 18 to 34 Years | 0 (0.0%) | 0 (0.0%) |
| 35 to 64 Years | 0 (0.0%) | 36 (40.0%) |
| 65 to 74 Years | 0 (0.0%) | 0 (0.0%) |
| 75 Years and over | 0 (0.0%) | 0 (0.0%) |
Disability Class by Sex by Age in Oswego
Disability Class: Hearing Difficulty
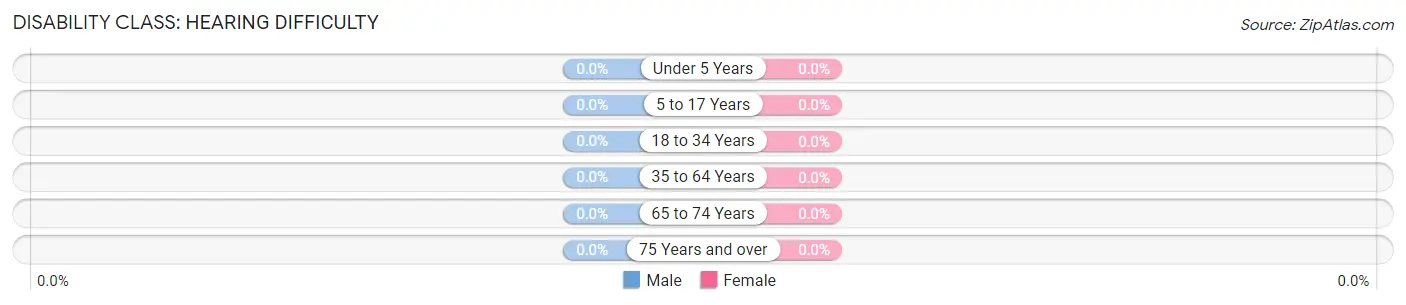
| Age Bracket | Male | Female |
| Under 5 Years | 0 (0.0%) | 0 (0.0%) |
| 5 to 17 Years | 0 (0.0%) | 0 (0.0%) |
| 18 to 34 Years | 0 (0.0%) | 0 (0.0%) |
| 35 to 64 Years | 0 (0.0%) | 0 (0.0%) |
| 65 to 74 Years | 0 (0.0%) | 0 (0.0%) |
| 75 Years and over | 0 (0.0%) | 0 (0.0%) |
Disability Class: Vision Difficulty
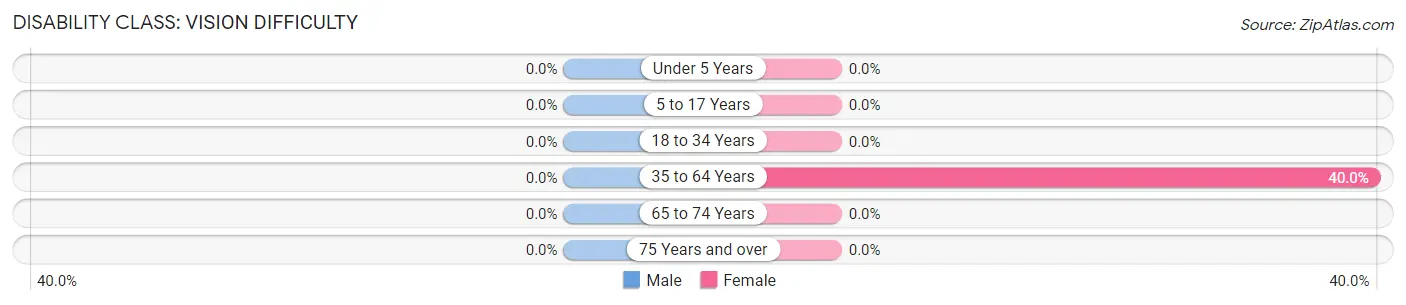
| Age Bracket | Male | Female |
| Under 5 Years | 0 (0.0%) | 0 (0.0%) |
| 5 to 17 Years | 0 (0.0%) | 0 (0.0%) |
| 18 to 34 Years | 0 (0.0%) | 0 (0.0%) |
| 35 to 64 Years | 0 (0.0%) | 36 (40.0%) |
| 65 to 74 Years | 0 (0.0%) | 0 (0.0%) |
| 75 Years and over | 0 (0.0%) | 0 (0.0%) |
Disability Class: Cognitive Difficulty
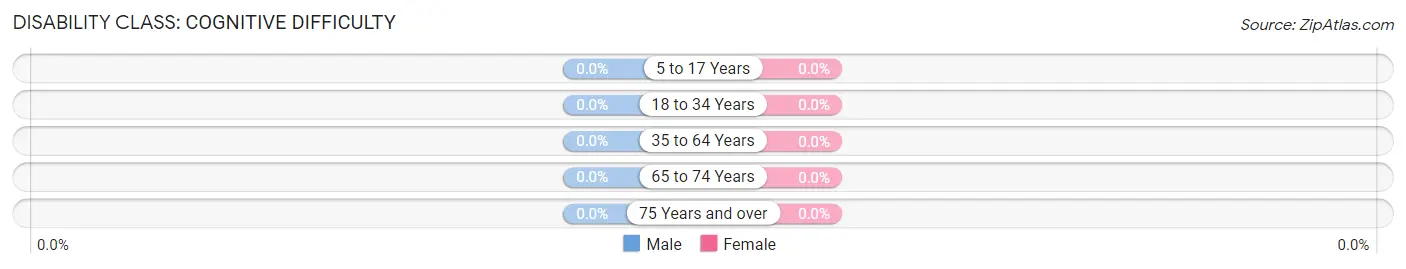
| Age Bracket | Male | Female |
| 5 to 17 Years | 0 (0.0%) | 0 (0.0%) |
| 18 to 34 Years | 0 (0.0%) | 0 (0.0%) |
| 35 to 64 Years | 0 (0.0%) | 0 (0.0%) |
| 65 to 74 Years | 0 (0.0%) | 0 (0.0%) |
| 75 Years and over | 0 (0.0%) | 0 (0.0%) |
Disability Class: Ambulatory Difficulty
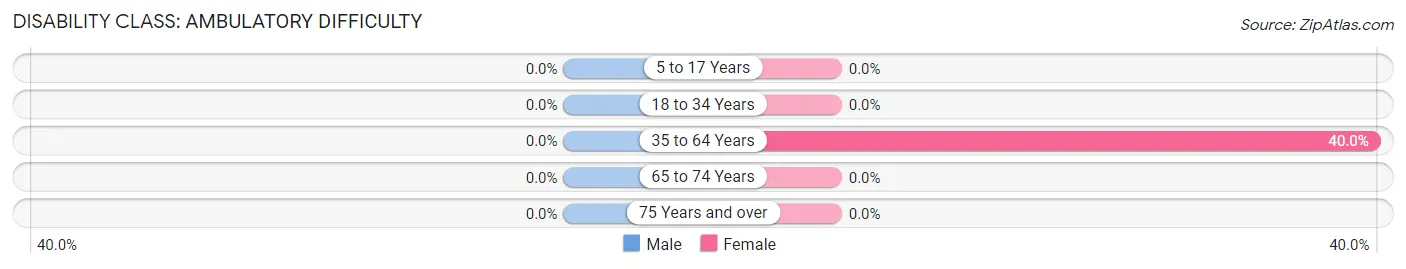
| Age Bracket | Male | Female |
| 5 to 17 Years | 0 (0.0%) | 0 (0.0%) |
| 18 to 34 Years | 0 (0.0%) | 0 (0.0%) |
| 35 to 64 Years | 0 (0.0%) | 36 (40.0%) |
| 65 to 74 Years | 0 (0.0%) | 0 (0.0%) |
| 75 Years and over | 0 (0.0%) | 0 (0.0%) |
Disability Class: Self-Care Difficulty
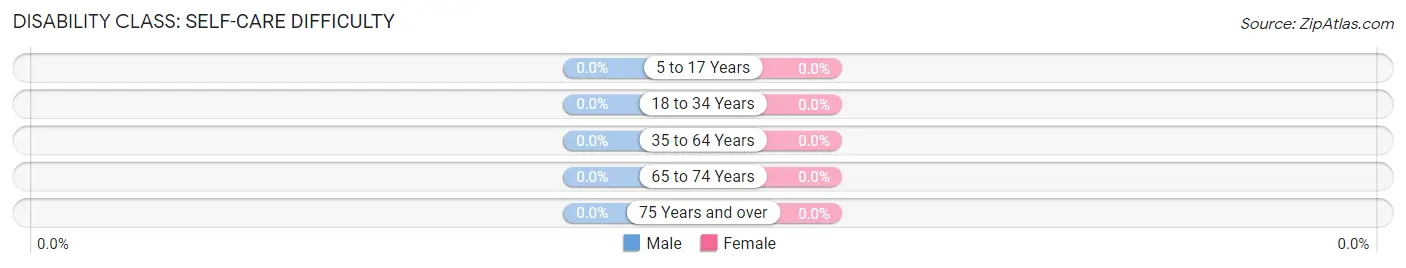
| Age Bracket | Male | Female |
| 5 to 17 Years | 0 (0.0%) | 0 (0.0%) |
| 18 to 34 Years | 0 (0.0%) | 0 (0.0%) |
| 35 to 64 Years | 0 (0.0%) | 0 (0.0%) |
| 65 to 74 Years | 0 (0.0%) | 0 (0.0%) |
| 75 Years and over | 0 (0.0%) | 0 (0.0%) |
Technology Access in Oswego
Computing Device Access in Oswego
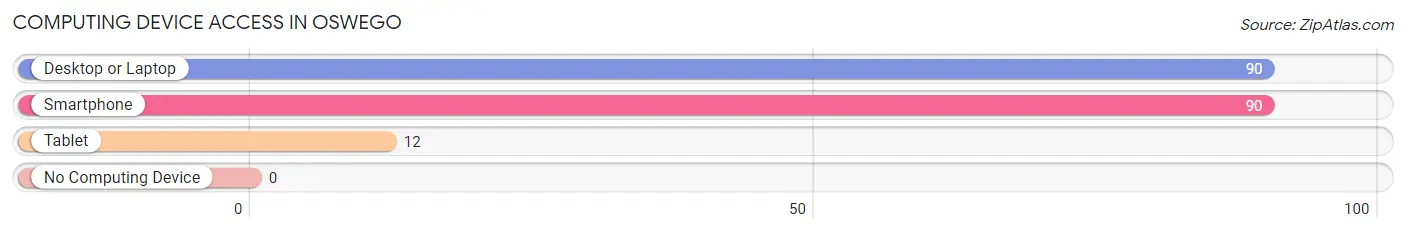
| Device Type | # Households | % Households |
| Desktop or Laptop | 90 | 100.0% |
| Smartphone | 90 | 100.0% |
| Tablet | 12 | 13.3% |
| No Computing Device | 0 | 0.0% |
| Total | 90 | 100.0% |
Internet Access in Oswego
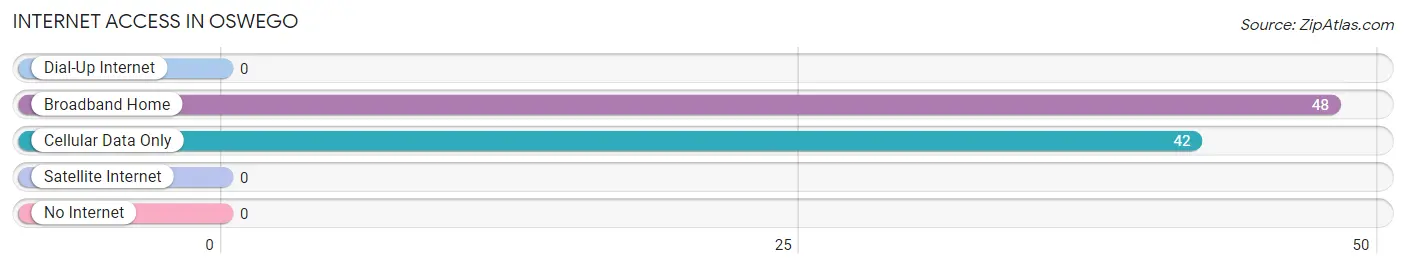
| Internet Type | # Households | % Households |
| Dial-Up Internet | 0 | 0.0% |
| Broadband Home | 48 | 53.3% |
| Cellular Data Only | 42 | 46.7% |
| Satellite Internet | 0 | 0.0% |
| No Internet | 0 | 0.0% |
| Total | 90 | 100.0% |
Oswego Summary
Oswego is a small town located in South Carolina, United States. It is situated in the northwestern corner of the state, near the border with North Carolina. The town is part of the Greenville-Spartanburg-Anderson metropolitan area. As of the 2010 census, the population of Oswego was 1,845.
History
Oswego was founded in 1820 by a group of settlers from New York. The town was named after the city of Oswego, New York. The settlers were attracted to the area due to its fertile soil and abundant natural resources. The town quickly grew and by the mid-1800s, it had become a thriving agricultural center.
In the late 1800s, the town began to experience a period of industrialization. The first cotton mill was built in 1887 and the town soon became a major producer of textiles. The town also became a center for the production of furniture and other wood products.
In the early 1900s, the town experienced a period of growth and prosperity. The population increased from 1,000 in 1900 to over 2,000 by the mid-1900s. The town also experienced a period of racial tension during this time. In the 1950s, the town was the site of a major civil rights protest.
Geography
Oswego is located in the northwestern corner of South Carolina, near the border with North Carolina. The town is situated in the foothills of the Blue Ridge Mountains. The town is located at an elevation of 890 feet above sea level.
The town is located in the Piedmont region of South Carolina. The climate is characterized by hot, humid summers and mild winters. The average annual temperature is around 70 degrees Fahrenheit.
Economy
Oswego’s economy is largely based on agriculture and manufacturing. The town is home to several large farms that produce a variety of crops, including corn, soybeans, and cotton. The town is also home to several furniture and wood product manufacturers.
The town is also home to several small businesses, including restaurants, retail stores, and service providers. The town is also home to a number of tourist attractions, including the Oswego Historical Museum and the Oswego Heritage Trail.
Demographics
As of the 2010 census, the population of Oswego was 1,845. The racial makeup of the town was 79.3% White, 16.2% African American, 0.3% Native American, 0.7% Asian, 0.1% Pacific Islander, and 3.4% from other races. The median household income was $37,917.
The town is home to a number of churches, including the First Baptist Church of Oswego, the Oswego United Methodist Church, and the Oswego Presbyterian Church. The town is also home to a number of schools, including Oswego Elementary School, Oswego Middle School, and Oswego High School.
Common Questions
What is Per Capita Income in Oswego?
Per Capita income in Oswego is $16,098.
What is the Median Family Income in Oswego?
Median Family Income in Oswego is $52,708.
What is the Median Household income in Oswego?
Median Household Income in Oswego is $52,708.
What is Inequality or Gini Index in Oswego?
Inequality or Gini Index in Oswego is 0.36.
What is the Total Population of Oswego?
Total Population of Oswego is 352.
What is the Total Male Population of Oswego?
Total Male Population of Oswego is 142.
What is the Total Female Population of Oswego?
Total Female Population of Oswego is 210.
What is the Ratio of Males per 100 Females in Oswego?
There are 67.62 Males per 100 Females in Oswego.
What is the Ratio of Females per 100 Males in Oswego?
There are 147.89 Females per 100 Males in Oswego.
What is the Median Population Age in Oswego?
Median Population Age in Oswego is 47.2 Years.
What is the Average Family Size in Oswego
Average Family Size in Oswego is 3.9 People.
What is the Average Household Size in Oswego
Average Household Size in Oswego is 3.9 People.
How Large is the Labor Force in Oswego?
There are 101 People in the Labor Forcein in Oswego.
What is the Percentage of People in the Labor Force in Oswego?
50.0% of People are in the Labor Force in Oswego.