Sunriver, OR Map & Demographics
Sunriver Map
Sunriver Overview
$80,857
PER CAPITA INCOME
$121,134
AVG FAMILY INCOME
$87,276
AVG HOUSEHOLD INCOME
34.7%
WAGE / INCOME GAP [ % ]
65.3¢/ $1
WAGE / INCOME GAP [ $ ]
0.48
INEQUALITY / GINI INDEX
1,516
TOTAL POPULATION
735
MALE POPULATION
781
FEMALE POPULATION
94.11
MALES / 100 FEMALES
106.26
FEMALES / 100 MALES
70.2
MEDIAN AGE
2.1
AVG FAMILY SIZE
1.8
AVG HOUSEHOLD SIZE
481
LABOR FORCE [ PEOPLE ]
31.7%
PERCENT IN LABOR FORCE
Sunriver Area Codes
Income in Sunriver
Income Overview in Sunriver
Per Capita Income in Sunriver is $80,857, while median incomes of families and households are $121,134 and $87,276 respectively.
| Characteristic | Number | Measure |
| Per Capita Income | 1,516 | $80,857 |
| Median Family Income | 505 | $121,134 |
| Mean Family Income | 505 | $188,977 |
| Median Household Income | 826 | $87,276 |
| Mean Household Income | 826 | $144,490 |
| Income Deficit | 505 | $0 |
| Wage / Income Gap (%) | 1,516 | 34.69% |
| Wage / Income Gap ($) | 1,516 | 65.31¢ per $1 |
| Gini / Inequality Index | 1,516 | 0.48 |
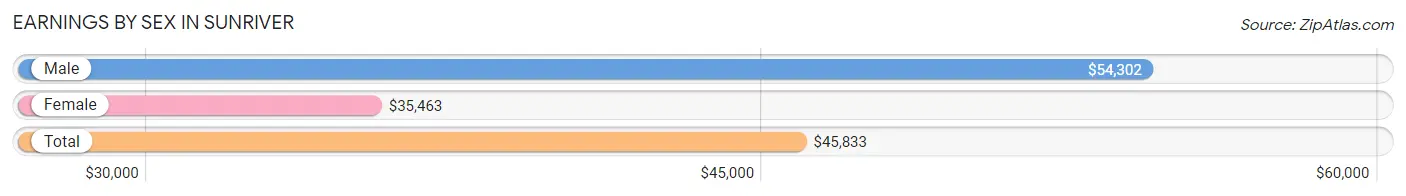
Earnings by Sex in Sunriver
Average Earnings in Sunriver are $45,833, $54,302 for men and $35,463 for women, a difference of 34.7%.
| Sex | Number | Average Earnings |
| Male | 300 (54.1%) | $54,302 |
| Female | 254 (45.9%) | $35,463 |
| Total | 554 (100.0%) | $45,833 |
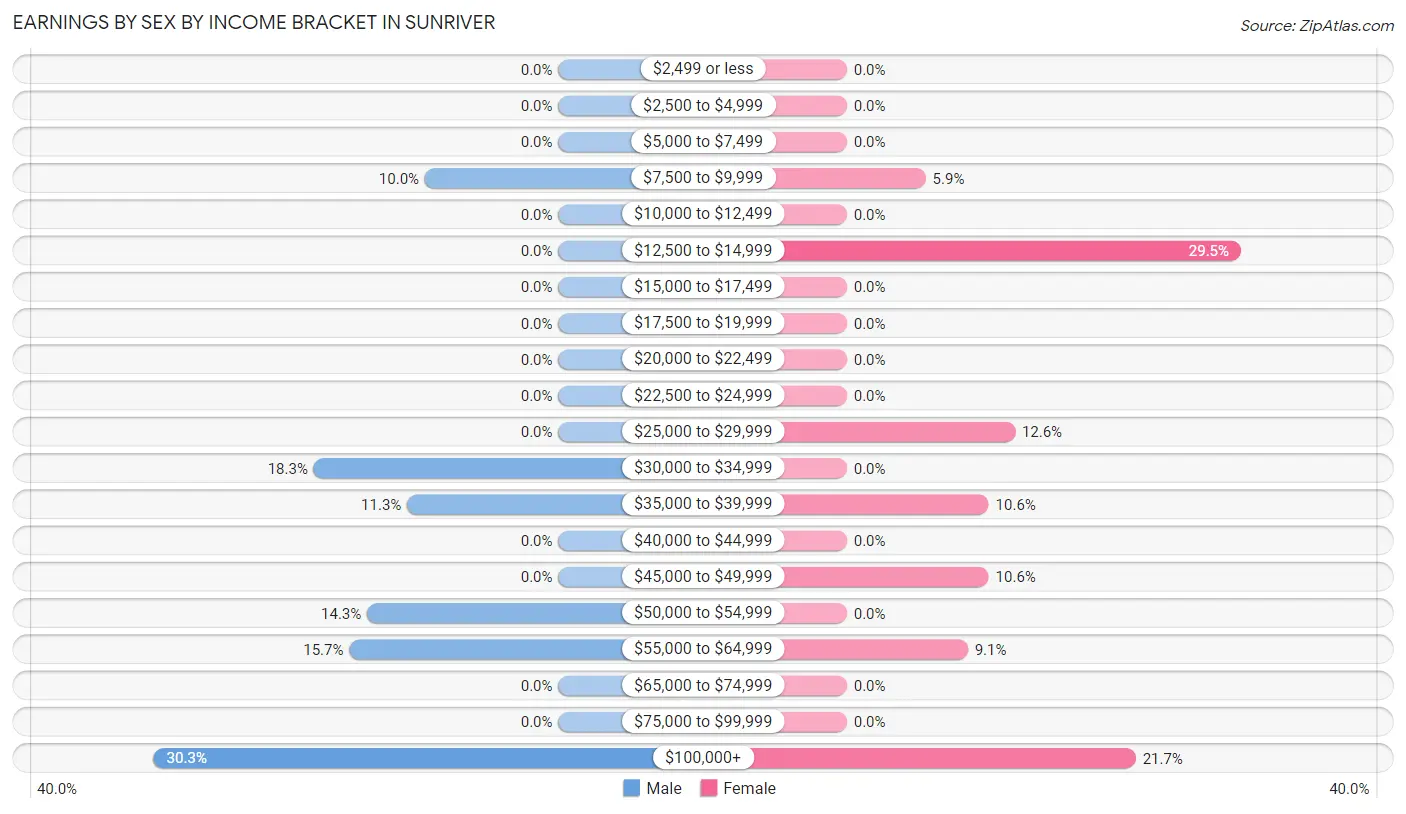
Earnings by Sex by Income Bracket in Sunriver
The most common earnings brackets in Sunriver are $100,000+ for men (91 | 30.3%) and $12,500 to $14,999 for women (75 | 29.5%).
| Income | Male | Female |
| $2,499 or less | 0 (0.0%) | 0 (0.0%) |
| $2,500 to $4,999 | 0 (0.0%) | 0 (0.0%) |
| $5,000 to $7,499 | 0 (0.0%) | 0 (0.0%) |
| $7,500 to $9,999 | 30 (10.0%) | 15 (5.9%) |
| $10,000 to $12,499 | 0 (0.0%) | 0 (0.0%) |
| $12,500 to $14,999 | 0 (0.0%) | 75 (29.5%) |
| $15,000 to $17,499 | 0 (0.0%) | 0 (0.0%) |
| $17,500 to $19,999 | 0 (0.0%) | 0 (0.0%) |
| $20,000 to $22,499 | 0 (0.0%) | 0 (0.0%) |
| $22,500 to $24,999 | 0 (0.0%) | 0 (0.0%) |
| $25,000 to $29,999 | 0 (0.0%) | 32 (12.6%) |
| $30,000 to $34,999 | 55 (18.3%) | 0 (0.0%) |
| $35,000 to $39,999 | 34 (11.3%) | 27 (10.6%) |
| $40,000 to $44,999 | 0 (0.0%) | 0 (0.0%) |
| $45,000 to $49,999 | 0 (0.0%) | 27 (10.6%) |
| $50,000 to $54,999 | 43 (14.3%) | 0 (0.0%) |
| $55,000 to $64,999 | 47 (15.7%) | 23 (9.1%) |
| $65,000 to $74,999 | 0 (0.0%) | 0 (0.0%) |
| $75,000 to $99,999 | 0 (0.0%) | 0 (0.0%) |
| $100,000+ | 91 (30.3%) | 55 (21.6%) |
| Total | 300 (100.0%) | 254 (100.0%) |
Earnings by Sex by Educational Attainment in Sunriver
| Educational Attainment | Male Income | Female Income |
| Less than High School | - | - |
| High School Diploma | - | - |
| College or Associate's Degree | - | - |
| Bachelor's Degree | - | - |
| Graduate Degree | - | - |
| Total | $54,302 | $0 |
Family Income in Sunriver
Family Income Brackets in Sunriver
According to the Sunriver family income data, there are 145 families falling into the $200,000+ income range, which is the most common income bracket and makes up 28.7% of all families.
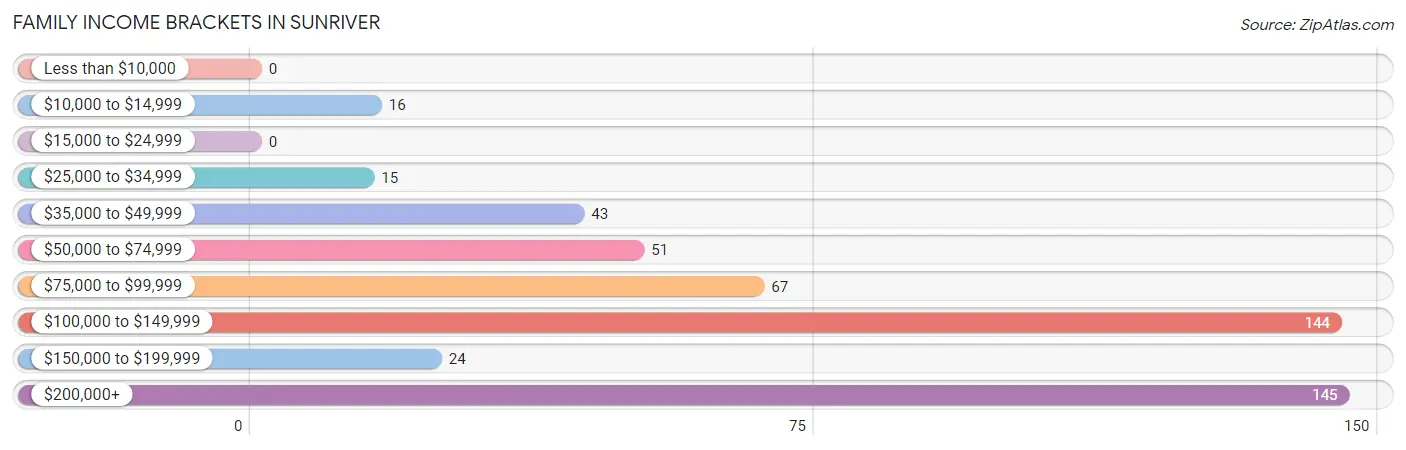
| Income Bracket | # Families | % Families |
| Less than $10,000 | 0 | 0.0% |
| $10,000 to $14,999 | 16 | 3.2% |
| $15,000 to $24,999 | 0 | 0.0% |
| $25,000 to $34,999 | 15 | 3.0% |
| $35,000 to $49,999 | 43 | 8.5% |
| $50,000 to $74,999 | 51 | 10.1% |
| $75,000 to $99,999 | 67 | 13.3% |
| $100,000 to $149,999 | 144 | 28.5% |
| $150,000 to $199,999 | 24 | 4.8% |
| $200,000+ | 145 | 28.7% |
Family Income by Famaliy Size in Sunriver
2-person families (455 | 90.1%) account for the highest median family income in Sunriver with $121,192 per family, while 2-person families (455 | 90.1%) have the highest median income of $60,596 per family member.
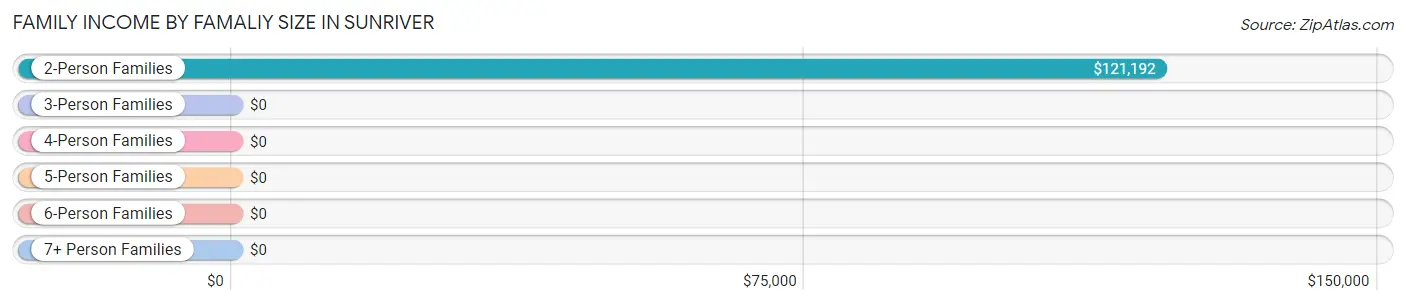
| Income Bracket | # Families | Median Income |
| 2-Person Families | 455 (90.1%) | $121,192 |
| 3-Person Families | 50 (9.9%) | $0 |
| 4-Person Families | 0 (0.0%) | $0 |
| 5-Person Families | 0 (0.0%) | $0 |
| 6-Person Families | 0 (0.0%) | $0 |
| 7+ Person Families | 0 (0.0%) | $0 |
| Total | 505 (100.0%) | $121,134 |
Family Income by Number of Earners in Sunriver
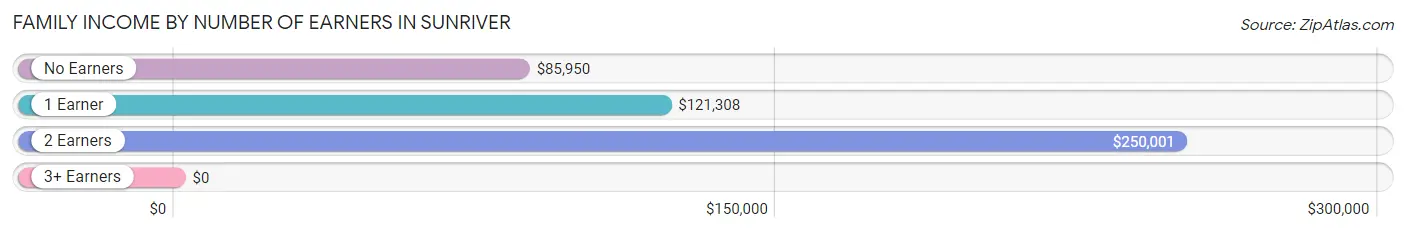
| Number of Earners | # Families | Median Income |
| No Earners | 258 (51.1%) | $85,950 |
| 1 Earner | 109 (21.6%) | $121,308 |
| 2 Earners | 138 (27.3%) | $250,001 |
| 3+ Earners | 0 (0.0%) | $0 |
| Total | 505 (100.0%) | $121,134 |
Household Income in Sunriver
Household Income Brackets in Sunriver
With 180 households falling in the category, the $100,000 to $149,999 income range is the most frequent in Sunriver, accounting for 21.8% of all households.
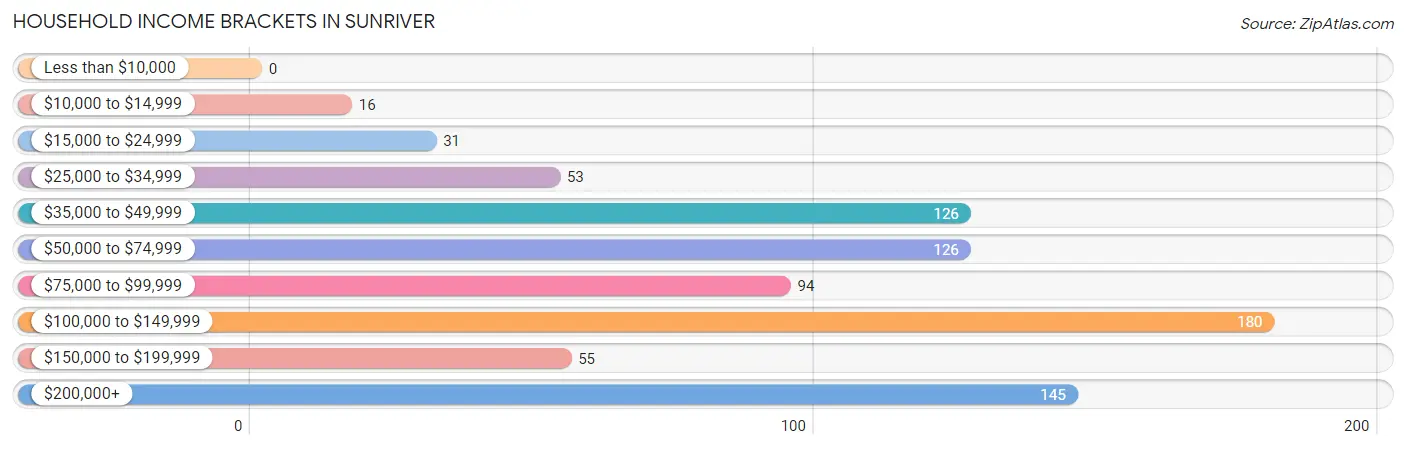
| Income Bracket | # Households | % Households |
| Less than $10,000 | 0 | 0.0% |
| $10,000 to $14,999 | 16 | 1.9% |
| $15,000 to $24,999 | 31 | 3.8% |
| $25,000 to $34,999 | 53 | 6.4% |
| $35,000 to $49,999 | 126 | 15.3% |
| $50,000 to $74,999 | 126 | 15.3% |
| $75,000 to $99,999 | 94 | 11.4% |
| $100,000 to $149,999 | 180 | 21.8% |
| $150,000 to $199,999 | 55 | 6.7% |
| $200,000+ | 145 | 17.6% |
Household Income by Householder Age in Sunriver
The median household income in Sunriver is $87,276, with the highest median household income of $184,355 found in the 45 to 64 years age bracket for the primary householder. A total of 198 households (24.0%) fall into this category. Meanwhile, the 15 to 24 years age bracket for the primary householder has the lowest median household income of $0, with 26 households (3.2%) in this group.
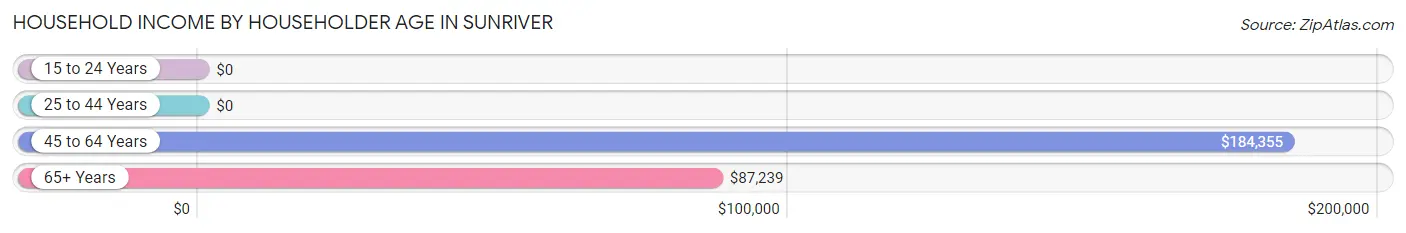
| Income Bracket | # Households | Median Income |
| 15 to 24 Years | 26 (3.2%) | $0 |
| 25 to 44 Years | 72 (8.7%) | $0 |
| 45 to 64 Years | 198 (24.0%) | $184,355 |
| 65+ Years | 530 (64.2%) | $87,239 |
| Total | 826 (100.0%) | $87,276 |
Poverty in Sunriver
Income Below Poverty by Sex and Age in Sunriver
With 2.3% poverty level for males and 8.5% for females among the residents of Sunriver, 75 year old and over males and 55 to 64 year old females are the most vulnerable to poverty, with 17 males (8.2%) and 49 females (22.2%) in their respective age groups living below the poverty level.
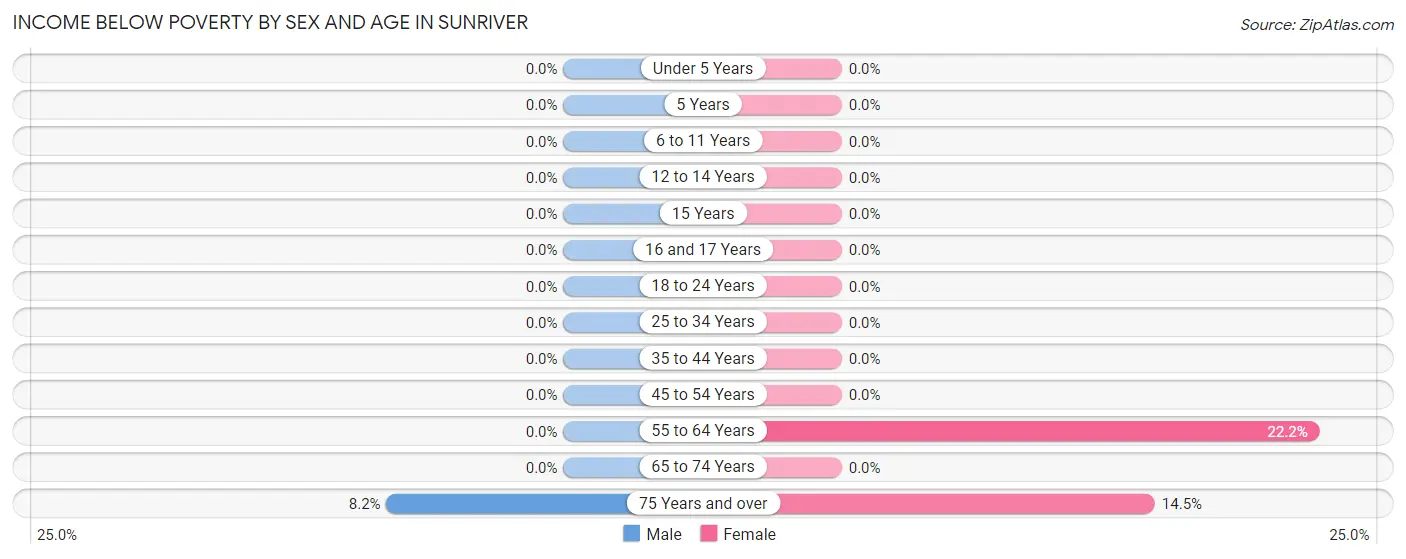
| Age Bracket | Male | Female |
| Under 5 Years | 0 (0.0%) | 0 (0.0%) |
| 5 Years | 0 (0.0%) | 0 (0.0%) |
| 6 to 11 Years | 0 (0.0%) | 0 (0.0%) |
| 12 to 14 Years | 0 (0.0%) | 0 (0.0%) |
| 15 Years | 0 (0.0%) | 0 (0.0%) |
| 16 and 17 Years | 0 (0.0%) | 0 (0.0%) |
| 18 to 24 Years | 0 (0.0%) | 0 (0.0%) |
| 25 to 34 Years | 0 (0.0%) | 0 (0.0%) |
| 35 to 44 Years | 0 (0.0%) | 0 (0.0%) |
| 45 to 54 Years | 0 (0.0%) | 0 (0.0%) |
| 55 to 64 Years | 0 (0.0%) | 49 (22.2%) |
| 65 to 74 Years | 0 (0.0%) | 0 (0.0%) |
| 75 Years and over | 17 (8.2%) | 17 (14.5%) |
| Total | 17 (2.3%) | 66 (8.5%) |
Income Above Poverty by Sex and Age in Sunriver
According to the poverty statistics in Sunriver, males aged 18 to 24 years and females aged 18 to 24 years are the age groups that are most secure financially, with 100.0% of males and 100.0% of females in these age groups living above the poverty line.
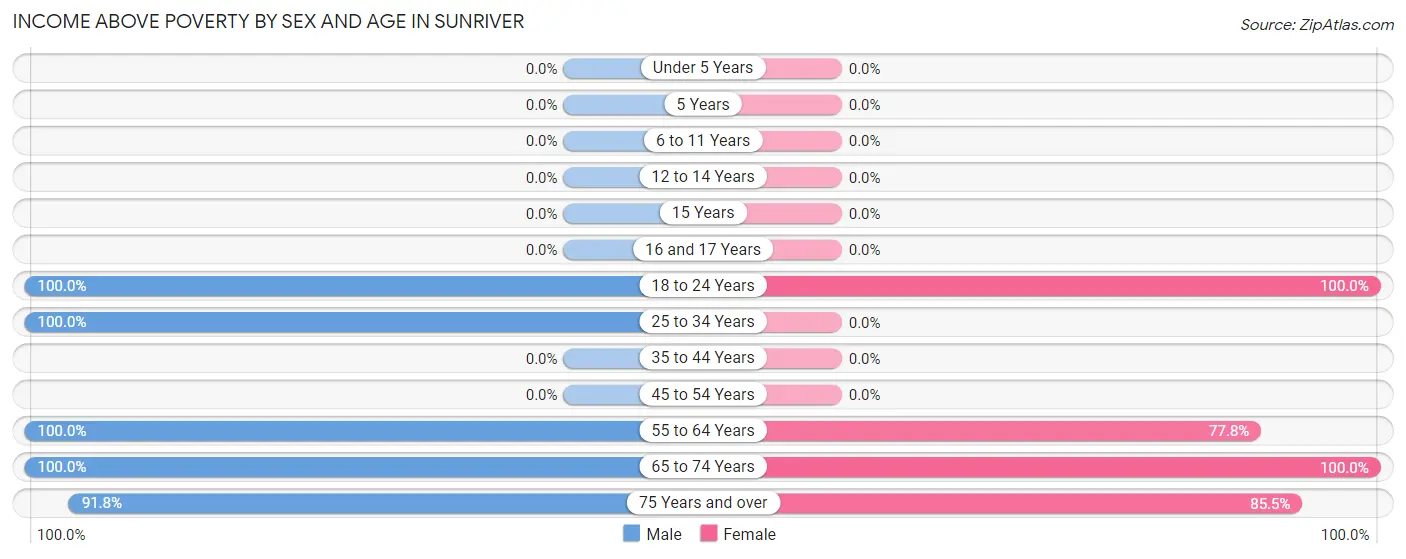
| Age Bracket | Male | Female |
| Under 5 Years | 0 (0.0%) | 0 (0.0%) |
| 5 Years | 0 (0.0%) | 0 (0.0%) |
| 6 to 11 Years | 0 (0.0%) | 0 (0.0%) |
| 12 to 14 Years | 0 (0.0%) | 0 (0.0%) |
| 15 Years | 0 (0.0%) | 0 (0.0%) |
| 16 and 17 Years | 0 (0.0%) | 0 (0.0%) |
| 18 to 24 Years | 26 (100.0%) | 32 (100.0%) |
| 25 to 34 Years | 72 (100.0%) | 0 (0.0%) |
| 35 to 44 Years | 0 (0.0%) | 0 (0.0%) |
| 45 to 54 Years | 0 (0.0%) | 0 (0.0%) |
| 55 to 64 Years | 200 (100.0%) | 172 (77.8%) |
| 65 to 74 Years | 230 (100.0%) | 411 (100.0%) |
| 75 Years and over | 190 (91.8%) | 100 (85.5%) |
| Total | 718 (97.7%) | 715 (91.5%) |
Income Below Poverty Among Married-Couple Families in Sunriver
The poverty statistics for married-couple families in Sunriver show that 3.3% or 16 of the total 479 families live below the poverty line. Families with no children have the highest poverty rate of 3.3%, comprising of 16 families. On the other hand, families with no children have the lowest poverty rate of 3.3%, which includes 16 families.
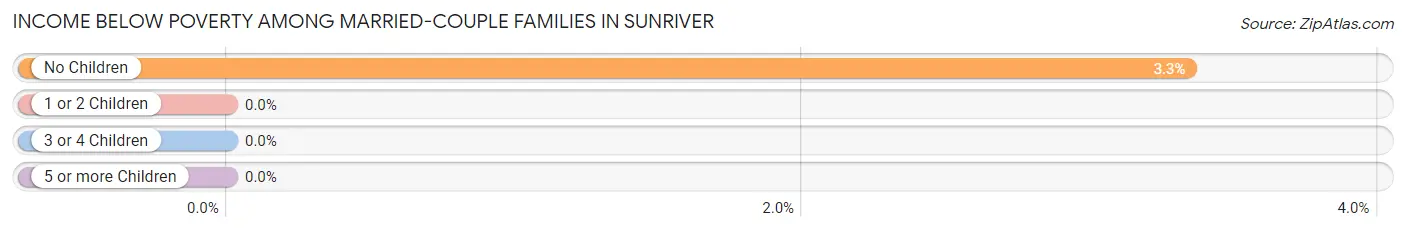
| Children | Above Poverty | Below Poverty |
| No Children | 463 (96.7%) | 16 (3.3%) |
| 1 or 2 Children | 0 (0.0%) | 0 (0.0%) |
| 3 or 4 Children | 0 (0.0%) | 0 (0.0%) |
| 5 or more Children | 0 (0.0%) | 0 (0.0%) |
| Total | 463 (96.7%) | 16 (3.3%) |
Income Below Poverty Among Single-Parent Households in Sunriver
| Children | Single Father | Single Mother |
| No Children | 0 (0.0%) | 0 (0.0%) |
| 1 or 2 Children | 0 (0.0%) | 0 (0.0%) |
| 3 or 4 Children | 0 (0.0%) | 0 (0.0%) |
| 5 or more Children | 0 (0.0%) | 0 (0.0%) |
| Total | 0 (0.0%) | 0 (0.0%) |
Income Below Poverty Among Married-Couple vs Single-Parent Households in Sunriver
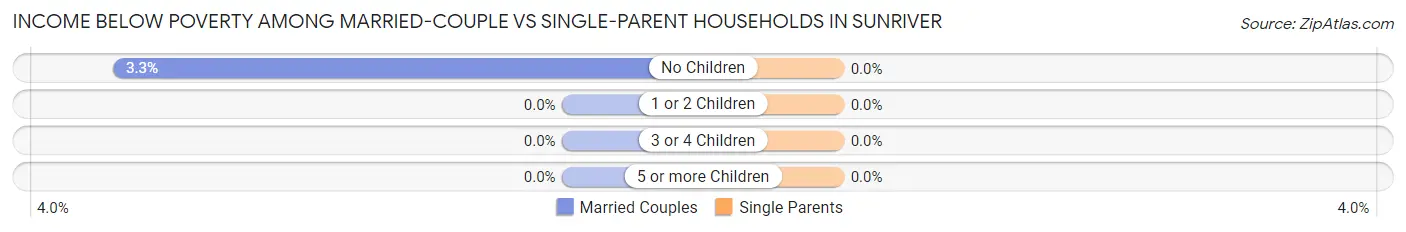
| Children | Married-Couple Families | Single-Parent Households |
| No Children | 16 (3.3%) | 0 (0.0%) |
| 1 or 2 Children | 0 (0.0%) | 0 (0.0%) |
| 3 or 4 Children | 0 (0.0%) | 0 (0.0%) |
| 5 or more Children | 0 (0.0%) | 0 (0.0%) |
| Total | 16 (3.3%) | 0 (0.0%) |
Race in Sunriver
The most populous races in Sunriver are , and White / Caucasian (1,516 | 100.0%).
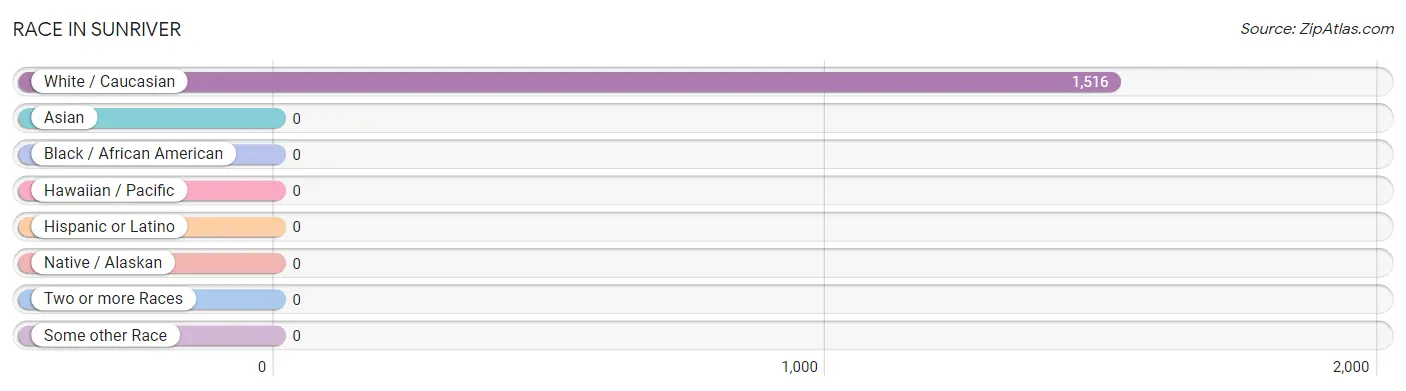
| Race | # Population | % Population |
| Asian | 0 | 0.0% |
| Black / African American | 0 | 0.0% |
| Hawaiian / Pacific | 0 | 0.0% |
| Hispanic or Latino | 0 | 0.0% |
| Native / Alaskan | 0 | 0.0% |
| White / Caucasian | 1,516 | 100.0% |
| Two or more Races | 0 | 0.0% |
| Some other Race | 0 | 0.0% |
| Total | 1,516 | 100.0% |
Ancestry in Sunriver
The most populous ancestries reported in Sunriver are German (362 | 23.9%), English (295 | 19.5%), Irish (187 | 12.3%), American (126 | 8.3%), and Scandinavian (98 | 6.5%), together accounting for 70.4% of all Sunriver residents.
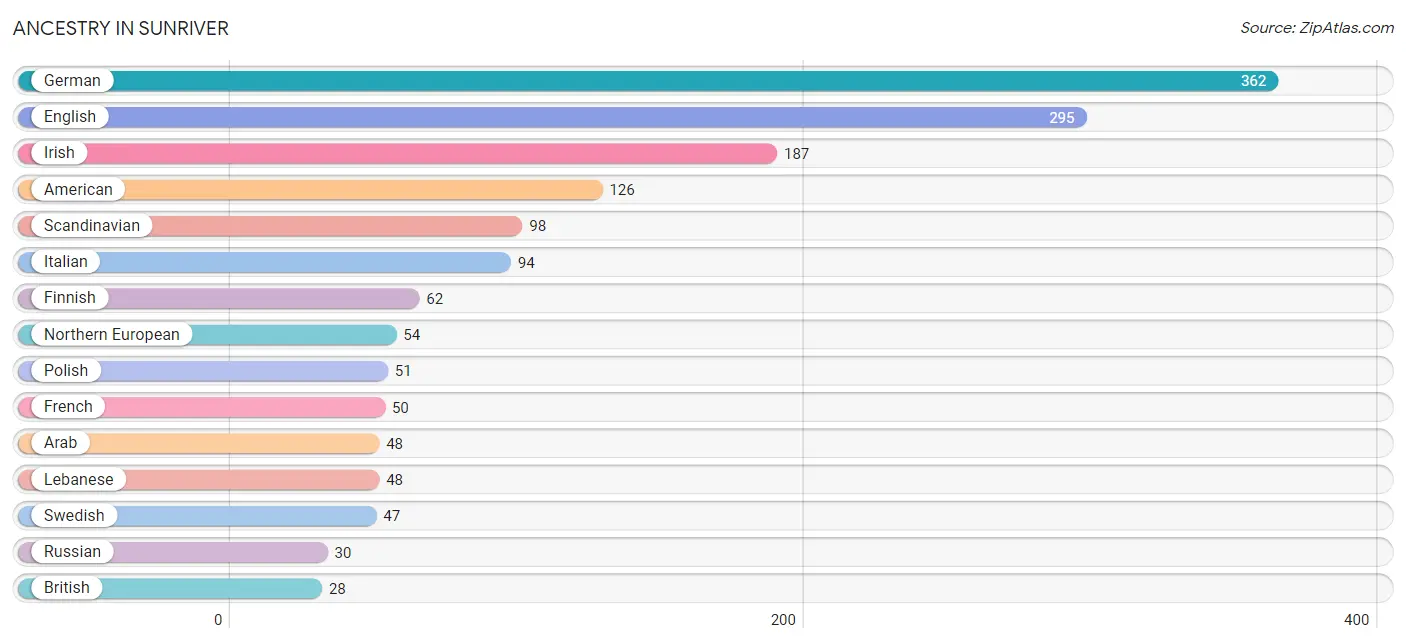
| Ancestry | # Population | % Population |
| American | 126 | 8.3% |
| Arab | 48 | 3.2% |
| British | 28 | 1.8% |
| Danish | 14 | 0.9% |
| English | 295 | 19.5% |
| Finnish | 62 | 4.1% |
| French | 50 | 3.3% |
| German | 362 | 23.9% |
| Irish | 187 | 12.3% |
| Italian | 94 | 6.2% |
| Lebanese | 48 | 3.2% |
| Northern European | 54 | 3.6% |
| Norwegian | 17 | 1.1% |
| Polish | 51 | 3.4% |
| Russian | 30 | 2.0% |
| Scandinavian | 98 | 6.5% |
| Scottish | 22 | 1.5% |
| Swedish | 47 | 3.1% | View All 18 Rows |
Immigrants in Sunriver
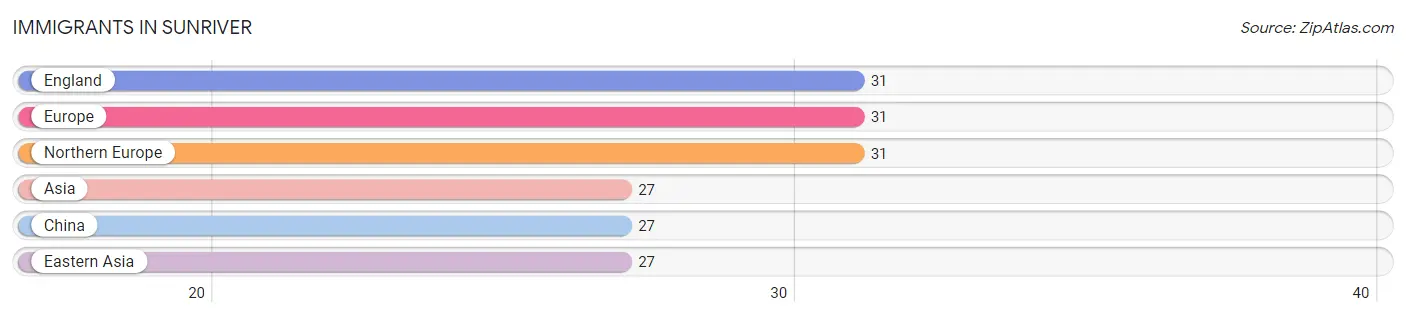
The most numerous immigrant groups reported in Sunriver came from England (31 | 2.0%), Europe (31 | 2.0%), Northern Europe (31 | 2.0%), Asia (27 | 1.8%), and China (27 | 1.8%), together accounting for 9.7% of all Sunriver residents.
| Immigration Origin | # Population | % Population |
| Asia | 27 | 1.8% |
| China | 27 | 1.8% |
| Eastern Asia | 27 | 1.8% |
| England | 31 | 2.0% |
| Europe | 31 | 2.0% |
| Northern Europe | 31 | 2.0% | View All 6 Rows |
Sex and Age in Sunriver
Sex and Age in Sunriver
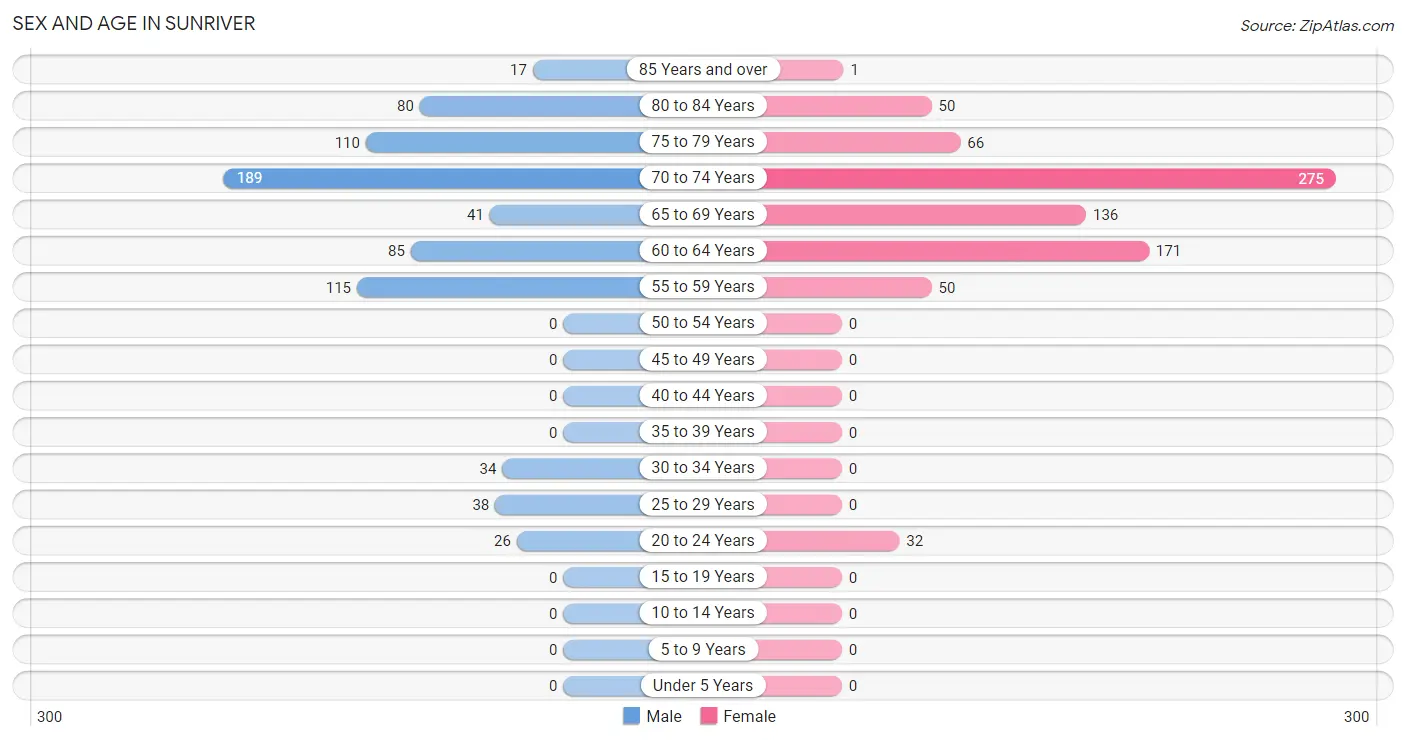
The most populous age groups in Sunriver are 70 to 74 Years (189 | 25.7%) for men and 70 to 74 Years (275 | 35.2%) for women.
| Age Bracket | Male | Female |
| Under 5 Years | 0 (0.0%) | 0 (0.0%) |
| 5 to 9 Years | 0 (0.0%) | 0 (0.0%) |
| 10 to 14 Years | 0 (0.0%) | 0 (0.0%) |
| 15 to 19 Years | 0 (0.0%) | 0 (0.0%) |
| 20 to 24 Years | 26 (3.5%) | 32 (4.1%) |
| 25 to 29 Years | 38 (5.2%) | 0 (0.0%) |
| 30 to 34 Years | 34 (4.6%) | 0 (0.0%) |
| 35 to 39 Years | 0 (0.0%) | 0 (0.0%) |
| 40 to 44 Years | 0 (0.0%) | 0 (0.0%) |
| 45 to 49 Years | 0 (0.0%) | 0 (0.0%) |
| 50 to 54 Years | 0 (0.0%) | 0 (0.0%) |
| 55 to 59 Years | 115 (15.7%) | 50 (6.4%) |
| 60 to 64 Years | 85 (11.6%) | 171 (21.9%) |
| 65 to 69 Years | 41 (5.6%) | 136 (17.4%) |
| 70 to 74 Years | 189 (25.7%) | 275 (35.2%) |
| 75 to 79 Years | 110 (15.0%) | 66 (8.5%) |
| 80 to 84 Years | 80 (10.9%) | 50 (6.4%) |
| 85 Years and over | 17 (2.3%) | 1 (0.1%) |
| Total | 735 (100.0%) | 781 (100.0%) |
Families and Households in Sunriver
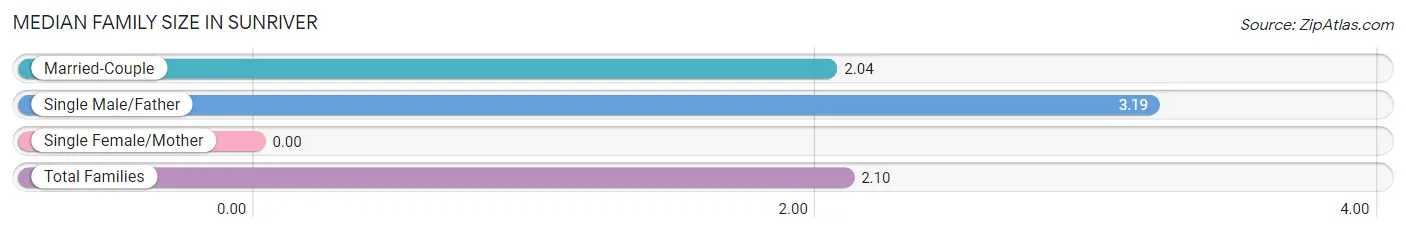
Median Family Size in Sunriver
| Family Type | # Families | Family Size |
| Married-Couple | 479 (94.9%) | 2.04 |
| Single Male/Father | 26 (5.1%) | 3.19 |
| Single Female/Mother | 0 (0.0%) | - |
| Total Families | 505 (100.0%) | 2.10 |
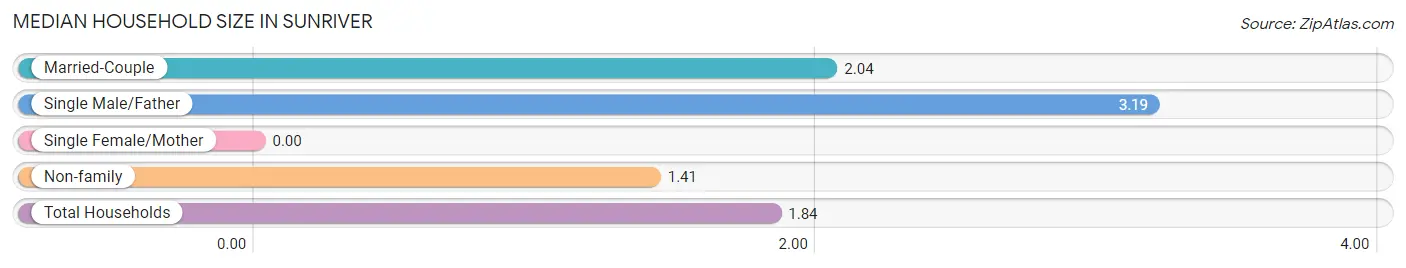
Median Household Size in Sunriver
| Household Type | # Households | Household Size |
| Married-Couple | 479 (58.0%) | 2.04 |
| Single Male/Father | 26 (3.2%) | 3.19 |
| Single Female/Mother | 0 (0.0%) | - |
| Non-family | 321 (38.9%) | 1.41 |
| Total Households | 826 (100.0%) | 1.84 |
Household Size by Marriage Status in Sunriver
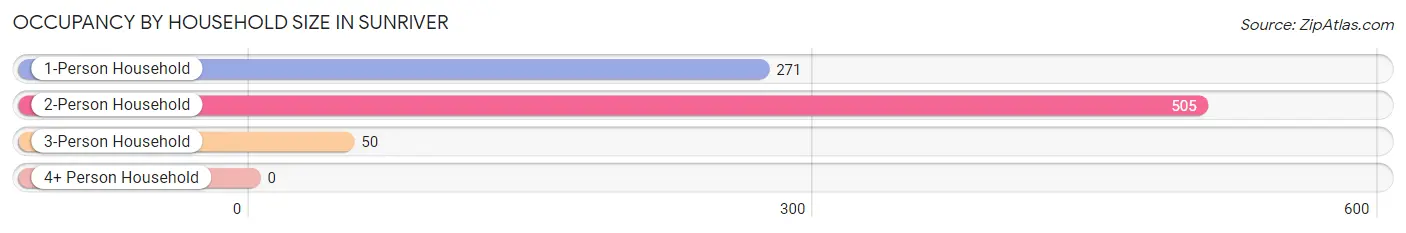
Out of a total of 826 households in Sunriver, 505 (61.1%) are family households, while 321 (38.9%) are nonfamily households. The most numerous type of family households are 2-person households, comprising 455, and the most common type of nonfamily households are 1-person households, comprising 271.
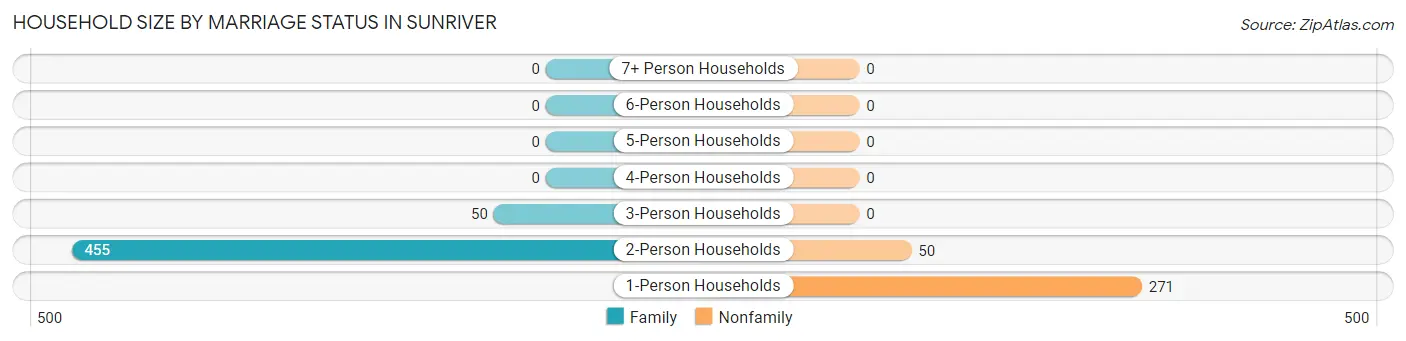
| Household Size | Family Households | Nonfamily Households |
| 1-Person Households | - | 271 (32.8%) |
| 2-Person Households | 455 (55.1%) | 50 (6.0%) |
| 3-Person Households | 50 (6.0%) | 0 (0.0%) |
| 4-Person Households | 0 (0.0%) | 0 (0.0%) |
| 5-Person Households | 0 (0.0%) | 0 (0.0%) |
| 6-Person Households | 0 (0.0%) | 0 (0.0%) |
| 7+ Person Households | 0 (0.0%) | 0 (0.0%) |
| Total | 505 (61.1%) | 321 (38.9%) |
Female Fertility in Sunriver
Fertility by Age in Sunriver
| Age Bracket | Women with Births | Births / 1,000 Women |
| 15 to 19 years | 0 (0.0%) | 0.0 |
| 20 to 34 years | 0 (0.0%) | 0.0 |
| 35 to 50 years | 0 (0.0%) | 0.0 |
| Total | 0 (0.0%) | 0.0 |
Fertility by Age by Marriage Status in Sunriver
| Age Bracket | Married | Unmarried |
| 15 to 19 years | 0 (0.0%) | 0 (0.0%) |
| 20 to 34 years | 0 (0.0%) | 0 (0.0%) |
| 35 to 50 years | 0 (0.0%) | 0 (0.0%) |
| Total | 0 (0.0%) | 0 (0.0%) |
Fertility by Education in Sunriver
| Educational Attainment | Women with Births | Births / 1,000 Women |
| Less than High School | 0 (0.0%) | 0.0 |
| High School Diploma | 0 (0.0%) | 0.0 |
| College or Associate's Degree | 0 (0.0%) | 0.0 |
| Bachelor's Degree | 0 (0.0%) | 0.0 |
| Graduate Degree | 0 (0.0%) | 0.0 |
| Total | 0 (0.0%) | 0.0 |
Fertility by Education by Marriage Status in Sunriver
| Educational Attainment | Married | Unmarried |
| Less than High School | 0 (0.0%) | 0 (0.0%) |
| High School Diploma | 0 (0.0%) | 0 (0.0%) |
| College or Associate's Degree | 0 (0.0%) | 0 (0.0%) |
| Bachelor's Degree | 0 (0.0%) | 0 (0.0%) |
| Graduate Degree | 0 (0.0%) | 0 (0.0%) |
| Total | 0 (0.0%) | 0 (0.0%) |
Employment Characteristics in Sunriver
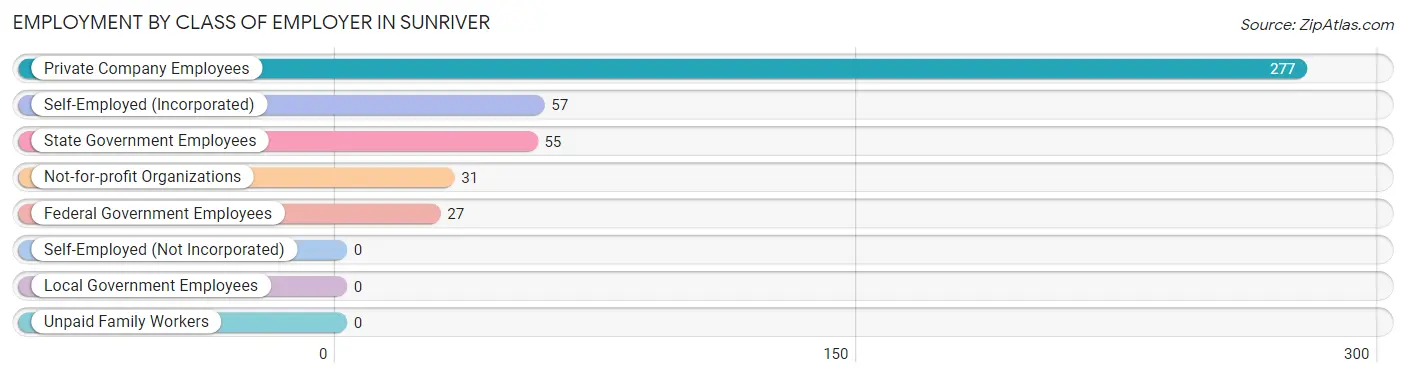
Employment by Class of Employer in Sunriver
Among the 447 employed individuals in Sunriver, private company employees (277 | 62.0%), self-employed (incorporated) (57 | 12.8%), and state government employees (55 | 12.3%) make up the most common classes of employment.
| Employer Class | # Employees | % Employees |
| Private Company Employees | 277 | 62.0% |
| Self-Employed (Incorporated) | 57 | 12.8% |
| Self-Employed (Not Incorporated) | 0 | 0.0% |
| Not-for-profit Organizations | 31 | 6.9% |
| Local Government Employees | 0 | 0.0% |
| State Government Employees | 55 | 12.3% |
| Federal Government Employees | 27 | 6.0% |
| Unpaid Family Workers | 0 | 0.0% |
| Total | 447 | 100.0% |
Employment Status by Age in Sunriver
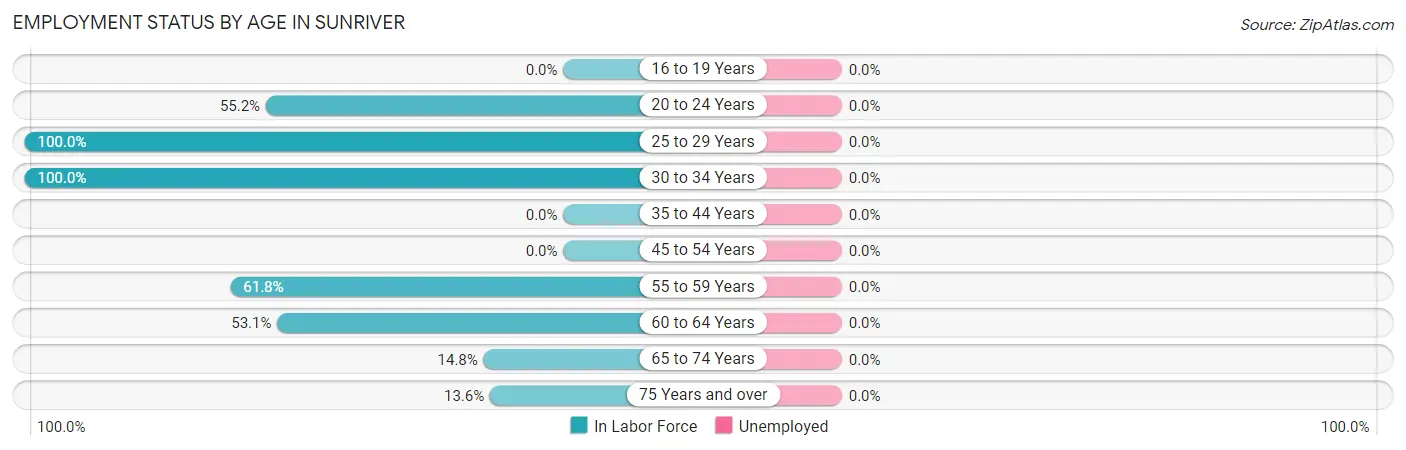
| Age Bracket | In Labor Force | Unemployed |
| 16 to 19 Years | 0 (0.0%) | 0 (0.0%) |
| 20 to 24 Years | 32 (55.2%) | 0 (0.0%) |
| 25 to 29 Years | 38 (100.0%) | 0 (0.0%) |
| 30 to 34 Years | 34 (100.0%) | 0 (0.0%) |
| 35 to 44 Years | 0 (0.0%) | 0 (0.0%) |
| 45 to 54 Years | 0 (0.0%) | 0 (0.0%) |
| 55 to 59 Years | 102 (61.8%) | 0 (0.0%) |
| 60 to 64 Years | 136 (53.1%) | 0 (0.0%) |
| 65 to 74 Years | 95 (14.8%) | 0 (0.0%) |
| 75 Years and over | 44 (13.6%) | 0 (0.0%) |
| Total | 481 (31.7%) | 0 (0.0%) |
Employment Status by Educational Attainment in Sunriver
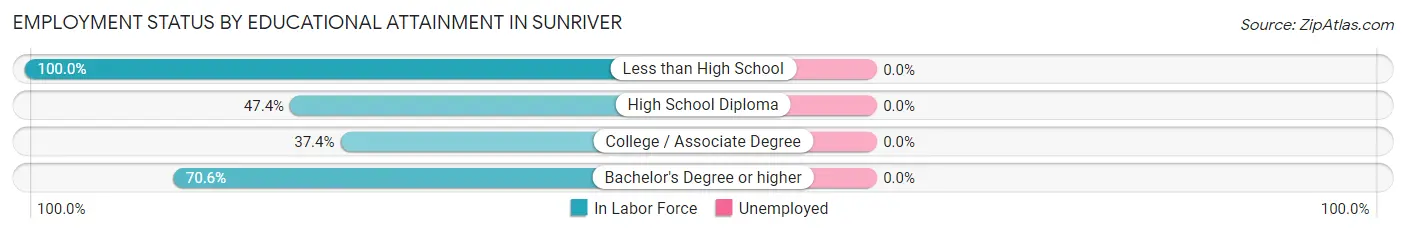
| Educational Attainment | In Labor Force | Unemployed |
| Less than High School | 28 (100.0%) | 0 (0.0%) |
| High School Diploma | 27 (47.4%) | 0 (0.0%) |
| College / Associate Degree | 37 (37.4%) | 0 (0.0%) |
| Bachelor's Degree or higher | 218 (70.6%) | 0 (0.0%) |
| Total | 310 (62.9%) | 0 (0.0%) |
Employment Occupations by Sex in Sunriver
Management, Business, Science and Arts Occupations
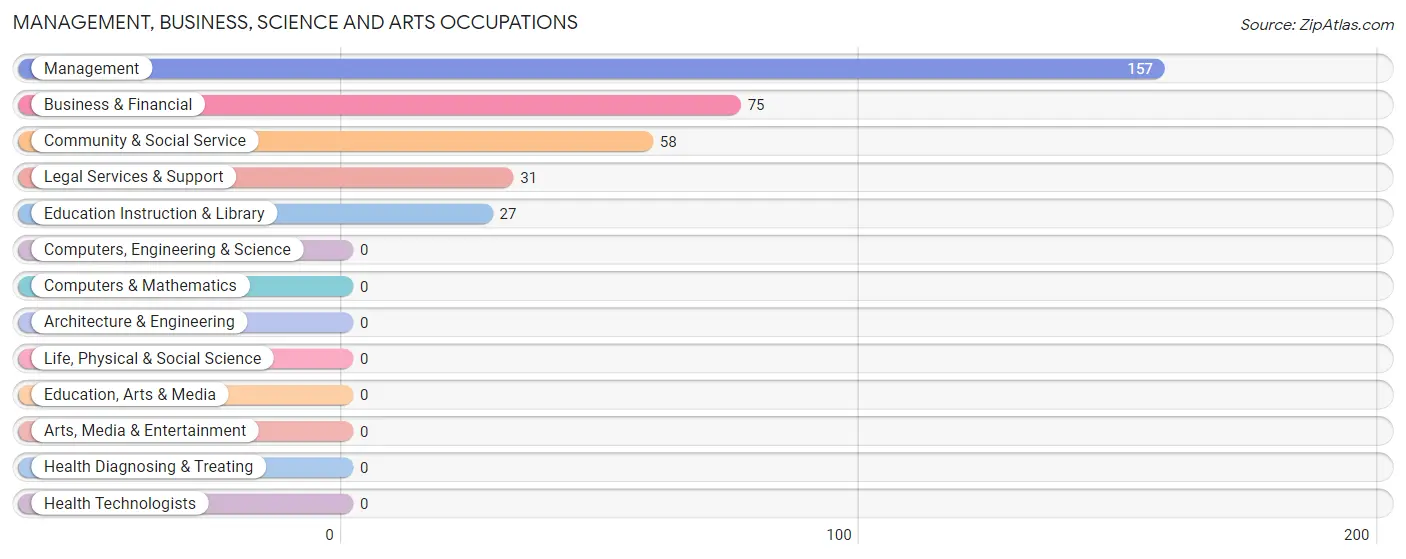
The most common Management, Business, Science and Arts occupations in Sunriver are Management (157 | 32.6%), Business & Financial (75 | 15.6%), Community & Social Service (58 | 12.1%), Legal Services & Support (31 | 6.4%), and Education Instruction & Library (27 | 5.6%).
Management, Business, Science and Arts Occupations by Sex
| Occupation | Male | Female |
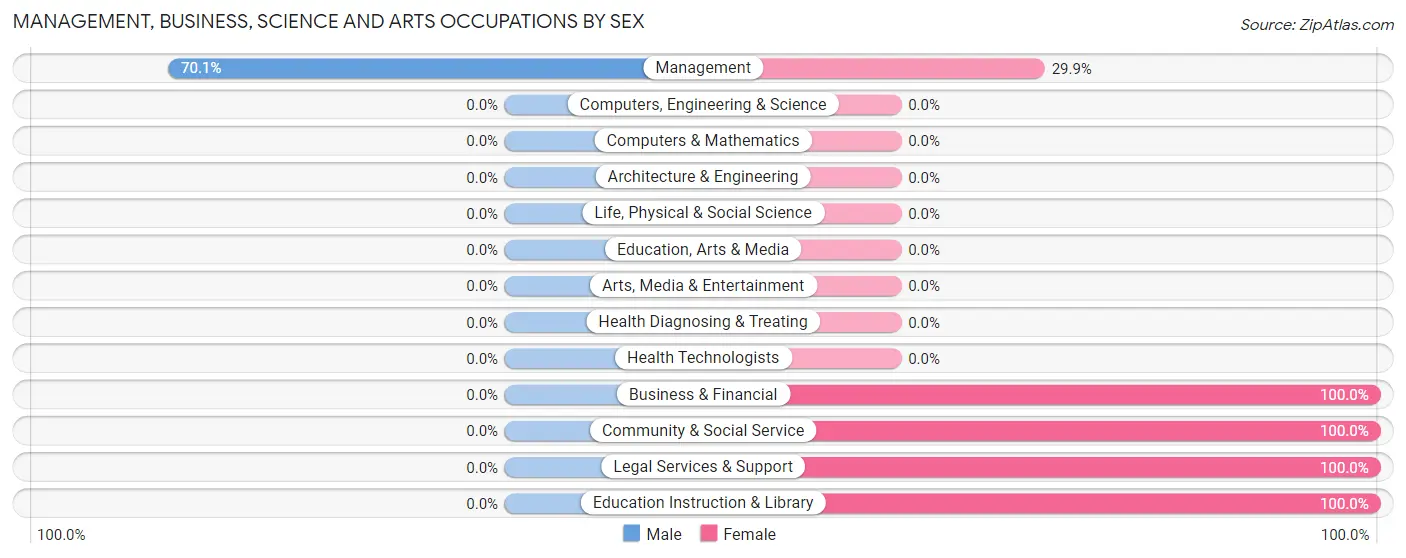
| Management | 110 (70.1%) | 47 (29.9%) |
| Business & Financial | 0 (0.0%) | 75 (100.0%) |
| Computers, Engineering & Science | 0 (0.0%) | 0 (0.0%) |
| Computers & Mathematics | 0 (0.0%) | 0 (0.0%) |
| Architecture & Engineering | 0 (0.0%) | 0 (0.0%) |
| Life, Physical & Social Science | 0 (0.0%) | 0 (0.0%) |
| Community & Social Service | 0 (0.0%) | 58 (100.0%) |
| Education, Arts & Media | 0 (0.0%) | 0 (0.0%) |
| Legal Services & Support | 0 (0.0%) | 31 (100.0%) |
| Education Instruction & Library | 0 (0.0%) | 27 (100.0%) |
| Arts, Media & Entertainment | 0 (0.0%) | 0 (0.0%) |
| Health Diagnosing & Treating | 0 (0.0%) | 0 (0.0%) |
| Health Technologists | 0 (0.0%) | 0 (0.0%) |
| Total (Category) | 110 (37.9%) | 180 (62.1%) |
| Total (Overall) | 227 (47.2%) | 254 (52.8%) |
Services Occupations
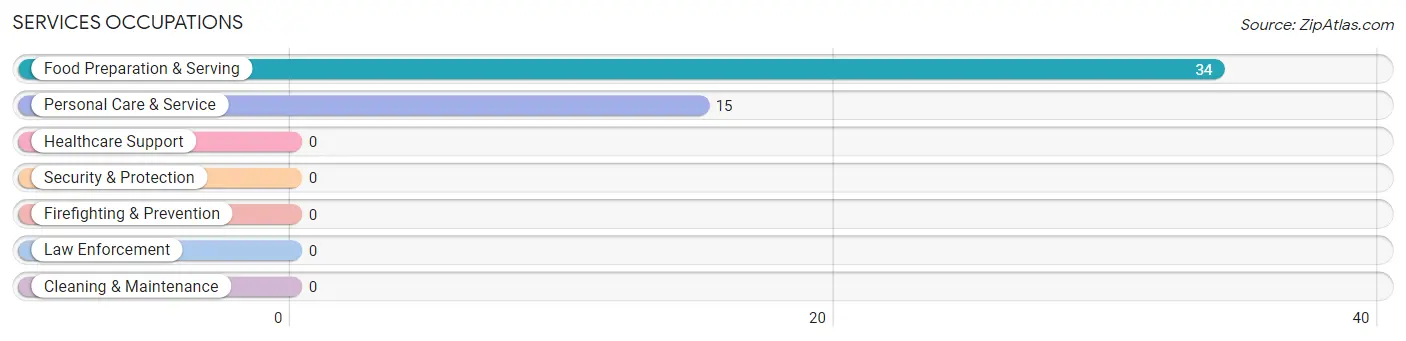
The most common Services occupations in Sunriver are Food Preparation & Serving (34 | 7.1%), and Personal Care & Service (15 | 3.1%).
Services Occupations by Sex
| Occupation | Male | Female |
| Healthcare Support | 0 (0.0%) | 0 (0.0%) |
| Security & Protection | 0 (0.0%) | 0 (0.0%) |
| Firefighting & Prevention | 0 (0.0%) | 0 (0.0%) |
| Law Enforcement | 0 (0.0%) | 0 (0.0%) |
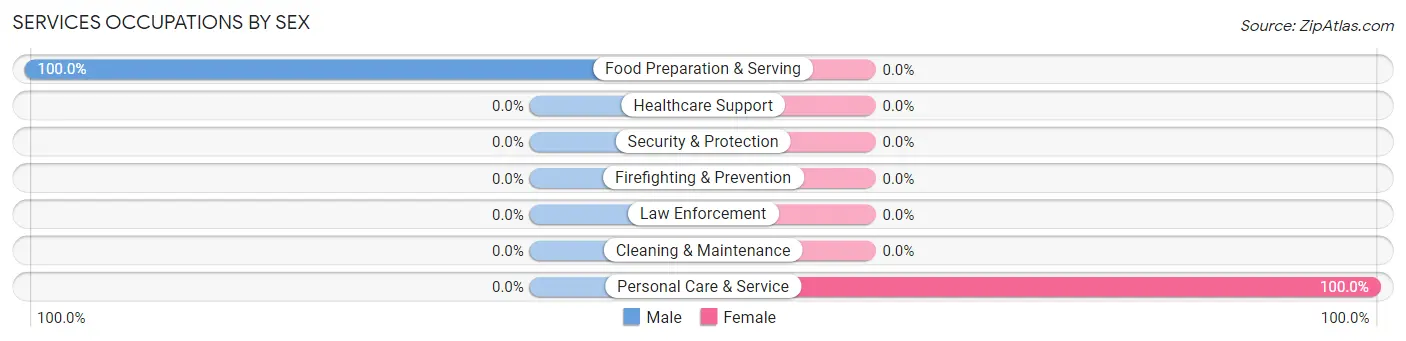
| Food Preparation & Serving | 34 (100.0%) | 0 (0.0%) |
| Cleaning & Maintenance | 0 (0.0%) | 0 (0.0%) |
| Personal Care & Service | 0 (0.0%) | 15 (100.0%) |
| Total (Category) | 34 (69.4%) | 15 (30.6%) |
| Total (Overall) | 227 (47.2%) | 254 (52.8%) |
Sales and Office Occupations
The most common Sales and Office occupations in Sunriver are Sales & Related (55 | 11.4%), and Office & Administration (27 | 5.6%).
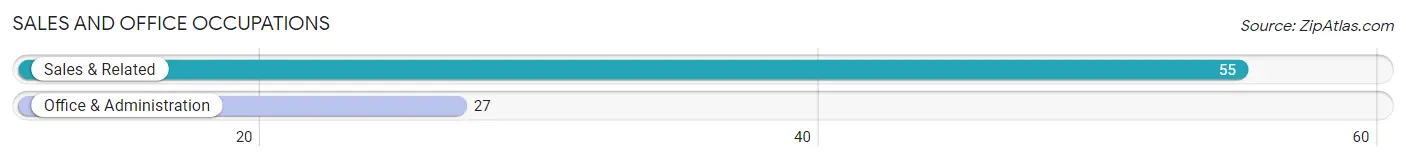
Sales and Office Occupations by Sex
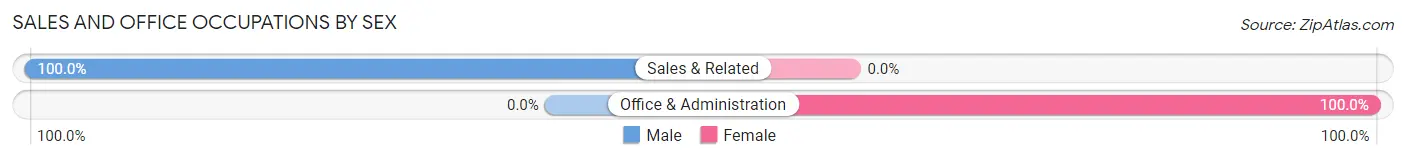
| Occupation | Male | Female |
| Sales & Related | 55 (100.0%) | 0 (0.0%) |
| Office & Administration | 0 (0.0%) | 27 (100.0%) |
| Total (Category) | 55 (67.1%) | 27 (32.9%) |
| Total (Overall) | 227 (47.2%) | 254 (52.8%) |
Natural Resources, Construction and Maintenance Occupations
The most common Natural Resources, Construction and Maintenance occupations in Sunriver are , and Farming, Fishing & Forestry (28 | 5.8%).
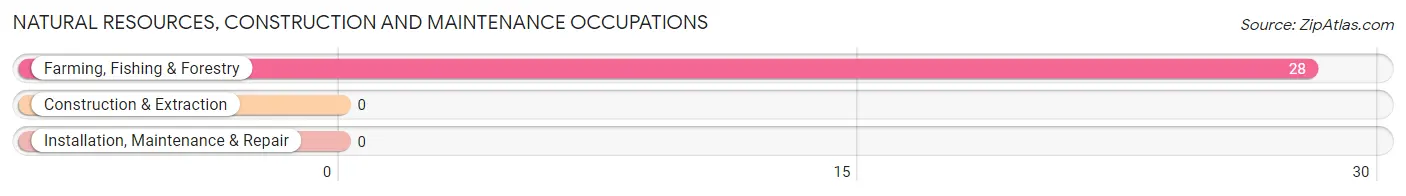
Natural Resources, Construction and Maintenance Occupations by Sex
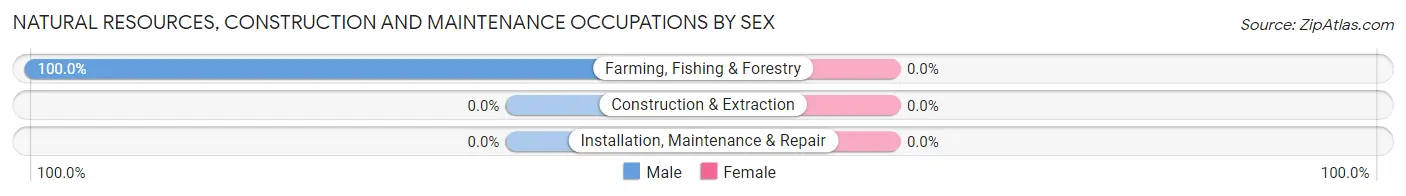
| Occupation | Male | Female |
| Farming, Fishing & Forestry | 28 (100.0%) | 0 (0.0%) |
| Construction & Extraction | 0 (0.0%) | 0 (0.0%) |
| Installation, Maintenance & Repair | 0 (0.0%) | 0 (0.0%) |
| Total (Category) | 28 (100.0%) | 0 (0.0%) |
| Total (Overall) | 227 (47.2%) | 254 (52.8%) |
Production, Transportation and Moving Occupations
The most common Production, Transportation and Moving occupations in Sunriver are , and Transportation (32 | 6.7%).
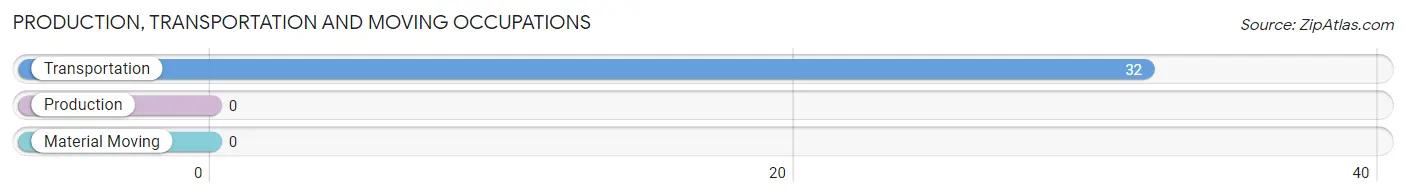
Production, Transportation and Moving Occupations by Sex
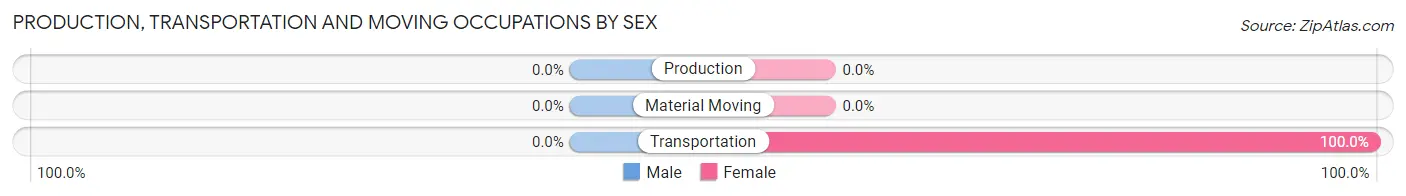
| Occupation | Male | Female |
| Production | 0 (0.0%) | 0 (0.0%) |
| Transportation | 0 (0.0%) | 32 (100.0%) |
| Material Moving | 0 (0.0%) | 0 (0.0%) |
| Total (Category) | 0 (0.0%) | 32 (100.0%) |
| Total (Overall) | 227 (47.2%) | 254 (52.8%) |
Employment Industries by Sex in Sunriver
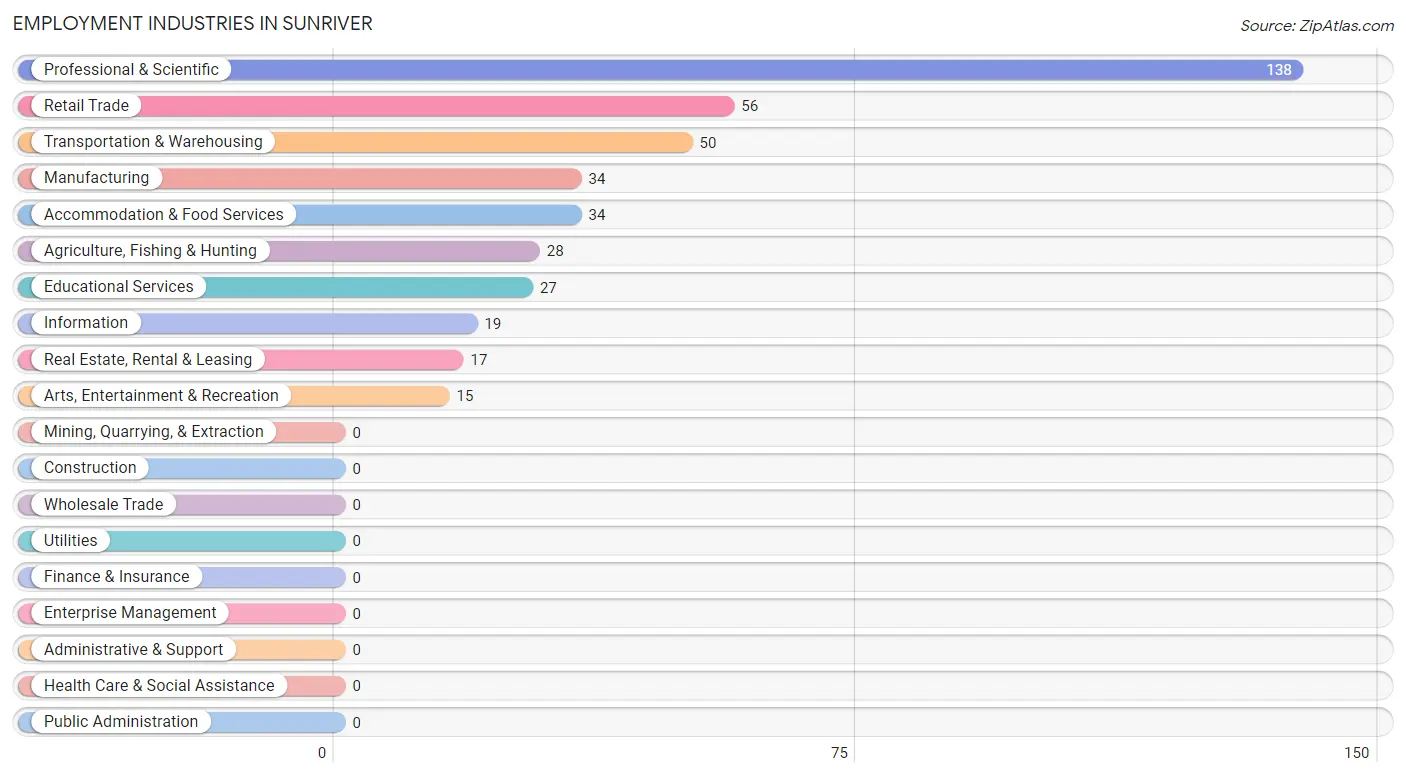
Employment Industries in Sunriver
The major employment industries in Sunriver include Professional & Scientific (138 | 28.7%), Retail Trade (56 | 11.6%), Transportation & Warehousing (50 | 10.4%), Manufacturing (34 | 7.1%), and Accommodation & Food Services (34 | 7.1%).
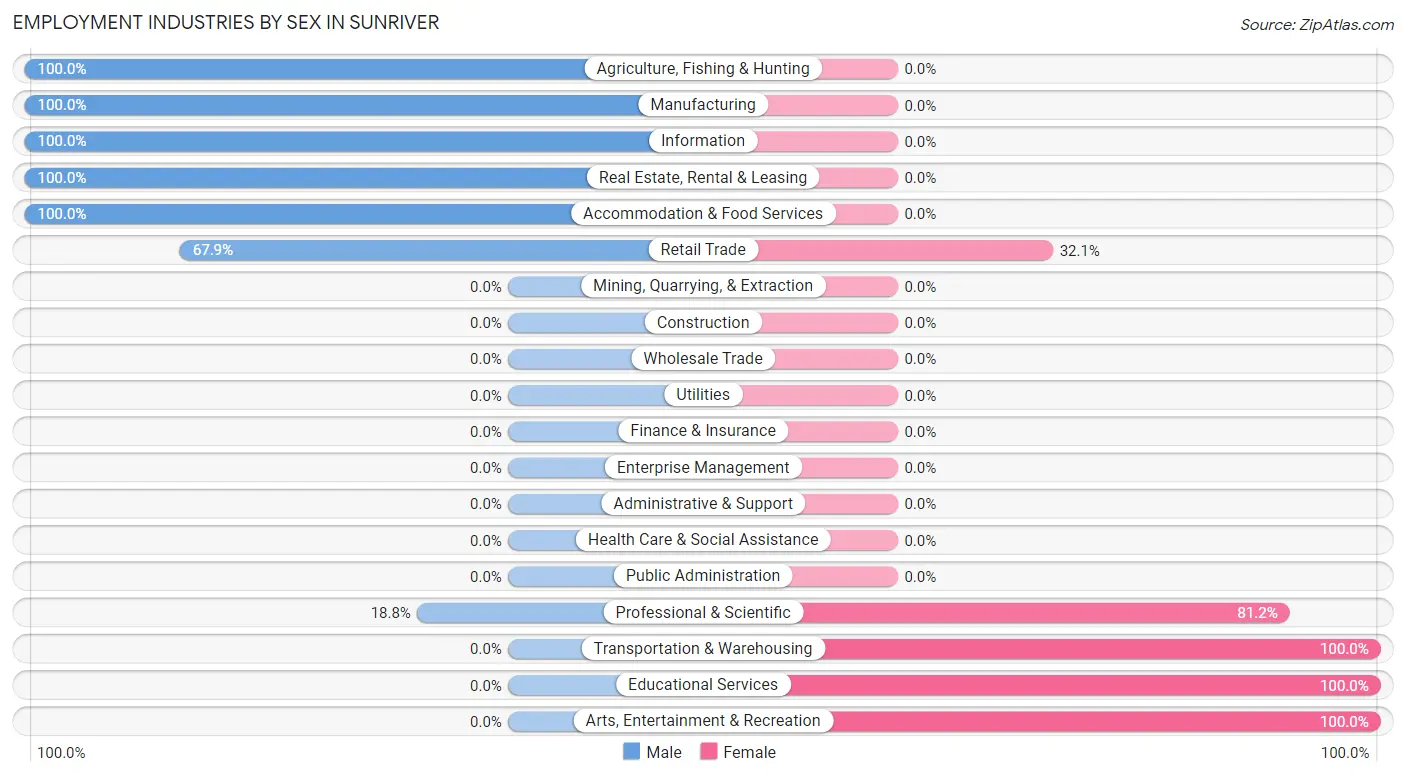
Employment Industries by Sex in Sunriver
The Sunriver industries that see more men than women are Agriculture, Fishing & Hunting (100.0%), Manufacturing (100.0%), and Information (100.0%), whereas the industries that tend to have a higher number of women are Transportation & Warehousing (100.0%), Educational Services (100.0%), and Arts, Entertainment & Recreation (100.0%).
| Industry | Male | Female |
| Agriculture, Fishing & Hunting | 28 (100.0%) | 0 (0.0%) |
| Mining, Quarrying, & Extraction | 0 (0.0%) | 0 (0.0%) |
| Construction | 0 (0.0%) | 0 (0.0%) |
| Manufacturing | 34 (100.0%) | 0 (0.0%) |
| Wholesale Trade | 0 (0.0%) | 0 (0.0%) |
| Retail Trade | 38 (67.9%) | 18 (32.1%) |
| Transportation & Warehousing | 0 (0.0%) | 50 (100.0%) |
| Utilities | 0 (0.0%) | 0 (0.0%) |
| Information | 19 (100.0%) | 0 (0.0%) |
| Finance & Insurance | 0 (0.0%) | 0 (0.0%) |
| Real Estate, Rental & Leasing | 17 (100.0%) | 0 (0.0%) |
| Professional & Scientific | 26 (18.8%) | 112 (81.2%) |
| Enterprise Management | 0 (0.0%) | 0 (0.0%) |
| Administrative & Support | 0 (0.0%) | 0 (0.0%) |
| Educational Services | 0 (0.0%) | 27 (100.0%) |
| Health Care & Social Assistance | 0 (0.0%) | 0 (0.0%) |
| Arts, Entertainment & Recreation | 0 (0.0%) | 15 (100.0%) |
| Accommodation & Food Services | 34 (100.0%) | 0 (0.0%) |
| Public Administration | 0 (0.0%) | 0 (0.0%) |
| Total | 227 (47.2%) | 254 (52.8%) |
Education in Sunriver
School Enrollment in Sunriver
| School Level | # Students | % Students |
| Nursery / Preschool | 0 | 0.0% |
| Kindergarten | 0 | 0.0% |
| Elementary School | 0 | 0.0% |
| Middle School | 0 | 0.0% |
| High School | 0 | 0.0% |
| College / Undergraduate | 0 | 0.0% |
| Graduate / Professional | 0 | 0.0% |
| Total | 0 | 0.0% |
School Enrollment by Age by Funding Source in Sunriver
| Age Bracket | Public School | Private School |
| 3 to 4 Year Olds | 0 (0.0%) | 0 (0.0%) |
| 5 to 9 Year Old | 0 (0.0%) | 0 (0.0%) |
| 10 to 14 Year Olds | 0 (0.0%) | 0 (0.0%) |
| 15 to 17 Year Olds | 0 (0.0%) | 0 (0.0%) |
| 18 to 19 Year Olds | 0 (0.0%) | 0 (0.0%) |
| 20 to 24 Year Olds | 0 (0.0%) | 0 (0.0%) |
| 25 to 34 Year Olds | 0 (0.0%) | 0 (0.0%) |
| 35 Years and over | 0 (0.0%) | 0 (0.0%) |
| Total | 0 (0.0%) | 0 (0.0%) |
Educational Attainment by Field of Study in Sunriver
Business (212 | 20.2%), education (200 | 19.1%), literature & languages (172 | 16.4%), social sciences (127 | 12.1%), and physical & health sciences (97 | 9.2%) are the most common fields of study among 1,049 individuals in Sunriver who have obtained a bachelor's degree or higher.
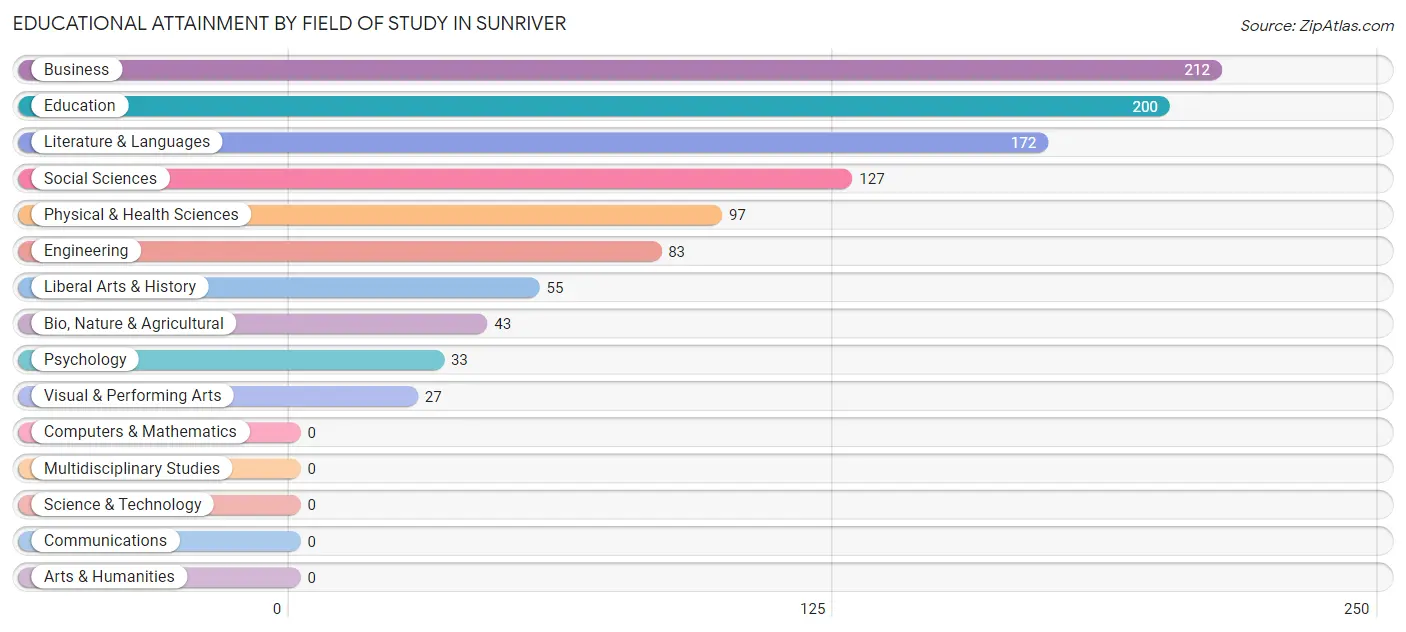
| Field of Study | # Graduates | % Graduates |
| Computers & Mathematics | 0 | 0.0% |
| Bio, Nature & Agricultural | 43 | 4.1% |
| Physical & Health Sciences | 97 | 9.2% |
| Psychology | 33 | 3.2% |
| Social Sciences | 127 | 12.1% |
| Engineering | 83 | 7.9% |
| Multidisciplinary Studies | 0 | 0.0% |
| Science & Technology | 0 | 0.0% |
| Business | 212 | 20.2% |
| Education | 200 | 19.1% |
| Literature & Languages | 172 | 16.4% |
| Liberal Arts & History | 55 | 5.2% |
| Visual & Performing Arts | 27 | 2.6% |
| Communications | 0 | 0.0% |
| Arts & Humanities | 0 | 0.0% |
| Total | 1,049 | 100.0% |
Transportation & Commute in Sunriver
Vehicle Availability by Sex in Sunriver
The most prevalent vehicle ownership categories in Sunriver are males with 2 vehicles (120, accounting for 62.2%) and females with 2 vehicles (73, making up 47.2%).
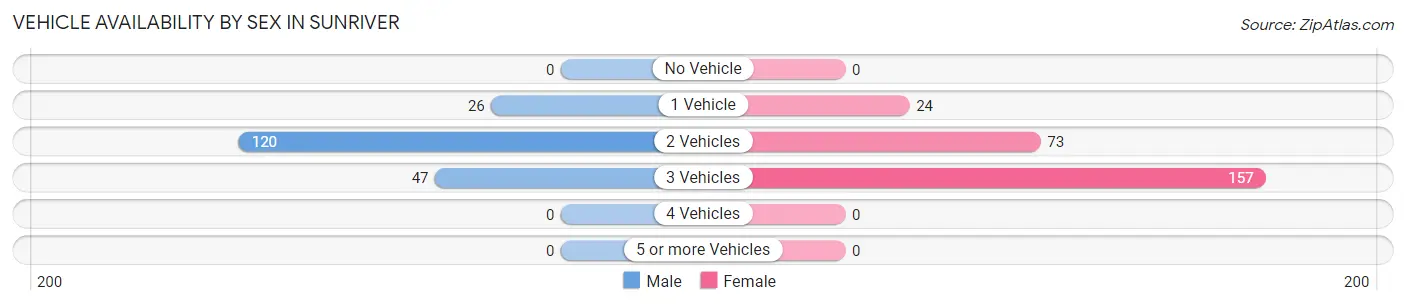
| Vehicles Available | Male | Female |
| No Vehicle | 0 (0.0%) | 0 (0.0%) |
| 1 Vehicle | 26 (13.5%) | 24 (9.5%) |
| 2 Vehicles | 120 (62.2%) | 73 (28.7%) |
| 3 Vehicles | 47 (24.3%) | 157 (61.8%) |
| 4 Vehicles | 0 (0.0%) | 0 (0.0%) |
| 5 or more Vehicles | 0 (0.0%) | 0 (0.0%) |
| Total | 193 (100.0%) | 254 (100.0%) |
Commute Time in Sunriver
The most frequently occuring commute durations in Sunriver are 30 to 34 minutes (66 commuters, 23.2%), 40 to 44 minutes (53 commuters, 18.7%), and 10 to 14 minutes (50 commuters, 17.6%).
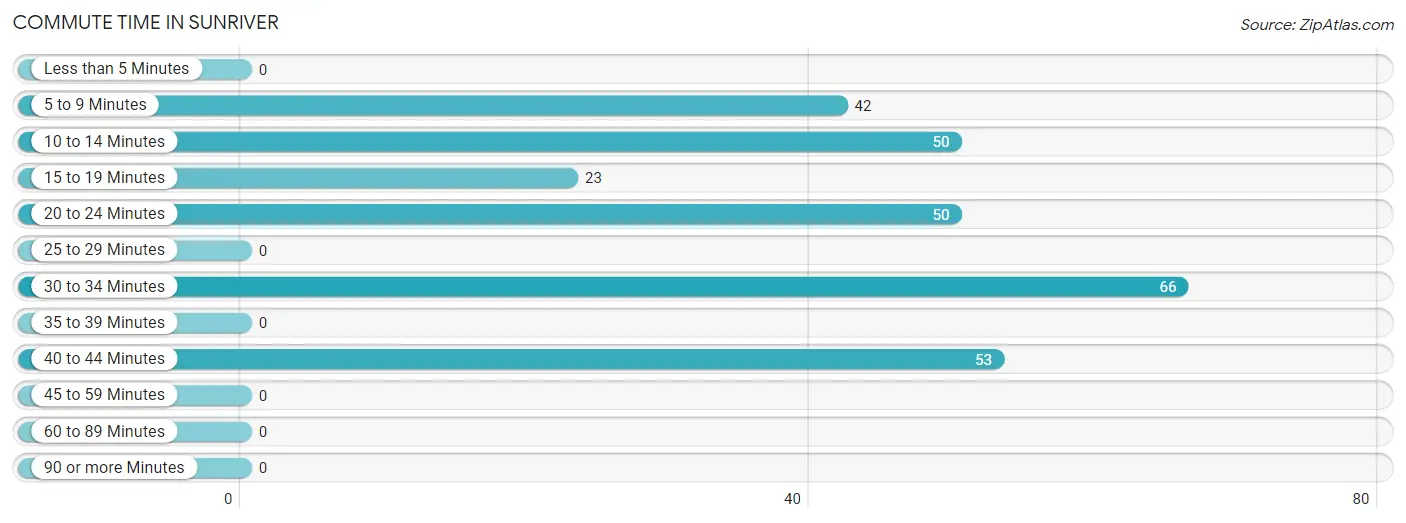
| Commute Time | # Commuters | % Commuters |
| Less than 5 Minutes | 0 | 0.0% |
| 5 to 9 Minutes | 42 | 14.8% |
| 10 to 14 Minutes | 50 | 17.6% |
| 15 to 19 Minutes | 23 | 8.1% |
| 20 to 24 Minutes | 50 | 17.6% |
| 25 to 29 Minutes | 0 | 0.0% |
| 30 to 34 Minutes | 66 | 23.2% |
| 35 to 39 Minutes | 0 | 0.0% |
| 40 to 44 Minutes | 53 | 18.7% |
| 45 to 59 Minutes | 0 | 0.0% |
| 60 to 89 Minutes | 0 | 0.0% |
| 90 or more Minutes | 0 | 0.0% |
Commute Time by Sex in Sunriver
The most common commute times in Sunriver are 30 to 34 minutes (66 commuters, 45.5%) for males and 20 to 24 minutes (50 commuters, 36.0%) for females.
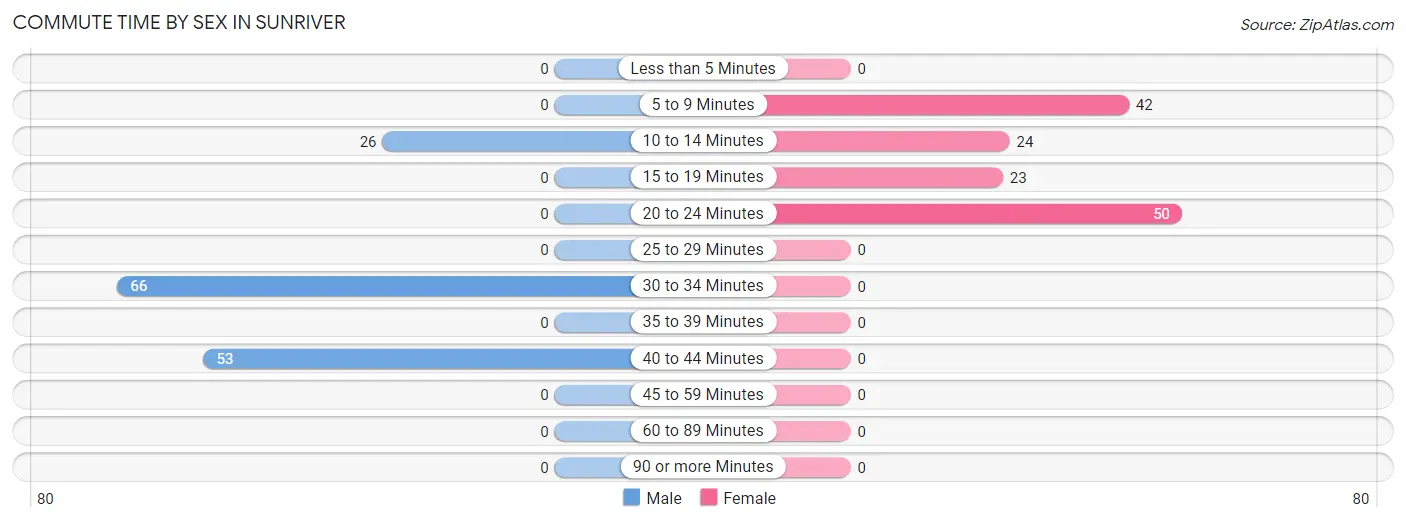
| Commute Time | Male | Female |
| Less than 5 Minutes | 0 (0.0%) | 0 (0.0%) |
| 5 to 9 Minutes | 0 (0.0%) | 42 (30.2%) |
| 10 to 14 Minutes | 26 (17.9%) | 24 (17.3%) |
| 15 to 19 Minutes | 0 (0.0%) | 23 (16.6%) |
| 20 to 24 Minutes | 0 (0.0%) | 50 (36.0%) |
| 25 to 29 Minutes | 0 (0.0%) | 0 (0.0%) |
| 30 to 34 Minutes | 66 (45.5%) | 0 (0.0%) |
| 35 to 39 Minutes | 0 (0.0%) | 0 (0.0%) |
| 40 to 44 Minutes | 53 (36.5%) | 0 (0.0%) |
| 45 to 59 Minutes | 0 (0.0%) | 0 (0.0%) |
| 60 to 89 Minutes | 0 (0.0%) | 0 (0.0%) |
| 90 or more Minutes | 0 (0.0%) | 0 (0.0%) |
Time of Departure to Work by Sex in Sunriver
The most frequent times of departure to work in Sunriver are 10:00 AM to 10:59 AM (53, 36.5%) for males and 12:00 AM to 4:59 AM (73, 52.5%) for females.
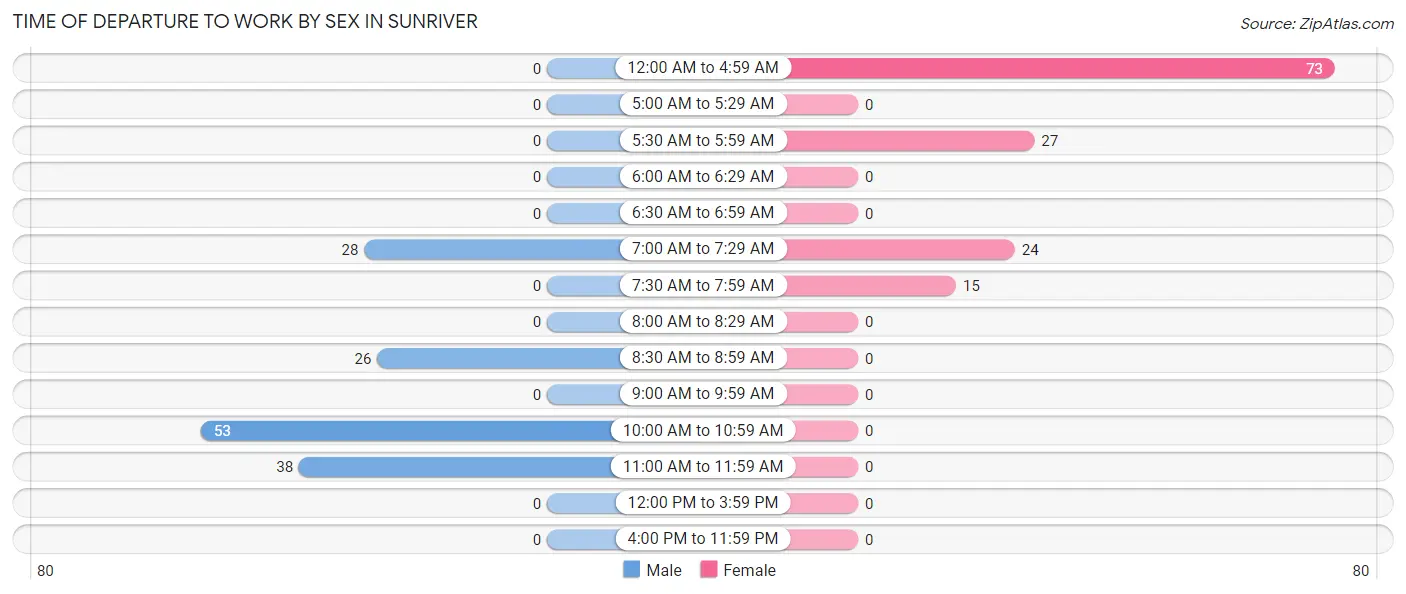
| Time of Departure | Male | Female |
| 12:00 AM to 4:59 AM | 0 (0.0%) | 73 (52.5%) |
| 5:00 AM to 5:29 AM | 0 (0.0%) | 0 (0.0%) |
| 5:30 AM to 5:59 AM | 0 (0.0%) | 27 (19.4%) |
| 6:00 AM to 6:29 AM | 0 (0.0%) | 0 (0.0%) |
| 6:30 AM to 6:59 AM | 0 (0.0%) | 0 (0.0%) |
| 7:00 AM to 7:29 AM | 28 (19.3%) | 24 (17.3%) |
| 7:30 AM to 7:59 AM | 0 (0.0%) | 15 (10.8%) |
| 8:00 AM to 8:29 AM | 0 (0.0%) | 0 (0.0%) |
| 8:30 AM to 8:59 AM | 26 (17.9%) | 0 (0.0%) |
| 9:00 AM to 9:59 AM | 0 (0.0%) | 0 (0.0%) |
| 10:00 AM to 10:59 AM | 53 (36.5%) | 0 (0.0%) |
| 11:00 AM to 11:59 AM | 38 (26.2%) | 0 (0.0%) |
| 12:00 PM to 3:59 PM | 0 (0.0%) | 0 (0.0%) |
| 4:00 PM to 11:59 PM | 0 (0.0%) | 0 (0.0%) |
| Total | 145 (100.0%) | 139 (100.0%) |
Housing Occupancy in Sunriver
Occupancy by Ownership in Sunriver
Of the total 826 dwellings in Sunriver, owner-occupied units account for 724 (87.6%), while renter-occupied units make up 102 (12.3%).
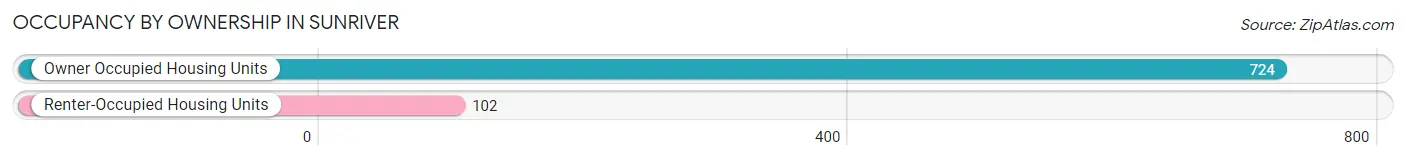
| Occupancy | # Housing Units | % Housing Units |
| Owner Occupied Housing Units | 724 | 87.6% |
| Renter-Occupied Housing Units | 102 | 12.3% |
| Total Occupied Housing Units | 826 | 100.0% |
Occupancy by Household Size in Sunriver
| Household Size | # Housing Units | % Housing Units |
| 1-Person Household | 271 | 32.8% |
| 2-Person Household | 505 | 61.1% |
| 3-Person Household | 50 | 6.0% |
| 4+ Person Household | 0 | 0.0% |
| Total Housing Units | 826 | 100.0% |
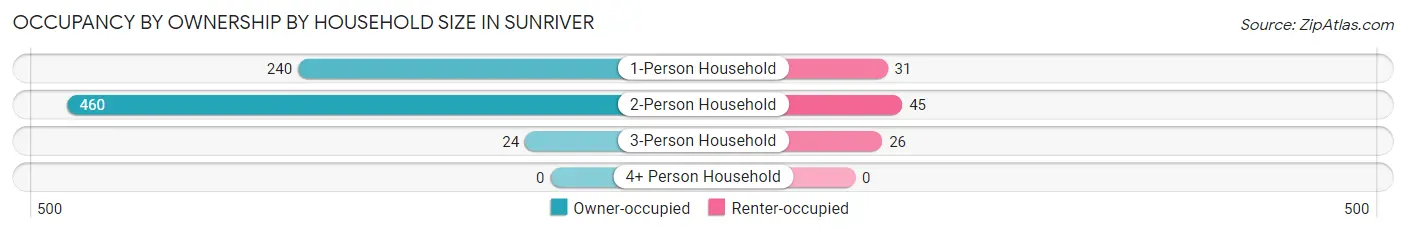
Occupancy by Ownership by Household Size in Sunriver
| Household Size | Owner-occupied | Renter-occupied |
| 1-Person Household | 240 (88.6%) | 31 (11.4%) |
| 2-Person Household | 460 (91.1%) | 45 (8.9%) |
| 3-Person Household | 24 (48.0%) | 26 (52.0%) |
| 4+ Person Household | 0 (0.0%) | 0 (0.0%) |
| Total Housing Units | 724 (87.6%) | 102 (12.3%) |
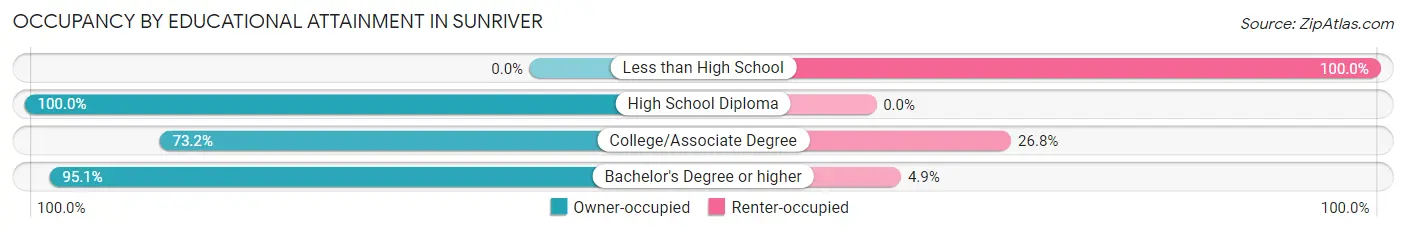
Occupancy by Educational Attainment in Sunriver
| Household Size | Owner-occupied | Renter-occupied |
| Less than High School | 0 (0.0%) | 17 (100.0%) |
| High School Diploma | 27 (100.0%) | 0 (0.0%) |
| College/Associate Degree | 156 (73.2%) | 57 (26.8%) |
| Bachelor's Degree or higher | 541 (95.1%) | 28 (4.9%) |
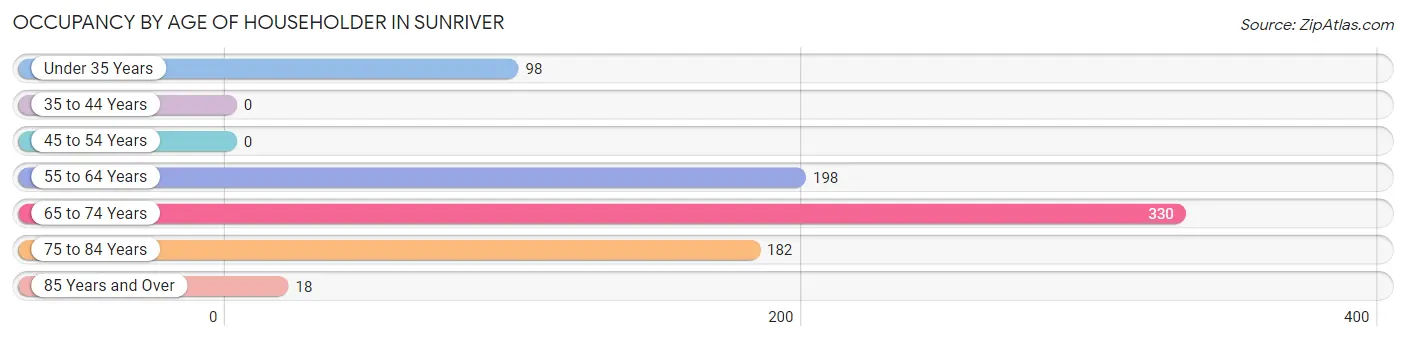
Occupancy by Age of Householder in Sunriver
| Age Bracket | # Households | % Households |
| Under 35 Years | 98 | 11.9% |
| 35 to 44 Years | 0 | 0.0% |
| 45 to 54 Years | 0 | 0.0% |
| 55 to 64 Years | 198 | 24.0% |
| 65 to 74 Years | 330 | 40.0% |
| 75 to 84 Years | 182 | 22.0% |
| 85 Years and Over | 18 | 2.2% |
| Total | 826 | 100.0% |
Housing Finances in Sunriver
Median Income by Occupancy in Sunriver
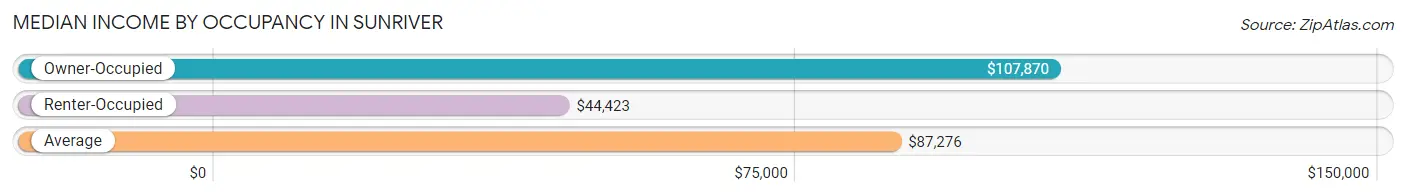
| Occupancy Type | # Households | Median Income |
| Owner-Occupied | 724 (87.6%) | $107,870 |
| Renter-Occupied | 102 (12.3%) | $44,423 |
| Average | 826 (100.0%) | $87,276 |
Occupancy by Householder Income Bracket in Sunriver
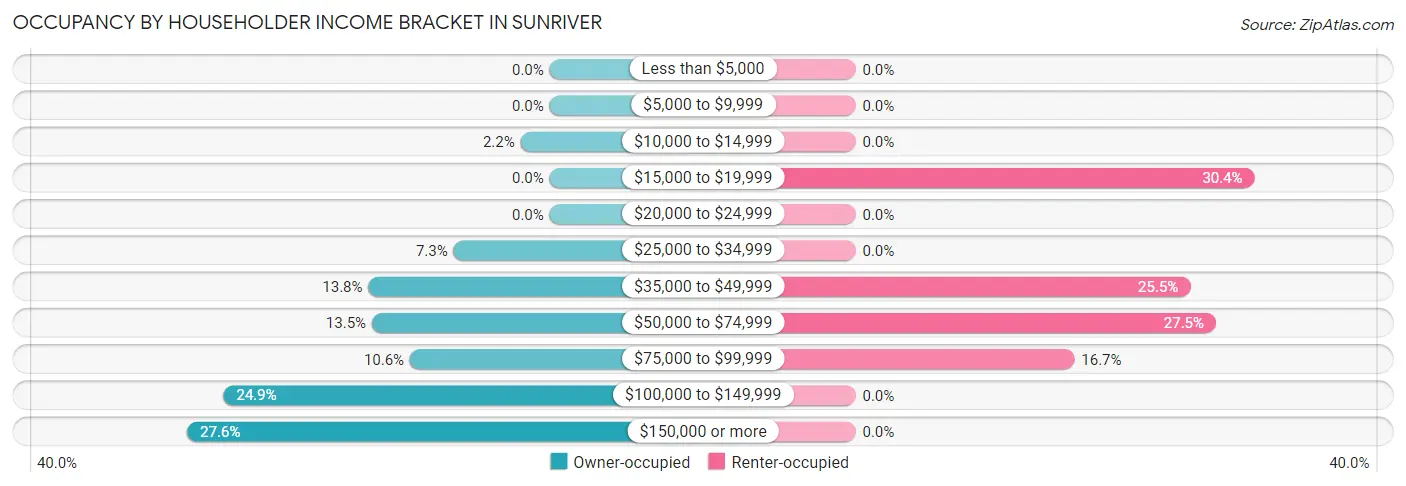
| Income Bracket | Owner-occupied | Renter-occupied |
| Less than $5,000 | 0 (0.0%) | 0 (0.0%) |
| $5,000 to $9,999 | 0 (0.0%) | 0 (0.0%) |
| $10,000 to $14,999 | 16 (2.2%) | 0 (0.0%) |
| $15,000 to $19,999 | 0 (0.0%) | 31 (30.4%) |
| $20,000 to $24,999 | 0 (0.0%) | 0 (0.0%) |
| $25,000 to $34,999 | 53 (7.3%) | 0 (0.0%) |
| $35,000 to $49,999 | 100 (13.8%) | 26 (25.5%) |
| $50,000 to $74,999 | 98 (13.5%) | 28 (27.5%) |
| $75,000 to $99,999 | 77 (10.6%) | 17 (16.7%) |
| $100,000 to $149,999 | 180 (24.9%) | 0 (0.0%) |
| $150,000 or more | 200 (27.6%) | 0 (0.0%) |
| Total | 724 (100.0%) | 102 (100.0%) |
Monthly Housing Cost Tiers in Sunriver
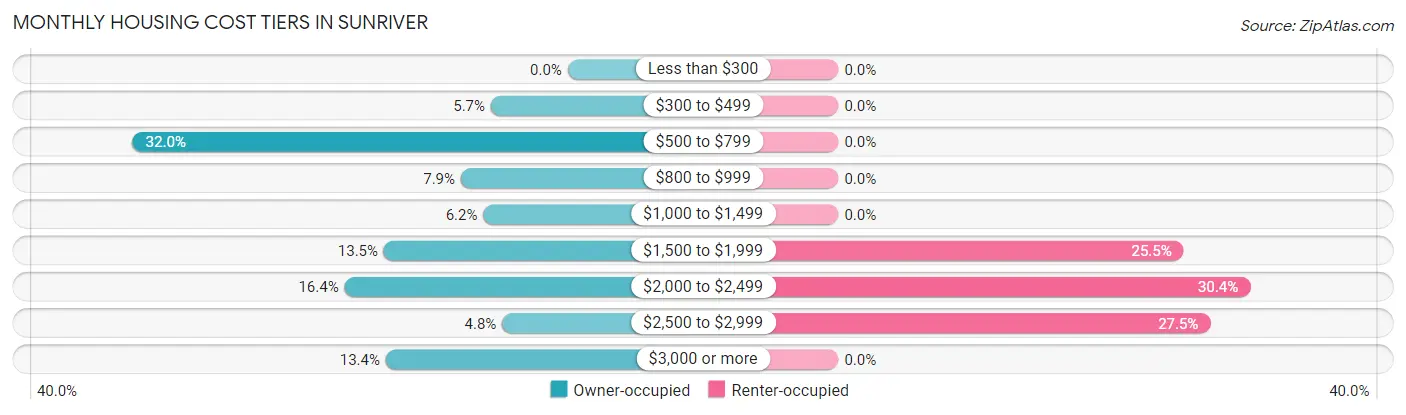
| Monthly Cost | Owner-occupied | Renter-occupied |
| Less than $300 | 0 (0.0%) | 0 (0.0%) |
| $300 to $499 | 41 (5.7%) | 0 (0.0%) |
| $500 to $799 | 232 (32.0%) | 0 (0.0%) |
| $800 to $999 | 57 (7.9%) | 0 (0.0%) |
| $1,000 to $1,499 | 45 (6.2%) | 0 (0.0%) |
| $1,500 to $1,999 | 98 (13.5%) | 26 (25.5%) |
| $2,000 to $2,499 | 119 (16.4%) | 31 (30.4%) |
| $2,500 to $2,999 | 35 (4.8%) | 28 (27.5%) |
| $3,000 or more | 97 (13.4%) | 0 (0.0%) |
| Total | 724 (100.0%) | 102 (100.0%) |
Physical Housing Characteristics in Sunriver
Housing Structures in Sunriver
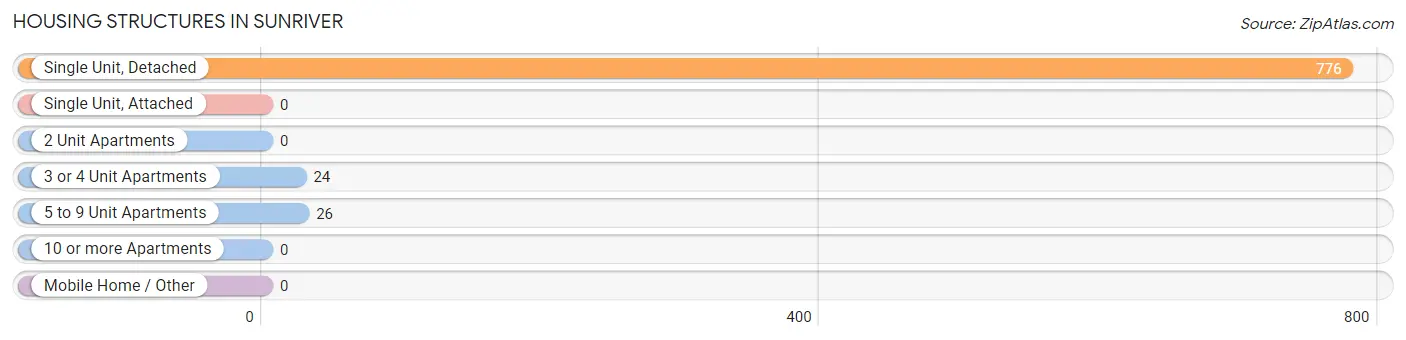
| Structure Type | # Housing Units | % Housing Units |
| Single Unit, Detached | 776 | 94.0% |
| Single Unit, Attached | 0 | 0.0% |
| 2 Unit Apartments | 0 | 0.0% |
| 3 or 4 Unit Apartments | 24 | 2.9% |
| 5 to 9 Unit Apartments | 26 | 3.2% |
| 10 or more Apartments | 0 | 0.0% |
| Mobile Home / Other | 0 | 0.0% |
| Total | 826 | 100.0% |
Housing Structures by Occupancy in Sunriver
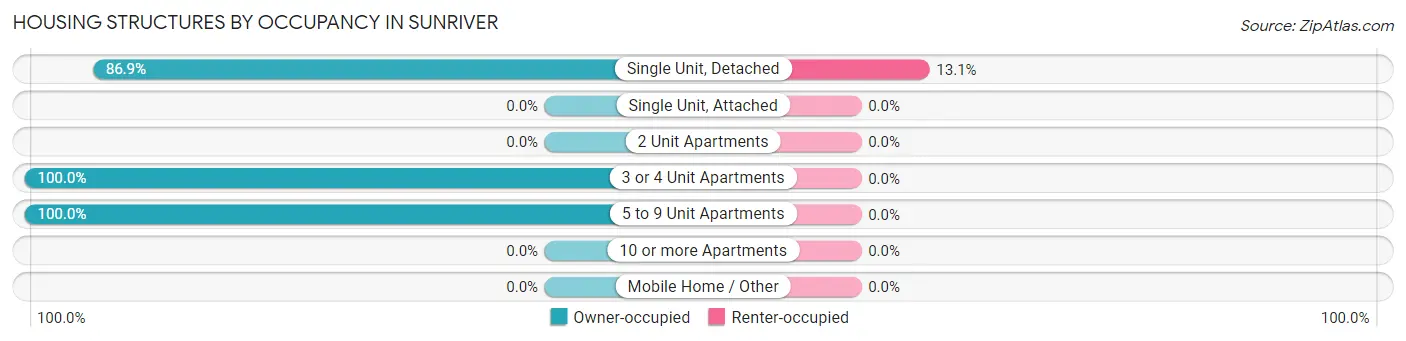
| Structure Type | Owner-occupied | Renter-occupied |
| Single Unit, Detached | 674 (86.9%) | 102 (13.1%) |
| Single Unit, Attached | 0 (0.0%) | 0 (0.0%) |
| 2 Unit Apartments | 0 (0.0%) | 0 (0.0%) |
| 3 or 4 Unit Apartments | 24 (100.0%) | 0 (0.0%) |
| 5 to 9 Unit Apartments | 26 (100.0%) | 0 (0.0%) |
| 10 or more Apartments | 0 (0.0%) | 0 (0.0%) |
| Mobile Home / Other | 0 (0.0%) | 0 (0.0%) |
| Total | 724 (87.6%) | 102 (12.3%) |
Housing Structures by Number of Rooms in Sunriver
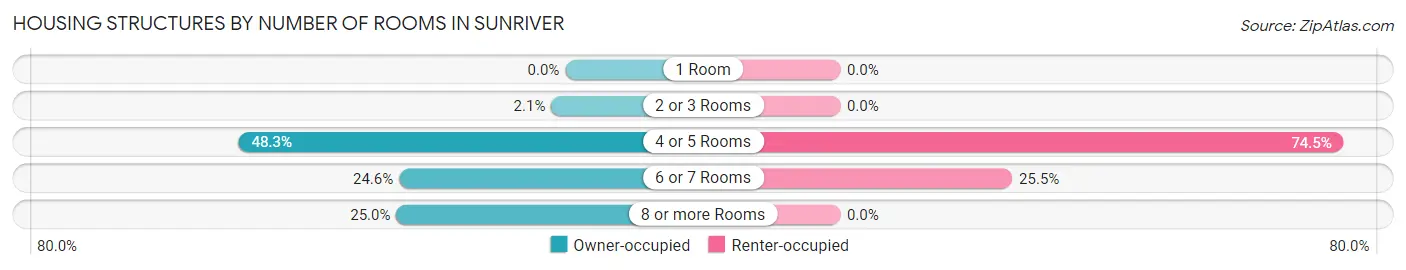
| Number of Rooms | Owner-occupied | Renter-occupied |
| 1 Room | 0 (0.0%) | 0 (0.0%) |
| 2 or 3 Rooms | 15 (2.1%) | 0 (0.0%) |
| 4 or 5 Rooms | 350 (48.3%) | 76 (74.5%) |
| 6 or 7 Rooms | 178 (24.6%) | 26 (25.5%) |
| 8 or more Rooms | 181 (25.0%) | 0 (0.0%) |
| Total | 724 (100.0%) | 102 (100.0%) |
Housing Structure by Heating Type in Sunriver
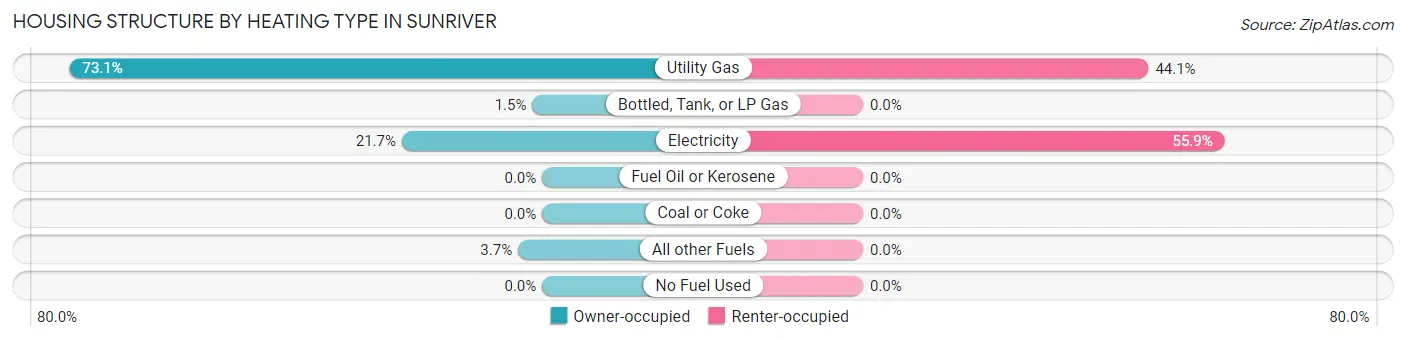
| Heating Type | Owner-occupied | Renter-occupied |
| Utility Gas | 529 (73.1%) | 45 (44.1%) |
| Bottled, Tank, or LP Gas | 11 (1.5%) | 0 (0.0%) |
| Electricity | 157 (21.7%) | 57 (55.9%) |
| Fuel Oil or Kerosene | 0 (0.0%) | 0 (0.0%) |
| Coal or Coke | 0 (0.0%) | 0 (0.0%) |
| All other Fuels | 27 (3.7%) | 0 (0.0%) |
| No Fuel Used | 0 (0.0%) | 0 (0.0%) |
| Total | 724 (100.0%) | 102 (100.0%) |
Household Vehicle Usage in Sunriver
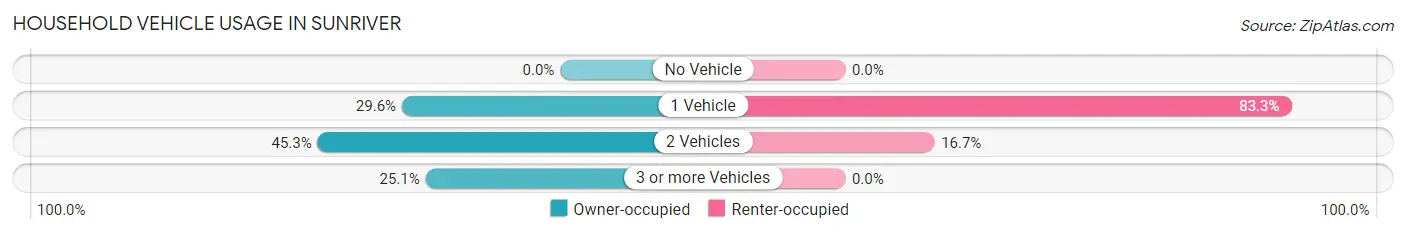
| Vehicles per Household | Owner-occupied | Renter-occupied |
| No Vehicle | 0 (0.0%) | 0 (0.0%) |
| 1 Vehicle | 214 (29.6%) | 85 (83.3%) |
| 2 Vehicles | 328 (45.3%) | 17 (16.7%) |
| 3 or more Vehicles | 182 (25.1%) | 0 (0.0%) |
| Total | 724 (100.0%) | 102 (100.0%) |
Real Estate & Mortgages in Sunriver
Real Estate and Mortgage Overview in Sunriver
| Characteristic | Without Mortgage | With Mortgage |
| Housing Units | 410 | 314 |
| Median Property Value | $556,900 | $733,800 |
| Median Household Income | $120,233 | $58 |
| Monthly Housing Costs | $716 | $97 |
| Real Estate Taxes | $4,824 | $0 |
Property Value by Mortgage Status in Sunriver
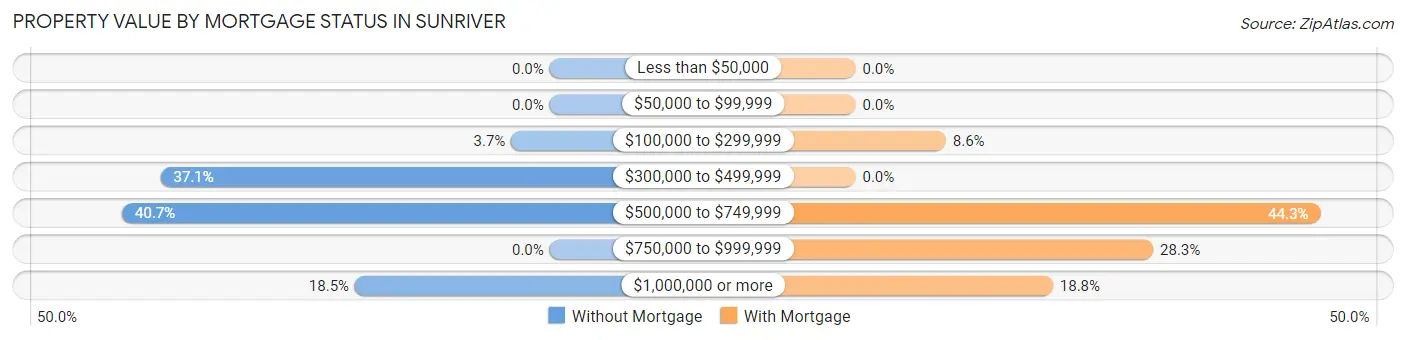
| Property Value | Without Mortgage | With Mortgage |
| Less than $50,000 | 0 (0.0%) | 0 (0.0%) |
| $50,000 to $99,999 | 0 (0.0%) | 0 (0.0%) |
| $100,000 to $299,999 | 15 (3.7%) | 27 (8.6%) |
| $300,000 to $499,999 | 152 (37.1%) | 0 (0.0%) |
| $500,000 to $749,999 | 167 (40.7%) | 139 (44.3%) |
| $750,000 to $999,999 | 0 (0.0%) | 89 (28.3%) |
| $1,000,000 or more | 76 (18.5%) | 59 (18.8%) |
| Total | 410 (100.0%) | 314 (100.0%) |
Household Income by Mortgage Status in Sunriver
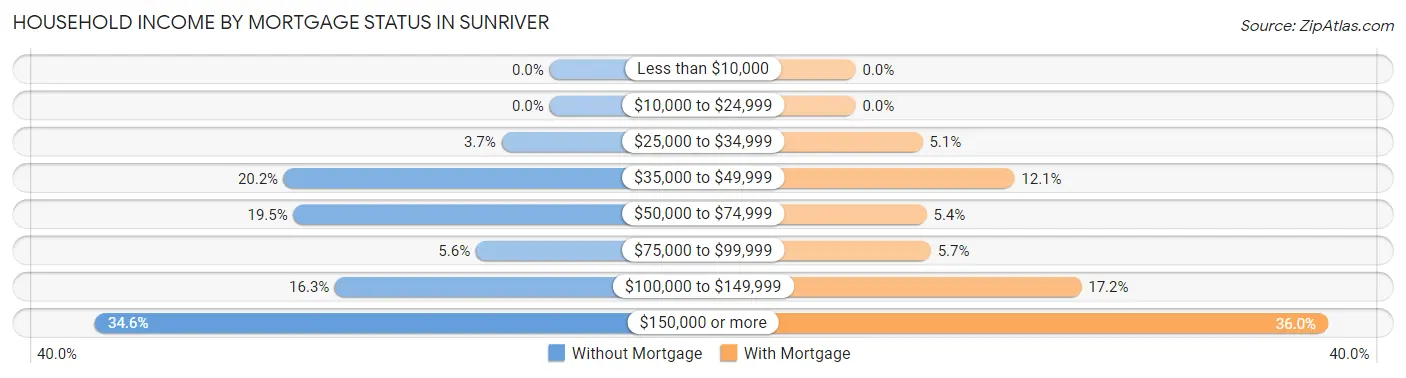
| Household Income | Without Mortgage | With Mortgage |
| Less than $10,000 | 0 (0.0%) | 0 (0.0%) |
| $10,000 to $24,999 | 0 (0.0%) | 0 (0.0%) |
| $25,000 to $34,999 | 15 (3.7%) | 16 (5.1%) |
| $35,000 to $49,999 | 83 (20.2%) | 38 (12.1%) |
| $50,000 to $74,999 | 80 (19.5%) | 17 (5.4%) |
| $75,000 to $99,999 | 23 (5.6%) | 18 (5.7%) |
| $100,000 to $149,999 | 67 (16.3%) | 54 (17.2%) |
| $150,000 or more | 142 (34.6%) | 113 (36.0%) |
| Total | 410 (100.0%) | 314 (100.0%) |
Property Value to Household Income Ratio in Sunriver
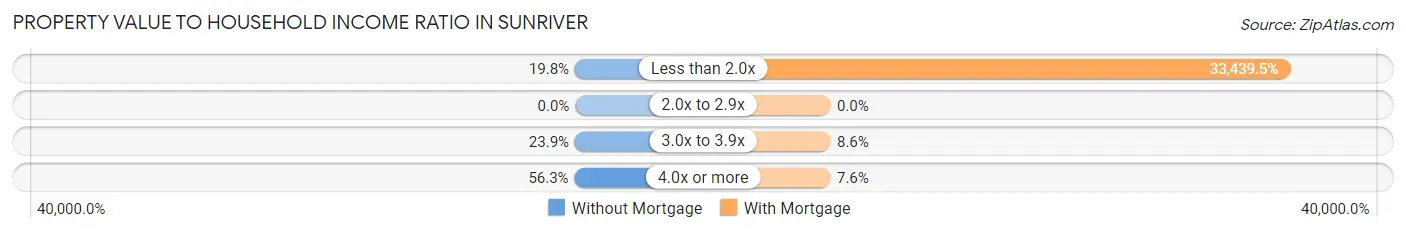
| Value-to-Income Ratio | Without Mortgage | With Mortgage |
| Less than 2.0x | 81 (19.8%) | 105,000 (33,439.5%) |
| 2.0x to 2.9x | 0 (0.0%) | 0 (0.0%) |
| 3.0x to 3.9x | 98 (23.9%) | 27 (8.6%) |
| 4.0x or more | 231 (56.3%) | 24 (7.6%) |
| Total | 410 (100.0%) | 314 (100.0%) |
Real Estate Taxes by Mortgage Status in Sunriver
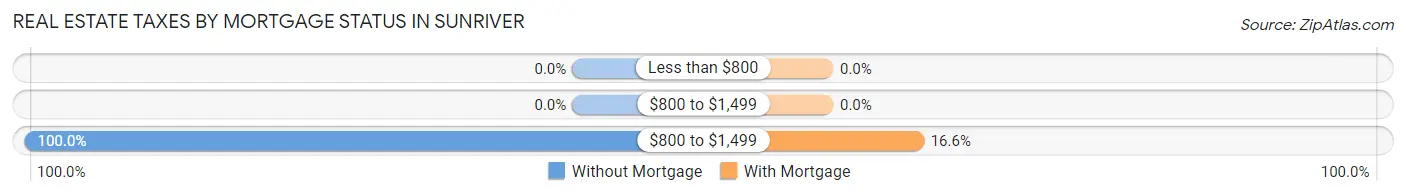
| Property Taxes | Without Mortgage | With Mortgage |
| Less than $800 | 0 (0.0%) | 0 (0.0%) |
| $800 to $1,499 | 0 (0.0%) | 0 (0.0%) |
| $800 to $1,499 | 410 (100.0%) | 52 (16.6%) |
| Total | 410 (100.0%) | 314 (100.0%) |
Health & Disability in Sunriver
Health Insurance Coverage by Age in Sunriver
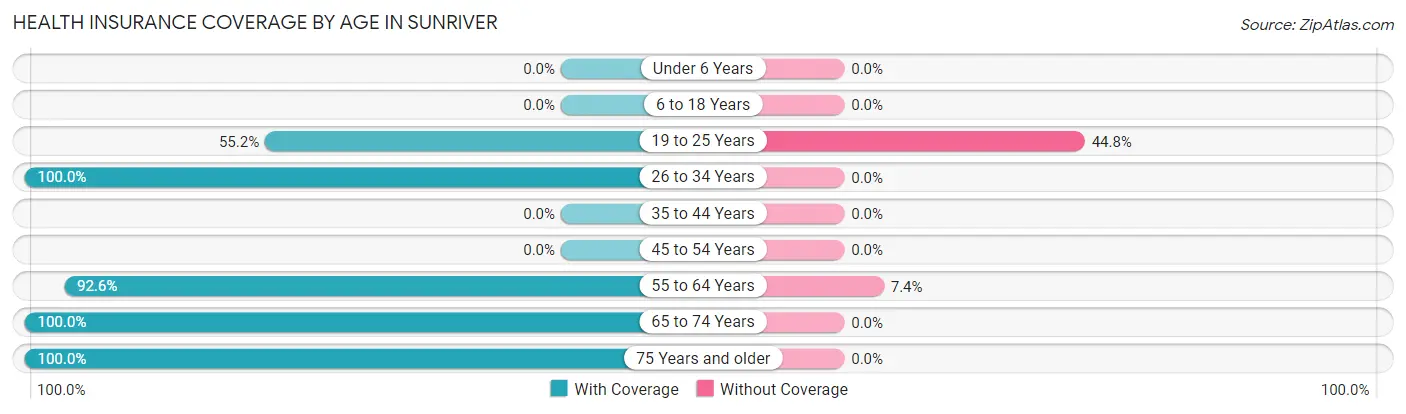
| Age Bracket | With Coverage | Without Coverage |
| Under 6 Years | 0 (0.0%) | 0 (0.0%) |
| 6 to 18 Years | 0 (0.0%) | 0 (0.0%) |
| 19 to 25 Years | 32 (55.2%) | 26 (44.8%) |
| 26 to 34 Years | 72 (100.0%) | 0 (0.0%) |
| 35 to 44 Years | 0 (0.0%) | 0 (0.0%) |
| 45 to 54 Years | 0 (0.0%) | 0 (0.0%) |
| 55 to 64 Years | 390 (92.6%) | 31 (7.4%) |
| 65 to 74 Years | 641 (100.0%) | 0 (0.0%) |
| 75 Years and older | 324 (100.0%) | 0 (0.0%) |
| Total | 1,459 (96.2%) | 57 (3.8%) |
Health Insurance Coverage by Citizenship Status in Sunriver
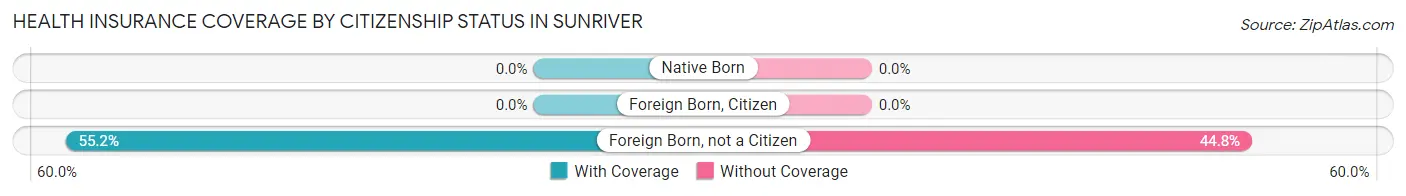
| Citizenship Status | With Coverage | Without Coverage |
| Native Born | 0 (0.0%) | 0 (0.0%) |
| Foreign Born, Citizen | 0 (0.0%) | 0 (0.0%) |
| Foreign Born, not a Citizen | 32 (55.2%) | 26 (44.8%) |
Health Insurance Coverage by Household Income in Sunriver
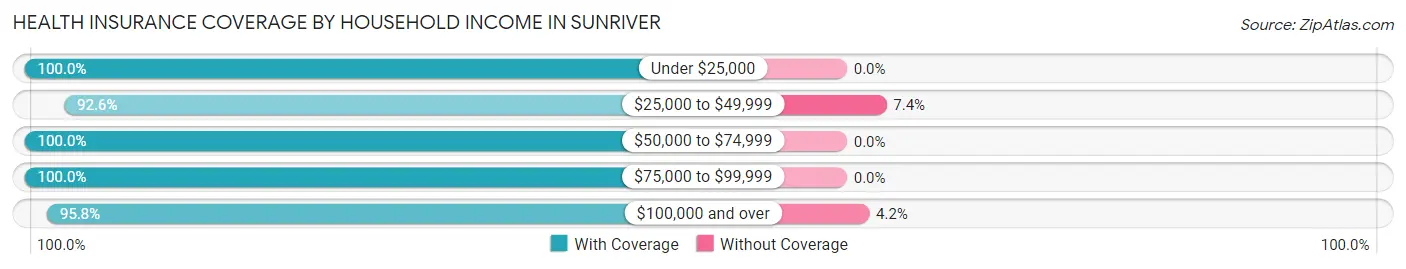
| Household Income | With Coverage | Without Coverage |
| Under $25,000 | 64 (100.0%) | 0 (0.0%) |
| $25,000 to $49,999 | 325 (92.6%) | 26 (7.4%) |
| $50,000 to $74,999 | 196 (100.0%) | 0 (0.0%) |
| $75,000 to $99,999 | 164 (100.0%) | 0 (0.0%) |
| $100,000 and over | 710 (95.8%) | 31 (4.2%) |
Public vs Private Health Insurance Coverage by Age in Sunriver
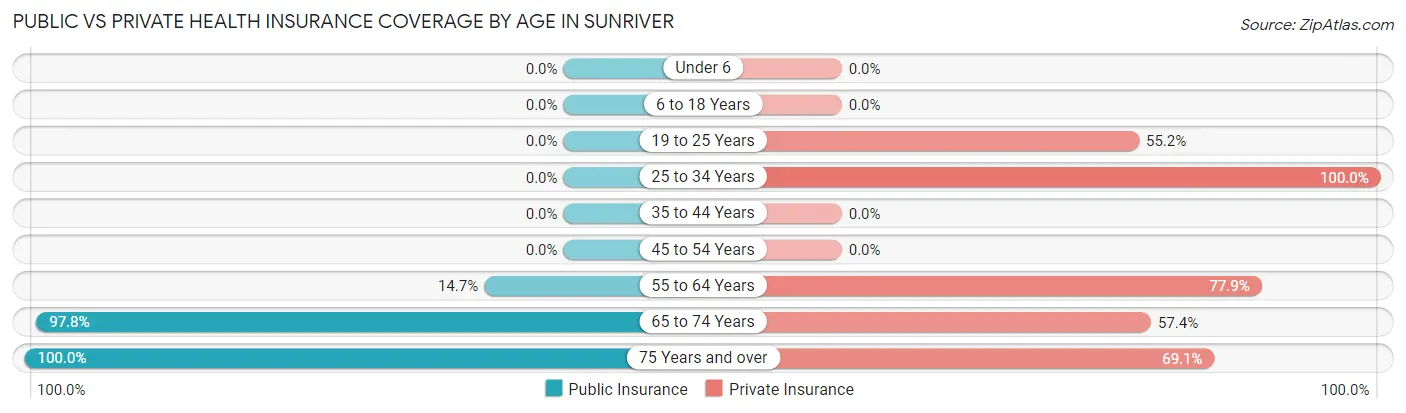
| Age Bracket | Public Insurance | Private Insurance |
| Under 6 | 0 (0.0%) | 0 (0.0%) |
| 6 to 18 Years | 0 (0.0%) | 0 (0.0%) |
| 19 to 25 Years | 0 (0.0%) | 32 (55.2%) |
| 25 to 34 Years | 0 (0.0%) | 72 (100.0%) |
| 35 to 44 Years | 0 (0.0%) | 0 (0.0%) |
| 45 to 54 Years | 0 (0.0%) | 0 (0.0%) |
| 55 to 64 Years | 62 (14.7%) | 328 (77.9%) |
| 65 to 74 Years | 627 (97.8%) | 368 (57.4%) |
| 75 Years and over | 324 (100.0%) | 224 (69.1%) |
| Total | 1,013 (66.8%) | 1,024 (67.5%) |
Disability Status by Sex by Age in Sunriver
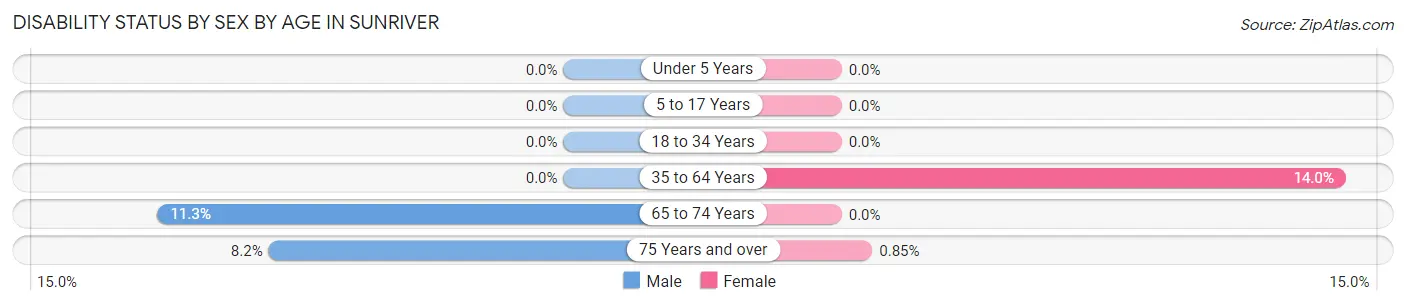
| Age Bracket | Male | Female |
| Under 5 Years | 0 (0.0%) | 0 (0.0%) |
| 5 to 17 Years | 0 (0.0%) | 0 (0.0%) |
| 18 to 34 Years | 0 (0.0%) | 0 (0.0%) |
| 35 to 64 Years | 0 (0.0%) | 31 (14.0%) |
| 65 to 74 Years | 26 (11.3%) | 0 (0.0%) |
| 75 Years and over | 17 (8.2%) | 1 (0.9%) |
Disability Class by Sex by Age in Sunriver
Disability Class: Hearing Difficulty
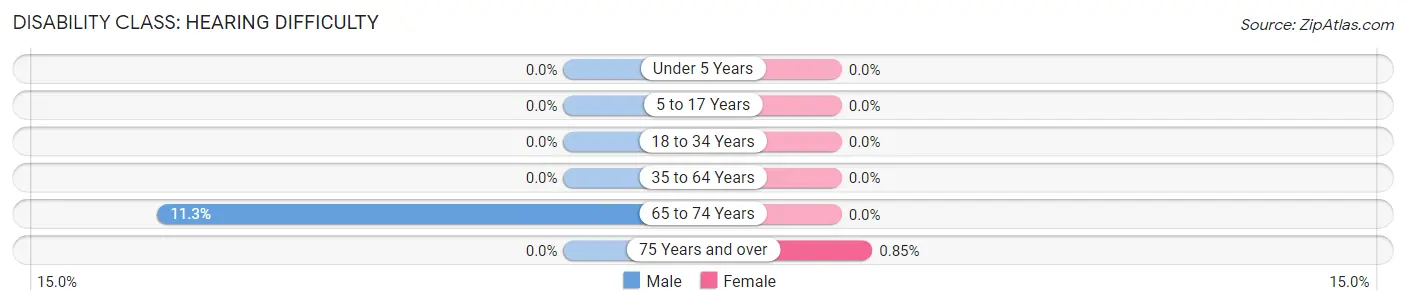
| Age Bracket | Male | Female |
| Under 5 Years | 0 (0.0%) | 0 (0.0%) |
| 5 to 17 Years | 0 (0.0%) | 0 (0.0%) |
| 18 to 34 Years | 0 (0.0%) | 0 (0.0%) |
| 35 to 64 Years | 0 (0.0%) | 0 (0.0%) |
| 65 to 74 Years | 26 (11.3%) | 0 (0.0%) |
| 75 Years and over | 0 (0.0%) | 1 (0.9%) |
Disability Class: Vision Difficulty
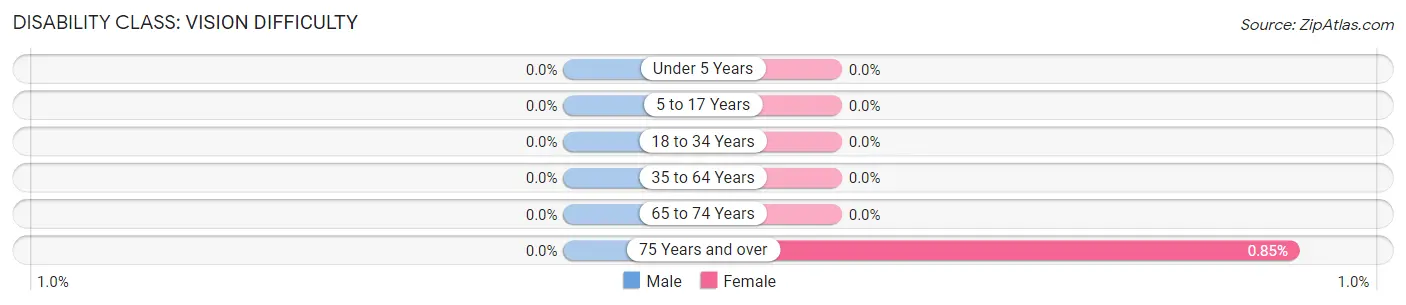
| Age Bracket | Male | Female |
| Under 5 Years | 0 (0.0%) | 0 (0.0%) |
| 5 to 17 Years | 0 (0.0%) | 0 (0.0%) |
| 18 to 34 Years | 0 (0.0%) | 0 (0.0%) |
| 35 to 64 Years | 0 (0.0%) | 0 (0.0%) |
| 65 to 74 Years | 0 (0.0%) | 0 (0.0%) |
| 75 Years and over | 0 (0.0%) | 1 (0.9%) |
Disability Class: Cognitive Difficulty
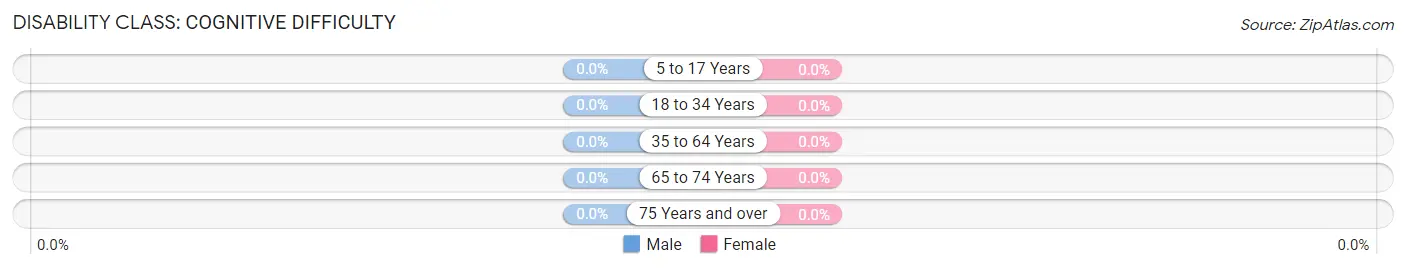
| Age Bracket | Male | Female |
| 5 to 17 Years | 0 (0.0%) | 0 (0.0%) |
| 18 to 34 Years | 0 (0.0%) | 0 (0.0%) |
| 35 to 64 Years | 0 (0.0%) | 0 (0.0%) |
| 65 to 74 Years | 0 (0.0%) | 0 (0.0%) |
| 75 Years and over | 0 (0.0%) | 0 (0.0%) |
Disability Class: Ambulatory Difficulty
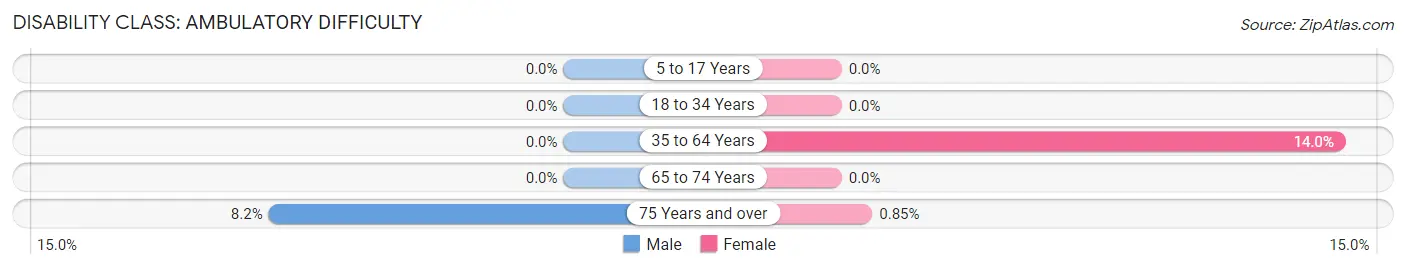
| Age Bracket | Male | Female |
| 5 to 17 Years | 0 (0.0%) | 0 (0.0%) |
| 18 to 34 Years | 0 (0.0%) | 0 (0.0%) |
| 35 to 64 Years | 0 (0.0%) | 31 (14.0%) |
| 65 to 74 Years | 0 (0.0%) | 0 (0.0%) |
| 75 Years and over | 17 (8.2%) | 1 (0.9%) |
Disability Class: Self-Care Difficulty
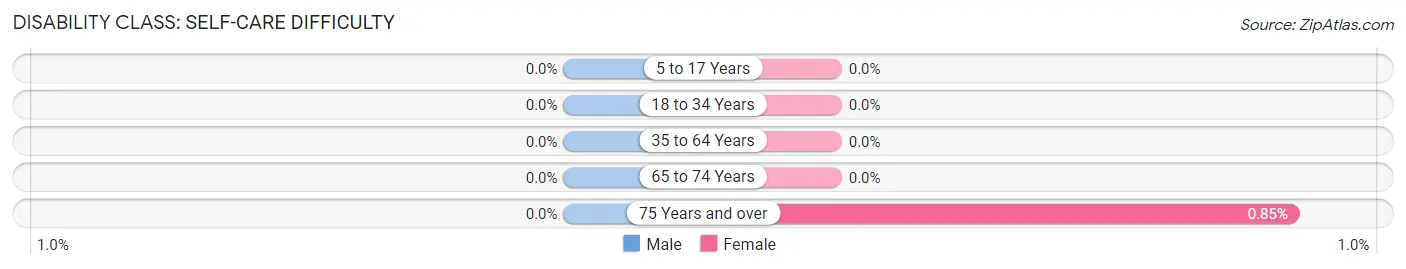
| Age Bracket | Male | Female |
| 5 to 17 Years | 0 (0.0%) | 0 (0.0%) |
| 18 to 34 Years | 0 (0.0%) | 0 (0.0%) |
| 35 to 64 Years | 0 (0.0%) | 0 (0.0%) |
| 65 to 74 Years | 0 (0.0%) | 0 (0.0%) |
| 75 Years and over | 0 (0.0%) | 1 (0.9%) |
Technology Access in Sunriver
Computing Device Access in Sunriver
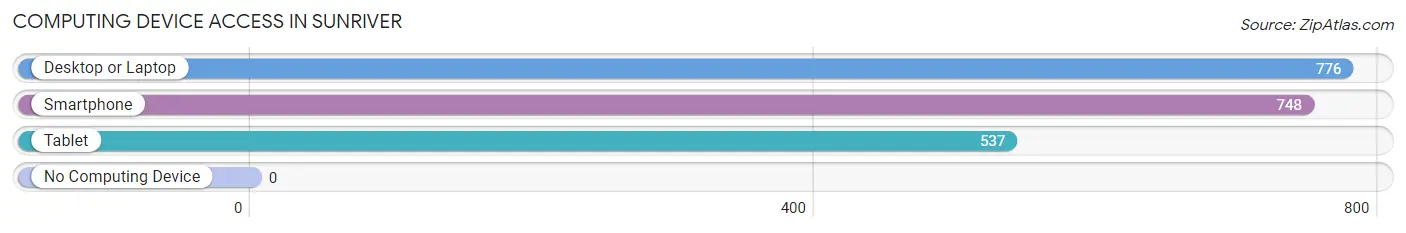
| Device Type | # Households | % Households |
| Desktop or Laptop | 776 | 94.0% |
| Smartphone | 748 | 90.6% |
| Tablet | 537 | 65.0% |
| No Computing Device | 0 | 0.0% |
| Total | 826 | 100.0% |
Internet Access in Sunriver
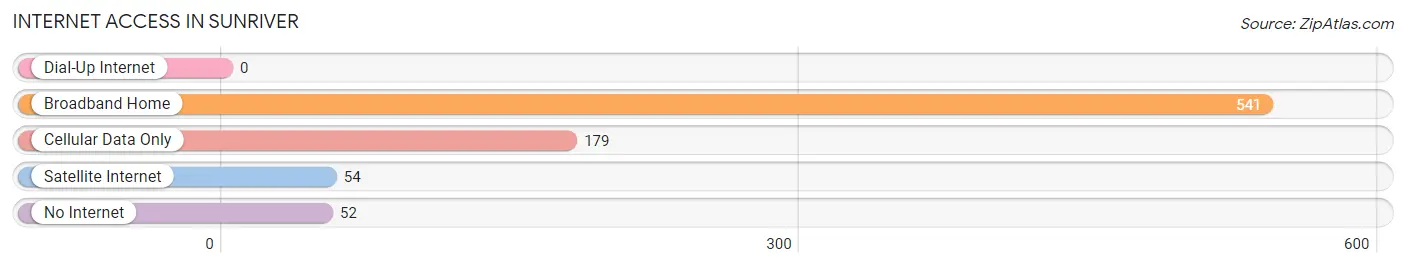
| Internet Type | # Households | % Households |
| Dial-Up Internet | 0 | 0.0% |
| Broadband Home | 541 | 65.5% |
| Cellular Data Only | 179 | 21.7% |
| Satellite Internet | 54 | 6.5% |
| No Internet | 52 | 6.3% |
| Total | 826 | 100.0% |
Sunriver Summary
Sunriver is a small unincorporated community located in Deschutes County, Oregon, United States. It is situated on the eastern edge of the Cascade Range, approximately 15 miles south of Bend and 25 miles north of Klamath Falls. The community is located along the Deschutes River, and is surrounded by the Deschutes National Forest. Sunriver is a popular tourist destination, and is home to a variety of recreational activities, including golf, skiing, snowboarding, fishing, and hiking.
History
Sunriver was originally inhabited by the Northern Paiute people, who lived in the area for thousands of years before the arrival of European settlers. The first European settlers arrived in the area in the late 1800s, and the community was officially established in the early 1900s. The community was originally known as Crossroads, and was renamed Sunriver in the 1950s.
Geography
Sunriver is located in the high desert of Central Oregon, at an elevation of 4,200 feet. The community is situated on the eastern edge of the Cascade Range, and is surrounded by the Deschutes National Forest. The Deschutes River runs through the community, and is a popular destination for fishing and rafting. The area is known for its mild climate, with hot summers and cold winters.
Economy
Sunriver is primarily a tourist destination, and the local economy is largely dependent on tourism. The community is home to a variety of recreational activities, including golf, skiing, snowboarding, fishing, and hiking. Sunriver is also home to a number of restaurants, shops, and lodging facilities.
Demographics
As of the 2010 census, Sunriver had a population of 3,724. The median age of the population was 48.7 years, and the median household income was $68,958. The racial makeup of the community was 94.3% White, 0.7% African American, 0.7% Native American, 0.7% Asian, 0.2% Pacific Islander, and 2.6% from other races. The population was spread out, with 25.3% under the age of 18, 5.2% from 18 to 24, 28.2% from 25 to 44, 28.2% from 45 to 64, and 13.1% who were 65 years of age or older.
Common Questions
What is Per Capita Income in Sunriver?
Per Capita income in Sunriver is $80,857.
What is the Median Family Income in Sunriver?
Median Family Income in Sunriver is $121,134.
What is the Median Household income in Sunriver?
Median Household Income in Sunriver is $87,276.
What is Income or Wage Gap in Sunriver?
Income or Wage Gap in Sunriver is 34.7%.
Women in Sunriver earn 65.3 cents for every dollar earned by a man.
What is Inequality or Gini Index in Sunriver?
Inequality or Gini Index in Sunriver is 0.48.
What is the Total Population of Sunriver?
Total Population of Sunriver is 1,516.
What is the Total Male Population of Sunriver?
Total Male Population of Sunriver is 735.
What is the Total Female Population of Sunriver?
Total Female Population of Sunriver is 781.
What is the Ratio of Males per 100 Females in Sunriver?
There are 94.11 Males per 100 Females in Sunriver.
What is the Ratio of Females per 100 Males in Sunriver?
There are 106.26 Females per 100 Males in Sunriver.
What is the Median Population Age in Sunriver?
Median Population Age in Sunriver is 70.2 Years.
What is the Average Family Size in Sunriver
Average Family Size in Sunriver is 2.1 People.
What is the Average Household Size in Sunriver
Average Household Size in Sunriver is 1.8 People.
How Large is the Labor Force in Sunriver?
There are 481 People in the Labor Forcein in Sunriver.
What is the Percentage of People in the Labor Force in Sunriver?
31.7% of People are in the Labor Force in Sunriver.