Silver Lake, OR Map & Demographics
Silver Lake Map
Silver Lake Overview
$39,121
PER CAPITA INCOME
$86,750
AVG FAMILY INCOME
0.25
INEQUALITY / GINI INDEX
253
TOTAL POPULATION
141
MALE POPULATION
112
FEMALE POPULATION
125.89
MALES / 100 FEMALES
79.43
FEMALES / 100 MALES
34.0
MEDIAN AGE
2.8
AVG FAMILY SIZE
3.0
AVG HOUSEHOLD SIZE
134
LABOR FORCE [ PEOPLE ]
66.7%
PERCENT IN LABOR FORCE
Silver Lake Zip Codes
Silver Lake Area Codes
Income in Silver Lake
Income Overview in Silver Lake
| Characteristic | Number | Measure |
| Per Capita Income | 253 | $39,121 |
| Median Family Income | 83 | $86,750 |
| Mean Family Income | 83 | $99,798 |
| Median Household Income | 83 | $0 |
| Mean Household Income | 83 | $112,311 |
| Income Deficit | 83 | $0 |
| Wage / Income Gap (%) | 253 | 0.00% |
| Wage / Income Gap ($) | 253 | 100.00¢ per $1 |
| Gini / Inequality Index | 253 | 0.25 |
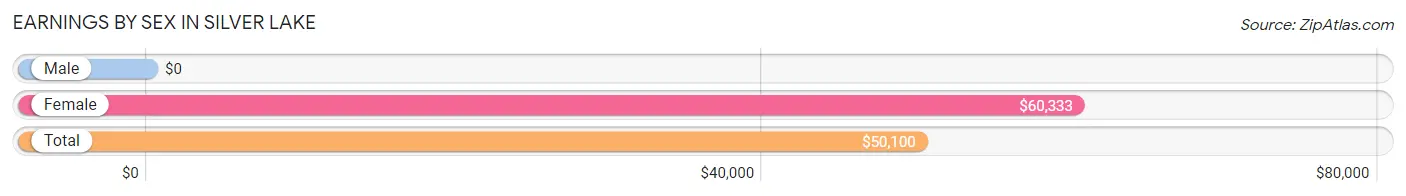
Earnings by Sex in Silver Lake
| Sex | Number | Average Earnings |
| Male | 114 (64.0%) | $0 |
| Female | 64 (36.0%) | $60,333 |
| Total | 178 (100.0%) | $50,100 |
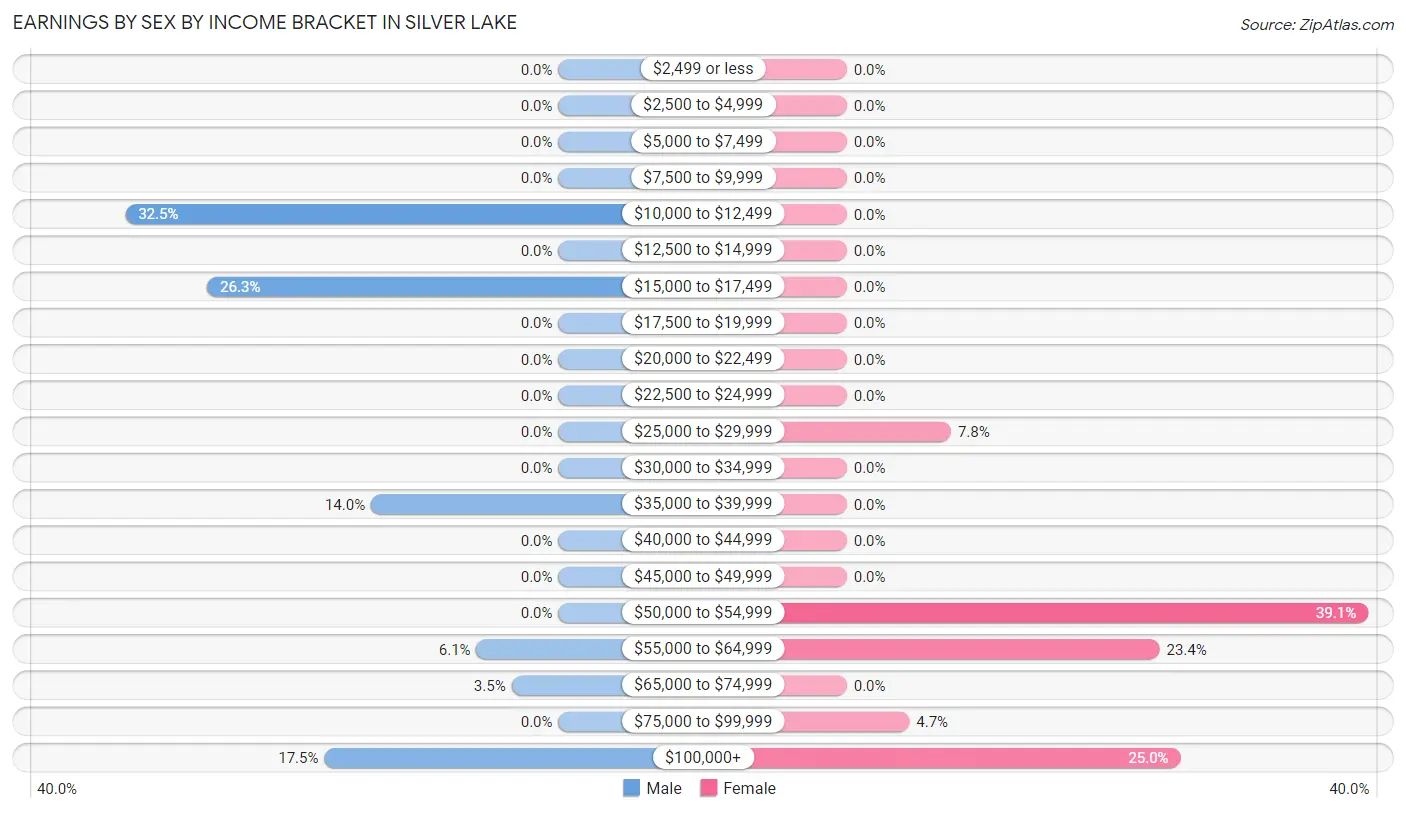
Earnings by Sex by Income Bracket in Silver Lake
The most common earnings brackets in Silver Lake are $10,000 to $12,499 for men (37 | 32.5%) and $50,000 to $54,999 for women (25 | 39.1%).
| Income | Male | Female |
| $2,499 or less | 0 (0.0%) | 0 (0.0%) |
| $2,500 to $4,999 | 0 (0.0%) | 0 (0.0%) |
| $5,000 to $7,499 | 0 (0.0%) | 0 (0.0%) |
| $7,500 to $9,999 | 0 (0.0%) | 0 (0.0%) |
| $10,000 to $12,499 | 37 (32.5%) | 0 (0.0%) |
| $12,500 to $14,999 | 0 (0.0%) | 0 (0.0%) |
| $15,000 to $17,499 | 30 (26.3%) | 0 (0.0%) |
| $17,500 to $19,999 | 0 (0.0%) | 0 (0.0%) |
| $20,000 to $22,499 | 0 (0.0%) | 0 (0.0%) |
| $22,500 to $24,999 | 0 (0.0%) | 0 (0.0%) |
| $25,000 to $29,999 | 0 (0.0%) | 5 (7.8%) |
| $30,000 to $34,999 | 0 (0.0%) | 0 (0.0%) |
| $35,000 to $39,999 | 16 (14.0%) | 0 (0.0%) |
| $40,000 to $44,999 | 0 (0.0%) | 0 (0.0%) |
| $45,000 to $49,999 | 0 (0.0%) | 0 (0.0%) |
| $50,000 to $54,999 | 0 (0.0%) | 25 (39.1%) |
| $55,000 to $64,999 | 7 (6.1%) | 15 (23.4%) |
| $65,000 to $74,999 | 4 (3.5%) | 0 (0.0%) |
| $75,000 to $99,999 | 0 (0.0%) | 3 (4.7%) |
| $100,000+ | 20 (17.5%) | 16 (25.0%) |
| Total | 114 (100.0%) | 64 (100.0%) |
Earnings by Sex by Educational Attainment in Silver Lake
| Educational Attainment | Male Income | Female Income |
| Less than High School | - | - |
| High School Diploma | - | - |
| College or Associate's Degree | - | - |
| Bachelor's Degree | - | - |
| Graduate Degree | - | - |
| Total | - | - |
Family Income in Silver Lake
Family Income Brackets in Silver Lake
According to the Silver Lake family income data, there are 38 families falling into the $50,000 to $74,999 income range, which is the most common income bracket and makes up 45.8% of all families.
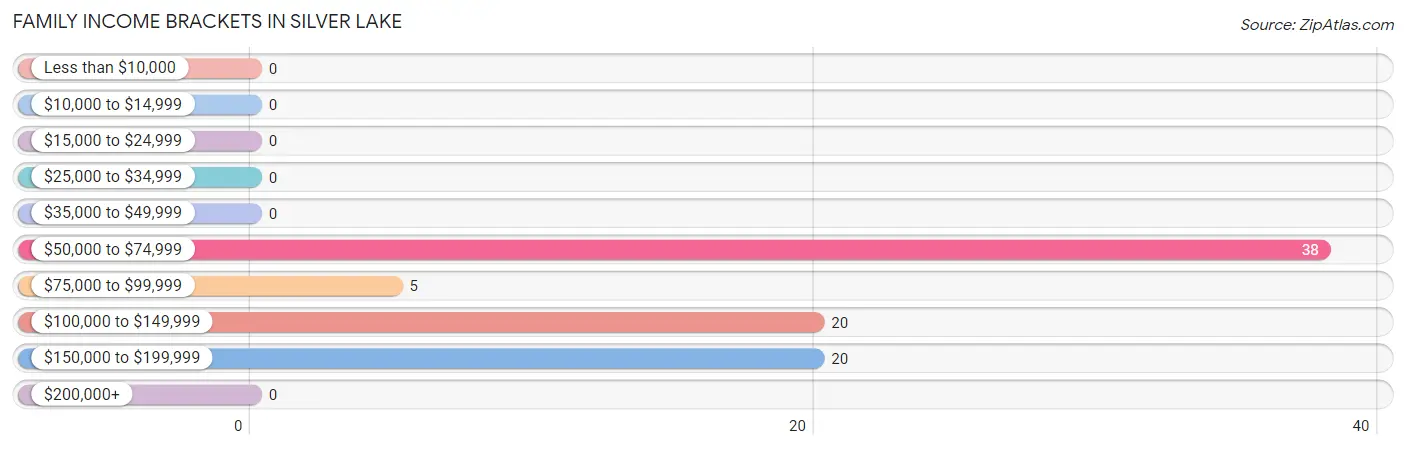
| Income Bracket | # Families | % Families |
| Less than $10,000 | 0 | 0.0% |
| $10,000 to $14,999 | 0 | 0.0% |
| $15,000 to $24,999 | 0 | 0.0% |
| $25,000 to $34,999 | 0 | 0.0% |
| $35,000 to $49,999 | 0 | 0.0% |
| $50,000 to $74,999 | 38 | 45.8% |
| $75,000 to $99,999 | 5 | 6.0% |
| $100,000 to $149,999 | 20 | 24.1% |
| $150,000 to $199,999 | 20 | 24.1% |
| $200,000+ | 0 | 0.0% |
Family Income by Famaliy Size in Silver Lake
3-person families (48 | 57.8%) account for the highest median family income in Silver Lake with $85,500 per family, while 3-person families (48 | 57.8%) have the highest median income of $28,500 per family member.
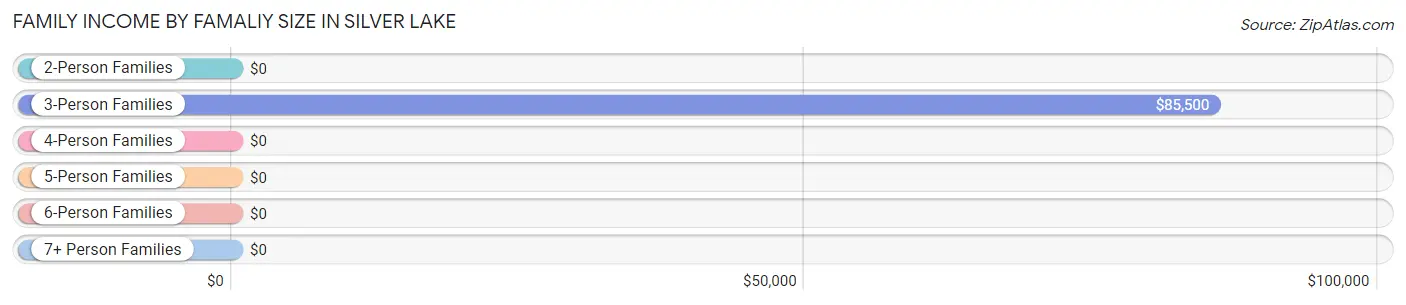
| Income Bracket | # Families | Median Income |
| 2-Person Families | 35 (42.2%) | $0 |
| 3-Person Families | 48 (57.8%) | $85,500 |
| 4-Person Families | 0 (0.0%) | $0 |
| 5-Person Families | 0 (0.0%) | $0 |
| 6-Person Families | 0 (0.0%) | $0 |
| 7+ Person Families | 0 (0.0%) | $0 |
| Total | 83 (100.0%) | $86,750 |
Family Income by Number of Earners in Silver Lake
| Number of Earners | # Families | Median Income |
| No Earners | 0 (0.0%) | $0 |
| 1 Earner | 35 (42.2%) | $0 |
| 2 Earners | 48 (57.8%) | $0 |
| 3+ Earners | 0 (0.0%) | $0 |
| Total | 83 (100.0%) | $86,750 |
Household Income in Silver Lake
Household Income Brackets in Silver Lake
With 40 households falling in the category, the $150,000 to $199,999 income range is the most frequent in Silver Lake, accounting for 48.2% of all households.
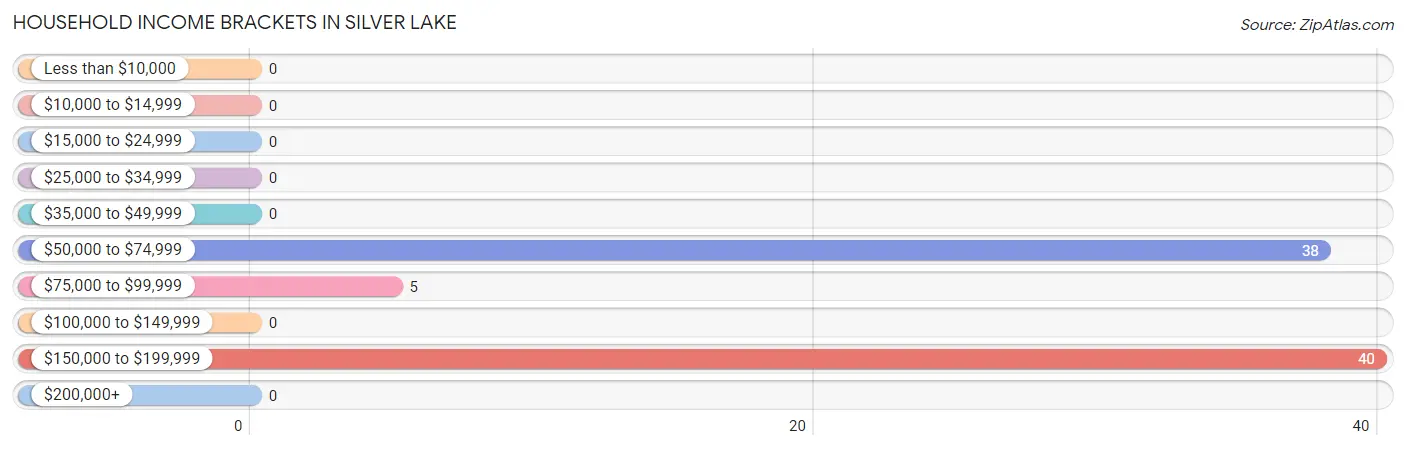
| Income Bracket | # Households | % Households |
| Less than $10,000 | 0 | 0.0% |
| $10,000 to $14,999 | 0 | 0.0% |
| $15,000 to $24,999 | 0 | 0.0% |
| $25,000 to $34,999 | 0 | 0.0% |
| $35,000 to $49,999 | 0 | 0.0% |
| $50,000 to $74,999 | 38 | 45.8% |
| $75,000 to $99,999 | 5 | 6.0% |
| $100,000 to $149,999 | 0 | 0.0% |
| $150,000 to $199,999 | 40 | 48.2% |
| $200,000+ | 0 | 0.0% |
Household Income by Householder Age in Silver Lake
| Income Bracket | # Households | Median Income |
| 15 to 24 Years | 0 (0.0%) | $0 |
| 25 to 44 Years | 63 (75.9%) | $0 |
| 45 to 64 Years | 20 (24.1%) | $0 |
| 65+ Years | 0 (0.0%) | $0 |
| Total | 83 (100.0%) | $0 |
Poverty in Silver Lake
Income Below Poverty by Sex and Age in Silver Lake
| Age Bracket | Male | Female |
| Under 5 Years | 0 (0.0%) | 0 (0.0%) |
| 5 Years | 0 (0.0%) | 0 (0.0%) |
| 6 to 11 Years | 0 (0.0%) | 0 (0.0%) |
| 12 to 14 Years | 0 (0.0%) | 0 (0.0%) |
| 15 Years | 0 (0.0%) | 0 (0.0%) |
| 16 and 17 Years | 0 (0.0%) | 0 (0.0%) |
| 18 to 24 Years | 0 (0.0%) | 0 (0.0%) |
| 25 to 34 Years | 0 (0.0%) | 0 (0.0%) |
| 35 to 44 Years | 0 (0.0%) | 0 (0.0%) |
| 45 to 54 Years | 0 (0.0%) | 0 (0.0%) |
| 55 to 64 Years | 0 (0.0%) | 0 (0.0%) |
| 65 to 74 Years | 0 (0.0%) | 0 (0.0%) |
| 75 Years and over | 0 (0.0%) | 0 (0.0%) |
| Total | 0 (0.0%) | 0 (0.0%) |
Income Above Poverty by Sex and Age in Silver Lake
According to the poverty statistics in Silver Lake, males aged under 5 years and females aged under 5 years are the age groups that are most secure financially, with 100.0% of males and 100.0% of females in these age groups living above the poverty line.
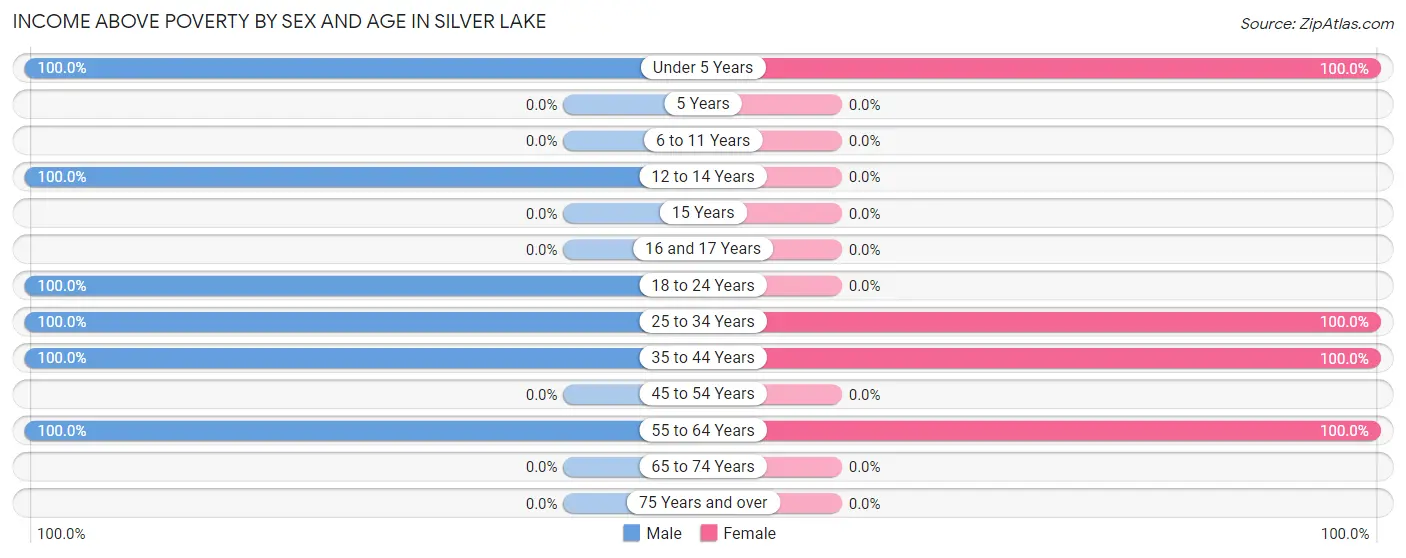
| Age Bracket | Male | Female |
| Under 5 Years | 5 (100.0%) | 25 (100.0%) |
| 5 Years | 0 (0.0%) | 0 (0.0%) |
| 6 to 11 Years | 0 (0.0%) | 0 (0.0%) |
| 12 to 14 Years | 22 (100.0%) | 0 (0.0%) |
| 15 Years | 0 (0.0%) | 0 (0.0%) |
| 16 and 17 Years | 0 (0.0%) | 0 (0.0%) |
| 18 to 24 Years | 30 (100.0%) | 0 (0.0%) |
| 25 to 34 Years | 20 (100.0%) | 25 (100.0%) |
| 35 to 44 Years | 7 (100.0%) | 43 (100.0%) |
| 45 to 54 Years | 0 (0.0%) | 0 (0.0%) |
| 55 to 64 Years | 57 (100.0%) | 19 (100.0%) |
| 65 to 74 Years | 0 (0.0%) | 0 (0.0%) |
| 75 Years and over | 0 (0.0%) | 0 (0.0%) |
| Total | 141 (100.0%) | 112 (100.0%) |
Income Below Poverty Among Married-Couple Families in Silver Lake
| Children | Above Poverty | Below Poverty |
| No Children | 20 (100.0%) | 0 (0.0%) |
| 1 or 2 Children | 5 (100.0%) | 0 (0.0%) |
| 3 or 4 Children | 0 (0.0%) | 0 (0.0%) |
| 5 or more Children | 0 (0.0%) | 0 (0.0%) |
| Total | 25 (100.0%) | 0 (0.0%) |
Income Below Poverty Among Single-Parent Households in Silver Lake
| Children | Single Father | Single Mother |
| No Children | 0 (0.0%) | 0 (0.0%) |
| 1 or 2 Children | 0 (0.0%) | 0 (0.0%) |
| 3 or 4 Children | 0 (0.0%) | 0 (0.0%) |
| 5 or more Children | 0 (0.0%) | 0 (0.0%) |
| Total | 0 (0.0%) | 0 (0.0%) |
Income Below Poverty Among Married-Couple vs Single-Parent Households in Silver Lake
| Children | Married-Couple Families | Single-Parent Households |
| No Children | 0 (0.0%) | 0 (0.0%) |
| 1 or 2 Children | 0 (0.0%) | 0 (0.0%) |
| 3 or 4 Children | 0 (0.0%) | 0 (0.0%) |
| 5 or more Children | 0 (0.0%) | 0 (0.0%) |
| Total | 0 (0.0%) | 0 (0.0%) |
Race in Silver Lake
The most populous races in Silver Lake are , and White / Caucasian (253 | 100.0%).
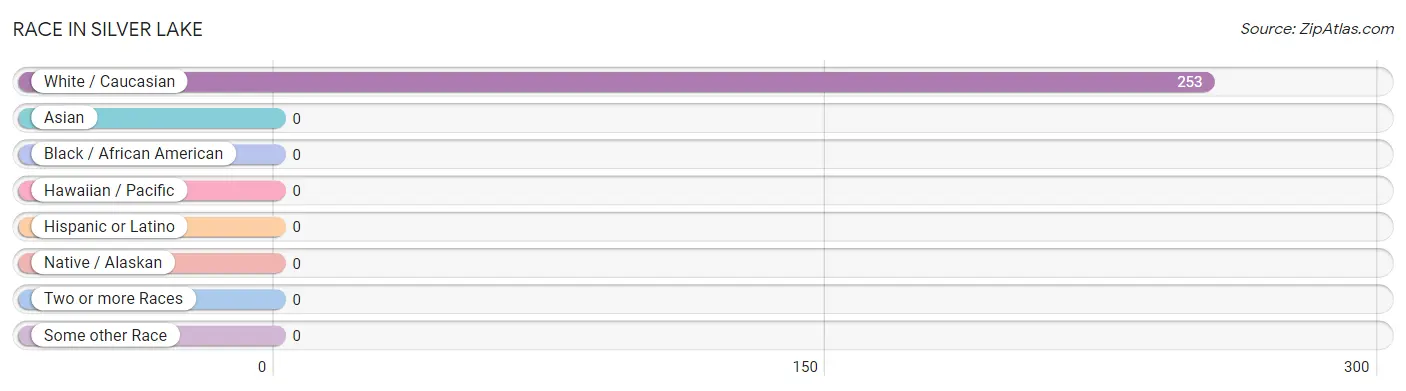
| Race | # Population | % Population |
| Asian | 0 | 0.0% |
| Black / African American | 0 | 0.0% |
| Hawaiian / Pacific | 0 | 0.0% |
| Hispanic or Latino | 0 | 0.0% |
| Native / Alaskan | 0 | 0.0% |
| White / Caucasian | 253 | 100.0% |
| Two or more Races | 0 | 0.0% |
| Some other Race | 0 | 0.0% |
| Total | 253 | 100.0% |
Ancestry in Silver Lake
The most populous ancestries reported in Silver Lake are German (114 | 45.1%), Portuguese (25 | 9.9%), Irish (22 | 8.7%), English (15 | 5.9%), and Scottish (15 | 5.9%), together accounting for 75.5% of all Silver Lake residents.
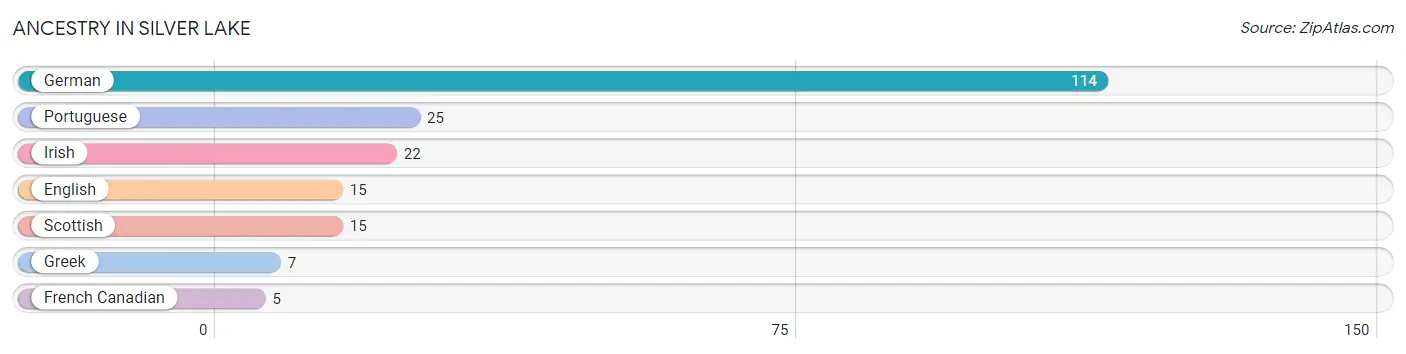
| Ancestry | # Population | % Population |
| English | 15 | 5.9% |
| French Canadian | 5 | 2.0% |
| German | 114 | 45.1% |
| Greek | 7 | 2.8% |
| Irish | 22 | 8.7% |
| Portuguese | 25 | 9.9% |
| Scottish | 15 | 5.9% | View All 7 Rows |
Immigrants in Silver Lake

| Immigration Origin | # Population | % Population | View All 0 Rows |
Sex and Age in Silver Lake
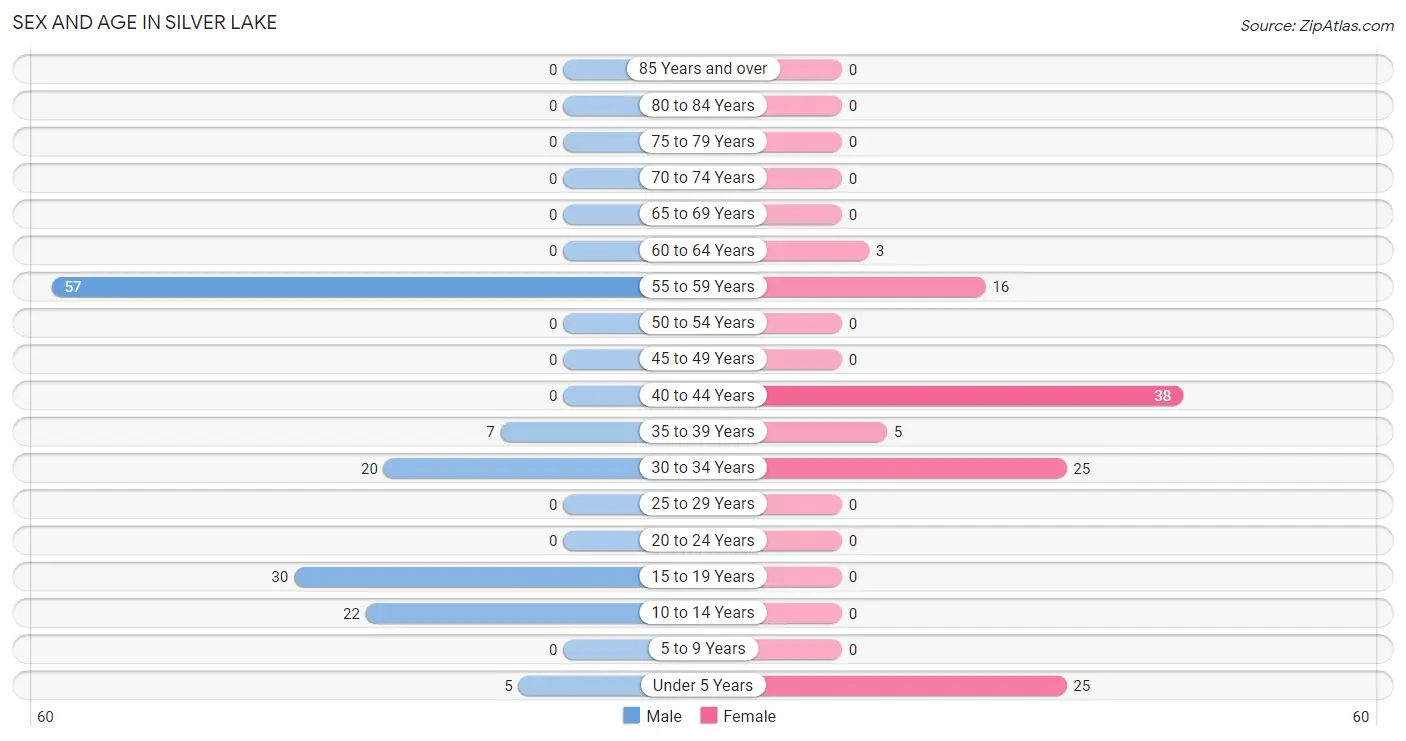
Sex and Age in Silver Lake
The most populous age groups in Silver Lake are 55 to 59 Years (57 | 40.4%) for men and 40 to 44 Years (38 | 33.9%) for women.
| Age Bracket | Male | Female |
| Under 5 Years | 5 (3.5%) | 25 (22.3%) |
| 5 to 9 Years | 0 (0.0%) | 0 (0.0%) |
| 10 to 14 Years | 22 (15.6%) | 0 (0.0%) |
| 15 to 19 Years | 30 (21.3%) | 0 (0.0%) |
| 20 to 24 Years | 0 (0.0%) | 0 (0.0%) |
| 25 to 29 Years | 0 (0.0%) | 0 (0.0%) |
| 30 to 34 Years | 20 (14.2%) | 25 (22.3%) |
| 35 to 39 Years | 7 (5.0%) | 5 (4.5%) |
| 40 to 44 Years | 0 (0.0%) | 38 (33.9%) |
| 45 to 49 Years | 0 (0.0%) | 0 (0.0%) |
| 50 to 54 Years | 0 (0.0%) | 0 (0.0%) |
| 55 to 59 Years | 57 (40.4%) | 16 (14.3%) |
| 60 to 64 Years | 0 (0.0%) | 3 (2.7%) |
| 65 to 69 Years | 0 (0.0%) | 0 (0.0%) |
| 70 to 74 Years | 0 (0.0%) | 0 (0.0%) |
| 75 to 79 Years | 0 (0.0%) | 0 (0.0%) |
| 80 to 84 Years | 0 (0.0%) | 0 (0.0%) |
| 85 Years and over | 0 (0.0%) | 0 (0.0%) |
| Total | 141 (100.0%) | 112 (100.0%) |
Families and Households in Silver Lake
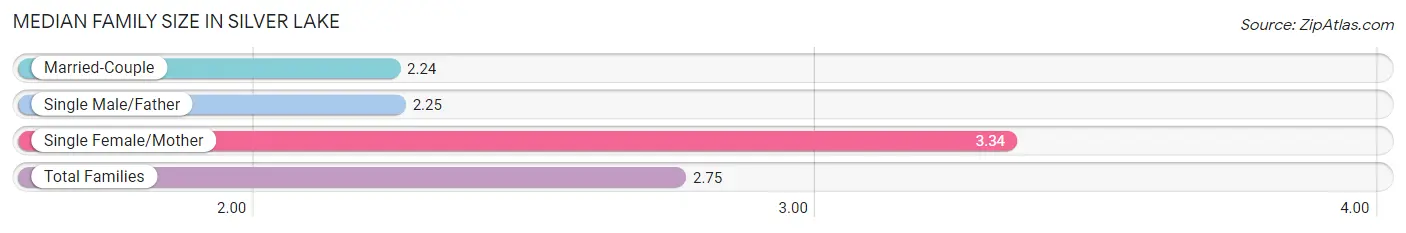
Median Family Size in Silver Lake
The median family size in Silver Lake is 2.75 persons per family, with single female/mother families (38 | 45.8%) accounting for the largest median family size of 3.34 persons per family. On the other hand, married-couple families (25 | 30.1%) represent the smallest median family size with 2.24 persons per family.
| Family Type | # Families | Family Size |
| Married-Couple | 25 (30.1%) | 2.24 |
| Single Male/Father | 20 (24.1%) | 2.25 |
| Single Female/Mother | 38 (45.8%) | 3.34 |
| Total Families | 83 (100.0%) | 2.75 |
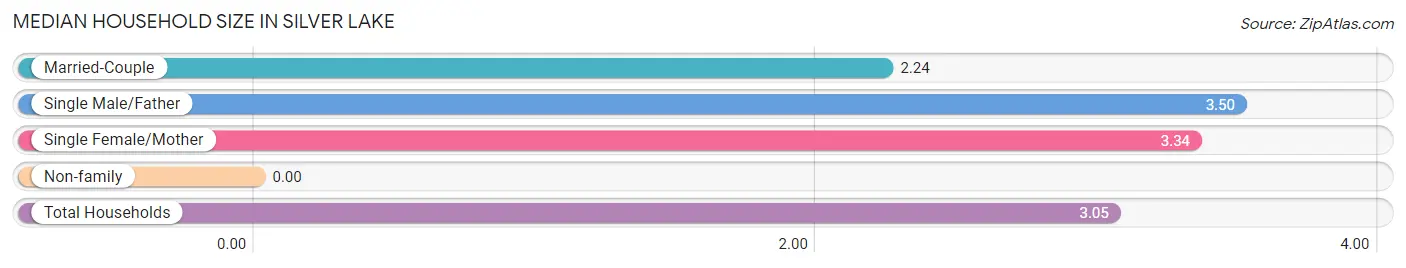
Median Household Size in Silver Lake
| Household Type | # Households | Household Size |
| Married-Couple | 25 (30.1%) | 2.24 |
| Single Male/Father | 20 (24.1%) | 3.50 |
| Single Female/Mother | 38 (45.8%) | 3.34 |
| Non-family | 0 (0.0%) | - |
| Total Households | 83 (100.0%) | 3.05 |
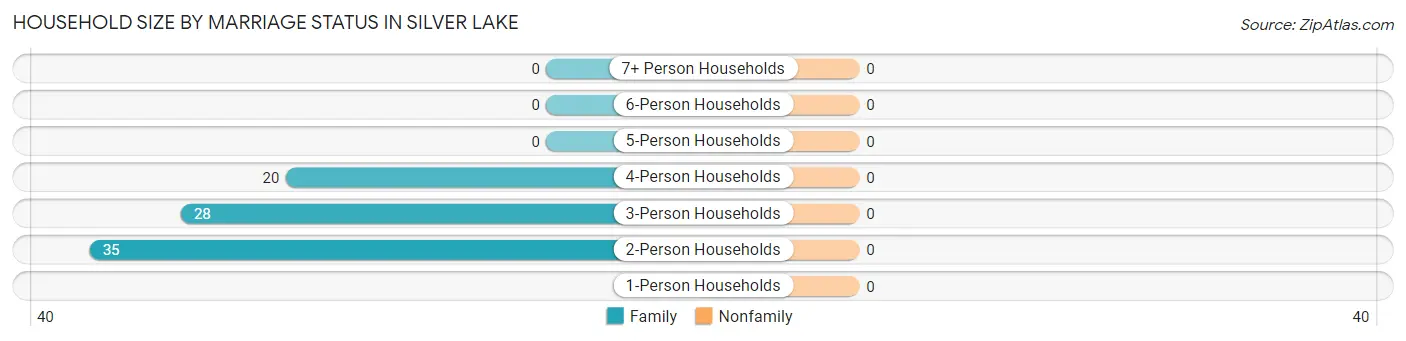
Household Size by Marriage Status in Silver Lake
| Household Size | Family Households | Nonfamily Households |
| 1-Person Households | - | 0 (0.0%) |
| 2-Person Households | 35 (42.2%) | 0 (0.0%) |
| 3-Person Households | 28 (33.7%) | 0 (0.0%) |
| 4-Person Households | 20 (24.1%) | 0 (0.0%) |
| 5-Person Households | 0 (0.0%) | 0 (0.0%) |
| 6-Person Households | 0 (0.0%) | 0 (0.0%) |
| 7+ Person Households | 0 (0.0%) | 0 (0.0%) |
| Total | 83 (100.0%) | 0 (0.0%) |
Female Fertility in Silver Lake
Fertility by Age in Silver Lake
Average fertility rate in Silver Lake is 74.0 births per 1,000 women. Women in the age bracket of 35 to 50 years have the highest fertility rate with 116.0 births per 1,000 women. Women in the age bracket of 35 to 50 years acount for 100.0% of all women with births.
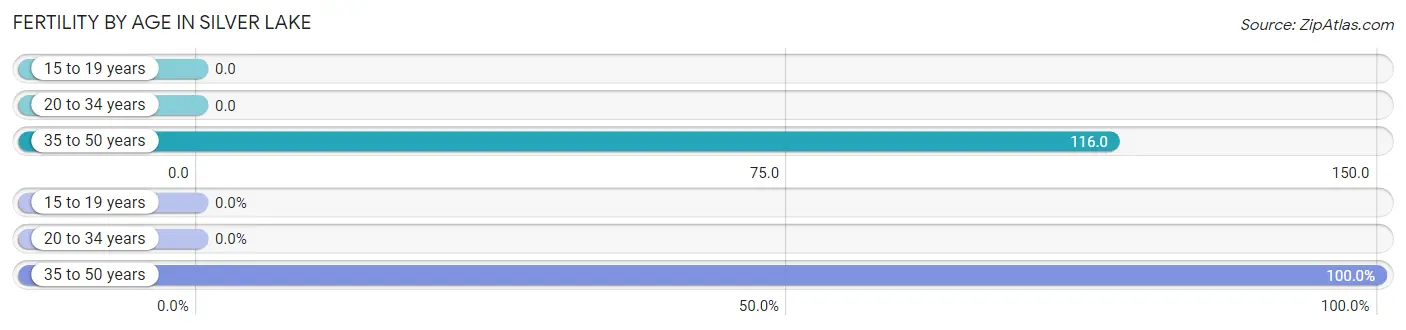
| Age Bracket | Women with Births | Births / 1,000 Women |
| 15 to 19 years | 0 (0.0%) | 0.0 |
| 20 to 34 years | 0 (0.0%) | 0.0 |
| 35 to 50 years | 5 (100.0%) | 116.0 |
| Total | 5 (100.0%) | 74.0 |
Fertility by Age by Marriage Status in Silver Lake
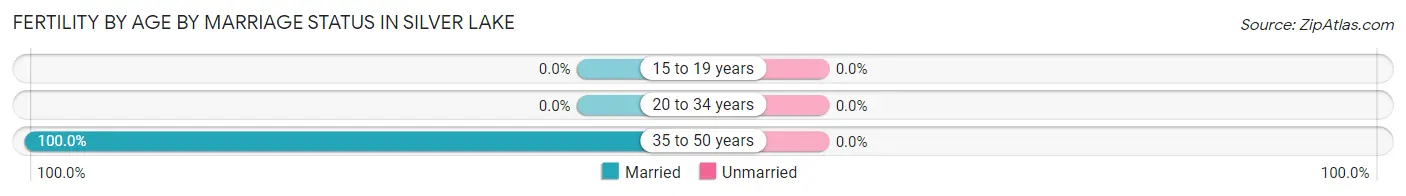
| Age Bracket | Married | Unmarried |
| 15 to 19 years | 0 (0.0%) | 0 (0.0%) |
| 20 to 34 years | 0 (0.0%) | 0 (0.0%) |
| 35 to 50 years | 5 (100.0%) | 0 (0.0%) |
| Total | 5 (100.0%) | 0 (0.0%) |
Fertility by Education in Silver Lake
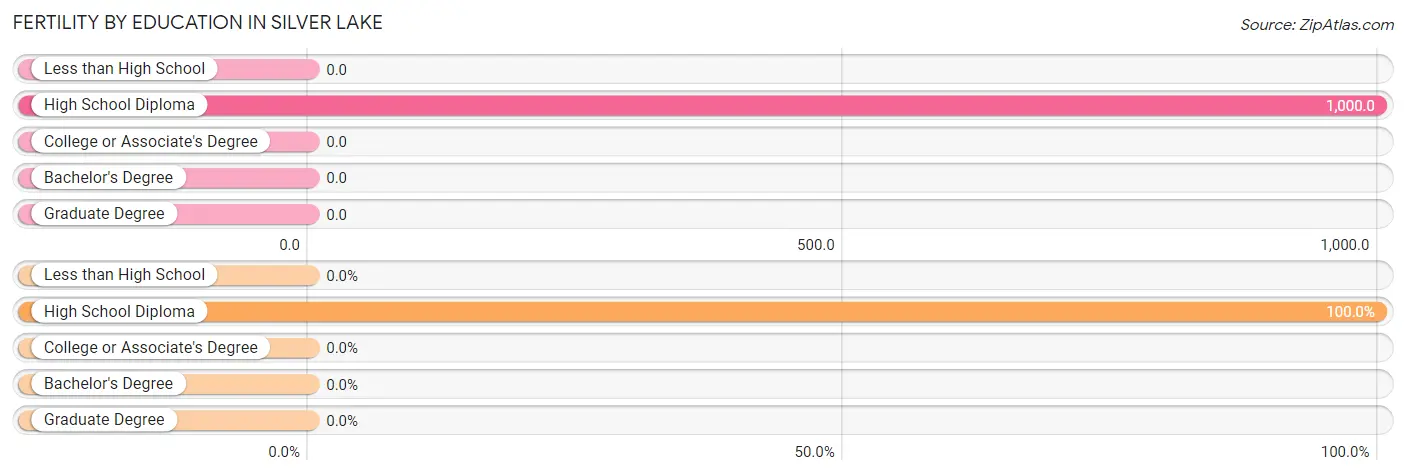
| Educational Attainment | Women with Births | Births / 1,000 Women |
| Less than High School | 0 (0.0%) | 0.0 |
| High School Diploma | 5 (100.0%) | 1,000.0 |
| College or Associate's Degree | 0 (0.0%) | 0.0 |
| Bachelor's Degree | 0 (0.0%) | 0.0 |
| Graduate Degree | 0 (0.0%) | 0.0 |
| Total | 5 (100.0%) | 74.0 |
Fertility by Education by Marriage Status in Silver Lake
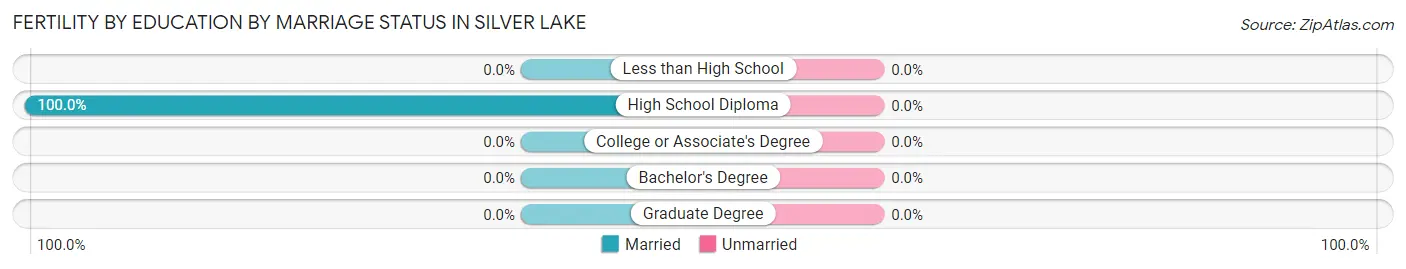
| Educational Attainment | Married | Unmarried |
| Less than High School | 0 (0.0%) | 0 (0.0%) |
| High School Diploma | 5 (100.0%) | 0 (0.0%) |
| College or Associate's Degree | 0 (0.0%) | 0 (0.0%) |
| Bachelor's Degree | 0 (0.0%) | 0 (0.0%) |
| Graduate Degree | 0 (0.0%) | 0 (0.0%) |
| Total | 5 (100.0%) | 0 (0.0%) |
Employment Characteristics in Silver Lake
Employment by Class of Employer in Silver Lake
Among the 129 employed individuals in Silver Lake, self-employed (not incorporated) (46 | 35.7%), private company employees (40 | 31.0%), and state government employees (25 | 19.4%) make up the most common classes of employment.
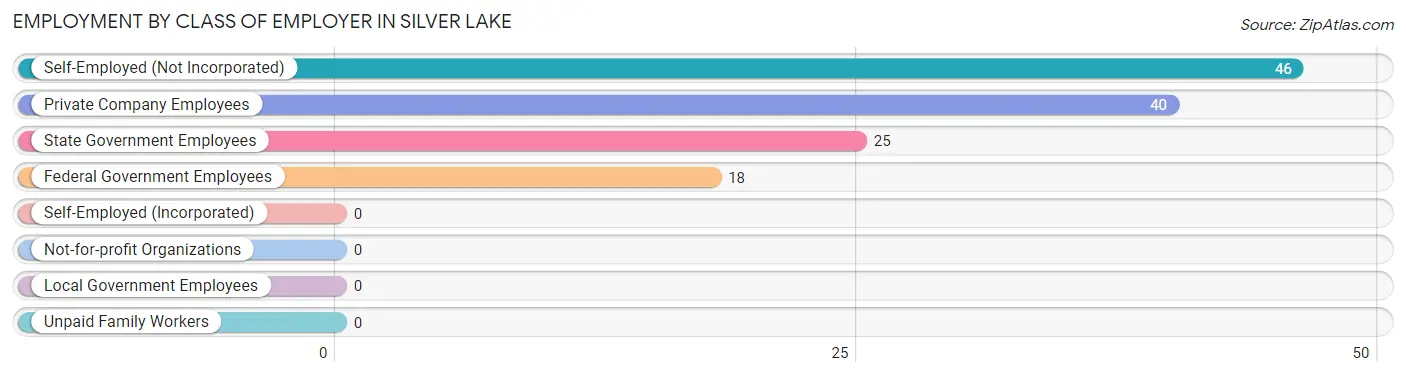
| Employer Class | # Employees | % Employees |
| Private Company Employees | 40 | 31.0% |
| Self-Employed (Incorporated) | 0 | 0.0% |
| Self-Employed (Not Incorporated) | 46 | 35.7% |
| Not-for-profit Organizations | 0 | 0.0% |
| Local Government Employees | 0 | 0.0% |
| State Government Employees | 25 | 19.4% |
| Federal Government Employees | 18 | 14.0% |
| Unpaid Family Workers | 0 | 0.0% |
| Total | 129 | 100.0% |
Employment Status by Age in Silver Lake
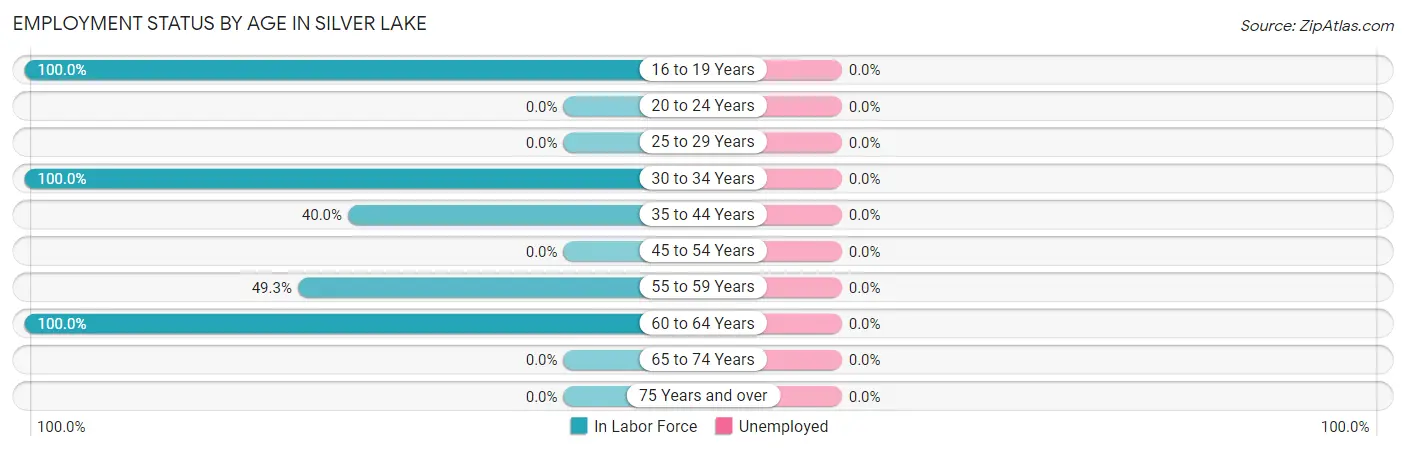
| Age Bracket | In Labor Force | Unemployed |
| 16 to 19 Years | 30 (100.0%) | 0 (0.0%) |
| 20 to 24 Years | 0 (0.0%) | 0 (0.0%) |
| 25 to 29 Years | 0 (0.0%) | 0 (0.0%) |
| 30 to 34 Years | 45 (100.0%) | 0 (0.0%) |
| 35 to 44 Years | 20 (40.0%) | 0 (0.0%) |
| 45 to 54 Years | 0 (0.0%) | 0 (0.0%) |
| 55 to 59 Years | 36 (49.3%) | 0 (0.0%) |
| 60 to 64 Years | 3 (100.0%) | 0 (0.0%) |
| 65 to 74 Years | 0 (0.0%) | 0 (0.0%) |
| 75 Years and over | 0 (0.0%) | 0 (0.0%) |
| Total | 134 (66.7%) | 0 (0.0%) |
Employment Status by Educational Attainment in Silver Lake
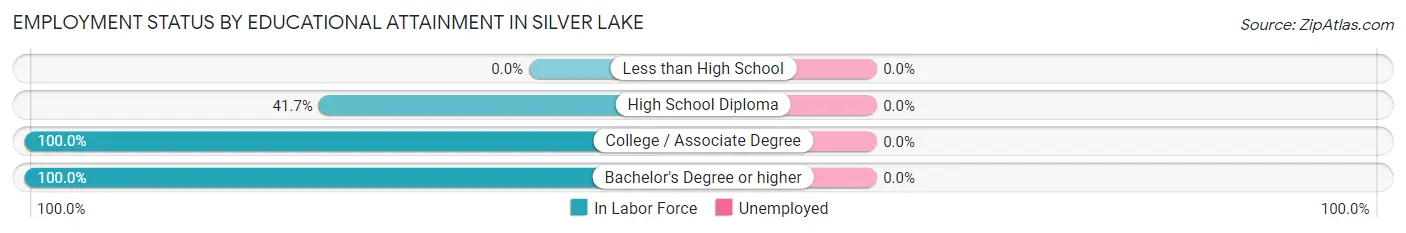
| Educational Attainment | In Labor Force | Unemployed |
| Less than High School | 0 (0.0%) | 0 (0.0%) |
| High School Diploma | 5 (41.7%) | 0 (0.0%) |
| College / Associate Degree | 54 (100.0%) | 0 (0.0%) |
| Bachelor's Degree or higher | 45 (100.0%) | 0 (0.0%) |
| Total | 104 (60.8%) | 0 (0.0%) |
Employment Occupations by Sex in Silver Lake
Management, Business, Science and Arts Occupations
The most common Management, Business, Science and Arts occupations in Silver Lake are Management (55 | 41.0%), Community & Social Service (25 | 18.7%), and Education Instruction & Library (25 | 18.7%).
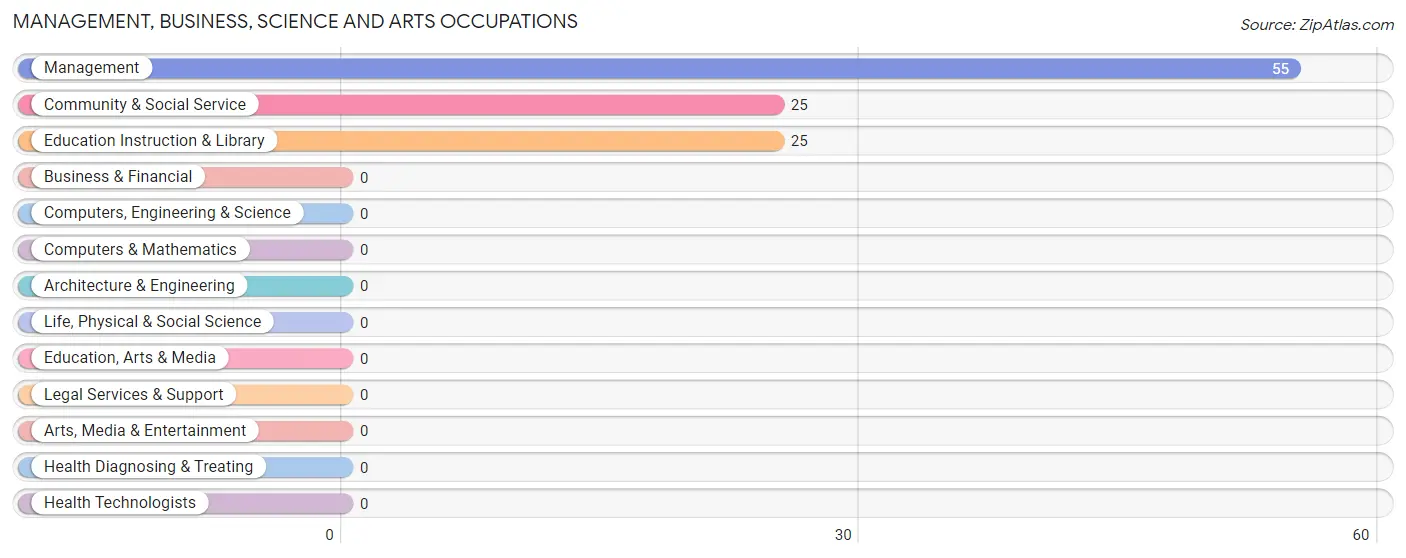
Management, Business, Science and Arts Occupations by Sex
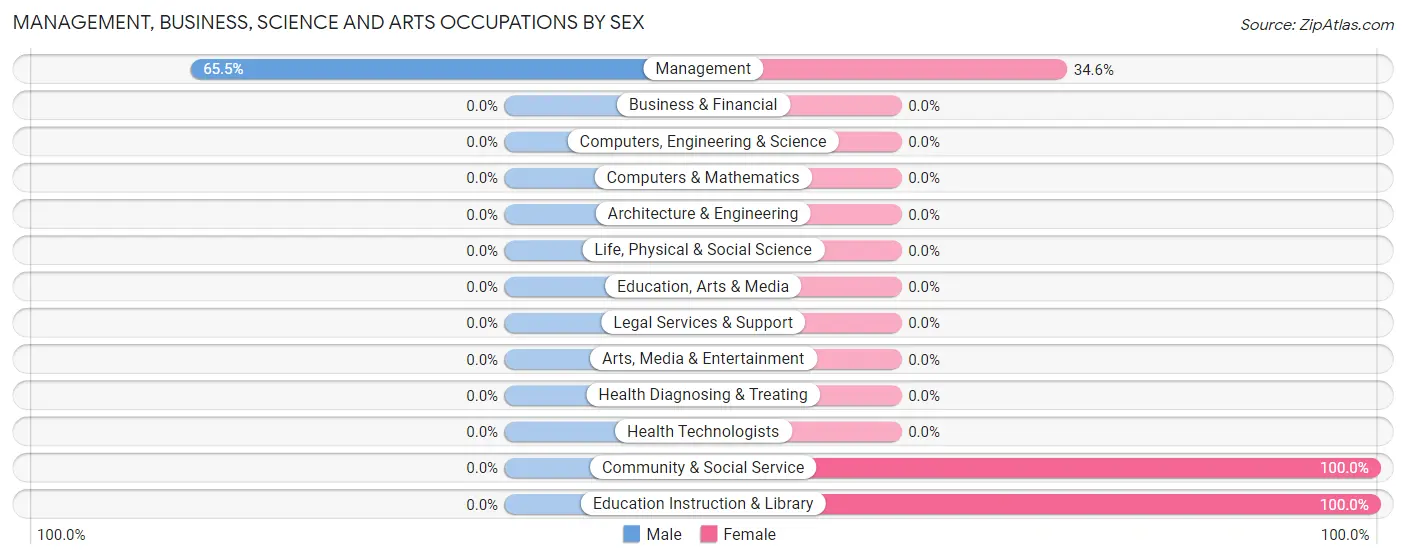
| Occupation | Male | Female |
| Management | 36 (65.4%) | 19 (34.5%) |
| Business & Financial | 0 (0.0%) | 0 (0.0%) |
| Computers, Engineering & Science | 0 (0.0%) | 0 (0.0%) |
| Computers & Mathematics | 0 (0.0%) | 0 (0.0%) |
| Architecture & Engineering | 0 (0.0%) | 0 (0.0%) |
| Life, Physical & Social Science | 0 (0.0%) | 0 (0.0%) |
| Community & Social Service | 0 (0.0%) | 25 (100.0%) |
| Education, Arts & Media | 0 (0.0%) | 0 (0.0%) |
| Legal Services & Support | 0 (0.0%) | 0 (0.0%) |
| Education Instruction & Library | 0 (0.0%) | 25 (100.0%) |
| Arts, Media & Entertainment | 0 (0.0%) | 0 (0.0%) |
| Health Diagnosing & Treating | 0 (0.0%) | 0 (0.0%) |
| Health Technologists | 0 (0.0%) | 0 (0.0%) |
| Total (Category) | 36 (45.0%) | 44 (55.0%) |
| Total (Overall) | 70 (52.2%) | 64 (47.8%) |
Services Occupations
Services Occupations by Sex
| Occupation | Male | Female |
| Healthcare Support | 0 (0.0%) | 0 (0.0%) |
| Security & Protection | 0 (0.0%) | 0 (0.0%) |
| Firefighting & Prevention | 0 (0.0%) | 0 (0.0%) |
| Law Enforcement | 0 (0.0%) | 0 (0.0%) |
| Food Preparation & Serving | 0 (0.0%) | 0 (0.0%) |
| Cleaning & Maintenance | 0 (0.0%) | 0 (0.0%) |
| Personal Care & Service | 0 (0.0%) | 0 (0.0%) |
| Total (Category) | 0 (0.0%) | 0 (0.0%) |
| Total (Overall) | 70 (52.2%) | 64 (47.8%) |
Sales and Office Occupations
The most common Sales and Office occupations in Silver Lake are Office & Administration (45 | 33.6%), and Sales & Related (5 | 3.7%).
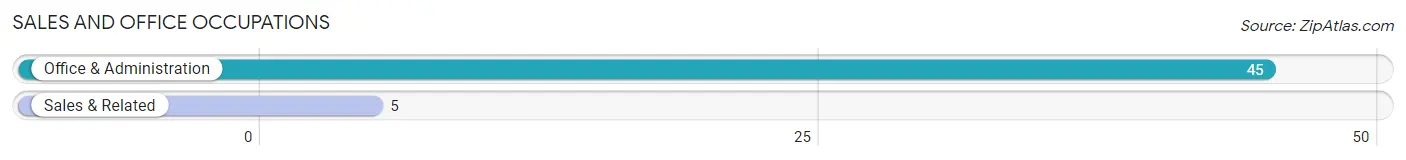
Sales and Office Occupations by Sex
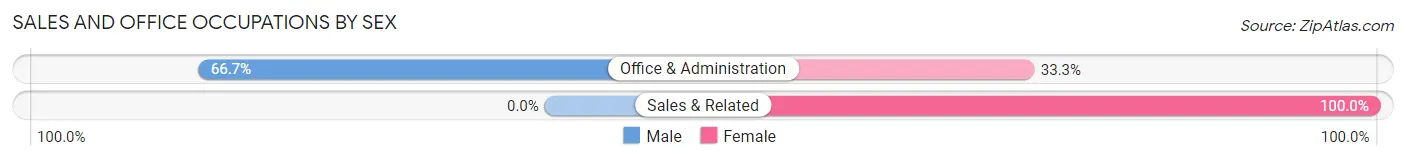
| Occupation | Male | Female |
| Sales & Related | 0 (0.0%) | 5 (100.0%) |
| Office & Administration | 30 (66.7%) | 15 (33.3%) |
| Total (Category) | 30 (60.0%) | 20 (40.0%) |
| Total (Overall) | 70 (52.2%) | 64 (47.8%) |
Natural Resources, Construction and Maintenance Occupations
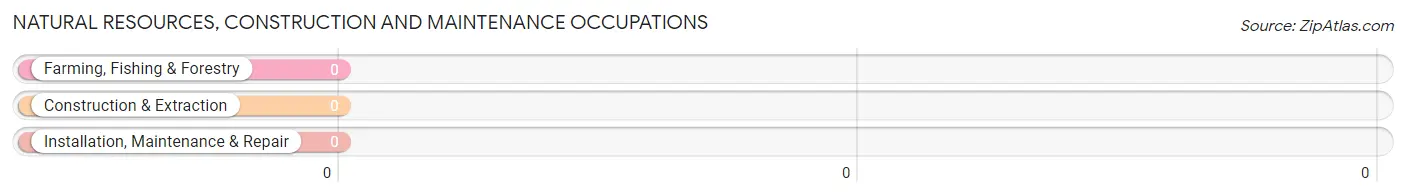
Natural Resources, Construction and Maintenance Occupations by Sex
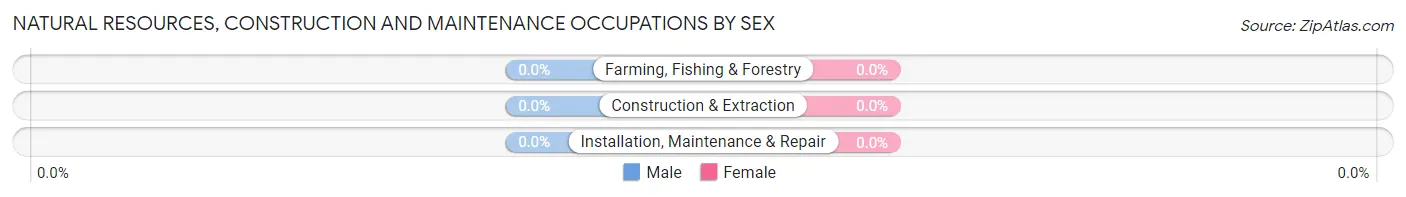
| Occupation | Male | Female |
| Farming, Fishing & Forestry | 0 (0.0%) | 0 (0.0%) |
| Construction & Extraction | 0 (0.0%) | 0 (0.0%) |
| Installation, Maintenance & Repair | 0 (0.0%) | 0 (0.0%) |
| Total (Category) | 0 (0.0%) | 0 (0.0%) |
| Total (Overall) | 70 (52.2%) | 64 (47.8%) |
Production, Transportation and Moving Occupations
The most common Production, Transportation and Moving occupations in Silver Lake are , and Transportation (4 | 3.0%).
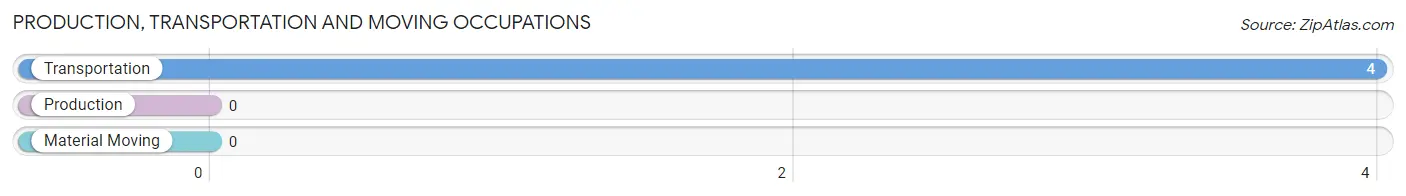
Production, Transportation and Moving Occupations by Sex
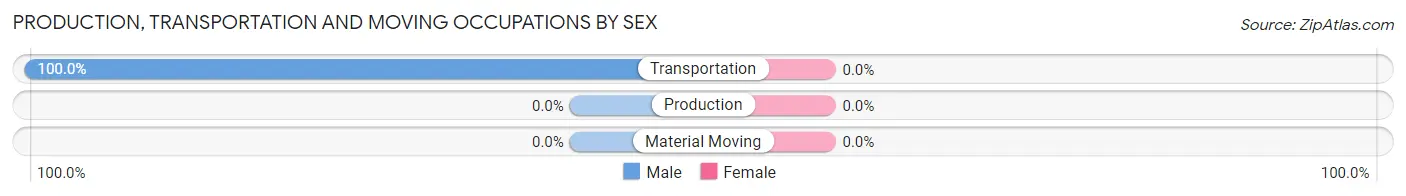
| Occupation | Male | Female |
| Production | 0 (0.0%) | 0 (0.0%) |
| Transportation | 4 (100.0%) | 0 (0.0%) |
| Material Moving | 0 (0.0%) | 0 (0.0%) |
| Total (Category) | 4 (100.0%) | 0 (0.0%) |
| Total (Overall) | 70 (52.2%) | 64 (47.8%) |
Employment Industries by Sex in Silver Lake
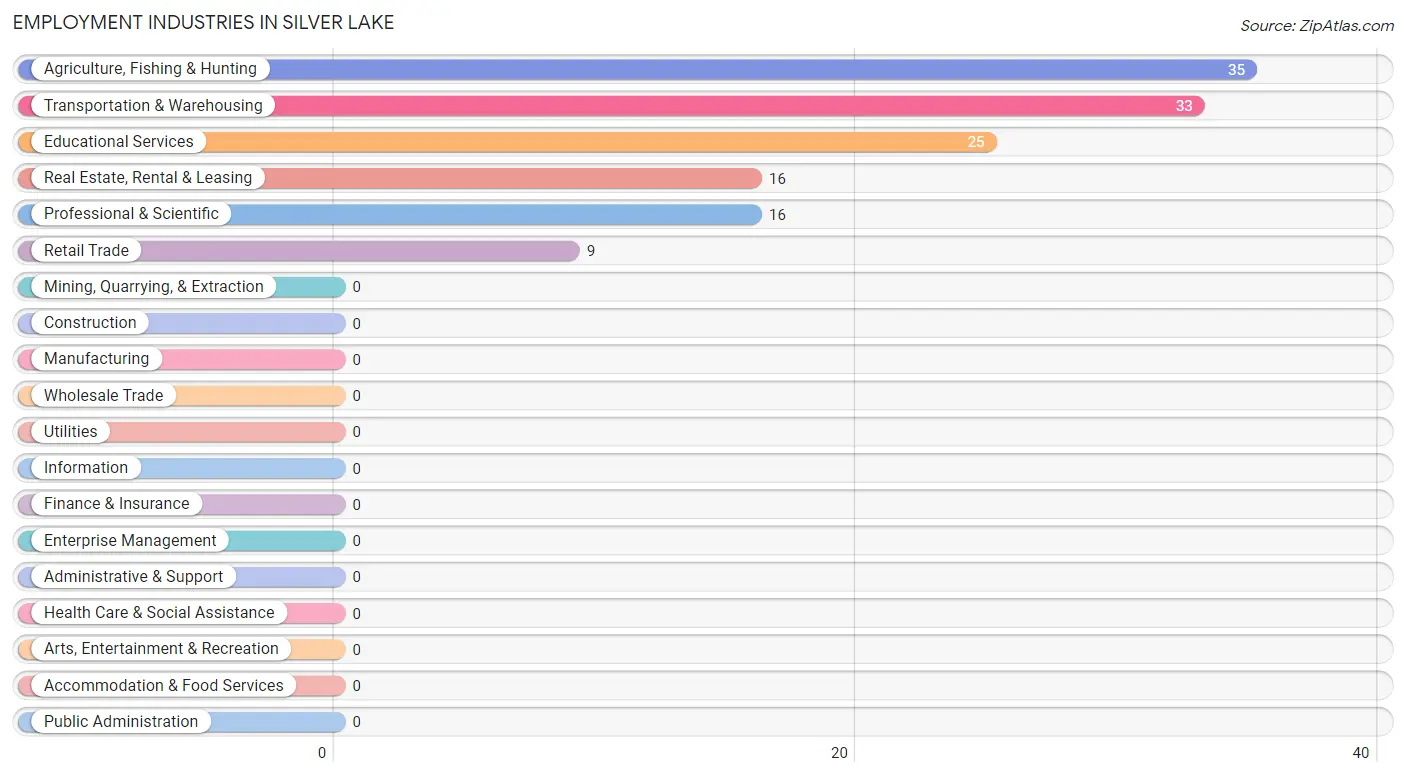
Employment Industries in Silver Lake
The major employment industries in Silver Lake include Agriculture, Fishing & Hunting (35 | 26.1%), Transportation & Warehousing (33 | 24.6%), Educational Services (25 | 18.7%), Real Estate, Rental & Leasing (16 | 11.9%), and Professional & Scientific (16 | 11.9%).
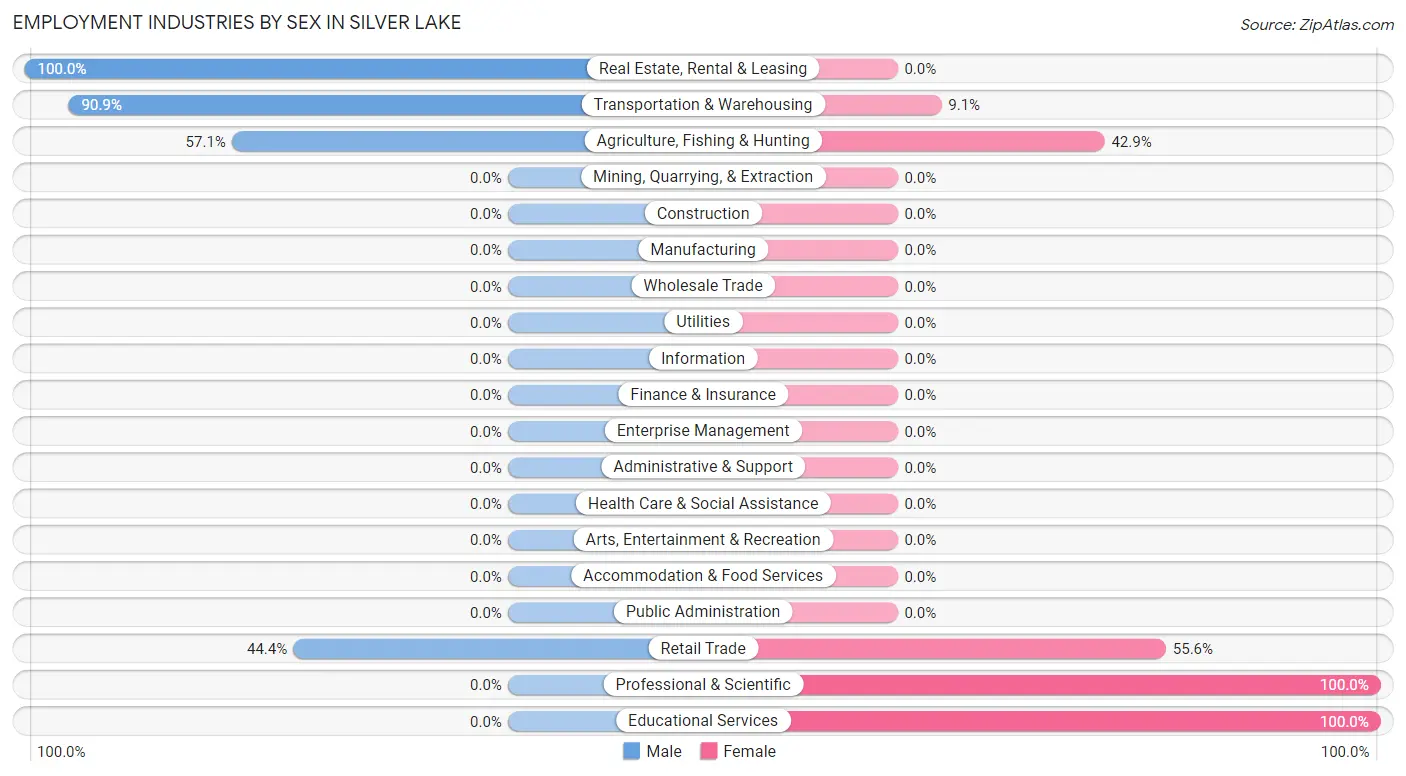
Employment Industries by Sex in Silver Lake
The Silver Lake industries that see more men than women are Real Estate, Rental & Leasing (100.0%), Transportation & Warehousing (90.9%), and Agriculture, Fishing & Hunting (57.1%), whereas the industries that tend to have a higher number of women are Professional & Scientific (100.0%), Educational Services (100.0%), and Retail Trade (55.6%).
| Industry | Male | Female |
| Agriculture, Fishing & Hunting | 20 (57.1%) | 15 (42.9%) |
| Mining, Quarrying, & Extraction | 0 (0.0%) | 0 (0.0%) |
| Construction | 0 (0.0%) | 0 (0.0%) |
| Manufacturing | 0 (0.0%) | 0 (0.0%) |
| Wholesale Trade | 0 (0.0%) | 0 (0.0%) |
| Retail Trade | 4 (44.4%) | 5 (55.6%) |
| Transportation & Warehousing | 30 (90.9%) | 3 (9.1%) |
| Utilities | 0 (0.0%) | 0 (0.0%) |
| Information | 0 (0.0%) | 0 (0.0%) |
| Finance & Insurance | 0 (0.0%) | 0 (0.0%) |
| Real Estate, Rental & Leasing | 16 (100.0%) | 0 (0.0%) |
| Professional & Scientific | 0 (0.0%) | 16 (100.0%) |
| Enterprise Management | 0 (0.0%) | 0 (0.0%) |
| Administrative & Support | 0 (0.0%) | 0 (0.0%) |
| Educational Services | 0 (0.0%) | 25 (100.0%) |
| Health Care & Social Assistance | 0 (0.0%) | 0 (0.0%) |
| Arts, Entertainment & Recreation | 0 (0.0%) | 0 (0.0%) |
| Accommodation & Food Services | 0 (0.0%) | 0 (0.0%) |
| Public Administration | 0 (0.0%) | 0 (0.0%) |
| Total | 70 (52.2%) | 64 (47.8%) |
Education in Silver Lake
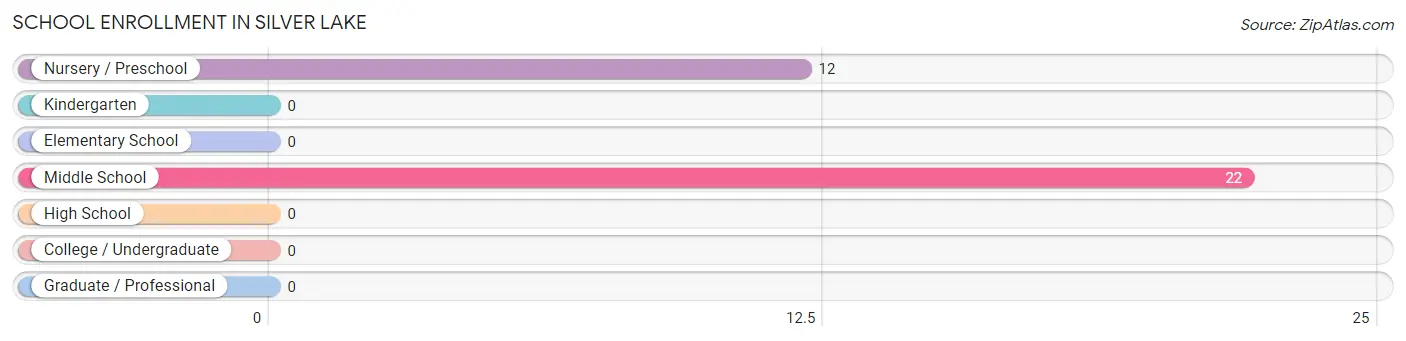
School Enrollment in Silver Lake
The most common levels of schooling among the 34 students in Silver Lake are middle school (22 | 64.7%), and nursery / preschool (12 | 35.3%).
| School Level | # Students | % Students |
| Nursery / Preschool | 12 | 35.3% |
| Kindergarten | 0 | 0.0% |
| Elementary School | 0 | 0.0% |
| Middle School | 22 | 64.7% |
| High School | 0 | 0.0% |
| College / Undergraduate | 0 | 0.0% |
| Graduate / Professional | 0 | 0.0% |
| Total | 34 | 100.0% |
School Enrollment by Age by Funding Source in Silver Lake
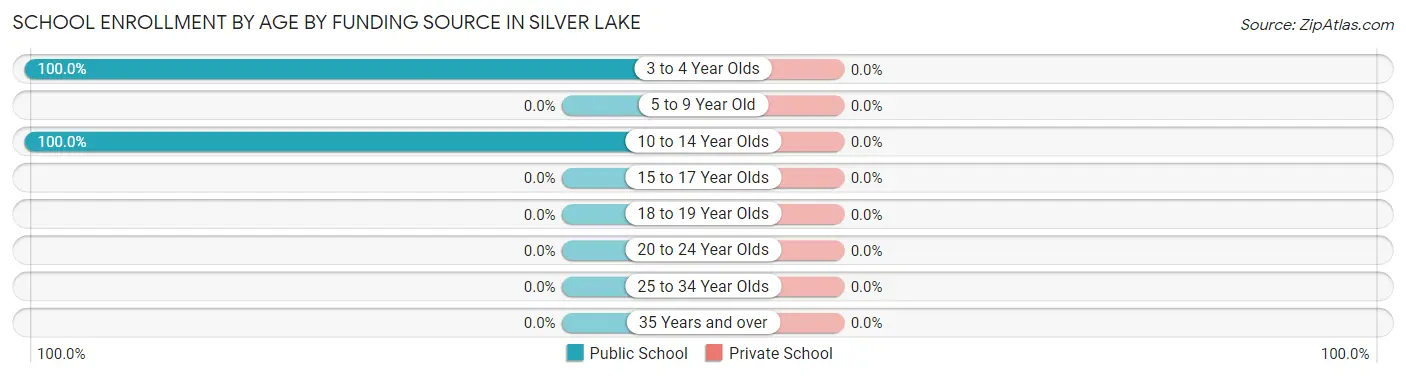
| Age Bracket | Public School | Private School |
| 3 to 4 Year Olds | 12 (100.0%) | 0 (0.0%) |
| 5 to 9 Year Old | 0 (0.0%) | 0 (0.0%) |
| 10 to 14 Year Olds | 22 (100.0%) | 0 (0.0%) |
| 15 to 17 Year Olds | 0 (0.0%) | 0 (0.0%) |
| 18 to 19 Year Olds | 0 (0.0%) | 0 (0.0%) |
| 20 to 24 Year Olds | 0 (0.0%) | 0 (0.0%) |
| 25 to 34 Year Olds | 0 (0.0%) | 0 (0.0%) |
| 35 Years and over | 0 (0.0%) | 0 (0.0%) |
| Total | 34 (100.0%) | 0 (0.0%) |
Educational Attainment by Field of Study in Silver Lake
Bio, nature & agricultural (45 | 64.3%), and education (25 | 35.7%) are the most common fields of study among 70 individuals in Silver Lake who have obtained a bachelor's degree or higher.
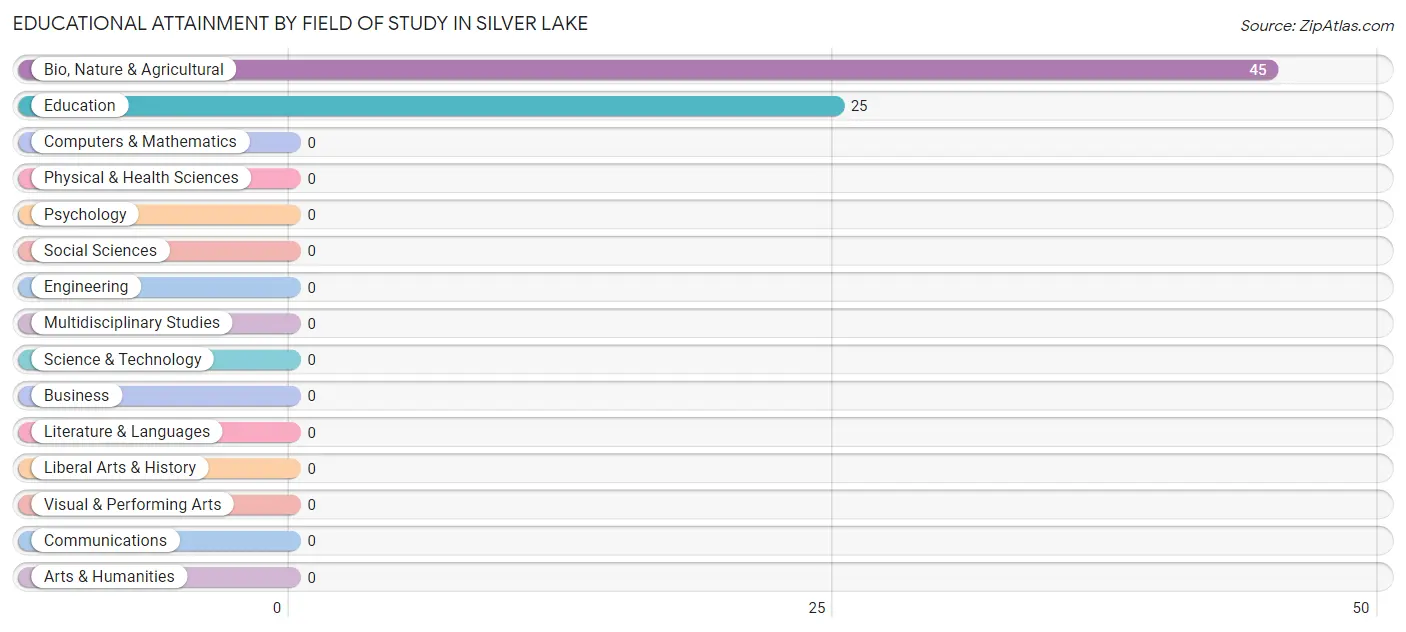
| Field of Study | # Graduates | % Graduates |
| Computers & Mathematics | 0 | 0.0% |
| Bio, Nature & Agricultural | 45 | 64.3% |
| Physical & Health Sciences | 0 | 0.0% |
| Psychology | 0 | 0.0% |
| Social Sciences | 0 | 0.0% |
| Engineering | 0 | 0.0% |
| Multidisciplinary Studies | 0 | 0.0% |
| Science & Technology | 0 | 0.0% |
| Business | 0 | 0.0% |
| Education | 25 | 35.7% |
| Literature & Languages | 0 | 0.0% |
| Liberal Arts & History | 0 | 0.0% |
| Visual & Performing Arts | 0 | 0.0% |
| Communications | 0 | 0.0% |
| Arts & Humanities | 0 | 0.0% |
| Total | 70 | 100.0% |
Transportation & Commute in Silver Lake
Vehicle Availability by Sex in Silver Lake
The most prevalent vehicle ownership categories in Silver Lake are males with 2 vehicles (30, accounting for 42.9%) and females with 2 vehicles (0, making up 50.8%).
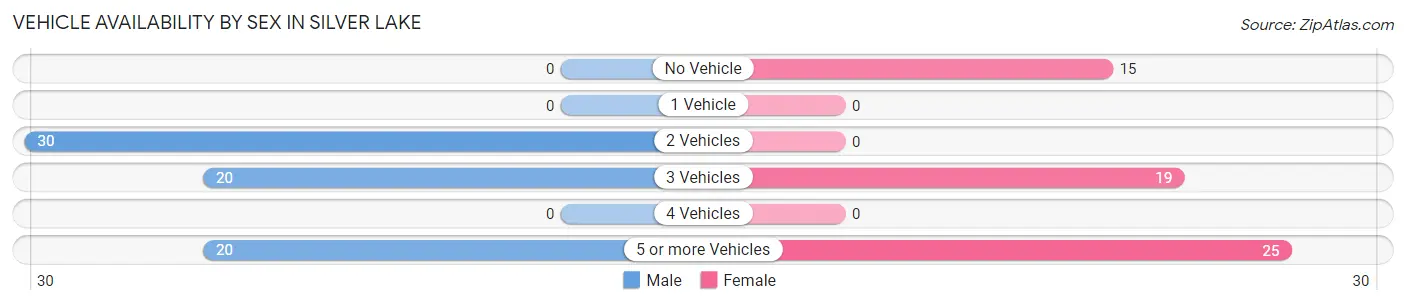
| Vehicles Available | Male | Female |
| No Vehicle | 0 (0.0%) | 15 (25.4%) |
| 1 Vehicle | 0 (0.0%) | 0 (0.0%) |
| 2 Vehicles | 30 (42.9%) | 0 (0.0%) |
| 3 Vehicles | 20 (28.6%) | 19 (32.2%) |
| 4 Vehicles | 0 (0.0%) | 0 (0.0%) |
| 5 or more Vehicles | 20 (28.6%) | 25 (42.4%) |
| Total | 70 (100.0%) | 59 (100.0%) |
Commute Time in Silver Lake
The most frequently occuring commute durations in Silver Lake are 90 or more minutes (30 commuters, 30.9%), 20 to 24 minutes (25 commuters, 25.8%), and less than 5 minutes (22 commuters, 22.7%).
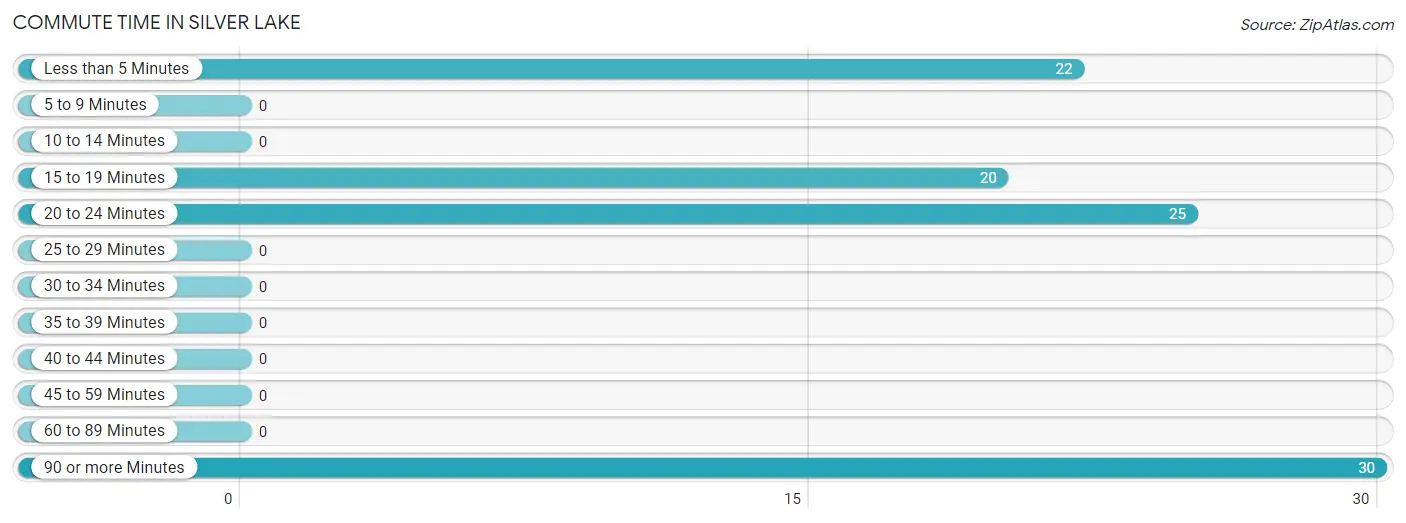
| Commute Time | # Commuters | % Commuters |
| Less than 5 Minutes | 22 | 22.7% |
| 5 to 9 Minutes | 0 | 0.0% |
| 10 to 14 Minutes | 0 | 0.0% |
| 15 to 19 Minutes | 20 | 20.6% |
| 20 to 24 Minutes | 25 | 25.8% |
| 25 to 29 Minutes | 0 | 0.0% |
| 30 to 34 Minutes | 0 | 0.0% |
| 35 to 39 Minutes | 0 | 0.0% |
| 40 to 44 Minutes | 0 | 0.0% |
| 45 to 59 Minutes | 0 | 0.0% |
| 60 to 89 Minutes | 0 | 0.0% |
| 90 or more Minutes | 30 | 30.9% |
Commute Time by Sex in Silver Lake
The most common commute times in Silver Lake are 90 or more minutes (30 commuters, 55.6%) for males and 20 to 24 minutes (25 commuters, 58.1%) for females.
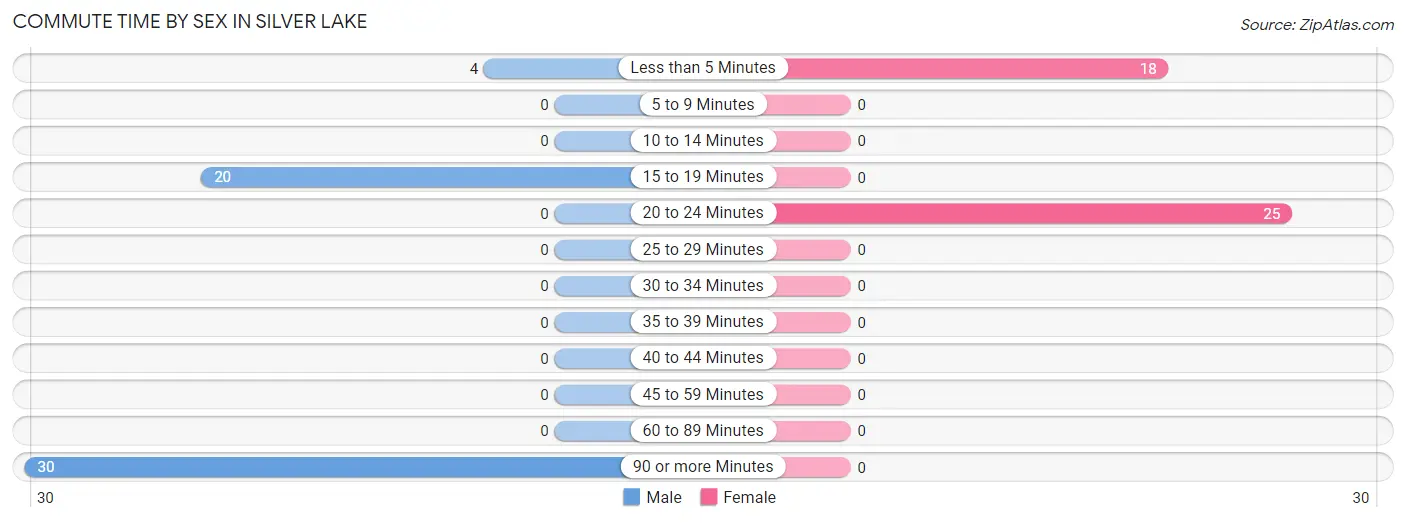
| Commute Time | Male | Female |
| Less than 5 Minutes | 4 (7.4%) | 18 (41.9%) |
| 5 to 9 Minutes | 0 (0.0%) | 0 (0.0%) |
| 10 to 14 Minutes | 0 (0.0%) | 0 (0.0%) |
| 15 to 19 Minutes | 20 (37.0%) | 0 (0.0%) |
| 20 to 24 Minutes | 0 (0.0%) | 25 (58.1%) |
| 25 to 29 Minutes | 0 (0.0%) | 0 (0.0%) |
| 30 to 34 Minutes | 0 (0.0%) | 0 (0.0%) |
| 35 to 39 Minutes | 0 (0.0%) | 0 (0.0%) |
| 40 to 44 Minutes | 0 (0.0%) | 0 (0.0%) |
| 45 to 59 Minutes | 0 (0.0%) | 0 (0.0%) |
| 60 to 89 Minutes | 0 (0.0%) | 0 (0.0%) |
| 90 or more Minutes | 30 (55.6%) | 0 (0.0%) |
Time of Departure to Work by Sex in Silver Lake
The most frequent times of departure to work in Silver Lake are 9:00 AM to 9:59 AM (30, 55.6%) for males and 6:30 AM to 6:59 AM (25, 58.1%) for females.
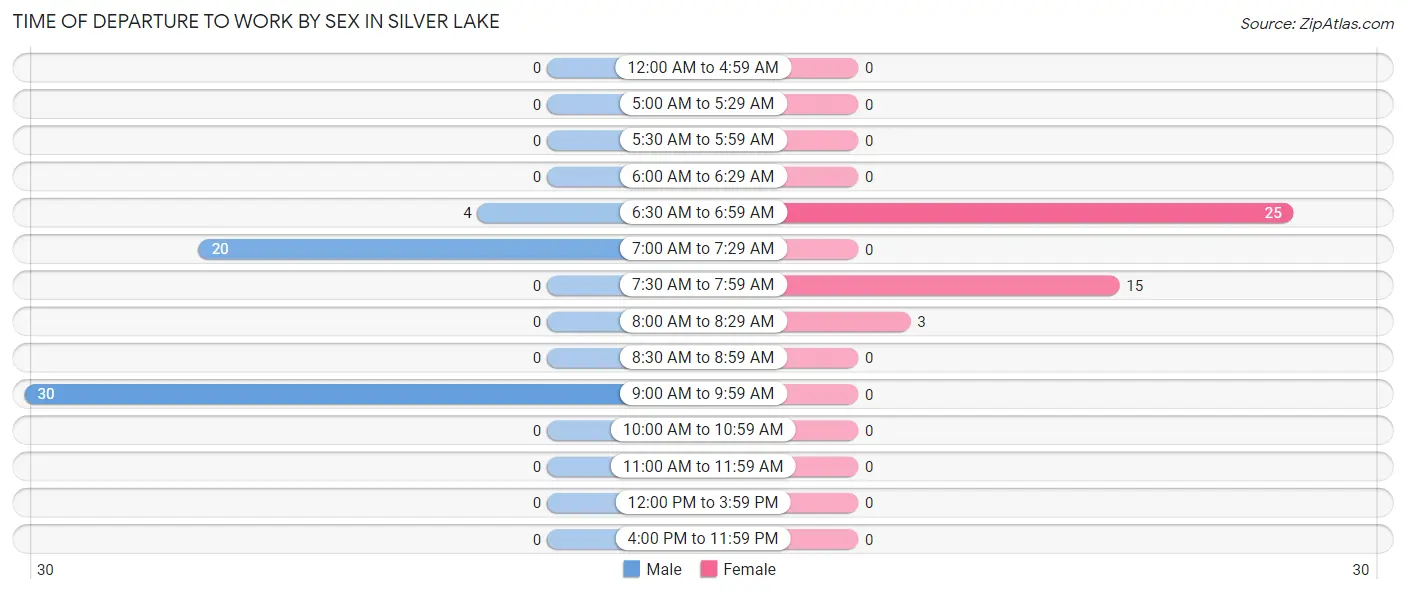
| Time of Departure | Male | Female |
| 12:00 AM to 4:59 AM | 0 (0.0%) | 0 (0.0%) |
| 5:00 AM to 5:29 AM | 0 (0.0%) | 0 (0.0%) |
| 5:30 AM to 5:59 AM | 0 (0.0%) | 0 (0.0%) |
| 6:00 AM to 6:29 AM | 0 (0.0%) | 0 (0.0%) |
| 6:30 AM to 6:59 AM | 4 (7.4%) | 25 (58.1%) |
| 7:00 AM to 7:29 AM | 20 (37.0%) | 0 (0.0%) |
| 7:30 AM to 7:59 AM | 0 (0.0%) | 15 (34.9%) |
| 8:00 AM to 8:29 AM | 0 (0.0%) | 3 (7.0%) |
| 8:30 AM to 8:59 AM | 0 (0.0%) | 0 (0.0%) |
| 9:00 AM to 9:59 AM | 30 (55.6%) | 0 (0.0%) |
| 10:00 AM to 10:59 AM | 0 (0.0%) | 0 (0.0%) |
| 11:00 AM to 11:59 AM | 0 (0.0%) | 0 (0.0%) |
| 12:00 PM to 3:59 PM | 0 (0.0%) | 0 (0.0%) |
| 4:00 PM to 11:59 PM | 0 (0.0%) | 0 (0.0%) |
| Total | 54 (100.0%) | 43 (100.0%) |
Housing Occupancy in Silver Lake
Occupancy by Ownership in Silver Lake
Of the total 83 dwellings in Silver Lake, owner-occupied units account for 43 (51.8%), while renter-occupied units make up 40 (48.2%).
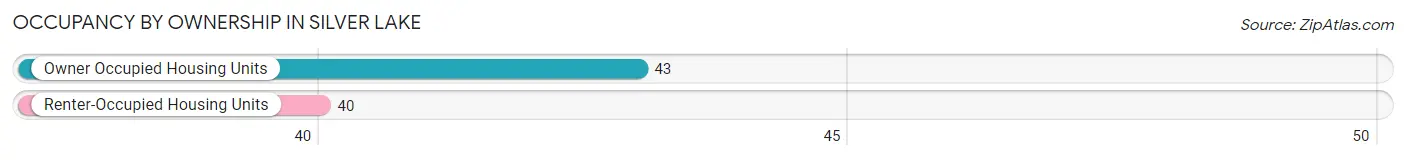
| Occupancy | # Housing Units | % Housing Units |
| Owner Occupied Housing Units | 43 | 51.8% |
| Renter-Occupied Housing Units | 40 | 48.2% |
| Total Occupied Housing Units | 83 | 100.0% |
Occupancy by Household Size in Silver Lake
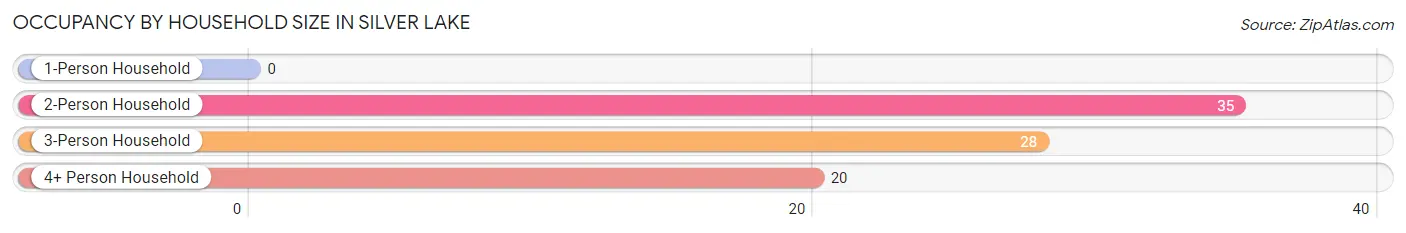
| Household Size | # Housing Units | % Housing Units |
| 1-Person Household | 0 | 0.0% |
| 2-Person Household | 35 | 42.2% |
| 3-Person Household | 28 | 33.7% |
| 4+ Person Household | 20 | 24.1% |
| Total Housing Units | 83 | 100.0% |
Occupancy by Ownership by Household Size in Silver Lake
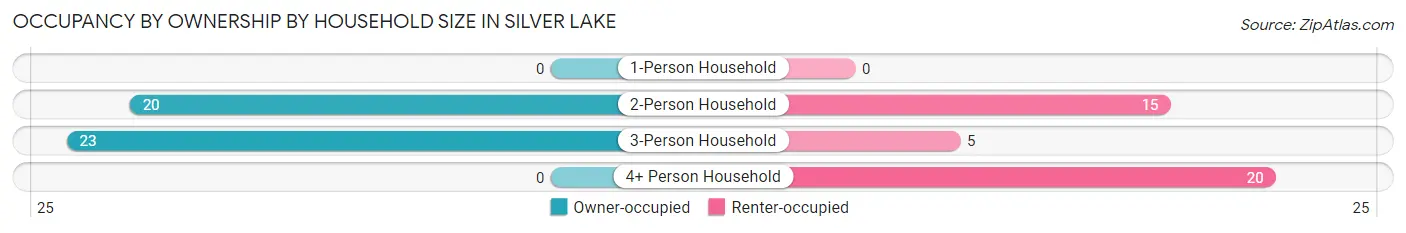
| Household Size | Owner-occupied | Renter-occupied |
| 1-Person Household | 0 (0.0%) | 0 (0.0%) |
| 2-Person Household | 20 (57.1%) | 15 (42.9%) |
| 3-Person Household | 23 (82.1%) | 5 (17.9%) |
| 4+ Person Household | 0 (0.0%) | 20 (100.0%) |
| Total Housing Units | 43 (51.8%) | 40 (48.2%) |
Occupancy by Educational Attainment in Silver Lake
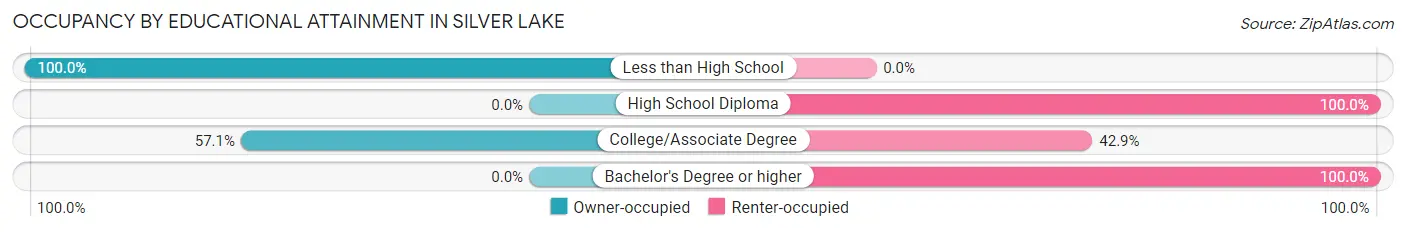
| Household Size | Owner-occupied | Renter-occupied |
| Less than High School | 23 (100.0%) | 0 (0.0%) |
| High School Diploma | 0 (0.0%) | 5 (100.0%) |
| College/Associate Degree | 20 (57.1%) | 15 (42.9%) |
| Bachelor's Degree or higher | 0 (0.0%) | 20 (100.0%) |
Occupancy by Age of Householder in Silver Lake
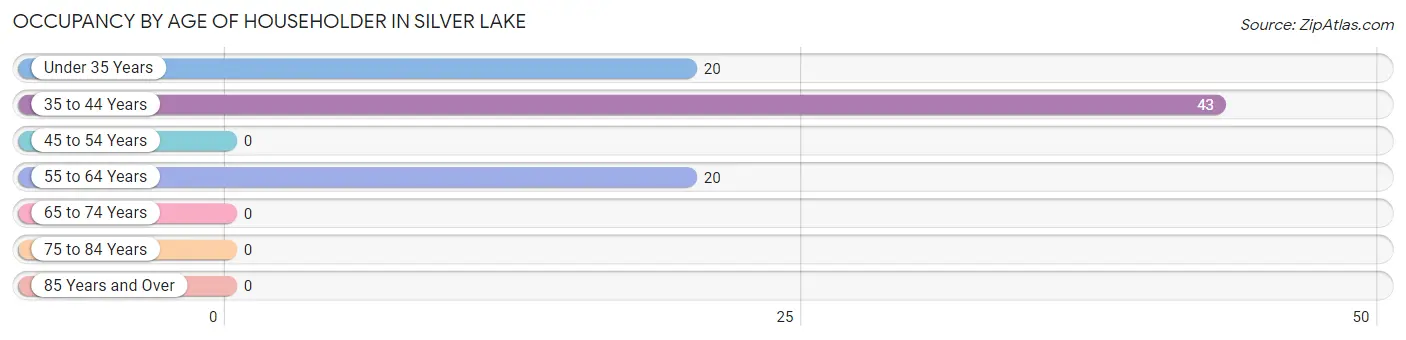
| Age Bracket | # Households | % Households |
| Under 35 Years | 20 | 24.1% |
| 35 to 44 Years | 43 | 51.8% |
| 45 to 54 Years | 0 | 0.0% |
| 55 to 64 Years | 20 | 24.1% |
| 65 to 74 Years | 0 | 0.0% |
| 75 to 84 Years | 0 | 0.0% |
| 85 Years and Over | 0 | 0.0% |
| Total | 83 | 100.0% |
Housing Finances in Silver Lake
Median Income by Occupancy in Silver Lake
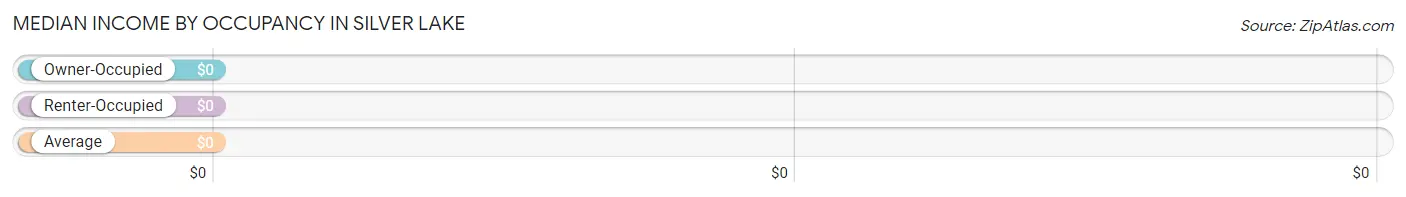
| Occupancy Type | # Households | Median Income |
| Owner-Occupied | 43 (51.8%) | $0 |
| Renter-Occupied | 40 (48.2%) | $0 |
| Average | 83 (100.0%) | $0 |
Occupancy by Householder Income Bracket in Silver Lake
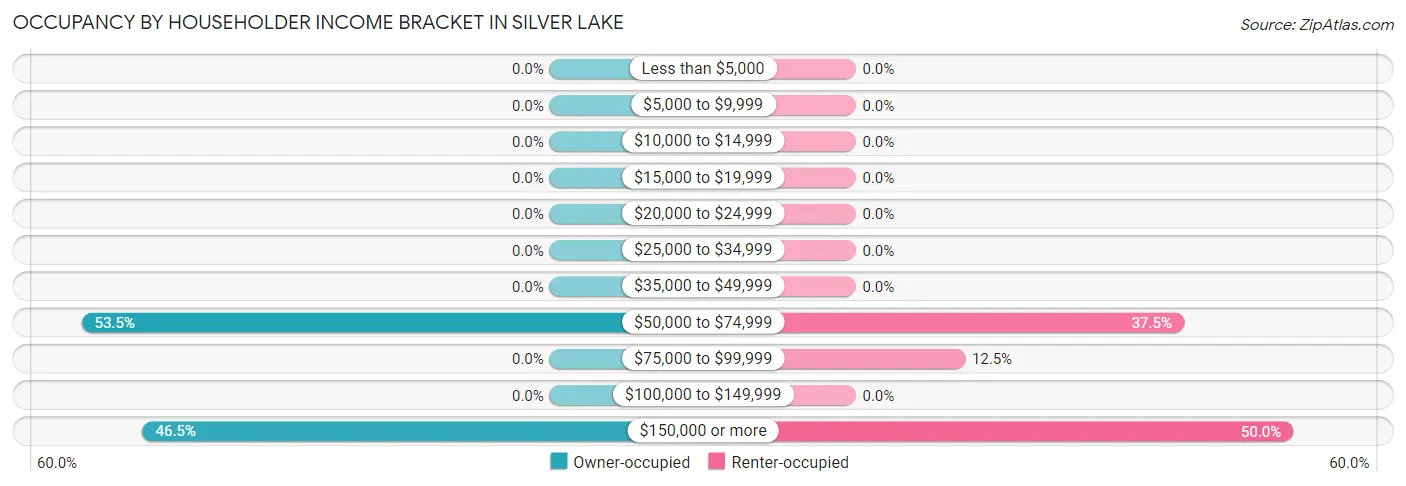
| Income Bracket | Owner-occupied | Renter-occupied |
| Less than $5,000 | 0 (0.0%) | 0 (0.0%) |
| $5,000 to $9,999 | 0 (0.0%) | 0 (0.0%) |
| $10,000 to $14,999 | 0 (0.0%) | 0 (0.0%) |
| $15,000 to $19,999 | 0 (0.0%) | 0 (0.0%) |
| $20,000 to $24,999 | 0 (0.0%) | 0 (0.0%) |
| $25,000 to $34,999 | 0 (0.0%) | 0 (0.0%) |
| $35,000 to $49,999 | 0 (0.0%) | 0 (0.0%) |
| $50,000 to $74,999 | 23 (53.5%) | 15 (37.5%) |
| $75,000 to $99,999 | 0 (0.0%) | 5 (12.5%) |
| $100,000 to $149,999 | 0 (0.0%) | 0 (0.0%) |
| $150,000 or more | 20 (46.5%) | 20 (50.0%) |
| Total | 43 (100.0%) | 40 (100.0%) |
Monthly Housing Cost Tiers in Silver Lake
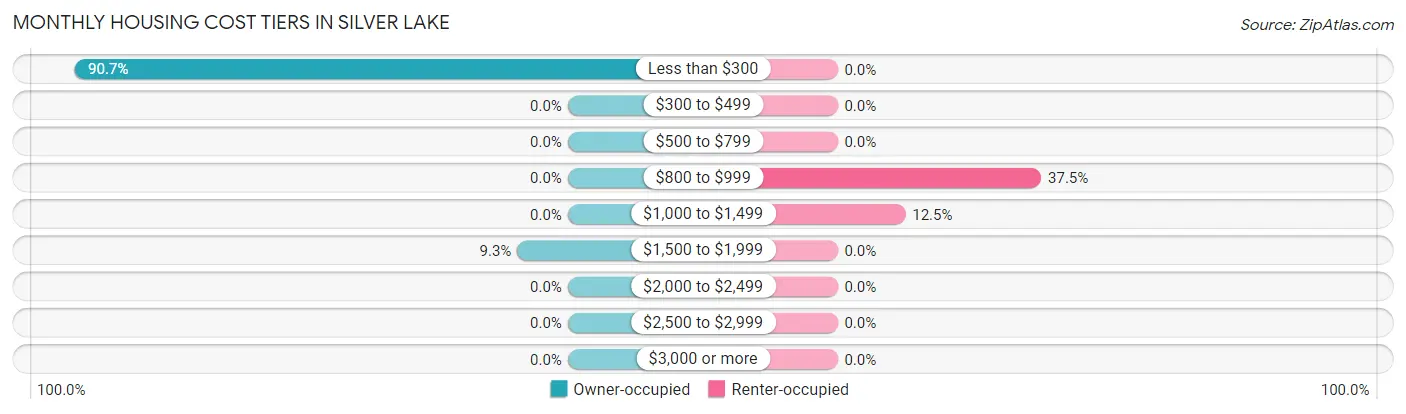
| Monthly Cost | Owner-occupied | Renter-occupied |
| Less than $300 | 39 (90.7%) | 0 (0.0%) |
| $300 to $499 | 0 (0.0%) | 0 (0.0%) |
| $500 to $799 | 0 (0.0%) | 0 (0.0%) |
| $800 to $999 | 0 (0.0%) | 15 (37.5%) |
| $1,000 to $1,499 | 0 (0.0%) | 5 (12.5%) |
| $1,500 to $1,999 | 4 (9.3%) | 0 (0.0%) |
| $2,000 to $2,499 | 0 (0.0%) | 0 (0.0%) |
| $2,500 to $2,999 | 0 (0.0%) | 0 (0.0%) |
| $3,000 or more | 0 (0.0%) | 0 (0.0%) |
| Total | 43 (100.0%) | 40 (100.0%) |
Physical Housing Characteristics in Silver Lake
Housing Structures in Silver Lake
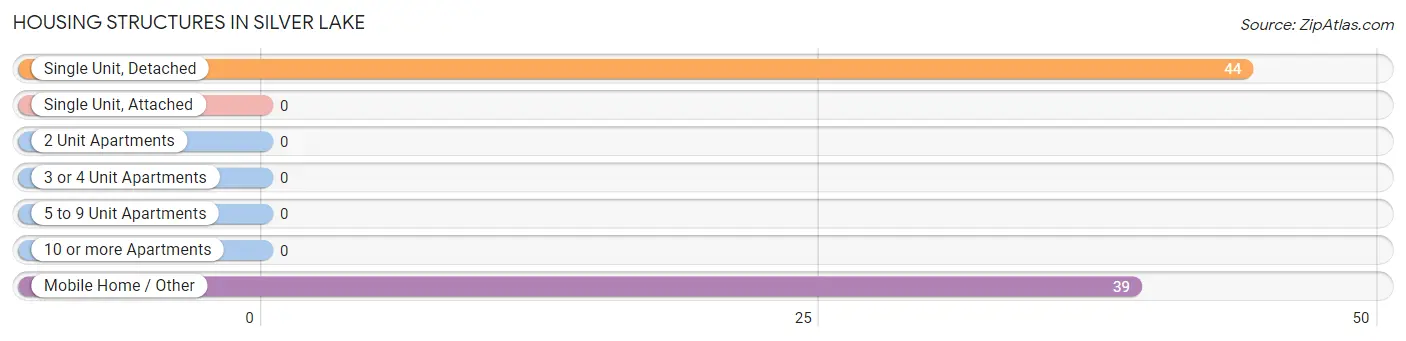
| Structure Type | # Housing Units | % Housing Units |
| Single Unit, Detached | 44 | 53.0% |
| Single Unit, Attached | 0 | 0.0% |
| 2 Unit Apartments | 0 | 0.0% |
| 3 or 4 Unit Apartments | 0 | 0.0% |
| 5 to 9 Unit Apartments | 0 | 0.0% |
| 10 or more Apartments | 0 | 0.0% |
| Mobile Home / Other | 39 | 47.0% |
| Total | 83 | 100.0% |
Housing Structures by Occupancy in Silver Lake
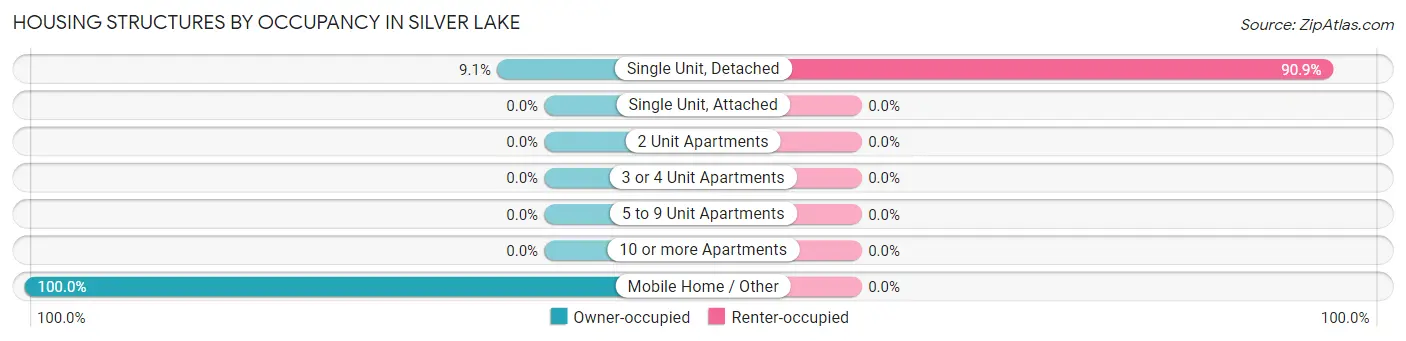
| Structure Type | Owner-occupied | Renter-occupied |
| Single Unit, Detached | 4 (9.1%) | 40 (90.9%) |
| Single Unit, Attached | 0 (0.0%) | 0 (0.0%) |
| 2 Unit Apartments | 0 (0.0%) | 0 (0.0%) |
| 3 or 4 Unit Apartments | 0 (0.0%) | 0 (0.0%) |
| 5 to 9 Unit Apartments | 0 (0.0%) | 0 (0.0%) |
| 10 or more Apartments | 0 (0.0%) | 0 (0.0%) |
| Mobile Home / Other | 39 (100.0%) | 0 (0.0%) |
| Total | 43 (51.8%) | 40 (48.2%) |
Housing Structures by Number of Rooms in Silver Lake
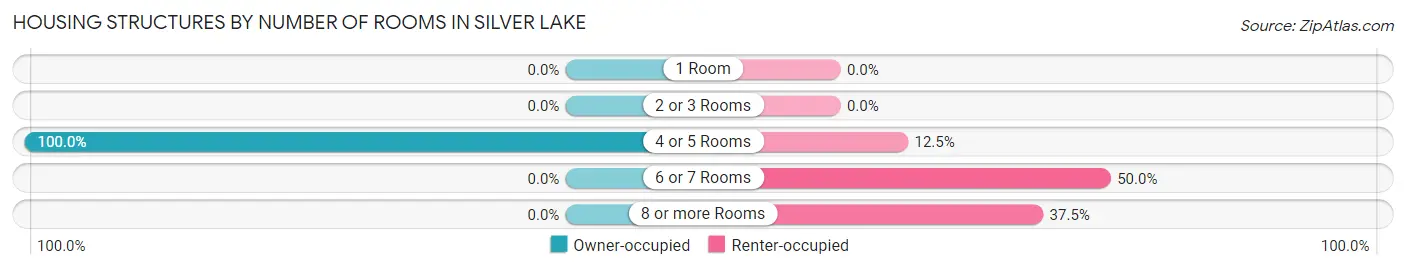
| Number of Rooms | Owner-occupied | Renter-occupied |
| 1 Room | 0 (0.0%) | 0 (0.0%) |
| 2 or 3 Rooms | 0 (0.0%) | 0 (0.0%) |
| 4 or 5 Rooms | 43 (100.0%) | 5 (12.5%) |
| 6 or 7 Rooms | 0 (0.0%) | 20 (50.0%) |
| 8 or more Rooms | 0 (0.0%) | 15 (37.5%) |
| Total | 43 (100.0%) | 40 (100.0%) |
Housing Structure by Heating Type in Silver Lake
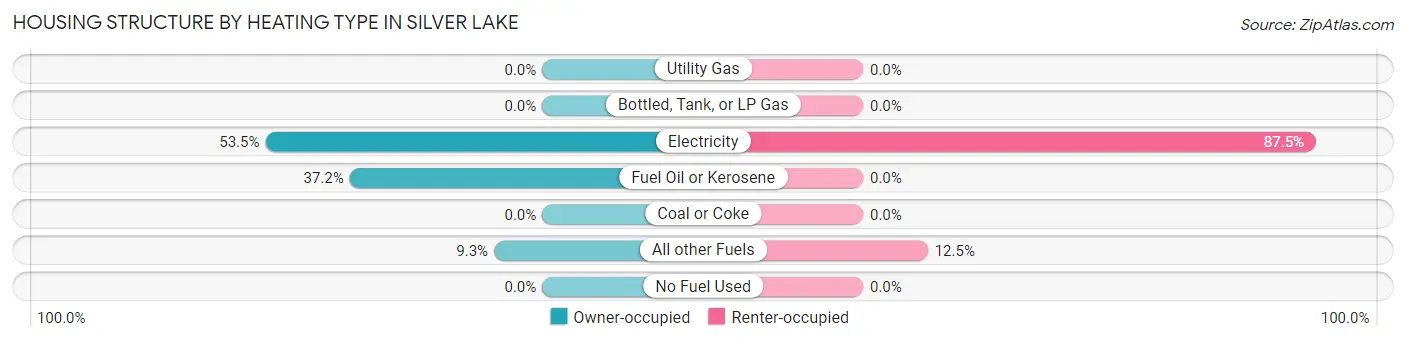
| Heating Type | Owner-occupied | Renter-occupied |
| Utility Gas | 0 (0.0%) | 0 (0.0%) |
| Bottled, Tank, or LP Gas | 0 (0.0%) | 0 (0.0%) |
| Electricity | 23 (53.5%) | 35 (87.5%) |
| Fuel Oil or Kerosene | 16 (37.2%) | 0 (0.0%) |
| Coal or Coke | 0 (0.0%) | 0 (0.0%) |
| All other Fuels | 4 (9.3%) | 5 (12.5%) |
| No Fuel Used | 0 (0.0%) | 0 (0.0%) |
| Total | 43 (100.0%) | 40 (100.0%) |
Household Vehicle Usage in Silver Lake
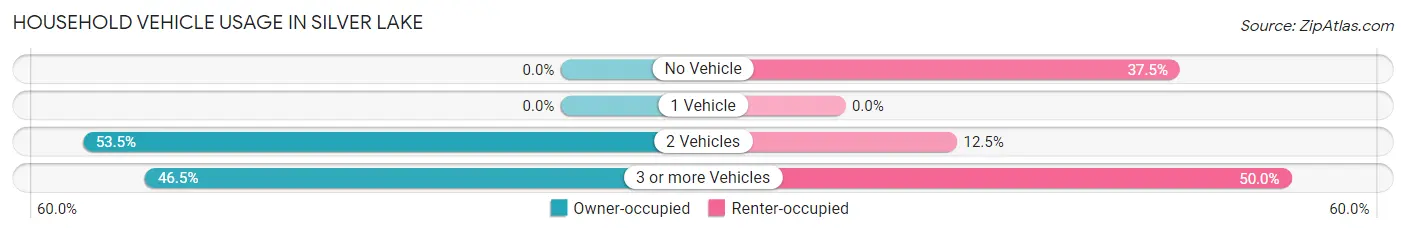
| Vehicles per Household | Owner-occupied | Renter-occupied |
| No Vehicle | 0 (0.0%) | 15 (37.5%) |
| 1 Vehicle | 0 (0.0%) | 0 (0.0%) |
| 2 Vehicles | 23 (53.5%) | 5 (12.5%) |
| 3 or more Vehicles | 20 (46.5%) | 20 (50.0%) |
| Total | 43 (100.0%) | 40 (100.0%) |
Real Estate & Mortgages in Silver Lake
Real Estate and Mortgage Overview in Silver Lake
| Characteristic | Without Mortgage | With Mortgage |
| Housing Units | 39 | 4 |
| Median Property Value | - | - |
| Median Household Income | - | - |
| Monthly Housing Costs | - | - |
| Real Estate Taxes | - | - |
Property Value by Mortgage Status in Silver Lake
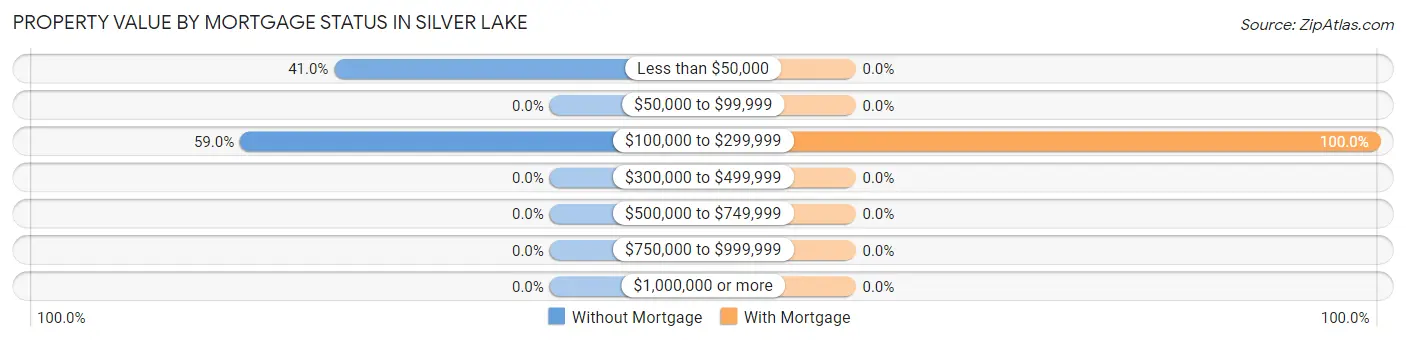
| Property Value | Without Mortgage | With Mortgage |
| Less than $50,000 | 16 (41.0%) | 0 (0.0%) |
| $50,000 to $99,999 | 0 (0.0%) | 0 (0.0%) |
| $100,000 to $299,999 | 23 (59.0%) | 4 (100.0%) |
| $300,000 to $499,999 | 0 (0.0%) | 0 (0.0%) |
| $500,000 to $749,999 | 0 (0.0%) | 0 (0.0%) |
| $750,000 to $999,999 | 0 (0.0%) | 0 (0.0%) |
| $1,000,000 or more | 0 (0.0%) | 0 (0.0%) |
| Total | 39 (100.0%) | 4 (100.0%) |
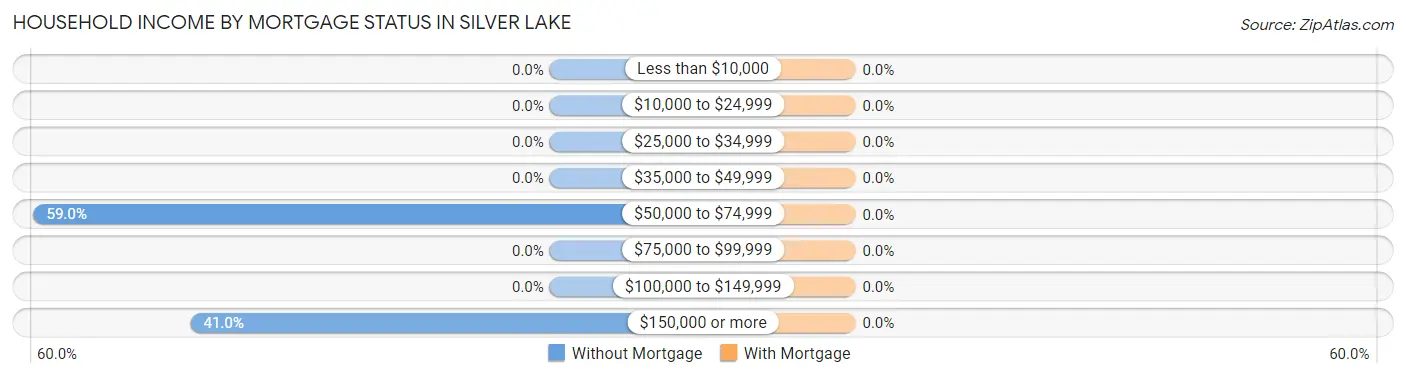
Household Income by Mortgage Status in Silver Lake
| Household Income | Without Mortgage | With Mortgage |
| Less than $10,000 | 0 (0.0%) | 0 (0.0%) |
| $10,000 to $24,999 | 0 (0.0%) | 0 (0.0%) |
| $25,000 to $34,999 | 0 (0.0%) | 0 (0.0%) |
| $35,000 to $49,999 | 0 (0.0%) | 0 (0.0%) |
| $50,000 to $74,999 | 23 (59.0%) | 0 (0.0%) |
| $75,000 to $99,999 | 0 (0.0%) | 0 (0.0%) |
| $100,000 to $149,999 | 0 (0.0%) | 0 (0.0%) |
| $150,000 or more | 16 (41.0%) | 0 (0.0%) |
| Total | 39 (100.0%) | 4 (100.0%) |
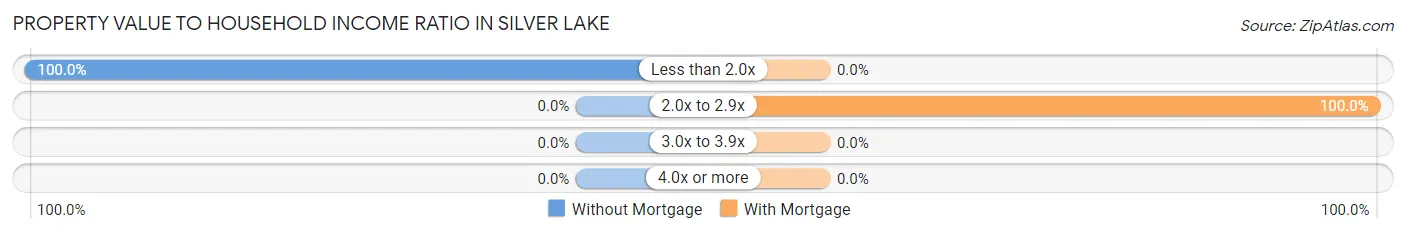
Property Value to Household Income Ratio in Silver Lake
| Value-to-Income Ratio | Without Mortgage | With Mortgage |
| Less than 2.0x | 39 (100.0%) | 0 (0.0%) |
| 2.0x to 2.9x | 0 (0.0%) | 4 (100.0%) |
| 3.0x to 3.9x | 0 (0.0%) | 0 (0.0%) |
| 4.0x or more | 0 (0.0%) | 0 (0.0%) |
| Total | 39 (100.0%) | 4 (100.0%) |
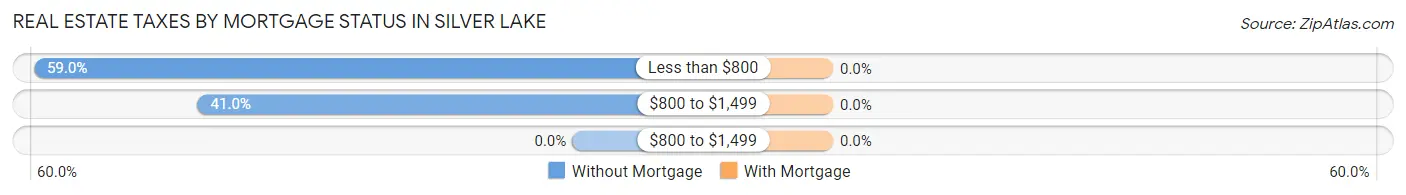
Real Estate Taxes by Mortgage Status in Silver Lake
| Property Taxes | Without Mortgage | With Mortgage |
| Less than $800 | 23 (59.0%) | 0 (0.0%) |
| $800 to $1,499 | 16 (41.0%) | 0 (0.0%) |
| $800 to $1,499 | 0 (0.0%) | 0 (0.0%) |
| Total | 39 (100.0%) | 4 (100.0%) |
Health & Disability in Silver Lake
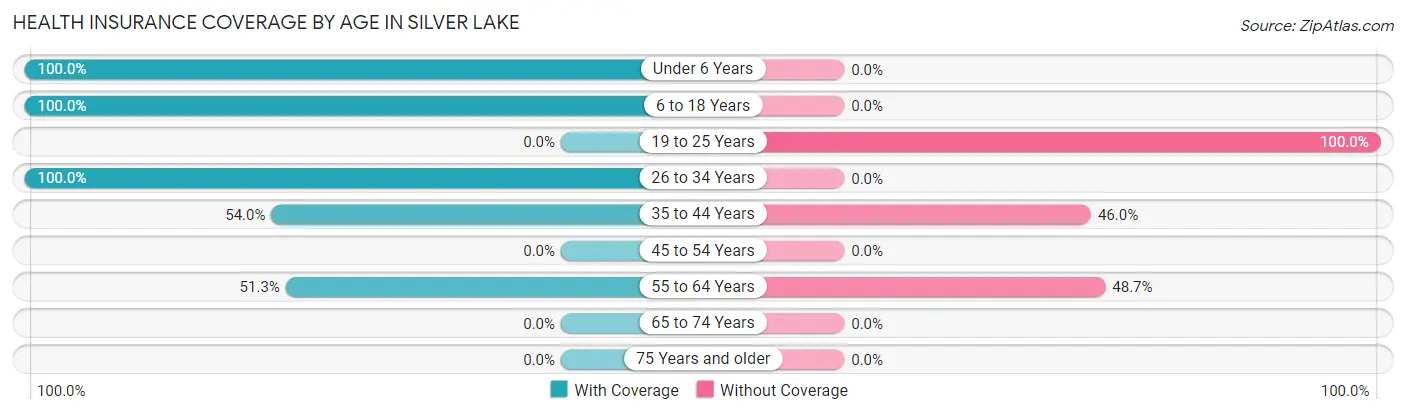
Health Insurance Coverage by Age in Silver Lake
| Age Bracket | With Coverage | Without Coverage |
| Under 6 Years | 30 (100.0%) | 0 (0.0%) |
| 6 to 18 Years | 22 (100.0%) | 0 (0.0%) |
| 19 to 25 Years | 0 (0.0%) | 30 (100.0%) |
| 26 to 34 Years | 45 (100.0%) | 0 (0.0%) |
| 35 to 44 Years | 27 (54.0%) | 23 (46.0%) |
| 45 to 54 Years | 0 (0.0%) | 0 (0.0%) |
| 55 to 64 Years | 39 (51.3%) | 37 (48.7%) |
| 65 to 74 Years | 0 (0.0%) | 0 (0.0%) |
| 75 Years and older | 0 (0.0%) | 0 (0.0%) |
| Total | 163 (64.4%) | 90 (35.6%) |
Health Insurance Coverage by Citizenship Status in Silver Lake
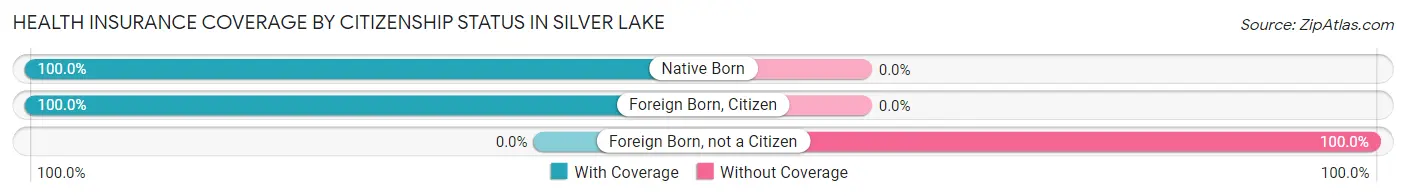
| Citizenship Status | With Coverage | Without Coverage |
| Native Born | 30 (100.0%) | 0 (0.0%) |
| Foreign Born, Citizen | 22 (100.0%) | 0 (0.0%) |
| Foreign Born, not a Citizen | 0 (0.0%) | 30 (100.0%) |
Health Insurance Coverage by Household Income in Silver Lake
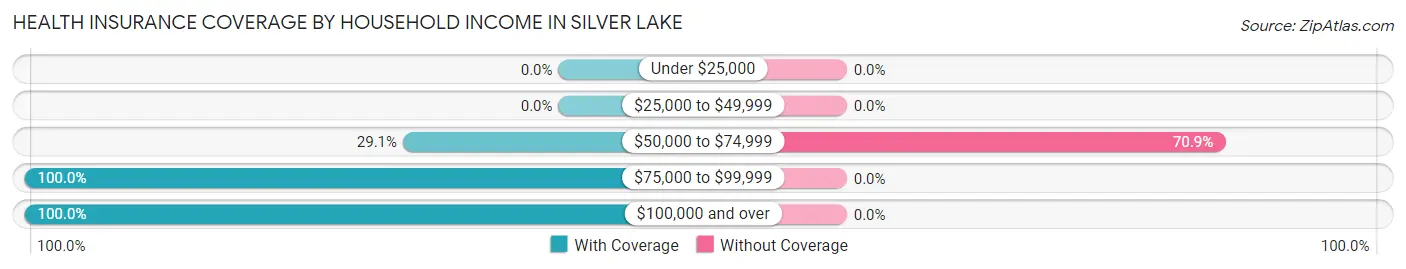
| Household Income | With Coverage | Without Coverage |
| Under $25,000 | 0 (0.0%) | 0 (0.0%) |
| $25,000 to $49,999 | 0 (0.0%) | 0 (0.0%) |
| $50,000 to $74,999 | 37 (29.1%) | 90 (70.9%) |
| $75,000 to $99,999 | 17 (100.0%) | 0 (0.0%) |
| $100,000 and over | 109 (100.0%) | 0 (0.0%) |
Public vs Private Health Insurance Coverage by Age in Silver Lake
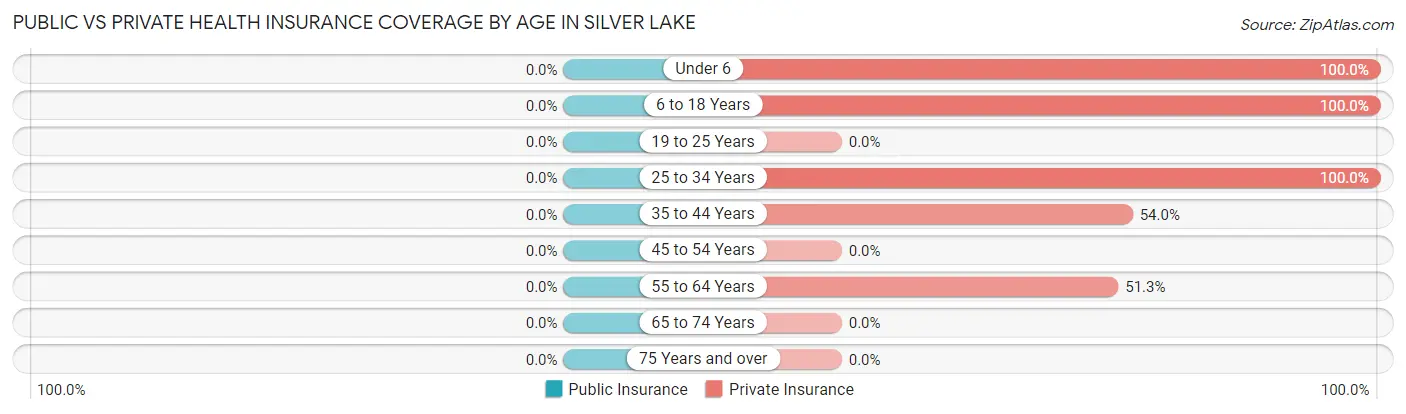
| Age Bracket | Public Insurance | Private Insurance |
| Under 6 | 0 (0.0%) | 30 (100.0%) |
| 6 to 18 Years | 0 (0.0%) | 22 (100.0%) |
| 19 to 25 Years | 0 (0.0%) | 0 (0.0%) |
| 25 to 34 Years | 0 (0.0%) | 45 (100.0%) |
| 35 to 44 Years | 0 (0.0%) | 27 (54.0%) |
| 45 to 54 Years | 0 (0.0%) | 0 (0.0%) |
| 55 to 64 Years | 0 (0.0%) | 39 (51.3%) |
| 65 to 74 Years | 0 (0.0%) | 0 (0.0%) |
| 75 Years and over | 0 (0.0%) | 0 (0.0%) |
| Total | 0 (0.0%) | 163 (64.4%) |
Disability Status by Sex by Age in Silver Lake
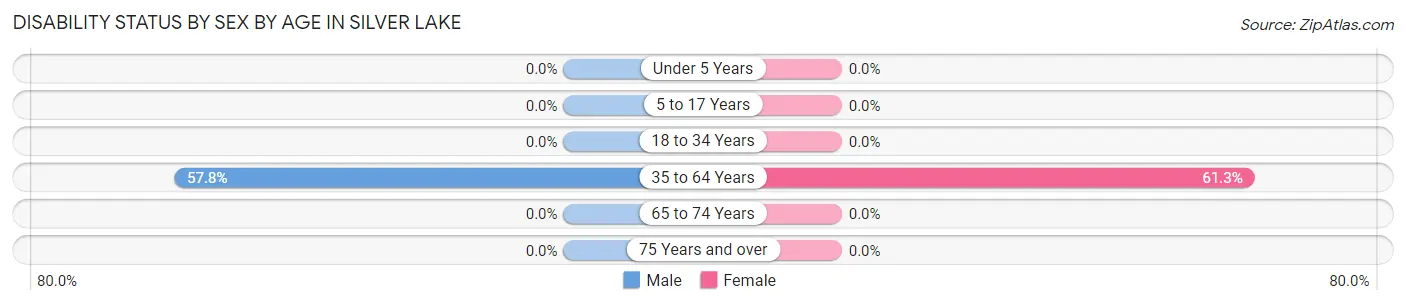
| Age Bracket | Male | Female |
| Under 5 Years | 0 (0.0%) | 0 (0.0%) |
| 5 to 17 Years | 0 (0.0%) | 0 (0.0%) |
| 18 to 34 Years | 0 (0.0%) | 0 (0.0%) |
| 35 to 64 Years | 37 (57.8%) | 38 (61.3%) |
| 65 to 74 Years | 0 (0.0%) | 0 (0.0%) |
| 75 Years and over | 0 (0.0%) | 0 (0.0%) |
Disability Class by Sex by Age in Silver Lake
Disability Class: Hearing Difficulty
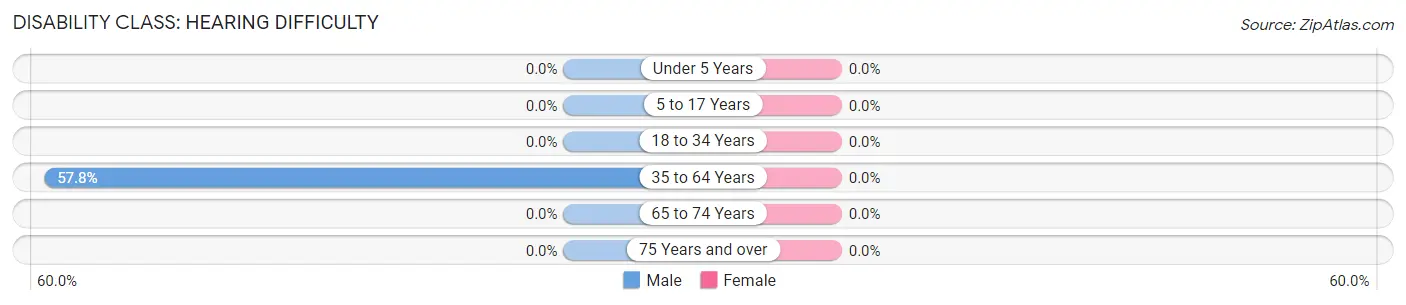
| Age Bracket | Male | Female |
| Under 5 Years | 0 (0.0%) | 0 (0.0%) |
| 5 to 17 Years | 0 (0.0%) | 0 (0.0%) |
| 18 to 34 Years | 0 (0.0%) | 0 (0.0%) |
| 35 to 64 Years | 37 (57.8%) | 0 (0.0%) |
| 65 to 74 Years | 0 (0.0%) | 0 (0.0%) |
| 75 Years and over | 0 (0.0%) | 0 (0.0%) |
Disability Class: Vision Difficulty
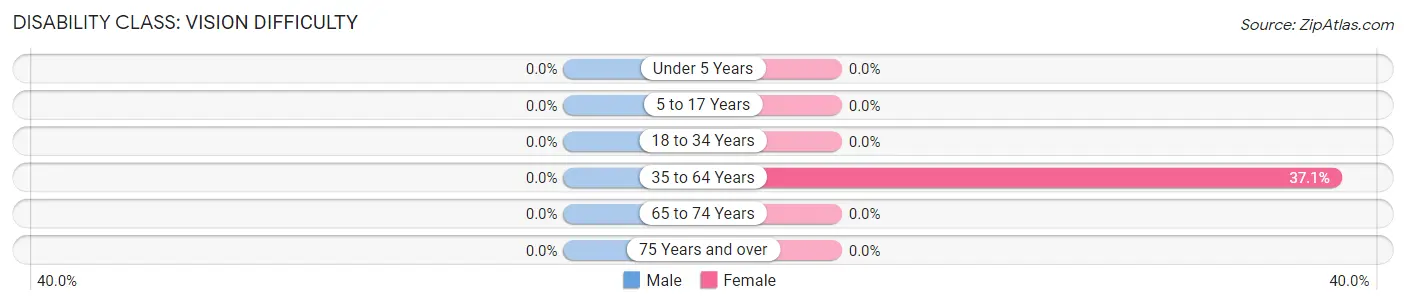
| Age Bracket | Male | Female |
| Under 5 Years | 0 (0.0%) | 0 (0.0%) |
| 5 to 17 Years | 0 (0.0%) | 0 (0.0%) |
| 18 to 34 Years | 0 (0.0%) | 0 (0.0%) |
| 35 to 64 Years | 0 (0.0%) | 23 (37.1%) |
| 65 to 74 Years | 0 (0.0%) | 0 (0.0%) |
| 75 Years and over | 0 (0.0%) | 0 (0.0%) |
Disability Class: Cognitive Difficulty
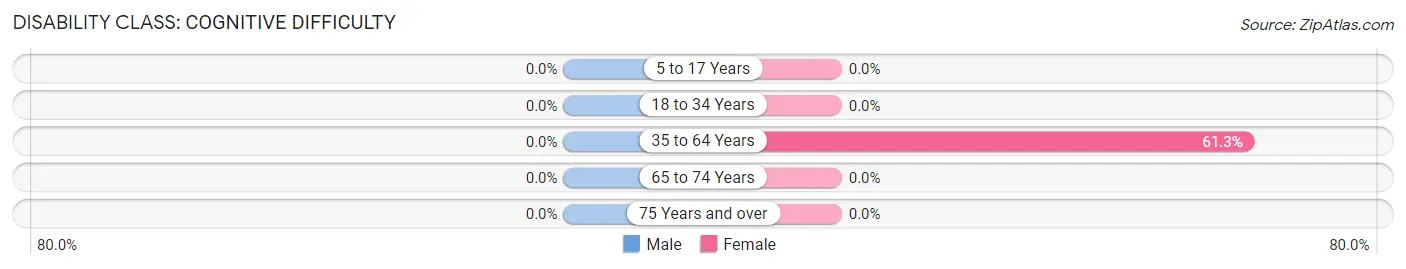
| Age Bracket | Male | Female |
| 5 to 17 Years | 0 (0.0%) | 0 (0.0%) |
| 18 to 34 Years | 0 (0.0%) | 0 (0.0%) |
| 35 to 64 Years | 0 (0.0%) | 38 (61.3%) |
| 65 to 74 Years | 0 (0.0%) | 0 (0.0%) |
| 75 Years and over | 0 (0.0%) | 0 (0.0%) |
Disability Class: Ambulatory Difficulty
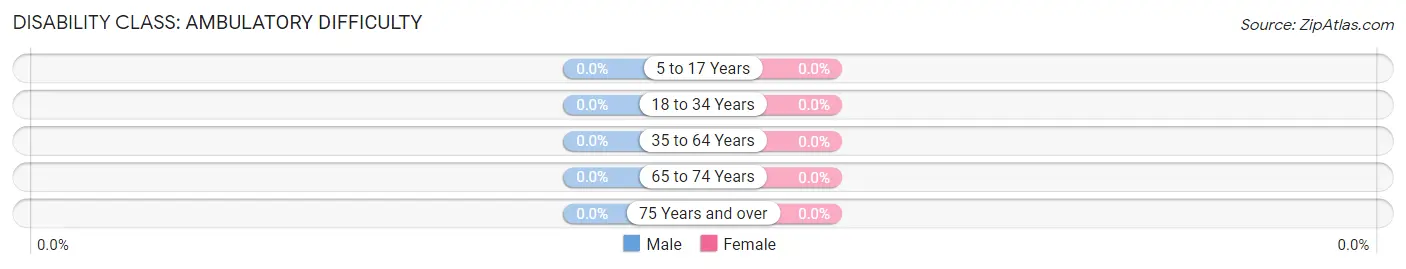
| Age Bracket | Male | Female |
| 5 to 17 Years | 0 (0.0%) | 0 (0.0%) |
| 18 to 34 Years | 0 (0.0%) | 0 (0.0%) |
| 35 to 64 Years | 0 (0.0%) | 0 (0.0%) |
| 65 to 74 Years | 0 (0.0%) | 0 (0.0%) |
| 75 Years and over | 0 (0.0%) | 0 (0.0%) |
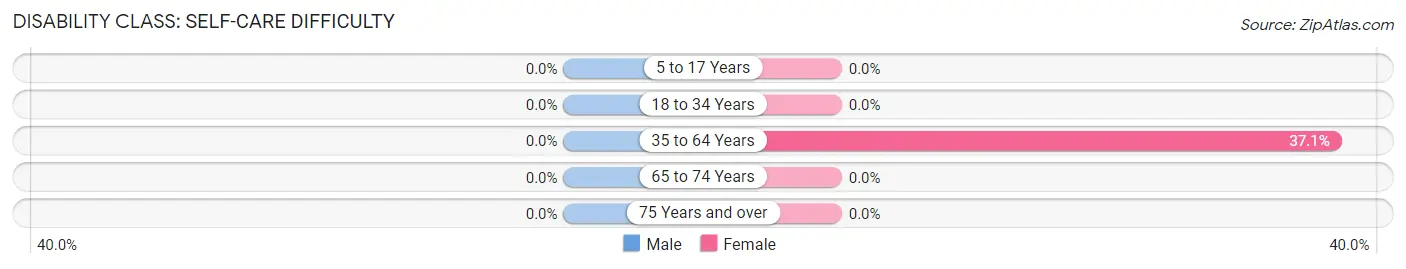
Disability Class: Self-Care Difficulty
| Age Bracket | Male | Female |
| 5 to 17 Years | 0 (0.0%) | 0 (0.0%) |
| 18 to 34 Years | 0 (0.0%) | 0 (0.0%) |
| 35 to 64 Years | 0 (0.0%) | 23 (37.1%) |
| 65 to 74 Years | 0 (0.0%) | 0 (0.0%) |
| 75 Years and over | 0 (0.0%) | 0 (0.0%) |
Technology Access in Silver Lake
Computing Device Access in Silver Lake
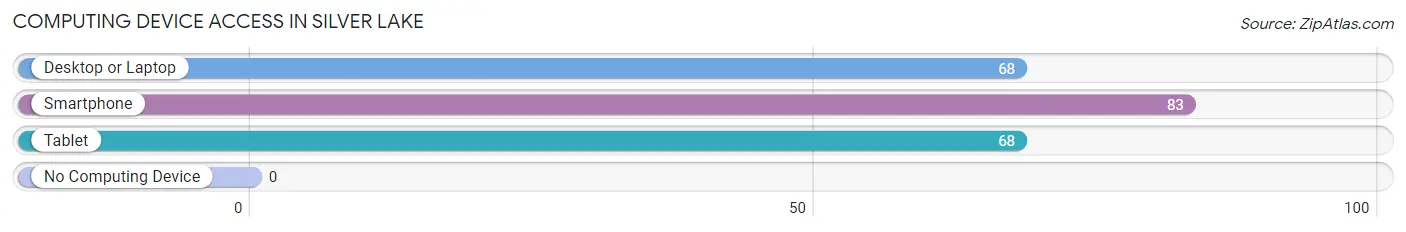
| Device Type | # Households | % Households |
| Desktop or Laptop | 68 | 81.9% |
| Smartphone | 83 | 100.0% |
| Tablet | 68 | 81.9% |
| No Computing Device | 0 | 0.0% |
| Total | 83 | 100.0% |
Internet Access in Silver Lake
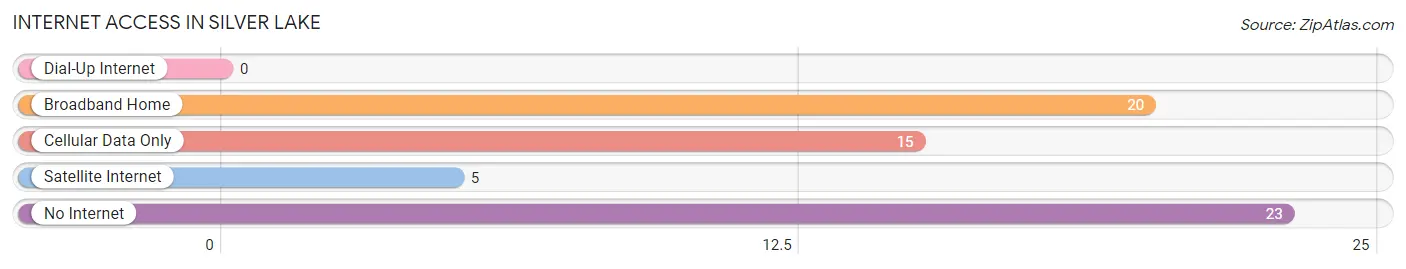
| Internet Type | # Households | % Households |
| Dial-Up Internet | 0 | 0.0% |
| Broadband Home | 20 | 24.1% |
| Cellular Data Only | 15 | 18.1% |
| Satellite Internet | 5 | 6.0% |
| No Internet | 23 | 27.7% |
| Total | 83 | 100.0% |
Silver Lake Summary
Introduction
Silver Lake is a small unincorporated community located in Lake County, Oregon. It is situated in the high desert of south-central Oregon, approximately 30 miles east of Lakeview. The town is surrounded by the Fremont-Winema National Forest and is home to a variety of wildlife, including deer, elk, antelope, and wild horses. Silver Lake is a popular destination for outdoor recreation, including camping, fishing, hunting, and hiking.
History
The area around Silver Lake was first inhabited by the Northern Paiute people, who lived in the area for thousands of years before the arrival of European settlers. The first European settlers arrived in the area in the late 1800s, and the town of Silver Lake was established in 1891. The town was named after the nearby Silver Lake, which was named for the silver-colored rocks that line its shore.
The town of Silver Lake grew quickly, and by the early 1900s, it had become a bustling center of commerce and industry. The town was home to several businesses, including a hotel, a general store, a saloon, and a blacksmith shop. The town also had a post office, a school, and a church.
Geography
Silver Lake is located in the high desert of south-central Oregon, approximately 30 miles east of Lakeview. The town is situated at an elevation of 4,400 feet, and is surrounded by the Fremont-Winema National Forest. The area is characterized by rolling hills, sagebrush, and juniper trees. The nearby Silver Lake is a popular destination for fishing, camping, and other outdoor activities.
Economy
The economy of Silver Lake is largely based on tourism and recreation. The town is a popular destination for outdoor recreation, including camping, fishing, hunting, and hiking. The nearby Silver Lake is a popular destination for fishing, and the town is home to several campgrounds and RV parks. The town also has a few small businesses, including a general store, a restaurant, and a gas station.
Demographics
As of the 2010 census, the population of Silver Lake was 545. The town is predominantly white, with a small Hispanic population. The median household income in Silver Lake is $35,000, and the median home value is $90,000. The town has a high rate of poverty, with nearly one-third of the population living below the poverty line.
Conclusion
Silver Lake is a small unincorporated community located in Lake County, Oregon. It is situated in the high desert of south-central Oregon, and is surrounded by the Fremont-Winema National Forest. The town is a popular destination for outdoor recreation, and its economy is largely based on tourism and recreation. The population of Silver Lake is predominantly white, with a small Hispanic population. The median household income in Silver Lake is $35,000, and the median home value is $90,000.
Common Questions
What is Per Capita Income in Silver Lake?
Per Capita income in Silver Lake is $39,121.
What is the Median Family Income in Silver Lake?
Median Family Income in Silver Lake is $86,750.
What is Inequality or Gini Index in Silver Lake?
Inequality or Gini Index in Silver Lake is 0.25.
What is the Total Population of Silver Lake?
Total Population of Silver Lake is 253.
What is the Total Male Population of Silver Lake?
Total Male Population of Silver Lake is 141.
What is the Total Female Population of Silver Lake?
Total Female Population of Silver Lake is 112.
What is the Ratio of Males per 100 Females in Silver Lake?
There are 125.89 Males per 100 Females in Silver Lake.
What is the Ratio of Females per 100 Males in Silver Lake?
There are 79.43 Females per 100 Males in Silver Lake.
What is the Median Population Age in Silver Lake?
Median Population Age in Silver Lake is 34.0 Years.
What is the Average Family Size in Silver Lake
Average Family Size in Silver Lake is 2.8 People.
What is the Average Household Size in Silver Lake
Average Household Size in Silver Lake is 3.0 People.
How Large is the Labor Force in Silver Lake?
There are 134 People in the Labor Forcein in Silver Lake.
What is the Percentage of People in the Labor Force in Silver Lake?
66.7% of People are in the Labor Force in Silver Lake.