Beaver, OR Map & Demographics
Beaver Map
Beaver Overview
$34,281
PER CAPITA INCOME
0.37
INEQUALITY / GINI INDEX
206
TOTAL POPULATION
147
MALE POPULATION
59
FEMALE POPULATION
249.15
MALES / 100 FEMALES
40.14
FEMALES / 100 MALES
57.5
MEDIAN AGE
2.6
AVG FAMILY SIZE
2.2
AVG HOUSEHOLD SIZE
78
LABOR FORCE [ PEOPLE ]
37.9%
PERCENT IN LABOR FORCE
Beaver Zip Codes
Income in Beaver
Income Overview in Beaver
| Characteristic | Number | Measure |
| Per Capita Income | 206 | $34,281 |
| Median Family Income | 70 | $0 |
| Mean Family Income | 70 | $71,961 |
| Median Household Income | 95 | $0 |
| Mean Household Income | 95 | $70,572 |
| Income Deficit | 70 | $0 |
| Wage / Income Gap (%) | 206 | 0.00% |
| Wage / Income Gap ($) | 206 | 100.00¢ per $1 |
| Gini / Inequality Index | 206 | 0.37 |
Earnings by Sex in Beaver
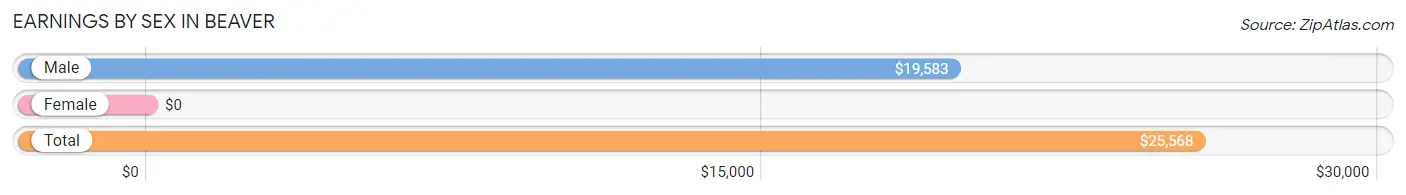
| Sex | Number | Average Earnings |
| Male | 72 (82.8%) | $19,583 |
| Female | 15 (17.2%) | $0 |
| Total | 87 (100.0%) | $25,568 |
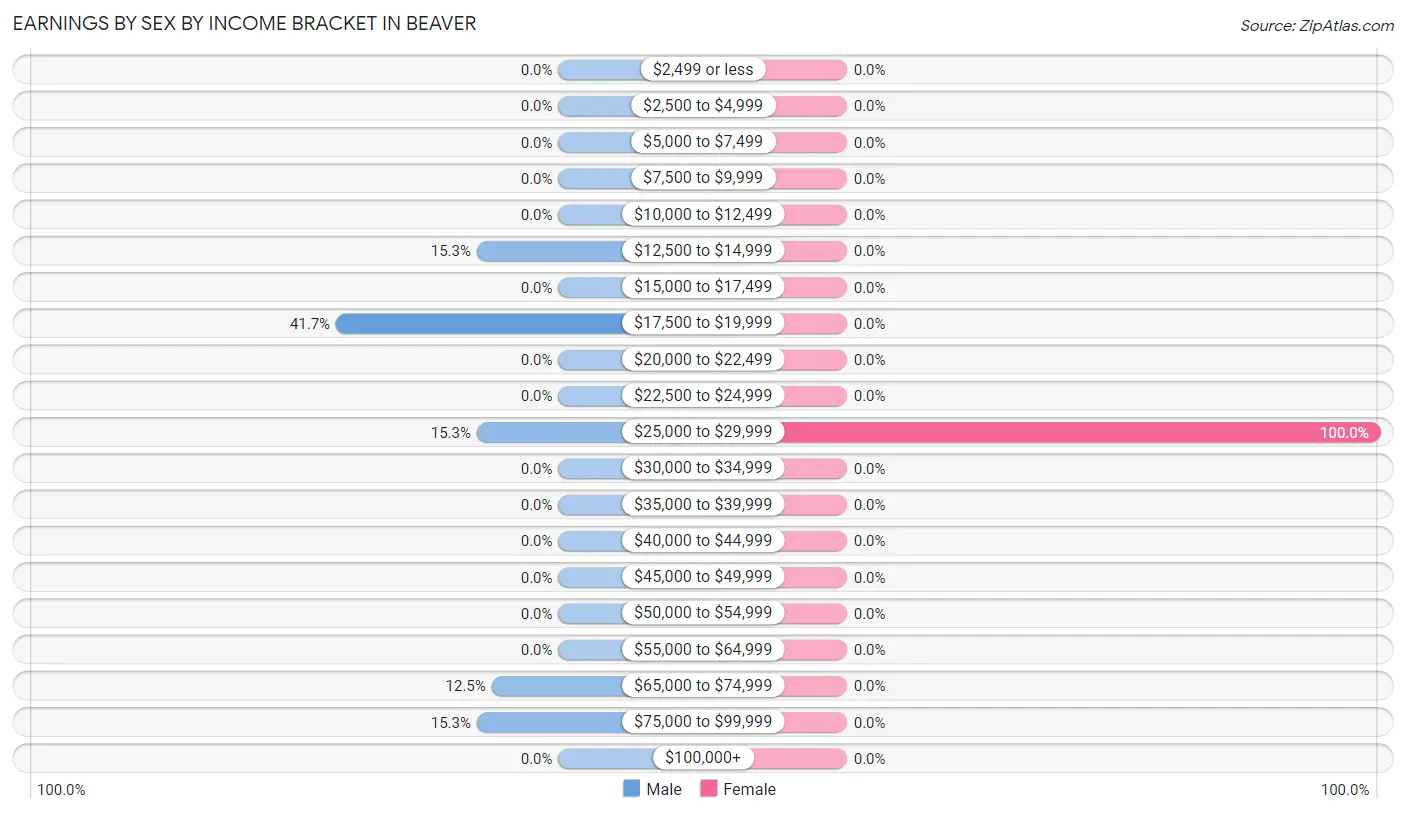
Earnings by Sex by Income Bracket in Beaver
The most common earnings brackets in Beaver are $17,500 to $19,999 for men (30 | 41.7%) and $25,000 to $29,999 for women (15 | 100.0%).
| Income | Male | Female |
| $2,499 or less | 0 (0.0%) | 0 (0.0%) |
| $2,500 to $4,999 | 0 (0.0%) | 0 (0.0%) |
| $5,000 to $7,499 | 0 (0.0%) | 0 (0.0%) |
| $7,500 to $9,999 | 0 (0.0%) | 0 (0.0%) |
| $10,000 to $12,499 | 0 (0.0%) | 0 (0.0%) |
| $12,500 to $14,999 | 11 (15.3%) | 0 (0.0%) |
| $15,000 to $17,499 | 0 (0.0%) | 0 (0.0%) |
| $17,500 to $19,999 | 30 (41.7%) | 0 (0.0%) |
| $20,000 to $22,499 | 0 (0.0%) | 0 (0.0%) |
| $22,500 to $24,999 | 0 (0.0%) | 0 (0.0%) |
| $25,000 to $29,999 | 11 (15.3%) | 15 (100.0%) |
| $30,000 to $34,999 | 0 (0.0%) | 0 (0.0%) |
| $35,000 to $39,999 | 0 (0.0%) | 0 (0.0%) |
| $40,000 to $44,999 | 0 (0.0%) | 0 (0.0%) |
| $45,000 to $49,999 | 0 (0.0%) | 0 (0.0%) |
| $50,000 to $54,999 | 0 (0.0%) | 0 (0.0%) |
| $55,000 to $64,999 | 0 (0.0%) | 0 (0.0%) |
| $65,000 to $74,999 | 9 (12.5%) | 0 (0.0%) |
| $75,000 to $99,999 | 11 (15.3%) | 0 (0.0%) |
| $100,000+ | 0 (0.0%) | 0 (0.0%) |
| Total | 72 (100.0%) | 15 (100.0%) |
Earnings by Sex by Educational Attainment in Beaver
| Educational Attainment | Male Income | Female Income |
| Less than High School | - | - |
| High School Diploma | - | - |
| College or Associate's Degree | - | - |
| Bachelor's Degree | - | - |
| Graduate Degree | - | - |
| Total | - | - |
Family Income in Beaver
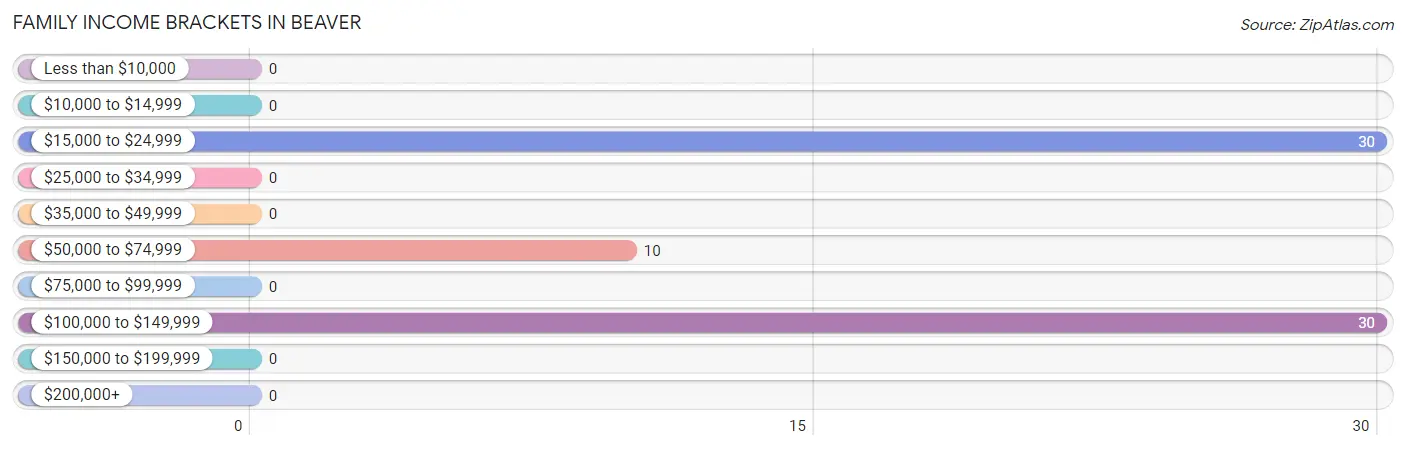
Family Income Brackets in Beaver
According to the Beaver family income data, there are 30 families falling into the $15,000 to $24,999 income range, which is the most common income bracket and makes up 42.9% of all families.
| Income Bracket | # Families | % Families |
| Less than $10,000 | 0 | 0.0% |
| $10,000 to $14,999 | 0 | 0.0% |
| $15,000 to $24,999 | 30 | 42.9% |
| $25,000 to $34,999 | 0 | 0.0% |
| $35,000 to $49,999 | 0 | 0.0% |
| $50,000 to $74,999 | 10 | 14.3% |
| $75,000 to $99,999 | 0 | 0.0% |
| $100,000 to $149,999 | 30 | 42.9% |
| $150,000 to $199,999 | 0 | 0.0% |
| $200,000+ | 0 | 0.0% |
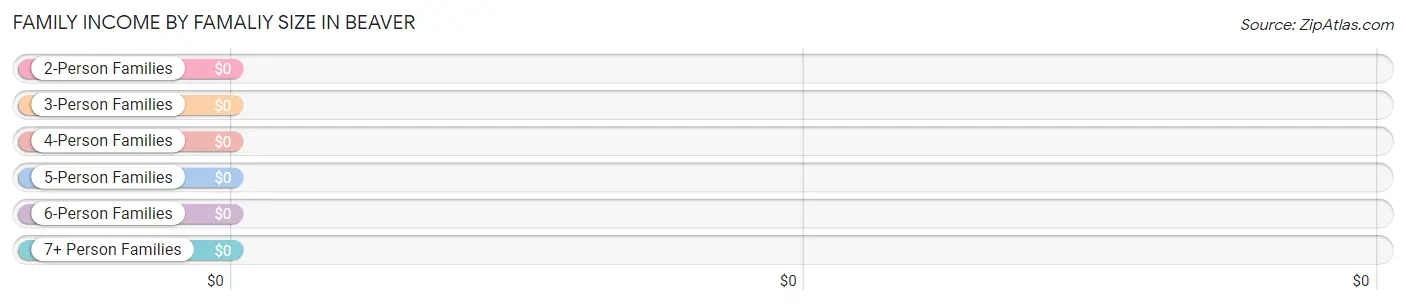
Family Income by Famaliy Size in Beaver
| Income Bracket | # Families | Median Income |
| 2-Person Families | 59 (84.3%) | $0 |
| 3-Person Families | 0 (0.0%) | $0 |
| 4-Person Families | 11 (15.7%) | $0 |
| 5-Person Families | 0 (0.0%) | $0 |
| 6-Person Families | 0 (0.0%) | $0 |
| 7+ Person Families | 0 (0.0%) | $0 |
| Total | 70 (100.0%) | $0 |
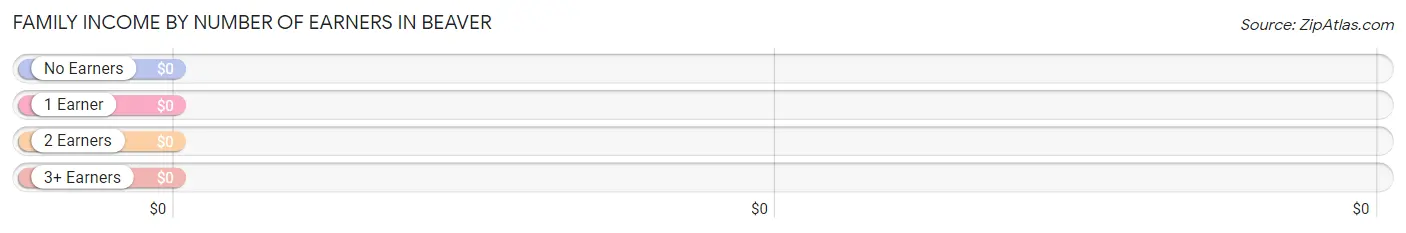
Family Income by Number of Earners in Beaver
| Number of Earners | # Families | Median Income |
| No Earners | 20 (28.6%) | $0 |
| 1 Earner | 39 (55.7%) | $0 |
| 2 Earners | 0 (0.0%) | $0 |
| 3+ Earners | 11 (15.7%) | $0 |
| Total | 70 (100.0%) | $0 |
Household Income in Beaver
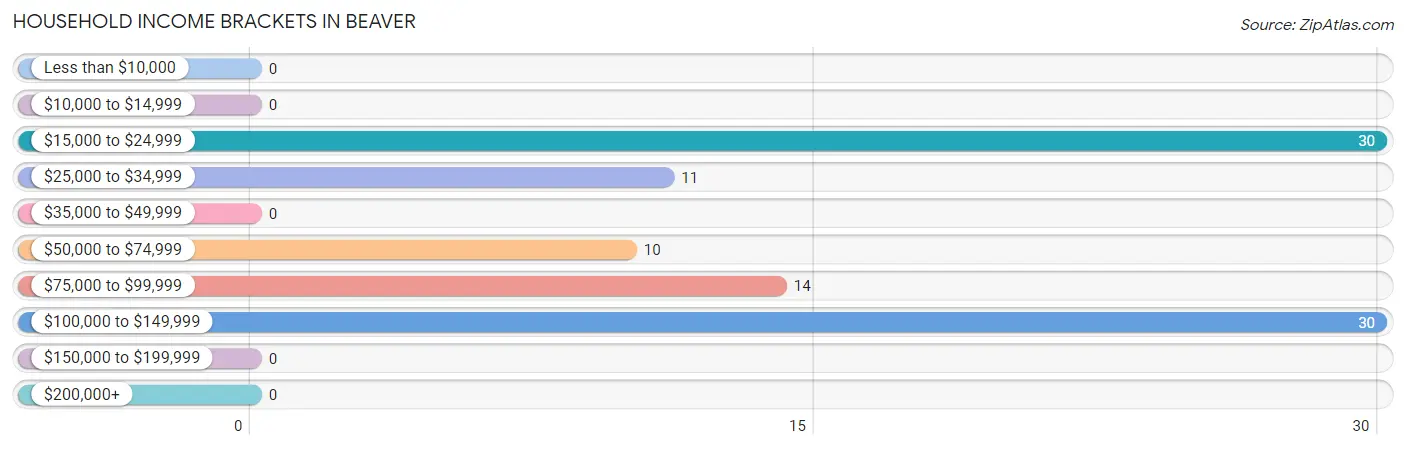
Household Income Brackets in Beaver
With 30 households falling in the category, the $15,000 to $24,999 income range is the most frequent in Beaver, accounting for 31.6% of all households.
| Income Bracket | # Households | % Households |
| Less than $10,000 | 0 | 0.0% |
| $10,000 to $14,999 | 0 | 0.0% |
| $15,000 to $24,999 | 30 | 31.6% |
| $25,000 to $34,999 | 11 | 11.6% |
| $35,000 to $49,999 | 0 | 0.0% |
| $50,000 to $74,999 | 10 | 10.5% |
| $75,000 to $99,999 | 14 | 14.7% |
| $100,000 to $149,999 | 30 | 31.6% |
| $150,000 to $199,999 | 0 | 0.0% |
| $200,000+ | 0 | 0.0% |
Household Income by Householder Age in Beaver
The median household income in Beaver is $0, with the highest median household income of $128,625 found in the 65+ years age bracket for the primary householder. A total of 29 households (30.5%) fall into this category.
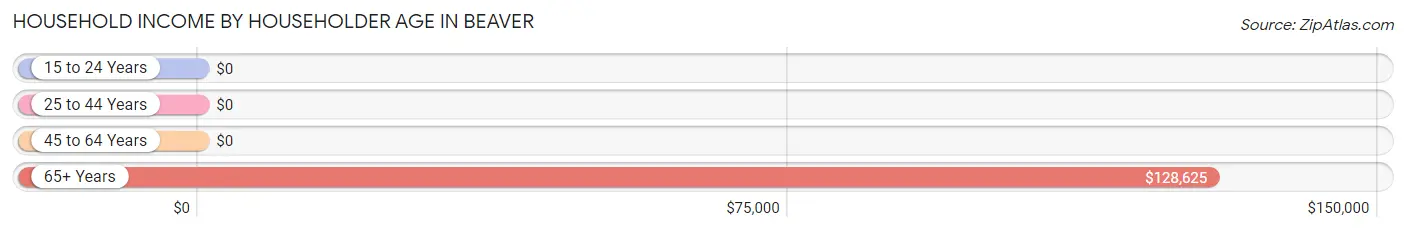
| Income Bracket | # Households | Median Income |
| 15 to 24 Years | 0 (0.0%) | $0 |
| 25 to 44 Years | 11 (11.6%) | $0 |
| 45 to 64 Years | 55 (57.9%) | $0 |
| 65+ Years | 29 (30.5%) | $128,625 |
| Total | 95 (100.0%) | $0 |
Poverty in Beaver
Income Below Poverty by Sex and Age in Beaver
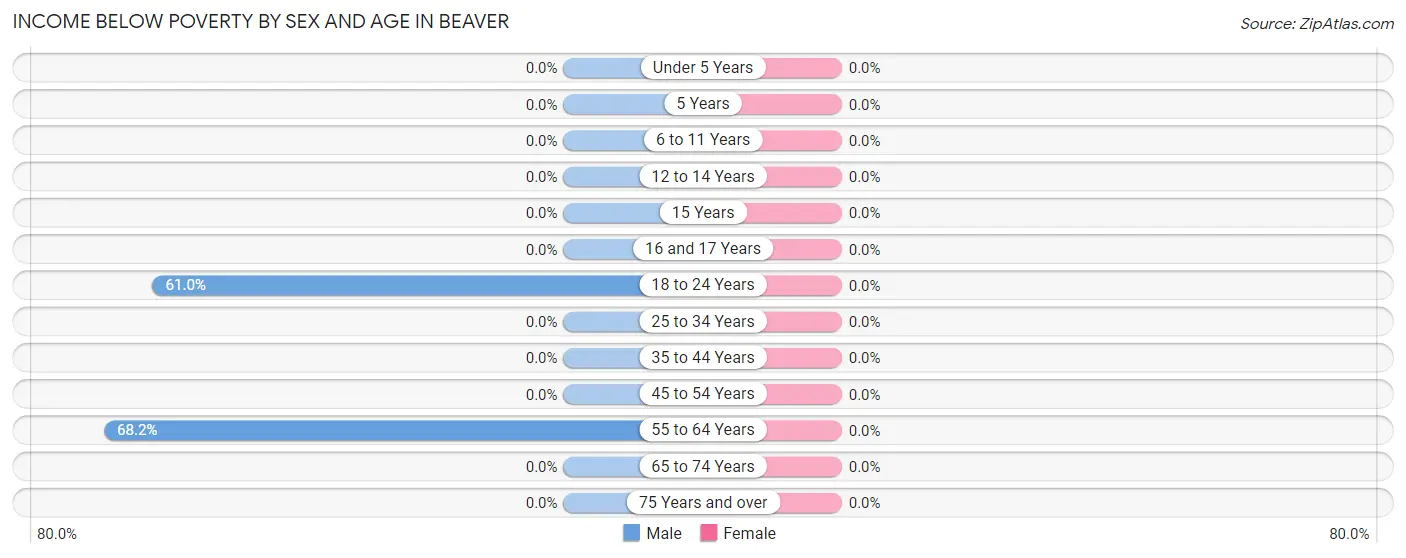
| Age Bracket | Male | Female |
| Under 5 Years | 0 (0.0%) | 0 (0.0%) |
| 5 Years | 0 (0.0%) | 0 (0.0%) |
| 6 to 11 Years | 0 (0.0%) | 0 (0.0%) |
| 12 to 14 Years | 0 (0.0%) | 0 (0.0%) |
| 15 Years | 0 (0.0%) | 0 (0.0%) |
| 16 and 17 Years | 0 (0.0%) | 0 (0.0%) |
| 18 to 24 Years | 25 (61.0%) | 0 (0.0%) |
| 25 to 34 Years | 0 (0.0%) | 0 (0.0%) |
| 35 to 44 Years | 0 (0.0%) | 0 (0.0%) |
| 45 to 54 Years | 0 (0.0%) | 0 (0.0%) |
| 55 to 64 Years | 30 (68.2%) | 0 (0.0%) |
| 65 to 74 Years | 0 (0.0%) | 0 (0.0%) |
| 75 Years and over | 0 (0.0%) | 0 (0.0%) |
| Total | 55 (37.4%) | 0 (0.0%) |
Income Above Poverty by Sex and Age in Beaver
According to the poverty statistics in Beaver, males aged 16 and 17 years and females aged 45 to 54 years are the age groups that are most secure financially, with 100.0% of males and 100.0% of females in these age groups living above the poverty line.
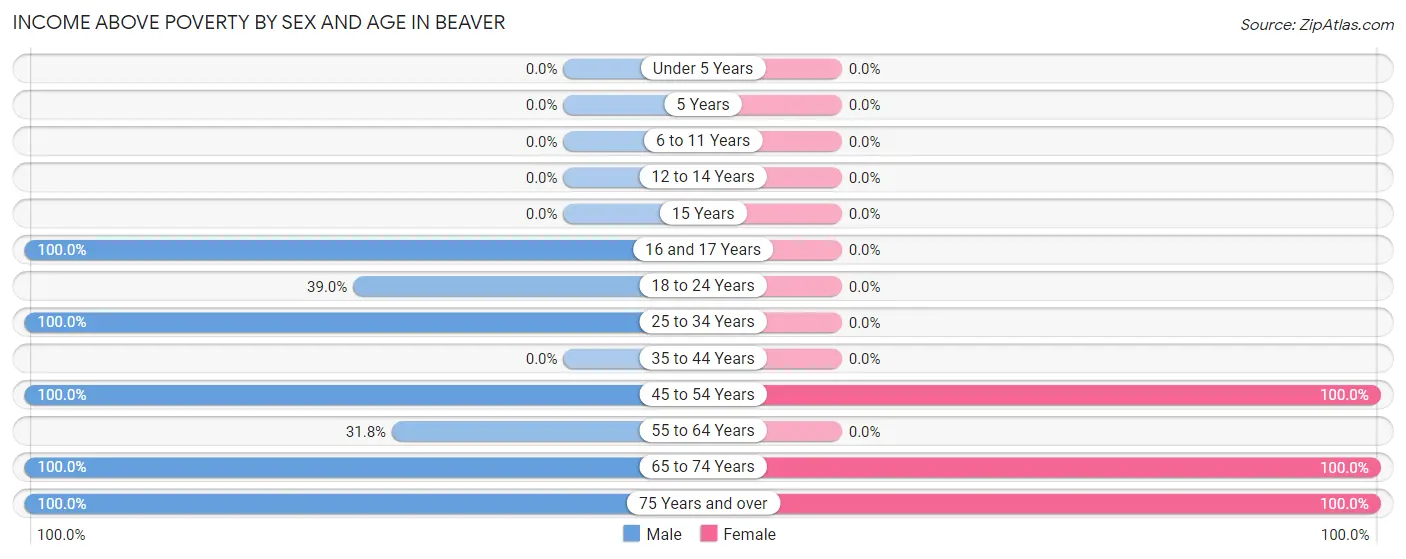
| Age Bracket | Male | Female |
| Under 5 Years | 0 (0.0%) | 0 (0.0%) |
| 5 Years | 0 (0.0%) | 0 (0.0%) |
| 6 to 11 Years | 0 (0.0%) | 0 (0.0%) |
| 12 to 14 Years | 0 (0.0%) | 0 (0.0%) |
| 15 Years | 0 (0.0%) | 0 (0.0%) |
| 16 and 17 Years | 11 (100.0%) | 0 (0.0%) |
| 18 to 24 Years | 16 (39.0%) | 0 (0.0%) |
| 25 to 34 Years | 11 (100.0%) | 0 (0.0%) |
| 35 to 44 Years | 0 (0.0%) | 0 (0.0%) |
| 45 to 54 Years | 11 (100.0%) | 15 (100.0%) |
| 55 to 64 Years | 14 (31.8%) | 0 (0.0%) |
| 65 to 74 Years | 19 (100.0%) | 19 (100.0%) |
| 75 Years and over | 10 (100.0%) | 25 (100.0%) |
| Total | 92 (62.6%) | 59 (100.0%) |
Income Below Poverty Among Married-Couple Families in Beaver
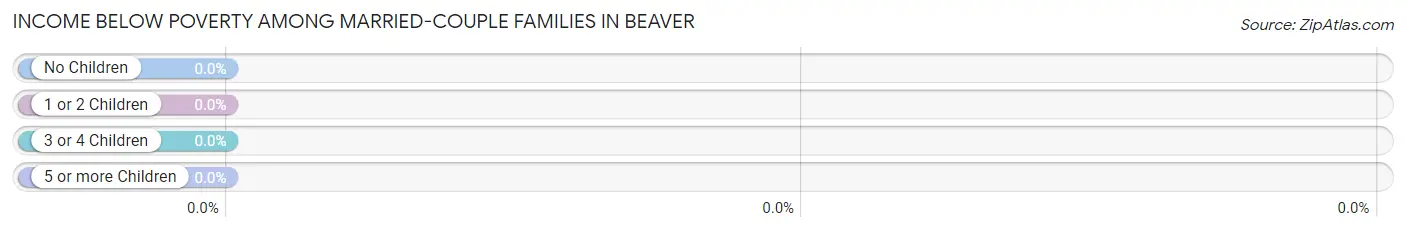
| Children | Above Poverty | Below Poverty |
| No Children | 29 (100.0%) | 0 (0.0%) |
| 1 or 2 Children | 11 (100.0%) | 0 (0.0%) |
| 3 or 4 Children | 0 (0.0%) | 0 (0.0%) |
| 5 or more Children | 0 (0.0%) | 0 (0.0%) |
| Total | 40 (100.0%) | 0 (0.0%) |
Income Below Poverty Among Single-Parent Households in Beaver
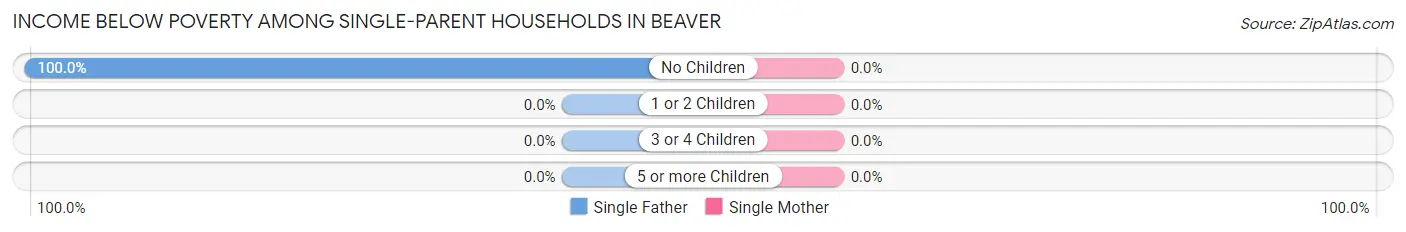
| Children | Single Father | Single Mother |
| No Children | 30 (100.0%) | 0 (0.0%) |
| 1 or 2 Children | 0 (0.0%) | 0 (0.0%) |
| 3 or 4 Children | 0 (0.0%) | 0 (0.0%) |
| 5 or more Children | 0 (0.0%) | 0 (0.0%) |
| Total | 30 (100.0%) | 0 (0.0%) |
Income Below Poverty Among Married-Couple vs Single-Parent Households in Beaver
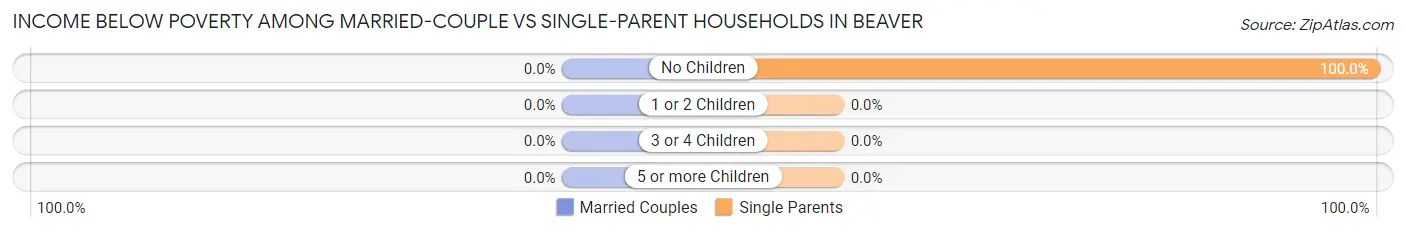
| Children | Married-Couple Families | Single-Parent Households |
| No Children | 0 (0.0%) | 30 (100.0%) |
| 1 or 2 Children | 0 (0.0%) | 0 (0.0%) |
| 3 or 4 Children | 0 (0.0%) | 0 (0.0%) |
| 5 or more Children | 0 (0.0%) | 0 (0.0%) |
| Total | 0 (0.0%) | 30 (100.0%) |
Race in Beaver
The most populous races in Beaver are White / Caucasian (181 | 87.9%), Hispanic or Latino (25 | 12.1%), and Two or more Races (25 | 12.1%).
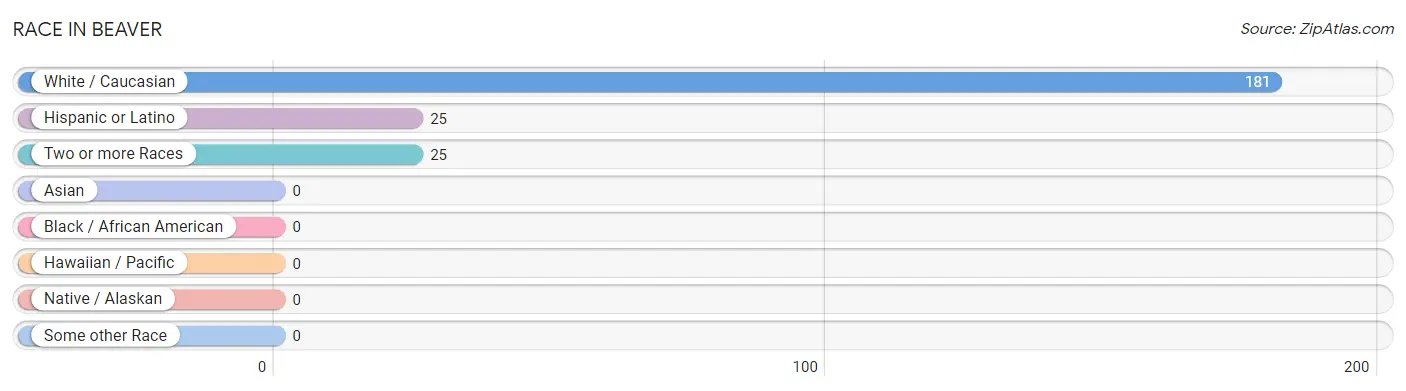
| Race | # Population | % Population |
| Asian | 0 | 0.0% |
| Black / African American | 0 | 0.0% |
| Hawaiian / Pacific | 0 | 0.0% |
| Hispanic or Latino | 25 | 12.1% |
| Native / Alaskan | 0 | 0.0% |
| White / Caucasian | 181 | 87.9% |
| Two or more Races | 25 | 12.1% |
| Some other Race | 0 | 0.0% |
| Total | 206 | 100.0% |
Ancestry in Beaver
The most populous ancestries reported in Beaver are European (83 | 40.3%), German (49 | 23.8%), English (35 | 17.0%), American (29 | 14.1%), and Mexican (25 | 12.1%), together accounting for 107.3% of all Beaver residents.
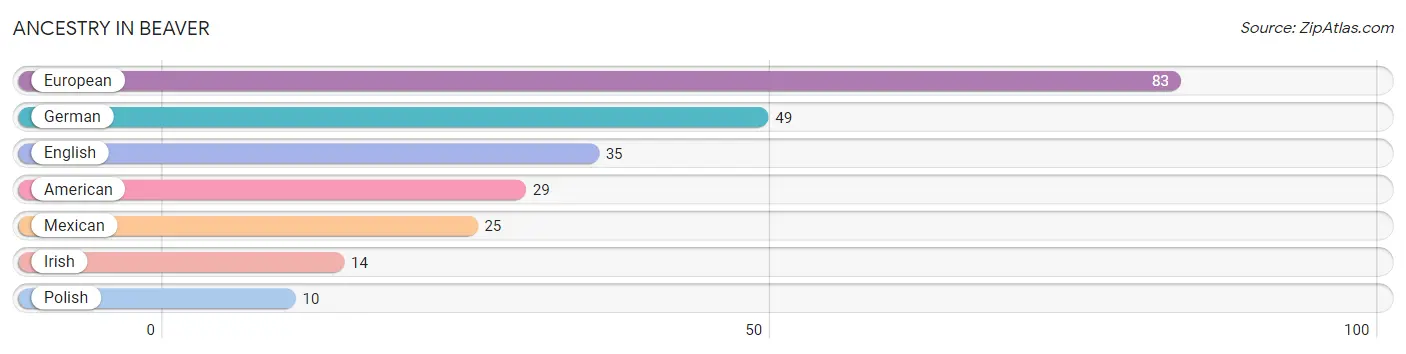
| Ancestry | # Population | % Population |
| American | 29 | 14.1% |
| English | 35 | 17.0% |
| European | 83 | 40.3% |
| German | 49 | 23.8% |
| Irish | 14 | 6.8% |
| Mexican | 25 | 12.1% |
| Polish | 10 | 4.9% | View All 7 Rows |
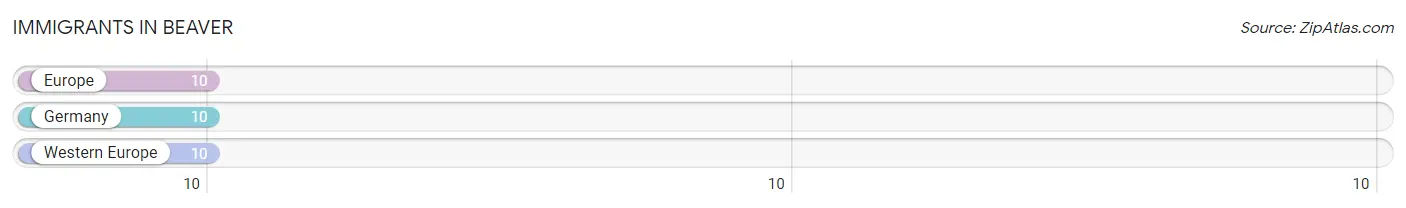
Immigrants in Beaver
The most numerous immigrant groups reported in Beaver came from Europe (10 | 4.9%), Germany (10 | 4.9%), and Western Europe (10 | 4.9%), together accounting for 14.6% of all Beaver residents.
| Immigration Origin | # Population | % Population |
| Europe | 10 | 4.9% |
| Germany | 10 | 4.9% |
| Western Europe | 10 | 4.9% | View All 3 Rows |
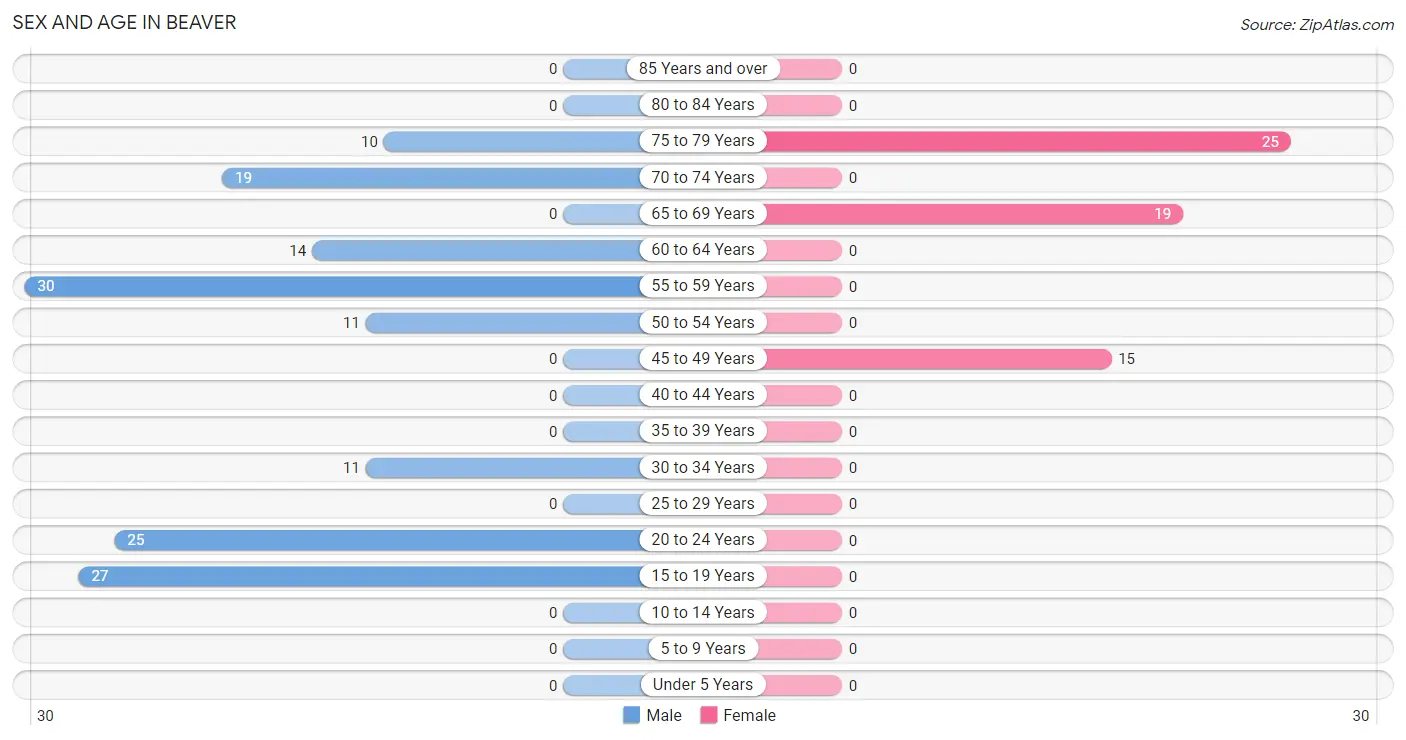
Sex and Age in Beaver
Sex and Age in Beaver
The most populous age groups in Beaver are 55 to 59 Years (30 | 20.4%) for men and 75 to 79 Years (25 | 42.4%) for women.
| Age Bracket | Male | Female |
| Under 5 Years | 0 (0.0%) | 0 (0.0%) |
| 5 to 9 Years | 0 (0.0%) | 0 (0.0%) |
| 10 to 14 Years | 0 (0.0%) | 0 (0.0%) |
| 15 to 19 Years | 27 (18.4%) | 0 (0.0%) |
| 20 to 24 Years | 25 (17.0%) | 0 (0.0%) |
| 25 to 29 Years | 0 (0.0%) | 0 (0.0%) |
| 30 to 34 Years | 11 (7.5%) | 0 (0.0%) |
| 35 to 39 Years | 0 (0.0%) | 0 (0.0%) |
| 40 to 44 Years | 0 (0.0%) | 0 (0.0%) |
| 45 to 49 Years | 0 (0.0%) | 15 (25.4%) |
| 50 to 54 Years | 11 (7.5%) | 0 (0.0%) |
| 55 to 59 Years | 30 (20.4%) | 0 (0.0%) |
| 60 to 64 Years | 14 (9.5%) | 0 (0.0%) |
| 65 to 69 Years | 0 (0.0%) | 19 (32.2%) |
| 70 to 74 Years | 19 (12.9%) | 0 (0.0%) |
| 75 to 79 Years | 10 (6.8%) | 25 (42.4%) |
| 80 to 84 Years | 0 (0.0%) | 0 (0.0%) |
| 85 Years and over | 0 (0.0%) | 0 (0.0%) |
| Total | 147 (100.0%) | 59 (100.0%) |
Families and Households in Beaver
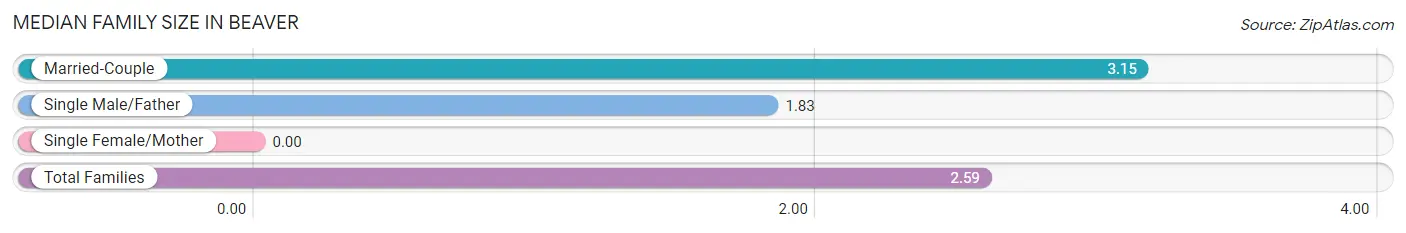
Median Family Size in Beaver
| Family Type | # Families | Family Size |
| Married-Couple | 40 (57.1%) | 3.15 |
| Single Male/Father | 30 (42.9%) | 1.83 |
| Single Female/Mother | 0 (0.0%) | - |
| Total Families | 70 (100.0%) | 2.59 |
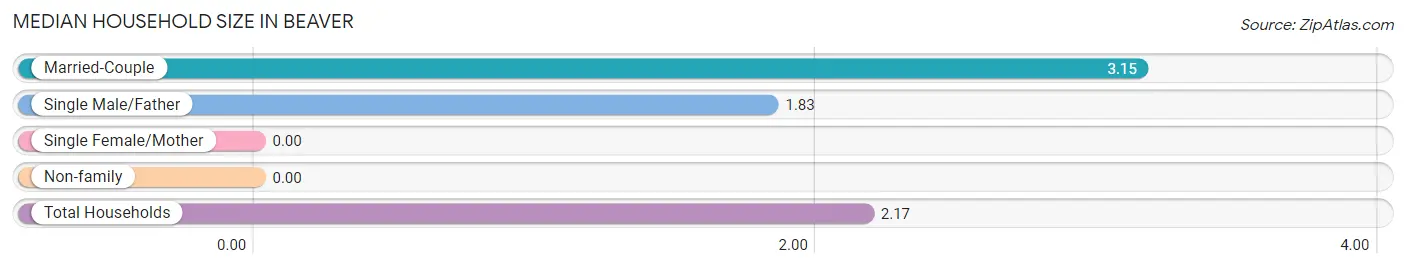
Median Household Size in Beaver
| Household Type | # Households | Household Size |
| Married-Couple | 40 (42.1%) | 3.15 |
| Single Male/Father | 30 (31.6%) | 1.83 |
| Single Female/Mother | 0 (0.0%) | - |
| Non-family | 25 (26.3%) | - |
| Total Households | 95 (100.0%) | 2.17 |
Household Size by Marriage Status in Beaver
Out of a total of 95 households in Beaver, 70 (73.7%) are family households, while 25 (26.3%) are nonfamily households. The most numerous type of family households are 2-person households, comprising 59, and the most common type of nonfamily households are 1-person households, comprising 25.
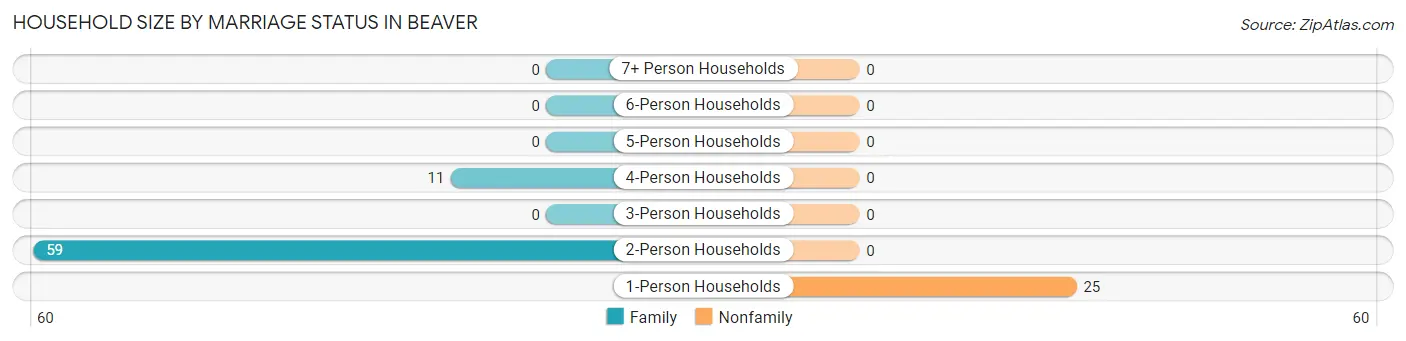
| Household Size | Family Households | Nonfamily Households |
| 1-Person Households | - | 25 (26.3%) |
| 2-Person Households | 59 (62.1%) | 0 (0.0%) |
| 3-Person Households | 0 (0.0%) | 0 (0.0%) |
| 4-Person Households | 11 (11.6%) | 0 (0.0%) |
| 5-Person Households | 0 (0.0%) | 0 (0.0%) |
| 6-Person Households | 0 (0.0%) | 0 (0.0%) |
| 7+ Person Households | 0 (0.0%) | 0 (0.0%) |
| Total | 70 (73.7%) | 25 (26.3%) |
Female Fertility in Beaver
Fertility by Age in Beaver
| Age Bracket | Women with Births | Births / 1,000 Women |
| 15 to 19 years | 0 (0.0%) | 0.0 |
| 20 to 34 years | 0 (0.0%) | 0.0 |
| 35 to 50 years | 0 (0.0%) | 0.0 |
| Total | 0 (0.0%) | 0.0 |
Fertility by Age by Marriage Status in Beaver
| Age Bracket | Married | Unmarried |
| 15 to 19 years | 0 (0.0%) | 0 (0.0%) |
| 20 to 34 years | 0 (0.0%) | 0 (0.0%) |
| 35 to 50 years | 0 (0.0%) | 0 (0.0%) |
| Total | 0 (0.0%) | 0 (0.0%) |
Fertility by Education in Beaver
| Educational Attainment | Women with Births | Births / 1,000 Women |
| Less than High School | 0 (0.0%) | 0.0 |
| High School Diploma | 0 (0.0%) | 0.0 |
| College or Associate's Degree | 0 (0.0%) | 0.0 |
| Bachelor's Degree | 0 (0.0%) | 0.0 |
| Graduate Degree | 0 (0.0%) | 0.0 |
| Total | 0 (0.0%) | 0.0 |
Fertility by Education by Marriage Status in Beaver
| Educational Attainment | Married | Unmarried |
| Less than High School | 0 (0.0%) | 0 (0.0%) |
| High School Diploma | 0 (0.0%) | 0 (0.0%) |
| College or Associate's Degree | 0 (0.0%) | 0 (0.0%) |
| Bachelor's Degree | 0 (0.0%) | 0 (0.0%) |
| Graduate Degree | 0 (0.0%) | 0 (0.0%) |
| Total | 0 (0.0%) | 0 (0.0%) |
Employment Characteristics in Beaver
Employment by Class of Employer in Beaver
Among the 78 employed individuals in Beaver, private company employees (41 | 52.6%), not-for-profit organizations (15 | 19.2%), and self-employed (not incorporated) (11 | 14.1%) make up the most common classes of employment.
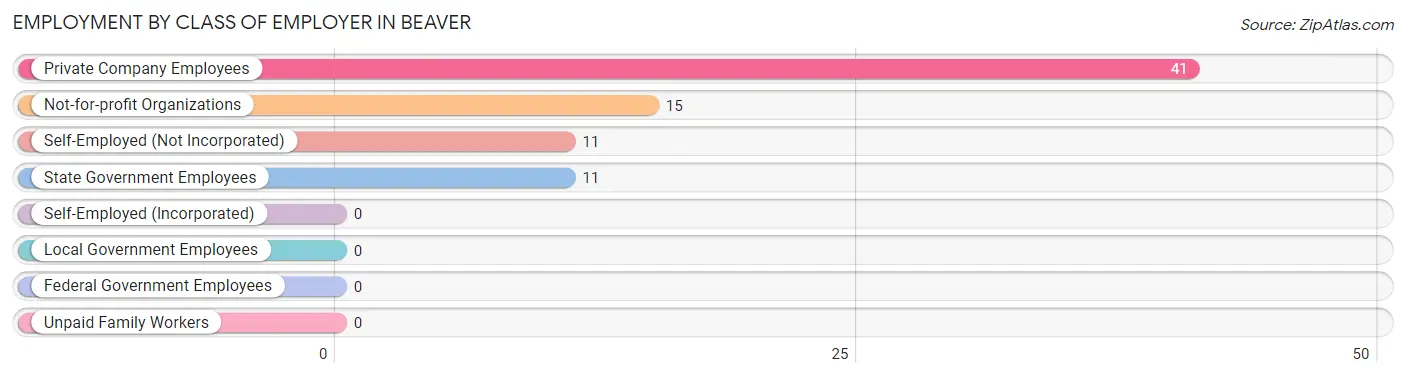
| Employer Class | # Employees | % Employees |
| Private Company Employees | 41 | 52.6% |
| Self-Employed (Incorporated) | 0 | 0.0% |
| Self-Employed (Not Incorporated) | 11 | 14.1% |
| Not-for-profit Organizations | 15 | 19.2% |
| Local Government Employees | 0 | 0.0% |
| State Government Employees | 11 | 14.1% |
| Federal Government Employees | 0 | 0.0% |
| Unpaid Family Workers | 0 | 0.0% |
| Total | 78 | 100.0% |
Employment Status by Age in Beaver
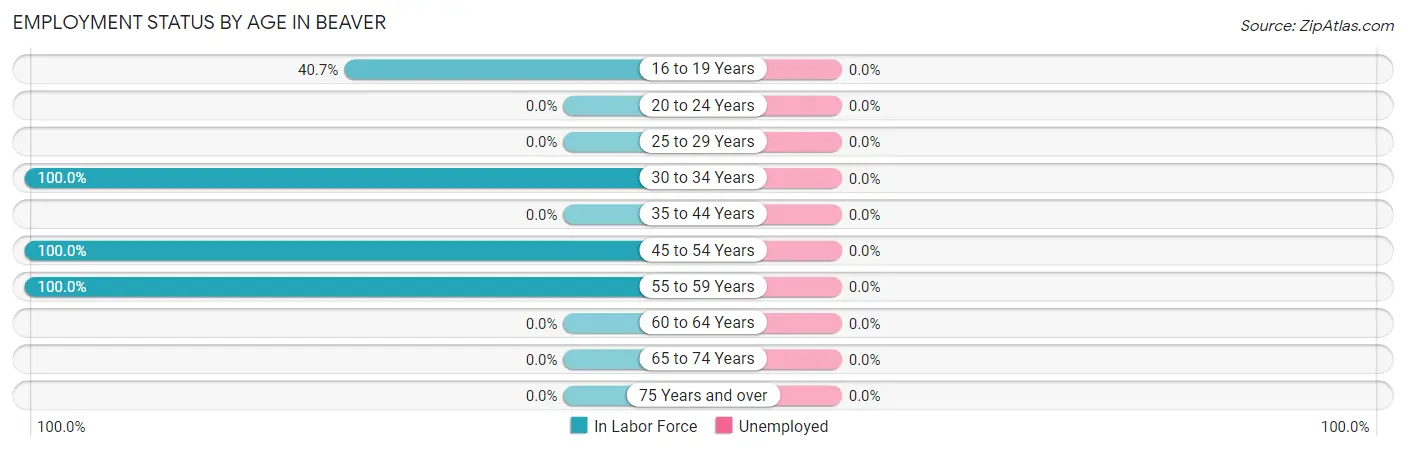
| Age Bracket | In Labor Force | Unemployed |
| 16 to 19 Years | 11 (40.7%) | 0 (0.0%) |
| 20 to 24 Years | 0 (0.0%) | 0 (0.0%) |
| 25 to 29 Years | 0 (0.0%) | 0 (0.0%) |
| 30 to 34 Years | 11 (100.0%) | 0 (0.0%) |
| 35 to 44 Years | 0 (0.0%) | 0 (0.0%) |
| 45 to 54 Years | 26 (100.0%) | 0 (0.0%) |
| 55 to 59 Years | 30 (100.0%) | 0 (0.0%) |
| 60 to 64 Years | 0 (0.0%) | 0 (0.0%) |
| 65 to 74 Years | 0 (0.0%) | 0 (0.0%) |
| 75 Years and over | 0 (0.0%) | 0 (0.0%) |
| Total | 78 (37.9%) | 0 (0.0%) |
Employment Status by Educational Attainment in Beaver
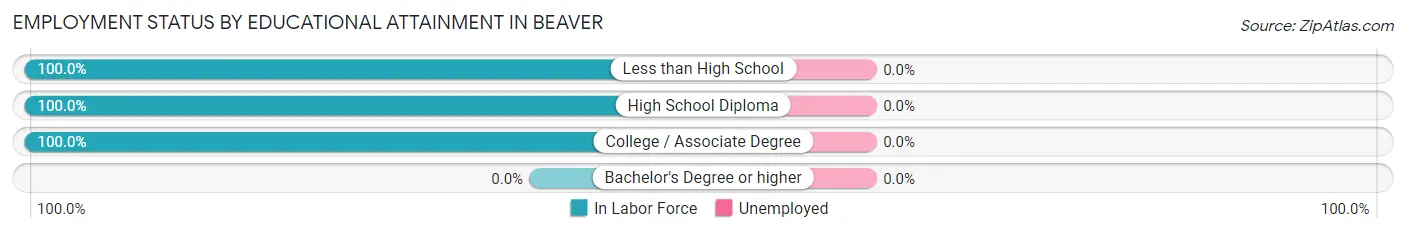
| Educational Attainment | In Labor Force | Unemployed |
| Less than High School | 30 (100.0%) | 0 (0.0%) |
| High School Diploma | 11 (100.0%) | 0 (0.0%) |
| College / Associate Degree | 26 (100.0%) | 0 (0.0%) |
| Bachelor's Degree or higher | 0 (0.0%) | 0 (0.0%) |
| Total | 67 (82.7%) | 0 (0.0%) |
Employment Occupations by Sex in Beaver
Management, Business, Science and Arts Occupations
The most common Management, Business, Science and Arts occupations in Beaver are Community & Social Service (15 | 19.2%), and Education Instruction & Library (15 | 19.2%).
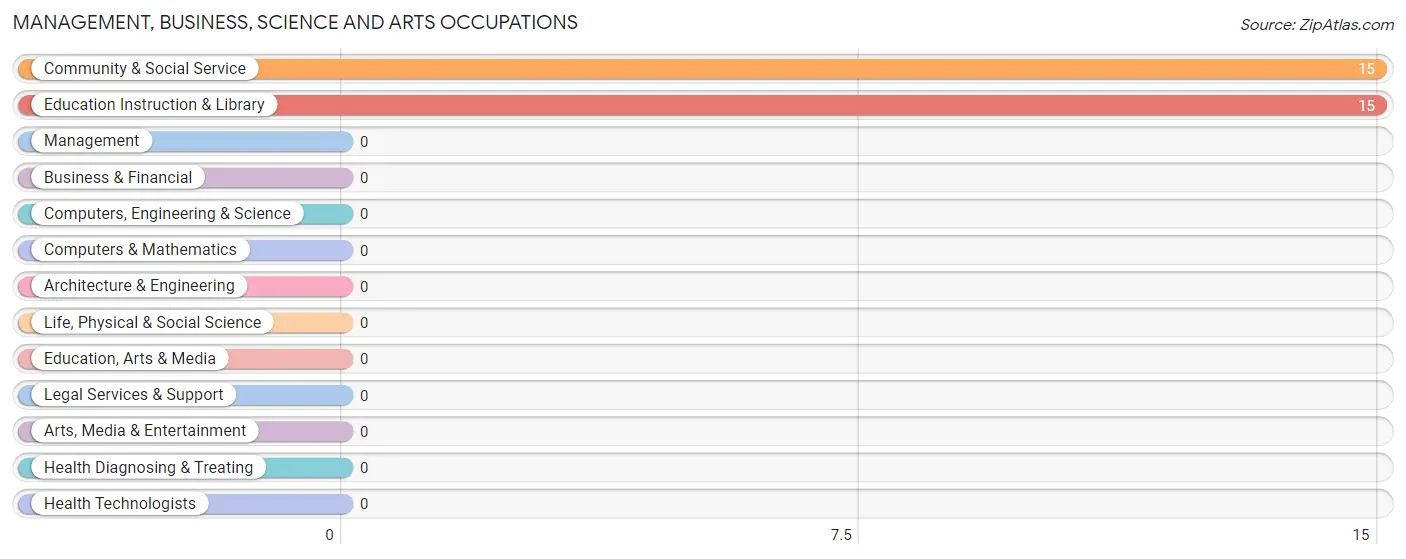
Management, Business, Science and Arts Occupations by Sex
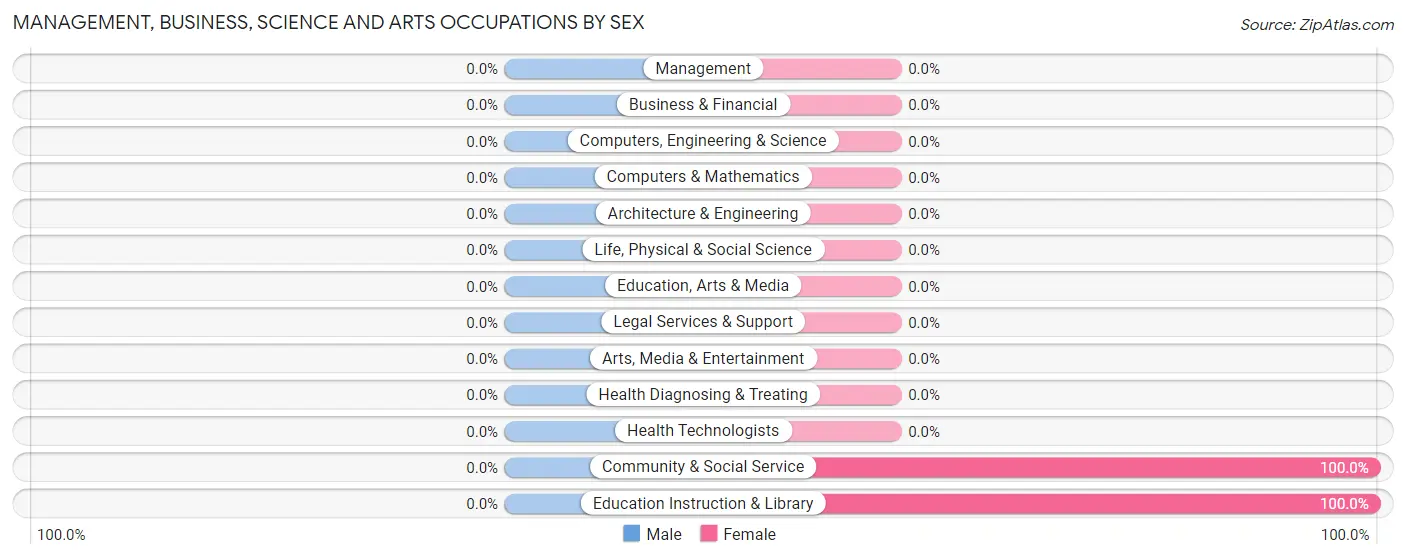
| Occupation | Male | Female |
| Management | 0 (0.0%) | 0 (0.0%) |
| Business & Financial | 0 (0.0%) | 0 (0.0%) |
| Computers, Engineering & Science | 0 (0.0%) | 0 (0.0%) |
| Computers & Mathematics | 0 (0.0%) | 0 (0.0%) |
| Architecture & Engineering | 0 (0.0%) | 0 (0.0%) |
| Life, Physical & Social Science | 0 (0.0%) | 0 (0.0%) |
| Community & Social Service | 0 (0.0%) | 15 (100.0%) |
| Education, Arts & Media | 0 (0.0%) | 0 (0.0%) |
| Legal Services & Support | 0 (0.0%) | 0 (0.0%) |
| Education Instruction & Library | 0 (0.0%) | 15 (100.0%) |
| Arts, Media & Entertainment | 0 (0.0%) | 0 (0.0%) |
| Health Diagnosing & Treating | 0 (0.0%) | 0 (0.0%) |
| Health Technologists | 0 (0.0%) | 0 (0.0%) |
| Total (Category) | 0 (0.0%) | 15 (100.0%) |
| Total (Overall) | 63 (80.8%) | 15 (19.2%) |
Services Occupations
The most common Services occupations in Beaver are , and Cleaning & Maintenance (30 | 38.5%).
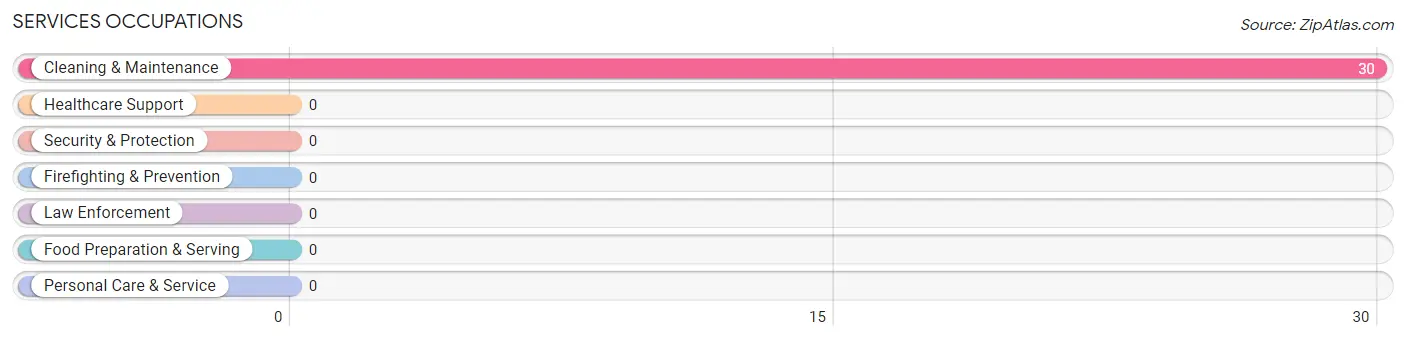
Services Occupations by Sex
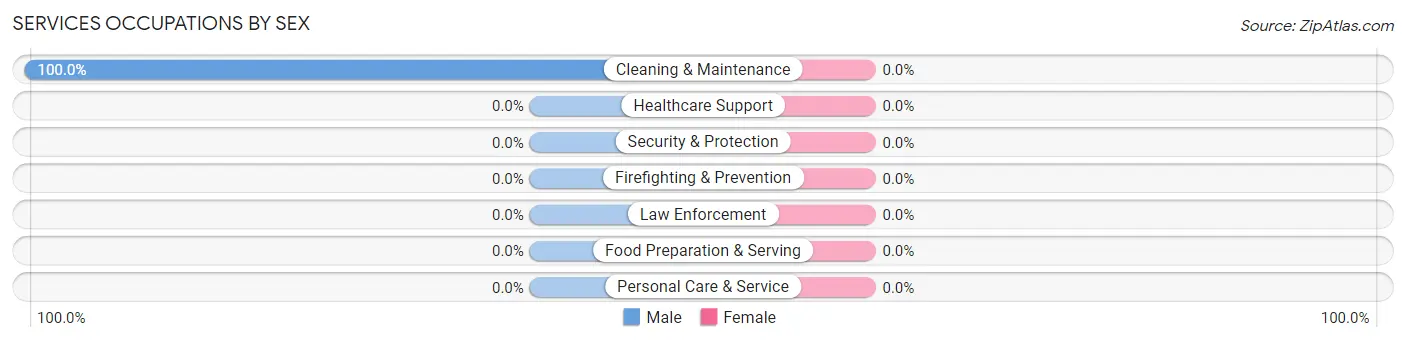
| Occupation | Male | Female |
| Healthcare Support | 0 (0.0%) | 0 (0.0%) |
| Security & Protection | 0 (0.0%) | 0 (0.0%) |
| Firefighting & Prevention | 0 (0.0%) | 0 (0.0%) |
| Law Enforcement | 0 (0.0%) | 0 (0.0%) |
| Food Preparation & Serving | 0 (0.0%) | 0 (0.0%) |
| Cleaning & Maintenance | 30 (100.0%) | 0 (0.0%) |
| Personal Care & Service | 0 (0.0%) | 0 (0.0%) |
| Total (Category) | 30 (100.0%) | 0 (0.0%) |
| Total (Overall) | 63 (80.8%) | 15 (19.2%) |
Sales and Office Occupations
Sales and Office Occupations by Sex
| Occupation | Male | Female |
| Sales & Related | 0 (0.0%) | 0 (0.0%) |
| Office & Administration | 0 (0.0%) | 0 (0.0%) |
| Total (Category) | 0 (0.0%) | 0 (0.0%) |
| Total (Overall) | 63 (80.8%) | 15 (19.2%) |
Natural Resources, Construction and Maintenance Occupations
The most common Natural Resources, Construction and Maintenance occupations in Beaver are , and Construction & Extraction (22 | 28.2%).
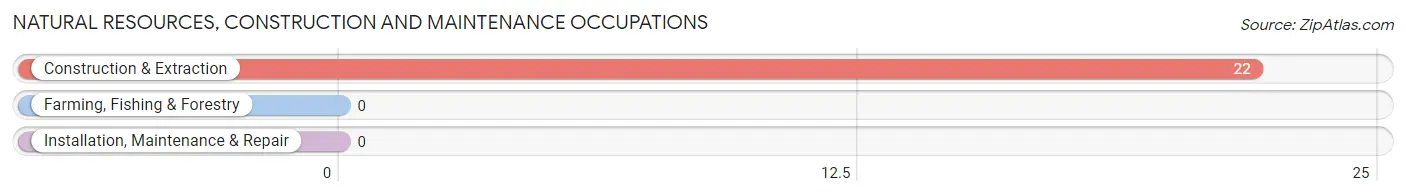
Natural Resources, Construction and Maintenance Occupations by Sex
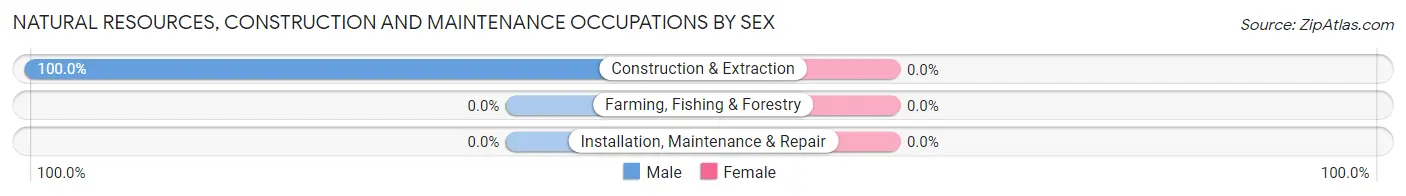
| Occupation | Male | Female |
| Farming, Fishing & Forestry | 0 (0.0%) | 0 (0.0%) |
| Construction & Extraction | 22 (100.0%) | 0 (0.0%) |
| Installation, Maintenance & Repair | 0 (0.0%) | 0 (0.0%) |
| Total (Category) | 22 (100.0%) | 0 (0.0%) |
| Total (Overall) | 63 (80.8%) | 15 (19.2%) |
Production, Transportation and Moving Occupations
The most common Production, Transportation and Moving occupations in Beaver are , and Transportation (11 | 14.1%).
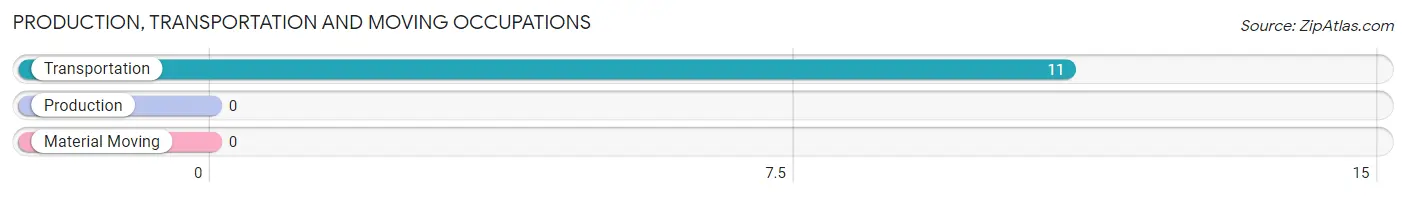
Production, Transportation and Moving Occupations by Sex
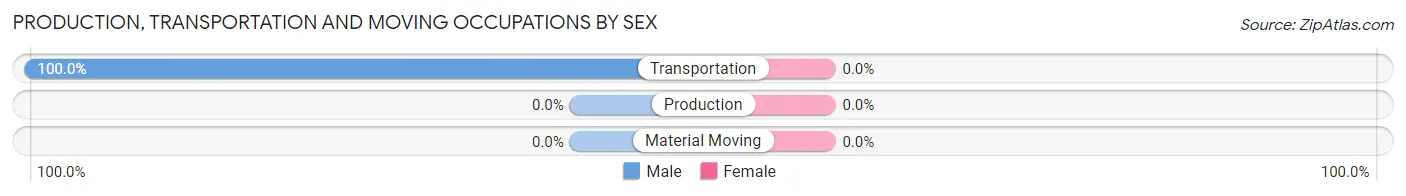
| Occupation | Male | Female |
| Production | 0 (0.0%) | 0 (0.0%) |
| Transportation | 11 (100.0%) | 0 (0.0%) |
| Material Moving | 0 (0.0%) | 0 (0.0%) |
| Total (Category) | 11 (100.0%) | 0 (0.0%) |
| Total (Overall) | 63 (80.8%) | 15 (19.2%) |
Employment Industries by Sex in Beaver
Employment Industries in Beaver
The major employment industries in Beaver include Real Estate, Rental & Leasing (30 | 38.5%), Construction (22 | 28.2%), Educational Services (15 | 19.2%), and Retail Trade (11 | 14.1%).
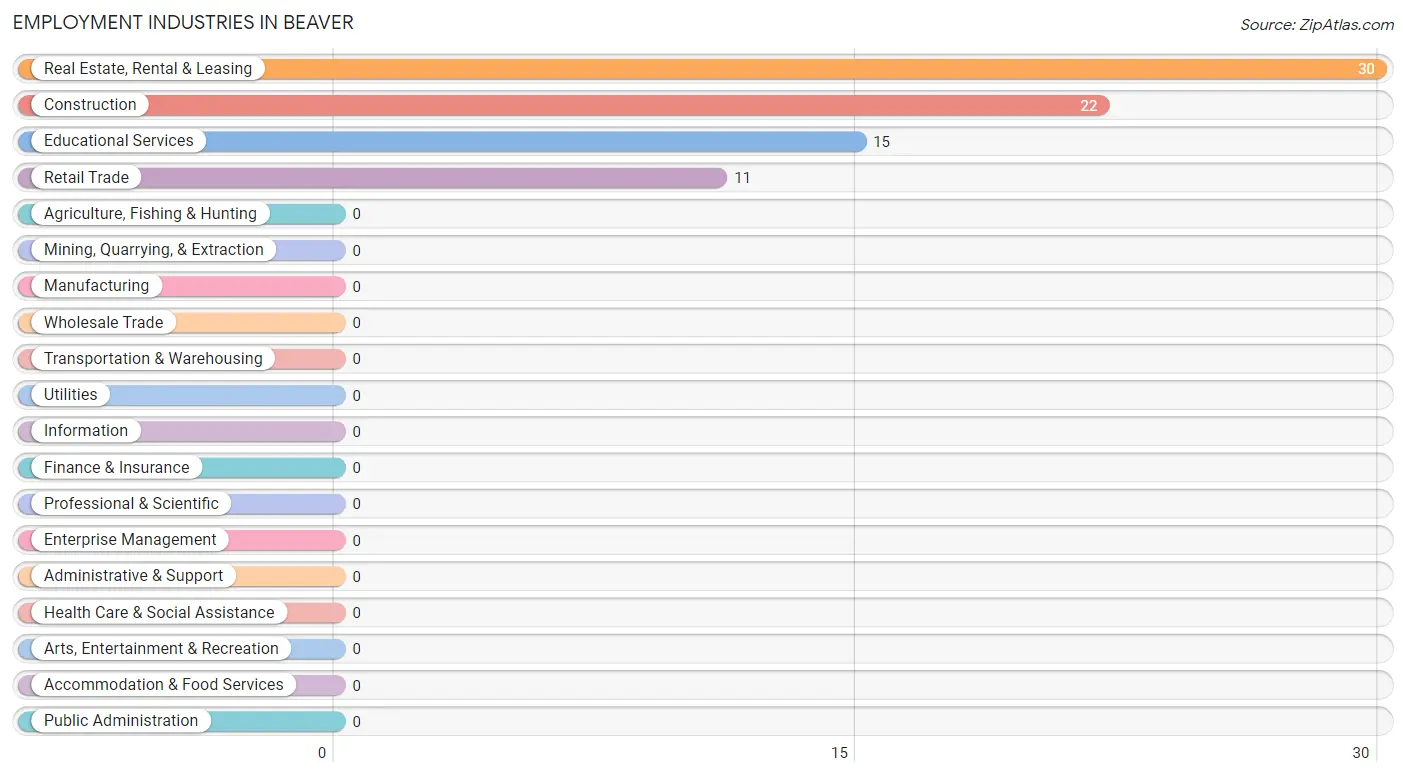
Employment Industries by Sex in Beaver
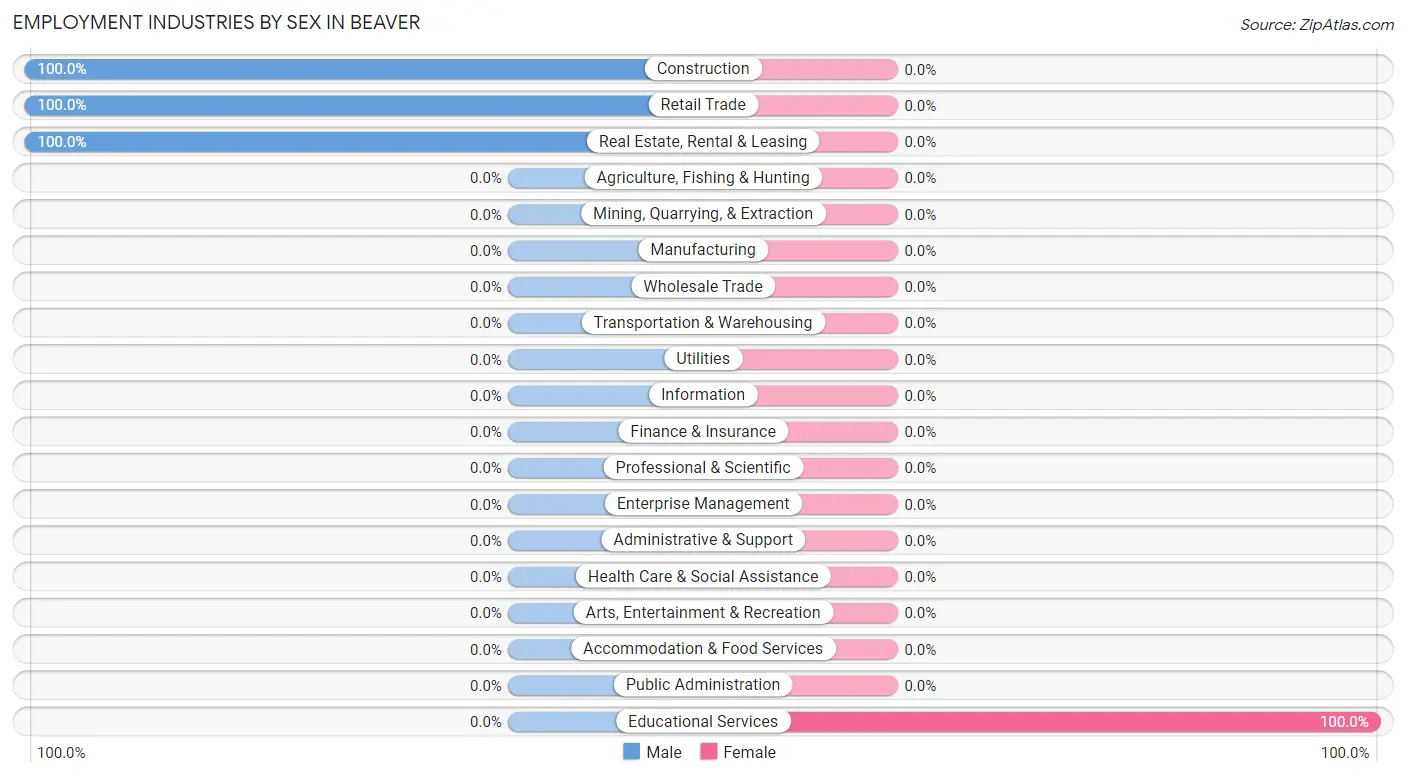
| Industry | Male | Female |
| Agriculture, Fishing & Hunting | 0 (0.0%) | 0 (0.0%) |
| Mining, Quarrying, & Extraction | 0 (0.0%) | 0 (0.0%) |
| Construction | 22 (100.0%) | 0 (0.0%) |
| Manufacturing | 0 (0.0%) | 0 (0.0%) |
| Wholesale Trade | 0 (0.0%) | 0 (0.0%) |
| Retail Trade | 11 (100.0%) | 0 (0.0%) |
| Transportation & Warehousing | 0 (0.0%) | 0 (0.0%) |
| Utilities | 0 (0.0%) | 0 (0.0%) |
| Information | 0 (0.0%) | 0 (0.0%) |
| Finance & Insurance | 0 (0.0%) | 0 (0.0%) |
| Real Estate, Rental & Leasing | 30 (100.0%) | 0 (0.0%) |
| Professional & Scientific | 0 (0.0%) | 0 (0.0%) |
| Enterprise Management | 0 (0.0%) | 0 (0.0%) |
| Administrative & Support | 0 (0.0%) | 0 (0.0%) |
| Educational Services | 0 (0.0%) | 15 (100.0%) |
| Health Care & Social Assistance | 0 (0.0%) | 0 (0.0%) |
| Arts, Entertainment & Recreation | 0 (0.0%) | 0 (0.0%) |
| Accommodation & Food Services | 0 (0.0%) | 0 (0.0%) |
| Public Administration | 0 (0.0%) | 0 (0.0%) |
| Total | 63 (80.8%) | 15 (19.2%) |
Education in Beaver
School Enrollment in Beaver
The most common levels of schooling among the 26 students in Beaver are college / undergraduate (15 | 57.7%), and high school (11 | 42.3%).
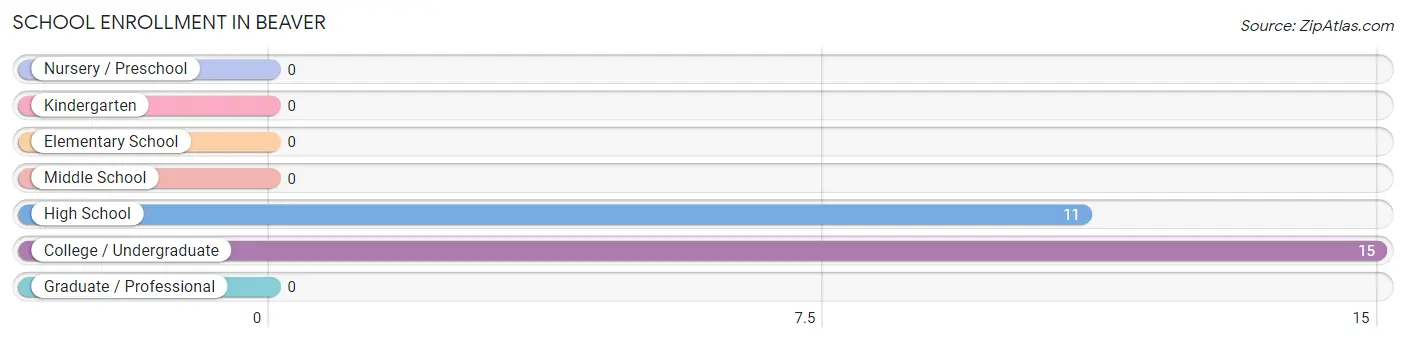
| School Level | # Students | % Students |
| Nursery / Preschool | 0 | 0.0% |
| Kindergarten | 0 | 0.0% |
| Elementary School | 0 | 0.0% |
| Middle School | 0 | 0.0% |
| High School | 11 | 42.3% |
| College / Undergraduate | 15 | 57.7% |
| Graduate / Professional | 0 | 0.0% |
| Total | 26 | 100.0% |
School Enrollment by Age by Funding Source in Beaver
Out of a total of 26 students who are enrolled in schools in Beaver, 11 (42.3%) attend a private institution, while the remaining 15 (57.7%) are enrolled in public schools. The age group of 15 to 17 year olds has the highest likelihood of being enrolled in private schools, with 11 (100.0% in the age bracket) enrolled. Conversely, the age group of 35 years and over has the lowest likelihood of being enrolled in a private school, with 15 (100.0% in the age bracket) attending a public institution.
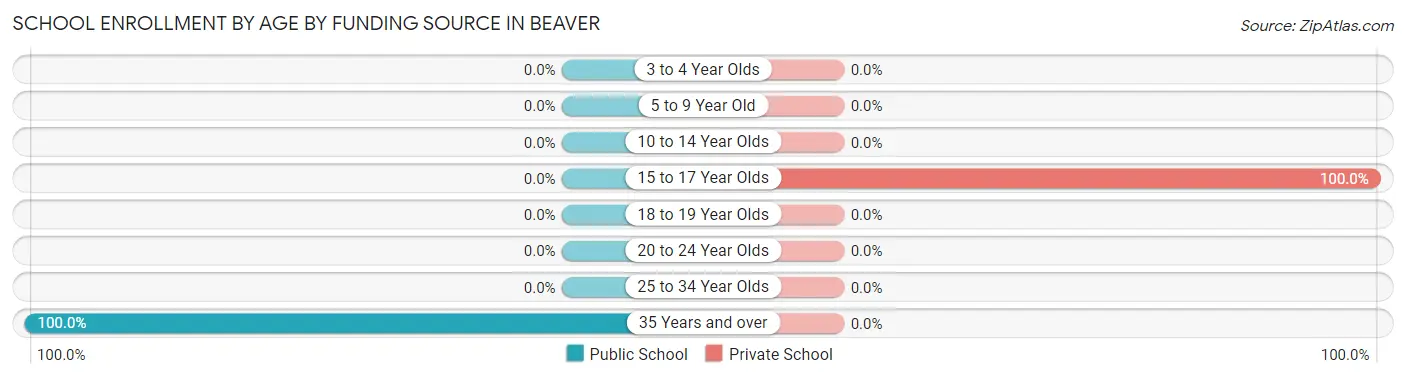
| Age Bracket | Public School | Private School |
| 3 to 4 Year Olds | 0 (0.0%) | 0 (0.0%) |
| 5 to 9 Year Old | 0 (0.0%) | 0 (0.0%) |
| 10 to 14 Year Olds | 0 (0.0%) | 0 (0.0%) |
| 15 to 17 Year Olds | 0 (0.0%) | 11 (100.0%) |
| 18 to 19 Year Olds | 0 (0.0%) | 0 (0.0%) |
| 20 to 24 Year Olds | 0 (0.0%) | 0 (0.0%) |
| 25 to 34 Year Olds | 0 (0.0%) | 0 (0.0%) |
| 35 Years and over | 15 (100.0%) | 0 (0.0%) |
| Total | 15 (57.7%) | 11 (42.3%) |
Educational Attainment by Field of Study in Beaver
Liberal arts & history (14 | 42.4%), bio, nature & agricultural (10 | 30.3%), and engineering (9 | 27.3%) are the most common fields of study among 33 individuals in Beaver who have obtained a bachelor's degree or higher.
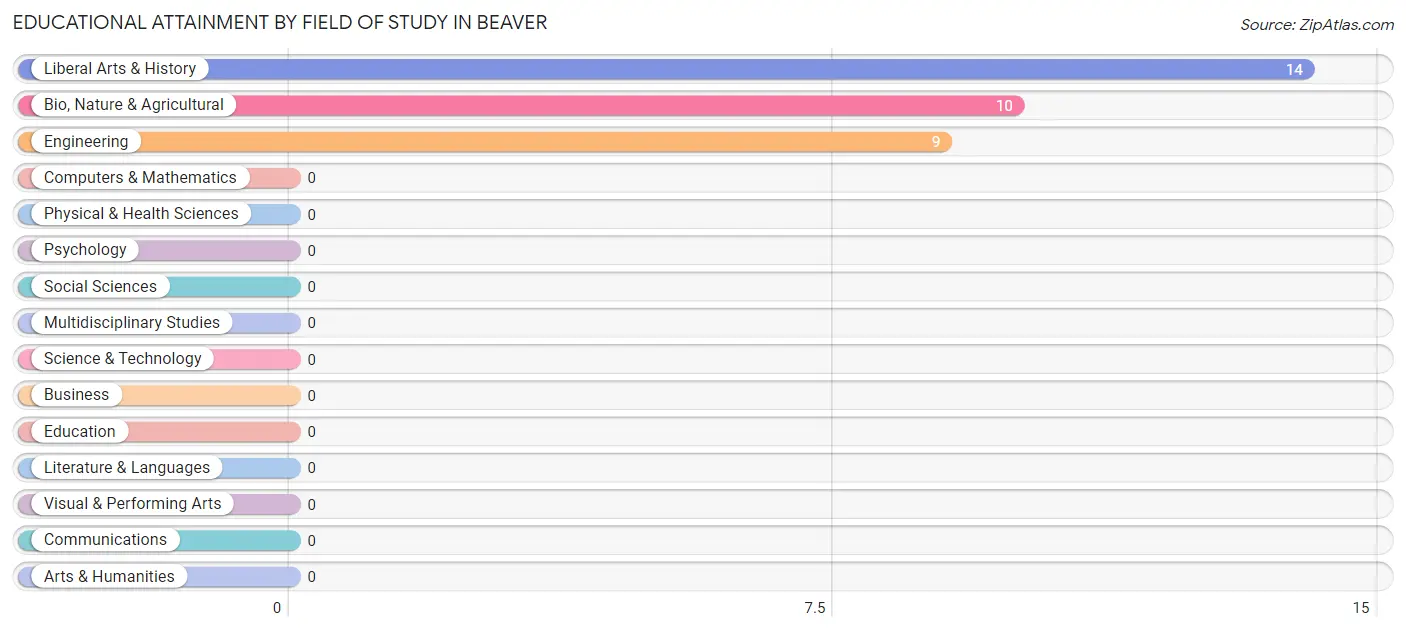
| Field of Study | # Graduates | % Graduates |
| Computers & Mathematics | 0 | 0.0% |
| Bio, Nature & Agricultural | 10 | 30.3% |
| Physical & Health Sciences | 0 | 0.0% |
| Psychology | 0 | 0.0% |
| Social Sciences | 0 | 0.0% |
| Engineering | 9 | 27.3% |
| Multidisciplinary Studies | 0 | 0.0% |
| Science & Technology | 0 | 0.0% |
| Business | 0 | 0.0% |
| Education | 0 | 0.0% |
| Literature & Languages | 0 | 0.0% |
| Liberal Arts & History | 14 | 42.4% |
| Visual & Performing Arts | 0 | 0.0% |
| Communications | 0 | 0.0% |
| Arts & Humanities | 0 | 0.0% |
| Total | 33 | 100.0% |
Transportation & Commute in Beaver
Vehicle Availability by Sex in Beaver
The most prevalent vehicle ownership categories in Beaver are males with 2 vehicles (41, accounting for 65.1%) and females with 2 vehicles (0, making up 273.3%).
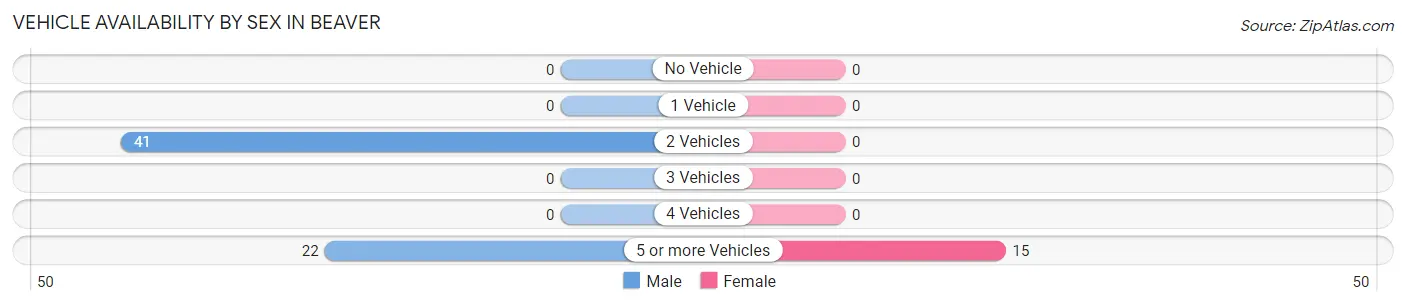
| Vehicles Available | Male | Female |
| No Vehicle | 0 (0.0%) | 0 (0.0%) |
| 1 Vehicle | 0 (0.0%) | 0 (0.0%) |
| 2 Vehicles | 41 (65.1%) | 0 (0.0%) |
| 3 Vehicles | 0 (0.0%) | 0 (0.0%) |
| 4 Vehicles | 0 (0.0%) | 0 (0.0%) |
| 5 or more Vehicles | 22 (34.9%) | 15 (100.0%) |
| Total | 63 (100.0%) | 15 (100.0%) |
Commute Time in Beaver
The most frequently occuring commute durations in Beaver are 20 to 24 minutes (30 commuters, 38.5%), 15 to 19 minutes (22 commuters, 28.2%), and 5 to 9 minutes (15 commuters, 19.2%).
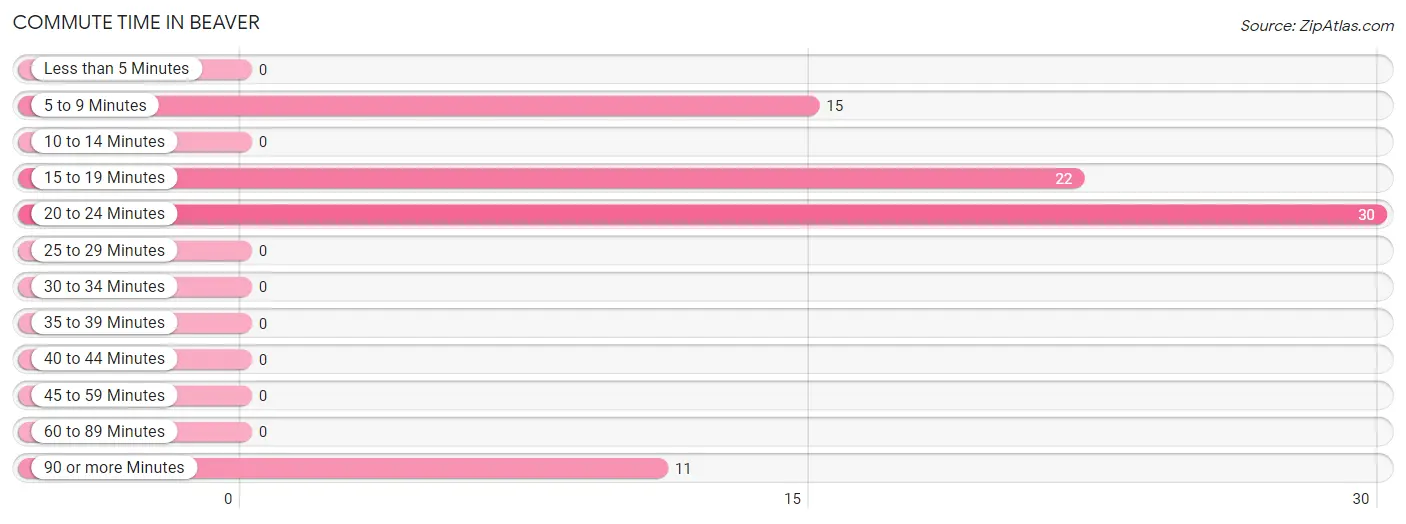
| Commute Time | # Commuters | % Commuters |
| Less than 5 Minutes | 0 | 0.0% |
| 5 to 9 Minutes | 15 | 19.2% |
| 10 to 14 Minutes | 0 | 0.0% |
| 15 to 19 Minutes | 22 | 28.2% |
| 20 to 24 Minutes | 30 | 38.5% |
| 25 to 29 Minutes | 0 | 0.0% |
| 30 to 34 Minutes | 0 | 0.0% |
| 35 to 39 Minutes | 0 | 0.0% |
| 40 to 44 Minutes | 0 | 0.0% |
| 45 to 59 Minutes | 0 | 0.0% |
| 60 to 89 Minutes | 0 | 0.0% |
| 90 or more Minutes | 11 | 14.1% |
Commute Time by Sex in Beaver
The most common commute times in Beaver are 20 to 24 minutes (30 commuters, 47.6%) for males and 5 to 9 minutes (15 commuters, 100.0%) for females.
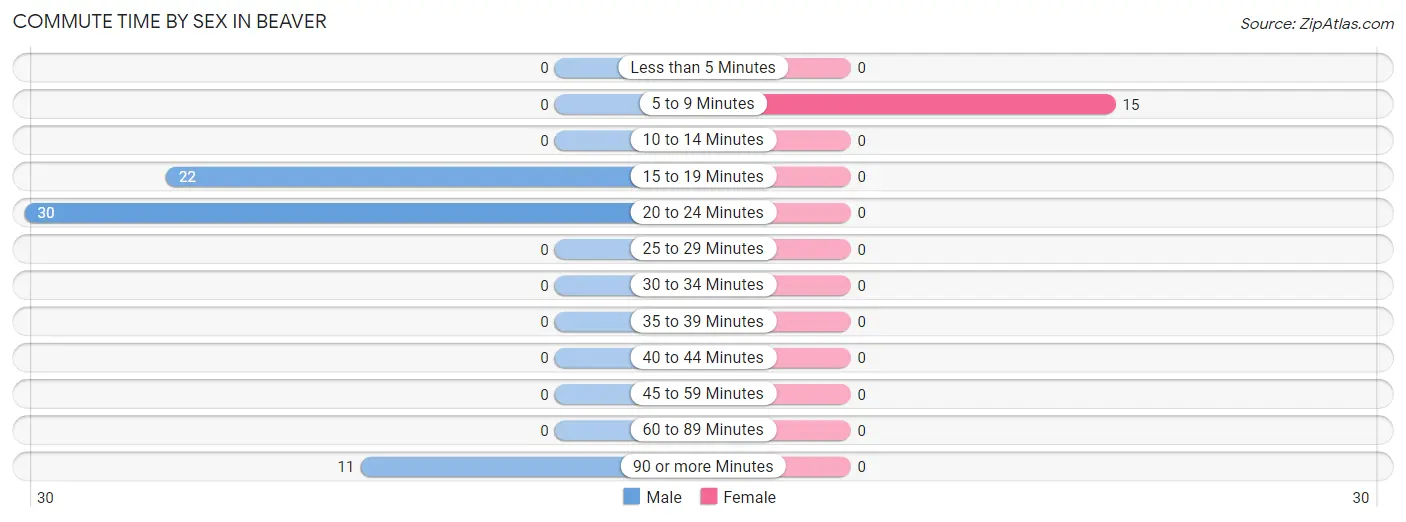
| Commute Time | Male | Female |
| Less than 5 Minutes | 0 (0.0%) | 0 (0.0%) |
| 5 to 9 Minutes | 0 (0.0%) | 15 (100.0%) |
| 10 to 14 Minutes | 0 (0.0%) | 0 (0.0%) |
| 15 to 19 Minutes | 22 (34.9%) | 0 (0.0%) |
| 20 to 24 Minutes | 30 (47.6%) | 0 (0.0%) |
| 25 to 29 Minutes | 0 (0.0%) | 0 (0.0%) |
| 30 to 34 Minutes | 0 (0.0%) | 0 (0.0%) |
| 35 to 39 Minutes | 0 (0.0%) | 0 (0.0%) |
| 40 to 44 Minutes | 0 (0.0%) | 0 (0.0%) |
| 45 to 59 Minutes | 0 (0.0%) | 0 (0.0%) |
| 60 to 89 Minutes | 0 (0.0%) | 0 (0.0%) |
| 90 or more Minutes | 11 (17.5%) | 0 (0.0%) |
Time of Departure to Work by Sex in Beaver
The most frequent times of departure to work in Beaver are 10:00 AM to 10:59 AM (30, 47.6%) for males and 7:00 AM to 7:29 AM (15, 100.0%) for females.
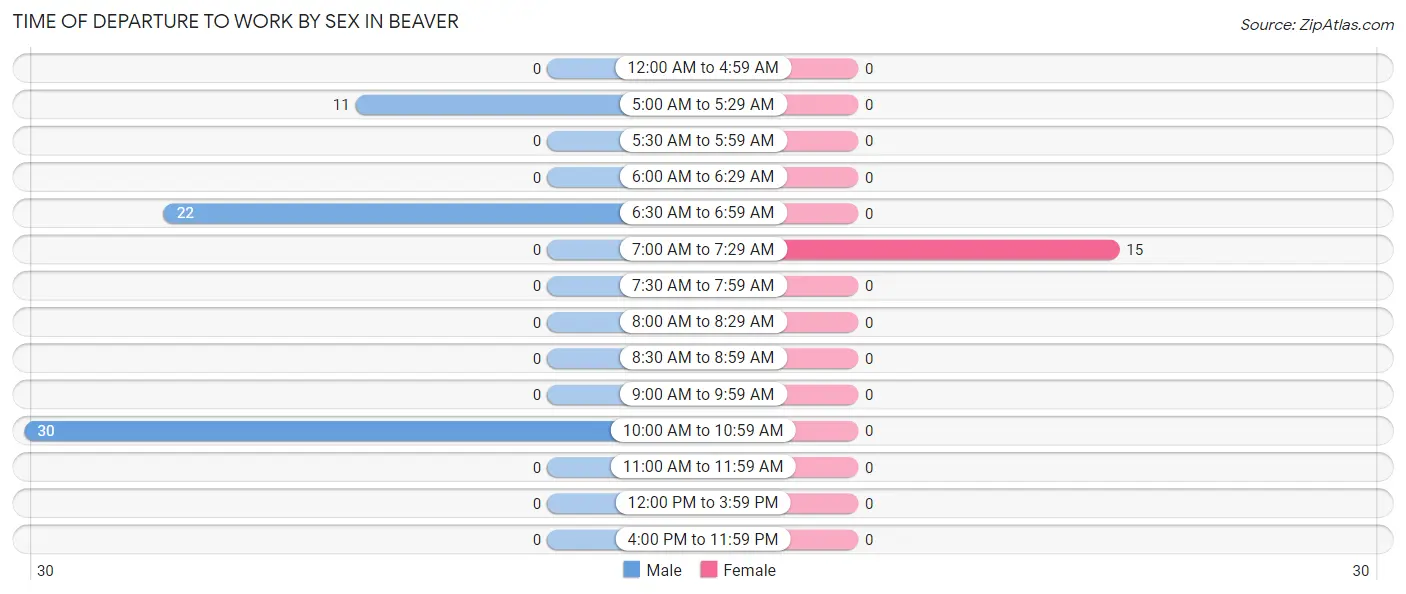
| Time of Departure | Male | Female |
| 12:00 AM to 4:59 AM | 0 (0.0%) | 0 (0.0%) |
| 5:00 AM to 5:29 AM | 11 (17.5%) | 0 (0.0%) |
| 5:30 AM to 5:59 AM | 0 (0.0%) | 0 (0.0%) |
| 6:00 AM to 6:29 AM | 0 (0.0%) | 0 (0.0%) |
| 6:30 AM to 6:59 AM | 22 (34.9%) | 0 (0.0%) |
| 7:00 AM to 7:29 AM | 0 (0.0%) | 15 (100.0%) |
| 7:30 AM to 7:59 AM | 0 (0.0%) | 0 (0.0%) |
| 8:00 AM to 8:29 AM | 0 (0.0%) | 0 (0.0%) |
| 8:30 AM to 8:59 AM | 0 (0.0%) | 0 (0.0%) |
| 9:00 AM to 9:59 AM | 0 (0.0%) | 0 (0.0%) |
| 10:00 AM to 10:59 AM | 30 (47.6%) | 0 (0.0%) |
| 11:00 AM to 11:59 AM | 0 (0.0%) | 0 (0.0%) |
| 12:00 PM to 3:59 PM | 0 (0.0%) | 0 (0.0%) |
| 4:00 PM to 11:59 PM | 0 (0.0%) | 0 (0.0%) |
| Total | 63 (100.0%) | 15 (100.0%) |
Housing Occupancy in Beaver
Occupancy by Ownership in Beaver
Of the total 95 dwellings in Beaver, owner-occupied units account for 73 (76.8%), while renter-occupied units make up 22 (23.2%).
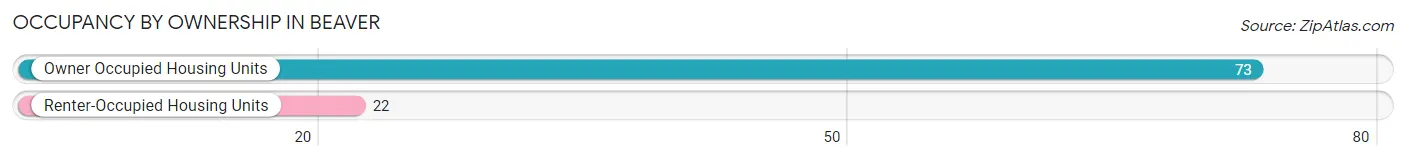
| Occupancy | # Housing Units | % Housing Units |
| Owner Occupied Housing Units | 73 | 76.8% |
| Renter-Occupied Housing Units | 22 | 23.2% |
| Total Occupied Housing Units | 95 | 100.0% |
Occupancy by Household Size in Beaver
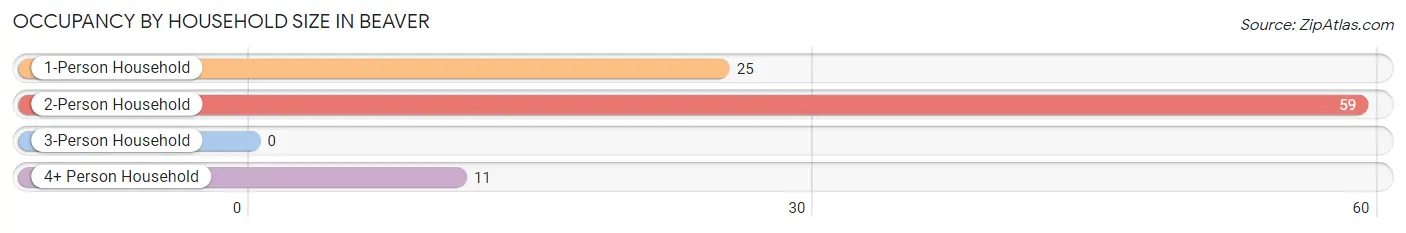
| Household Size | # Housing Units | % Housing Units |
| 1-Person Household | 25 | 26.3% |
| 2-Person Household | 59 | 62.1% |
| 3-Person Household | 0 | 0.0% |
| 4+ Person Household | 11 | 11.6% |
| Total Housing Units | 95 | 100.0% |
Occupancy by Ownership by Household Size in Beaver
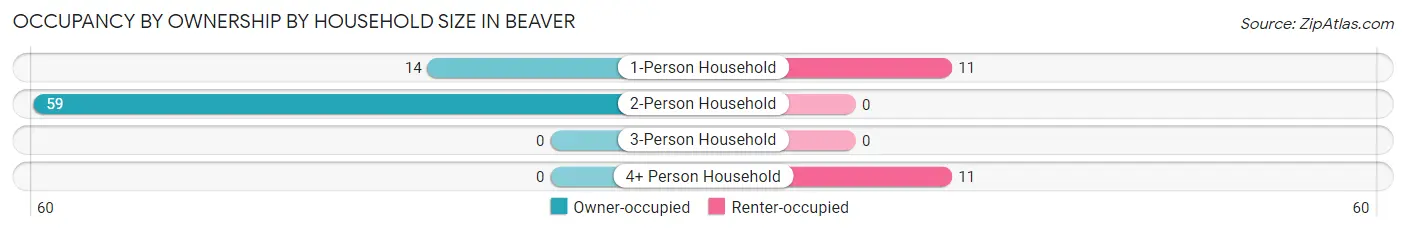
| Household Size | Owner-occupied | Renter-occupied |
| 1-Person Household | 14 (56.0%) | 11 (44.0%) |
| 2-Person Household | 59 (100.0%) | 0 (0.0%) |
| 3-Person Household | 0 (0.0%) | 0 (0.0%) |
| 4+ Person Household | 0 (0.0%) | 11 (100.0%) |
| Total Housing Units | 73 (76.8%) | 22 (23.2%) |
Occupancy by Educational Attainment in Beaver
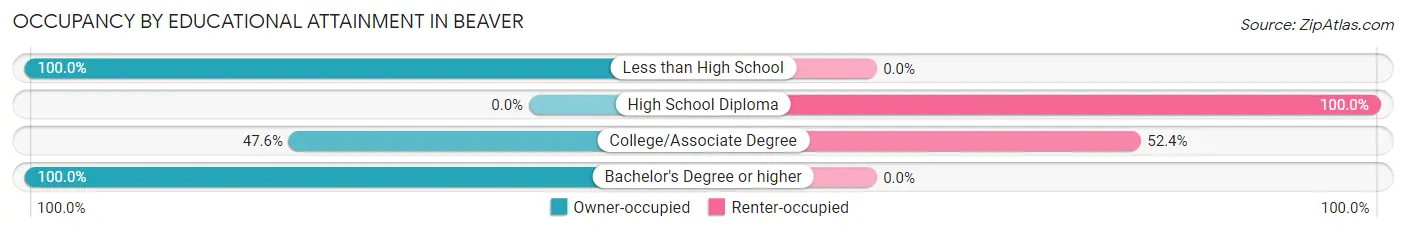
| Household Size | Owner-occupied | Renter-occupied |
| Less than High School | 30 (100.0%) | 0 (0.0%) |
| High School Diploma | 0 (0.0%) | 11 (100.0%) |
| College/Associate Degree | 10 (47.6%) | 11 (52.4%) |
| Bachelor's Degree or higher | 33 (100.0%) | 0 (0.0%) |
Occupancy by Age of Householder in Beaver
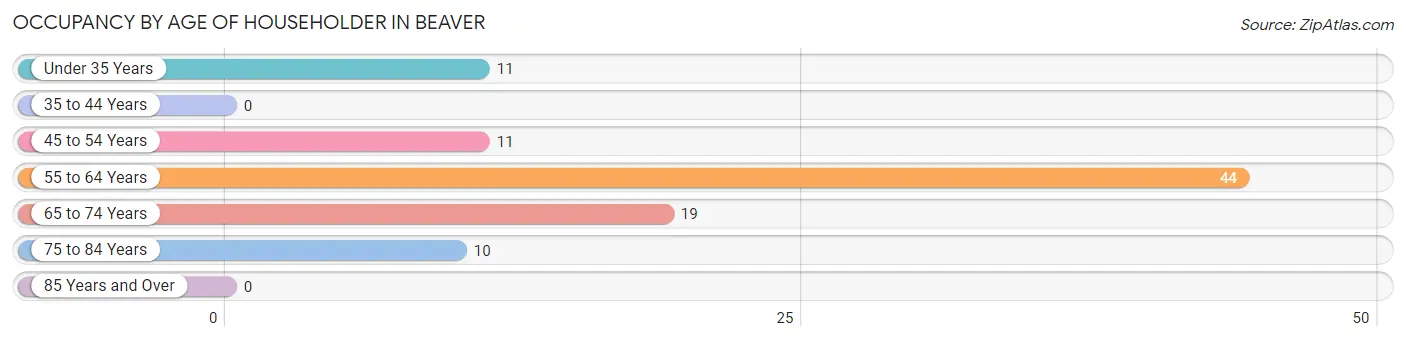
| Age Bracket | # Households | % Households |
| Under 35 Years | 11 | 11.6% |
| 35 to 44 Years | 0 | 0.0% |
| 45 to 54 Years | 11 | 11.6% |
| 55 to 64 Years | 44 | 46.3% |
| 65 to 74 Years | 19 | 20.0% |
| 75 to 84 Years | 10 | 10.5% |
| 85 Years and Over | 0 | 0.0% |
| Total | 95 | 100.0% |
Housing Finances in Beaver
Median Income by Occupancy in Beaver
| Occupancy Type | # Households | Median Income |
| Owner-Occupied | 73 (76.8%) | $0 |
| Renter-Occupied | 22 (23.2%) | $0 |
| Average | 95 (100.0%) | $0 |
Occupancy by Householder Income Bracket in Beaver
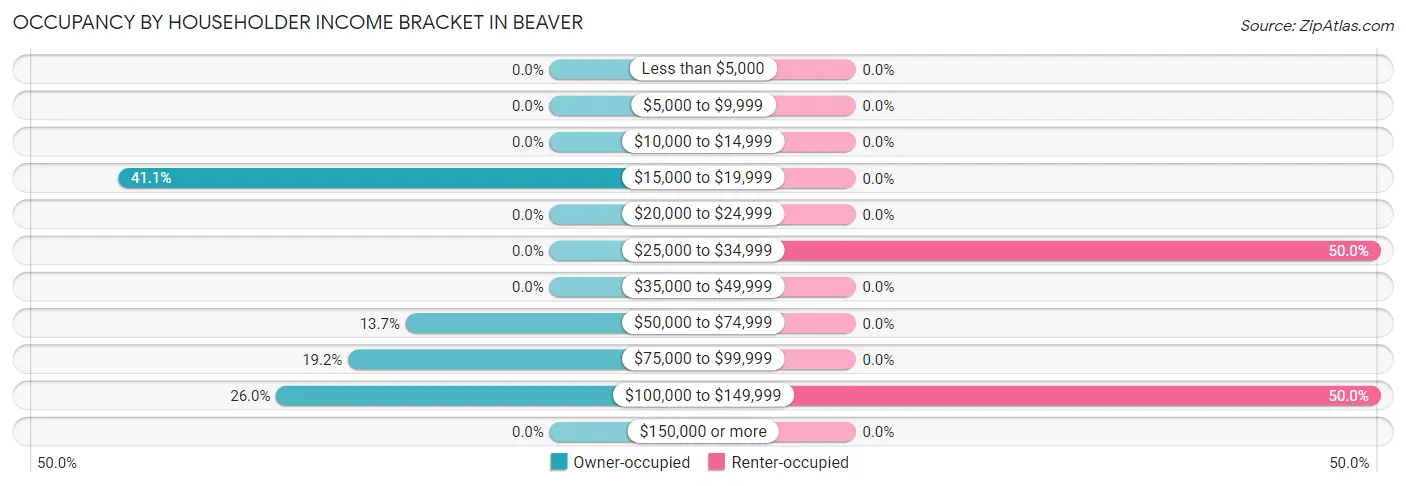
| Income Bracket | Owner-occupied | Renter-occupied |
| Less than $5,000 | 0 (0.0%) | 0 (0.0%) |
| $5,000 to $9,999 | 0 (0.0%) | 0 (0.0%) |
| $10,000 to $14,999 | 0 (0.0%) | 0 (0.0%) |
| $15,000 to $19,999 | 30 (41.1%) | 0 (0.0%) |
| $20,000 to $24,999 | 0 (0.0%) | 0 (0.0%) |
| $25,000 to $34,999 | 0 (0.0%) | 11 (50.0%) |
| $35,000 to $49,999 | 0 (0.0%) | 0 (0.0%) |
| $50,000 to $74,999 | 10 (13.7%) | 0 (0.0%) |
| $75,000 to $99,999 | 14 (19.2%) | 0 (0.0%) |
| $100,000 to $149,999 | 19 (26.0%) | 11 (50.0%) |
| $150,000 or more | 0 (0.0%) | 0 (0.0%) |
| Total | 73 (100.0%) | 22 (100.0%) |
Monthly Housing Cost Tiers in Beaver
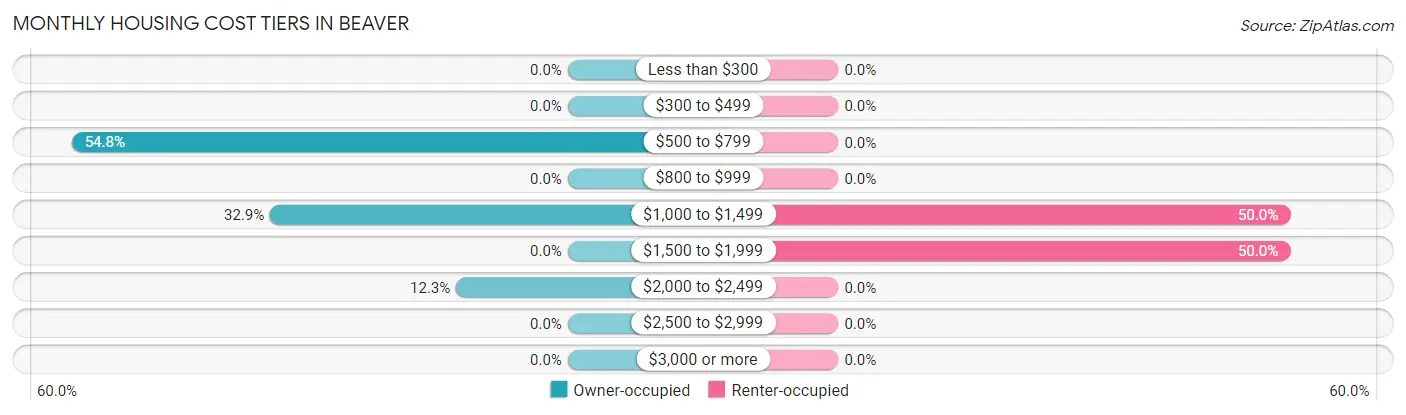
| Monthly Cost | Owner-occupied | Renter-occupied |
| Less than $300 | 0 (0.0%) | 0 (0.0%) |
| $300 to $499 | 0 (0.0%) | 0 (0.0%) |
| $500 to $799 | 40 (54.8%) | 0 (0.0%) |
| $800 to $999 | 0 (0.0%) | 0 (0.0%) |
| $1,000 to $1,499 | 24 (32.9%) | 11 (50.0%) |
| $1,500 to $1,999 | 0 (0.0%) | 11 (50.0%) |
| $2,000 to $2,499 | 9 (12.3%) | 0 (0.0%) |
| $2,500 to $2,999 | 0 (0.0%) | 0 (0.0%) |
| $3,000 or more | 0 (0.0%) | 0 (0.0%) |
| Total | 73 (100.0%) | 22 (100.0%) |
Physical Housing Characteristics in Beaver
Housing Structures in Beaver
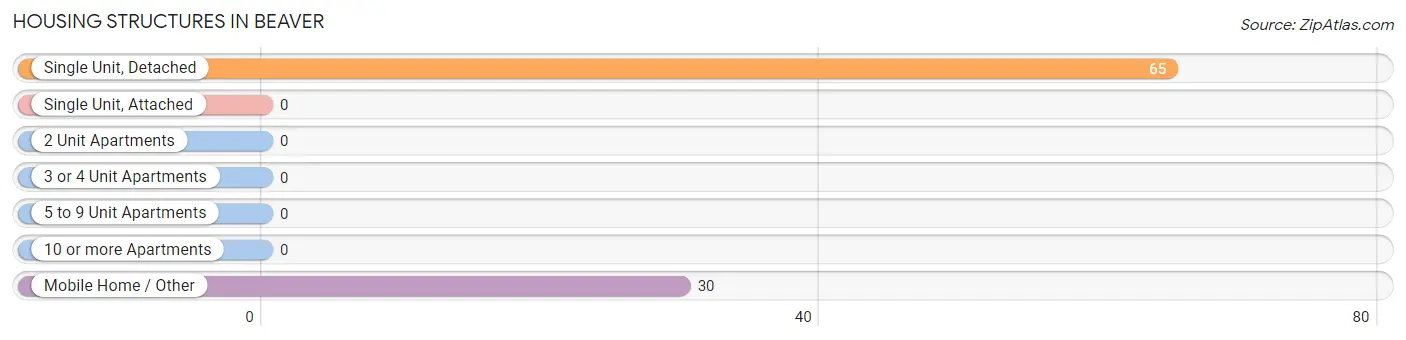
| Structure Type | # Housing Units | % Housing Units |
| Single Unit, Detached | 65 | 68.4% |
| Single Unit, Attached | 0 | 0.0% |
| 2 Unit Apartments | 0 | 0.0% |
| 3 or 4 Unit Apartments | 0 | 0.0% |
| 5 to 9 Unit Apartments | 0 | 0.0% |
| 10 or more Apartments | 0 | 0.0% |
| Mobile Home / Other | 30 | 31.6% |
| Total | 95 | 100.0% |
Housing Structures by Occupancy in Beaver
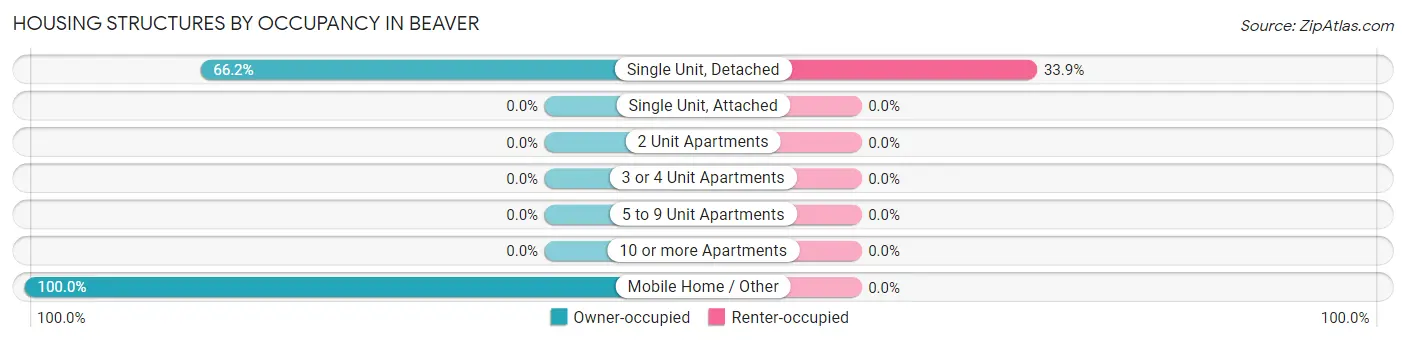
| Structure Type | Owner-occupied | Renter-occupied |
| Single Unit, Detached | 43 (66.1%) | 22 (33.9%) |
| Single Unit, Attached | 0 (0.0%) | 0 (0.0%) |
| 2 Unit Apartments | 0 (0.0%) | 0 (0.0%) |
| 3 or 4 Unit Apartments | 0 (0.0%) | 0 (0.0%) |
| 5 to 9 Unit Apartments | 0 (0.0%) | 0 (0.0%) |
| 10 or more Apartments | 0 (0.0%) | 0 (0.0%) |
| Mobile Home / Other | 30 (100.0%) | 0 (0.0%) |
| Total | 73 (76.8%) | 22 (23.2%) |
Housing Structures by Number of Rooms in Beaver
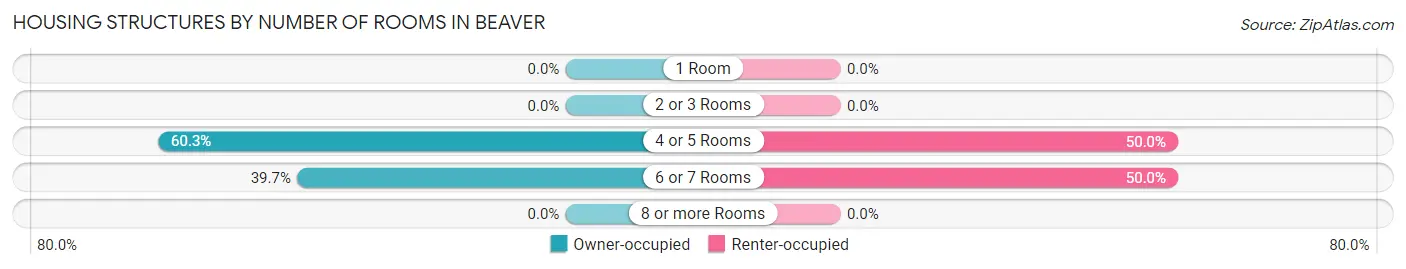
| Number of Rooms | Owner-occupied | Renter-occupied |
| 1 Room | 0 (0.0%) | 0 (0.0%) |
| 2 or 3 Rooms | 0 (0.0%) | 0 (0.0%) |
| 4 or 5 Rooms | 44 (60.3%) | 11 (50.0%) |
| 6 or 7 Rooms | 29 (39.7%) | 11 (50.0%) |
| 8 or more Rooms | 0 (0.0%) | 0 (0.0%) |
| Total | 73 (100.0%) | 22 (100.0%) |
Housing Structure by Heating Type in Beaver
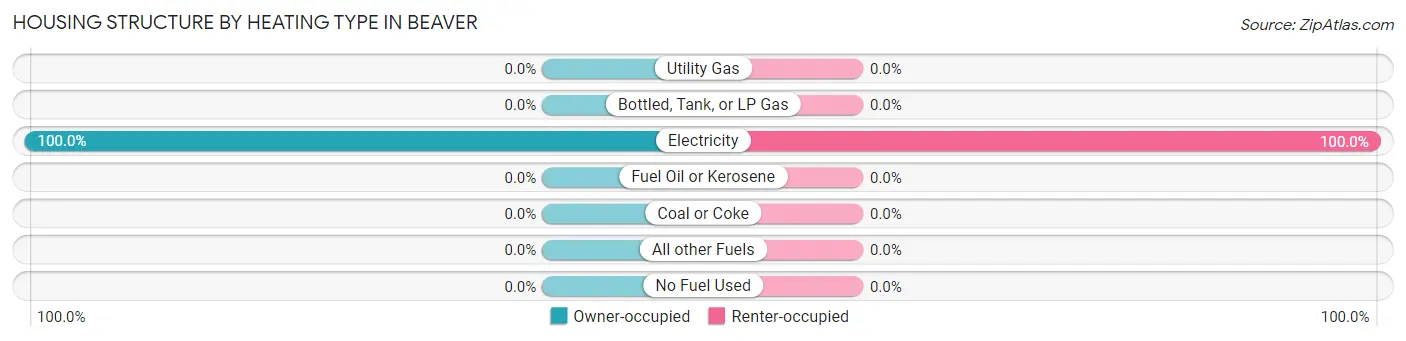
| Heating Type | Owner-occupied | Renter-occupied |
| Utility Gas | 0 (0.0%) | 0 (0.0%) |
| Bottled, Tank, or LP Gas | 0 (0.0%) | 0 (0.0%) |
| Electricity | 73 (100.0%) | 22 (100.0%) |
| Fuel Oil or Kerosene | 0 (0.0%) | 0 (0.0%) |
| Coal or Coke | 0 (0.0%) | 0 (0.0%) |
| All other Fuels | 0 (0.0%) | 0 (0.0%) |
| No Fuel Used | 0 (0.0%) | 0 (0.0%) |
| Total | 73 (100.0%) | 22 (100.0%) |
Household Vehicle Usage in Beaver
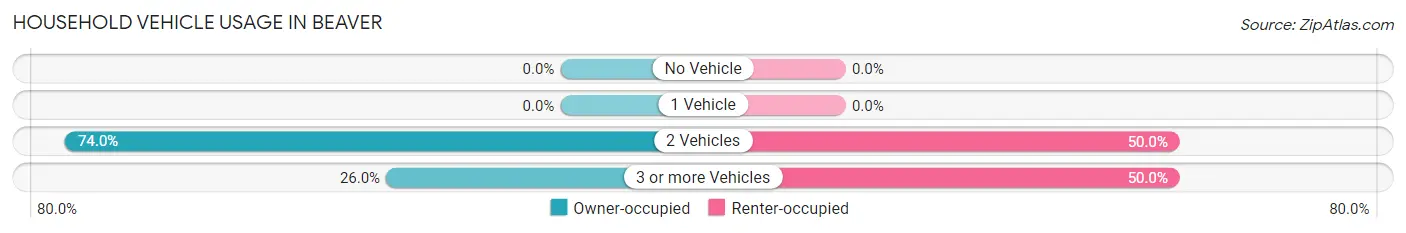
| Vehicles per Household | Owner-occupied | Renter-occupied |
| No Vehicle | 0 (0.0%) | 0 (0.0%) |
| 1 Vehicle | 0 (0.0%) | 0 (0.0%) |
| 2 Vehicles | 54 (74.0%) | 11 (50.0%) |
| 3 or more Vehicles | 19 (26.0%) | 11 (50.0%) |
| Total | 73 (100.0%) | 22 (100.0%) |
Real Estate & Mortgages in Beaver
Real Estate and Mortgage Overview in Beaver
| Characteristic | Without Mortgage | With Mortgage |
| Housing Units | 40 | 33 |
| Median Property Value | - | - |
| Median Household Income | - | - |
| Monthly Housing Costs | - | - |
| Real Estate Taxes | - | - |
Property Value by Mortgage Status in Beaver
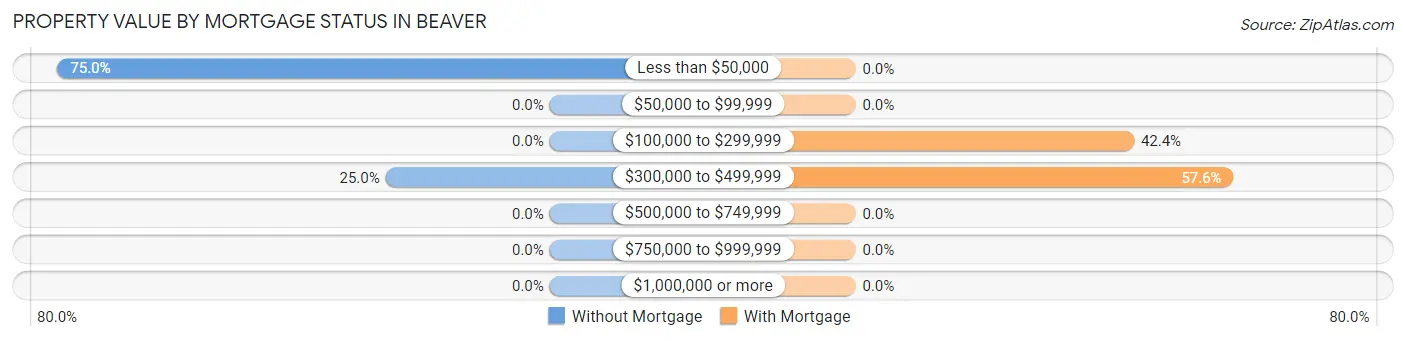
| Property Value | Without Mortgage | With Mortgage |
| Less than $50,000 | 30 (75.0%) | 0 (0.0%) |
| $50,000 to $99,999 | 0 (0.0%) | 0 (0.0%) |
| $100,000 to $299,999 | 0 (0.0%) | 14 (42.4%) |
| $300,000 to $499,999 | 10 (25.0%) | 19 (57.6%) |
| $500,000 to $749,999 | 0 (0.0%) | 0 (0.0%) |
| $750,000 to $999,999 | 0 (0.0%) | 0 (0.0%) |
| $1,000,000 or more | 0 (0.0%) | 0 (0.0%) |
| Total | 40 (100.0%) | 33 (100.0%) |
Household Income by Mortgage Status in Beaver
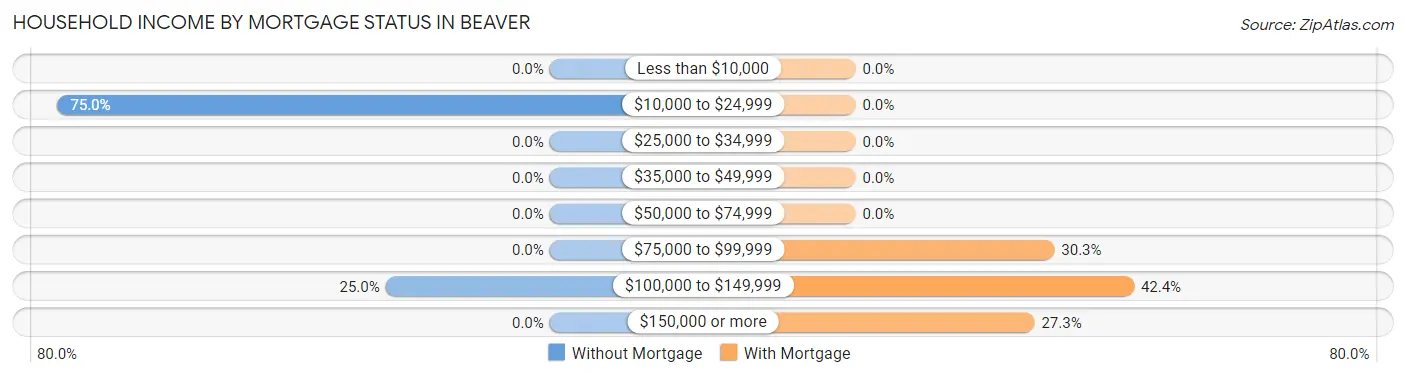
| Household Income | Without Mortgage | With Mortgage |
| Less than $10,000 | 0 (0.0%) | 0 (0.0%) |
| $10,000 to $24,999 | 30 (75.0%) | 0 (0.0%) |
| $25,000 to $34,999 | 0 (0.0%) | 0 (0.0%) |
| $35,000 to $49,999 | 0 (0.0%) | 0 (0.0%) |
| $50,000 to $74,999 | 0 (0.0%) | 0 (0.0%) |
| $75,000 to $99,999 | 0 (0.0%) | 10 (30.3%) |
| $100,000 to $149,999 | 10 (25.0%) | 14 (42.4%) |
| $150,000 or more | 0 (0.0%) | 9 (27.3%) |
| Total | 40 (100.0%) | 33 (100.0%) |
Property Value to Household Income Ratio in Beaver
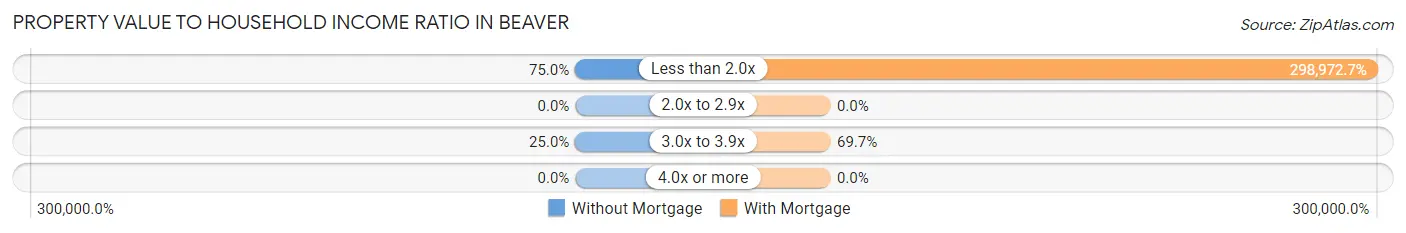
| Value-to-Income Ratio | Without Mortgage | With Mortgage |
| Less than 2.0x | 30 (75.0%) | 98,661 (298,972.7%) |
| 2.0x to 2.9x | 0 (0.0%) | 0 (0.0%) |
| 3.0x to 3.9x | 10 (25.0%) | 23 (69.7%) |
| 4.0x or more | 0 (0.0%) | 0 (0.0%) |
| Total | 40 (100.0%) | 33 (100.0%) |
Real Estate Taxes by Mortgage Status in Beaver
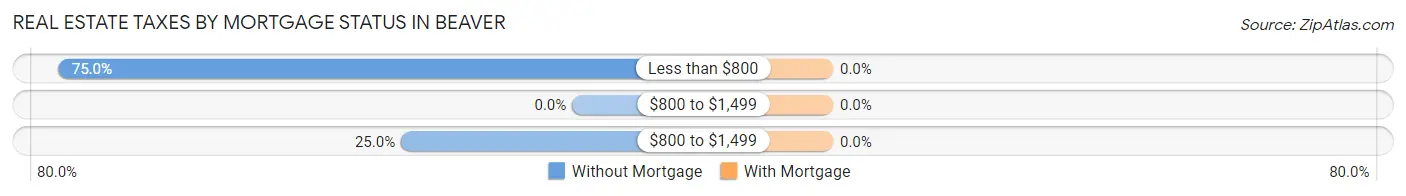
| Property Taxes | Without Mortgage | With Mortgage |
| Less than $800 | 30 (75.0%) | 0 (0.0%) |
| $800 to $1,499 | 0 (0.0%) | 0 (0.0%) |
| $800 to $1,499 | 10 (25.0%) | 0 (0.0%) |
| Total | 40 (100.0%) | 33 (100.0%) |
Health & Disability in Beaver
Health Insurance Coverage by Age in Beaver
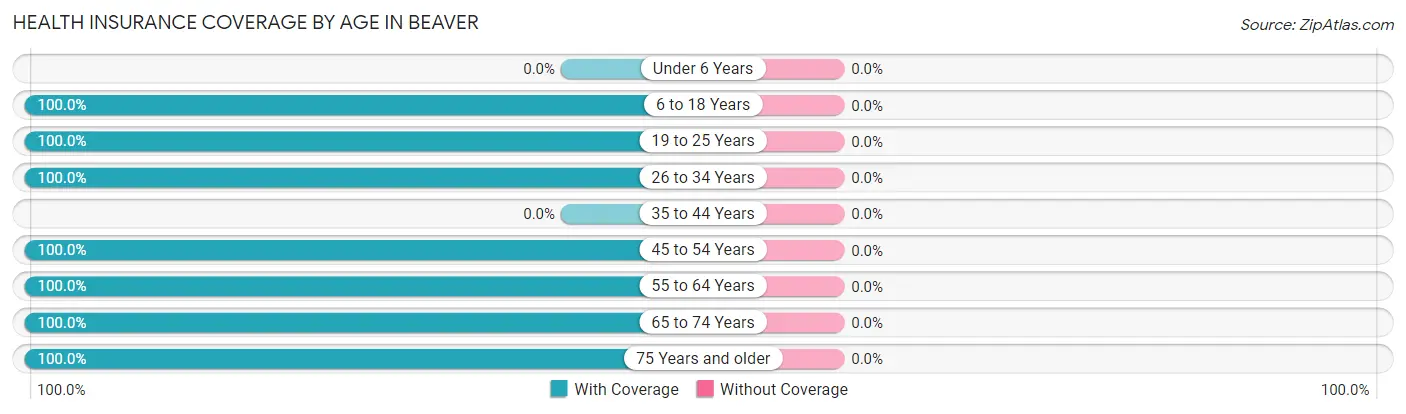
| Age Bracket | With Coverage | Without Coverage |
| Under 6 Years | 0 (0.0%) | 0 (0.0%) |
| 6 to 18 Years | 27 (100.0%) | 0 (0.0%) |
| 19 to 25 Years | 25 (100.0%) | 0 (0.0%) |
| 26 to 34 Years | 11 (100.0%) | 0 (0.0%) |
| 35 to 44 Years | 0 (0.0%) | 0 (0.0%) |
| 45 to 54 Years | 26 (100.0%) | 0 (0.0%) |
| 55 to 64 Years | 44 (100.0%) | 0 (0.0%) |
| 65 to 74 Years | 38 (100.0%) | 0 (0.0%) |
| 75 Years and older | 35 (100.0%) | 0 (0.0%) |
| Total | 206 (100.0%) | 0 (0.0%) |
Health Insurance Coverage by Citizenship Status in Beaver
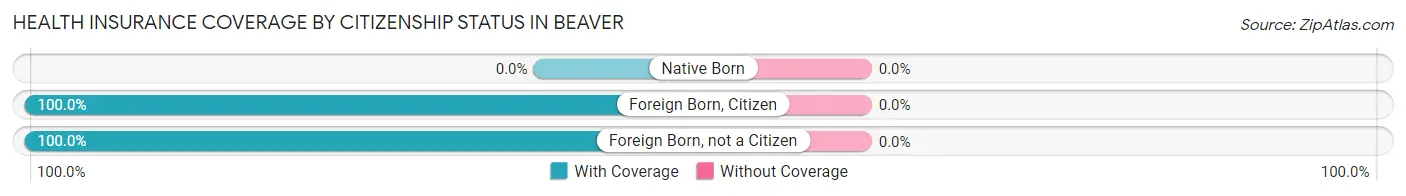
| Citizenship Status | With Coverage | Without Coverage |
| Native Born | 0 (0.0%) | 0 (0.0%) |
| Foreign Born, Citizen | 27 (100.0%) | 0 (0.0%) |
| Foreign Born, not a Citizen | 25 (100.0%) | 0 (0.0%) |
Health Insurance Coverage by Household Income in Beaver
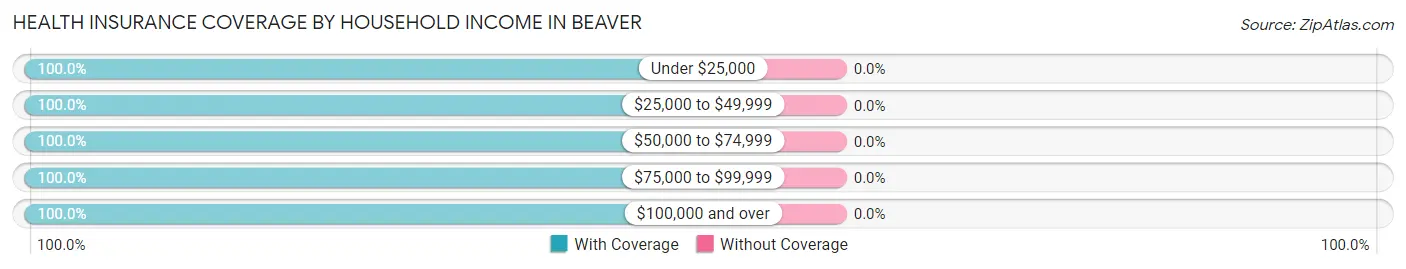
| Household Income | With Coverage | Without Coverage |
| Under $25,000 | 55 (100.0%) | 0 (0.0%) |
| $25,000 to $49,999 | 11 (100.0%) | 0 (0.0%) |
| $50,000 to $74,999 | 35 (100.0%) | 0 (0.0%) |
| $75,000 to $99,999 | 14 (100.0%) | 0 (0.0%) |
| $100,000 and over | 91 (100.0%) | 0 (0.0%) |
Public vs Private Health Insurance Coverage by Age in Beaver
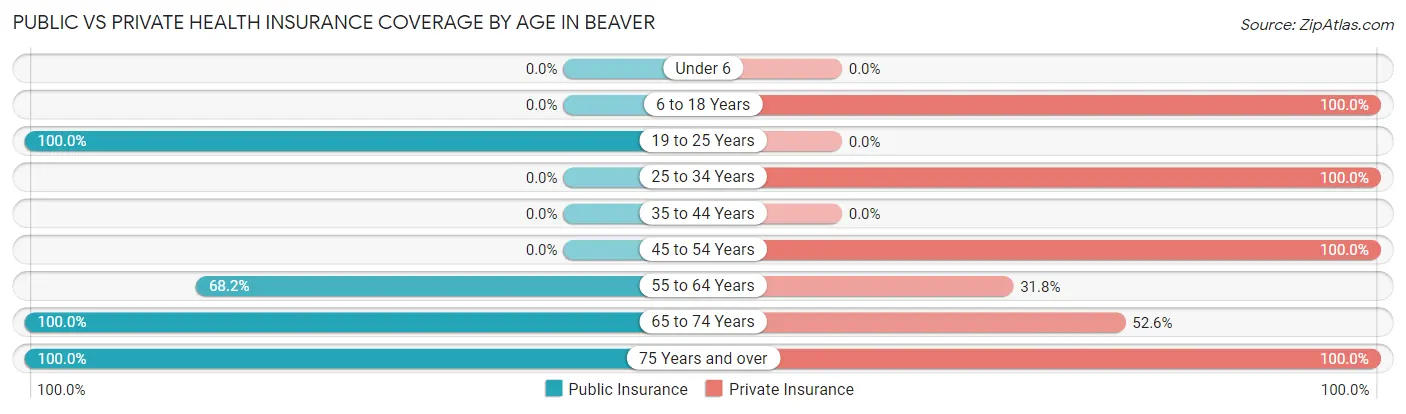
| Age Bracket | Public Insurance | Private Insurance |
| Under 6 | 0 (0.0%) | 0 (0.0%) |
| 6 to 18 Years | 0 (0.0%) | 27 (100.0%) |
| 19 to 25 Years | 25 (100.0%) | 0 (0.0%) |
| 25 to 34 Years | 0 (0.0%) | 11 (100.0%) |
| 35 to 44 Years | 0 (0.0%) | 0 (0.0%) |
| 45 to 54 Years | 0 (0.0%) | 26 (100.0%) |
| 55 to 64 Years | 30 (68.2%) | 14 (31.8%) |
| 65 to 74 Years | 38 (100.0%) | 20 (52.6%) |
| 75 Years and over | 35 (100.0%) | 35 (100.0%) |
| Total | 128 (62.1%) | 133 (64.6%) |
Disability Status by Sex by Age in Beaver
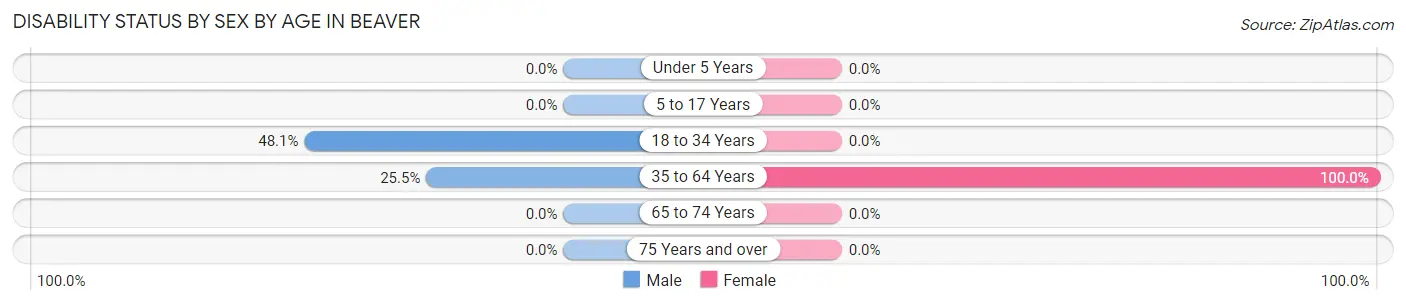
| Age Bracket | Male | Female |
| Under 5 Years | 0 (0.0%) | 0 (0.0%) |
| 5 to 17 Years | 0 (0.0%) | 0 (0.0%) |
| 18 to 34 Years | 25 (48.1%) | 0 (0.0%) |
| 35 to 64 Years | 14 (25.5%) | 15 (100.0%) |
| 65 to 74 Years | 0 (0.0%) | 0 (0.0%) |
| 75 Years and over | 0 (0.0%) | 0 (0.0%) |
Disability Class by Sex by Age in Beaver
Disability Class: Hearing Difficulty
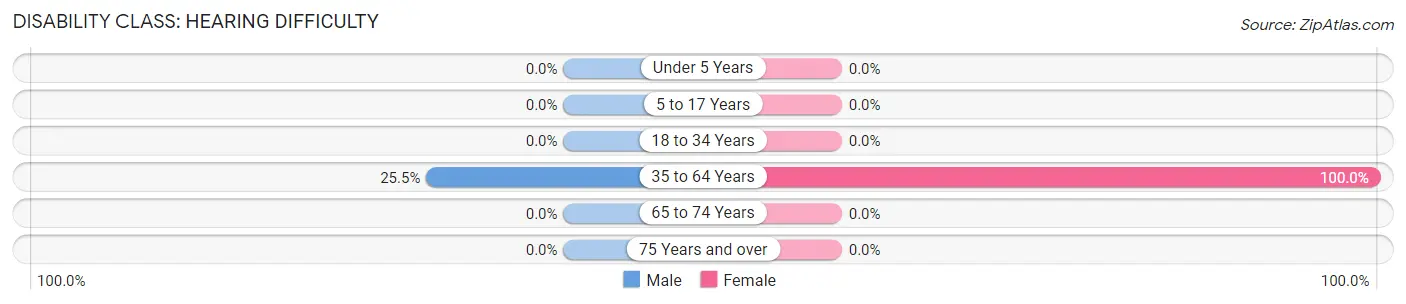
| Age Bracket | Male | Female |
| Under 5 Years | 0 (0.0%) | 0 (0.0%) |
| 5 to 17 Years | 0 (0.0%) | 0 (0.0%) |
| 18 to 34 Years | 0 (0.0%) | 0 (0.0%) |
| 35 to 64 Years | 14 (25.5%) | 15 (100.0%) |
| 65 to 74 Years | 0 (0.0%) | 0 (0.0%) |
| 75 Years and over | 0 (0.0%) | 0 (0.0%) |
Disability Class: Vision Difficulty
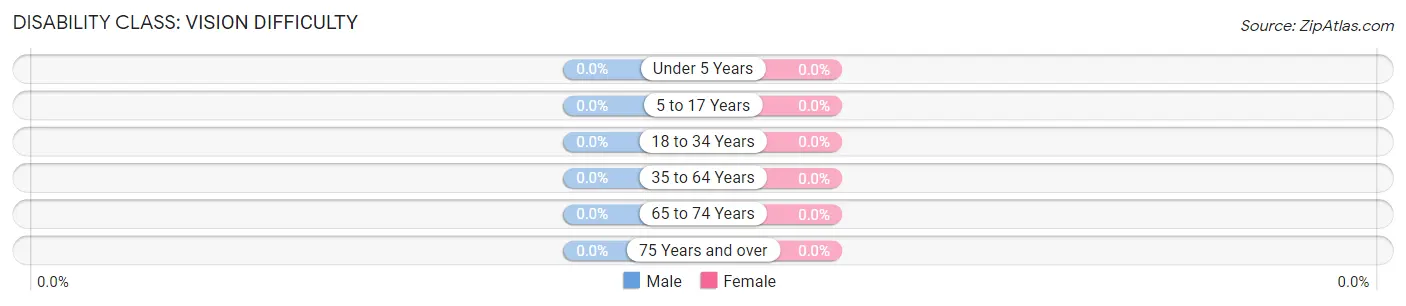
| Age Bracket | Male | Female |
| Under 5 Years | 0 (0.0%) | 0 (0.0%) |
| 5 to 17 Years | 0 (0.0%) | 0 (0.0%) |
| 18 to 34 Years | 0 (0.0%) | 0 (0.0%) |
| 35 to 64 Years | 0 (0.0%) | 0 (0.0%) |
| 65 to 74 Years | 0 (0.0%) | 0 (0.0%) |
| 75 Years and over | 0 (0.0%) | 0 (0.0%) |
Disability Class: Cognitive Difficulty
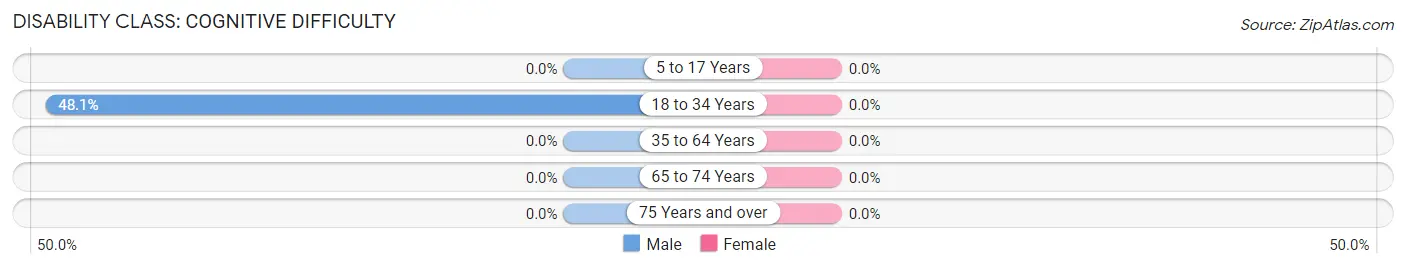
| Age Bracket | Male | Female |
| 5 to 17 Years | 0 (0.0%) | 0 (0.0%) |
| 18 to 34 Years | 25 (48.1%) | 0 (0.0%) |
| 35 to 64 Years | 0 (0.0%) | 0 (0.0%) |
| 65 to 74 Years | 0 (0.0%) | 0 (0.0%) |
| 75 Years and over | 0 (0.0%) | 0 (0.0%) |
Disability Class: Ambulatory Difficulty
| Age Bracket | Male | Female |
| 5 to 17 Years | 0 (0.0%) | 0 (0.0%) |
| 18 to 34 Years | 0 (0.0%) | 0 (0.0%) |
| 35 to 64 Years | 0 (0.0%) | 0 (0.0%) |
| 65 to 74 Years | 0 (0.0%) | 0 (0.0%) |
| 75 Years and over | 0 (0.0%) | 0 (0.0%) |
Disability Class: Self-Care Difficulty
| Age Bracket | Male | Female |
| 5 to 17 Years | 0 (0.0%) | 0 (0.0%) |
| 18 to 34 Years | 0 (0.0%) | 0 (0.0%) |
| 35 to 64 Years | 0 (0.0%) | 0 (0.0%) |
| 65 to 74 Years | 0 (0.0%) | 0 (0.0%) |
| 75 Years and over | 0 (0.0%) | 0 (0.0%) |
Technology Access in Beaver
Computing Device Access in Beaver
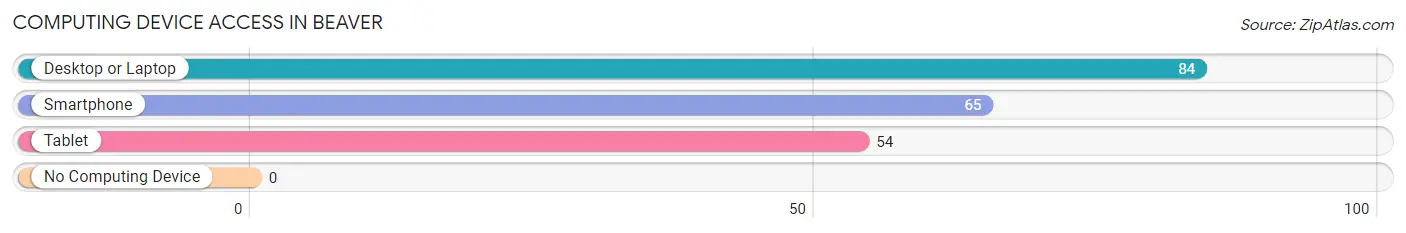
| Device Type | # Households | % Households |
| Desktop or Laptop | 84 | 88.4% |
| Smartphone | 65 | 68.4% |
| Tablet | 54 | 56.8% |
| No Computing Device | 0 | 0.0% |
| Total | 95 | 100.0% |
Internet Access in Beaver
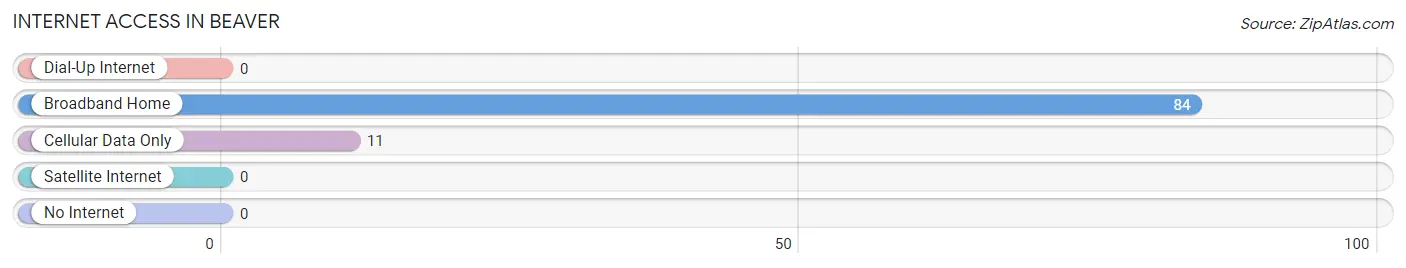
| Internet Type | # Households | % Households |
| Dial-Up Internet | 0 | 0.0% |
| Broadband Home | 84 | 88.4% |
| Cellular Data Only | 11 | 11.6% |
| Satellite Internet | 0 | 0.0% |
| No Internet | 0 | 0.0% |
| Total | 95 | 100.0% |
Beaver Summary
Beaver, Oregon is a small city located in the northwest corner of the state, in the foothills of the Cascade Mountains. It is situated on the banks of the Beaver Creek, a tributary of the Willamette River. The city is home to approximately 4,000 people and is the county seat of Beaver County.
Geography
Beaver is located in the foothills of the Cascade Mountains, at an elevation of 1,890 feet. The city is surrounded by mountains, forests, and rivers, making it a popular destination for outdoor recreation. The city is located in the Willamette Valley, which is known for its fertile soil and mild climate. The city is located approximately 40 miles south of Portland, Oregon, and is accessible by Interstate 5.
Economy
Beaver’s economy is largely based on agriculture and timber. The city is home to several large farms, as well as a number of small family-owned farms. The city is also home to several timber companies, which harvest and process timber from the surrounding forests. In addition, the city is home to several small businesses, including restaurants, retail stores, and service providers.
Demographics
As of the 2010 census, Beaver had a population of 4,037 people. The racial makeup of the city was 94.3% White, 0.7% African American, 0.7% Native American, 0.7% Asian, 0.2% Pacific Islander, 1.2% from other races, and 2.1% from two or more races. Hispanic or Latino of any race were 4.2% of the population.
The median income for a household in Beaver was $41,944, and the median income for a family was $50,917. The per capita income for the city was $20,945. About 11.2% of families and 14.2% of the population were below the poverty line, including 18.2% of those under age 18 and 8.2% of those age 65 or over.
Education
Beaver is served by the Beaverton School District, which includes two elementary schools, one middle school, and one high school. The city is also home to a branch of the Oregon State University, which offers a variety of undergraduate and graduate degree programs.
Conclusion
Beaver, Oregon is a small city located in the northwest corner of the state, in the foothills of the Cascade Mountains. It is situated on the banks of the Beaver Creek, a tributary of the Willamette River. The city is home to approximately 4,000 people and is the county seat of Beaver County. The city’s economy is largely based on agriculture and timber, and it is home to several small businesses, including restaurants, retail stores, and service providers. The city is served by the Beaverton School District, and is home to a branch of the Oregon State University.
Common Questions
What is Per Capita Income in Beaver?
Per Capita income in Beaver is $34,281.
What is Inequality or Gini Index in Beaver?
Inequality or Gini Index in Beaver is 0.37.
What is the Total Population of Beaver?
Total Population of Beaver is 206.
What is the Total Male Population of Beaver?
Total Male Population of Beaver is 147.
What is the Total Female Population of Beaver?
Total Female Population of Beaver is 59.
What is the Ratio of Males per 100 Females in Beaver?
There are 249.15 Males per 100 Females in Beaver.
What is the Ratio of Females per 100 Males in Beaver?
There are 40.14 Females per 100 Males in Beaver.
What is the Median Population Age in Beaver?
Median Population Age in Beaver is 57.5 Years.
What is the Average Family Size in Beaver
Average Family Size in Beaver is 2.6 People.
What is the Average Household Size in Beaver
Average Household Size in Beaver is 2.2 People.
How Large is the Labor Force in Beaver?
There are 78 People in the Labor Forcein in Beaver.
What is the Percentage of People in the Labor Force in Beaver?
37.9% of People are in the Labor Force in Beaver.