Zip Codes with the Highest Percentage of Population Employed in Real Estate, Rental & Leasing in Oregon
RELATED REPORTS & OPTIONS
Real Estate, Rental & Leasing
Oregon
Compare Zip Codes
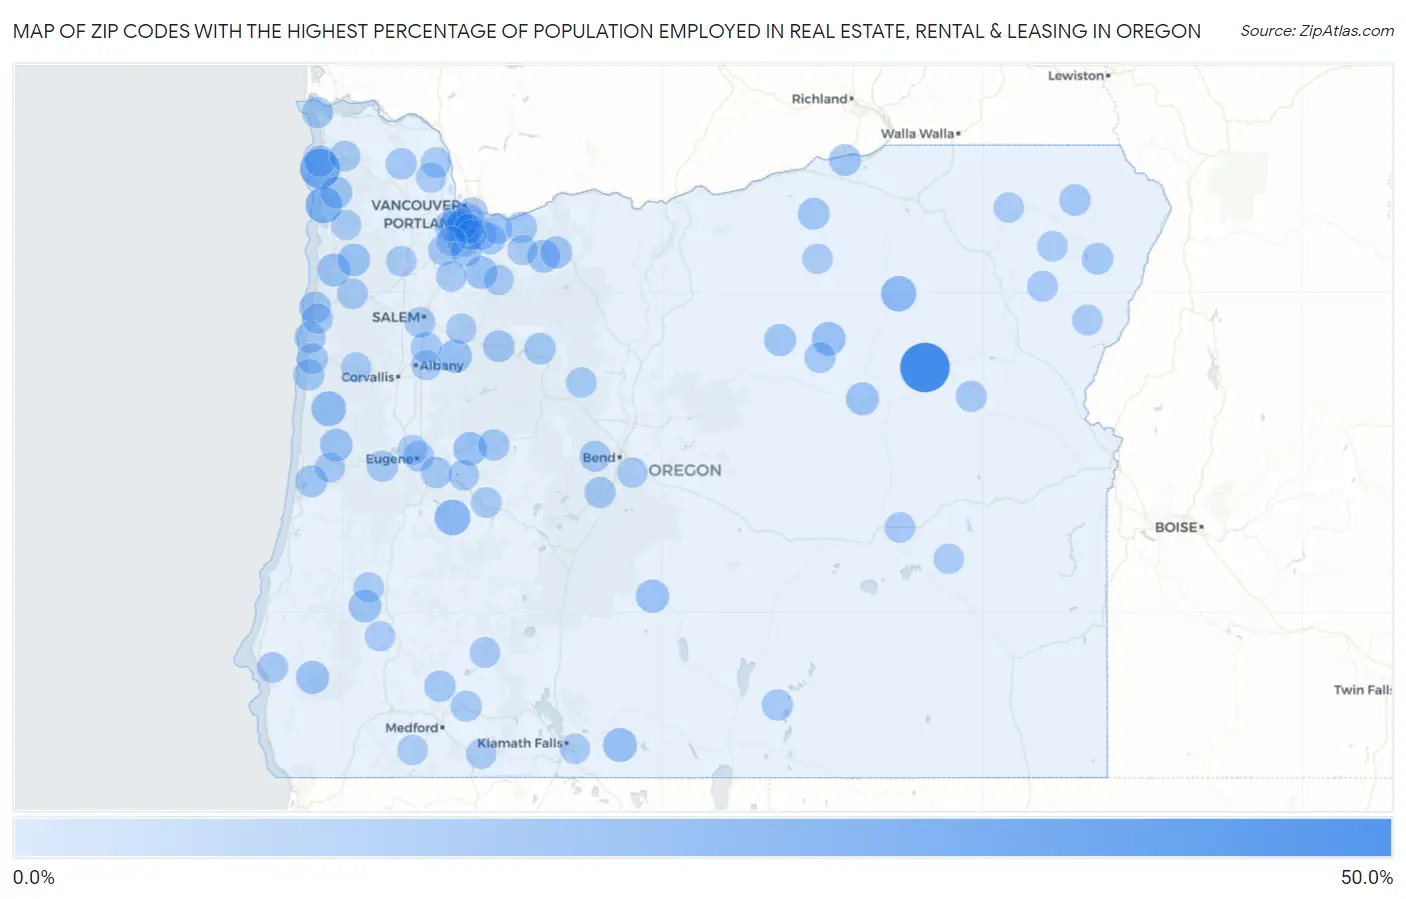
Map of Zip Codes with the Highest Percentage of Population Employed in Real Estate, Rental & Leasing in Oregon
0.0%
50.0%
Zip Codes with the Highest Percentage of Population Employed in Real Estate, Rental & Leasing in Oregon
| Zip Code | % Employed | vs State | vs National | |
| 1. | 97817 | 44.4% | 2.0%(+42.5)#1 | 1.9%(+42.6)#20 |
| 2. | 97145 | 23.3% | 2.0%(+21.3)#2 | 1.9%(+21.4)#81 |
| 3. | 97136 | 15.6% | 2.0%(+13.6)#3 | 1.9%(+13.7)#160 |
| 4. | 97434 | 13.8% | 2.0%(+11.9)#4 | 1.9%(+12.0)#206 |
| 5. | 97880 | 13.1% | 2.0%(+11.1)#5 | 1.9%(+11.2)#223 |
| 6. | 97390 | 12.1% | 2.0%(+10.1)#6 | 1.9%(+10.2)#260 |
| 7. | 97623 | 10.2% | 2.0%(+8.26)#7 | 1.9%(+8.34)#364 |
| 8. | 97864 | 9.6% | 2.0%(+7.68)#8 | 1.9%(+7.76)#410 |
| 9. | 97374 | 9.4% | 2.0%(+7.42)#9 | 1.9%(+7.50)#432 |
| 10. | 97489 | 9.3% | 2.0%(+7.32)#10 | 1.9%(+7.40)#447 |
| 11. | 97638 | 8.5% | 2.0%(+6.49)#11 | 1.9%(+6.57)#498 |
| 12. | 97112 | 8.2% | 2.0%(+6.22)#12 | 1.9%(+6.30)#530 |
| 13. | 97406 | 8.1% | 2.0%(+6.16)#13 | 1.9%(+6.24)#538 |
| 14. | 97865 | 8.0% | 2.0%(+6.07)#14 | 1.9%(+6.15)#550 |
| 15. | 97067 | 7.8% | 2.0%(+5.87)#15 | 1.9%(+5.95)#575 |
| 16. | 97108 | 7.4% | 2.0%(+5.38)#16 | 1.9%(+5.46)#668 |
| 17. | 97042 | 7.3% | 2.0%(+5.37)#17 | 1.9%(+5.45)#669 |
| 18. | 97481 | 7.3% | 2.0%(+5.31)#18 | 1.9%(+5.39)#676 |
| 19. | 97480 | 7.2% | 2.0%(+5.26)#19 | 1.9%(+5.34)#684 |
| 20. | 97131 | 6.1% | 2.0%(+4.17)#20 | 1.9%(+4.25)#931 |
| 21. | 97874 | 6.1% | 2.0%(+4.11)#21 | 1.9%(+4.20)#946 |
| 22. | 97493 | 6.0% | 2.0%(+4.07)#22 | 1.9%(+4.15)#961 |
| 23. | 97049 | 6.0% | 2.0%(+4.03)#23 | 1.9%(+4.11)#972 |
| 24. | 97364 | 5.7% | 2.0%(+3.73)#24 | 1.9%(+3.81)#1,075 |
| 25. | 97882 | 5.5% | 2.0%(+3.48)#25 | 1.9%(+3.56)#1,168 |
| 26. | 97346 | 5.4% | 2.0%(+3.46)#26 | 1.9%(+3.54)#1,185 |
| 27. | 97839 | 5.4% | 2.0%(+3.43)#27 | 1.9%(+3.51)#1,198 |
| 28. | 97034 | 5.1% | 2.0%(+3.11)#28 | 1.9%(+3.19)#1,346 |
| 29. | 97110 | 5.0% | 2.0%(+3.06)#29 | 1.9%(+3.14)#1,369 |
| 30. | 97342 | 5.0% | 2.0%(+3.03)#30 | 1.9%(+3.11)#1,387 |
| 31. | 97828 | 5.0% | 2.0%(+3.00)#31 | 1.9%(+3.08)#1,403 |
| 32. | 97846 | 4.9% | 2.0%(+2.95)#32 | 1.9%(+3.03)#1,436 |
| 33. | 97019 | 4.9% | 2.0%(+2.93)#33 | 1.9%(+3.01)#1,446 |
| 34. | 97503 | 4.9% | 2.0%(+2.89)#34 | 1.9%(+2.97)#1,468 |
| 35. | 97089 | 4.8% | 2.0%(+2.82)#35 | 1.9%(+2.90)#1,510 |
| 36. | 97488 | 4.7% | 2.0%(+2.68)#36 | 1.9%(+2.76)#1,603 |
| 37. | 97064 | 4.5% | 2.0%(+2.55)#37 | 1.9%(+2.63)#1,701 |
| 38. | 97455 | 4.5% | 2.0%(+2.53)#38 | 1.9%(+2.62)#1,712 |
| 39. | 97707 | 4.5% | 2.0%(+2.53)#39 | 1.9%(+2.61)#1,719 |
| 40. | 97366 | 4.4% | 2.0%(+2.43)#40 | 1.9%(+2.51)#1,790 |
| 41. | 97637 | 4.3% | 2.0%(+2.37)#41 | 1.9%(+2.46)#1,835 |
| 42. | 97121 | 4.3% | 2.0%(+2.32)#42 | 1.9%(+2.40)#1,870 |
| 43. | 97140 | 4.2% | 2.0%(+2.19)#43 | 1.9%(+2.27)#1,996 |
| 44. | 97487 | 4.1% | 2.0%(+2.15)#44 | 1.9%(+2.23)#2,044 |
| 45. | 97239 | 4.0% | 2.0%(+2.03)#45 | 1.9%(+2.11)#2,165 |
| 46. | 97884 | 4.0% | 2.0%(+2.03)#46 | 1.9%(+2.11)#2,171 |
| 47. | 97341 | 4.0% | 2.0%(+2.00)#47 | 1.9%(+2.08)#2,209 |
| 48. | 97365 | 3.9% | 2.0%(+1.95)#48 | 1.9%(+2.03)#2,259 |
| 49. | 97848 | 3.9% | 2.0%(+1.95)#49 | 1.9%(+2.03)#2,266 |
| 50. | 97068 | 3.9% | 2.0%(+1.89)#50 | 1.9%(+1.97)#2,316 |
| 51. | 97703 | 3.8% | 2.0%(+1.86)#51 | 1.9%(+1.94)#2,351 |
| 52. | 97352 | 3.8% | 2.0%(+1.84)#52 | 1.9%(+1.92)#2,373 |
| 53. | 97524 | 3.7% | 2.0%(+1.75)#53 | 1.9%(+1.83)#2,490 |
| 54. | 97005 | 3.7% | 2.0%(+1.72)#54 | 1.9%(+1.80)#2,533 |
| 55. | 97347 | 3.5% | 2.0%(+1.51)#55 | 1.9%(+1.59)#2,878 |
| 56. | 97883 | 3.5% | 2.0%(+1.49)#56 | 1.9%(+1.57)#2,915 |
| 57. | 97465 | 3.4% | 2.0%(+1.47)#57 | 1.9%(+1.56)#2,934 |
| 58. | 97438 | 3.4% | 2.0%(+1.44)#58 | 1.9%(+1.52)#2,996 |
| 59. | 97401 | 3.3% | 2.0%(+1.33)#59 | 1.9%(+1.42)#3,193 |
| 60. | 97536 | 3.3% | 2.0%(+1.28)#60 | 1.9%(+1.36)#3,323 |
| 61. | 97111 | 3.2% | 2.0%(+1.25)#61 | 1.9%(+1.33)#3,358 |
| 62. | 97492 | 3.2% | 2.0%(+1.23)#62 | 1.9%(+1.31)#3,406 |
| 63. | 97367 | 3.2% | 2.0%(+1.21)#63 | 1.9%(+1.29)#3,440 |
| 64. | 97834 | 3.2% | 2.0%(+1.19)#64 | 1.9%(+1.28)#3,480 |
| 65. | 97302 | 3.2% | 2.0%(+1.19)#65 | 1.9%(+1.27)#3,505 |
| 66. | 97032 | 3.2% | 2.0%(+1.18)#66 | 1.9%(+1.27)#3,508 |
| 67. | 97212 | 3.2% | 2.0%(+1.18)#67 | 1.9%(+1.26)#3,511 |
| 68. | 97225 | 3.1% | 2.0%(+1.17)#68 | 1.9%(+1.25)#3,526 |
| 69. | 97720 | 3.1% | 2.0%(+1.09)#69 | 1.9%(+1.18)#3,705 |
| 70. | 97221 | 3.1% | 2.0%(+1.09)#70 | 1.9%(+1.17)#3,720 |
| 71. | 97086 | 3.0% | 2.0%(+1.03)#71 | 1.9%(+1.12)#3,890 |
| 72. | 97857 | 3.0% | 2.0%(+1.02)#72 | 1.9%(+1.10)#3,923 |
| 73. | 97205 | 3.0% | 2.0%(+1.00)#73 | 1.9%(+1.08)#3,966 |
| 74. | 97211 | 2.9% | 2.0%(+0.953)#74 | 1.9%(+1.03)#4,094 |
| 75. | 97080 | 2.9% | 2.0%(+0.918)#75 | 1.9%(+0.999)#4,196 |
| 76. | 97138 | 2.9% | 2.0%(+0.909)#76 | 1.9%(+0.990)#4,221 |
| 77. | 97051 | 2.9% | 2.0%(+0.877)#77 | 1.9%(+0.958)#4,299 |
| 78. | 97210 | 2.7% | 2.0%(+0.765)#78 | 1.9%(+0.847)#4,625 |
| 79. | 97222 | 2.7% | 2.0%(+0.752)#79 | 1.9%(+0.834)#4,666 |
| 80. | 97471 | 2.7% | 2.0%(+0.735)#80 | 1.9%(+0.817)#4,720 |
| 81. | 97702 | 2.7% | 2.0%(+0.729)#81 | 1.9%(+0.811)#4,735 |
| 82. | 97202 | 2.7% | 2.0%(+0.718)#82 | 1.9%(+0.799)#4,778 |
| 83. | 97322 | 2.7% | 2.0%(+0.715)#83 | 1.9%(+0.796)#4,784 |
| 84. | 97056 | 2.7% | 2.0%(+0.711)#84 | 1.9%(+0.792)#4,792 |
| 85. | 97603 | 2.6% | 2.0%(+0.654)#85 | 1.9%(+0.736)#5,011 |
| 86. | 97385 | 2.6% | 2.0%(+0.635)#86 | 1.9%(+0.716)#5,072 |
| 87. | 97530 | 2.6% | 2.0%(+0.625)#87 | 1.9%(+0.707)#5,106 |
| 88. | 97730 | 2.6% | 2.0%(+0.624)#88 | 1.9%(+0.706)#5,113 |
| 89. | 97141 | 2.6% | 2.0%(+0.602)#89 | 1.9%(+0.684)#5,184 |
| 90. | 97017 | 2.6% | 2.0%(+0.600)#90 | 1.9%(+0.682)#5,193 |
| 91. | 97055 | 2.6% | 2.0%(+0.595)#91 | 1.9%(+0.676)#5,216 |
| 92. | 97836 | 2.6% | 2.0%(+0.594)#92 | 1.9%(+0.675)#5,221 |
| 93. | 97469 | 2.5% | 2.0%(+0.573)#93 | 1.9%(+0.654)#5,307 |
| 94. | 97224 | 2.5% | 2.0%(+0.563)#94 | 1.9%(+0.645)#5,345 |
| 95. | 97827 | 2.5% | 2.0%(+0.556)#95 | 1.9%(+0.637)#5,377 |
| 96. | 97732 | 2.5% | 2.0%(+0.527)#96 | 1.9%(+0.608)#5,491 |
| 97. | 97453 | 2.5% | 2.0%(+0.518)#97 | 1.9%(+0.599)#5,524 |
| 98. | 97404 | 2.5% | 2.0%(+0.494)#98 | 1.9%(+0.575)#5,608 |
| 99. | 97326 | 2.4% | 2.0%(+0.472)#99 | 1.9%(+0.554)#5,697 |
| 100. | 97520 | 2.4% | 2.0%(+0.461)#100 | 1.9%(+0.542)#5,744 |
Common Questions
What are the Top 10 Zip Codes with the Highest Percentage of Population Employed in Real Estate, Rental & Leasing in Oregon?
Top 10 Zip Codes with the Highest Percentage of Population Employed in Real Estate, Rental & Leasing in Oregon are:
What zip code has the Highest Percentage of Population Employed in Real Estate, Rental & Leasing in Oregon?
97817 has the Highest Percentage of Population Employed in Real Estate, Rental & Leasing in Oregon with 44.4%.
What is the Percentage of Population Employed in Real Estate, Rental & Leasing in the State of Oregon?
Percentage of Population Employed in Real Estate, Rental & Leasing in Oregon is 2.0%.
What is the Percentage of Population Employed in Real Estate, Rental & Leasing in the United States?
Percentage of Population Employed in Real Estate, Rental & Leasing in the United States is 1.9%.