Jefferson, OR Map & Demographics
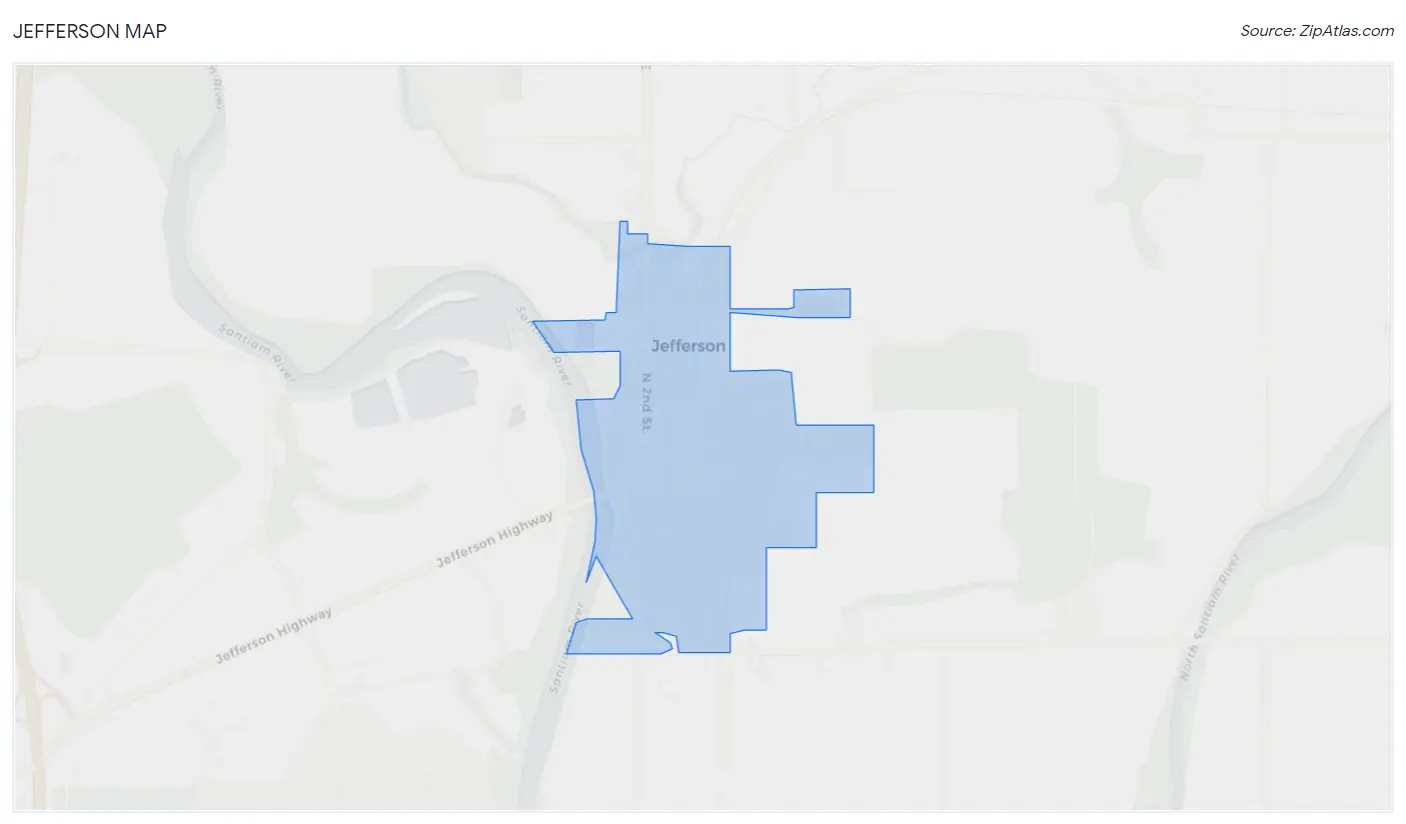
Jefferson Map
Jefferson Overview
$32,414
PER CAPITA INCOME
$90,677
AVG FAMILY INCOME
$87,604
AVG HOUSEHOLD INCOME
16.4%
WAGE / INCOME GAP [ % ]
83.6¢/ $1
WAGE / INCOME GAP [ $ ]
0.42
INEQUALITY / GINI INDEX
3,324
TOTAL POPULATION
1,607
MALE POPULATION
1,717
FEMALE POPULATION
93.59
MALES / 100 FEMALES
106.85
FEMALES / 100 MALES
31.7
MEDIAN AGE
3.7
AVG FAMILY SIZE
3.4
AVG HOUSEHOLD SIZE
1,630
LABOR FORCE [ PEOPLE ]
68.7%
PERCENT IN LABOR FORCE
9.7%
UNEMPLOYMENT RATE
Jefferson Zip Codes
Jefferson Area Codes
Income in Jefferson
Income Overview in Jefferson
Per Capita Income in Jefferson is $32,414, while median incomes of families and households are $90,677 and $87,604 respectively.
| Characteristic | Number | Measure |
| Per Capita Income | 3,324 | $32,414 |
| Median Family Income | 787 | $90,677 |
| Mean Family Income | 787 | $107,593 |
| Median Household Income | 969 | $87,604 |
| Mean Household Income | 969 | $107,452 |
| Income Deficit | 787 | $0 |
| Wage / Income Gap (%) | 3,324 | 16.36% |
| Wage / Income Gap ($) | 3,324 | 83.64¢ per $1 |
| Gini / Inequality Index | 3,324 | 0.42 |
Earnings by Sex in Jefferson
Average Earnings in Jefferson are $36,830, $41,434 for men and $34,656 for women, a difference of 16.4%.
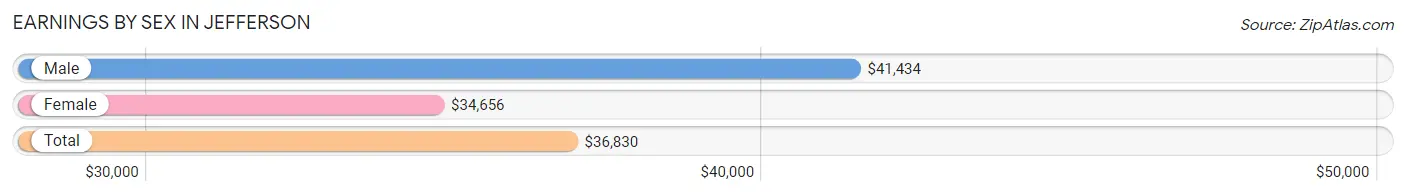
| Sex | Number | Average Earnings |
| Male | 933 (55.0%) | $41,434 |
| Female | 763 (45.0%) | $34,656 |
| Total | 1,696 (100.0%) | $36,830 |
Earnings by Sex by Income Bracket in Jefferson
The most common earnings brackets in Jefferson are $75,000 to $99,999 for men (177 | 19.0%) and $25,000 to $29,999 for women (137 | 18.0%).
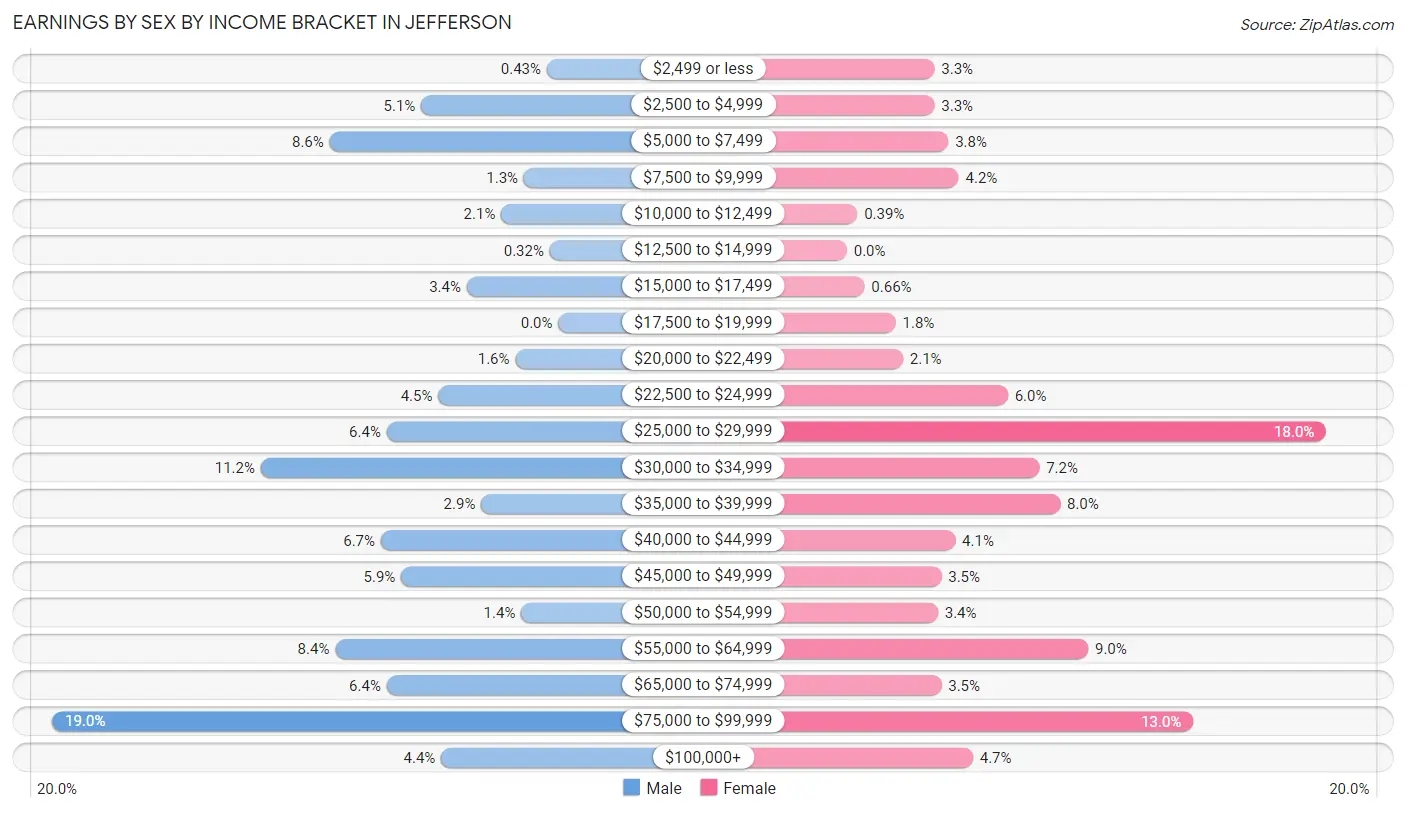
| Income | Male | Female |
| $2,499 or less | 4 (0.4%) | 25 (3.3%) |
| $2,500 to $4,999 | 48 (5.1%) | 25 (3.3%) |
| $5,000 to $7,499 | 80 (8.6%) | 29 (3.8%) |
| $7,500 to $9,999 | 12 (1.3%) | 32 (4.2%) |
| $10,000 to $12,499 | 20 (2.1%) | 3 (0.4%) |
| $12,500 to $14,999 | 3 (0.3%) | 0 (0.0%) |
| $15,000 to $17,499 | 32 (3.4%) | 5 (0.7%) |
| $17,500 to $19,999 | 0 (0.0%) | 14 (1.8%) |
| $20,000 to $22,499 | 15 (1.6%) | 16 (2.1%) |
| $22,500 to $24,999 | 42 (4.5%) | 46 (6.0%) |
| $25,000 to $29,999 | 60 (6.4%) | 137 (18.0%) |
| $30,000 to $34,999 | 104 (11.2%) | 55 (7.2%) |
| $35,000 to $39,999 | 27 (2.9%) | 61 (8.0%) |
| $40,000 to $44,999 | 62 (6.7%) | 31 (4.1%) |
| $45,000 to $49,999 | 55 (5.9%) | 27 (3.5%) |
| $50,000 to $54,999 | 13 (1.4%) | 26 (3.4%) |
| $55,000 to $64,999 | 78 (8.4%) | 69 (9.0%) |
| $65,000 to $74,999 | 60 (6.4%) | 27 (3.5%) |
| $75,000 to $99,999 | 177 (19.0%) | 99 (13.0%) |
| $100,000+ | 41 (4.4%) | 36 (4.7%) |
| Total | 933 (100.0%) | 763 (100.0%) |
Earnings by Sex by Educational Attainment in Jefferson
Average earnings in Jefferson are $45,900 for men and $37,266 for women, a difference of 18.8%. Men with an educational attainment of bachelor's degree enjoy the highest average annual earnings of $56,875, while those with high school diploma education earn the least with $34,881. Women with an educational attainment of bachelor's degree earn the most with the average annual earnings of $58,333, while those with high school diploma education have the smallest earnings of $30,917.
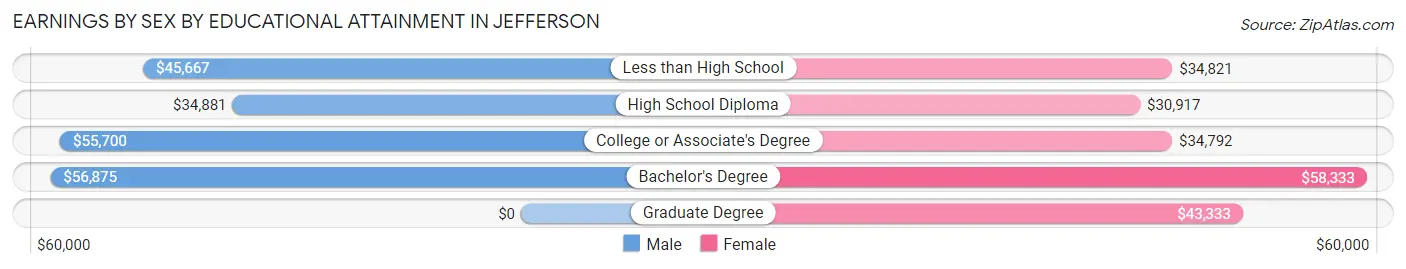
| Educational Attainment | Male Income | Female Income |
| Less than High School | $45,667 | $34,821 |
| High School Diploma | $34,881 | $30,917 |
| College or Associate's Degree | $55,700 | $34,792 |
| Bachelor's Degree | $56,875 | $58,333 |
| Graduate Degree | - | - |
| Total | $45,900 | $37,266 |
Family Income in Jefferson
Family Income Brackets in Jefferson
According to the Jefferson family income data, there are 220 families falling into the $100,000 to $149,999 income range, which is the most common income bracket and makes up 28.0% of all families. Conversely, the $10,000 to $14,999 income bracket is the least frequent group with only 11 families (1.4%) belonging to this category.
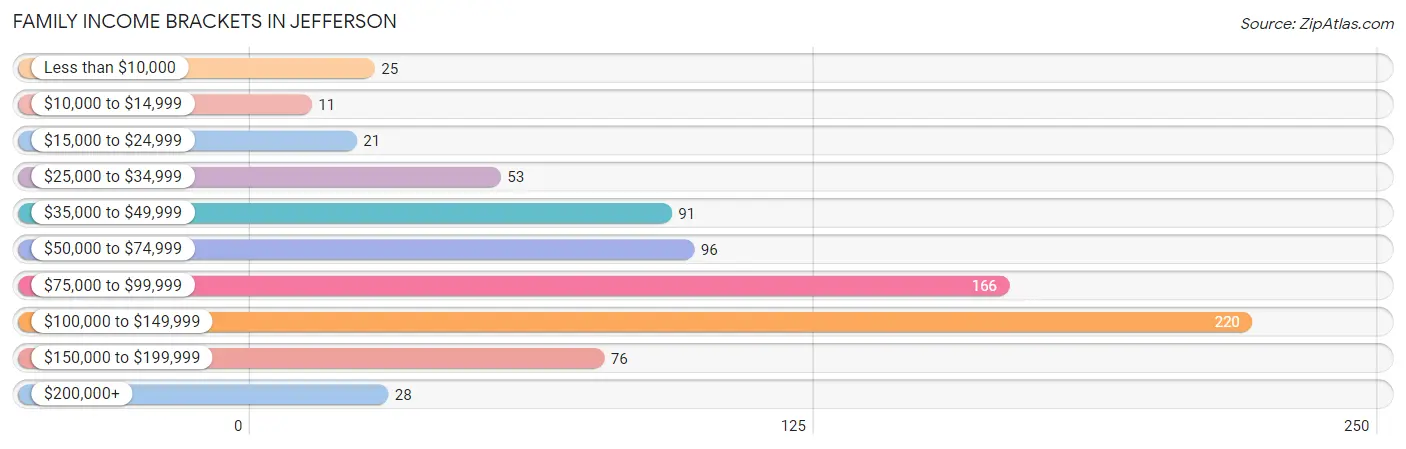
| Income Bracket | # Families | % Families |
| Less than $10,000 | 25 | 3.2% |
| $10,000 to $14,999 | 11 | 1.4% |
| $15,000 to $24,999 | 21 | 2.7% |
| $25,000 to $34,999 | 53 | 6.7% |
| $35,000 to $49,999 | 91 | 11.6% |
| $50,000 to $74,999 | 96 | 12.2% |
| $75,000 to $99,999 | 166 | 21.1% |
| $100,000 to $149,999 | 220 | 28.0% |
| $150,000 to $199,999 | 76 | 9.7% |
| $200,000+ | 28 | 3.6% |
Family Income by Famaliy Size in Jefferson
4-person families (153 | 19.4%) account for the highest median family income in Jefferson with $118,482 per family, while 2-person families (316 | 40.2%) have the highest median income of $38,014 per family member.
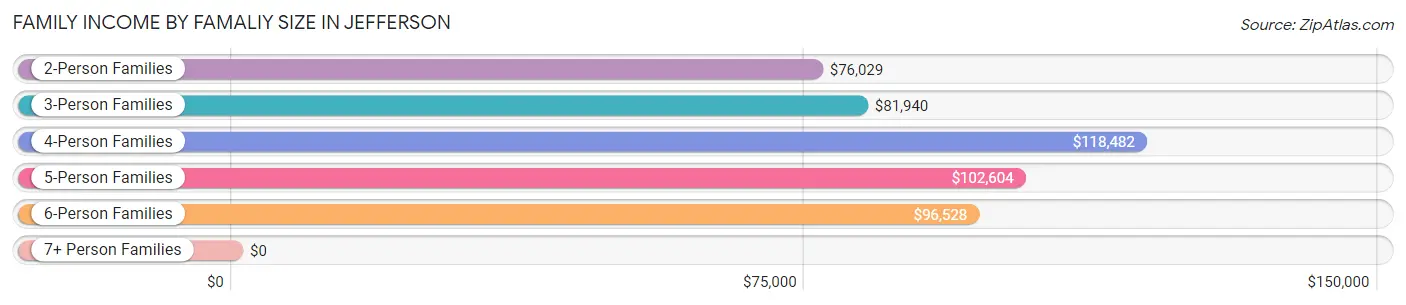
| Income Bracket | # Families | Median Income |
| 2-Person Families | 316 (40.2%) | $76,029 |
| 3-Person Families | 103 (13.1%) | $81,940 |
| 4-Person Families | 153 (19.4%) | $118,482 |
| 5-Person Families | 122 (15.5%) | $102,604 |
| 6-Person Families | 47 (6.0%) | $96,528 |
| 7+ Person Families | 46 (5.8%) | $0 |
| Total | 787 (100.0%) | $90,677 |
Family Income by Number of Earners in Jefferson
The median family income in Jefferson is $90,677, with families comprising 3+ earners (123) having the highest median family income of $119,688, while families with no earners (104) have the lowest median family income of $38,125, accounting for 15.6% and 13.2% of families, respectively.
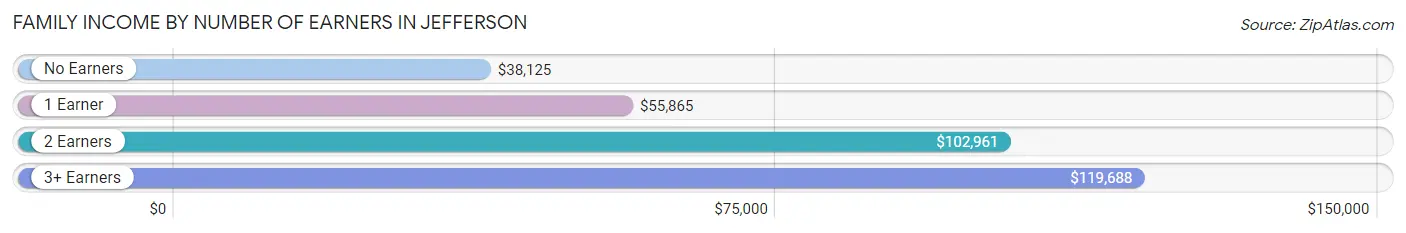
| Number of Earners | # Families | Median Income |
| No Earners | 104 (13.2%) | $38,125 |
| 1 Earner | 225 (28.6%) | $55,865 |
| 2 Earners | 335 (42.6%) | $102,961 |
| 3+ Earners | 123 (15.6%) | $119,688 |
| Total | 787 (100.0%) | $90,677 |
Household Income in Jefferson
Household Income Brackets in Jefferson
With 278 households falling in the category, the $100,000 to $149,999 income range is the most frequent in Jefferson, accounting for 28.7% of all households. In contrast, only 11 households (1.1%) fall into the less than $10,000 income bracket, making it the least populous group.
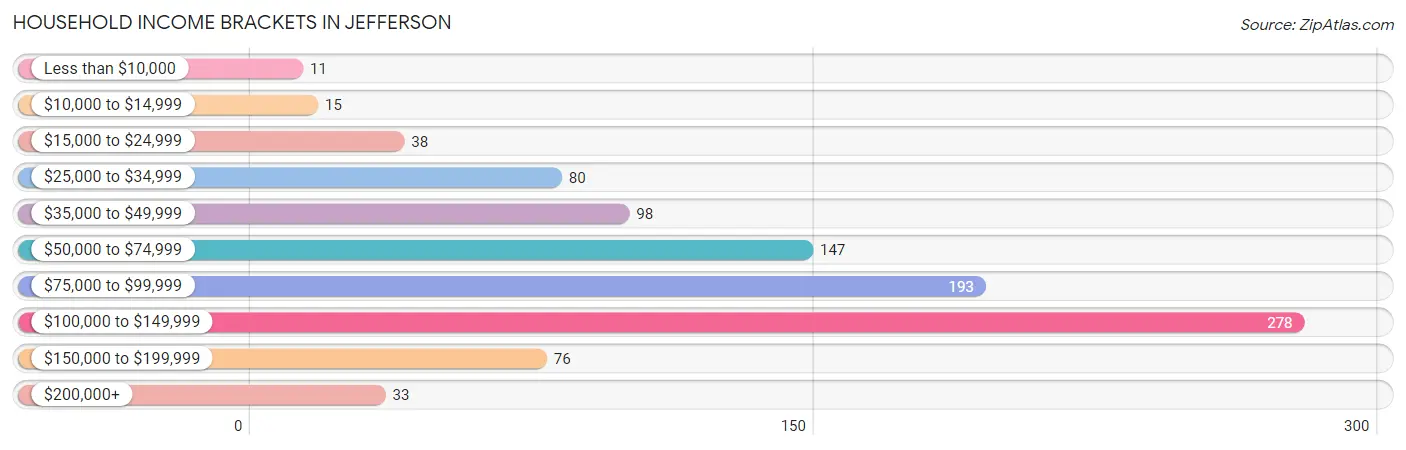
| Income Bracket | # Households | % Households |
| Less than $10,000 | 11 | 1.1% |
| $10,000 to $14,999 | 15 | 1.5% |
| $15,000 to $24,999 | 38 | 3.9% |
| $25,000 to $34,999 | 80 | 8.3% |
| $35,000 to $49,999 | 98 | 10.1% |
| $50,000 to $74,999 | 147 | 15.2% |
| $75,000 to $99,999 | 193 | 19.9% |
| $100,000 to $149,999 | 278 | 28.7% |
| $150,000 to $199,999 | 76 | 7.8% |
| $200,000+ | 33 | 3.4% |
Household Income by Householder Age in Jefferson
The median household income in Jefferson is $87,604, with the highest median household income of $117,644 found in the 45 to 64 years age bracket for the primary householder. A total of 269 households (27.8%) fall into this category. Meanwhile, the 15 to 24 years age bracket for the primary householder has the lowest median household income of $0, with 11 households (1.1%) in this group.
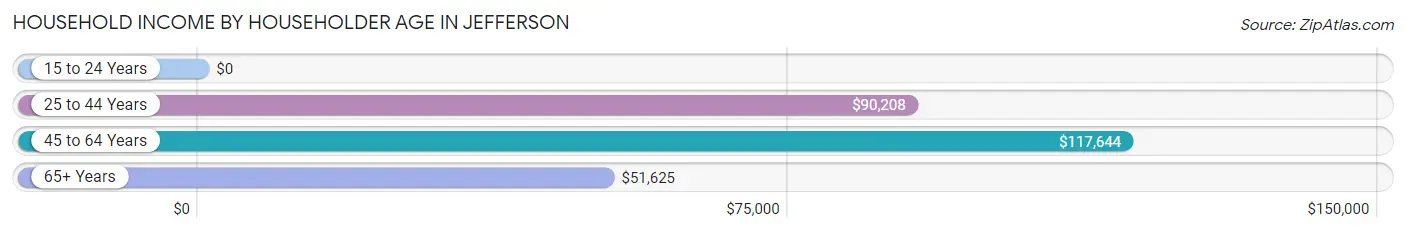
| Income Bracket | # Households | Median Income |
| 15 to 24 Years | 11 (1.1%) | $0 |
| 25 to 44 Years | 464 (47.9%) | $90,208 |
| 45 to 64 Years | 269 (27.8%) | $117,644 |
| 65+ Years | 225 (23.2%) | $51,625 |
| Total | 969 (100.0%) | $87,604 |
Poverty in Jefferson
Income Below Poverty by Sex and Age in Jefferson
With 11.0% poverty level for males and 8.7% for females among the residents of Jefferson, 6 to 11 year old males and 5 year old females are the most vulnerable to poverty, with 74 males (30.2%) and 31 females (38.3%) in their respective age groups living below the poverty level.
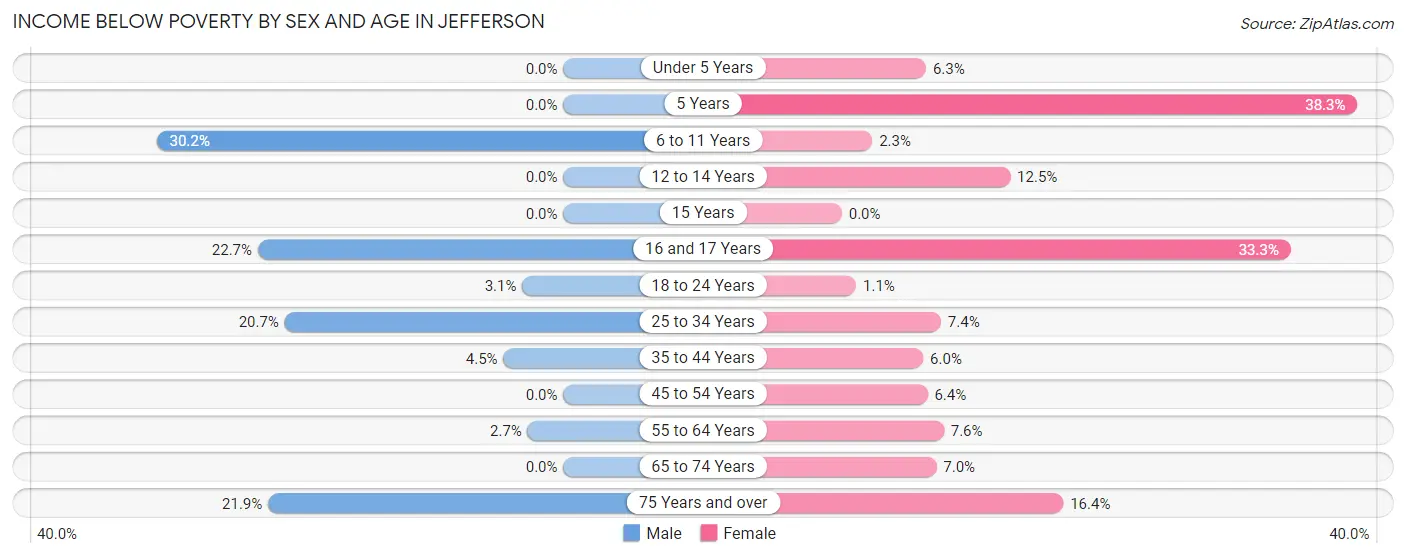
| Age Bracket | Male | Female |
| Under 5 Years | 0 (0.0%) | 9 (6.2%) |
| 5 Years | 0 (0.0%) | 31 (38.3%) |
| 6 to 11 Years | 74 (30.2%) | 5 (2.3%) |
| 12 to 14 Years | 0 (0.0%) | 11 (12.5%) |
| 15 Years | 0 (0.0%) | 0 (0.0%) |
| 16 and 17 Years | 22 (22.7%) | 17 (33.3%) |
| 18 to 24 Years | 6 (3.0%) | 1 (1.1%) |
| 25 to 34 Years | 42 (20.7%) | 19 (7.4%) |
| 35 to 44 Years | 13 (4.4%) | 16 (6.0%) |
| 45 to 54 Years | 0 (0.0%) | 7 (6.4%) |
| 55 to 64 Years | 4 (2.6%) | 14 (7.6%) |
| 65 to 74 Years | 0 (0.0%) | 8 (7.0%) |
| 75 Years and over | 16 (21.9%) | 12 (16.4%) |
| Total | 177 (11.0%) | 150 (8.7%) |
Income Above Poverty by Sex and Age in Jefferson
According to the poverty statistics in Jefferson, males aged under 5 years and females aged 15 years are the age groups that are most secure financially, with 100.0% of males and 100.0% of females in these age groups living above the poverty line.
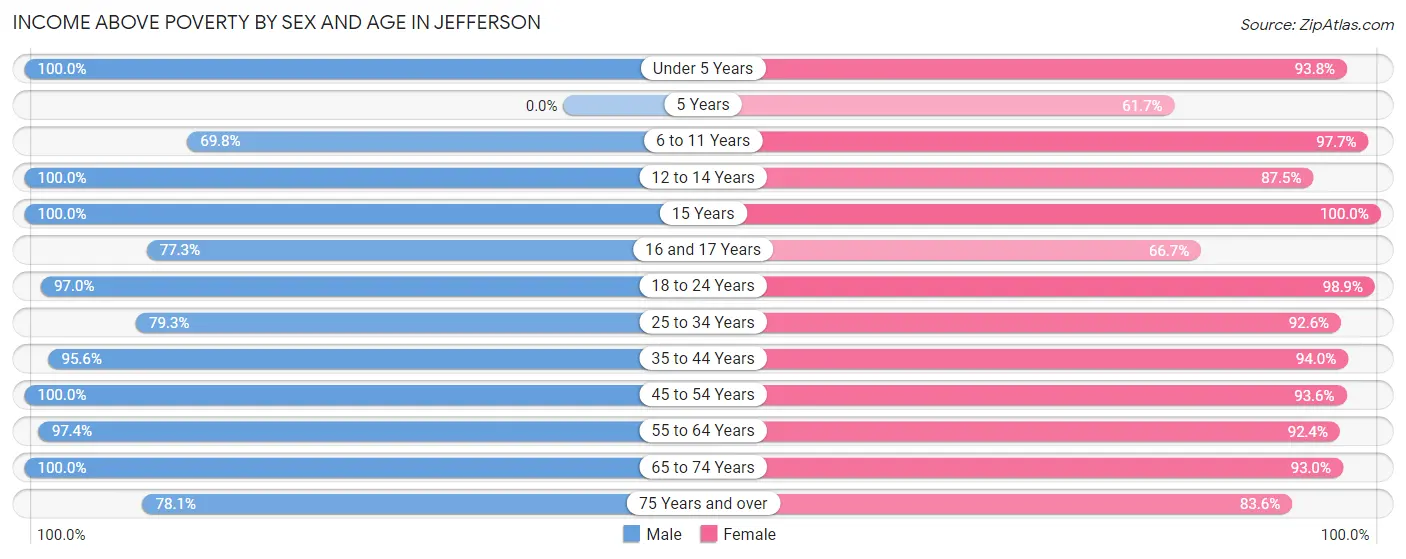
| Age Bracket | Male | Female |
| Under 5 Years | 51 (100.0%) | 135 (93.8%) |
| 5 Years | 0 (0.0%) | 50 (61.7%) |
| 6 to 11 Years | 171 (69.8%) | 216 (97.7%) |
| 12 to 14 Years | 63 (100.0%) | 77 (87.5%) |
| 15 Years | 26 (100.0%) | 33 (100.0%) |
| 16 and 17 Years | 75 (77.3%) | 34 (66.7%) |
| 18 to 24 Years | 191 (97.0%) | 93 (98.9%) |
| 25 to 34 Years | 161 (79.3%) | 239 (92.6%) |
| 35 to 44 Years | 279 (95.6%) | 249 (94.0%) |
| 45 to 54 Years | 108 (100.0%) | 103 (93.6%) |
| 55 to 64 Years | 147 (97.4%) | 171 (92.4%) |
| 65 to 74 Years | 101 (100.0%) | 106 (93.0%) |
| 75 Years and over | 57 (78.1%) | 61 (83.6%) |
| Total | 1,430 (89.0%) | 1,567 (91.3%) |
Income Below Poverty Among Married-Couple Families in Jefferson
The poverty statistics for married-couple families in Jefferson show that 2.8% or 17 of the total 598 families live below the poverty line. Families with no children have the highest poverty rate of 5.6%, comprising of 17 families. On the other hand, families with 1 or 2 children have the lowest poverty rate of 0.0%, which includes 0 families.
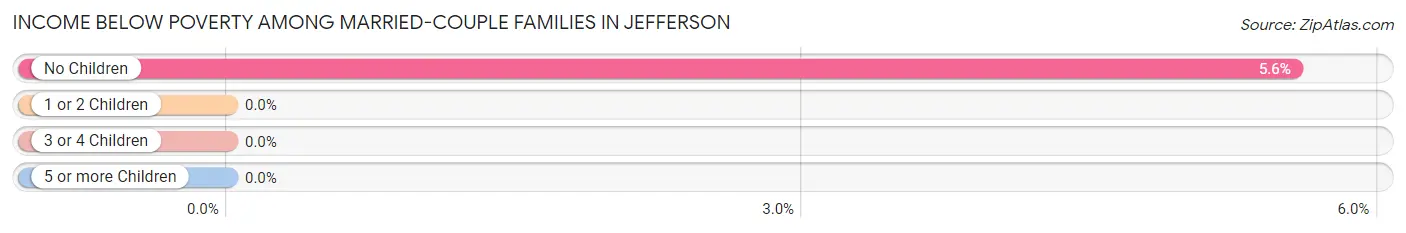
| Children | Above Poverty | Below Poverty |
| No Children | 289 (94.4%) | 17 (5.6%) |
| 1 or 2 Children | 150 (100.0%) | 0 (0.0%) |
| 3 or 4 Children | 142 (100.0%) | 0 (0.0%) |
| 5 or more Children | 0 (0.0%) | 0 (0.0%) |
| Total | 581 (97.2%) | 17 (2.8%) |
Income Below Poverty Among Single-Parent Households in Jefferson
According to the poverty data in Jefferson, 31.2% or 30 single-father households and 31.2% or 29 single-mother households are living below the poverty line. Among single-father households, those with 5 or more children have the highest poverty rate, with 30 households (100.0%) experiencing poverty. Likewise, among single-mother households, those with 1 or 2 children have the highest poverty rate, with 21 households (48.8%) falling below the poverty line.
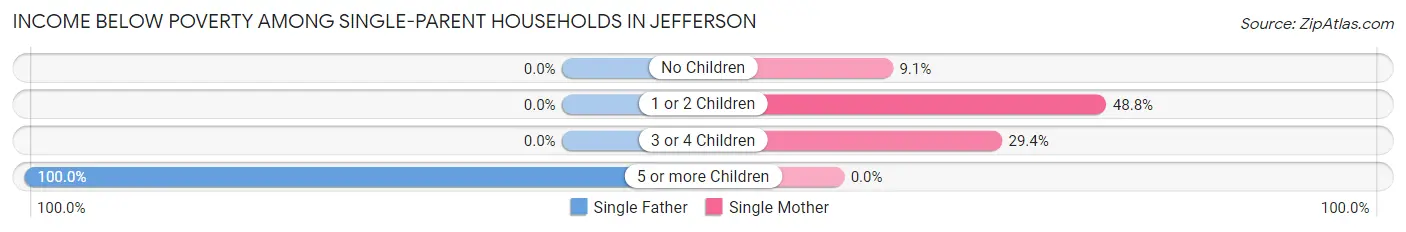
| Children | Single Father | Single Mother |
| No Children | 0 (0.0%) | 3 (9.1%) |
| 1 or 2 Children | 0 (0.0%) | 21 (48.8%) |
| 3 or 4 Children | 0 (0.0%) | 5 (29.4%) |
| 5 or more Children | 30 (100.0%) | 0 (0.0%) |
| Total | 30 (31.2%) | 29 (31.2%) |
Income Below Poverty Among Married-Couple vs Single-Parent Households in Jefferson
The poverty data for Jefferson shows that 17 of the married-couple family households (2.8%) and 59 of the single-parent households (31.2%) are living below the poverty level. Within the married-couple family households, those with no children have the highest poverty rate, with 17 households (5.6%) falling below the poverty line. Among the single-parent households, those with 5 or more children have the highest poverty rate, with 30 household (100.0%) living below poverty.
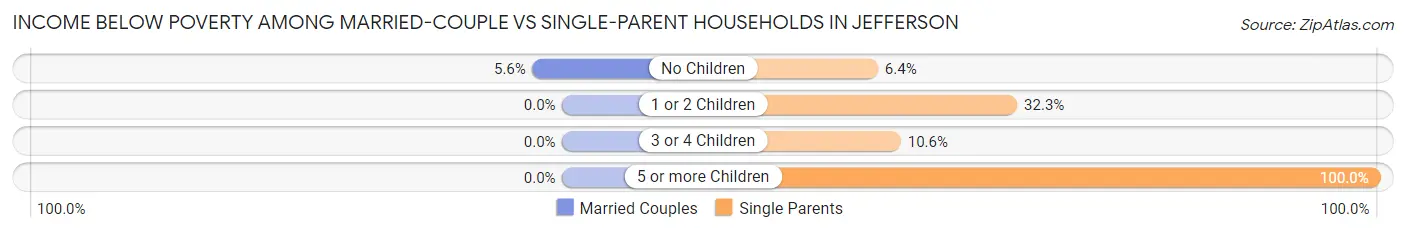
| Children | Married-Couple Families | Single-Parent Households |
| No Children | 17 (5.6%) | 3 (6.4%) |
| 1 or 2 Children | 0 (0.0%) | 21 (32.3%) |
| 3 or 4 Children | 0 (0.0%) | 5 (10.6%) |
| 5 or more Children | 0 (0.0%) | 30 (100.0%) |
| Total | 17 (2.8%) | 59 (31.2%) |
Race in Jefferson
The most populous races in Jefferson are White / Caucasian (2,471 | 74.3%), Hispanic or Latino (662 | 19.9%), and Some other Race (407 | 12.2%).
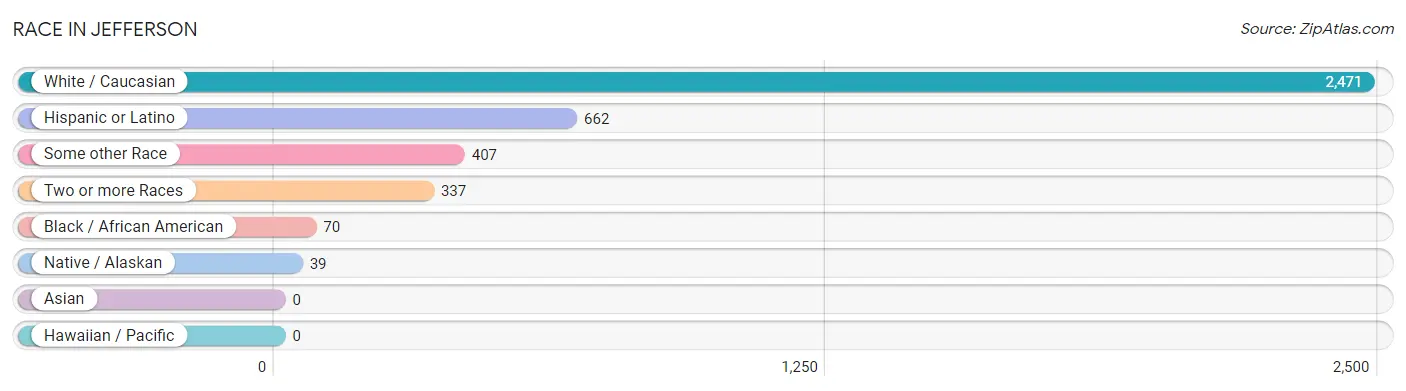
| Race | # Population | % Population |
| Asian | 0 | 0.0% |
| Black / African American | 70 | 2.1% |
| Hawaiian / Pacific | 0 | 0.0% |
| Hispanic or Latino | 662 | 19.9% |
| Native / Alaskan | 39 | 1.2% |
| White / Caucasian | 2,471 | 74.3% |
| Two or more Races | 337 | 10.1% |
| Some other Race | 407 | 12.2% |
| Total | 3,324 | 100.0% |
Ancestry in Jefferson
The most populous ancestries reported in Jefferson are German (969 | 29.1%), Mexican (575 | 17.3%), Irish (397 | 11.9%), English (308 | 9.3%), and European (119 | 3.6%), together accounting for 71.2% of all Jefferson residents.
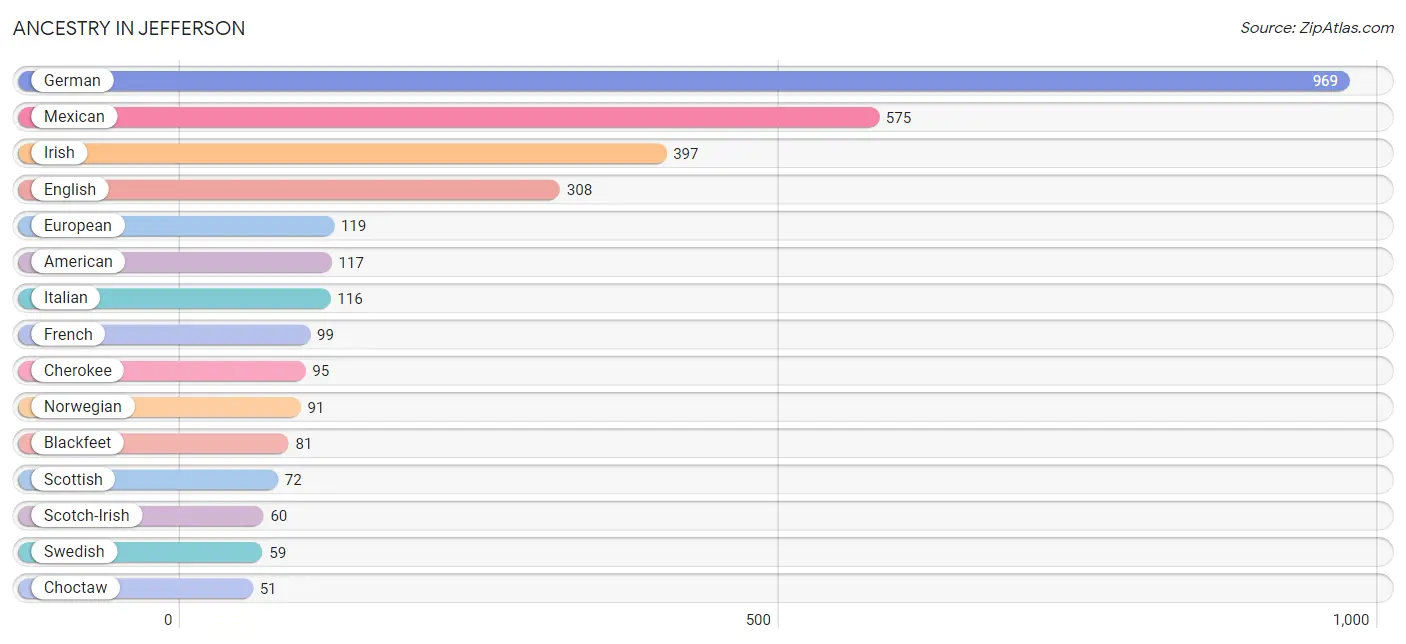
| Ancestry | # Population | % Population |
| American | 117 | 3.5% |
| Blackfeet | 81 | 2.4% |
| British | 26 | 0.8% |
| Canadian | 25 | 0.7% |
| Central American | 27 | 0.8% |
| Cherokee | 95 | 2.9% |
| Chilean | 36 | 1.1% |
| Choctaw | 51 | 1.5% |
| Cuban | 15 | 0.4% |
| Czechoslovakian | 5 | 0.2% |
| Danish | 17 | 0.5% |
| Dutch | 16 | 0.5% |
| Dutch West Indian | 10 | 0.3% |
| Eastern European | 5 | 0.2% |
| English | 308 | 9.3% |
| European | 119 | 3.6% |
| French | 99 | 3.0% |
| French Canadian | 41 | 1.2% |
| German | 969 | 29.1% |
| Honduran | 27 | 0.8% |
| Icelander | 4 | 0.1% |
| Irish | 397 | 11.9% |
| Italian | 116 | 3.5% |
| Korean | 21 | 0.6% |
| Latvian | 4 | 0.1% |
| Mexican | 575 | 17.3% |
| Navajo | 6 | 0.2% |
| Norwegian | 91 | 2.7% |
| Polish | 7 | 0.2% |
| Scandinavian | 28 | 0.8% |
| Scotch-Irish | 60 | 1.8% |
| Scottish | 72 | 2.2% |
| Sioux | 3 | 0.1% |
| South American | 36 | 1.1% |
| Spanish | 9 | 0.3% |
| Swedish | 59 | 1.8% |
| Swiss | 11 | 0.3% |
| Ukrainian | 46 | 1.4% |
| Welsh | 19 | 0.6% | View All 39 Rows |
Immigrants in Jefferson
The most numerous immigrant groups reported in Jefferson came from Central America (330 | 9.9%), Latin America (330 | 9.9%), Mexico (330 | 9.9%), and Canada (12 | 0.4%), together accounting for 30.1% of all Jefferson residents.
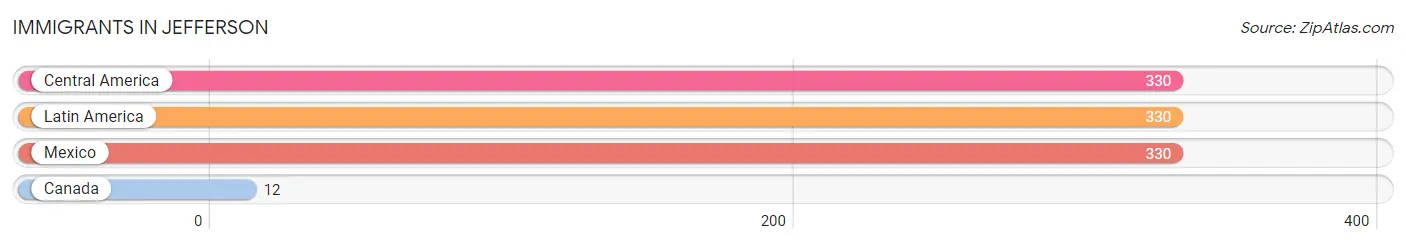
| Immigration Origin | # Population | % Population |
| Canada | 12 | 0.4% |
| Central America | 330 | 9.9% |
| Latin America | 330 | 9.9% |
| Mexico | 330 | 9.9% | View All 4 Rows |
Sex and Age in Jefferson
Sex and Age in Jefferson
The most populous age groups in Jefferson are 20 to 24 Years (191 | 11.9%) for men and 5 to 9 Years (244 | 14.2%) for women.
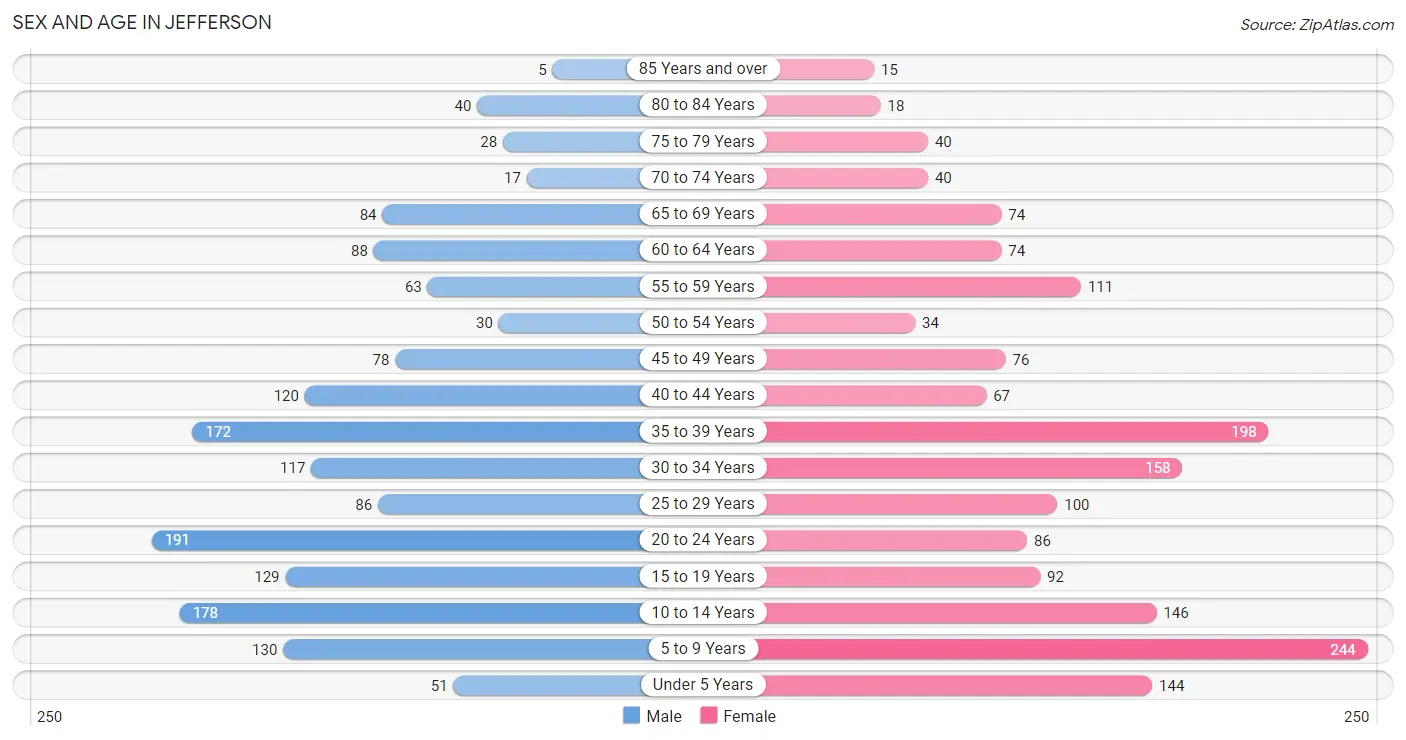
| Age Bracket | Male | Female |
| Under 5 Years | 51 (3.2%) | 144 (8.4%) |
| 5 to 9 Years | 130 (8.1%) | 244 (14.2%) |
| 10 to 14 Years | 178 (11.1%) | 146 (8.5%) |
| 15 to 19 Years | 129 (8.0%) | 92 (5.4%) |
| 20 to 24 Years | 191 (11.9%) | 86 (5.0%) |
| 25 to 29 Years | 86 (5.3%) | 100 (5.8%) |
| 30 to 34 Years | 117 (7.3%) | 158 (9.2%) |
| 35 to 39 Years | 172 (10.7%) | 198 (11.5%) |
| 40 to 44 Years | 120 (7.5%) | 67 (3.9%) |
| 45 to 49 Years | 78 (4.9%) | 76 (4.4%) |
| 50 to 54 Years | 30 (1.9%) | 34 (2.0%) |
| 55 to 59 Years | 63 (3.9%) | 111 (6.5%) |
| 60 to 64 Years | 88 (5.5%) | 74 (4.3%) |
| 65 to 69 Years | 84 (5.2%) | 74 (4.3%) |
| 70 to 74 Years | 17 (1.1%) | 40 (2.3%) |
| 75 to 79 Years | 28 (1.7%) | 40 (2.3%) |
| 80 to 84 Years | 40 (2.5%) | 18 (1.1%) |
| 85 Years and over | 5 (0.3%) | 15 (0.9%) |
| Total | 1,607 (100.0%) | 1,717 (100.0%) |
Families and Households in Jefferson
Median Family Size in Jefferson
The median family size in Jefferson is 3.73 persons per family, with single male/father families (96 | 12.2%) accounting for the largest median family size of 4.32 persons per family. On the other hand, single female/mother families (93 | 11.8%) represent the smallest median family size with 2.53 persons per family.
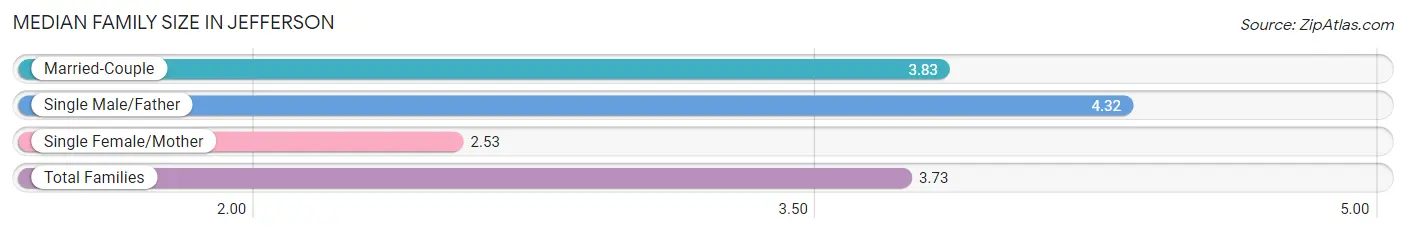
| Family Type | # Families | Family Size |
| Married-Couple | 598 (76.0%) | 3.83 |
| Single Male/Father | 96 (12.2%) | 4.32 |
| Single Female/Mother | 93 (11.8%) | 2.53 |
| Total Families | 787 (100.0%) | 3.73 |
Median Household Size in Jefferson
The median household size in Jefferson is 3.42 persons per household, with single male/father households (96 | 9.9%) accounting for the largest median household size of 4.99 persons per household. non-family households (182 | 18.8%) represent the smallest median household size with 1.32 persons per household.
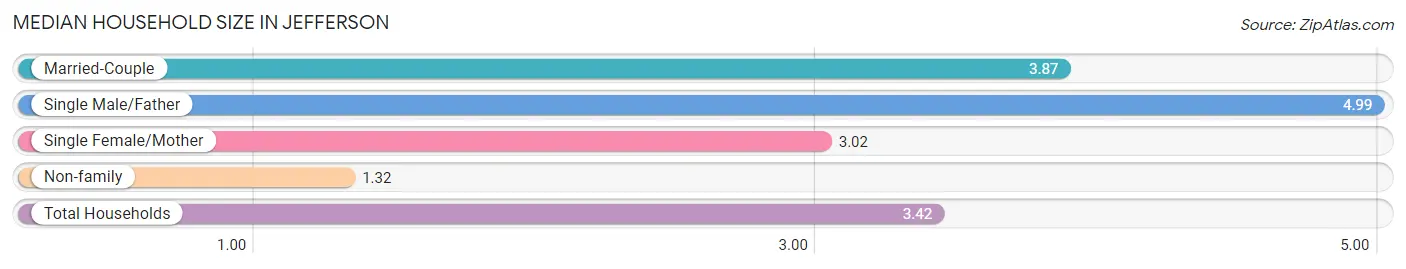
| Household Type | # Households | Household Size |
| Married-Couple | 598 (61.7%) | 3.87 |
| Single Male/Father | 96 (9.9%) | 4.99 |
| Single Female/Mother | 93 (9.6%) | 3.02 |
| Non-family | 182 (18.8%) | 1.32 |
| Total Households | 969 (100.0%) | 3.42 |
Household Size by Marriage Status in Jefferson
Out of a total of 969 households in Jefferson, 787 (81.2%) are family households, while 182 (18.8%) are nonfamily households. The most numerous type of family households are 2-person households, comprising 247, and the most common type of nonfamily households are 1-person households, comprising 140.
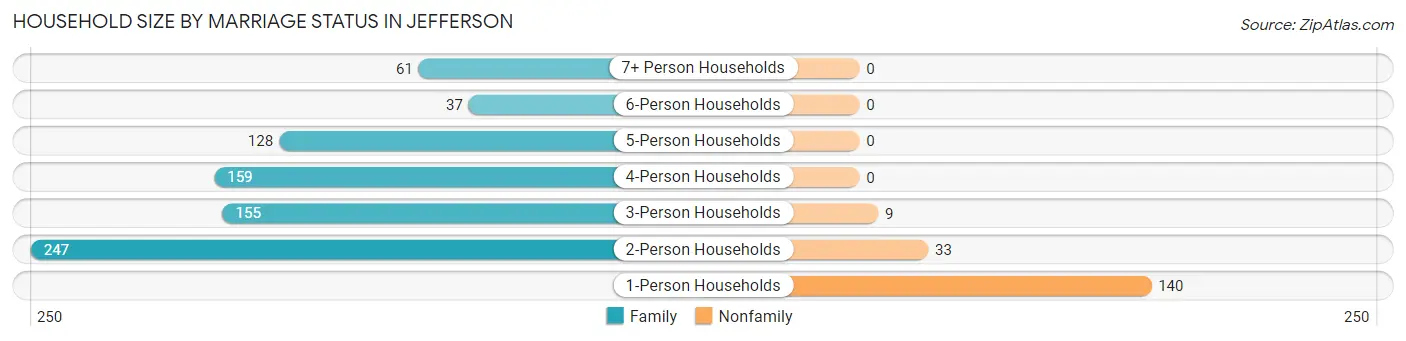
| Household Size | Family Households | Nonfamily Households |
| 1-Person Households | - | 140 (14.4%) |
| 2-Person Households | 247 (25.5%) | 33 (3.4%) |
| 3-Person Households | 155 (16.0%) | 9 (0.9%) |
| 4-Person Households | 159 (16.4%) | 0 (0.0%) |
| 5-Person Households | 128 (13.2%) | 0 (0.0%) |
| 6-Person Households | 37 (3.8%) | 0 (0.0%) |
| 7+ Person Households | 61 (6.3%) | 0 (0.0%) |
| Total | 787 (81.2%) | 182 (18.8%) |
Female Fertility in Jefferson
Fertility by Age in Jefferson
Average fertility rate in Jefferson is 31.0 births per 1,000 women. Women in the age bracket of 20 to 34 years have the highest fertility rate with 52.0 births per 1,000 women. Women in the age bracket of 20 to 34 years acount for 75.0% of all women with births.
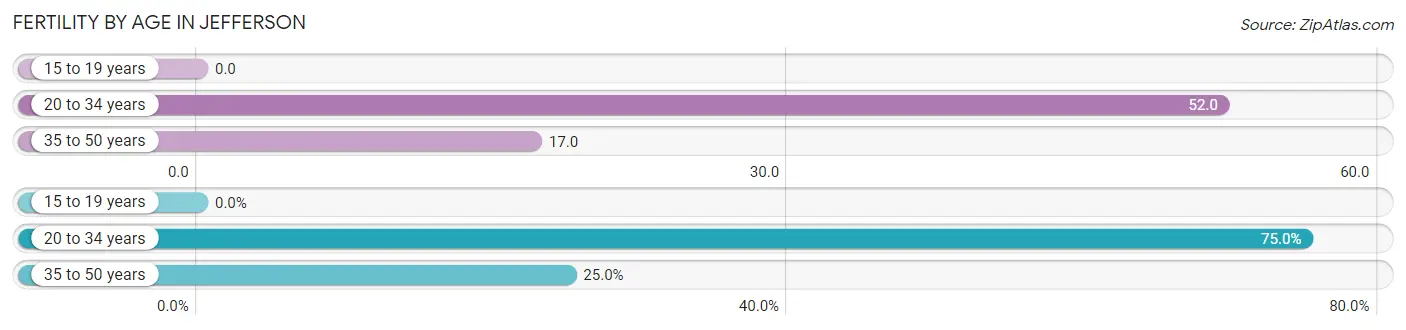
| Age Bracket | Women with Births | Births / 1,000 Women |
| 15 to 19 years | 0 (0.0%) | 0.0 |
| 20 to 34 years | 18 (75.0%) | 52.0 |
| 35 to 50 years | 6 (25.0%) | 17.0 |
| Total | 24 (100.0%) | 31.0 |
Fertility by Age by Marriage Status in Jefferson
70.8% of women with births (24) in Jefferson are married. The highest percentage of unmarried women with births falls into 20 to 34 years age bracket with 38.9% of them unmarried at the time of birth, while the lowest percentage of unmarried women with births belong to 35 to 50 years age bracket with 0.0% of them unmarried.
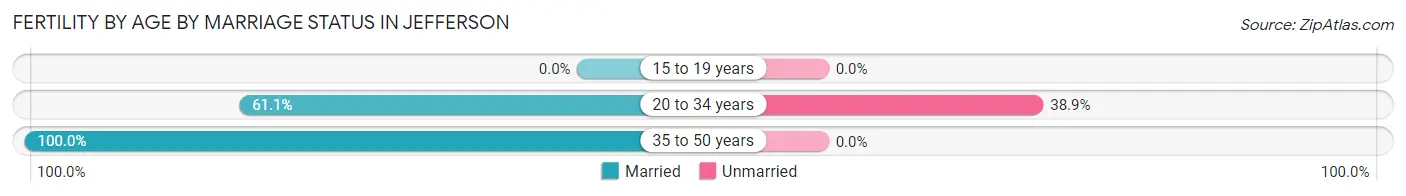
| Age Bracket | Married | Unmarried |
| 15 to 19 years | 0 (0.0%) | 0 (0.0%) |
| 20 to 34 years | 11 (61.1%) | 7 (38.9%) |
| 35 to 50 years | 6 (100.0%) | 0 (0.0%) |
| Total | 17 (70.8%) | 7 (29.2%) |
Fertility by Education in Jefferson
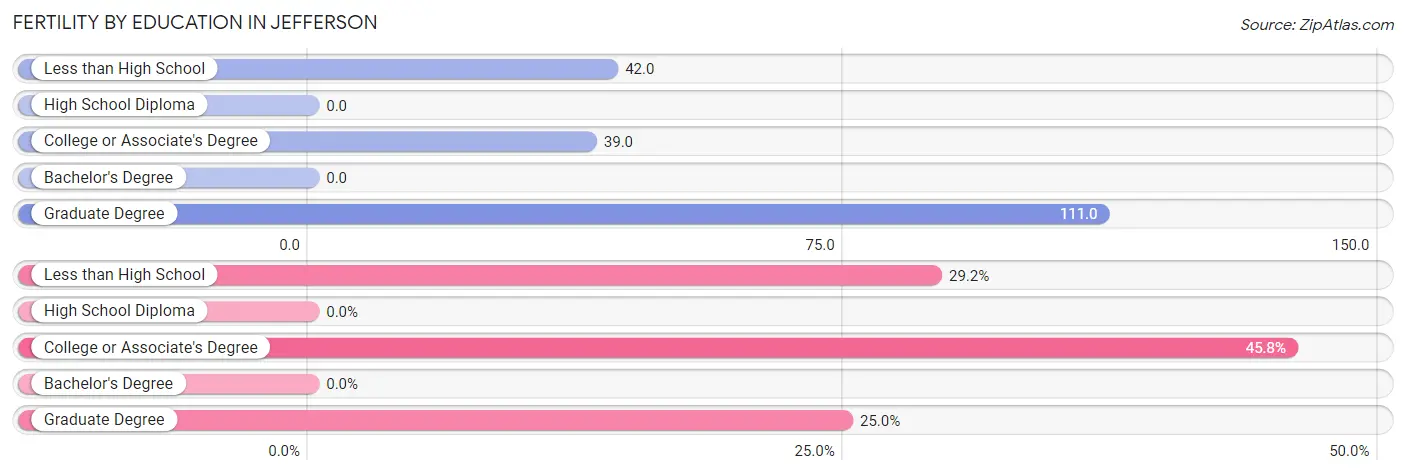
| Educational Attainment | Women with Births | Births / 1,000 Women |
| Less than High School | 7 (29.2%) | 42.0 |
| High School Diploma | 0 (0.0%) | 0.0 |
| College or Associate's Degree | 11 (45.8%) | 39.0 |
| Bachelor's Degree | 0 (0.0%) | 0.0 |
| Graduate Degree | 6 (25.0%) | 111.0 |
| Total | 24 (100.0%) | 31.0 |
Fertility by Education by Marriage Status in Jefferson
29.2% of women with births in Jefferson are unmarried. Women with the educational attainment of college or associate's degree are most likely to be married with 100.0% of them married at childbirth, while women with the educational attainment of less than high school are least likely to be married with 100.0% of them unmarried at childbirth.
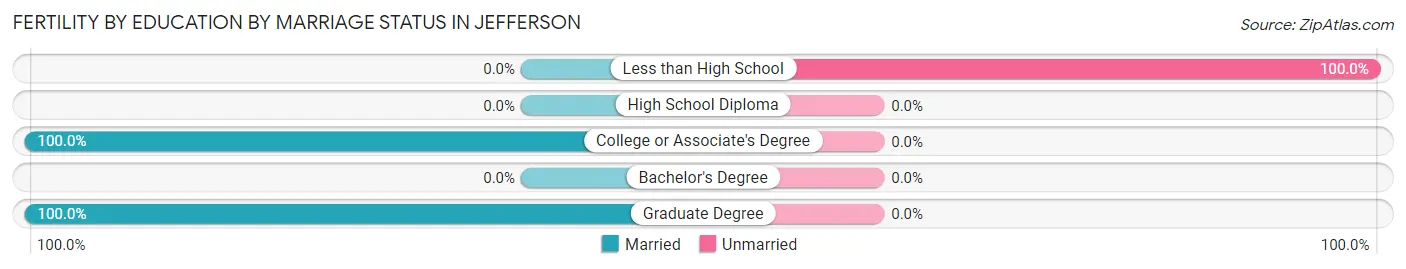
| Educational Attainment | Married | Unmarried |
| Less than High School | 0 (0.0%) | 7 (100.0%) |
| High School Diploma | 0 (0.0%) | 0 (0.0%) |
| College or Associate's Degree | 11 (100.0%) | 0 (0.0%) |
| Bachelor's Degree | 0 (0.0%) | 0 (0.0%) |
| Graduate Degree | 6 (100.0%) | 0 (0.0%) |
| Total | 17 (70.8%) | 7 (29.2%) |
Employment Characteristics in Jefferson
Employment by Class of Employer in Jefferson
Among the 1,450 employed individuals in Jefferson, private company employees (979 | 67.5%), state government employees (168 | 11.6%), and not-for-profit organizations (96 | 6.6%) make up the most common classes of employment.
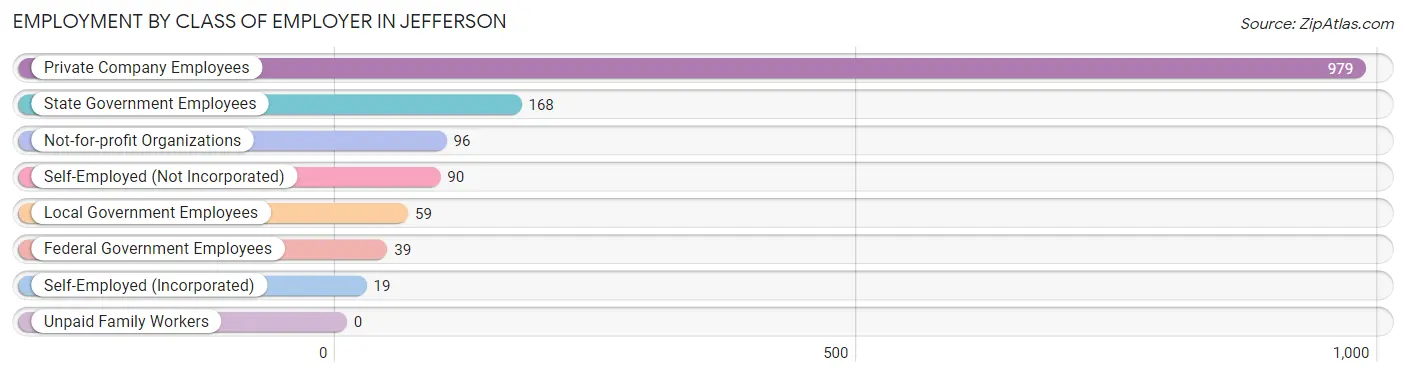
| Employer Class | # Employees | % Employees |
| Private Company Employees | 979 | 67.5% |
| Self-Employed (Incorporated) | 19 | 1.3% |
| Self-Employed (Not Incorporated) | 90 | 6.2% |
| Not-for-profit Organizations | 96 | 6.6% |
| Local Government Employees | 59 | 4.1% |
| State Government Employees | 168 | 11.6% |
| Federal Government Employees | 39 | 2.7% |
| Unpaid Family Workers | 0 | 0.0% |
| Total | 1,450 | 100.0% |
Employment Status by Age in Jefferson
According to the labor force statistics for Jefferson, out of the total population over 16 years of age (2,372), 68.7% or 1,630 individuals are in the labor force, with 9.7% or 158 of them unemployed. The age group with the highest labor force participation rate is 35 to 44 years, with 91.4% or 509 individuals in the labor force. Within the labor force, the 30 to 34 years age range has the highest percentage of unemployed individuals, with 21.9% or 55 of them being unemployed.
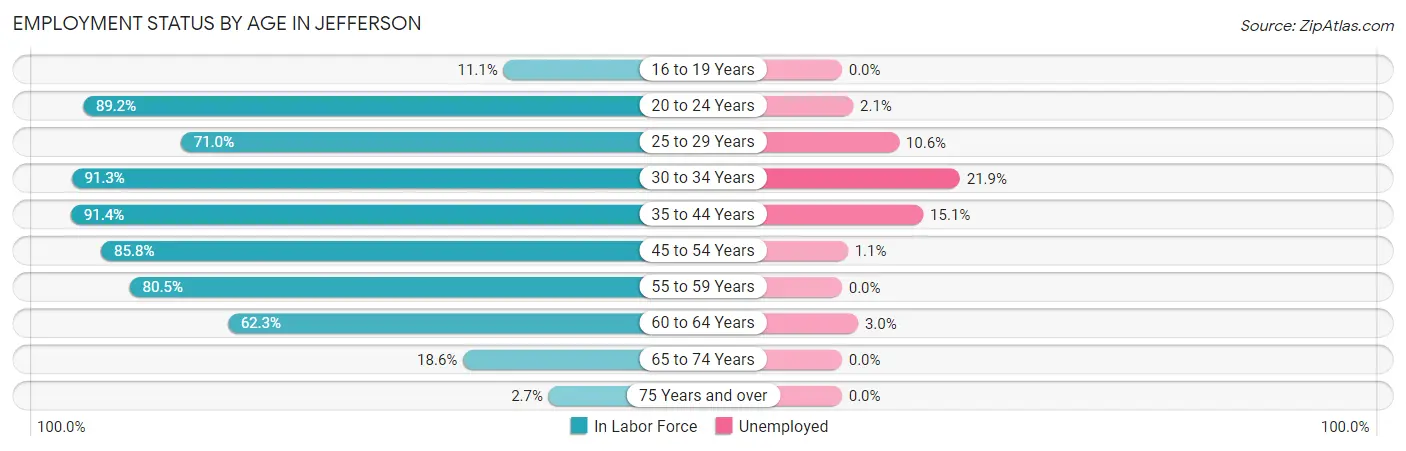
| Age Bracket | In Labor Force | Unemployed |
| 16 to 19 Years | 18 (11.1%) | 0 (0.0%) |
| 20 to 24 Years | 247 (89.2%) | 5 (2.1%) |
| 25 to 29 Years | 132 (71.0%) | 14 (10.6%) |
| 30 to 34 Years | 251 (91.3%) | 55 (21.9%) |
| 35 to 44 Years | 509 (91.4%) | 77 (15.1%) |
| 45 to 54 Years | 187 (85.8%) | 2 (1.1%) |
| 55 to 59 Years | 140 (80.5%) | 0 (0.0%) |
| 60 to 64 Years | 101 (62.3%) | 3 (3.0%) |
| 65 to 74 Years | 40 (18.6%) | 0 (0.0%) |
| 75 Years and over | 4 (2.7%) | 0 (0.0%) |
| Total | 1,630 (68.7%) | 158 (9.7%) |
Employment Status by Educational Attainment in Jefferson
According to labor force statistics for Jefferson, 84.0% of individuals (1,320) out of the total population between 25 and 64 years of age (1,572) are in the labor force, with 11.4% or 150 of them being unemployed. The group with the highest labor force participation rate are those with the educational attainment of bachelor's degree or higher, with 92.9% or 290 individuals in the labor force. Within the labor force, individuals with high school diploma education have the highest percentage of unemployment, with 20.6% or 71 of them being unemployed.
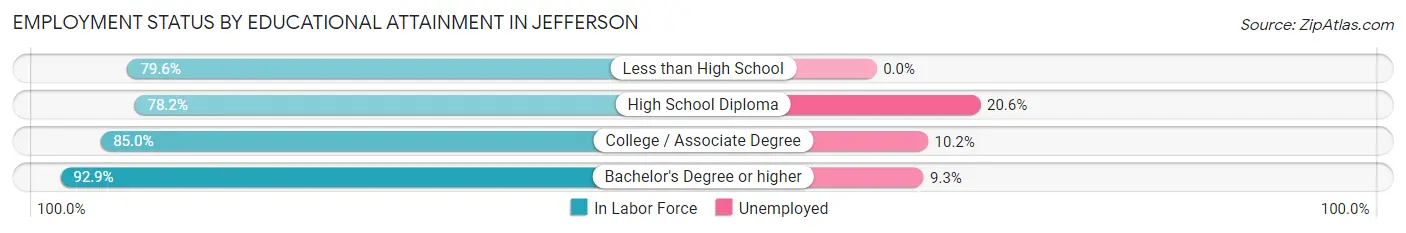
| Educational Attainment | In Labor Force | Unemployed |
| Less than High School | 164 (79.6%) | 0 (0.0%) |
| High School Diploma | 344 (78.2%) | 91 (20.6%) |
| College / Associate Degree | 522 (85.0%) | 63 (10.2%) |
| Bachelor's Degree or higher | 290 (92.9%) | 29 (9.3%) |
| Total | 1,320 (84.0%) | 179 (11.4%) |
Employment Occupations by Sex in Jefferson
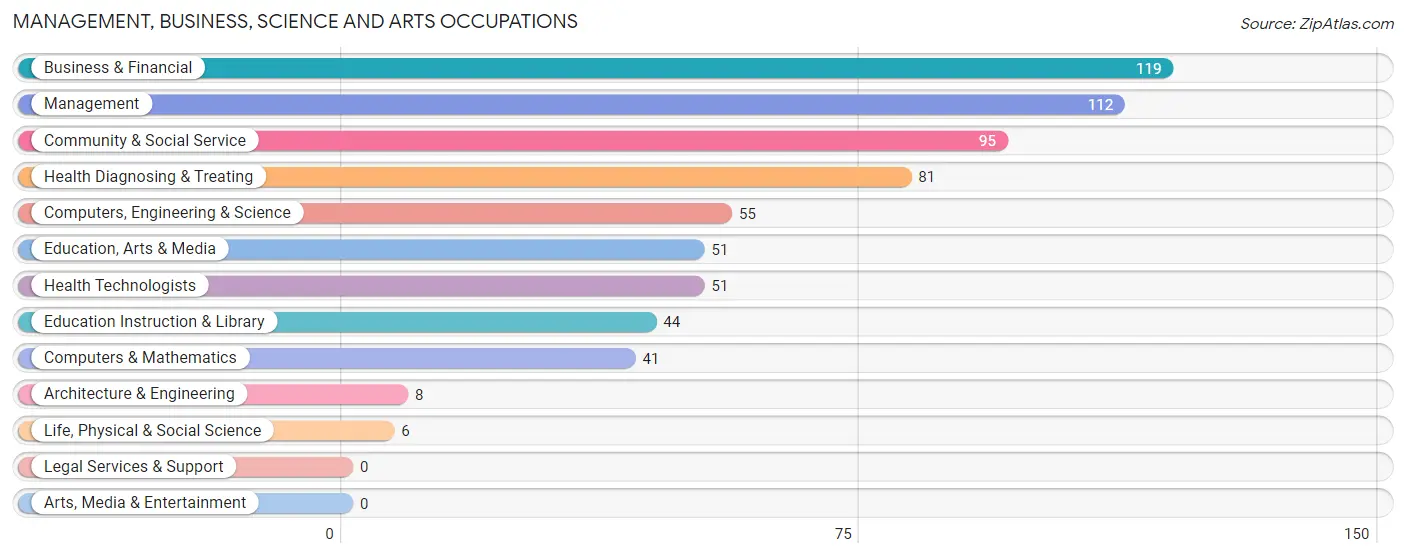
Management, Business, Science and Arts Occupations
The most common Management, Business, Science and Arts occupations in Jefferson are Business & Financial (119 | 8.2%), Management (112 | 7.7%), Community & Social Service (95 | 6.5%), Health Diagnosing & Treating (81 | 5.6%), and Computers, Engineering & Science (55 | 3.8%).
Management, Business, Science and Arts Occupations by Sex
Within the Management, Business, Science and Arts occupations in Jefferson, the most male-oriented occupations are Architecture & Engineering (100.0%), Life, Physical & Social Science (100.0%), and Management (76.8%), while the most female-oriented occupations are Health Diagnosing & Treating (100.0%), Health Technologists (100.0%), and Business & Financial (68.1%).
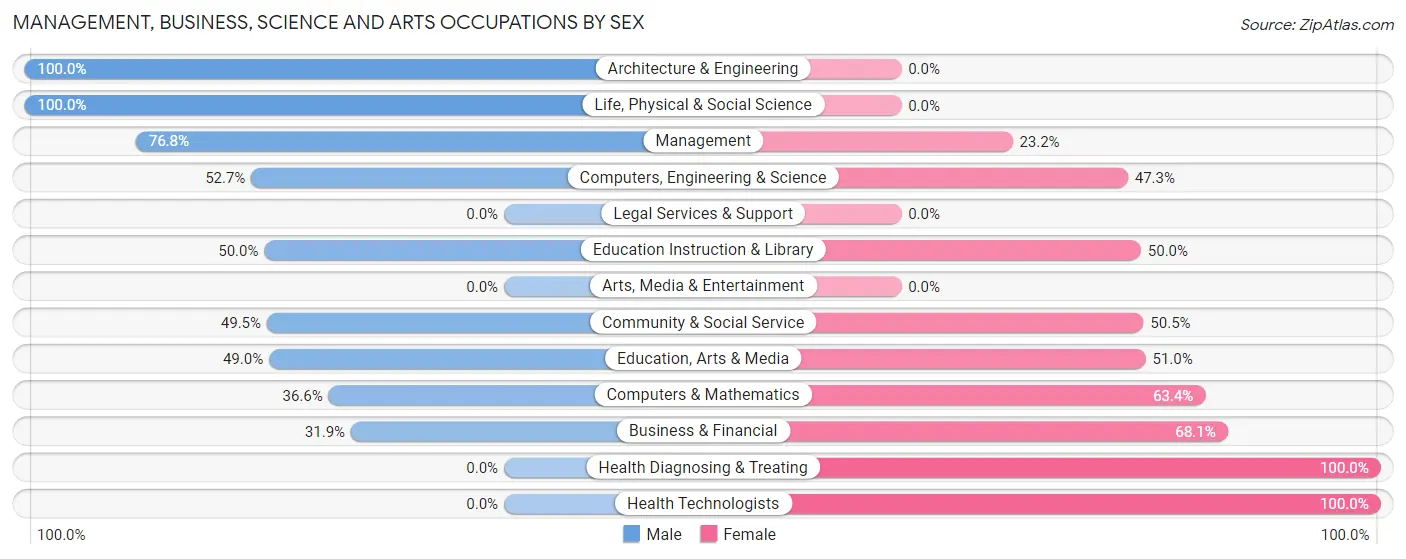
| Occupation | Male | Female |
| Management | 86 (76.8%) | 26 (23.2%) |
| Business & Financial | 38 (31.9%) | 81 (68.1%) |
| Computers, Engineering & Science | 29 (52.7%) | 26 (47.3%) |
| Computers & Mathematics | 15 (36.6%) | 26 (63.4%) |
| Architecture & Engineering | 8 (100.0%) | 0 (0.0%) |
| Life, Physical & Social Science | 6 (100.0%) | 0 (0.0%) |
| Community & Social Service | 47 (49.5%) | 48 (50.5%) |
| Education, Arts & Media | 25 (49.0%) | 26 (51.0%) |
| Legal Services & Support | 0 (0.0%) | 0 (0.0%) |
| Education Instruction & Library | 22 (50.0%) | 22 (50.0%) |
| Arts, Media & Entertainment | 0 (0.0%) | 0 (0.0%) |
| Health Diagnosing & Treating | 0 (0.0%) | 81 (100.0%) |
| Health Technologists | 0 (0.0%) | 51 (100.0%) |
| Total (Category) | 200 (43.3%) | 262 (56.7%) |
| Total (Overall) | 829 (56.8%) | 631 (43.2%) |
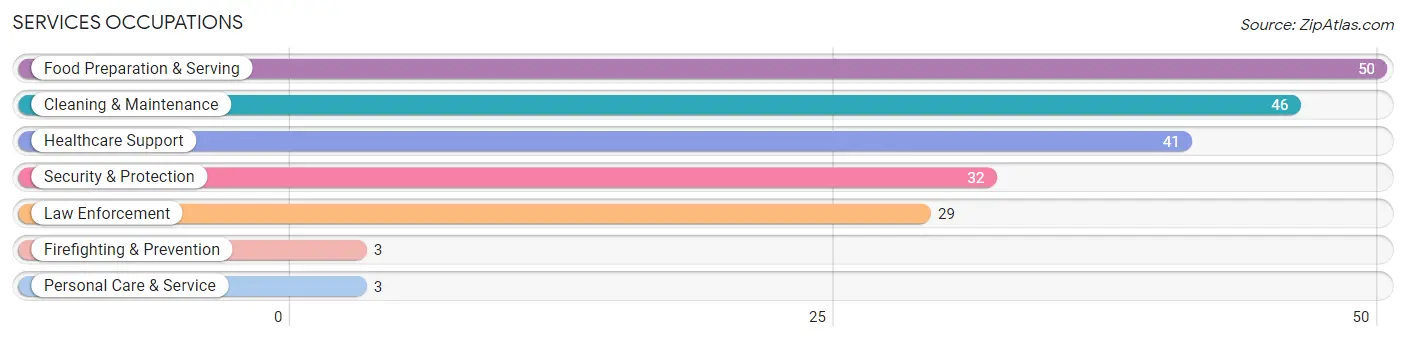
Services Occupations
The most common Services occupations in Jefferson are Food Preparation & Serving (50 | 3.4%), Cleaning & Maintenance (46 | 3.2%), Healthcare Support (41 | 2.8%), Security & Protection (32 | 2.2%), and Law Enforcement (29 | 2.0%).
Services Occupations by Sex
Within the Services occupations in Jefferson, the most male-oriented occupations are Security & Protection (100.0%), Firefighting & Prevention (100.0%), and Law Enforcement (100.0%), while the most female-oriented occupations are Personal Care & Service (100.0%), Healthcare Support (85.4%), and Food Preparation & Serving (78.0%).
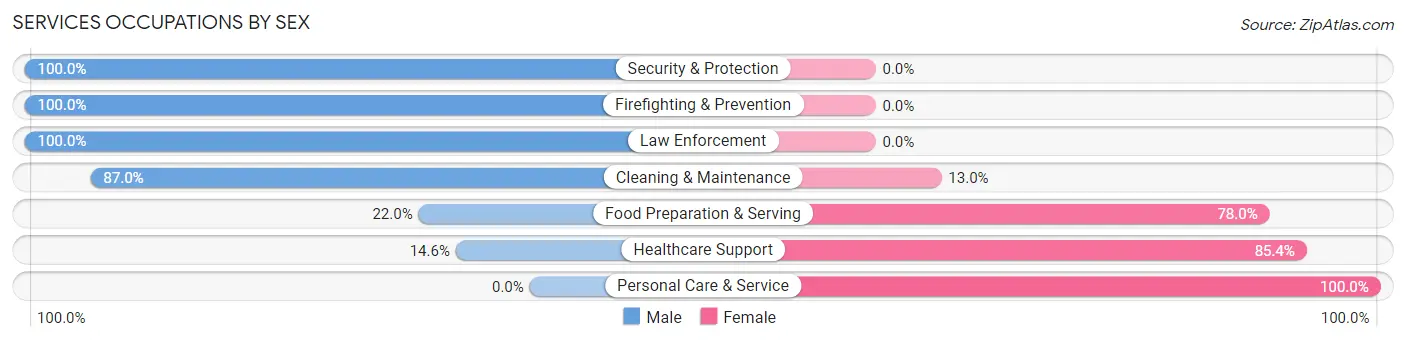
| Occupation | Male | Female |
| Healthcare Support | 6 (14.6%) | 35 (85.4%) |
| Security & Protection | 32 (100.0%) | 0 (0.0%) |
| Firefighting & Prevention | 3 (100.0%) | 0 (0.0%) |
| Law Enforcement | 29 (100.0%) | 0 (0.0%) |
| Food Preparation & Serving | 11 (22.0%) | 39 (78.0%) |
| Cleaning & Maintenance | 40 (87.0%) | 6 (13.0%) |
| Personal Care & Service | 0 (0.0%) | 3 (100.0%) |
| Total (Category) | 89 (51.7%) | 83 (48.3%) |
| Total (Overall) | 829 (56.8%) | 631 (43.2%) |
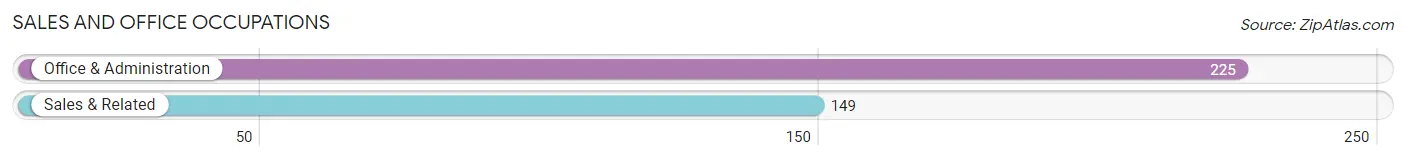
Sales and Office Occupations
The most common Sales and Office occupations in Jefferson are Office & Administration (225 | 15.4%), and Sales & Related (149 | 10.2%).
Sales and Office Occupations by Sex
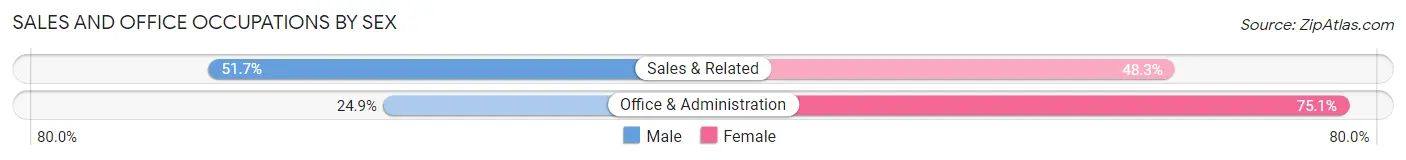
| Occupation | Male | Female |
| Sales & Related | 77 (51.7%) | 72 (48.3%) |
| Office & Administration | 56 (24.9%) | 169 (75.1%) |
| Total (Category) | 133 (35.6%) | 241 (64.4%) |
| Total (Overall) | 829 (56.8%) | 631 (43.2%) |
Natural Resources, Construction and Maintenance Occupations
The most common Natural Resources, Construction and Maintenance occupations in Jefferson are Farming, Fishing & Forestry (120 | 8.2%), Installation, Maintenance & Repair (98 | 6.7%), and Construction & Extraction (65 | 4.4%).
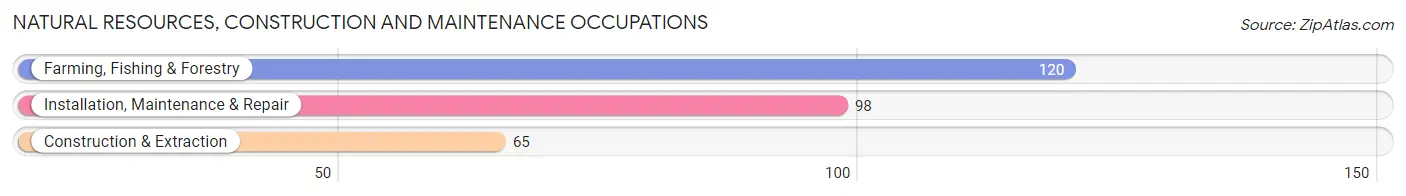
Natural Resources, Construction and Maintenance Occupations by Sex
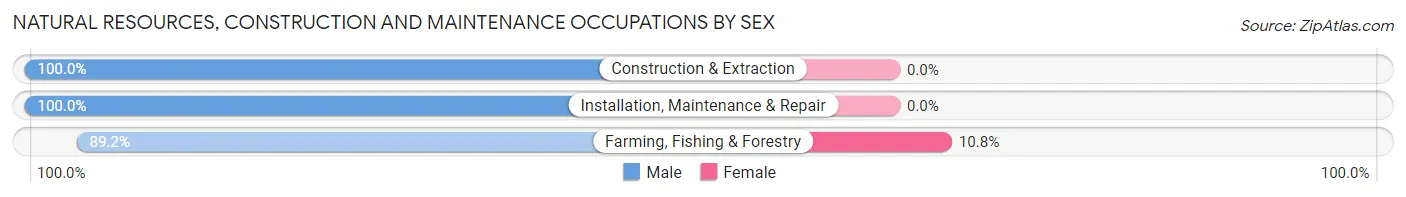
| Occupation | Male | Female |
| Farming, Fishing & Forestry | 107 (89.2%) | 13 (10.8%) |
| Construction & Extraction | 65 (100.0%) | 0 (0.0%) |
| Installation, Maintenance & Repair | 98 (100.0%) | 0 (0.0%) |
| Total (Category) | 270 (95.4%) | 13 (4.6%) |
| Total (Overall) | 829 (56.8%) | 631 (43.2%) |
Production, Transportation and Moving Occupations
The most common Production, Transportation and Moving occupations in Jefferson are Material Moving (78 | 5.3%), Production (49 | 3.4%), and Transportation (42 | 2.9%).
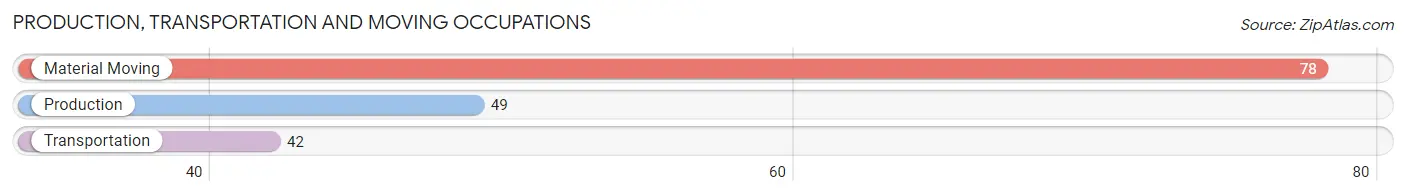
Production, Transportation and Moving Occupations by Sex
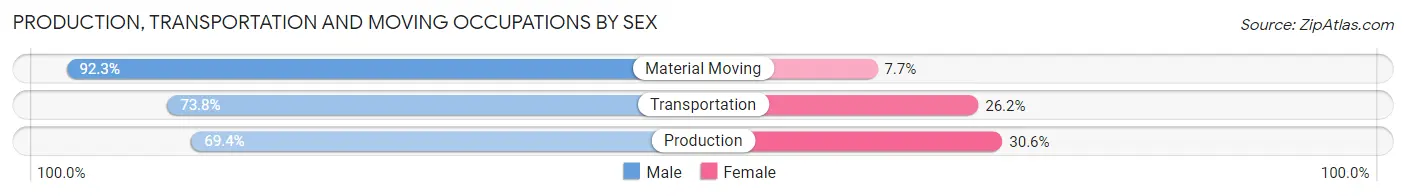
| Occupation | Male | Female |
| Production | 34 (69.4%) | 15 (30.6%) |
| Transportation | 31 (73.8%) | 11 (26.2%) |
| Material Moving | 72 (92.3%) | 6 (7.7%) |
| Total (Category) | 137 (81.1%) | 32 (18.9%) |
| Total (Overall) | 829 (56.8%) | 631 (43.2%) |
Employment Industries by Sex in Jefferson
Employment Industries in Jefferson
The major employment industries in Jefferson include Retail Trade (168 | 11.5%), Health Care & Social Assistance (168 | 11.5%), Public Administration (157 | 10.7%), Manufacturing (152 | 10.4%), and Transportation & Warehousing (147 | 10.1%).
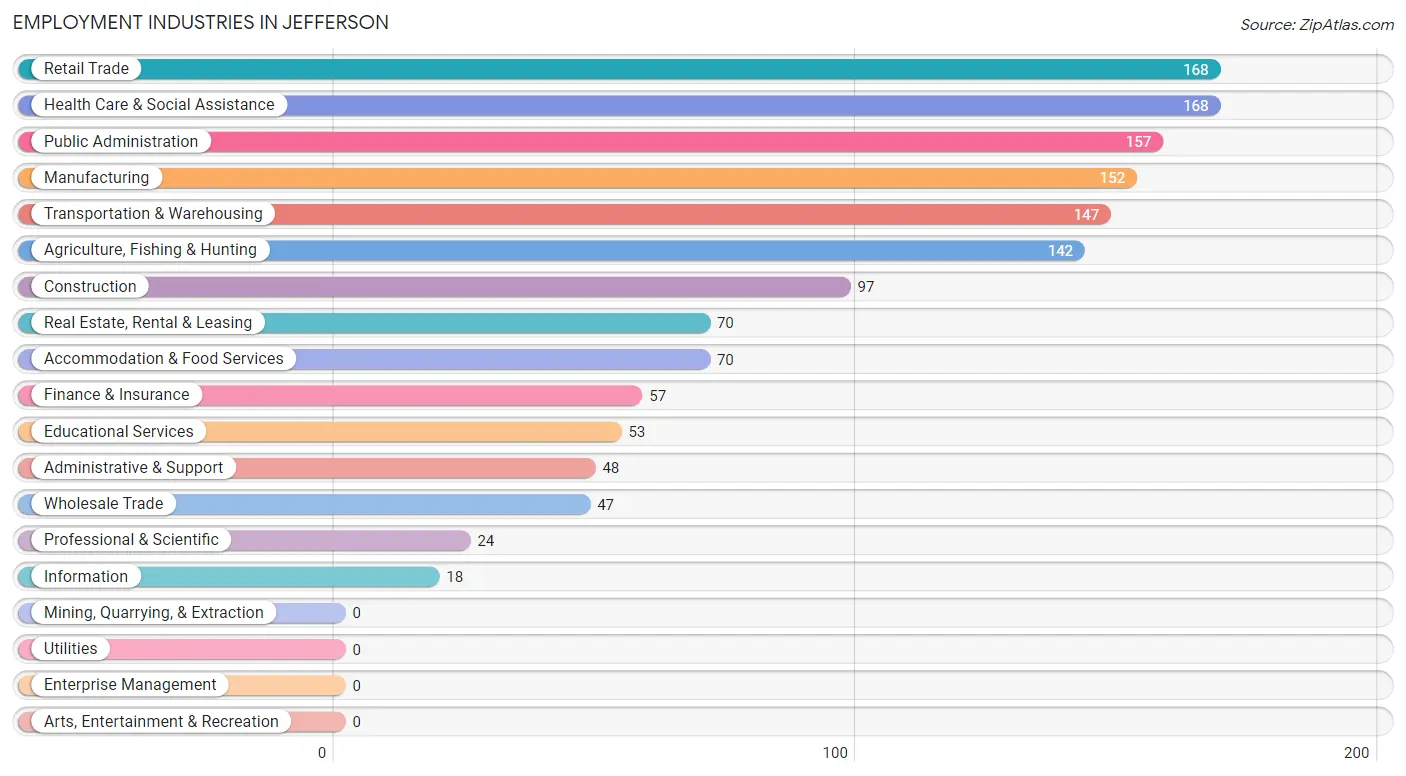
Employment Industries by Sex in Jefferson
The Jefferson industries that see more men than women are Administrative & Support (100.0%), Construction (94.9%), and Wholesale Trade (89.4%), whereas the industries that tend to have a higher number of women are Health Care & Social Assistance (90.5%), Finance & Insurance (84.2%), and Information (83.3%).
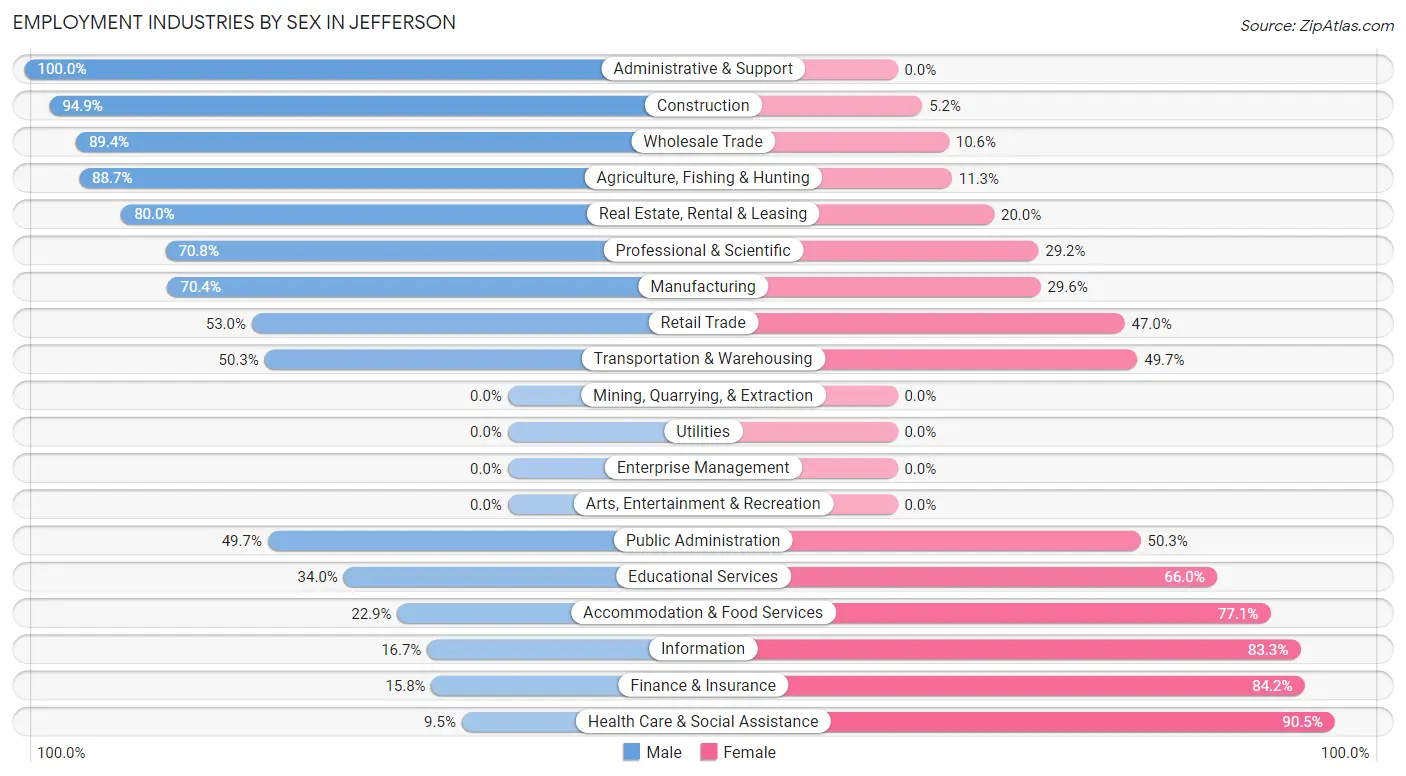
| Industry | Male | Female |
| Agriculture, Fishing & Hunting | 126 (88.7%) | 16 (11.3%) |
| Mining, Quarrying, & Extraction | 0 (0.0%) | 0 (0.0%) |
| Construction | 92 (94.9%) | 5 (5.1%) |
| Manufacturing | 107 (70.4%) | 45 (29.6%) |
| Wholesale Trade | 42 (89.4%) | 5 (10.6%) |
| Retail Trade | 89 (53.0%) | 79 (47.0%) |
| Transportation & Warehousing | 74 (50.3%) | 73 (49.7%) |
| Utilities | 0 (0.0%) | 0 (0.0%) |
| Information | 3 (16.7%) | 15 (83.3%) |
| Finance & Insurance | 9 (15.8%) | 48 (84.2%) |
| Real Estate, Rental & Leasing | 56 (80.0%) | 14 (20.0%) |
| Professional & Scientific | 17 (70.8%) | 7 (29.2%) |
| Enterprise Management | 0 (0.0%) | 0 (0.0%) |
| Administrative & Support | 48 (100.0%) | 0 (0.0%) |
| Educational Services | 18 (34.0%) | 35 (66.0%) |
| Health Care & Social Assistance | 16 (9.5%) | 152 (90.5%) |
| Arts, Entertainment & Recreation | 0 (0.0%) | 0 (0.0%) |
| Accommodation & Food Services | 16 (22.9%) | 54 (77.1%) |
| Public Administration | 78 (49.7%) | 79 (50.3%) |
| Total | 829 (56.8%) | 631 (43.2%) |
Education in Jefferson
School Enrollment in Jefferson
The most common levels of schooling among the 918 students in Jefferson are elementary school (315 | 34.3%), middle school (246 | 26.8%), and high school (226 | 24.6%).
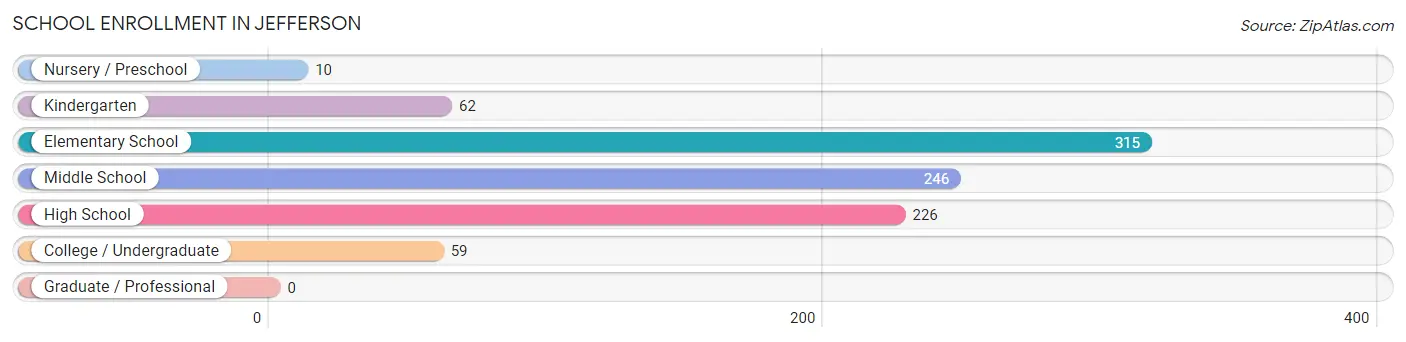
| School Level | # Students | % Students |
| Nursery / Preschool | 10 | 1.1% |
| Kindergarten | 62 | 6.8% |
| Elementary School | 315 | 34.3% |
| Middle School | 246 | 26.8% |
| High School | 226 | 24.6% |
| College / Undergraduate | 59 | 6.4% |
| Graduate / Professional | 0 | 0.0% |
| Total | 918 | 100.0% |
School Enrollment by Age by Funding Source in Jefferson
Out of a total of 918 students who are enrolled in schools in Jefferson, 82 (8.9%) attend a private institution, while the remaining 836 (91.1%) are enrolled in public schools. The age group of 3 to 4 year olds has the highest likelihood of being enrolled in private schools, with 10 (100.0% in the age bracket) enrolled. Conversely, the age group of 18 to 19 year olds has the lowest likelihood of being enrolled in a private school, with 14 (100.0% in the age bracket) attending a public institution.
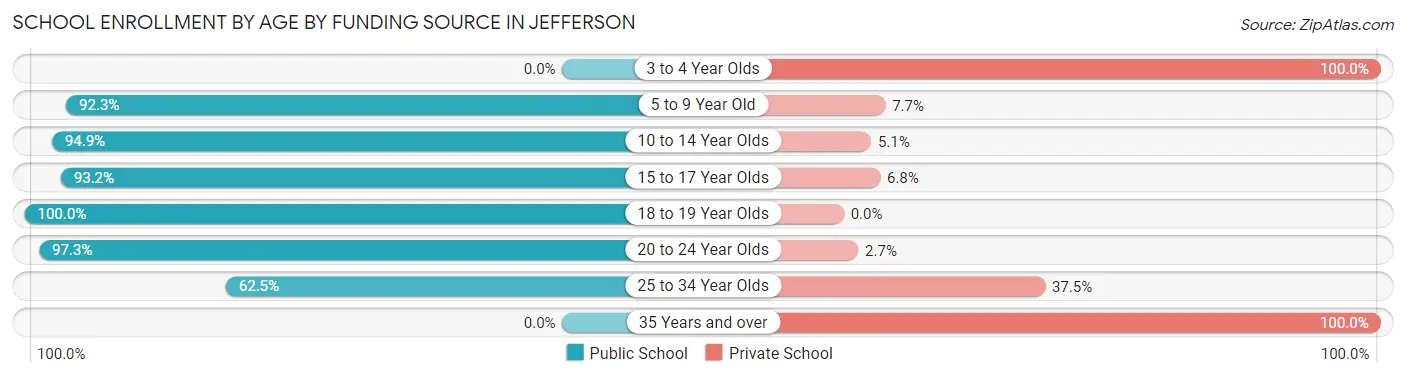
| Age Bracket | Public School | Private School |
| 3 to 4 Year Olds | 0 (0.0%) | 10 (100.0%) |
| 5 to 9 Year Old | 322 (92.3%) | 27 (7.7%) |
| 10 to 14 Year Olds | 261 (94.9%) | 14 (5.1%) |
| 15 to 17 Year Olds | 193 (93.2%) | 14 (6.8%) |
| 18 to 19 Year Olds | 14 (100.0%) | 0 (0.0%) |
| 20 to 24 Year Olds | 36 (97.3%) | 1 (2.7%) |
| 25 to 34 Year Olds | 10 (62.5%) | 6 (37.5%) |
| 35 Years and over | 0 (0.0%) | 10 (100.0%) |
| Total | 836 (91.1%) | 82 (8.9%) |
Educational Attainment by Field of Study in Jefferson
Business (73 | 19.5%), psychology (66 | 17.6%), science & technology (62 | 16.5%), education (43 | 11.5%), and computers & mathematics (33 | 8.8%) are the most common fields of study among 375 individuals in Jefferson who have obtained a bachelor's degree or higher.
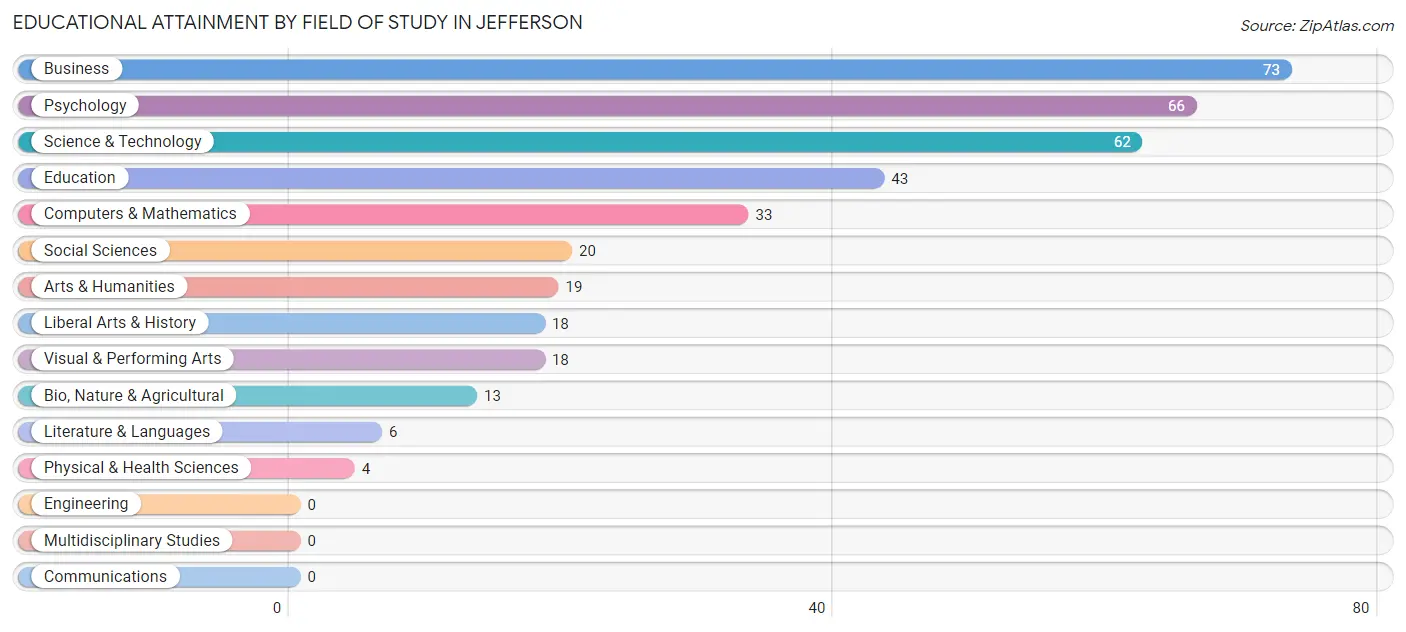
| Field of Study | # Graduates | % Graduates |
| Computers & Mathematics | 33 | 8.8% |
| Bio, Nature & Agricultural | 13 | 3.5% |
| Physical & Health Sciences | 4 | 1.1% |
| Psychology | 66 | 17.6% |
| Social Sciences | 20 | 5.3% |
| Engineering | 0 | 0.0% |
| Multidisciplinary Studies | 0 | 0.0% |
| Science & Technology | 62 | 16.5% |
| Business | 73 | 19.5% |
| Education | 43 | 11.5% |
| Literature & Languages | 6 | 1.6% |
| Liberal Arts & History | 18 | 4.8% |
| Visual & Performing Arts | 18 | 4.8% |
| Communications | 0 | 0.0% |
| Arts & Humanities | 19 | 5.1% |
| Total | 375 | 100.0% |
Transportation & Commute in Jefferson
Vehicle Availability by Sex in Jefferson
The most prevalent vehicle ownership categories in Jefferson are males with 3 vehicles (346, accounting for 41.3%) and females with 3 vehicles (301, making up 56.6%).
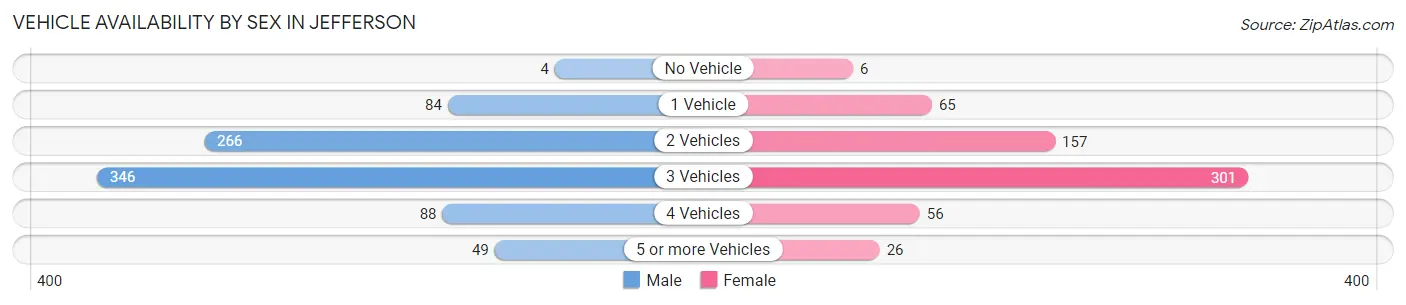
| Vehicles Available | Male | Female |
| No Vehicle | 4 (0.5%) | 6 (1.0%) |
| 1 Vehicle | 84 (10.0%) | 65 (10.6%) |
| 2 Vehicles | 266 (31.8%) | 157 (25.7%) |
| 3 Vehicles | 346 (41.3%) | 301 (49.3%) |
| 4 Vehicles | 88 (10.5%) | 56 (9.2%) |
| 5 or more Vehicles | 49 (5.9%) | 26 (4.3%) |
| Total | 837 (100.0%) | 611 (100.0%) |
Commute Time in Jefferson
The most frequently occuring commute durations in Jefferson are 30 to 34 minutes (358 commuters, 28.1%), 20 to 24 minutes (233 commuters, 18.3%), and 15 to 19 minutes (198 commuters, 15.5%).
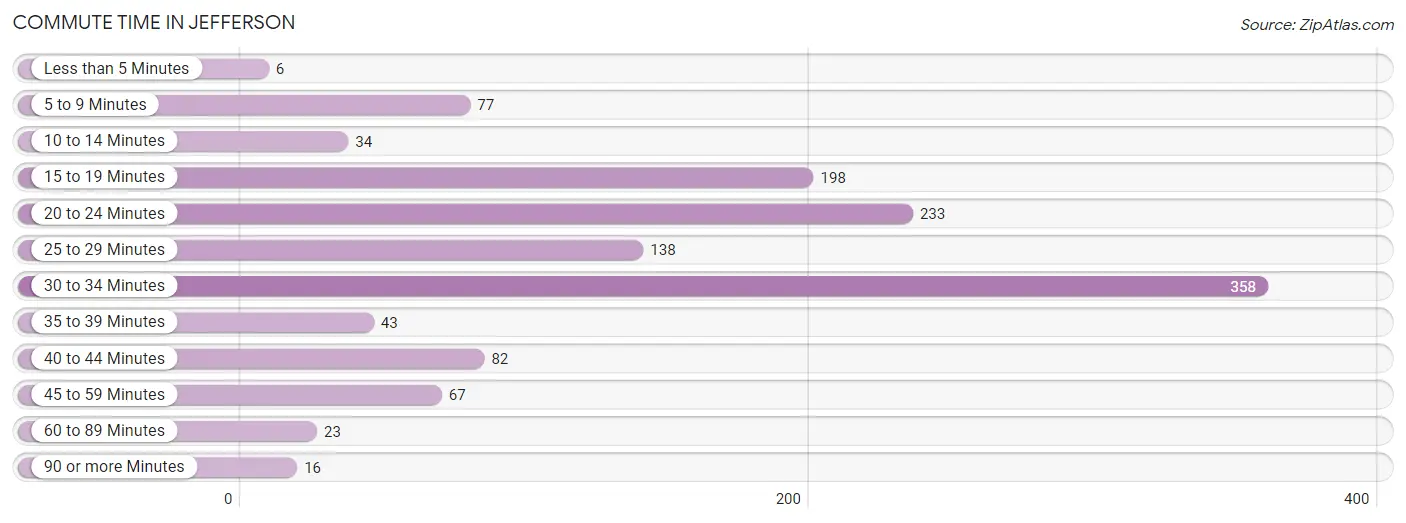
| Commute Time | # Commuters | % Commuters |
| Less than 5 Minutes | 6 | 0.5% |
| 5 to 9 Minutes | 77 | 6.0% |
| 10 to 14 Minutes | 34 | 2.7% |
| 15 to 19 Minutes | 198 | 15.5% |
| 20 to 24 Minutes | 233 | 18.3% |
| 25 to 29 Minutes | 138 | 10.8% |
| 30 to 34 Minutes | 358 | 28.1% |
| 35 to 39 Minutes | 43 | 3.4% |
| 40 to 44 Minutes | 82 | 6.4% |
| 45 to 59 Minutes | 67 | 5.2% |
| 60 to 89 Minutes | 23 | 1.8% |
| 90 or more Minutes | 16 | 1.3% |
Commute Time by Sex in Jefferson
The most common commute times in Jefferson are 30 to 34 minutes (222 commuters, 28.9%) for males and 30 to 34 minutes (136 commuters, 26.8%) for females.
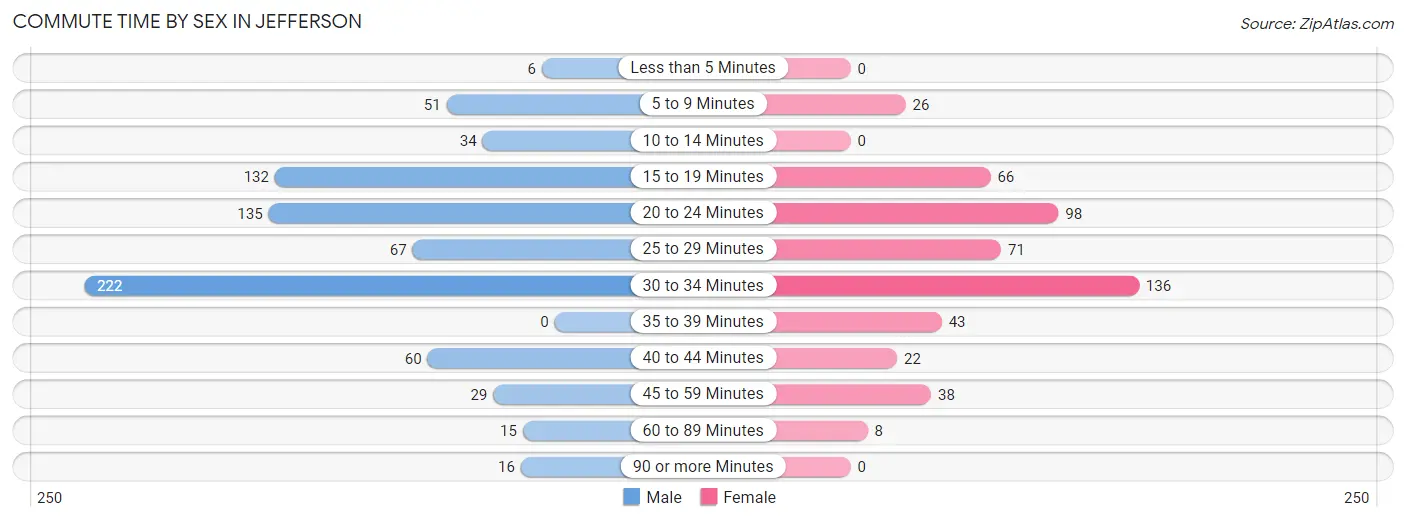
| Commute Time | Male | Female |
| Less than 5 Minutes | 6 (0.8%) | 0 (0.0%) |
| 5 to 9 Minutes | 51 (6.7%) | 26 (5.1%) |
| 10 to 14 Minutes | 34 (4.4%) | 0 (0.0%) |
| 15 to 19 Minutes | 132 (17.2%) | 66 (13.0%) |
| 20 to 24 Minutes | 135 (17.6%) | 98 (19.3%) |
| 25 to 29 Minutes | 67 (8.7%) | 71 (14.0%) |
| 30 to 34 Minutes | 222 (28.9%) | 136 (26.8%) |
| 35 to 39 Minutes | 0 (0.0%) | 43 (8.5%) |
| 40 to 44 Minutes | 60 (7.8%) | 22 (4.3%) |
| 45 to 59 Minutes | 29 (3.8%) | 38 (7.5%) |
| 60 to 89 Minutes | 15 (2.0%) | 8 (1.6%) |
| 90 or more Minutes | 16 (2.1%) | 0 (0.0%) |
Time of Departure to Work by Sex in Jefferson
The most frequent times of departure to work in Jefferson are 6:00 AM to 6:29 AM (199, 26.0%) for males and 5:30 AM to 5:59 AM (80, 15.8%) for females.
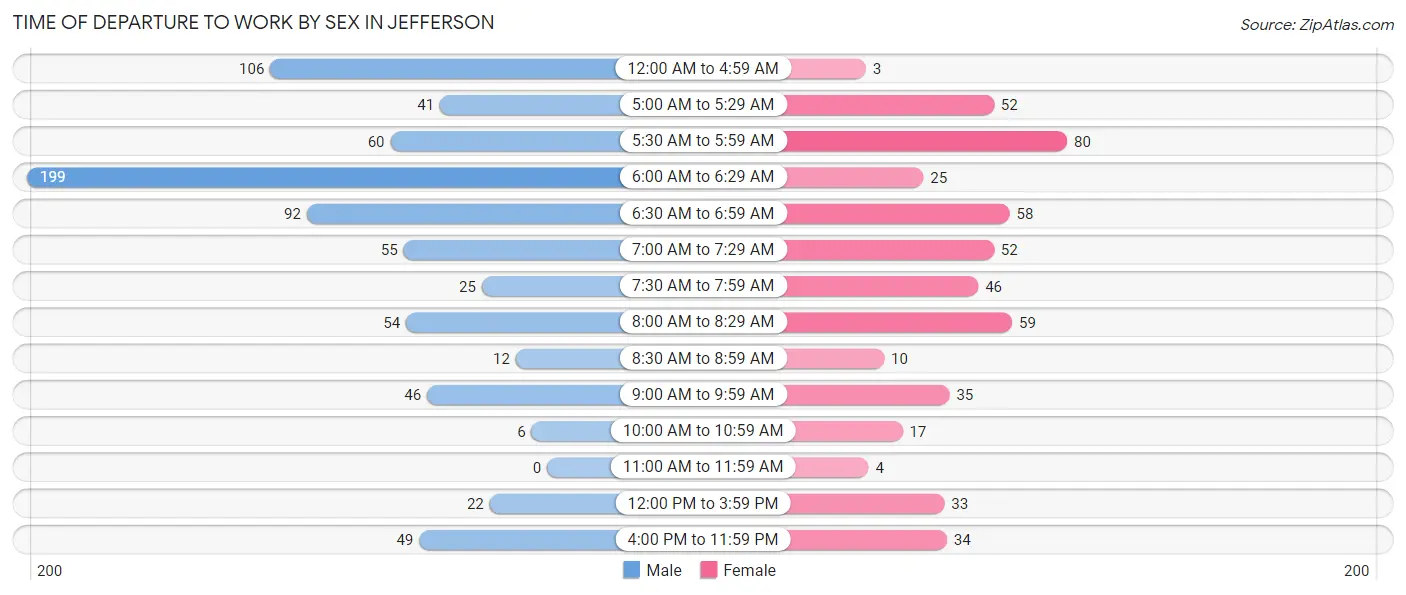
| Time of Departure | Male | Female |
| 12:00 AM to 4:59 AM | 106 (13.8%) | 3 (0.6%) |
| 5:00 AM to 5:29 AM | 41 (5.3%) | 52 (10.2%) |
| 5:30 AM to 5:59 AM | 60 (7.8%) | 80 (15.8%) |
| 6:00 AM to 6:29 AM | 199 (26.0%) | 25 (4.9%) |
| 6:30 AM to 6:59 AM | 92 (12.0%) | 58 (11.4%) |
| 7:00 AM to 7:29 AM | 55 (7.2%) | 52 (10.2%) |
| 7:30 AM to 7:59 AM | 25 (3.3%) | 46 (9.1%) |
| 8:00 AM to 8:29 AM | 54 (7.0%) | 59 (11.6%) |
| 8:30 AM to 8:59 AM | 12 (1.6%) | 10 (2.0%) |
| 9:00 AM to 9:59 AM | 46 (6.0%) | 35 (6.9%) |
| 10:00 AM to 10:59 AM | 6 (0.8%) | 17 (3.4%) |
| 11:00 AM to 11:59 AM | 0 (0.0%) | 4 (0.8%) |
| 12:00 PM to 3:59 PM | 22 (2.9%) | 33 (6.5%) |
| 4:00 PM to 11:59 PM | 49 (6.4%) | 34 (6.7%) |
| Total | 767 (100.0%) | 508 (100.0%) |
Housing Occupancy in Jefferson
Occupancy by Ownership in Jefferson
Of the total 969 dwellings in Jefferson, owner-occupied units account for 806 (83.2%), while renter-occupied units make up 163 (16.8%).
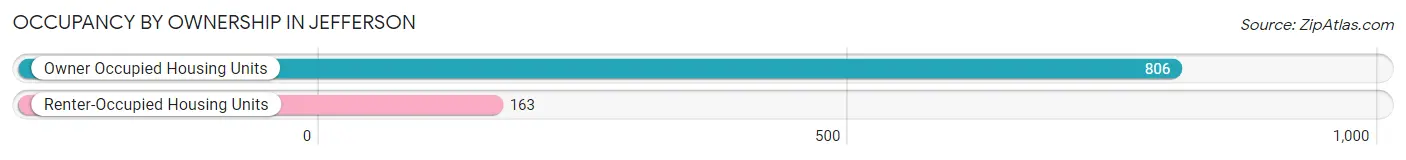
| Occupancy | # Housing Units | % Housing Units |
| Owner Occupied Housing Units | 806 | 83.2% |
| Renter-Occupied Housing Units | 163 | 16.8% |
| Total Occupied Housing Units | 969 | 100.0% |
Occupancy by Household Size in Jefferson
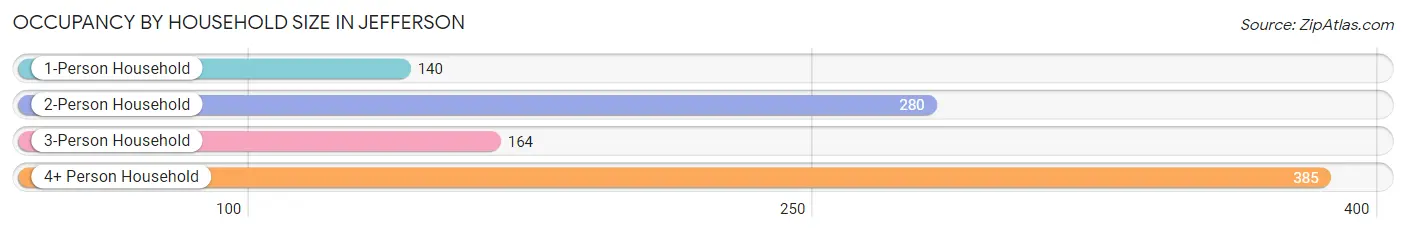
| Household Size | # Housing Units | % Housing Units |
| 1-Person Household | 140 | 14.4% |
| 2-Person Household | 280 | 28.9% |
| 3-Person Household | 164 | 16.9% |
| 4+ Person Household | 385 | 39.7% |
| Total Housing Units | 969 | 100.0% |
Occupancy by Ownership by Household Size in Jefferson
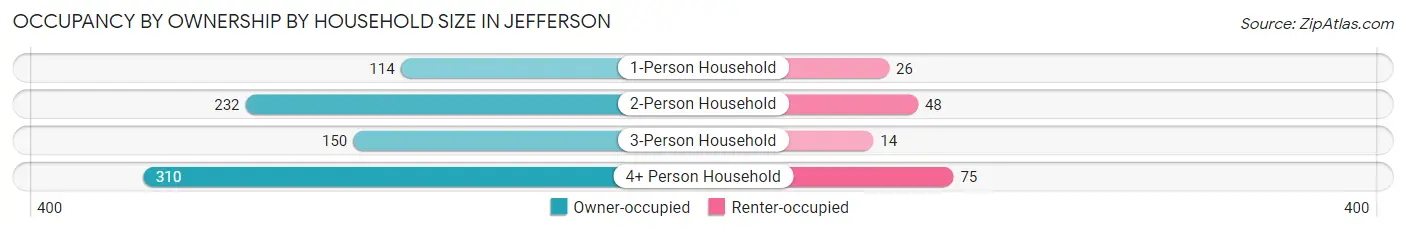
| Household Size | Owner-occupied | Renter-occupied |
| 1-Person Household | 114 (81.4%) | 26 (18.6%) |
| 2-Person Household | 232 (82.9%) | 48 (17.1%) |
| 3-Person Household | 150 (91.5%) | 14 (8.5%) |
| 4+ Person Household | 310 (80.5%) | 75 (19.5%) |
| Total Housing Units | 806 (83.2%) | 163 (16.8%) |
Occupancy by Educational Attainment in Jefferson
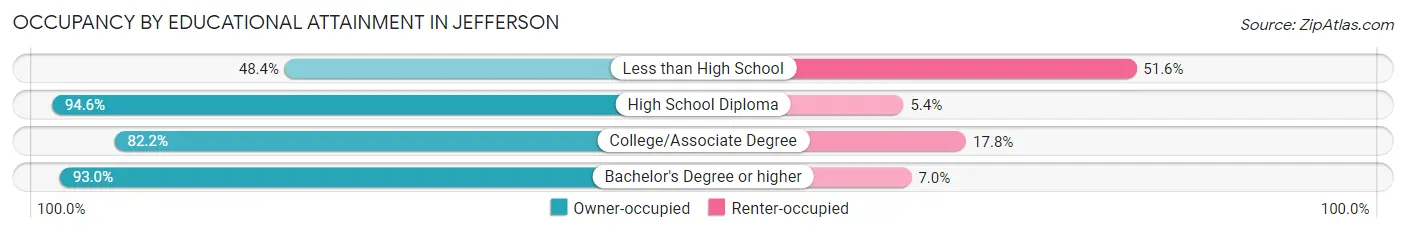
| Household Size | Owner-occupied | Renter-occupied |
| Less than High School | 61 (48.4%) | 65 (51.6%) |
| High School Diploma | 245 (94.6%) | 14 (5.4%) |
| College/Associate Degree | 327 (82.2%) | 71 (17.8%) |
| Bachelor's Degree or higher | 173 (93.0%) | 13 (7.0%) |
Occupancy by Age of Householder in Jefferson
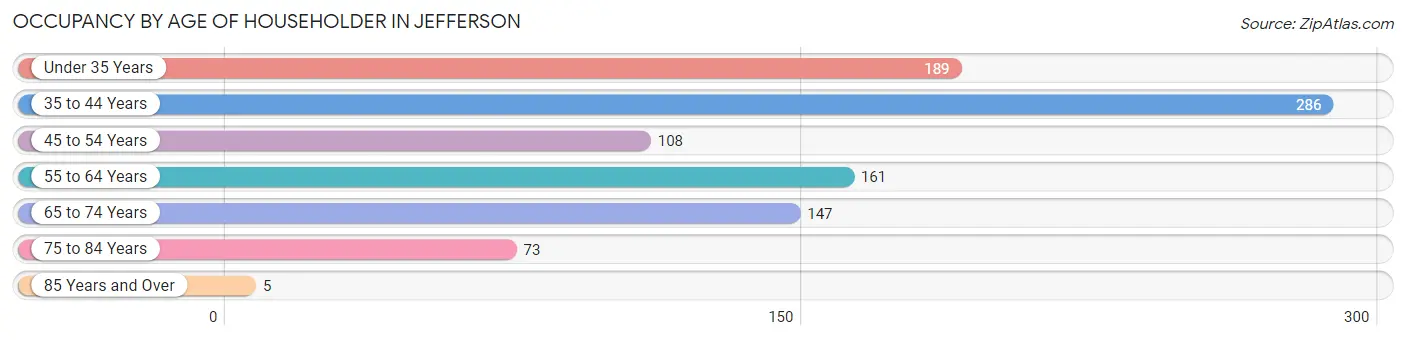
| Age Bracket | # Households | % Households |
| Under 35 Years | 189 | 19.5% |
| 35 to 44 Years | 286 | 29.5% |
| 45 to 54 Years | 108 | 11.2% |
| 55 to 64 Years | 161 | 16.6% |
| 65 to 74 Years | 147 | 15.2% |
| 75 to 84 Years | 73 | 7.5% |
| 85 Years and Over | 5 | 0.5% |
| Total | 969 | 100.0% |
Housing Finances in Jefferson
Median Income by Occupancy in Jefferson
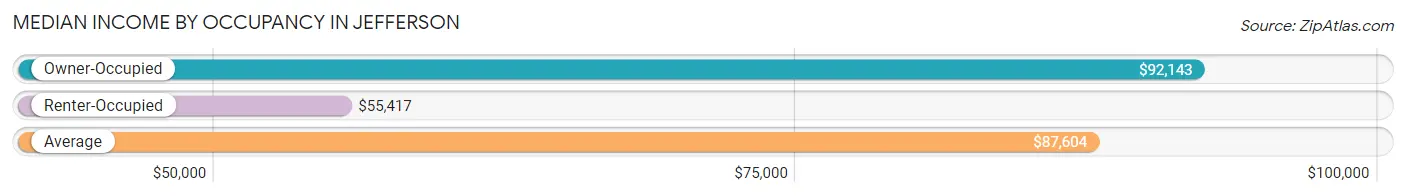
| Occupancy Type | # Households | Median Income |
| Owner-Occupied | 806 (83.2%) | $92,143 |
| Renter-Occupied | 163 (16.8%) | $55,417 |
| Average | 969 (100.0%) | $87,604 |
Occupancy by Householder Income Bracket in Jefferson
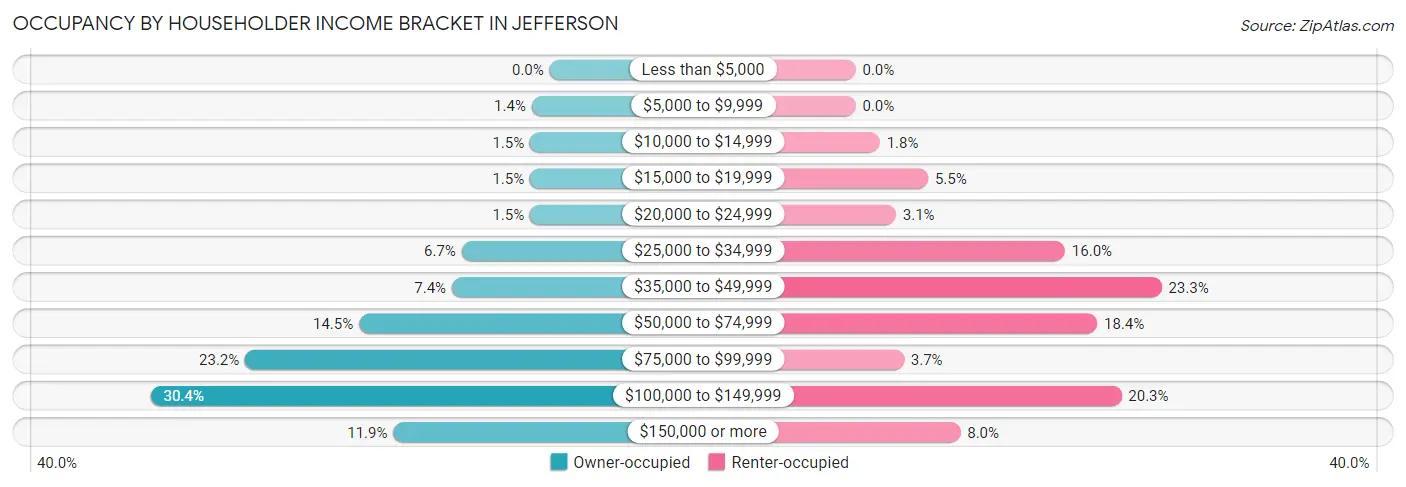
| Income Bracket | Owner-occupied | Renter-occupied |
| Less than $5,000 | 0 (0.0%) | 0 (0.0%) |
| $5,000 to $9,999 | 11 (1.4%) | 0 (0.0%) |
| $10,000 to $14,999 | 12 (1.5%) | 3 (1.8%) |
| $15,000 to $19,999 | 12 (1.5%) | 9 (5.5%) |
| $20,000 to $24,999 | 12 (1.5%) | 5 (3.1%) |
| $25,000 to $34,999 | 54 (6.7%) | 26 (16.0%) |
| $35,000 to $49,999 | 60 (7.4%) | 38 (23.3%) |
| $50,000 to $74,999 | 117 (14.5%) | 30 (18.4%) |
| $75,000 to $99,999 | 187 (23.2%) | 6 (3.7%) |
| $100,000 to $149,999 | 245 (30.4%) | 33 (20.3%) |
| $150,000 or more | 96 (11.9%) | 13 (8.0%) |
| Total | 806 (100.0%) | 163 (100.0%) |
Monthly Housing Cost Tiers in Jefferson
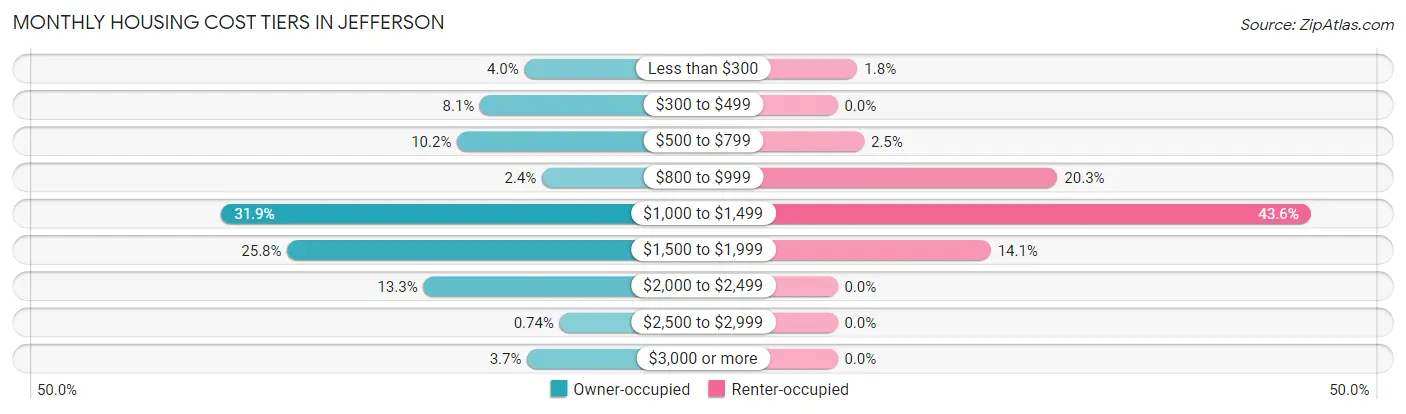
| Monthly Cost | Owner-occupied | Renter-occupied |
| Less than $300 | 32 (4.0%) | 3 (1.8%) |
| $300 to $499 | 65 (8.1%) | 0 (0.0%) |
| $500 to $799 | 82 (10.2%) | 4 (2.5%) |
| $800 to $999 | 19 (2.4%) | 33 (20.3%) |
| $1,000 to $1,499 | 257 (31.9%) | 71 (43.6%) |
| $1,500 to $1,999 | 208 (25.8%) | 23 (14.1%) |
| $2,000 to $2,499 | 107 (13.3%) | 0 (0.0%) |
| $2,500 to $2,999 | 6 (0.7%) | 0 (0.0%) |
| $3,000 or more | 30 (3.7%) | 0 (0.0%) |
| Total | 806 (100.0%) | 163 (100.0%) |
Physical Housing Characteristics in Jefferson
Housing Structures in Jefferson
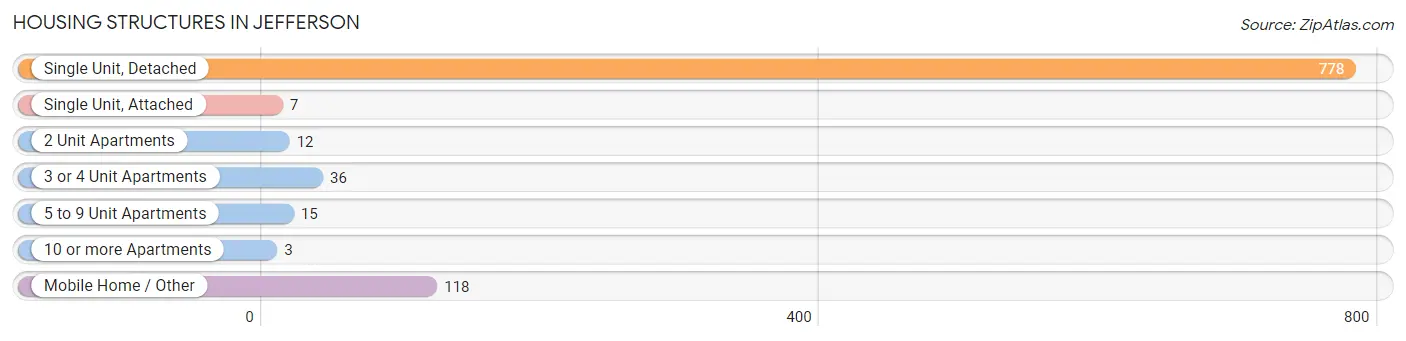
| Structure Type | # Housing Units | % Housing Units |
| Single Unit, Detached | 778 | 80.3% |
| Single Unit, Attached | 7 | 0.7% |
| 2 Unit Apartments | 12 | 1.2% |
| 3 or 4 Unit Apartments | 36 | 3.7% |
| 5 to 9 Unit Apartments | 15 | 1.5% |
| 10 or more Apartments | 3 | 0.3% |
| Mobile Home / Other | 118 | 12.2% |
| Total | 969 | 100.0% |
Housing Structures by Occupancy in Jefferson
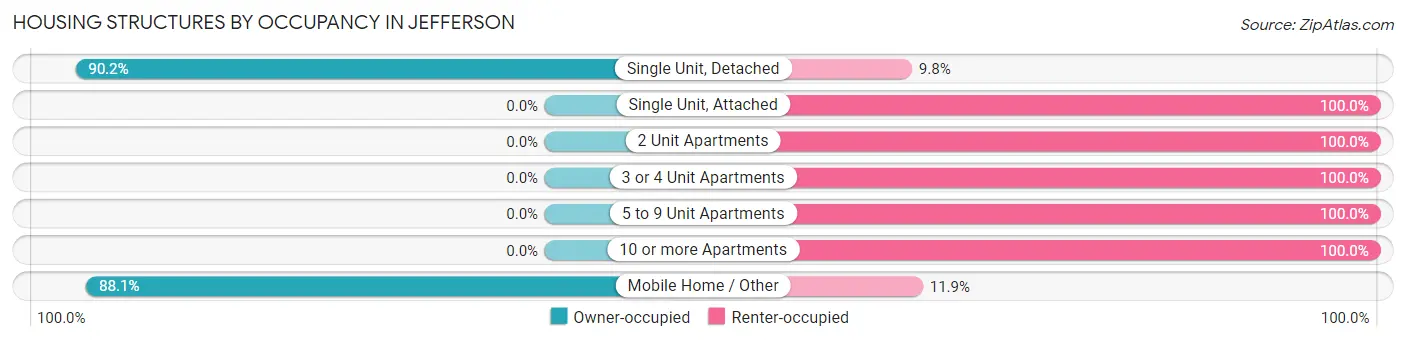
| Structure Type | Owner-occupied | Renter-occupied |
| Single Unit, Detached | 702 (90.2%) | 76 (9.8%) |
| Single Unit, Attached | 0 (0.0%) | 7 (100.0%) |
| 2 Unit Apartments | 0 (0.0%) | 12 (100.0%) |
| 3 or 4 Unit Apartments | 0 (0.0%) | 36 (100.0%) |
| 5 to 9 Unit Apartments | 0 (0.0%) | 15 (100.0%) |
| 10 or more Apartments | 0 (0.0%) | 3 (100.0%) |
| Mobile Home / Other | 104 (88.1%) | 14 (11.9%) |
| Total | 806 (83.2%) | 163 (16.8%) |
Housing Structures by Number of Rooms in Jefferson
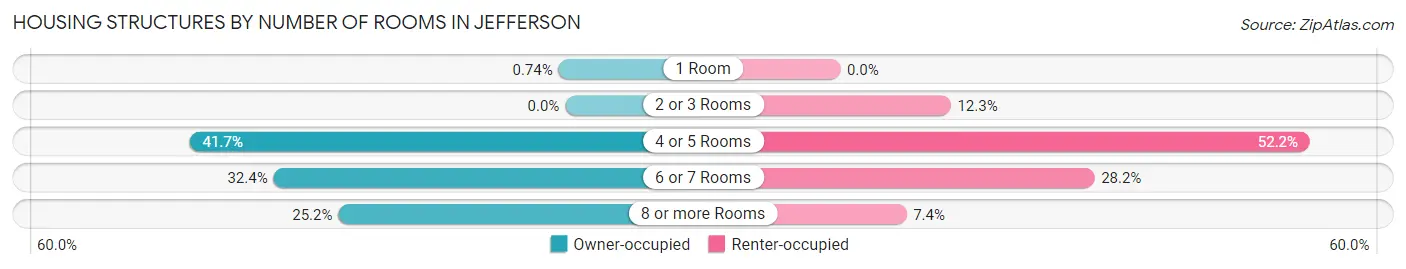
| Number of Rooms | Owner-occupied | Renter-occupied |
| 1 Room | 6 (0.7%) | 0 (0.0%) |
| 2 or 3 Rooms | 0 (0.0%) | 20 (12.3%) |
| 4 or 5 Rooms | 336 (41.7%) | 85 (52.1%) |
| 6 or 7 Rooms | 261 (32.4%) | 46 (28.2%) |
| 8 or more Rooms | 203 (25.2%) | 12 (7.4%) |
| Total | 806 (100.0%) | 163 (100.0%) |
Housing Structure by Heating Type in Jefferson
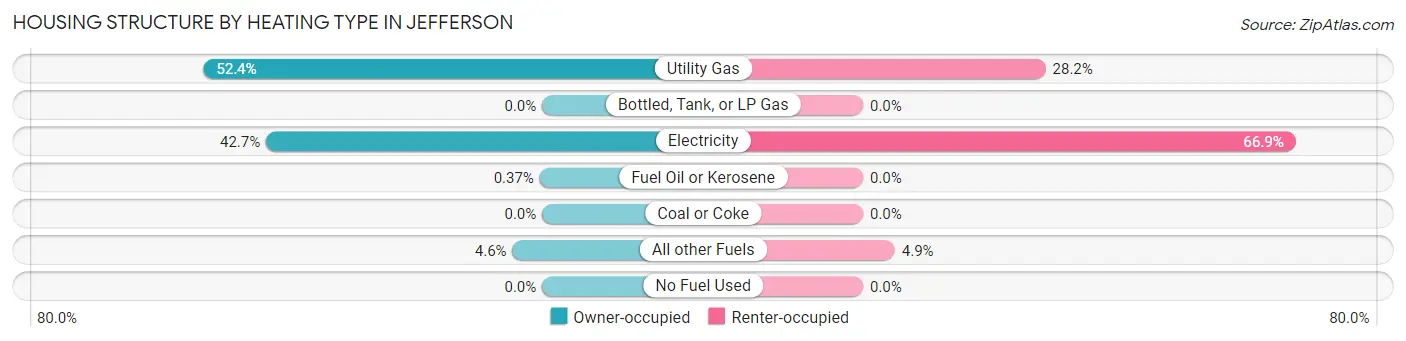
| Heating Type | Owner-occupied | Renter-occupied |
| Utility Gas | 422 (52.4%) | 46 (28.2%) |
| Bottled, Tank, or LP Gas | 0 (0.0%) | 0 (0.0%) |
| Electricity | 344 (42.7%) | 109 (66.9%) |
| Fuel Oil or Kerosene | 3 (0.4%) | 0 (0.0%) |
| Coal or Coke | 0 (0.0%) | 0 (0.0%) |
| All other Fuels | 37 (4.6%) | 8 (4.9%) |
| No Fuel Used | 0 (0.0%) | 0 (0.0%) |
| Total | 806 (100.0%) | 163 (100.0%) |
Household Vehicle Usage in Jefferson
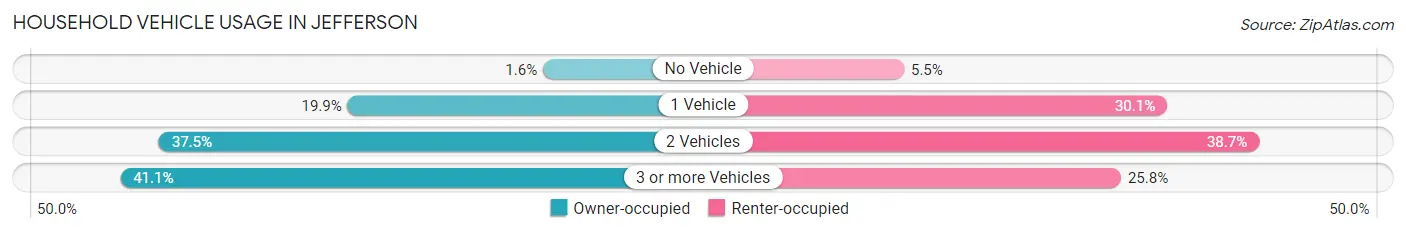
| Vehicles per Household | Owner-occupied | Renter-occupied |
| No Vehicle | 13 (1.6%) | 9 (5.5%) |
| 1 Vehicle | 160 (19.9%) | 49 (30.1%) |
| 2 Vehicles | 302 (37.5%) | 63 (38.7%) |
| 3 or more Vehicles | 331 (41.1%) | 42 (25.8%) |
| Total | 806 (100.0%) | 163 (100.0%) |
Real Estate & Mortgages in Jefferson
Real Estate and Mortgage Overview in Jefferson
| Characteristic | Without Mortgage | With Mortgage |
| Housing Units | 167 | 639 |
| Median Property Value | $325,500 | $325,500 |
| Median Household Income | $51,375 | $87 |
| Monthly Housing Costs | $467 | $30 |
| Real Estate Taxes | $2,085 | $10 |
Property Value by Mortgage Status in Jefferson
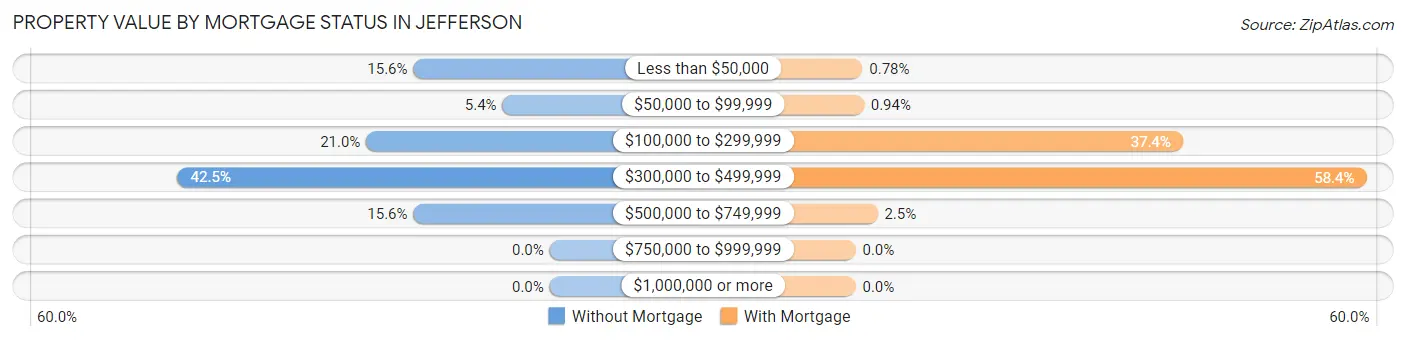
| Property Value | Without Mortgage | With Mortgage |
| Less than $50,000 | 26 (15.6%) | 5 (0.8%) |
| $50,000 to $99,999 | 9 (5.4%) | 6 (0.9%) |
| $100,000 to $299,999 | 35 (21.0%) | 239 (37.4%) |
| $300,000 to $499,999 | 71 (42.5%) | 373 (58.4%) |
| $500,000 to $749,999 | 26 (15.6%) | 16 (2.5%) |
| $750,000 to $999,999 | 0 (0.0%) | 0 (0.0%) |
| $1,000,000 or more | 0 (0.0%) | 0 (0.0%) |
| Total | 167 (100.0%) | 639 (100.0%) |
Household Income by Mortgage Status in Jefferson
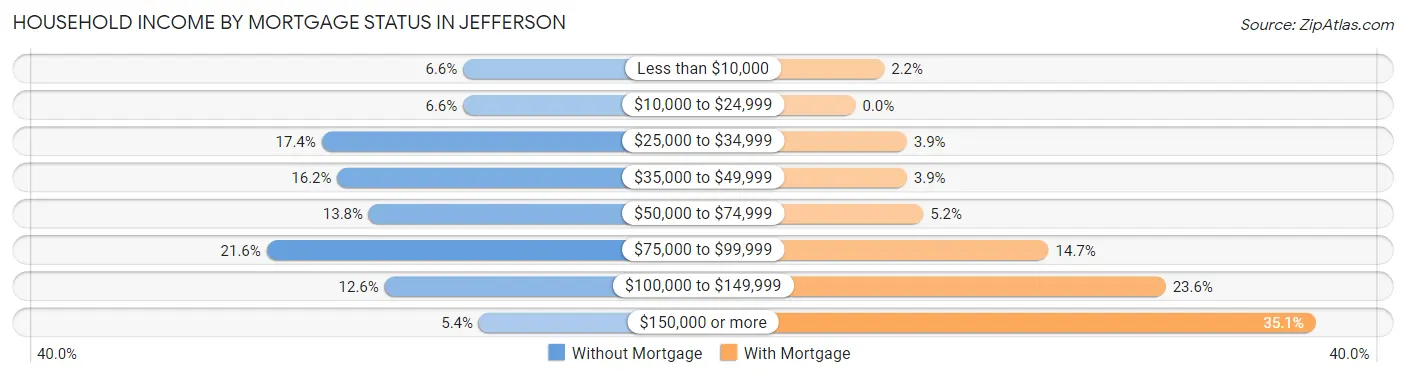
| Household Income | Without Mortgage | With Mortgage |
| Less than $10,000 | 11 (6.6%) | 14 (2.2%) |
| $10,000 to $24,999 | 11 (6.6%) | 0 (0.0%) |
| $25,000 to $34,999 | 29 (17.4%) | 25 (3.9%) |
| $35,000 to $49,999 | 27 (16.2%) | 25 (3.9%) |
| $50,000 to $74,999 | 23 (13.8%) | 33 (5.2%) |
| $75,000 to $99,999 | 36 (21.6%) | 94 (14.7%) |
| $100,000 to $149,999 | 21 (12.6%) | 151 (23.6%) |
| $150,000 or more | 9 (5.4%) | 224 (35.0%) |
| Total | 167 (100.0%) | 639 (100.0%) |
Property Value to Household Income Ratio in Jefferson
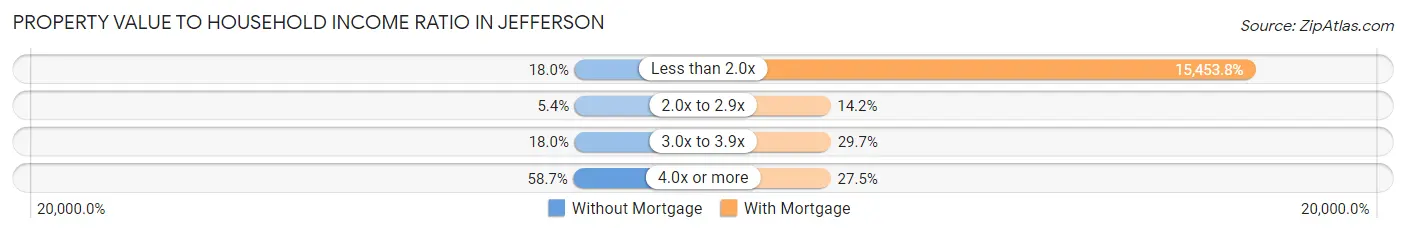
| Value-to-Income Ratio | Without Mortgage | With Mortgage |
| Less than 2.0x | 30 (18.0%) | 98,750 (15,453.8%) |
| 2.0x to 2.9x | 9 (5.4%) | 91 (14.2%) |
| 3.0x to 3.9x | 30 (18.0%) | 190 (29.7%) |
| 4.0x or more | 98 (58.7%) | 176 (27.5%) |
| Total | 167 (100.0%) | 639 (100.0%) |
Real Estate Taxes by Mortgage Status in Jefferson
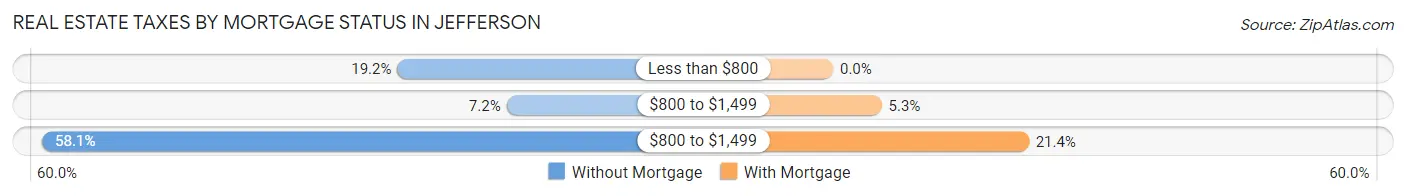
| Property Taxes | Without Mortgage | With Mortgage |
| Less than $800 | 32 (19.2%) | 0 (0.0%) |
| $800 to $1,499 | 12 (7.2%) | 34 (5.3%) |
| $800 to $1,499 | 97 (58.1%) | 137 (21.4%) |
| Total | 167 (100.0%) | 639 (100.0%) |
Health & Disability in Jefferson
Health Insurance Coverage by Age in Jefferson
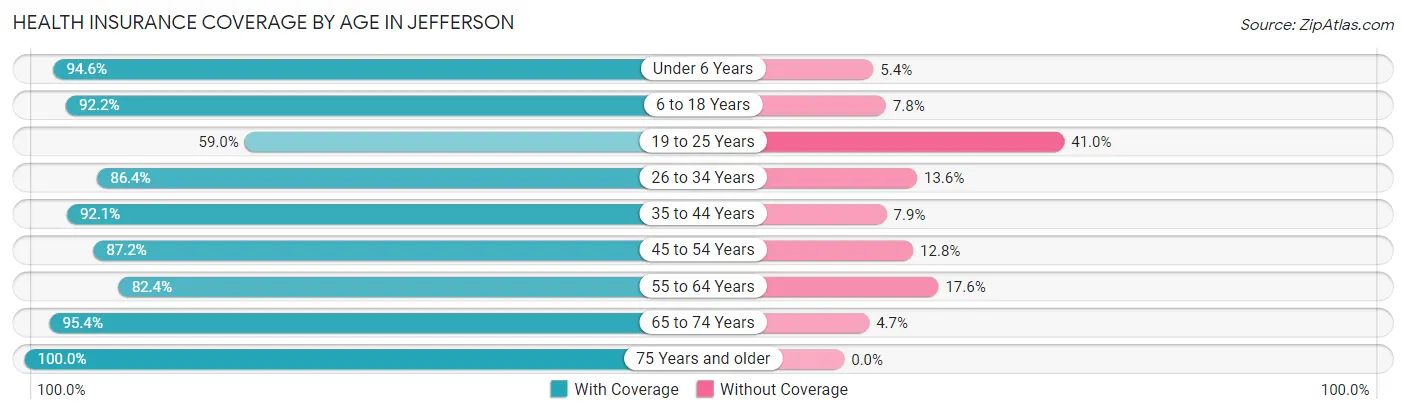
| Age Bracket | With Coverage | Without Coverage |
| Under 6 Years | 261 (94.6%) | 15 (5.4%) |
| 6 to 18 Years | 773 (92.2%) | 65 (7.8%) |
| 19 to 25 Years | 171 (59.0%) | 119 (41.0%) |
| 26 to 34 Years | 376 (86.4%) | 59 (13.6%) |
| 35 to 44 Years | 513 (92.1%) | 44 (7.9%) |
| 45 to 54 Years | 190 (87.2%) | 28 (12.8%) |
| 55 to 64 Years | 277 (82.4%) | 59 (17.6%) |
| 65 to 74 Years | 205 (95.4%) | 10 (4.6%) |
| 75 Years and older | 146 (100.0%) | 0 (0.0%) |
| Total | 2,912 (87.9%) | 399 (12.0%) |
Health Insurance Coverage by Citizenship Status in Jefferson
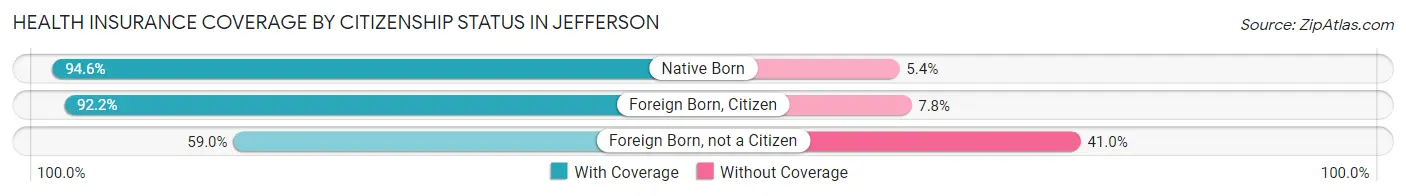
| Citizenship Status | With Coverage | Without Coverage |
| Native Born | 261 (94.6%) | 15 (5.4%) |
| Foreign Born, Citizen | 773 (92.2%) | 65 (7.8%) |
| Foreign Born, not a Citizen | 171 (59.0%) | 119 (41.0%) |
Health Insurance Coverage by Household Income in Jefferson
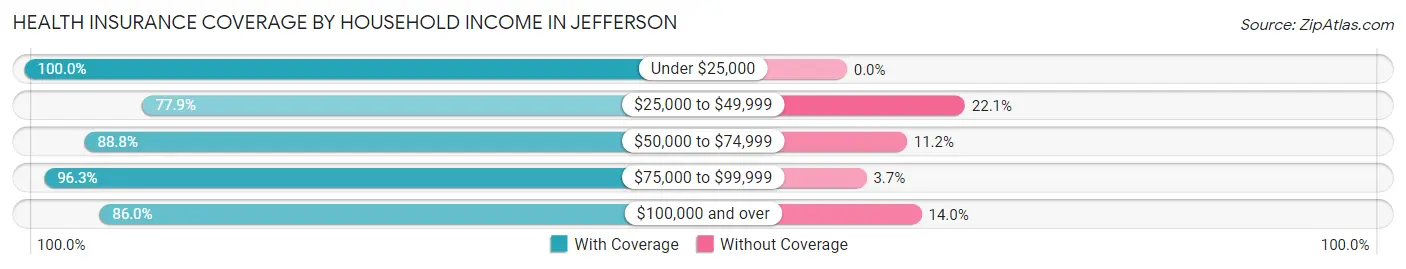
| Household Income | With Coverage | Without Coverage |
| Under $25,000 | 104 (100.0%) | 0 (0.0%) |
| $25,000 to $49,999 | 338 (77.9%) | 96 (22.1%) |
| $50,000 to $74,999 | 458 (88.8%) | 58 (11.2%) |
| $75,000 to $99,999 | 655 (96.3%) | 25 (3.7%) |
| $100,000 and over | 1,350 (86.0%) | 220 (14.0%) |
Public vs Private Health Insurance Coverage by Age in Jefferson
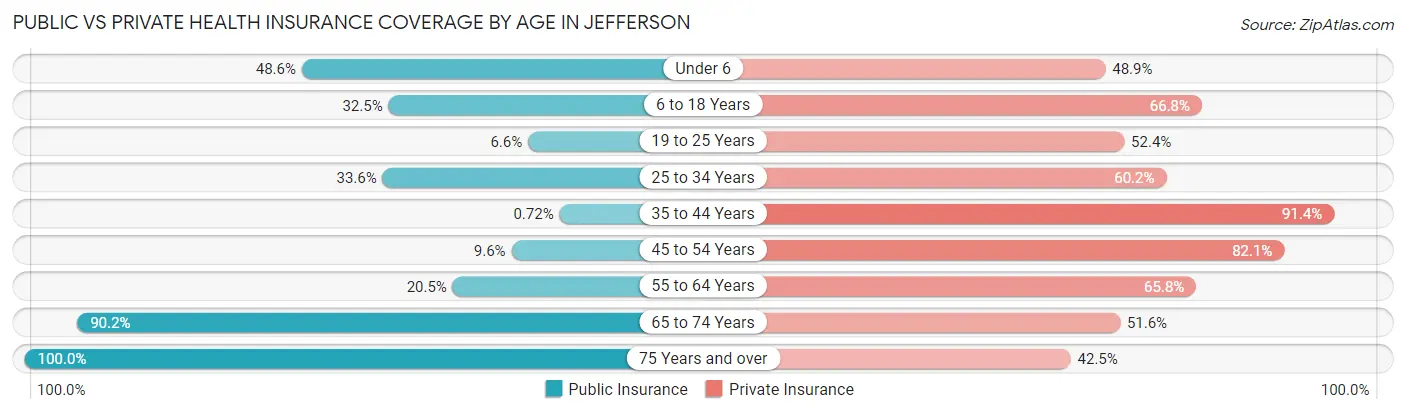
| Age Bracket | Public Insurance | Private Insurance |
| Under 6 | 134 (48.5%) | 135 (48.9%) |
| 6 to 18 Years | 272 (32.5%) | 560 (66.8%) |
| 19 to 25 Years | 19 (6.6%) | 152 (52.4%) |
| 25 to 34 Years | 146 (33.6%) | 262 (60.2%) |
| 35 to 44 Years | 4 (0.7%) | 509 (91.4%) |
| 45 to 54 Years | 21 (9.6%) | 179 (82.1%) |
| 55 to 64 Years | 69 (20.5%) | 221 (65.8%) |
| 65 to 74 Years | 194 (90.2%) | 111 (51.6%) |
| 75 Years and over | 146 (100.0%) | 62 (42.5%) |
| Total | 1,005 (30.3%) | 2,191 (66.2%) |
Disability Status by Sex by Age in Jefferson
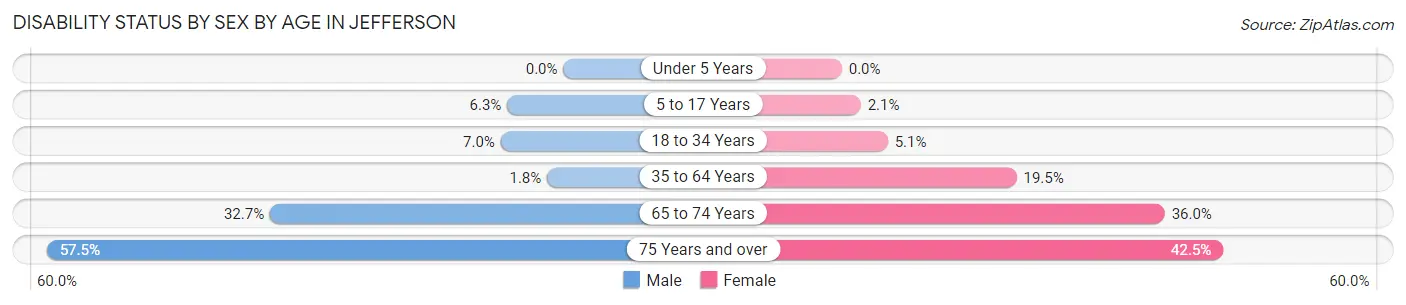
| Age Bracket | Male | Female |
| Under 5 Years | 0 (0.0%) | 0 (0.0%) |
| 5 to 17 Years | 27 (6.3%) | 10 (2.1%) |
| 18 to 34 Years | 27 (7.0%) | 18 (5.1%) |
| 35 to 64 Years | 10 (1.8%) | 109 (19.5%) |
| 65 to 74 Years | 33 (32.7%) | 41 (36.0%) |
| 75 Years and over | 42 (57.5%) | 31 (42.5%) |
Disability Class by Sex by Age in Jefferson
Disability Class: Hearing Difficulty
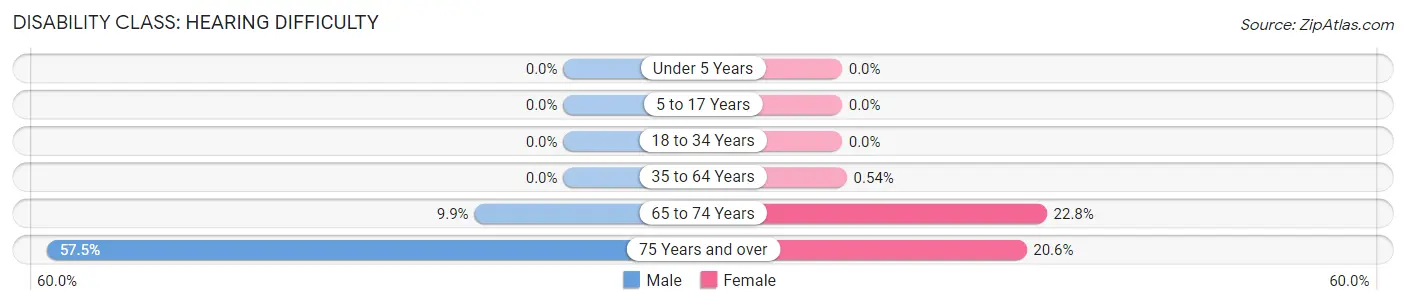
| Age Bracket | Male | Female |
| Under 5 Years | 0 (0.0%) | 0 (0.0%) |
| 5 to 17 Years | 0 (0.0%) | 0 (0.0%) |
| 18 to 34 Years | 0 (0.0%) | 0 (0.0%) |
| 35 to 64 Years | 0 (0.0%) | 3 (0.5%) |
| 65 to 74 Years | 10 (9.9%) | 26 (22.8%) |
| 75 Years and over | 42 (57.5%) | 15 (20.5%) |
Disability Class: Vision Difficulty
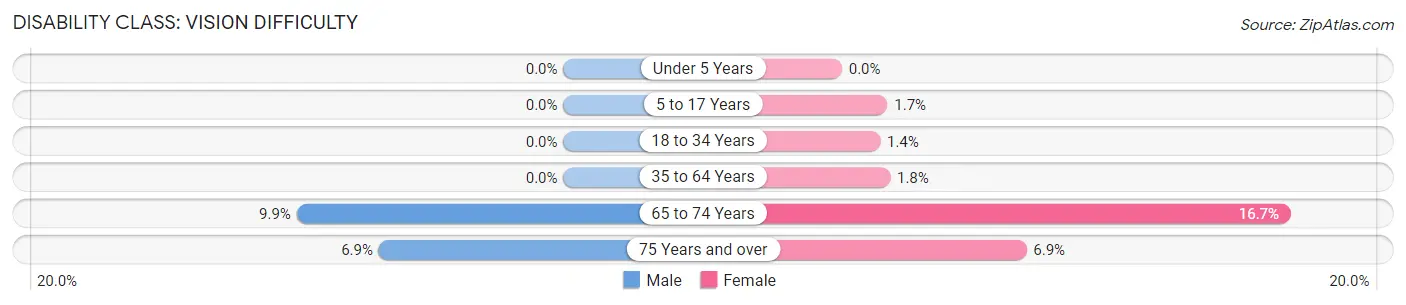
| Age Bracket | Male | Female |
| Under 5 Years | 0 (0.0%) | 0 (0.0%) |
| 5 to 17 Years | 0 (0.0%) | 8 (1.7%) |
| 18 to 34 Years | 0 (0.0%) | 5 (1.4%) |
| 35 to 64 Years | 0 (0.0%) | 10 (1.8%) |
| 65 to 74 Years | 10 (9.9%) | 19 (16.7%) |
| 75 Years and over | 5 (6.9%) | 5 (6.9%) |
Disability Class: Cognitive Difficulty
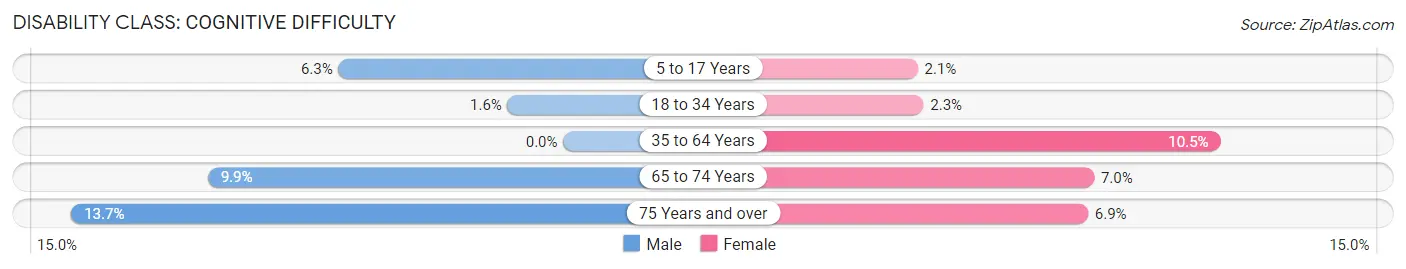
| Age Bracket | Male | Female |
| 5 to 17 Years | 27 (6.3%) | 10 (2.1%) |
| 18 to 34 Years | 6 (1.5%) | 8 (2.3%) |
| 35 to 64 Years | 0 (0.0%) | 59 (10.5%) |
| 65 to 74 Years | 10 (9.9%) | 8 (7.0%) |
| 75 Years and over | 10 (13.7%) | 5 (6.9%) |
Disability Class: Ambulatory Difficulty
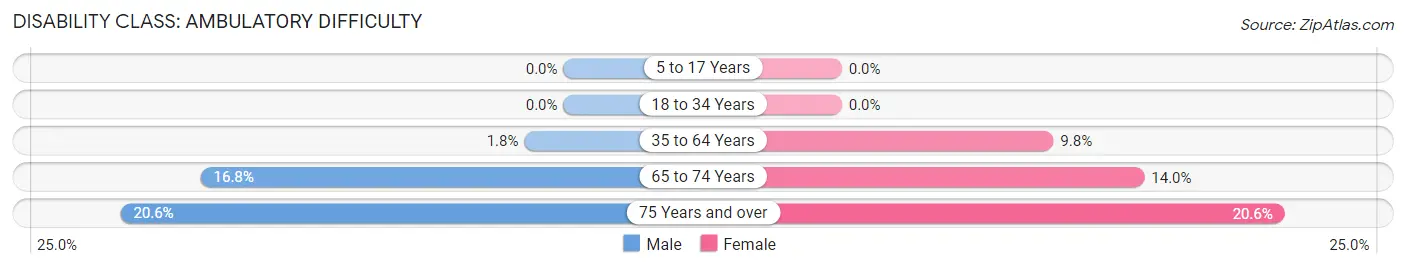
| Age Bracket | Male | Female |
| 5 to 17 Years | 0 (0.0%) | 0 (0.0%) |
| 18 to 34 Years | 0 (0.0%) | 0 (0.0%) |
| 35 to 64 Years | 10 (1.8%) | 55 (9.8%) |
| 65 to 74 Years | 17 (16.8%) | 16 (14.0%) |
| 75 Years and over | 15 (20.5%) | 15 (20.5%) |
Disability Class: Self-Care Difficulty
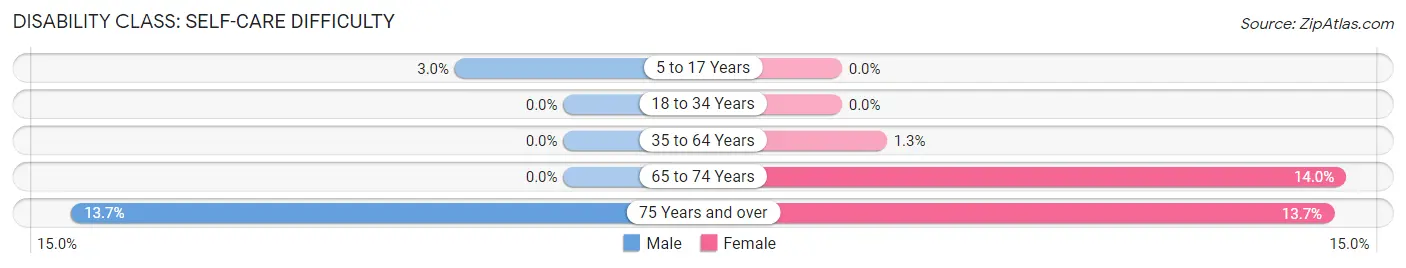
| Age Bracket | Male | Female |
| 5 to 17 Years | 13 (3.0%) | 0 (0.0%) |
| 18 to 34 Years | 0 (0.0%) | 0 (0.0%) |
| 35 to 64 Years | 0 (0.0%) | 7 (1.3%) |
| 65 to 74 Years | 0 (0.0%) | 16 (14.0%) |
| 75 Years and over | 10 (13.7%) | 10 (13.7%) |
Technology Access in Jefferson
Computing Device Access in Jefferson
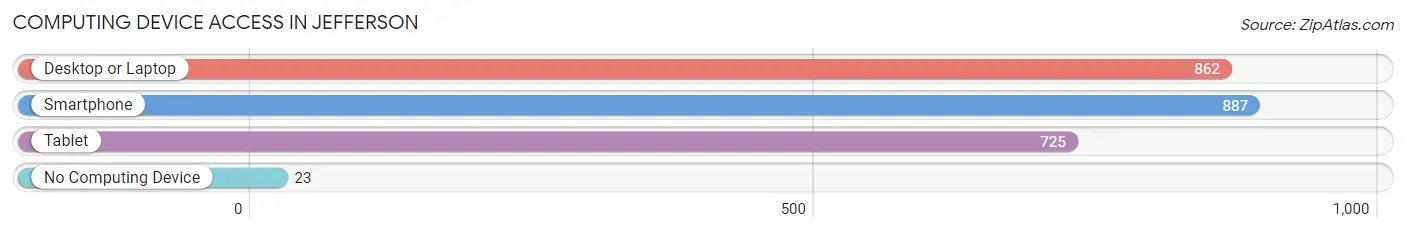
| Device Type | # Households | % Households |
| Desktop or Laptop | 862 | 89.0% |
| Smartphone | 887 | 91.5% |
| Tablet | 725 | 74.8% |
| No Computing Device | 23 | 2.4% |
| Total | 969 | 100.0% |
Internet Access in Jefferson
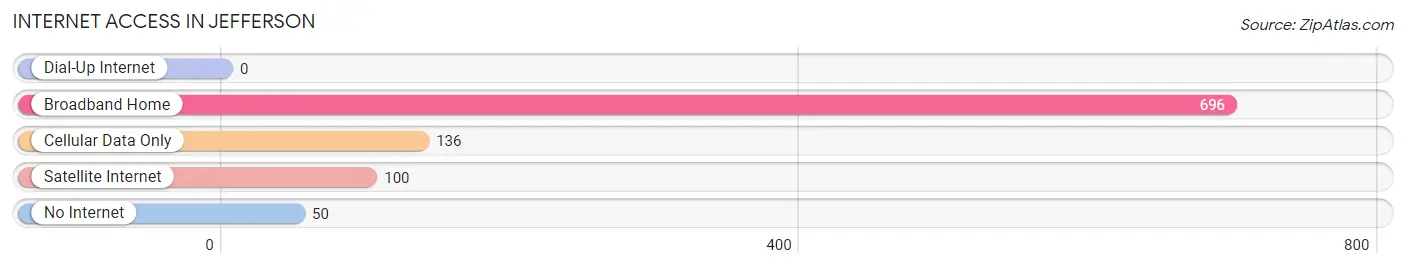
| Internet Type | # Households | % Households |
| Dial-Up Internet | 0 | 0.0% |
| Broadband Home | 696 | 71.8% |
| Cellular Data Only | 136 | 14.0% |
| Satellite Internet | 100 | 10.3% |
| No Internet | 50 | 5.2% |
| Total | 969 | 100.0% |
Jefferson Summary
Jefferson, Oregon is a small city located in Marion County, Oregon. It is situated on the banks of the Willamette River, about 25 miles south of Salem, the state capital. The city has a population of approximately 2,500 people and is part of the Salem Metropolitan Statistical Area.
History
The area that is now Jefferson was first settled in the early 1840s by pioneers from the Oregon Trail. The first settlers were primarily farmers and ranchers, and the area was known as “Jefferson Prairie”. In 1851, the first post office was established in the area, and the name was changed to “Jefferson”.
In 1854, the Oregon and California Railroad was built through the area, connecting Jefferson to the rest of the state. This allowed for the growth of the city, and by the late 1800s, Jefferson had become a thriving agricultural and commercial center.
In the early 1900s, Jefferson was home to several large lumber mills, and the city was known as the “Lumber Capital of the World”. The lumber industry was the primary source of employment for the city’s residents, and the city’s population grew rapidly.
In the 1950s, the lumber industry began to decline, and the city’s population began to decline as well. In the 1970s, the city began to diversify its economy, and today Jefferson is home to a variety of businesses, including manufacturing, retail, and tourism.
Geography
Jefferson is located in the Willamette Valley, about 25 miles south of Salem. The city is situated on the banks of the Willamette River, and is surrounded by rolling hills and farmland. The city has a total area of 2.3 square miles, and is located at an elevation of approximately 200 feet.
The climate in Jefferson is mild and temperate, with warm summers and cool winters. The average annual temperature is around 50 degrees Fahrenheit, and the average annual precipitation is around 40 inches.
Economy
The economy of Jefferson is largely based on agriculture and manufacturing. The city is home to several large agricultural operations, including dairy farms, fruit orchards, and vegetable farms. The city is also home to several manufacturing companies, including a paper mill, a furniture factory, and a plastics factory.
In addition to these industries, Jefferson is also home to a variety of retail stores, restaurants, and other businesses. The city is also a popular tourist destination, and is home to several historic sites, museums, and other attractions.
Demographics
As of the 2010 census, the population of Jefferson was 2,500. The racial makeup of the city was 94.2% White, 0.8% African American, 0.4% Native American, 0.8% Asian, 0.2% Pacific Islander, and 2.6% from other races. The median household income in Jefferson was $41,250, and the median family income was $50,000.
Conclusion
Jefferson, Oregon is a small city located in Marion County, Oregon. It is situated on the banks of the Willamette River, about 25 miles south of Salem, the state capital. The city has a population of approximately 2,500 people and is part of the Salem Metropolitan Statistical Area. The economy of Jefferson is largely based on agriculture and manufacturing, and the city is also a popular tourist destination. The racial makeup of the city is 94.2% White, 0.8% African American, 0.4% Native American, 0.8% Asian, 0.2% Pacific Islander, and 2.6% from other races. The median household income in Jefferson was $41,250, and the median family income was $50,000.
Common Questions
What is Per Capita Income in Jefferson?
Per Capita income in Jefferson is $32,414.
What is the Median Family Income in Jefferson?
Median Family Income in Jefferson is $90,677.
What is the Median Household income in Jefferson?
Median Household Income in Jefferson is $87,604.
What is Income or Wage Gap in Jefferson?
Income or Wage Gap in Jefferson is 16.4%.
Women in Jefferson earn 83.6 cents for every dollar earned by a man.
What is Inequality or Gini Index in Jefferson?
Inequality or Gini Index in Jefferson is 0.42.
What is the Total Population of Jefferson?
Total Population of Jefferson is 3,324.
What is the Total Male Population of Jefferson?
Total Male Population of Jefferson is 1,607.
What is the Total Female Population of Jefferson?
Total Female Population of Jefferson is 1,717.
What is the Ratio of Males per 100 Females in Jefferson?
There are 93.59 Males per 100 Females in Jefferson.
What is the Ratio of Females per 100 Males in Jefferson?
There are 106.85 Females per 100 Males in Jefferson.
What is the Median Population Age in Jefferson?
Median Population Age in Jefferson is 31.7 Years.
What is the Average Family Size in Jefferson
Average Family Size in Jefferson is 3.7 People.
What is the Average Household Size in Jefferson
Average Household Size in Jefferson is 3.4 People.
How Large is the Labor Force in Jefferson?
There are 1,630 People in the Labor Forcein in Jefferson.
What is the Percentage of People in the Labor Force in Jefferson?
68.7% of People are in the Labor Force in Jefferson.
What is the Unemployment Rate in Jefferson?
Unemployment Rate in Jefferson is 9.7%.