Atoka, NM Map & Demographics
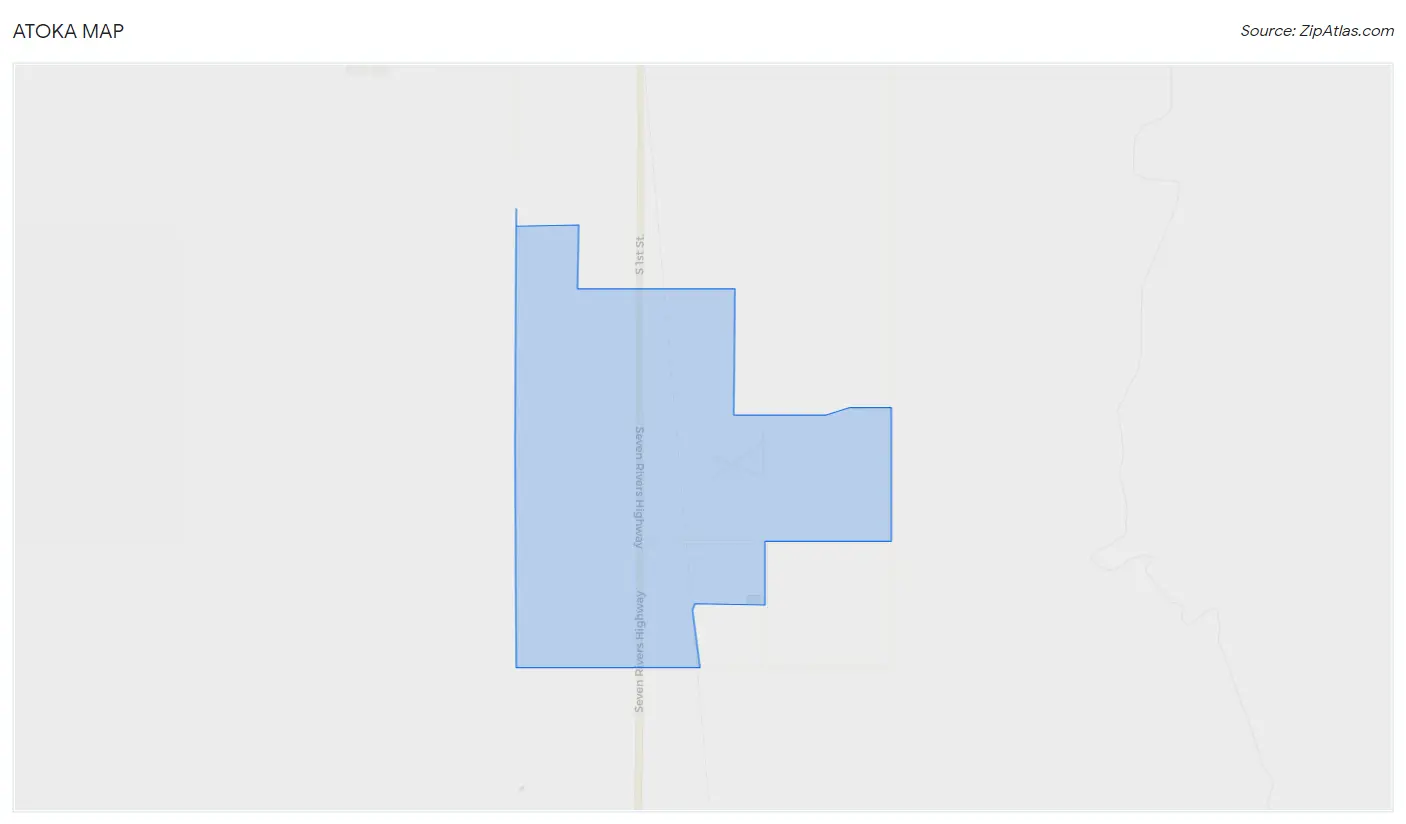
Atoka Map
Atoka Overview
$28,362
PER CAPITA INCOME
$79,303
AVG FAMILY INCOME
$77,816
AVG HOUSEHOLD INCOME
15.1%
WAGE / INCOME GAP [ % ]
84.9¢/ $1
WAGE / INCOME GAP [ $ ]
0.31
INEQUALITY / GINI INDEX
1,280
TOTAL POPULATION
755
MALE POPULATION
525
FEMALE POPULATION
143.81
MALES / 100 FEMALES
69.54
FEMALES / 100 MALES
29.6
MEDIAN AGE
3.0
AVG FAMILY SIZE
2.5
AVG HOUSEHOLD SIZE
387
LABOR FORCE [ PEOPLE ]
42.4%
PERCENT IN LABOR FORCE
2.6%
UNEMPLOYMENT RATE
Income in Atoka
Income Overview in Atoka
Per Capita Income in Atoka is $28,362, while median incomes of families and households are $79,303 and $77,816 respectively.
| Characteristic | Number | Measure |
| Per Capita Income | 1,280 | $28,362 |
| Median Family Income | 395 | $79,303 |
| Mean Family Income | 395 | $84,765 |
| Median Household Income | 508 | $77,816 |
| Mean Household Income | 508 | $72,910 |
| Income Deficit | 395 | $0 |
| Wage / Income Gap (%) | 1,280 | 15.06% |
| Wage / Income Gap ($) | 1,280 | 84.94¢ per $1 |
| Gini / Inequality Index | 1,280 | 0.31 |
Earnings by Sex in Atoka
Average Earnings in Atoka are $68,758, $68,091 for men and $80,165 for women, a difference of 15.1%.
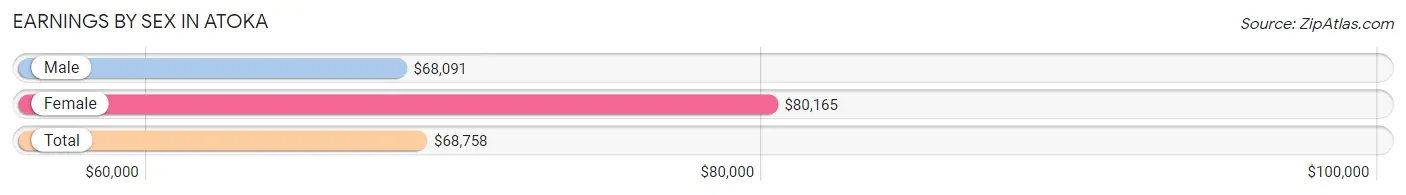
| Sex | Number | Average Earnings |
| Male | 288 (74.4%) | $68,091 |
| Female | 99 (25.6%) | $80,165 |
| Total | 387 (100.0%) | $68,758 |
Earnings by Sex by Income Bracket in Atoka
The most common earnings brackets in Atoka are $65,000 to $74,999 for men (148 | 51.4%) and $75,000 to $99,999 for women (53 | 53.5%).
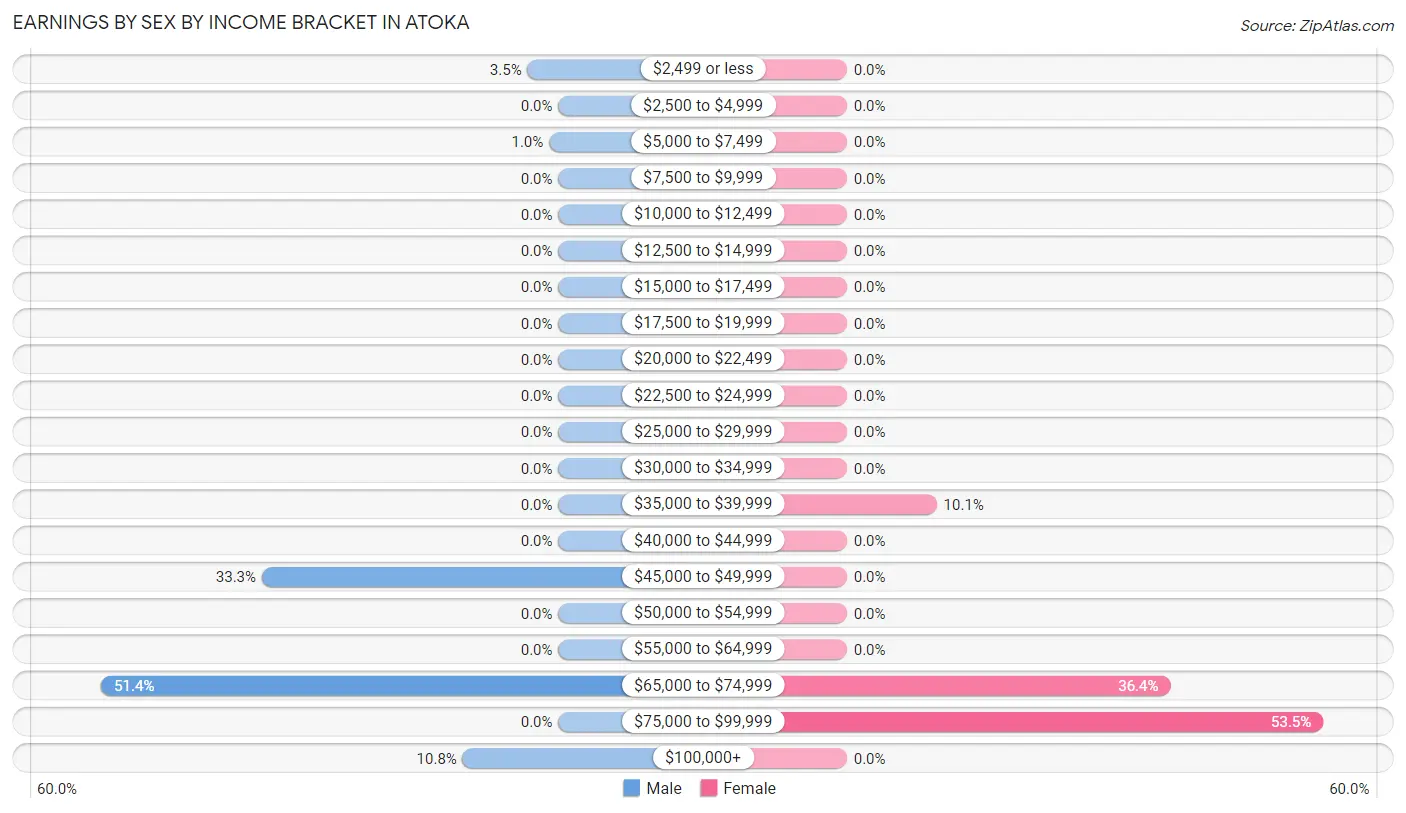
| Income | Male | Female |
| $2,499 or less | 10 (3.5%) | 0 (0.0%) |
| $2,500 to $4,999 | 0 (0.0%) | 0 (0.0%) |
| $5,000 to $7,499 | 3 (1.0%) | 0 (0.0%) |
| $7,500 to $9,999 | 0 (0.0%) | 0 (0.0%) |
| $10,000 to $12,499 | 0 (0.0%) | 0 (0.0%) |
| $12,500 to $14,999 | 0 (0.0%) | 0 (0.0%) |
| $15,000 to $17,499 | 0 (0.0%) | 0 (0.0%) |
| $17,500 to $19,999 | 0 (0.0%) | 0 (0.0%) |
| $20,000 to $22,499 | 0 (0.0%) | 0 (0.0%) |
| $22,500 to $24,999 | 0 (0.0%) | 0 (0.0%) |
| $25,000 to $29,999 | 0 (0.0%) | 0 (0.0%) |
| $30,000 to $34,999 | 0 (0.0%) | 0 (0.0%) |
| $35,000 to $39,999 | 0 (0.0%) | 10 (10.1%) |
| $40,000 to $44,999 | 0 (0.0%) | 0 (0.0%) |
| $45,000 to $49,999 | 96 (33.3%) | 0 (0.0%) |
| $50,000 to $54,999 | 0 (0.0%) | 0 (0.0%) |
| $55,000 to $64,999 | 0 (0.0%) | 0 (0.0%) |
| $65,000 to $74,999 | 148 (51.4%) | 36 (36.4%) |
| $75,000 to $99,999 | 0 (0.0%) | 53 (53.5%) |
| $100,000+ | 31 (10.8%) | 0 (0.0%) |
| Total | 288 (100.0%) | 99 (100.0%) |
Earnings by Sex by Educational Attainment in Atoka
| Educational Attainment | Male Income | Female Income |
| Less than High School | - | - |
| High School Diploma | - | - |
| College or Associate's Degree | - | - |
| Bachelor's Degree | - | - |
| Graduate Degree | - | - |
| Total | $68,885 | $80,165 |
Family Income in Atoka
Family Income Brackets in Atoka
According to the Atoka family income data, there are 177 families falling into the $75,000 to $99,999 income range, which is the most common income bracket and makes up 44.8% of all families.
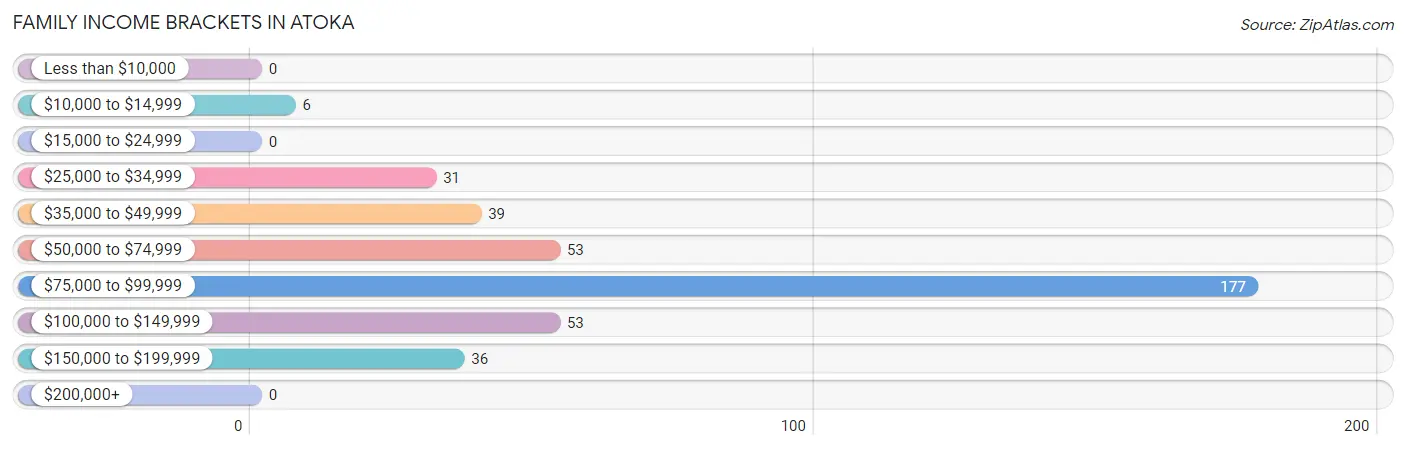
| Income Bracket | # Families | % Families |
| Less than $10,000 | 0 | 0.0% |
| $10,000 to $14,999 | 6 | 1.5% |
| $15,000 to $24,999 | 0 | 0.0% |
| $25,000 to $34,999 | 31 | 7.8% |
| $35,000 to $49,999 | 39 | 9.9% |
| $50,000 to $74,999 | 53 | 13.4% |
| $75,000 to $99,999 | 177 | 44.8% |
| $100,000 to $149,999 | 53 | 13.4% |
| $150,000 to $199,999 | 36 | 9.1% |
| $200,000+ | 0 | 0.0% |
Family Income by Famaliy Size in Atoka
2-person families (146 | 37.0%) account for the highest median family income in Atoka with $115,755 per family, while 2-person families (146 | 37.0%) have the highest median income of $57,878 per family member.
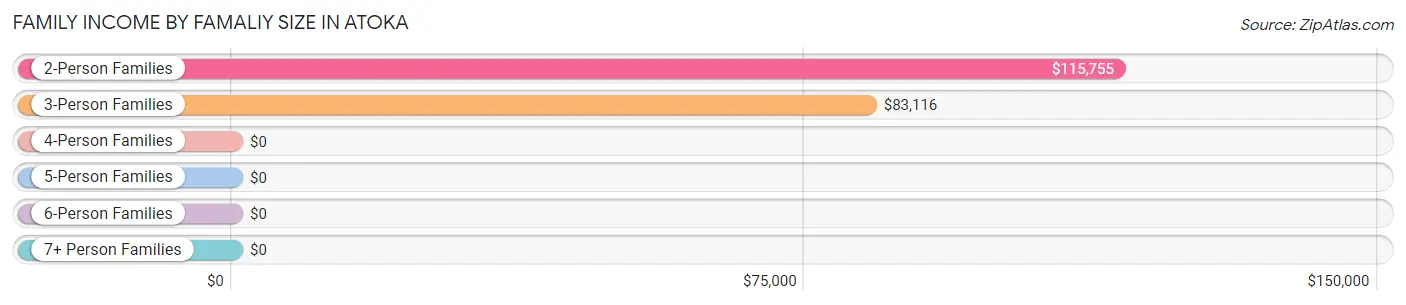
| Income Bracket | # Families | Median Income |
| 2-Person Families | 146 (37.0%) | $115,755 |
| 3-Person Families | 101 (25.6%) | $83,116 |
| 4-Person Families | 95 (24.0%) | $0 |
| 5-Person Families | 53 (13.4%) | $0 |
| 6-Person Families | 0 (0.0%) | $0 |
| 7+ Person Families | 0 (0.0%) | $0 |
| Total | 395 (100.0%) | $79,303 |
Family Income by Number of Earners in Atoka
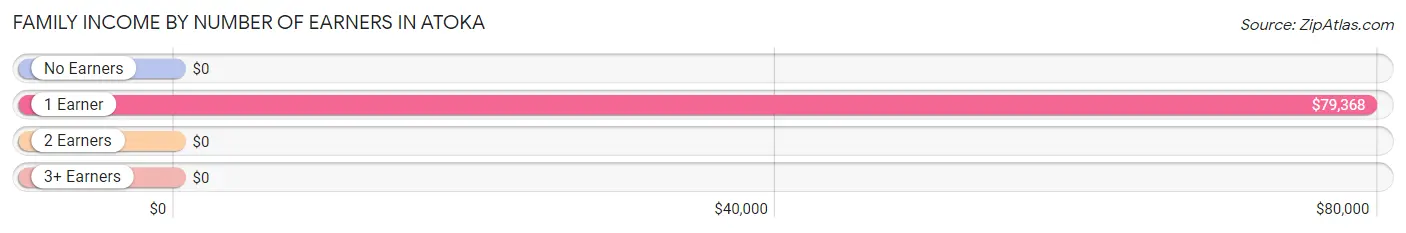
| Number of Earners | # Families | Median Income |
| No Earners | 61 (15.4%) | $0 |
| 1 Earner | 288 (72.9%) | $79,368 |
| 2 Earners | 46 (11.7%) | $0 |
| 3+ Earners | 0 (0.0%) | $0 |
| Total | 395 (100.0%) | $79,303 |
Household Income in Atoka
Household Income Brackets in Atoka
With 177 households falling in the category, the $75,000 to $99,999 income range is the most frequent in Atoka, accounting for 34.8% of all households.
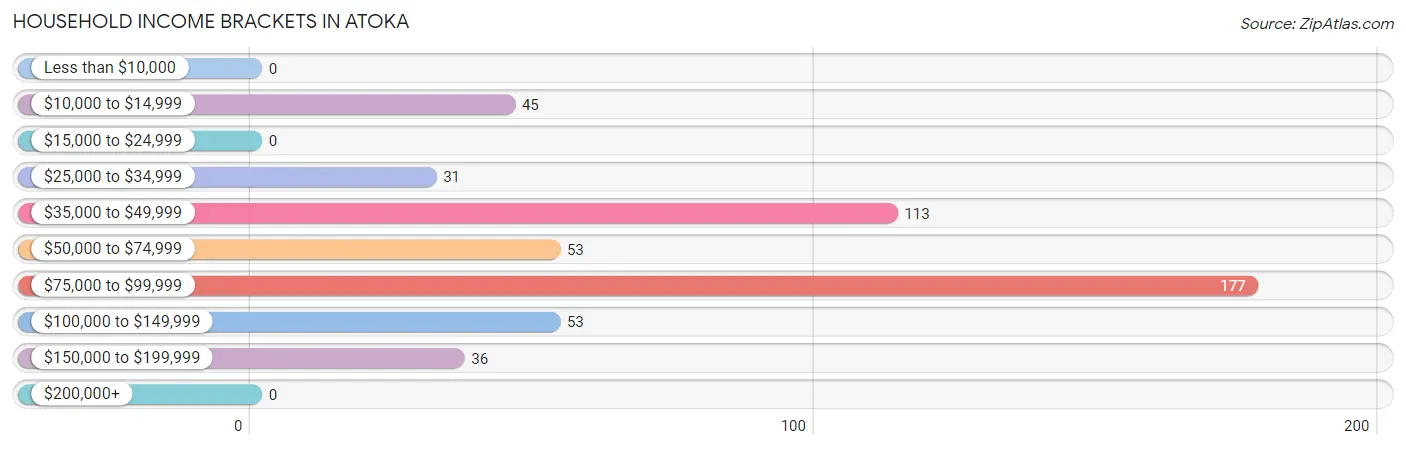
| Income Bracket | # Households | % Households |
| Less than $10,000 | 0 | 0.0% |
| $10,000 to $14,999 | 45 | 8.9% |
| $15,000 to $24,999 | 0 | 0.0% |
| $25,000 to $34,999 | 31 | 6.1% |
| $35,000 to $49,999 | 113 | 22.2% |
| $50,000 to $74,999 | 53 | 10.4% |
| $75,000 to $99,999 | 177 | 34.8% |
| $100,000 to $149,999 | 53 | 10.4% |
| $150,000 to $199,999 | 36 | 7.1% |
| $200,000+ | 0 | 0.0% |
Household Income by Householder Age in Atoka
The median household income in Atoka is $77,816, with the highest median household income of $116,863 found in the 45 to 64 years age bracket for the primary householder. A total of 99 households (19.5%) fall into this category.
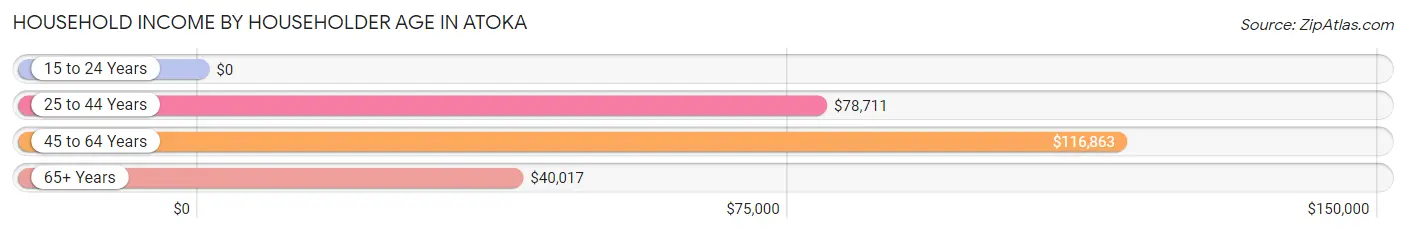
| Income Bracket | # Households | Median Income |
| 15 to 24 Years | 0 (0.0%) | $0 |
| 25 to 44 Years | 232 (45.7%) | $78,711 |
| 45 to 64 Years | 99 (19.5%) | $116,863 |
| 65+ Years | 177 (34.8%) | $40,017 |
| Total | 508 (100.0%) | $77,816 |
Poverty in Atoka
Income Below Poverty by Sex and Age in Atoka
With 7.0% poverty level for males and 0.2% for females among the residents of Atoka, 65 to 74 year old males and 65 to 74 year old females are the most vulnerable to poverty, with 45 males (75.0%) and 1 females (7.1%) in their respective age groups living below the poverty level.
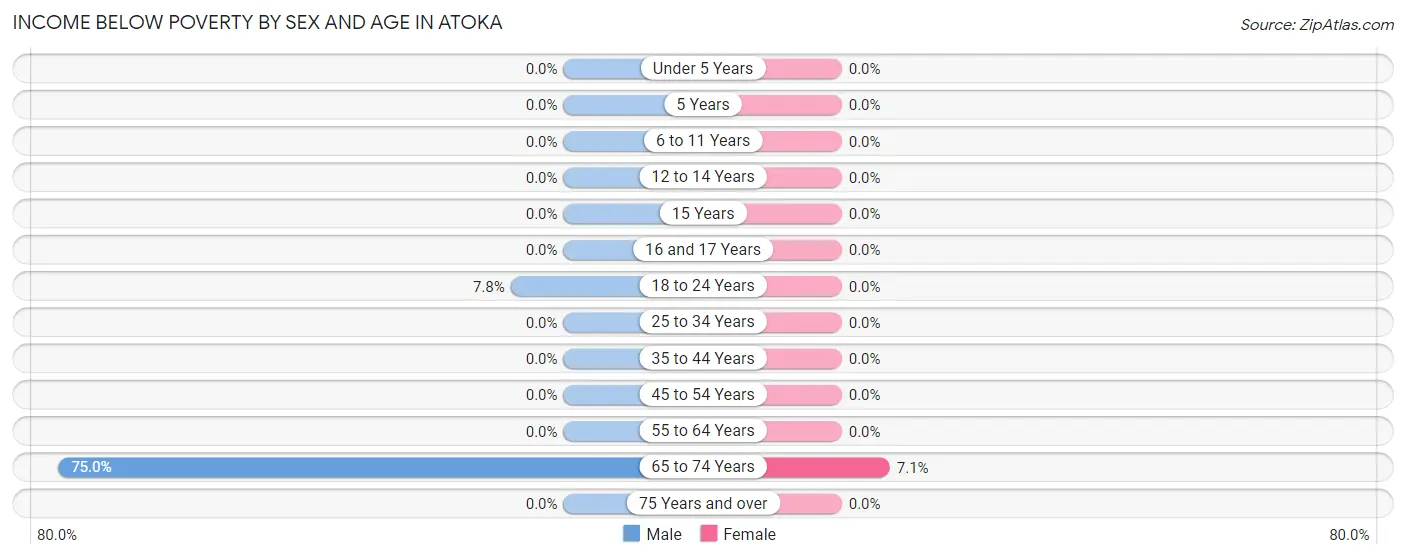
| Age Bracket | Male | Female |
| Under 5 Years | 0 (0.0%) | 0 (0.0%) |
| 5 Years | 0 (0.0%) | 0 (0.0%) |
| 6 to 11 Years | 0 (0.0%) | 0 (0.0%) |
| 12 to 14 Years | 0 (0.0%) | 0 (0.0%) |
| 15 Years | 0 (0.0%) | 0 (0.0%) |
| 16 and 17 Years | 0 (0.0%) | 0 (0.0%) |
| 18 to 24 Years | 8 (7.8%) | 0 (0.0%) |
| 25 to 34 Years | 0 (0.0%) | 0 (0.0%) |
| 35 to 44 Years | 0 (0.0%) | 0 (0.0%) |
| 45 to 54 Years | 0 (0.0%) | 0 (0.0%) |
| 55 to 64 Years | 0 (0.0%) | 0 (0.0%) |
| 65 to 74 Years | 45 (75.0%) | 1 (7.1%) |
| 75 Years and over | 0 (0.0%) | 0 (0.0%) |
| Total | 53 (7.0%) | 1 (0.2%) |
Income Above Poverty by Sex and Age in Atoka
According to the poverty statistics in Atoka, males aged under 5 years and females aged under 5 years are the age groups that are most secure financially, with 100.0% of males and 100.0% of females in these age groups living above the poverty line.
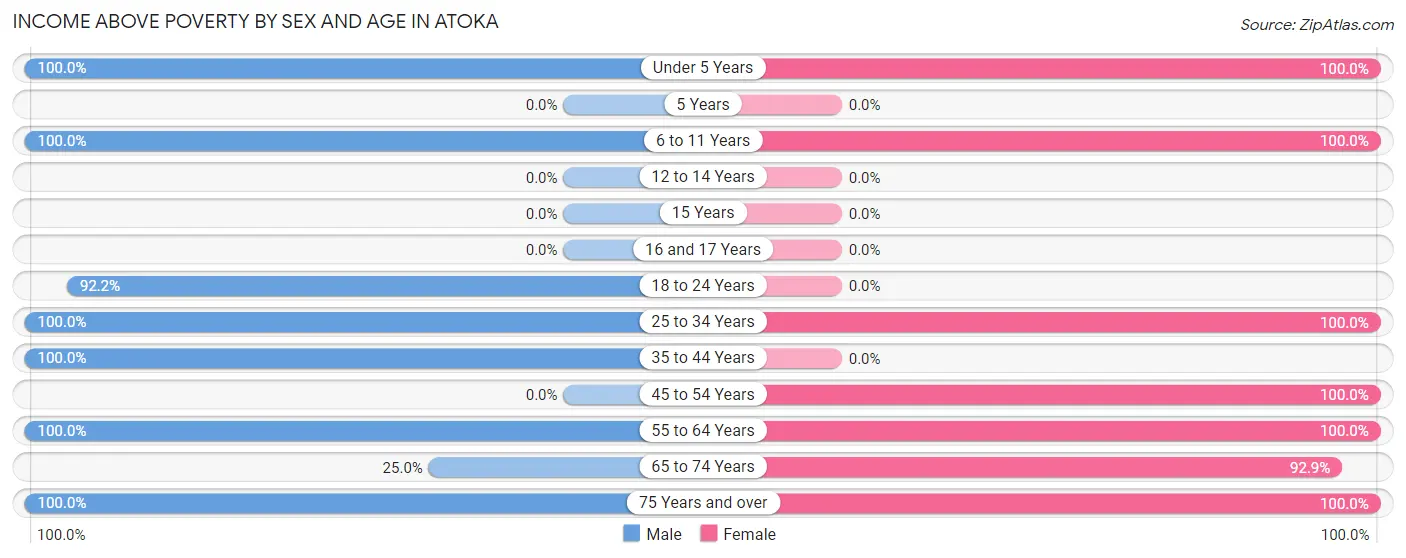
| Age Bracket | Male | Female |
| Under 5 Years | 83 (100.0%) | 49 (100.0%) |
| 5 Years | 0 (0.0%) | 0 (0.0%) |
| 6 to 11 Years | 161 (100.0%) | 75 (100.0%) |
| 12 to 14 Years | 0 (0.0%) | 0 (0.0%) |
| 15 Years | 0 (0.0%) | 0 (0.0%) |
| 16 and 17 Years | 0 (0.0%) | 0 (0.0%) |
| 18 to 24 Years | 94 (92.2%) | 0 (0.0%) |
| 25 to 34 Years | 148 (100.0%) | 228 (100.0%) |
| 35 to 44 Years | 12 (100.0%) | 0 (0.0%) |
| 45 to 54 Years | 0 (0.0%) | 63 (100.0%) |
| 55 to 64 Years | 100 (100.0%) | 62 (100.0%) |
| 65 to 74 Years | 15 (25.0%) | 13 (92.9%) |
| 75 Years and over | 89 (100.0%) | 34 (100.0%) |
| Total | 702 (93.0%) | 524 (99.8%) |
Income Below Poverty Among Married-Couple Families in Atoka
The poverty statistics for married-couple families in Atoka show that 1.7% or 6 of the total 357 families live below the poverty line. Families with no children have the highest poverty rate of 4.2%, comprising of 6 families. On the other hand, families with 1 or 2 children have the lowest poverty rate of 0.0%, which includes 0 families.
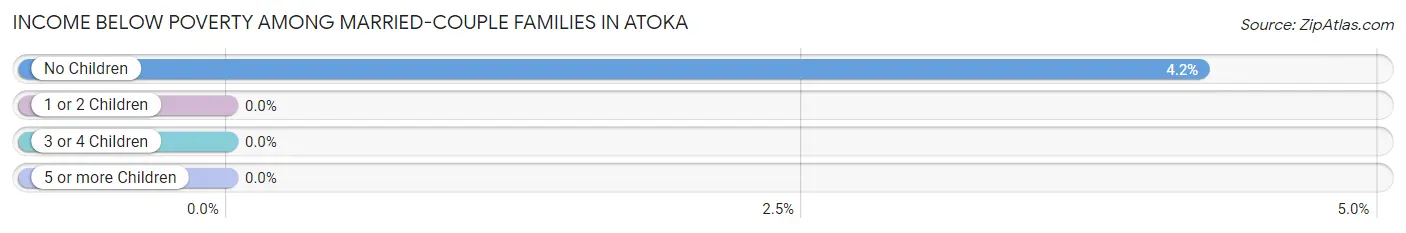
| Children | Above Poverty | Below Poverty |
| No Children | 136 (95.8%) | 6 (4.2%) |
| 1 or 2 Children | 162 (100.0%) | 0 (0.0%) |
| 3 or 4 Children | 53 (100.0%) | 0 (0.0%) |
| 5 or more Children | 0 (0.0%) | 0 (0.0%) |
| Total | 351 (98.3%) | 6 (1.7%) |
Income Below Poverty Among Single-Parent Households in Atoka
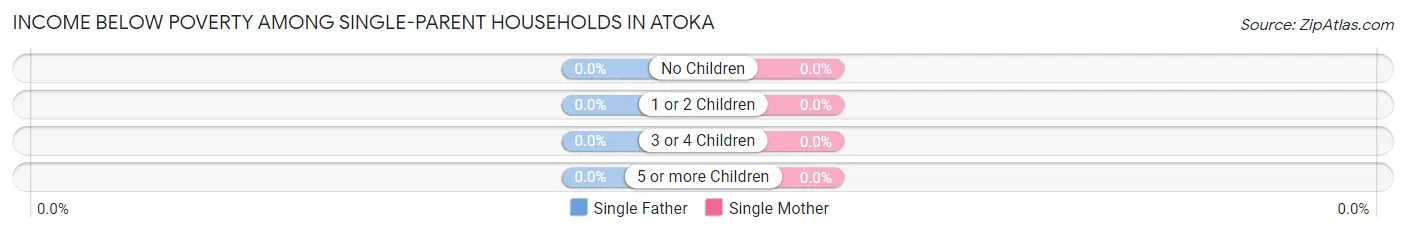
| Children | Single Father | Single Mother |
| No Children | 0 (0.0%) | 0 (0.0%) |
| 1 or 2 Children | 0 (0.0%) | 0 (0.0%) |
| 3 or 4 Children | 0 (0.0%) | 0 (0.0%) |
| 5 or more Children | 0 (0.0%) | 0 (0.0%) |
| Total | 0 (0.0%) | 0 (0.0%) |
Income Below Poverty Among Married-Couple vs Single-Parent Households in Atoka
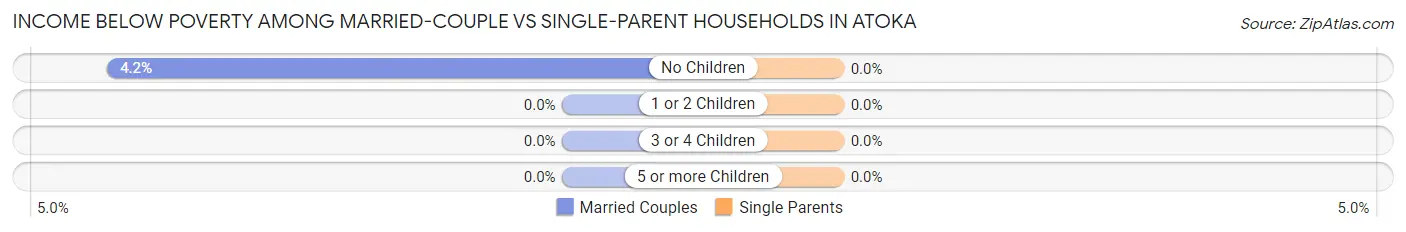
| Children | Married-Couple Families | Single-Parent Households |
| No Children | 6 (4.2%) | 0 (0.0%) |
| 1 or 2 Children | 0 (0.0%) | 0 (0.0%) |
| 3 or 4 Children | 0 (0.0%) | 0 (0.0%) |
| 5 or more Children | 0 (0.0%) | 0 (0.0%) |
| Total | 6 (1.7%) | 0 (0.0%) |
Race in Atoka
The most populous races in Atoka are Hispanic or Latino (874 | 68.3%), White / Caucasian (847 | 66.2%), and Two or more Races (370 | 28.9%).
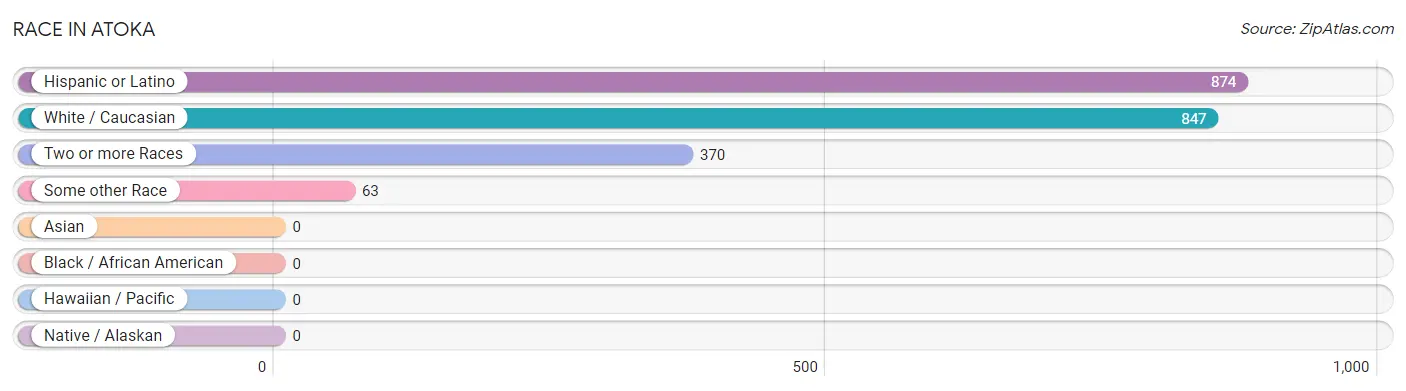
| Race | # Population | % Population |
| Asian | 0 | 0.0% |
| Black / African American | 0 | 0.0% |
| Hawaiian / Pacific | 0 | 0.0% |
| Hispanic or Latino | 874 | 68.3% |
| Native / Alaskan | 0 | 0.0% |
| White / Caucasian | 847 | 66.2% |
| Two or more Races | 370 | 28.9% |
| Some other Race | 63 | 4.9% |
| Total | 1,280 | 100.0% |
Ancestry in Atoka
The most populous ancestries reported in Atoka are Mexican (838 | 65.5%), English (215 | 16.8%), American (68 | 5.3%), European (25 | 1.9%), and Irish (17 | 1.3%), together accounting for 90.9% of all Atoka residents.
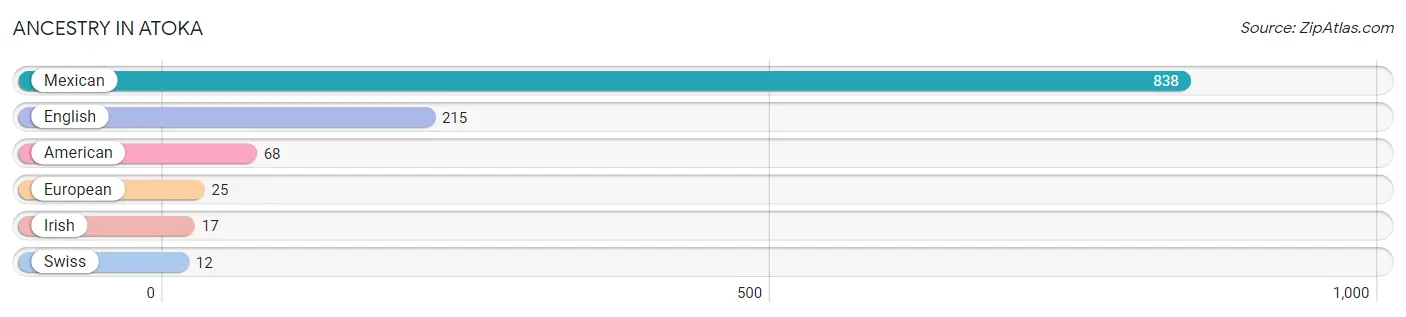
| Ancestry | # Population | % Population |
| American | 68 | 5.3% |
| English | 215 | 16.8% |
| European | 25 | 1.9% |
| Irish | 17 | 1.3% |
| Mexican | 838 | 65.5% |
| Swiss | 12 | 0.9% | View All 6 Rows |
Immigrants in Atoka
The most numerous immigrant groups reported in Atoka came from Central America (189 | 14.8%), Latin America (189 | 14.8%), and Mexico (189 | 14.8%), together accounting for 44.3% of all Atoka residents.
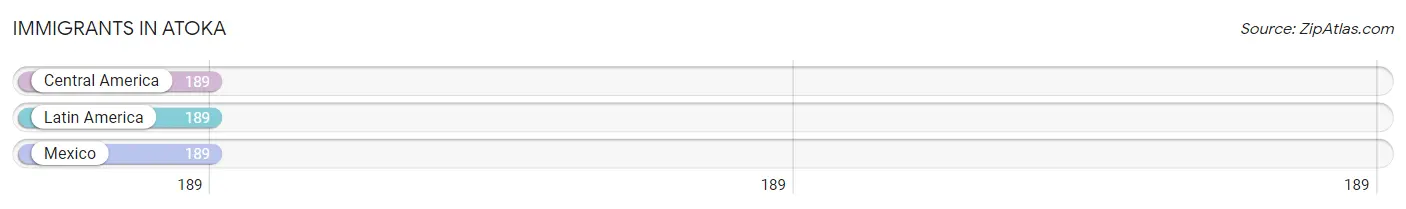
| Immigration Origin | # Population | % Population |
| Central America | 189 | 14.8% |
| Latin America | 189 | 14.8% |
| Mexico | 189 | 14.8% | View All 3 Rows |
Sex and Age in Atoka
Sex and Age in Atoka
The most populous age groups in Atoka are 5 to 9 Years (113 | 15.0%) for men and 25 to 29 Years (136 | 25.9%) for women.
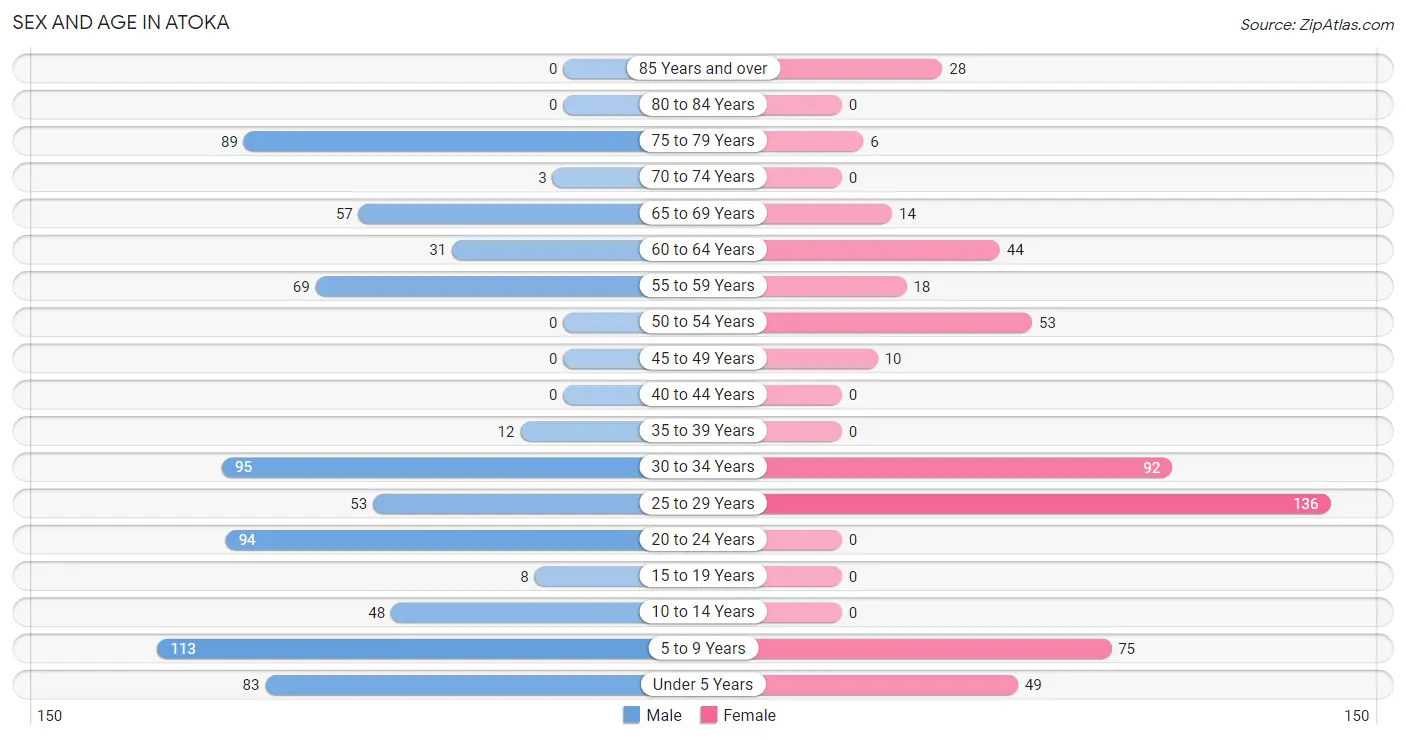
| Age Bracket | Male | Female |
| Under 5 Years | 83 (11.0%) | 49 (9.3%) |
| 5 to 9 Years | 113 (15.0%) | 75 (14.3%) |
| 10 to 14 Years | 48 (6.4%) | 0 (0.0%) |
| 15 to 19 Years | 8 (1.1%) | 0 (0.0%) |
| 20 to 24 Years | 94 (12.4%) | 0 (0.0%) |
| 25 to 29 Years | 53 (7.0%) | 136 (25.9%) |
| 30 to 34 Years | 95 (12.6%) | 92 (17.5%) |
| 35 to 39 Years | 12 (1.6%) | 0 (0.0%) |
| 40 to 44 Years | 0 (0.0%) | 0 (0.0%) |
| 45 to 49 Years | 0 (0.0%) | 10 (1.9%) |
| 50 to 54 Years | 0 (0.0%) | 53 (10.1%) |
| 55 to 59 Years | 69 (9.1%) | 18 (3.4%) |
| 60 to 64 Years | 31 (4.1%) | 44 (8.4%) |
| 65 to 69 Years | 57 (7.5%) | 14 (2.7%) |
| 70 to 74 Years | 3 (0.4%) | 0 (0.0%) |
| 75 to 79 Years | 89 (11.8%) | 6 (1.1%) |
| 80 to 84 Years | 0 (0.0%) | 0 (0.0%) |
| 85 Years and over | 0 (0.0%) | 28 (5.3%) |
| Total | 755 (100.0%) | 525 (100.0%) |
Families and Households in Atoka
Median Family Size in Atoka
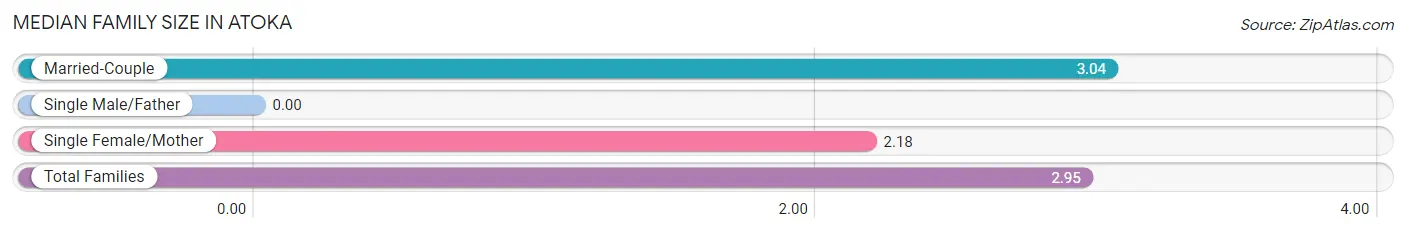
| Family Type | # Families | Family Size |
| Married-Couple | 357 (90.4%) | 3.04 |
| Single Male/Father | 0 (0.0%) | - |
| Single Female/Mother | 38 (9.6%) | 2.18 |
| Total Families | 395 (100.0%) | 2.95 |
Median Household Size in Atoka
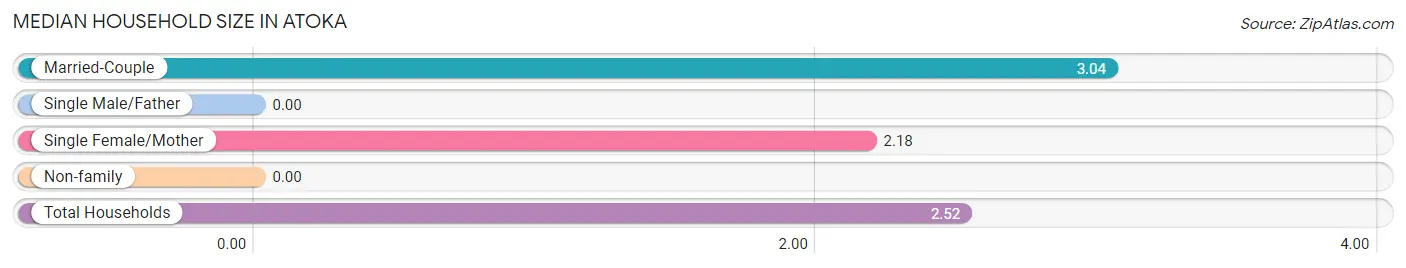
| Household Type | # Households | Household Size |
| Married-Couple | 357 (70.3%) | 3.04 |
| Single Male/Father | 0 (0.0%) | - |
| Single Female/Mother | 38 (7.5%) | 2.18 |
| Non-family | 113 (22.2%) | - |
| Total Households | 508 (100.0%) | 2.52 |
Household Size by Marriage Status in Atoka
Out of a total of 508 households in Atoka, 395 (77.8%) are family households, while 113 (22.2%) are nonfamily households. The most numerous type of family households are 2-person households, comprising 146, and the most common type of nonfamily households are 1-person households, comprising 113.
| Household Size | Family Households | Nonfamily Households |
| 1-Person Households | - | 113 (22.2%) |
| 2-Person Households | 146 (28.7%) | 0 (0.0%) |
| 3-Person Households | 101 (19.9%) | 0 (0.0%) |
| 4-Person Households | 95 (18.7%) | 0 (0.0%) |
| 5-Person Households | 53 (10.4%) | 0 (0.0%) |
| 6-Person Households | 0 (0.0%) | 0 (0.0%) |
| 7+ Person Households | 0 (0.0%) | 0 (0.0%) |
| Total | 395 (77.8%) | 113 (22.2%) |
Female Fertility in Atoka
Fertility by Age in Atoka
| Age Bracket | Women with Births | Births / 1,000 Women |
| 15 to 19 years | 0 (0.0%) | 0.0 |
| 20 to 34 years | 0 (0.0%) | 0.0 |
| 35 to 50 years | 0 (0.0%) | 0.0 |
| Total | 0 (0.0%) | 0.0 |
Fertility by Age by Marriage Status in Atoka
| Age Bracket | Married | Unmarried |
| 15 to 19 years | 0 (0.0%) | 0 (0.0%) |
| 20 to 34 years | 0 (0.0%) | 0 (0.0%) |
| 35 to 50 years | 0 (0.0%) | 0 (0.0%) |
| Total | 0 (0.0%) | 0 (0.0%) |
Fertility by Education in Atoka
| Educational Attainment | Women with Births | Births / 1,000 Women |
| Less than High School | 0 (0.0%) | 0.0 |
| High School Diploma | 0 (0.0%) | 0.0 |
| College or Associate's Degree | 0 (0.0%) | 0.0 |
| Bachelor's Degree | 0 (0.0%) | 0.0 |
| Graduate Degree | 0 (0.0%) | 0.0 |
| Total | 0 (0.0%) | 0.0 |
Fertility by Education by Marriage Status in Atoka
| Educational Attainment | Married | Unmarried |
| Less than High School | 0 (0.0%) | 0 (0.0%) |
| High School Diploma | 0 (0.0%) | 0 (0.0%) |
| College or Associate's Degree | 0 (0.0%) | 0 (0.0%) |
| Bachelor's Degree | 0 (0.0%) | 0 (0.0%) |
| Graduate Degree | 0 (0.0%) | 0 (0.0%) |
| Total | 0 (0.0%) | 0 (0.0%) |
Employment Characteristics in Atoka
Employment by Class of Employer in Atoka
Among the 377 employed individuals in Atoka, private company employees (193 | 51.2%), federal government employees (95 | 25.2%), and not-for-profit organizations (89 | 23.6%) make up the most common classes of employment.
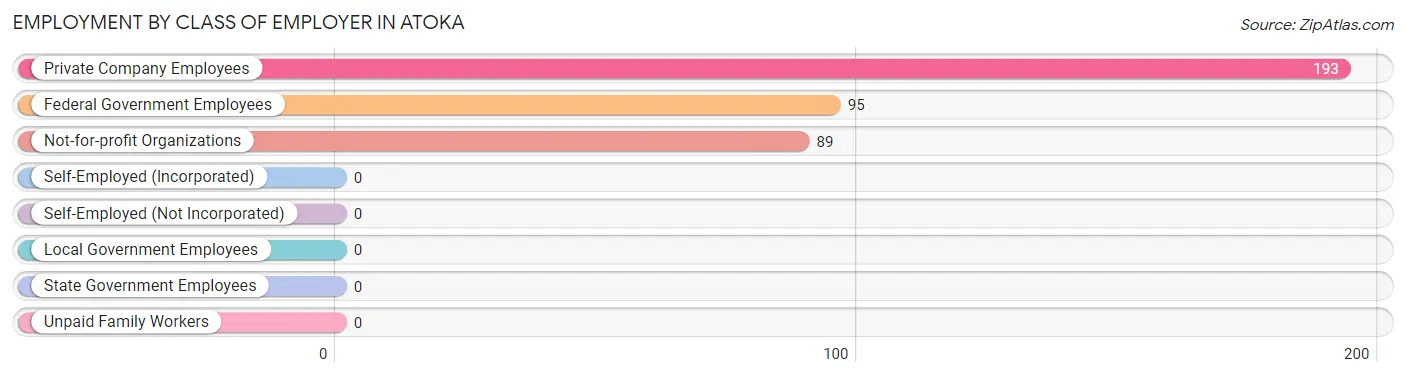
| Employer Class | # Employees | % Employees |
| Private Company Employees | 193 | 51.2% |
| Self-Employed (Incorporated) | 0 | 0.0% |
| Self-Employed (Not Incorporated) | 0 | 0.0% |
| Not-for-profit Organizations | 89 | 23.6% |
| Local Government Employees | 0 | 0.0% |
| State Government Employees | 0 | 0.0% |
| Federal Government Employees | 95 | 25.2% |
| Unpaid Family Workers | 0 | 0.0% |
| Total | 377 | 100.0% |
Employment Status by Age in Atoka
According to the labor force statistics for Atoka, out of the total population over 16 years of age (912), 42.4% or 387 individuals are in the labor force, with 2.6% or 10 of them unemployed. The age group with the highest labor force participation rate is 20 to 24 years, with 100.0% or 94 individuals in the labor force. Within the labor force, the 20 to 24 years age range has the highest percentage of unemployed individuals, with 10.6% or 10 of them being unemployed.
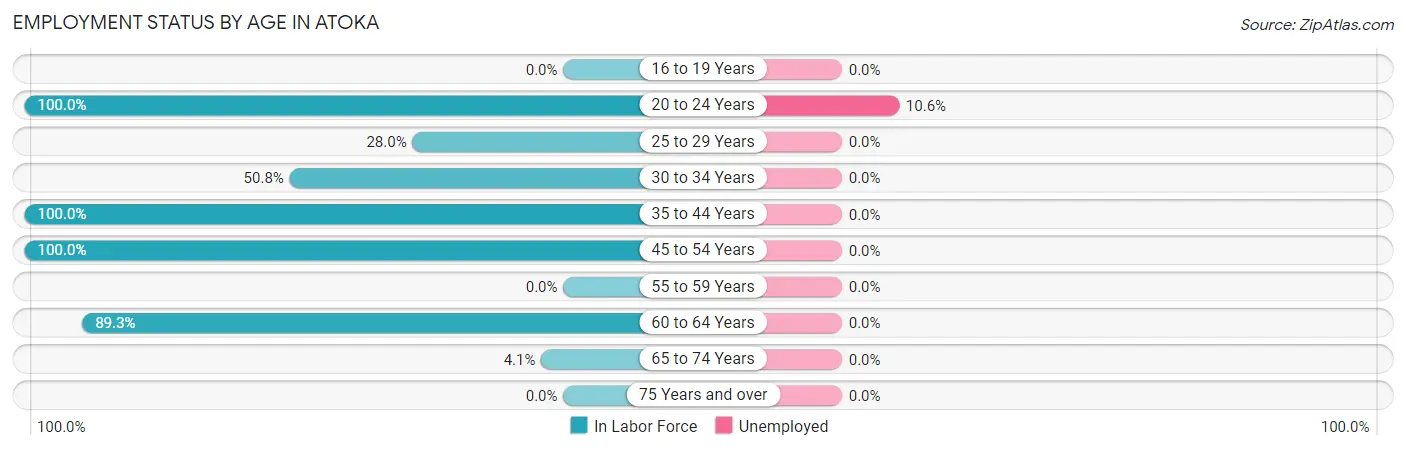
| Age Bracket | In Labor Force | Unemployed |
| 16 to 19 Years | 0 (0.0%) | 0 (0.0%) |
| 20 to 24 Years | 94 (100.0%) | 10 (10.6%) |
| 25 to 29 Years | 53 (28.0%) | 0 (0.0%) |
| 30 to 34 Years | 95 (50.8%) | 0 (0.0%) |
| 35 to 44 Years | 12 (100.0%) | 0 (0.0%) |
| 45 to 54 Years | 63 (100.0%) | 0 (0.0%) |
| 55 to 59 Years | 0 (0.0%) | 0 (0.0%) |
| 60 to 64 Years | 67 (89.3%) | 0 (0.0%) |
| 65 to 74 Years | 3 (4.1%) | 0 (0.0%) |
| 75 Years and over | 0 (0.0%) | 0 (0.0%) |
| Total | 387 (42.4%) | 10 (2.6%) |
Employment Status by Educational Attainment in Atoka
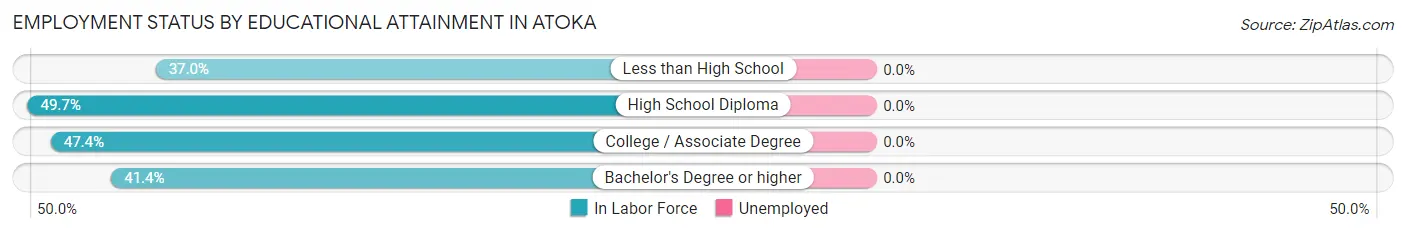
| Educational Attainment | In Labor Force | Unemployed |
| Less than High School | 10 (37.0%) | 0 (0.0%) |
| High School Diploma | 84 (49.7%) | 0 (0.0%) |
| College / Associate Degree | 184 (47.4%) | 0 (0.0%) |
| Bachelor's Degree or higher | 12 (41.4%) | 0 (0.0%) |
| Total | 290 (47.3%) | 0 (0.0%) |
Employment Occupations by Sex in Atoka
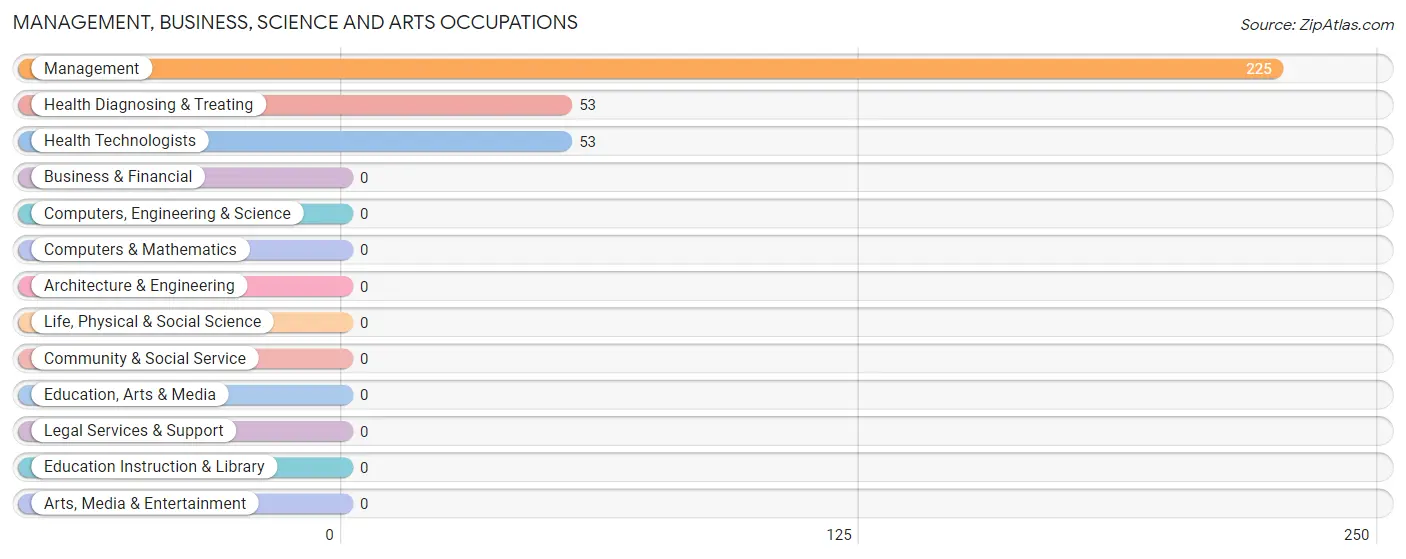
Management, Business, Science and Arts Occupations
The most common Management, Business, Science and Arts occupations in Atoka are Management (225 | 59.7%), Health Diagnosing & Treating (53 | 14.1%), and Health Technologists (53 | 14.1%).
Management, Business, Science and Arts Occupations by Sex
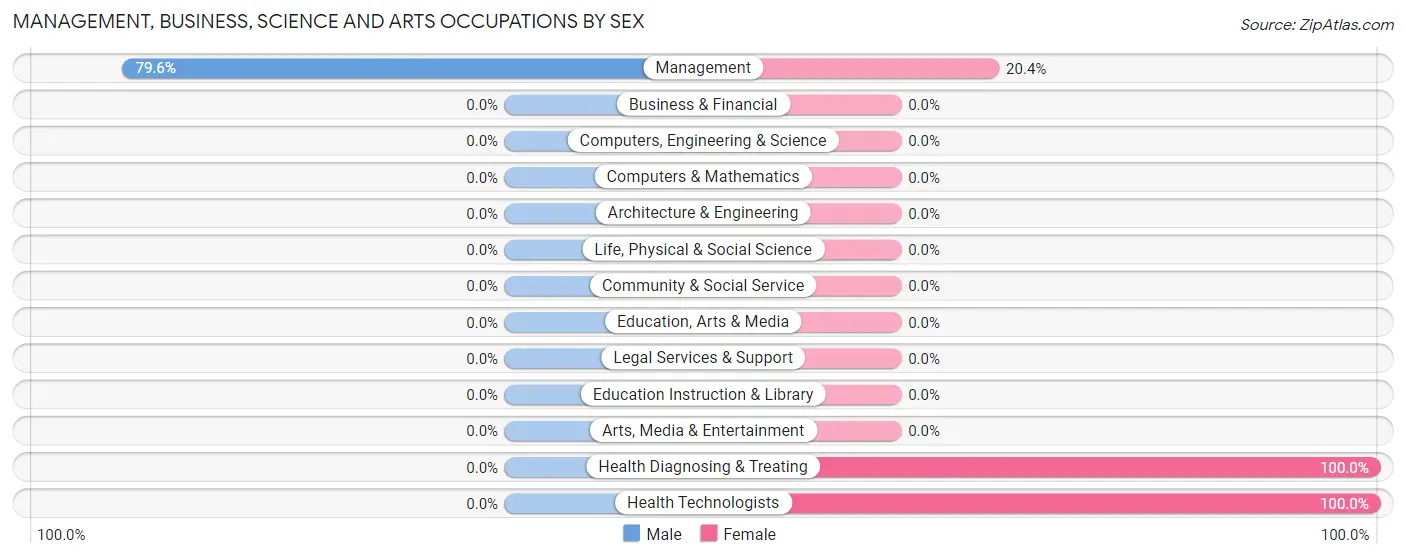
| Occupation | Male | Female |
| Management | 179 (79.6%) | 46 (20.4%) |
| Business & Financial | 0 (0.0%) | 0 (0.0%) |
| Computers, Engineering & Science | 0 (0.0%) | 0 (0.0%) |
| Computers & Mathematics | 0 (0.0%) | 0 (0.0%) |
| Architecture & Engineering | 0 (0.0%) | 0 (0.0%) |
| Life, Physical & Social Science | 0 (0.0%) | 0 (0.0%) |
| Community & Social Service | 0 (0.0%) | 0 (0.0%) |
| Education, Arts & Media | 0 (0.0%) | 0 (0.0%) |
| Legal Services & Support | 0 (0.0%) | 0 (0.0%) |
| Education Instruction & Library | 0 (0.0%) | 0 (0.0%) |
| Arts, Media & Entertainment | 0 (0.0%) | 0 (0.0%) |
| Health Diagnosing & Treating | 0 (0.0%) | 53 (100.0%) |
| Health Technologists | 0 (0.0%) | 53 (100.0%) |
| Total (Category) | 179 (64.4%) | 99 (35.6%) |
| Total (Overall) | 278 (73.7%) | 99 (26.3%) |
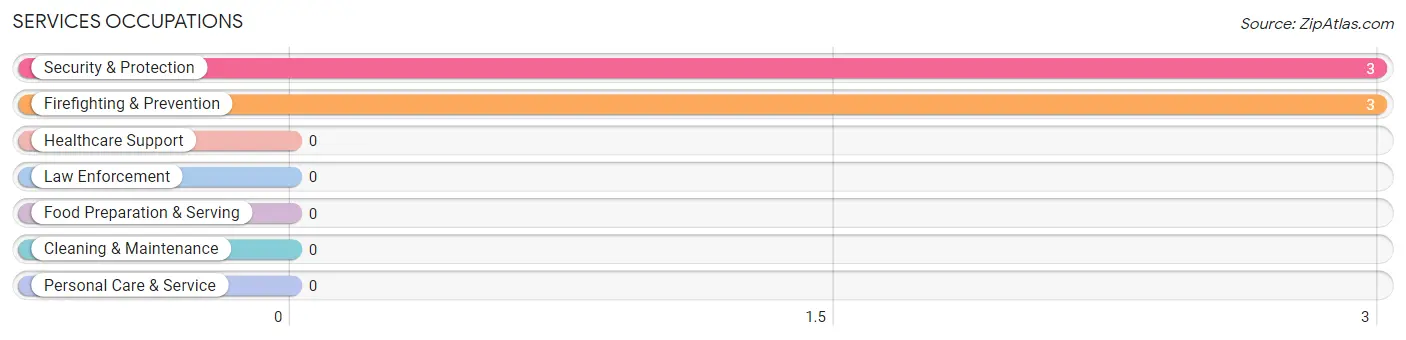
Services Occupations
The most common Services occupations in Atoka are Security & Protection (3 | 0.8%), and Firefighting & Prevention (3 | 0.8%).
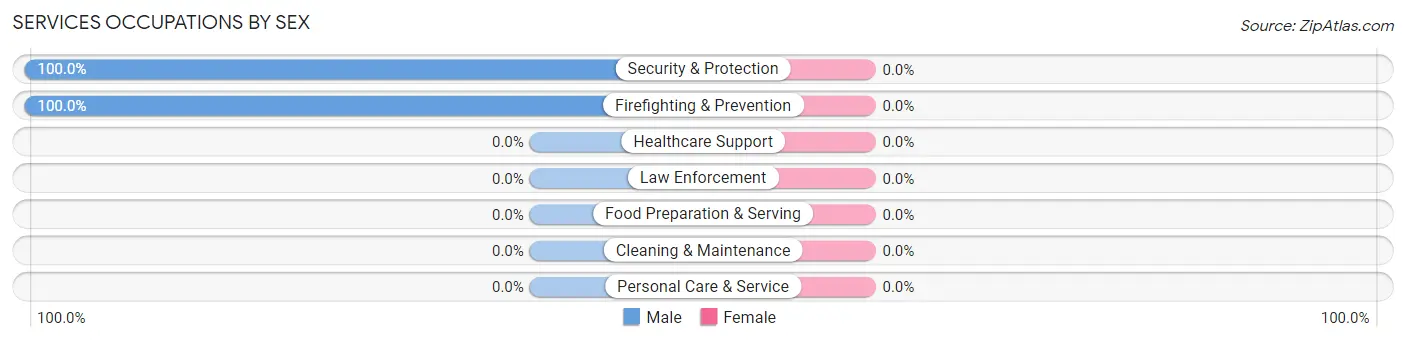
Services Occupations by Sex
| Occupation | Male | Female |
| Healthcare Support | 0 (0.0%) | 0 (0.0%) |
| Security & Protection | 3 (100.0%) | 0 (0.0%) |
| Firefighting & Prevention | 3 (100.0%) | 0 (0.0%) |
| Law Enforcement | 0 (0.0%) | 0 (0.0%) |
| Food Preparation & Serving | 0 (0.0%) | 0 (0.0%) |
| Cleaning & Maintenance | 0 (0.0%) | 0 (0.0%) |
| Personal Care & Service | 0 (0.0%) | 0 (0.0%) |
| Total (Category) | 3 (100.0%) | 0 (0.0%) |
| Total (Overall) | 278 (73.7%) | 99 (26.3%) |
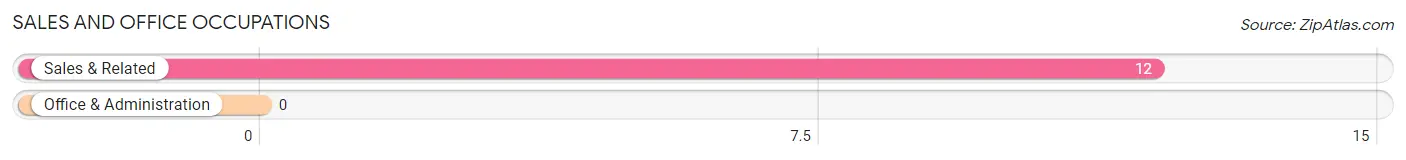
Sales and Office Occupations
The most common Sales and Office occupations in Atoka are , and Sales & Related (12 | 3.2%).
Sales and Office Occupations by Sex
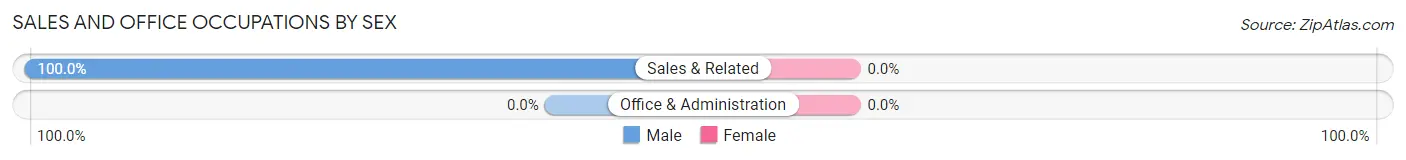
| Occupation | Male | Female |
| Sales & Related | 12 (100.0%) | 0 (0.0%) |
| Office & Administration | 0 (0.0%) | 0 (0.0%) |
| Total (Category) | 12 (100.0%) | 0 (0.0%) |
| Total (Overall) | 278 (73.7%) | 99 (26.3%) |
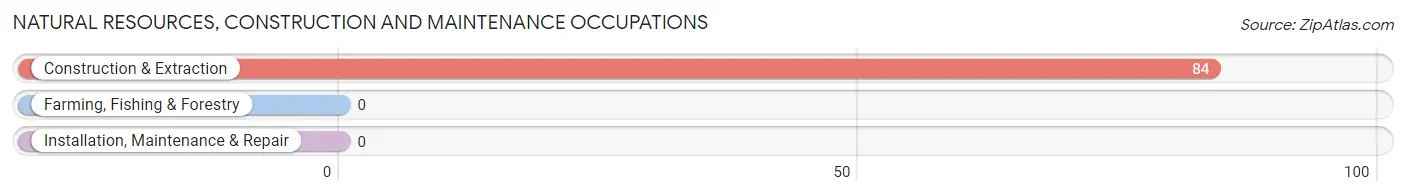
Natural Resources, Construction and Maintenance Occupations
The most common Natural Resources, Construction and Maintenance occupations in Atoka are , and Construction & Extraction (84 | 22.3%).
Natural Resources, Construction and Maintenance Occupations by Sex
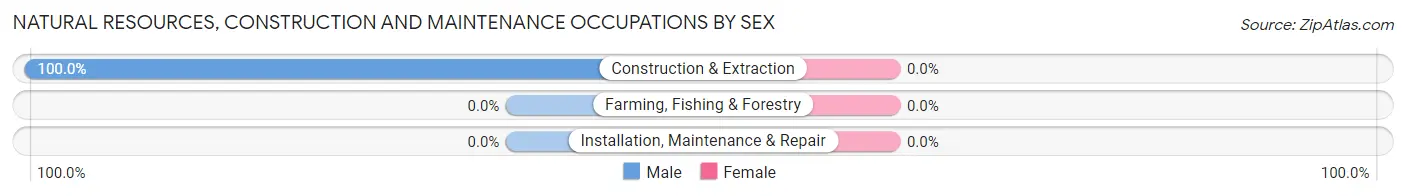
| Occupation | Male | Female |
| Farming, Fishing & Forestry | 0 (0.0%) | 0 (0.0%) |
| Construction & Extraction | 84 (100.0%) | 0 (0.0%) |
| Installation, Maintenance & Repair | 0 (0.0%) | 0 (0.0%) |
| Total (Category) | 84 (100.0%) | 0 (0.0%) |
| Total (Overall) | 278 (73.7%) | 99 (26.3%) |
Production, Transportation and Moving Occupations
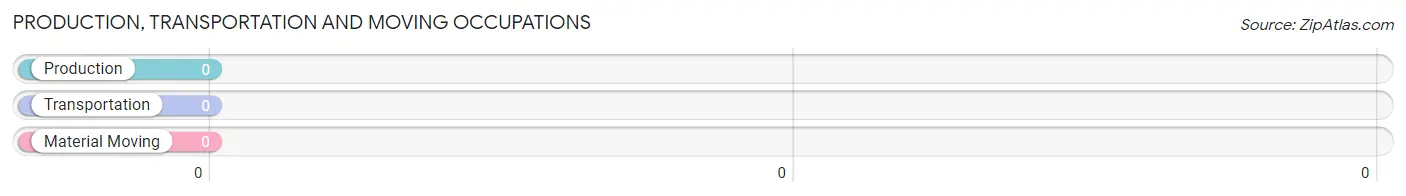
Production, Transportation and Moving Occupations by Sex
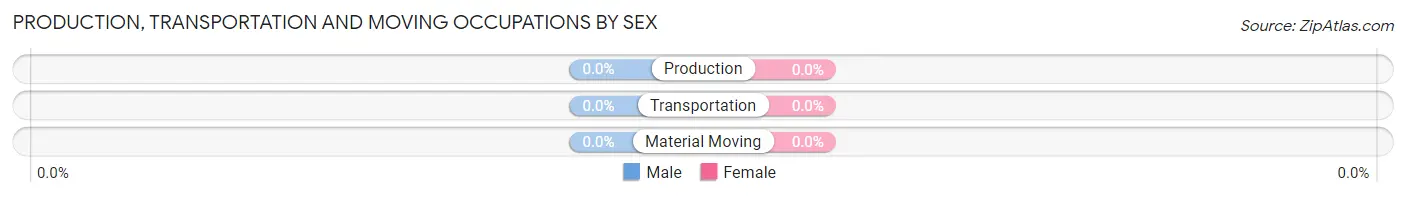
| Occupation | Male | Female |
| Production | 0 (0.0%) | 0 (0.0%) |
| Transportation | 0 (0.0%) | 0 (0.0%) |
| Material Moving | 0 (0.0%) | 0 (0.0%) |
| Total (Category) | 0 (0.0%) | 0 (0.0%) |
| Total (Overall) | 278 (73.7%) | 99 (26.3%) |
Employment Industries by Sex in Atoka
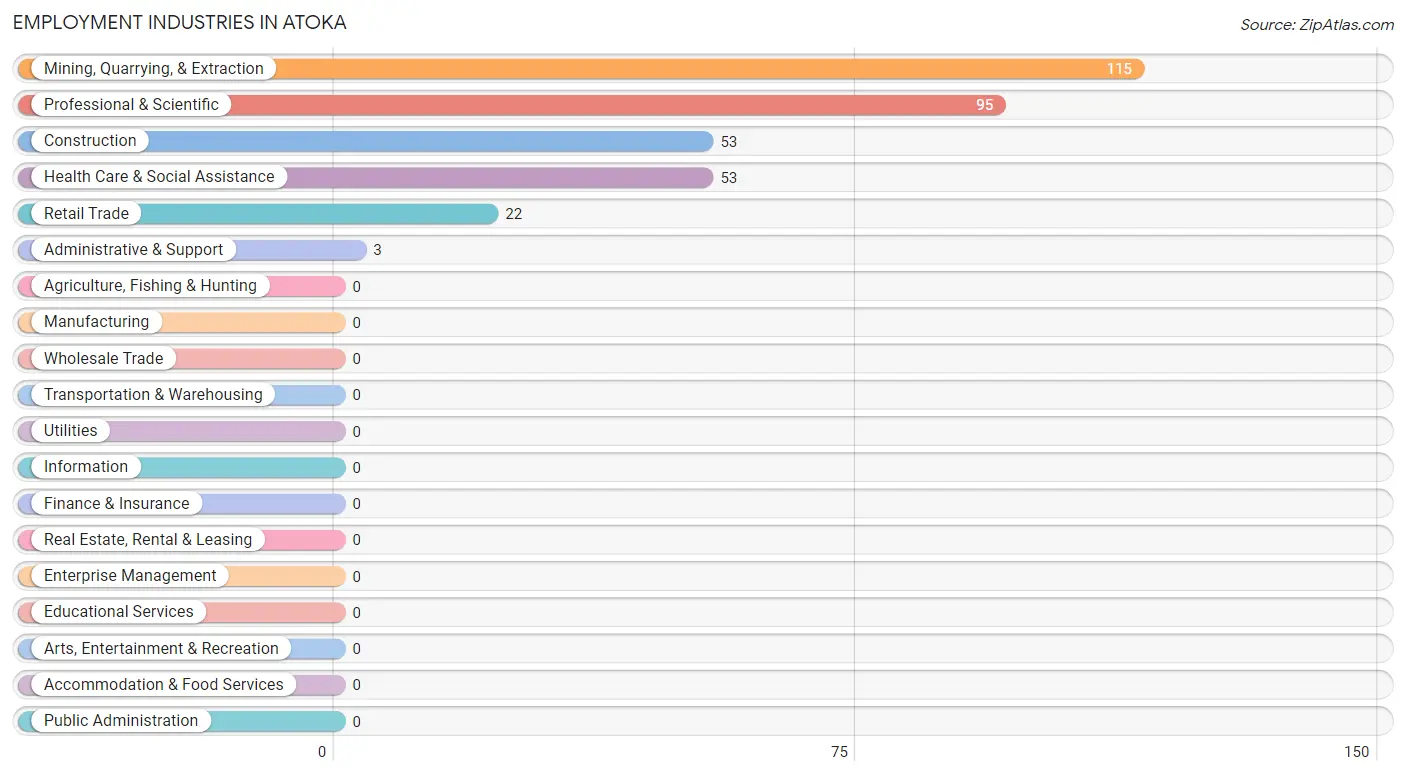
Employment Industries in Atoka
The major employment industries in Atoka include Mining, Quarrying, & Extraction (115 | 30.5%), Professional & Scientific (95 | 25.2%), Construction (53 | 14.1%), Health Care & Social Assistance (53 | 14.1%), and Retail Trade (22 | 5.8%).
Employment Industries by Sex in Atoka
The Atoka industries that see more men than women are Mining, Quarrying, & Extraction (100.0%), Construction (100.0%), and Professional & Scientific (100.0%), whereas the industries that tend to have a higher number of women are Health Care & Social Assistance (100.0%), and Retail Trade (45.5%).
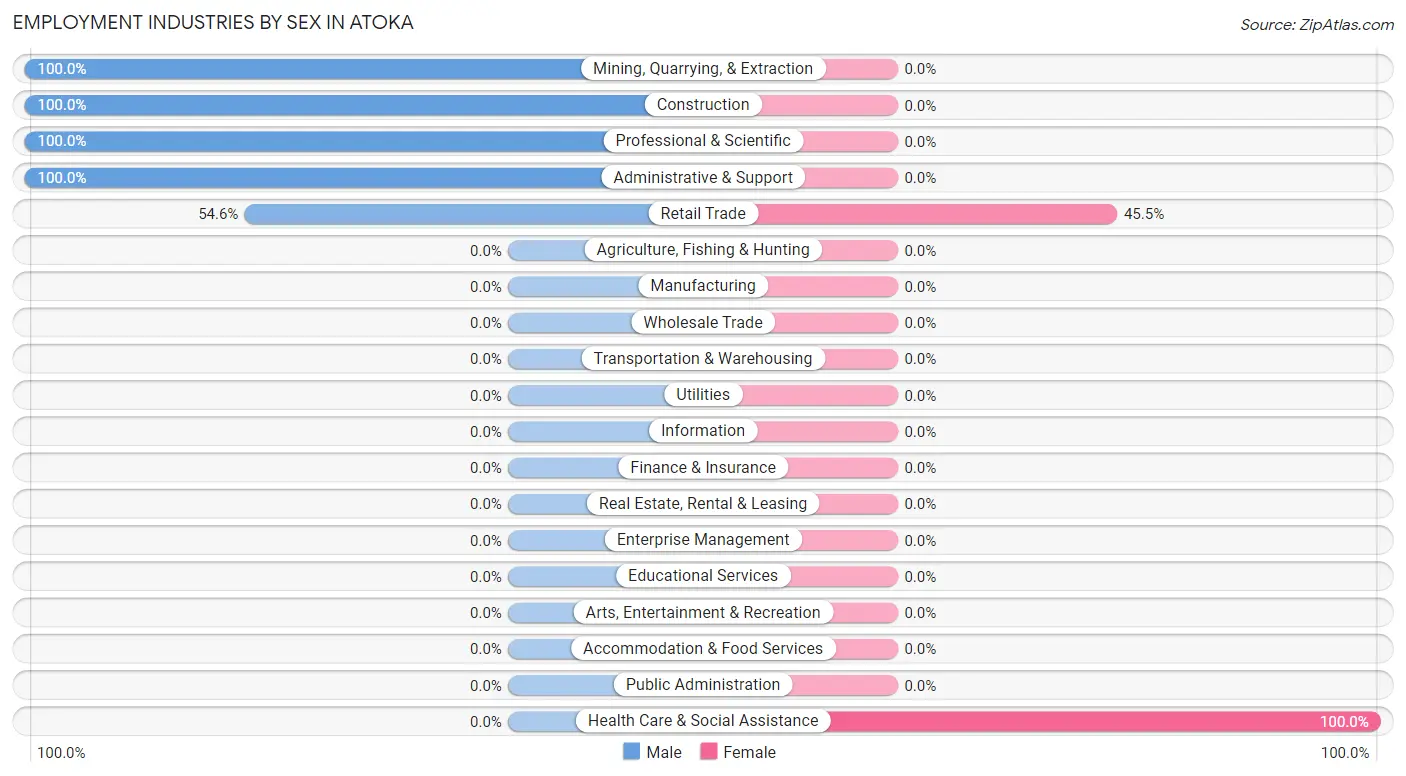
| Industry | Male | Female |
| Agriculture, Fishing & Hunting | 0 (0.0%) | 0 (0.0%) |
| Mining, Quarrying, & Extraction | 115 (100.0%) | 0 (0.0%) |
| Construction | 53 (100.0%) | 0 (0.0%) |
| Manufacturing | 0 (0.0%) | 0 (0.0%) |
| Wholesale Trade | 0 (0.0%) | 0 (0.0%) |
| Retail Trade | 12 (54.5%) | 10 (45.5%) |
| Transportation & Warehousing | 0 (0.0%) | 0 (0.0%) |
| Utilities | 0 (0.0%) | 0 (0.0%) |
| Information | 0 (0.0%) | 0 (0.0%) |
| Finance & Insurance | 0 (0.0%) | 0 (0.0%) |
| Real Estate, Rental & Leasing | 0 (0.0%) | 0 (0.0%) |
| Professional & Scientific | 95 (100.0%) | 0 (0.0%) |
| Enterprise Management | 0 (0.0%) | 0 (0.0%) |
| Administrative & Support | 3 (100.0%) | 0 (0.0%) |
| Educational Services | 0 (0.0%) | 0 (0.0%) |
| Health Care & Social Assistance | 0 (0.0%) | 53 (100.0%) |
| Arts, Entertainment & Recreation | 0 (0.0%) | 0 (0.0%) |
| Accommodation & Food Services | 0 (0.0%) | 0 (0.0%) |
| Public Administration | 0 (0.0%) | 0 (0.0%) |
| Total | 278 (73.7%) | 99 (26.3%) |
Education in Atoka
School Enrollment in Atoka
The most common levels of schooling among the 244 students in Atoka are elementary school (188 | 77.0%), middle school (48 | 19.7%), and high school (8 | 3.3%).
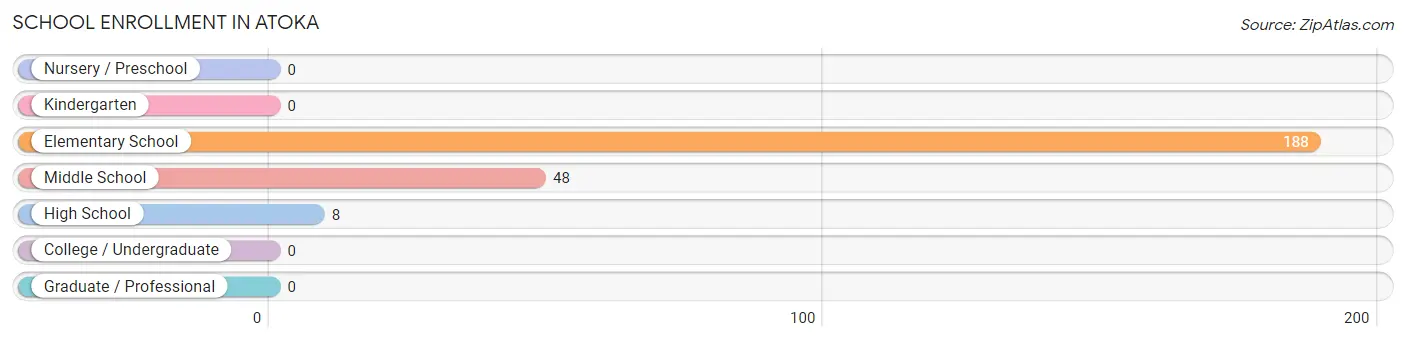
| School Level | # Students | % Students |
| Nursery / Preschool | 0 | 0.0% |
| Kindergarten | 0 | 0.0% |
| Elementary School | 188 | 77.0% |
| Middle School | 48 | 19.7% |
| High School | 8 | 3.3% |
| College / Undergraduate | 0 | 0.0% |
| Graduate / Professional | 0 | 0.0% |
| Total | 244 | 100.0% |
School Enrollment by Age by Funding Source in Atoka
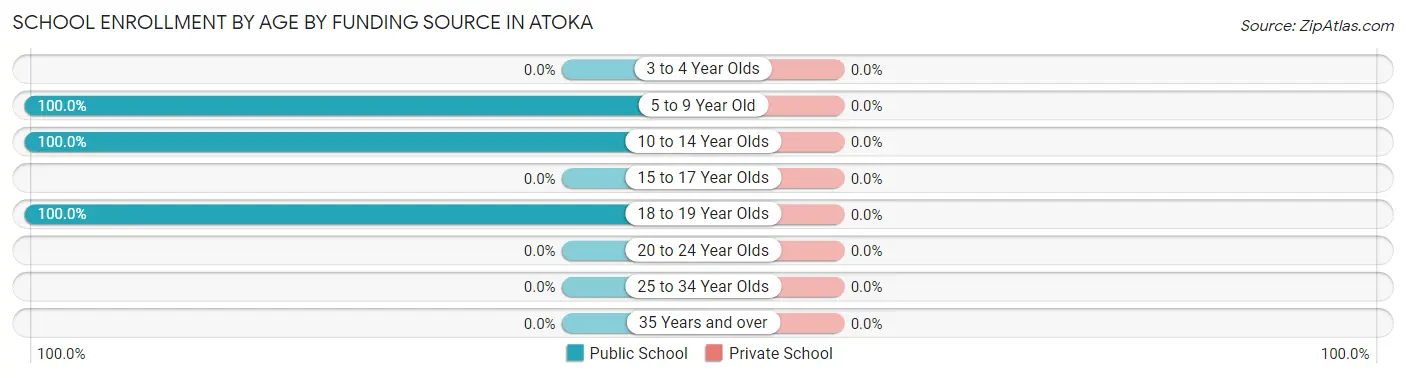
| Age Bracket | Public School | Private School |
| 3 to 4 Year Olds | 0 (0.0%) | 0 (0.0%) |
| 5 to 9 Year Old | 188 (100.0%) | 0 (0.0%) |
| 10 to 14 Year Olds | 48 (100.0%) | 0 (0.0%) |
| 15 to 17 Year Olds | 0 (0.0%) | 0 (0.0%) |
| 18 to 19 Year Olds | 8 (100.0%) | 0 (0.0%) |
| 20 to 24 Year Olds | 0 (0.0%) | 0 (0.0%) |
| 25 to 34 Year Olds | 0 (0.0%) | 0 (0.0%) |
| 35 Years and over | 0 (0.0%) | 0 (0.0%) |
| Total | 244 (100.0%) | 0 (0.0%) |
Educational Attainment by Field of Study in Atoka
Bio, nature & agricultural (29 | 65.9%), and education (15 | 34.1%) are the most common fields of study among 44 individuals in Atoka who have obtained a bachelor's degree or higher.
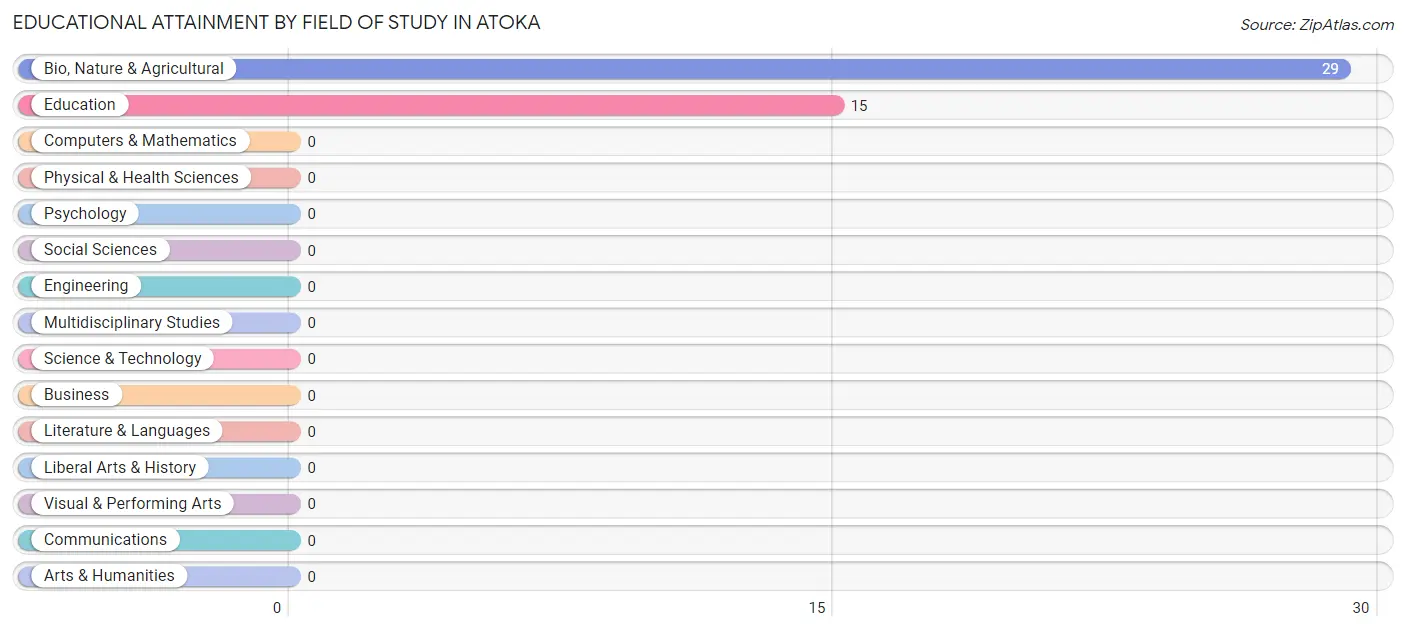
| Field of Study | # Graduates | % Graduates |
| Computers & Mathematics | 0 | 0.0% |
| Bio, Nature & Agricultural | 29 | 65.9% |
| Physical & Health Sciences | 0 | 0.0% |
| Psychology | 0 | 0.0% |
| Social Sciences | 0 | 0.0% |
| Engineering | 0 | 0.0% |
| Multidisciplinary Studies | 0 | 0.0% |
| Science & Technology | 0 | 0.0% |
| Business | 0 | 0.0% |
| Education | 15 | 34.1% |
| Literature & Languages | 0 | 0.0% |
| Liberal Arts & History | 0 | 0.0% |
| Visual & Performing Arts | 0 | 0.0% |
| Communications | 0 | 0.0% |
| Arts & Humanities | 0 | 0.0% |
| Total | 44 | 100.0% |
Transportation & Commute in Atoka
Vehicle Availability by Sex in Atoka
The most prevalent vehicle ownership categories in Atoka are males with 2 vehicles (137, accounting for 49.3%) and females with 2 vehicles (53, making up 138.4%).
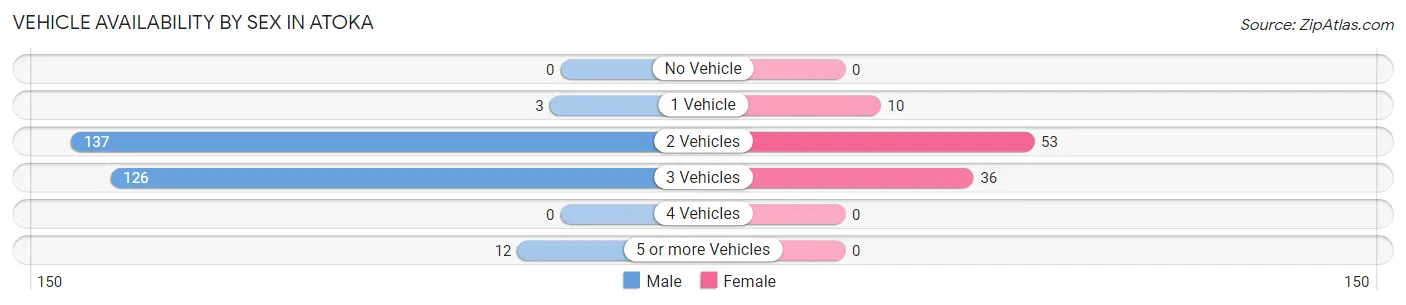
| Vehicles Available | Male | Female |
| No Vehicle | 0 (0.0%) | 0 (0.0%) |
| 1 Vehicle | 3 (1.1%) | 10 (10.1%) |
| 2 Vehicles | 137 (49.3%) | 53 (53.5%) |
| 3 Vehicles | 126 (45.3%) | 36 (36.4%) |
| 4 Vehicles | 0 (0.0%) | 0 (0.0%) |
| 5 or more Vehicles | 12 (4.3%) | 0 (0.0%) |
| Total | 278 (100.0%) | 99 (100.0%) |
Commute Time in Atoka
The most frequently occuring commute durations in Atoka are 15 to 19 minutes (179 commuters, 47.9%), 5 to 9 minutes (120 commuters, 32.1%), and 60 to 89 minutes (53 commuters, 14.2%).
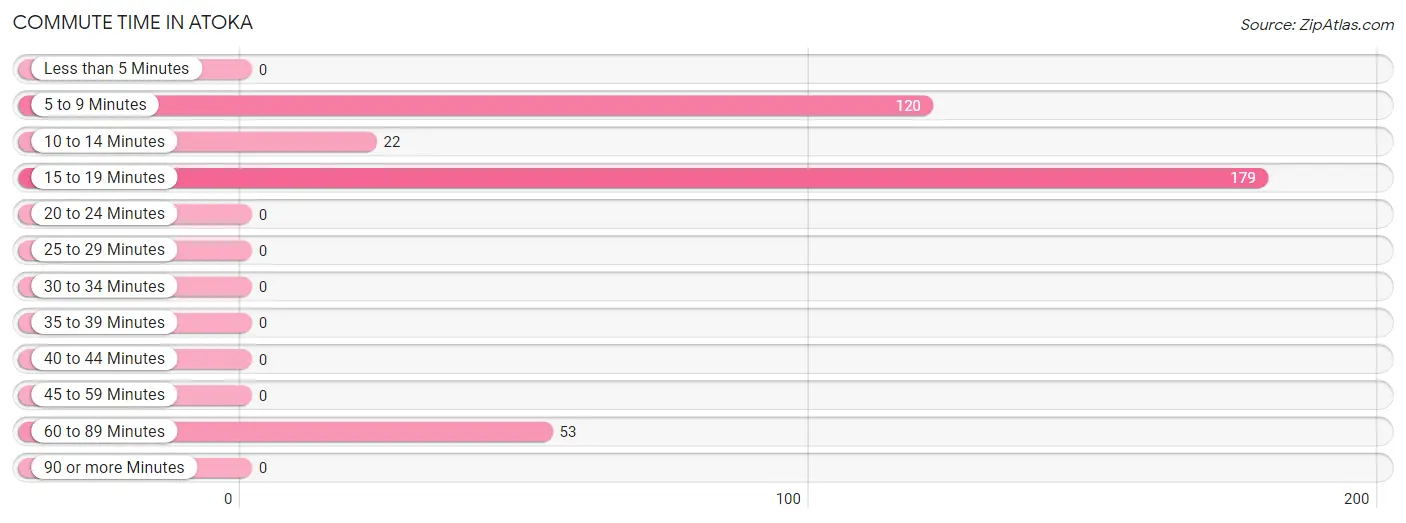
| Commute Time | # Commuters | % Commuters |
| Less than 5 Minutes | 0 | 0.0% |
| 5 to 9 Minutes | 120 | 32.1% |
| 10 to 14 Minutes | 22 | 5.9% |
| 15 to 19 Minutes | 179 | 47.9% |
| 20 to 24 Minutes | 0 | 0.0% |
| 25 to 29 Minutes | 0 | 0.0% |
| 30 to 34 Minutes | 0 | 0.0% |
| 35 to 39 Minutes | 0 | 0.0% |
| 40 to 44 Minutes | 0 | 0.0% |
| 45 to 59 Minutes | 0 | 0.0% |
| 60 to 89 Minutes | 53 | 14.2% |
| 90 or more Minutes | 0 | 0.0% |
Commute Time by Sex in Atoka
The most common commute times in Atoka are 15 to 19 minutes (179 commuters, 65.1%) for males and 5 to 9 minutes (89 commuters, 89.9%) for females.
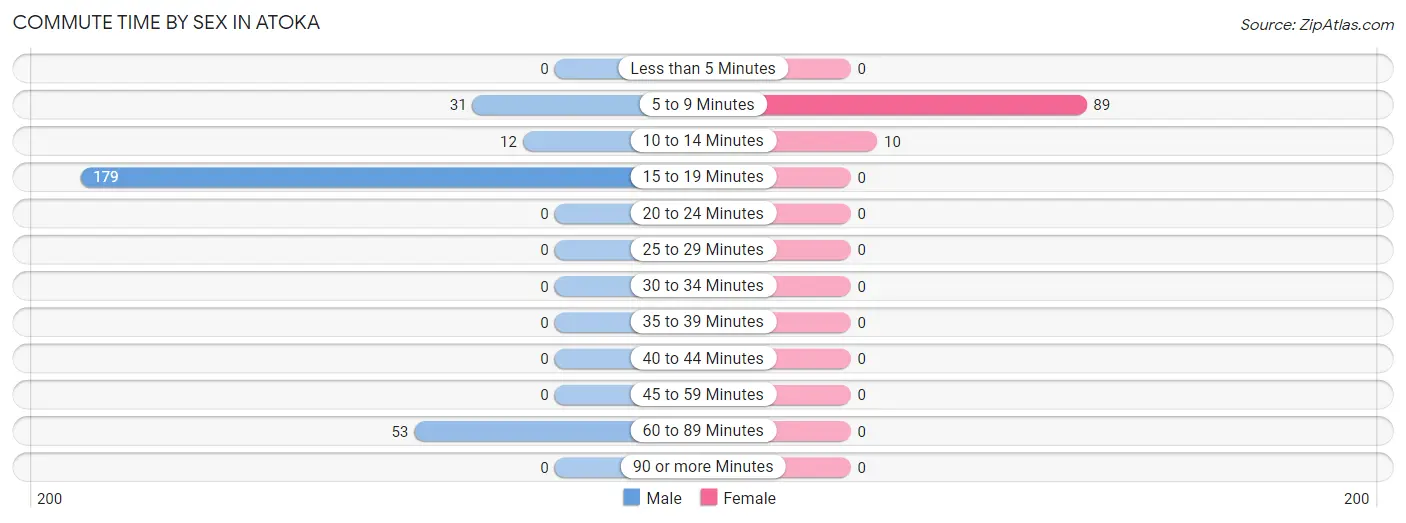
| Commute Time | Male | Female |
| Less than 5 Minutes | 0 (0.0%) | 0 (0.0%) |
| 5 to 9 Minutes | 31 (11.3%) | 89 (89.9%) |
| 10 to 14 Minutes | 12 (4.4%) | 10 (10.1%) |
| 15 to 19 Minutes | 179 (65.1%) | 0 (0.0%) |
| 20 to 24 Minutes | 0 (0.0%) | 0 (0.0%) |
| 25 to 29 Minutes | 0 (0.0%) | 0 (0.0%) |
| 30 to 34 Minutes | 0 (0.0%) | 0 (0.0%) |
| 35 to 39 Minutes | 0 (0.0%) | 0 (0.0%) |
| 40 to 44 Minutes | 0 (0.0%) | 0 (0.0%) |
| 45 to 59 Minutes | 0 (0.0%) | 0 (0.0%) |
| 60 to 89 Minutes | 53 (19.3%) | 0 (0.0%) |
| 90 or more Minutes | 0 (0.0%) | 0 (0.0%) |
Time of Departure to Work by Sex in Atoka
The most frequent times of departure to work in Atoka are 9:00 AM to 9:59 AM (95, 34.5%) for males and 6:30 AM to 6:59 AM (53, 53.5%) for females.
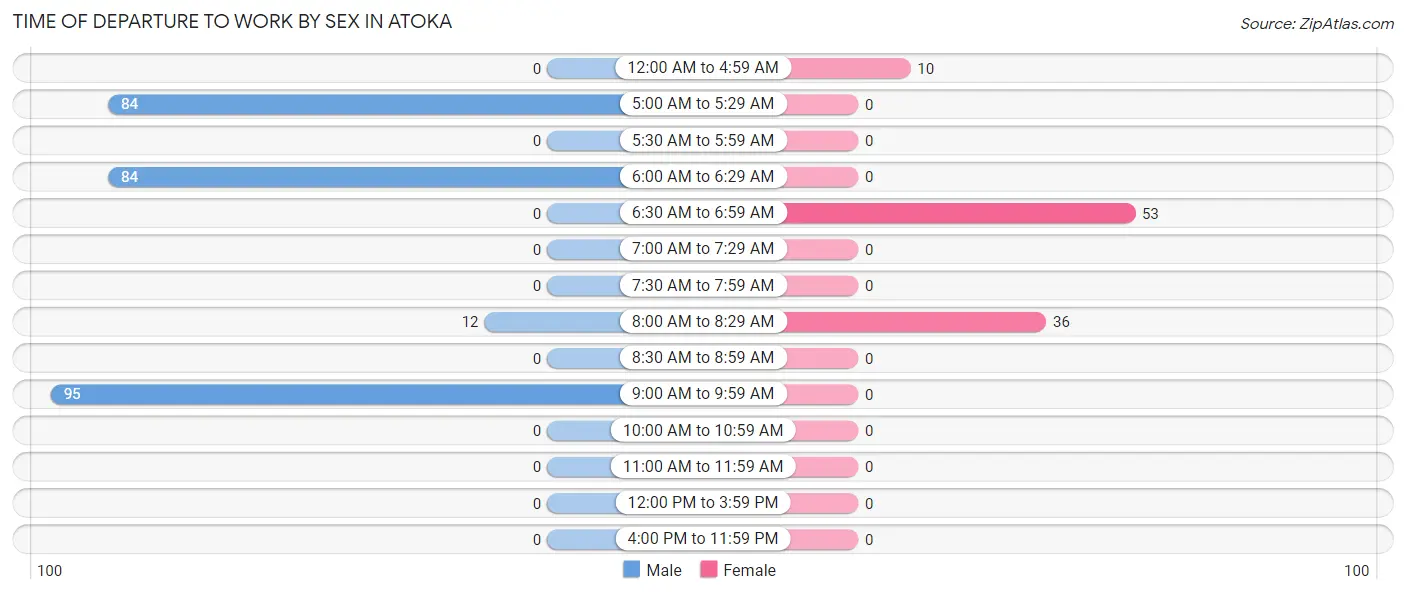
| Time of Departure | Male | Female |
| 12:00 AM to 4:59 AM | 0 (0.0%) | 10 (10.1%) |
| 5:00 AM to 5:29 AM | 84 (30.5%) | 0 (0.0%) |
| 5:30 AM to 5:59 AM | 0 (0.0%) | 0 (0.0%) |
| 6:00 AM to 6:29 AM | 84 (30.5%) | 0 (0.0%) |
| 6:30 AM to 6:59 AM | 0 (0.0%) | 53 (53.5%) |
| 7:00 AM to 7:29 AM | 0 (0.0%) | 0 (0.0%) |
| 7:30 AM to 7:59 AM | 0 (0.0%) | 0 (0.0%) |
| 8:00 AM to 8:29 AM | 12 (4.4%) | 36 (36.4%) |
| 8:30 AM to 8:59 AM | 0 (0.0%) | 0 (0.0%) |
| 9:00 AM to 9:59 AM | 95 (34.5%) | 0 (0.0%) |
| 10:00 AM to 10:59 AM | 0 (0.0%) | 0 (0.0%) |
| 11:00 AM to 11:59 AM | 0 (0.0%) | 0 (0.0%) |
| 12:00 PM to 3:59 PM | 0 (0.0%) | 0 (0.0%) |
| 4:00 PM to 11:59 PM | 0 (0.0%) | 0 (0.0%) |
| Total | 275 (100.0%) | 99 (100.0%) |
Housing Occupancy in Atoka
Occupancy by Ownership in Atoka
Of the total 508 dwellings in Atoka, owner-occupied units account for 388 (76.4%), while renter-occupied units make up 120 (23.6%).
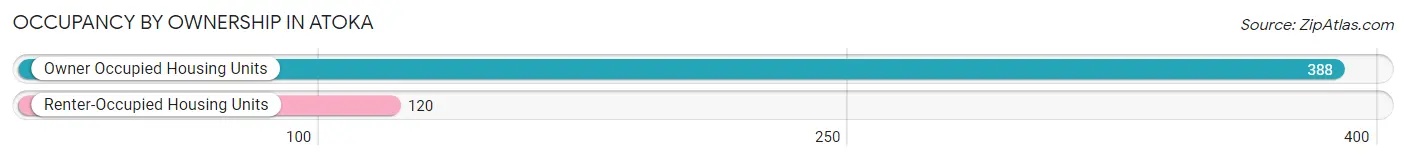
| Occupancy | # Housing Units | % Housing Units |
| Owner Occupied Housing Units | 388 | 76.4% |
| Renter-Occupied Housing Units | 120 | 23.6% |
| Total Occupied Housing Units | 508 | 100.0% |
Occupancy by Household Size in Atoka
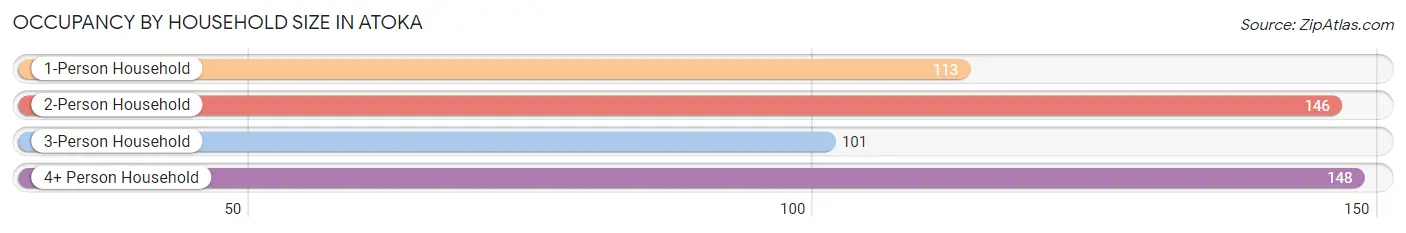
| Household Size | # Housing Units | % Housing Units |
| 1-Person Household | 113 | 22.2% |
| 2-Person Household | 146 | 28.7% |
| 3-Person Household | 101 | 19.9% |
| 4+ Person Household | 148 | 29.1% |
| Total Housing Units | 508 | 100.0% |
Occupancy by Ownership by Household Size in Atoka
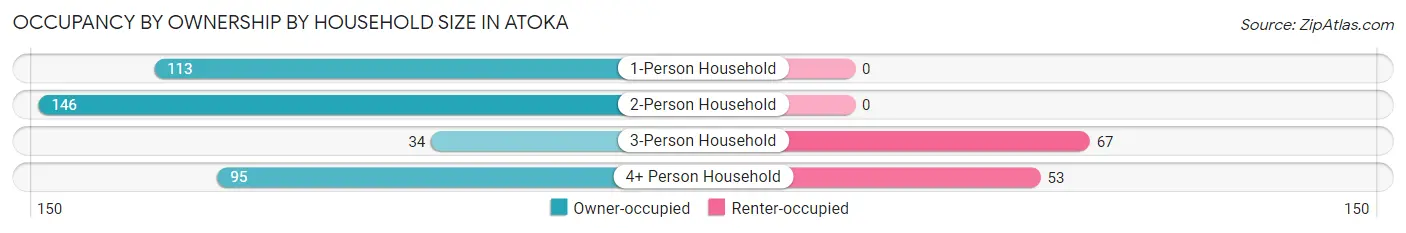
| Household Size | Owner-occupied | Renter-occupied |
| 1-Person Household | 113 (100.0%) | 0 (0.0%) |
| 2-Person Household | 146 (100.0%) | 0 (0.0%) |
| 3-Person Household | 34 (33.7%) | 67 (66.3%) |
| 4+ Person Household | 95 (64.2%) | 53 (35.8%) |
| Total Housing Units | 388 (76.4%) | 120 (23.6%) |
Occupancy by Educational Attainment in Atoka
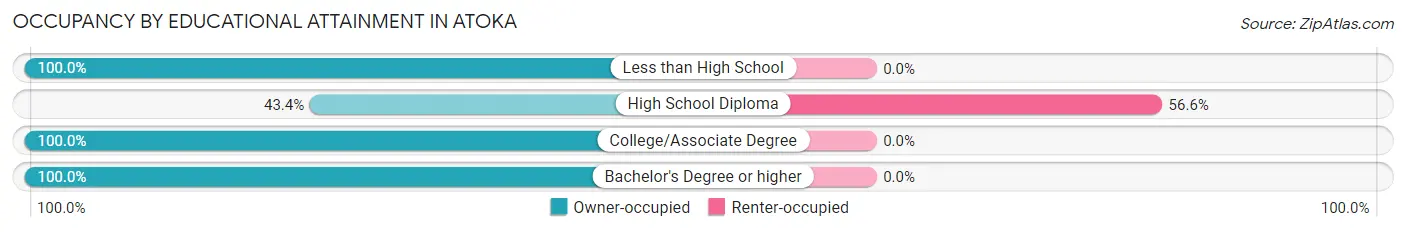
| Household Size | Owner-occupied | Renter-occupied |
| Less than High School | 77 (100.0%) | 0 (0.0%) |
| High School Diploma | 92 (43.4%) | 120 (56.6%) |
| College/Associate Degree | 187 (100.0%) | 0 (0.0%) |
| Bachelor's Degree or higher | 32 (100.0%) | 0 (0.0%) |
Occupancy by Age of Householder in Atoka
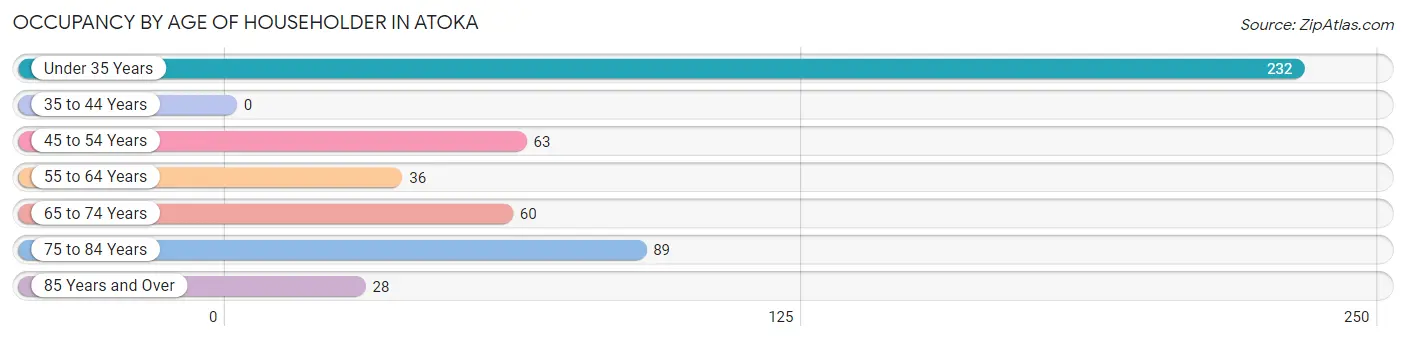
| Age Bracket | # Households | % Households |
| Under 35 Years | 232 | 45.7% |
| 35 to 44 Years | 0 | 0.0% |
| 45 to 54 Years | 63 | 12.4% |
| 55 to 64 Years | 36 | 7.1% |
| 65 to 74 Years | 60 | 11.8% |
| 75 to 84 Years | 89 | 17.5% |
| 85 Years and Over | 28 | 5.5% |
| Total | 508 | 100.0% |
Housing Finances in Atoka
Median Income by Occupancy in Atoka
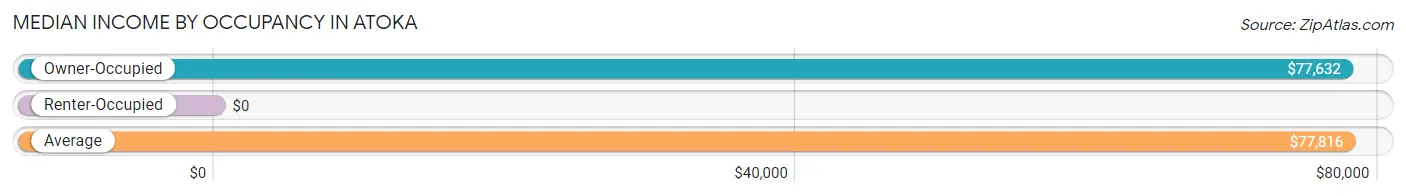
| Occupancy Type | # Households | Median Income |
| Owner-Occupied | 388 (76.4%) | $77,632 |
| Renter-Occupied | 120 (23.6%) | $0 |
| Average | 508 (100.0%) | $77,816 |
Occupancy by Householder Income Bracket in Atoka
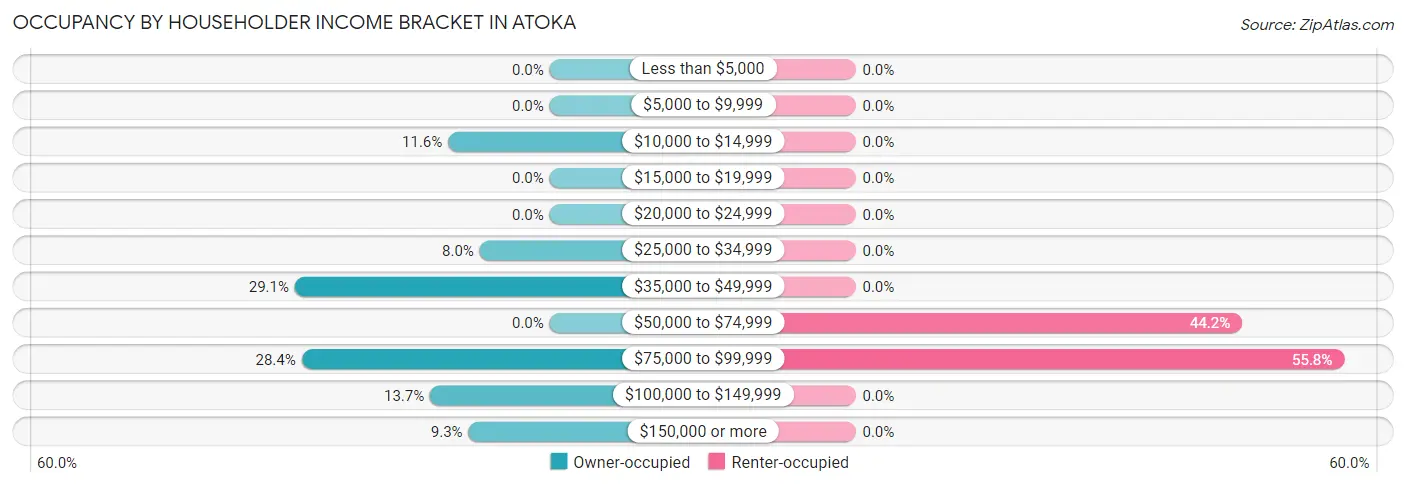
| Income Bracket | Owner-occupied | Renter-occupied |
| Less than $5,000 | 0 (0.0%) | 0 (0.0%) |
| $5,000 to $9,999 | 0 (0.0%) | 0 (0.0%) |
| $10,000 to $14,999 | 45 (11.6%) | 0 (0.0%) |
| $15,000 to $19,999 | 0 (0.0%) | 0 (0.0%) |
| $20,000 to $24,999 | 0 (0.0%) | 0 (0.0%) |
| $25,000 to $34,999 | 31 (8.0%) | 0 (0.0%) |
| $35,000 to $49,999 | 113 (29.1%) | 0 (0.0%) |
| $50,000 to $74,999 | 0 (0.0%) | 53 (44.2%) |
| $75,000 to $99,999 | 110 (28.3%) | 67 (55.8%) |
| $100,000 to $149,999 | 53 (13.7%) | 0 (0.0%) |
| $150,000 or more | 36 (9.3%) | 0 (0.0%) |
| Total | 388 (100.0%) | 120 (100.0%) |
Monthly Housing Cost Tiers in Atoka
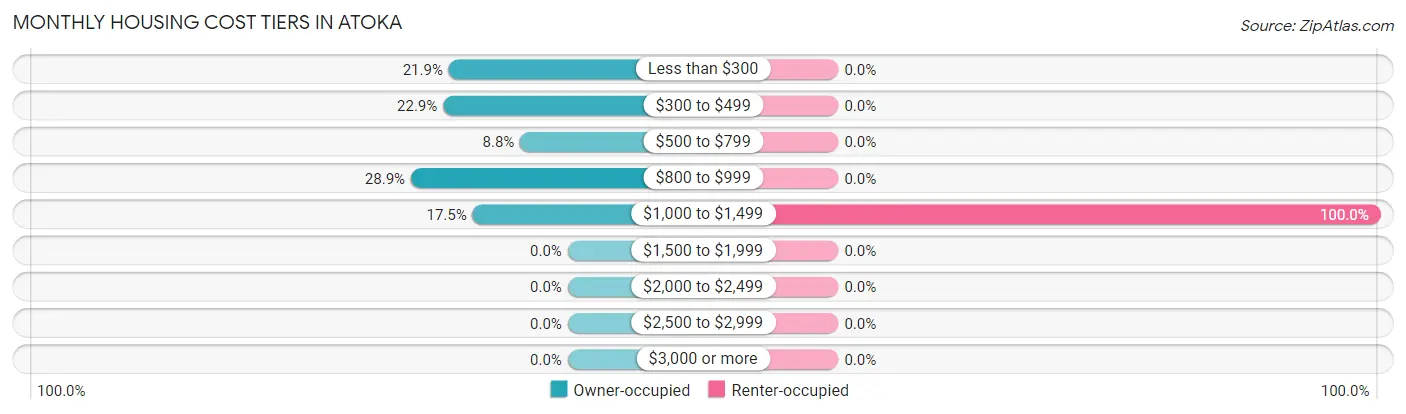
| Monthly Cost | Owner-occupied | Renter-occupied |
| Less than $300 | 85 (21.9%) | 0 (0.0%) |
| $300 to $499 | 89 (22.9%) | 0 (0.0%) |
| $500 to $799 | 34 (8.8%) | 0 (0.0%) |
| $800 to $999 | 112 (28.9%) | 0 (0.0%) |
| $1,000 to $1,499 | 68 (17.5%) | 120 (100.0%) |
| $1,500 to $1,999 | 0 (0.0%) | 0 (0.0%) |
| $2,000 to $2,499 | 0 (0.0%) | 0 (0.0%) |
| $2,500 to $2,999 | 0 (0.0%) | 0 (0.0%) |
| $3,000 or more | 0 (0.0%) | 0 (0.0%) |
| Total | 388 (100.0%) | 120 (100.0%) |
Physical Housing Characteristics in Atoka
Housing Structures in Atoka
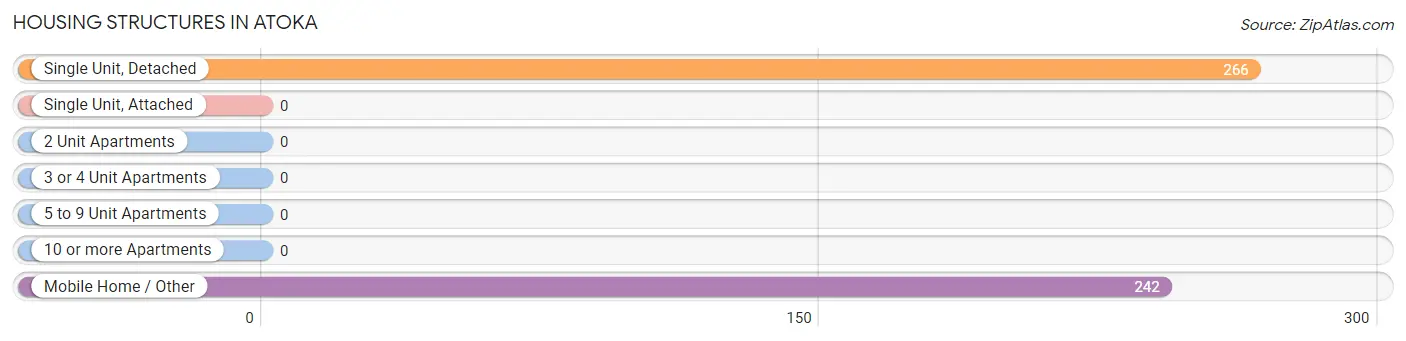
| Structure Type | # Housing Units | % Housing Units |
| Single Unit, Detached | 266 | 52.4% |
| Single Unit, Attached | 0 | 0.0% |
| 2 Unit Apartments | 0 | 0.0% |
| 3 or 4 Unit Apartments | 0 | 0.0% |
| 5 to 9 Unit Apartments | 0 | 0.0% |
| 10 or more Apartments | 0 | 0.0% |
| Mobile Home / Other | 242 | 47.6% |
| Total | 508 | 100.0% |
Housing Structures by Occupancy in Atoka
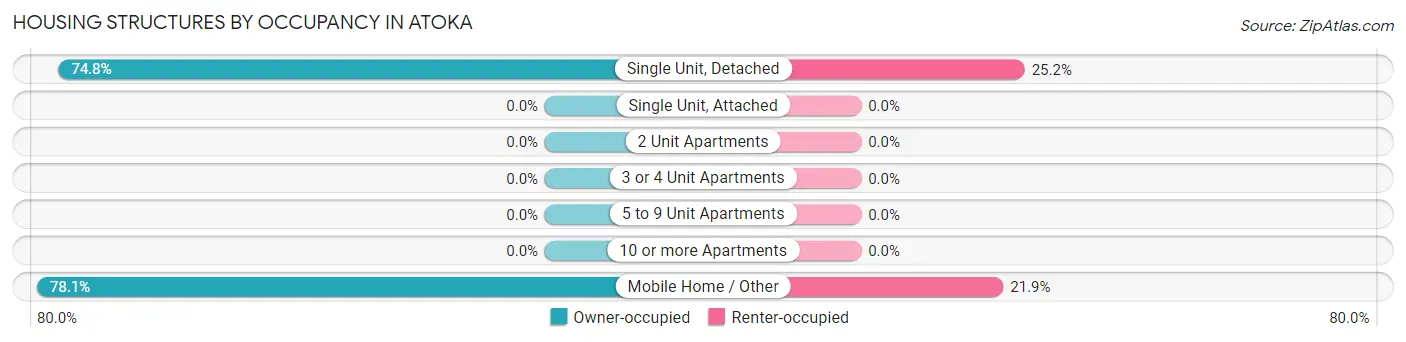
| Structure Type | Owner-occupied | Renter-occupied |
| Single Unit, Detached | 199 (74.8%) | 67 (25.2%) |
| Single Unit, Attached | 0 (0.0%) | 0 (0.0%) |
| 2 Unit Apartments | 0 (0.0%) | 0 (0.0%) |
| 3 or 4 Unit Apartments | 0 (0.0%) | 0 (0.0%) |
| 5 to 9 Unit Apartments | 0 (0.0%) | 0 (0.0%) |
| 10 or more Apartments | 0 (0.0%) | 0 (0.0%) |
| Mobile Home / Other | 189 (78.1%) | 53 (21.9%) |
| Total | 388 (76.4%) | 120 (23.6%) |
Housing Structures by Number of Rooms in Atoka
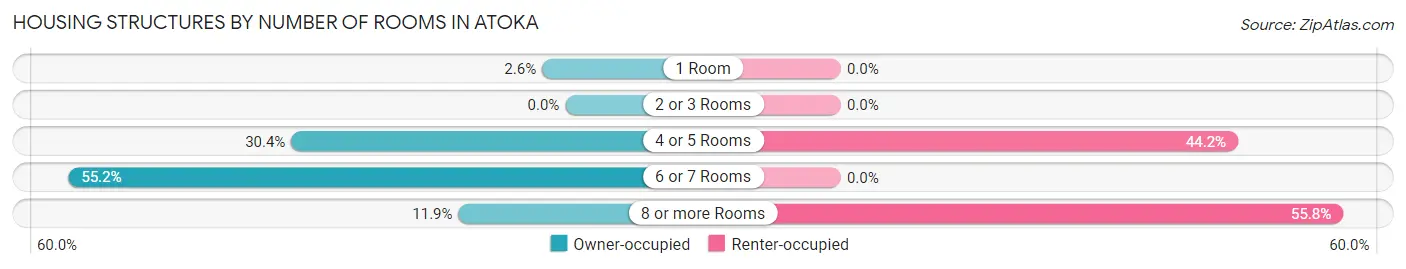
| Number of Rooms | Owner-occupied | Renter-occupied |
| 1 Room | 10 (2.6%) | 0 (0.0%) |
| 2 or 3 Rooms | 0 (0.0%) | 0 (0.0%) |
| 4 or 5 Rooms | 118 (30.4%) | 53 (44.2%) |
| 6 or 7 Rooms | 214 (55.1%) | 0 (0.0%) |
| 8 or more Rooms | 46 (11.9%) | 67 (55.8%) |
| Total | 388 (100.0%) | 120 (100.0%) |
Housing Structure by Heating Type in Atoka
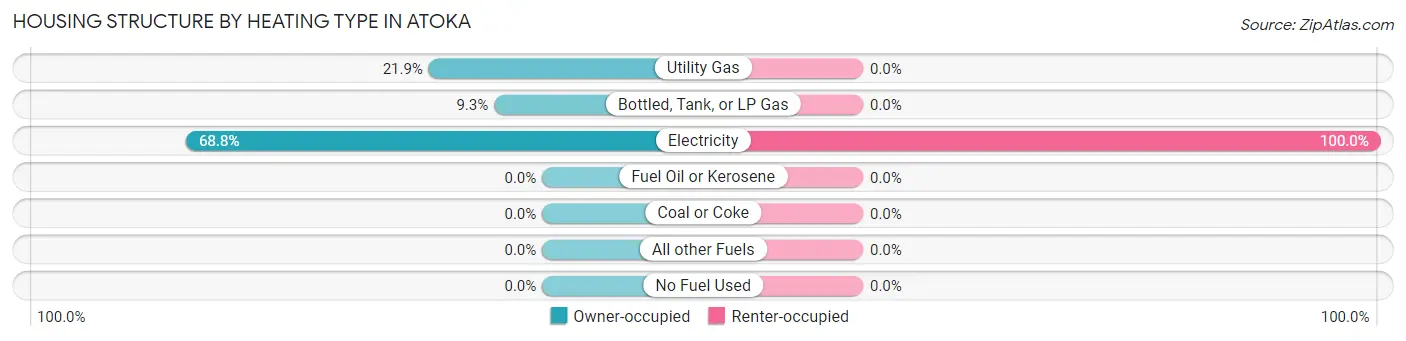
| Heating Type | Owner-occupied | Renter-occupied |
| Utility Gas | 85 (21.9%) | 0 (0.0%) |
| Bottled, Tank, or LP Gas | 36 (9.3%) | 0 (0.0%) |
| Electricity | 267 (68.8%) | 120 (100.0%) |
| Fuel Oil or Kerosene | 0 (0.0%) | 0 (0.0%) |
| Coal or Coke | 0 (0.0%) | 0 (0.0%) |
| All other Fuels | 0 (0.0%) | 0 (0.0%) |
| No Fuel Used | 0 (0.0%) | 0 (0.0%) |
| Total | 388 (100.0%) | 120 (100.0%) |
Household Vehicle Usage in Atoka
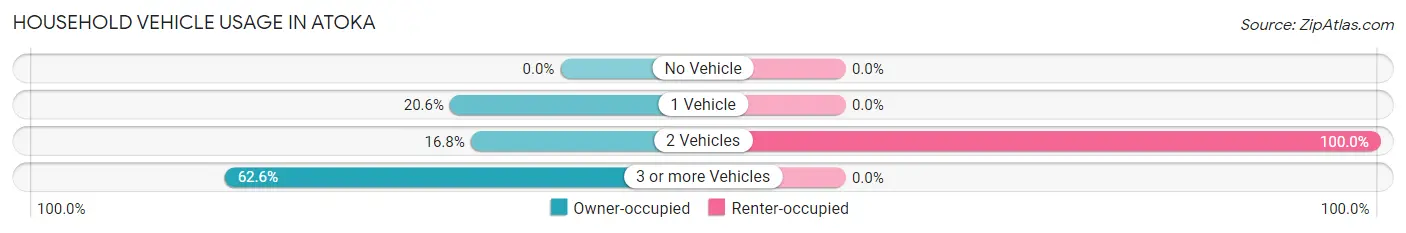
| Vehicles per Household | Owner-occupied | Renter-occupied |
| No Vehicle | 0 (0.0%) | 0 (0.0%) |
| 1 Vehicle | 80 (20.6%) | 0 (0.0%) |
| 2 Vehicles | 65 (16.8%) | 120 (100.0%) |
| 3 or more Vehicles | 243 (62.6%) | 0 (0.0%) |
| Total | 388 (100.0%) | 120 (100.0%) |
Real Estate & Mortgages in Atoka
Real Estate and Mortgage Overview in Atoka
| Characteristic | Without Mortgage | With Mortgage |
| Housing Units | 214 | 174 |
| Median Property Value | $156,100 | $113,200 |
| Median Household Income | $40,608 | $0 |
| Monthly Housing Costs | $414 | $0 |
| Real Estate Taxes | $524 | $0 |
Property Value by Mortgage Status in Atoka
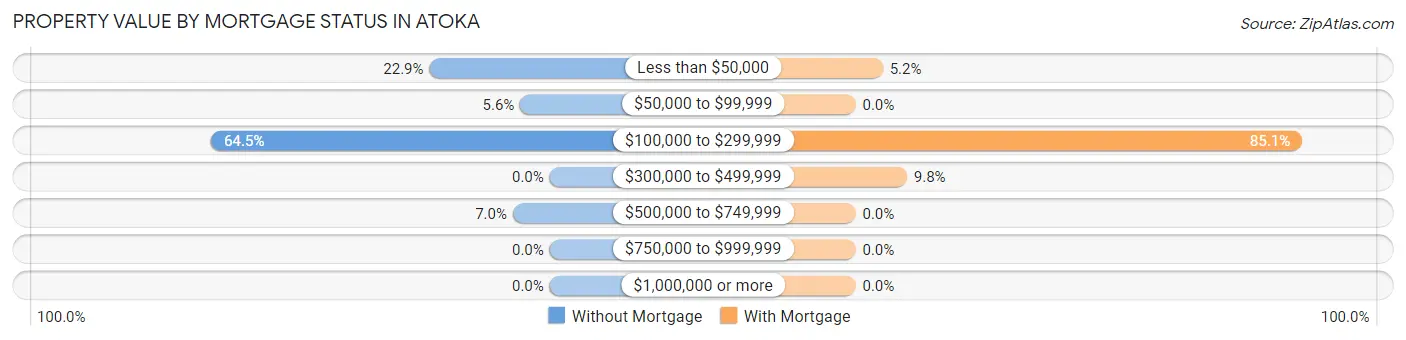
| Property Value | Without Mortgage | With Mortgage |
| Less than $50,000 | 49 (22.9%) | 9 (5.2%) |
| $50,000 to $99,999 | 12 (5.6%) | 0 (0.0%) |
| $100,000 to $299,999 | 138 (64.5%) | 148 (85.1%) |
| $300,000 to $499,999 | 0 (0.0%) | 17 (9.8%) |
| $500,000 to $749,999 | 15 (7.0%) | 0 (0.0%) |
| $750,000 to $999,999 | 0 (0.0%) | 0 (0.0%) |
| $1,000,000 or more | 0 (0.0%) | 0 (0.0%) |
| Total | 214 (100.0%) | 174 (100.0%) |
Household Income by Mortgage Status in Atoka
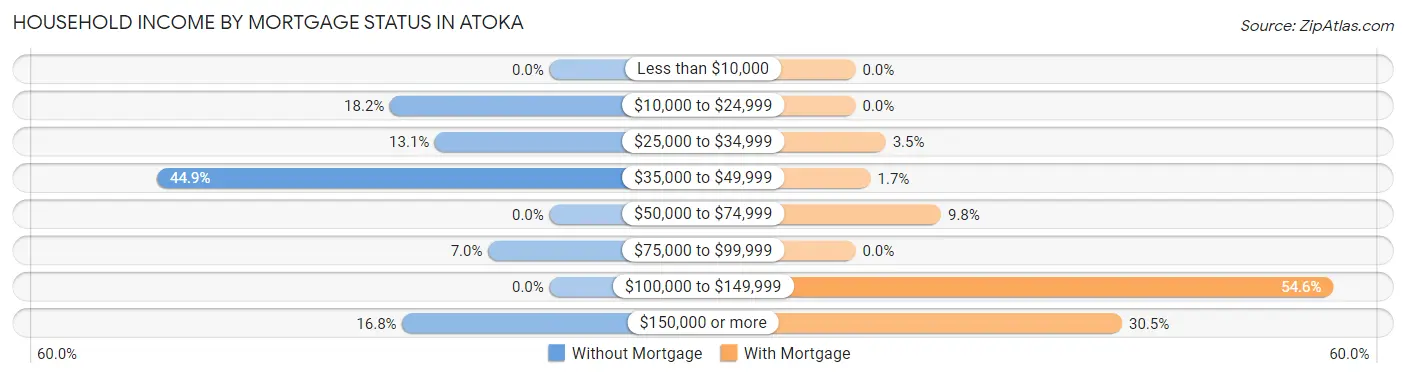
| Household Income | Without Mortgage | With Mortgage |
| Less than $10,000 | 0 (0.0%) | 0 (0.0%) |
| $10,000 to $24,999 | 39 (18.2%) | 0 (0.0%) |
| $25,000 to $34,999 | 28 (13.1%) | 6 (3.5%) |
| $35,000 to $49,999 | 96 (44.9%) | 3 (1.7%) |
| $50,000 to $74,999 | 0 (0.0%) | 17 (9.8%) |
| $75,000 to $99,999 | 15 (7.0%) | 0 (0.0%) |
| $100,000 to $149,999 | 0 (0.0%) | 95 (54.6%) |
| $150,000 or more | 36 (16.8%) | 53 (30.5%) |
| Total | 214 (100.0%) | 174 (100.0%) |
Property Value to Household Income Ratio in Atoka
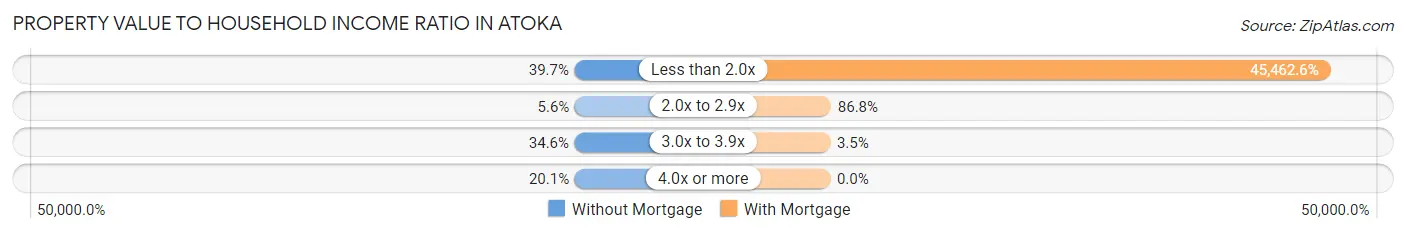
| Value-to-Income Ratio | Without Mortgage | With Mortgage |
| Less than 2.0x | 85 (39.7%) | 79,105 (45,462.6%) |
| 2.0x to 2.9x | 12 (5.6%) | 151 (86.8%) |
| 3.0x to 3.9x | 74 (34.6%) | 6 (3.5%) |
| 4.0x or more | 43 (20.1%) | 0 (0.0%) |
| Total | 214 (100.0%) | 174 (100.0%) |
Real Estate Taxes by Mortgage Status in Atoka
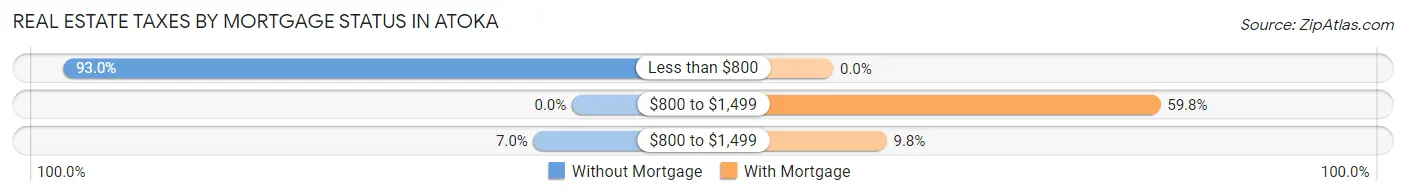
| Property Taxes | Without Mortgage | With Mortgage |
| Less than $800 | 199 (93.0%) | 0 (0.0%) |
| $800 to $1,499 | 0 (0.0%) | 104 (59.8%) |
| $800 to $1,499 | 15 (7.0%) | 17 (9.8%) |
| Total | 214 (100.0%) | 174 (100.0%) |
Health & Disability in Atoka
Health Insurance Coverage by Age in Atoka
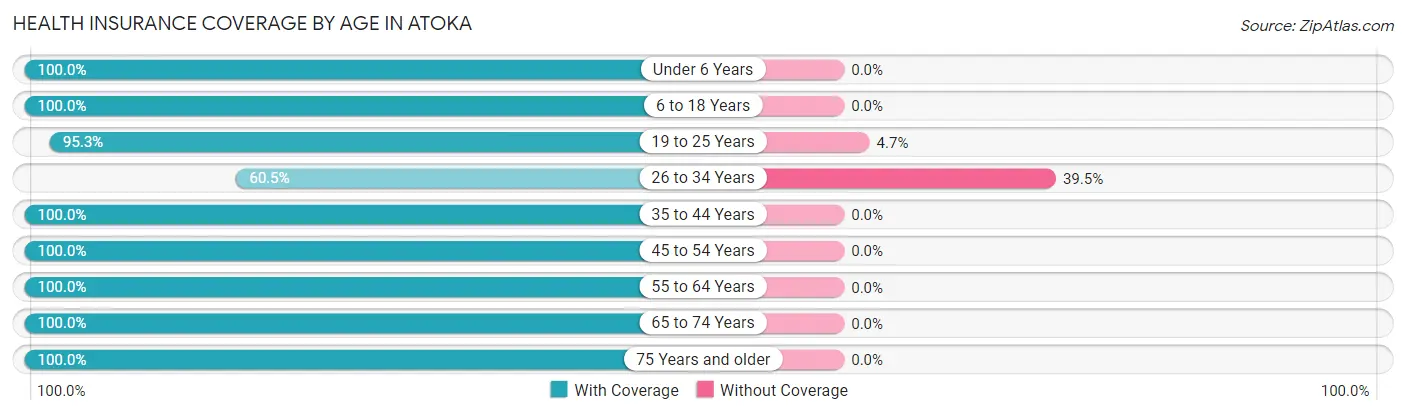
| Age Bracket | With Coverage | Without Coverage |
| Under 6 Years | 132 (100.0%) | 0 (0.0%) |
| 6 to 18 Years | 236 (100.0%) | 0 (0.0%) |
| 19 to 25 Years | 161 (95.3%) | 8 (4.7%) |
| 26 to 34 Years | 187 (60.5%) | 122 (39.5%) |
| 35 to 44 Years | 12 (100.0%) | 0 (0.0%) |
| 45 to 54 Years | 63 (100.0%) | 0 (0.0%) |
| 55 to 64 Years | 162 (100.0%) | 0 (0.0%) |
| 65 to 74 Years | 74 (100.0%) | 0 (0.0%) |
| 75 Years and older | 123 (100.0%) | 0 (0.0%) |
| Total | 1,150 (89.8%) | 130 (10.2%) |
Health Insurance Coverage by Citizenship Status in Atoka
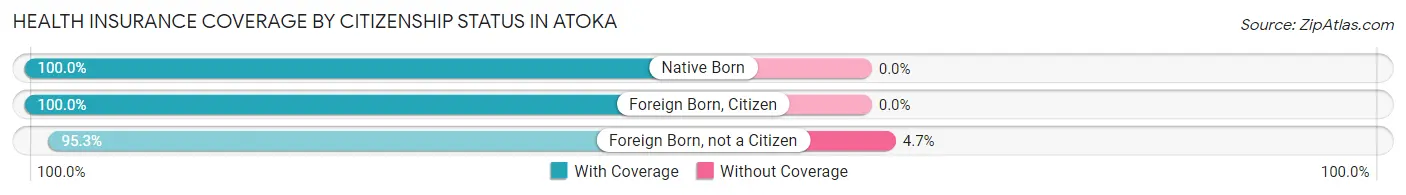
| Citizenship Status | With Coverage | Without Coverage |
| Native Born | 132 (100.0%) | 0 (0.0%) |
| Foreign Born, Citizen | 236 (100.0%) | 0 (0.0%) |
| Foreign Born, not a Citizen | 161 (95.3%) | 8 (4.7%) |
Health Insurance Coverage by Household Income in Atoka
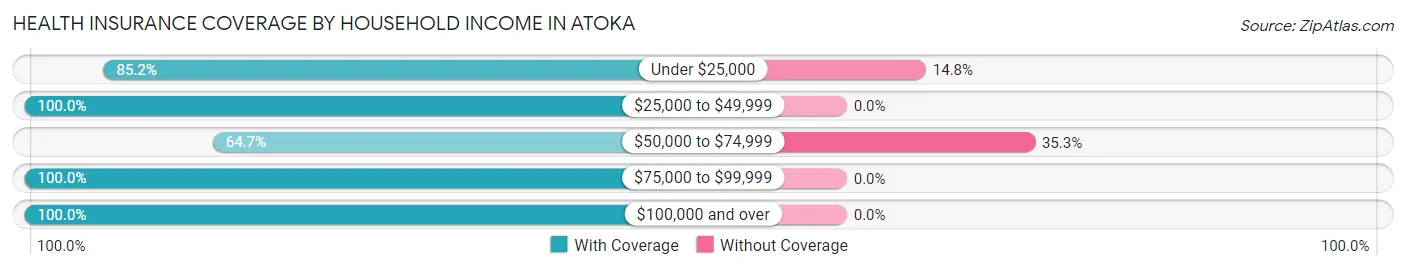
| Household Income | With Coverage | Without Coverage |
| Under $25,000 | 46 (85.2%) | 8 (14.8%) |
| $25,000 to $49,999 | 220 (100.0%) | 0 (0.0%) |
| $50,000 to $74,999 | 224 (64.7%) | 122 (35.3%) |
| $75,000 to $99,999 | 488 (100.0%) | 0 (0.0%) |
| $100,000 and over | 172 (100.0%) | 0 (0.0%) |
Public vs Private Health Insurance Coverage by Age in Atoka
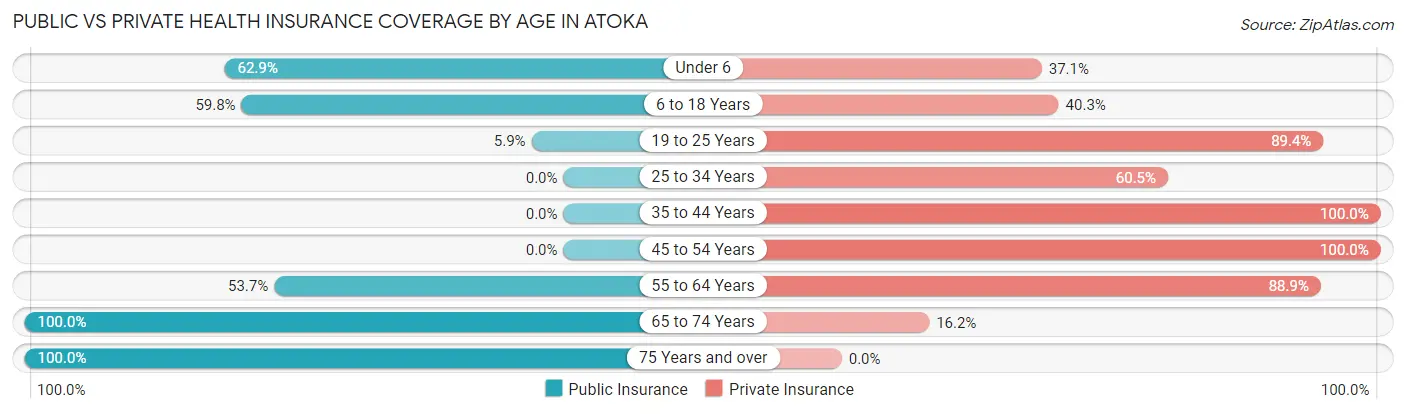
| Age Bracket | Public Insurance | Private Insurance |
| Under 6 | 83 (62.9%) | 49 (37.1%) |
| 6 to 18 Years | 141 (59.8%) | 95 (40.3%) |
| 19 to 25 Years | 10 (5.9%) | 151 (89.3%) |
| 25 to 34 Years | 0 (0.0%) | 187 (60.5%) |
| 35 to 44 Years | 0 (0.0%) | 12 (100.0%) |
| 45 to 54 Years | 0 (0.0%) | 63 (100.0%) |
| 55 to 64 Years | 87 (53.7%) | 144 (88.9%) |
| 65 to 74 Years | 74 (100.0%) | 12 (16.2%) |
| 75 Years and over | 123 (100.0%) | 0 (0.0%) |
| Total | 518 (40.5%) | 713 (55.7%) |
Disability Status by Sex by Age in Atoka
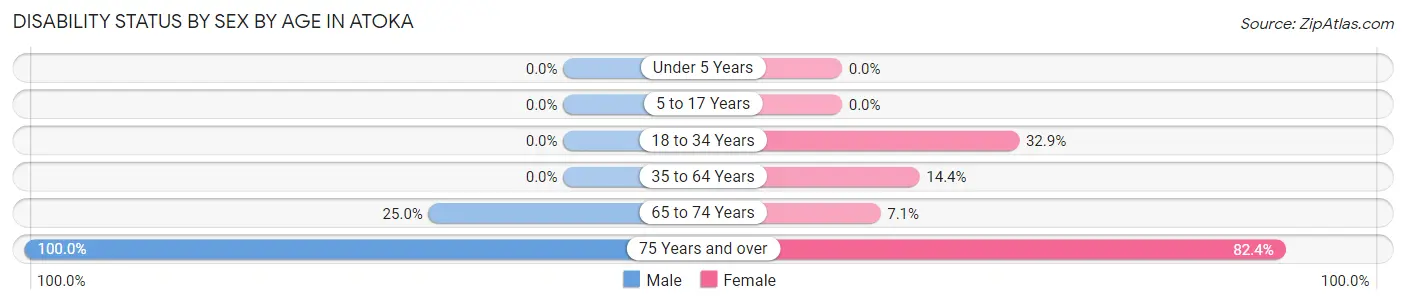
| Age Bracket | Male | Female |
| Under 5 Years | 0 (0.0%) | 0 (0.0%) |
| 5 to 17 Years | 0 (0.0%) | 0 (0.0%) |
| 18 to 34 Years | 0 (0.0%) | 75 (32.9%) |
| 35 to 64 Years | 0 (0.0%) | 18 (14.4%) |
| 65 to 74 Years | 15 (25.0%) | 1 (7.1%) |
| 75 Years and over | 89 (100.0%) | 28 (82.4%) |
Disability Class by Sex by Age in Atoka
Disability Class: Hearing Difficulty
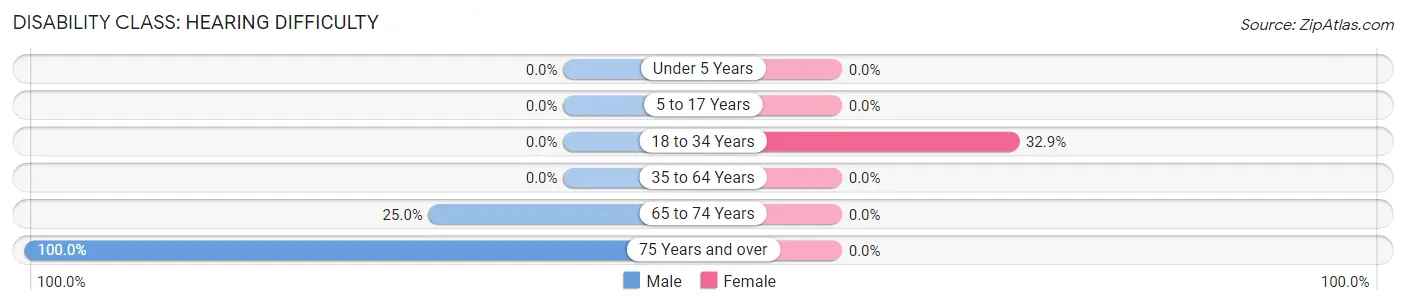
| Age Bracket | Male | Female |
| Under 5 Years | 0 (0.0%) | 0 (0.0%) |
| 5 to 17 Years | 0 (0.0%) | 0 (0.0%) |
| 18 to 34 Years | 0 (0.0%) | 75 (32.9%) |
| 35 to 64 Years | 0 (0.0%) | 0 (0.0%) |
| 65 to 74 Years | 15 (25.0%) | 0 (0.0%) |
| 75 Years and over | 89 (100.0%) | 0 (0.0%) |
Disability Class: Vision Difficulty
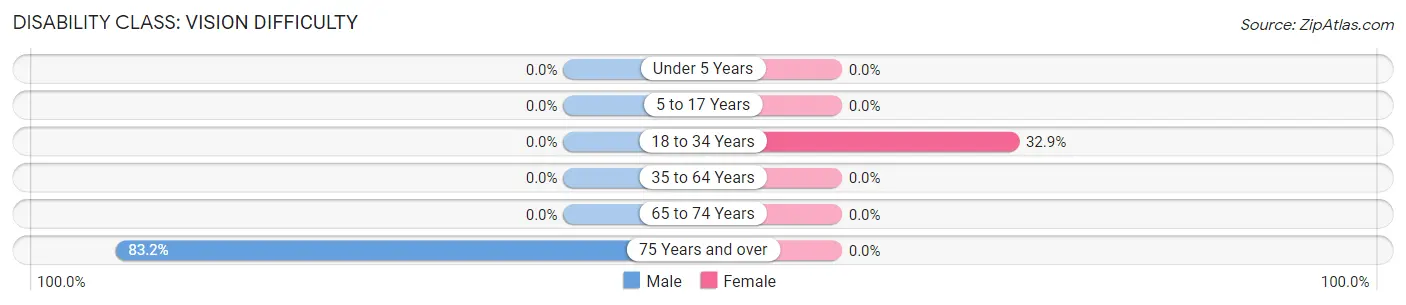
| Age Bracket | Male | Female |
| Under 5 Years | 0 (0.0%) | 0 (0.0%) |
| 5 to 17 Years | 0 (0.0%) | 0 (0.0%) |
| 18 to 34 Years | 0 (0.0%) | 75 (32.9%) |
| 35 to 64 Years | 0 (0.0%) | 0 (0.0%) |
| 65 to 74 Years | 0 (0.0%) | 0 (0.0%) |
| 75 Years and over | 74 (83.2%) | 0 (0.0%) |
Disability Class: Cognitive Difficulty
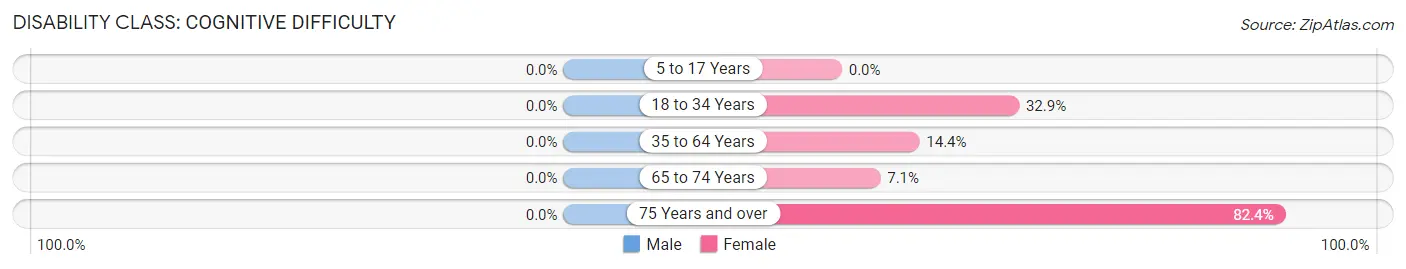
| Age Bracket | Male | Female |
| 5 to 17 Years | 0 (0.0%) | 0 (0.0%) |
| 18 to 34 Years | 0 (0.0%) | 75 (32.9%) |
| 35 to 64 Years | 0 (0.0%) | 18 (14.4%) |
| 65 to 74 Years | 0 (0.0%) | 1 (7.1%) |
| 75 Years and over | 0 (0.0%) | 28 (82.4%) |
Disability Class: Ambulatory Difficulty
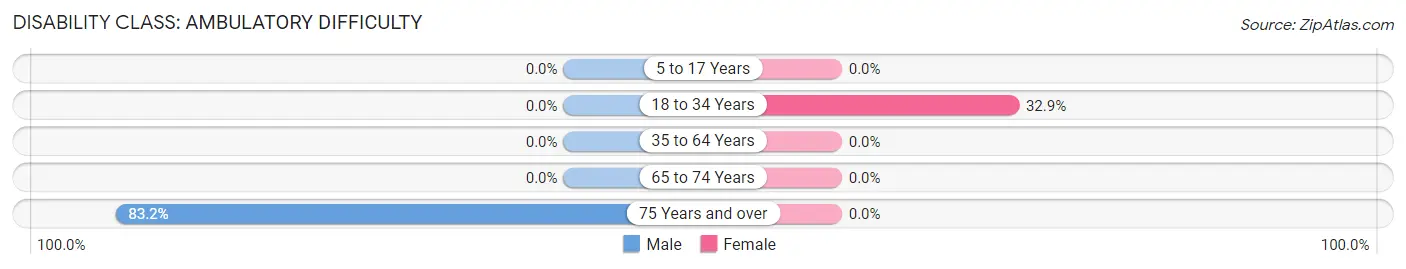
| Age Bracket | Male | Female |
| 5 to 17 Years | 0 (0.0%) | 0 (0.0%) |
| 18 to 34 Years | 0 (0.0%) | 75 (32.9%) |
| 35 to 64 Years | 0 (0.0%) | 0 (0.0%) |
| 65 to 74 Years | 0 (0.0%) | 0 (0.0%) |
| 75 Years and over | 74 (83.2%) | 0 (0.0%) |
Disability Class: Self-Care Difficulty
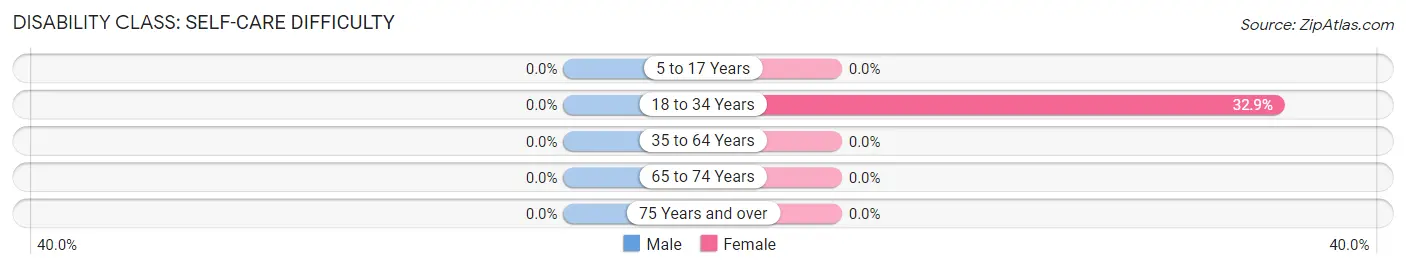
| Age Bracket | Male | Female |
| 5 to 17 Years | 0 (0.0%) | 0 (0.0%) |
| 18 to 34 Years | 0 (0.0%) | 75 (32.9%) |
| 35 to 64 Years | 0 (0.0%) | 0 (0.0%) |
| 65 to 74 Years | 0 (0.0%) | 0 (0.0%) |
| 75 Years and over | 0 (0.0%) | 0 (0.0%) |
Technology Access in Atoka
Computing Device Access in Atoka
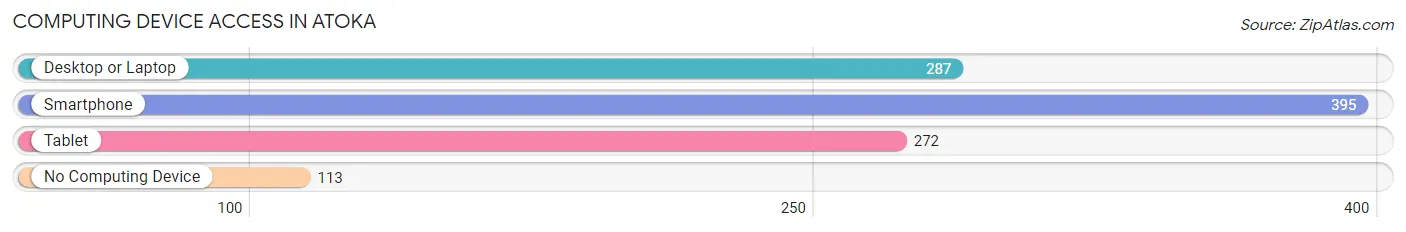
| Device Type | # Households | % Households |
| Desktop or Laptop | 287 | 56.5% |
| Smartphone | 395 | 77.8% |
| Tablet | 272 | 53.5% |
| No Computing Device | 113 | 22.2% |
| Total | 508 | 100.0% |
Internet Access in Atoka
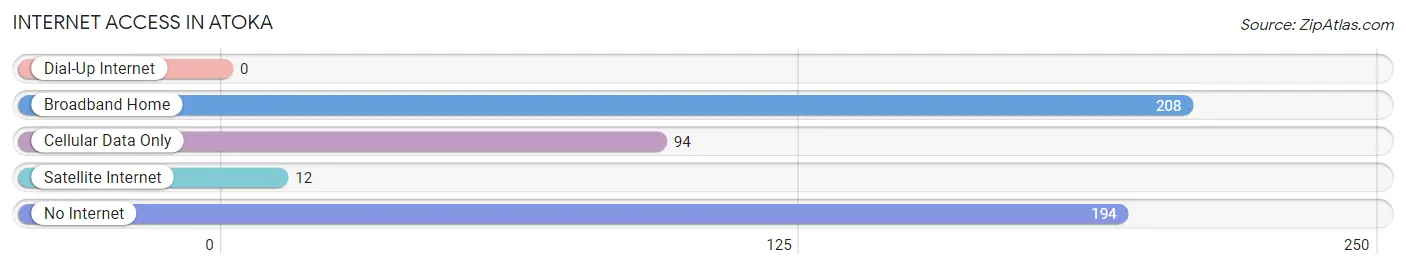
| Internet Type | # Households | % Households |
| Dial-Up Internet | 0 | 0.0% |
| Broadband Home | 208 | 40.9% |
| Cellular Data Only | 94 | 18.5% |
| Satellite Internet | 12 | 2.4% |
| No Internet | 194 | 38.2% |
| Total | 508 | 100.0% |
Atoka Summary
Atoka is a small unincorporated community located in the northwest corner of New Mexico. It is situated in the San Juan Basin, a region of the state known for its rich cultural and natural history. The area is home to the Navajo Nation, the largest Native American tribe in the United States. Atoka is located in McKinley County, which is the largest county in the state.
History
Atoka was founded in the late 1800s by settlers from the nearby Navajo Nation. The town was named after the nearby Atoka Springs, which was a popular watering hole for the Navajo. The town was originally a trading post and a stop on the Santa Fe Trail. In the early 1900s, the town began to grow as a result of the nearby coal mining industry. The coal mines provided jobs for many of the local residents and helped to fuel the local economy.
In the 1950s, the town began to decline as the coal industry began to decline. The town was eventually abandoned in the 1970s. In the 1980s, the town was revitalized by the Navajo Nation, which purchased the land and began to develop it as a tourist destination. Today, Atoka is a popular destination for tourists who come to explore the area’s rich cultural and natural history.
Geography
Atoka is located in the northwest corner of New Mexico, in the San Juan Basin. The town is situated at an elevation of 6,000 feet and is surrounded by the Chuska Mountains. The area is known for its rugged terrain and stunning views of the surrounding landscape. The town is located near the Four Corners Monument, which marks the intersection of four states: Arizona, Colorado, New Mexico, and Utah.
The climate in Atoka is semi-arid, with hot summers and cold winters. The average annual temperature is around 50 degrees Fahrenheit. The area receives an average of 12 inches of precipitation per year, most of which falls in the form of snow.
Economy
Atoka’s economy is largely based on tourism. The town is a popular destination for visitors who come to explore the area’s rich cultural and natural history. The town is also home to several small businesses, including restaurants, shops, and galleries.
The town is also home to the Atoka Mine, which is a coal mine that is owned and operated by the Navajo Nation. The mine provides jobs for many of the local residents and helps to fuel the local economy.
Demographics
As of the 2010 census, the population of Atoka was 1,072. The town is predominantly Native American, with the majority of the population being Navajo. The median household income in Atoka is $25,000, which is significantly lower than the national average. The town has a poverty rate of 28.3%, which is higher than the national average.
Common Questions
What is Per Capita Income in Atoka?
Per Capita income in Atoka is $28,362.
What is the Median Family Income in Atoka?
Median Family Income in Atoka is $79,303.
What is the Median Household income in Atoka?
Median Household Income in Atoka is $77,816.
What is Income or Wage Gap in Atoka?
Income or Wage Gap in Atoka is 15.1%.
Women in Atoka earn 84.9 cents for every dollar earned by a man.
What is Inequality or Gini Index in Atoka?
Inequality or Gini Index in Atoka is 0.31.
What is the Total Population of Atoka?
Total Population of Atoka is 1,280.
What is the Total Male Population of Atoka?
Total Male Population of Atoka is 755.
What is the Total Female Population of Atoka?
Total Female Population of Atoka is 525.
What is the Ratio of Males per 100 Females in Atoka?
There are 143.81 Males per 100 Females in Atoka.
What is the Ratio of Females per 100 Males in Atoka?
There are 69.54 Females per 100 Males in Atoka.
What is the Median Population Age in Atoka?
Median Population Age in Atoka is 29.6 Years.
What is the Average Family Size in Atoka
Average Family Size in Atoka is 3.0 People.
What is the Average Household Size in Atoka
Average Household Size in Atoka is 2.5 People.
How Large is the Labor Force in Atoka?
There are 387 People in the Labor Forcein in Atoka.
What is the Percentage of People in the Labor Force in Atoka?
42.4% of People are in the Labor Force in Atoka.
What is the Unemployment Rate in Atoka?
Unemployment Rate in Atoka is 2.6%.