Talpa, NM Map & Demographics
Talpa Map
Talpa Overview
$25,638
PER CAPITA INCOME
$46,473
AVG HOUSEHOLD INCOME
0.38
INEQUALITY / GINI INDEX
1,559
TOTAL POPULATION
815
MALE POPULATION
744
FEMALE POPULATION
109.54
MALES / 100 FEMALES
91.29
FEMALES / 100 MALES
47.5
MEDIAN AGE
3.1
AVG FAMILY SIZE
2.1
AVG HOUSEHOLD SIZE
646
LABOR FORCE [ PEOPLE ]
51.4%
PERCENT IN LABOR FORCE
Income in Talpa
Income Overview in Talpa
| Characteristic | Number | Measure |
| Per Capita Income | 1,559 | $25,638 |
| Median Family Income | 395 | $0 |
| Mean Family Income | 395 | $84,378 |
| Median Household Income | 736 | $46,473 |
| Mean Household Income | 736 | $61,313 |
| Income Deficit | 395 | $0 |
| Wage / Income Gap (%) | 1,559 | 0.00% |
| Wage / Income Gap ($) | 1,559 | 100.00¢ per $1 |
| Gini / Inequality Index | 1,559 | 0.38 |
Earnings by Sex in Talpa
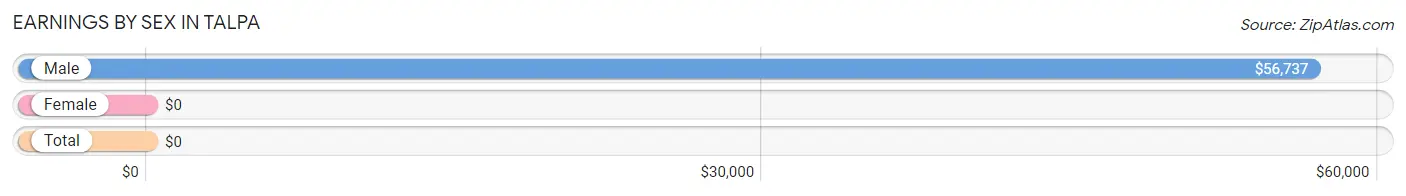
| Sex | Number | Average Earnings |
| Male | 223 (32.8%) | $56,737 |
| Female | 458 (67.2%) | $0 |
| Total | 681 (100.0%) | $0 |
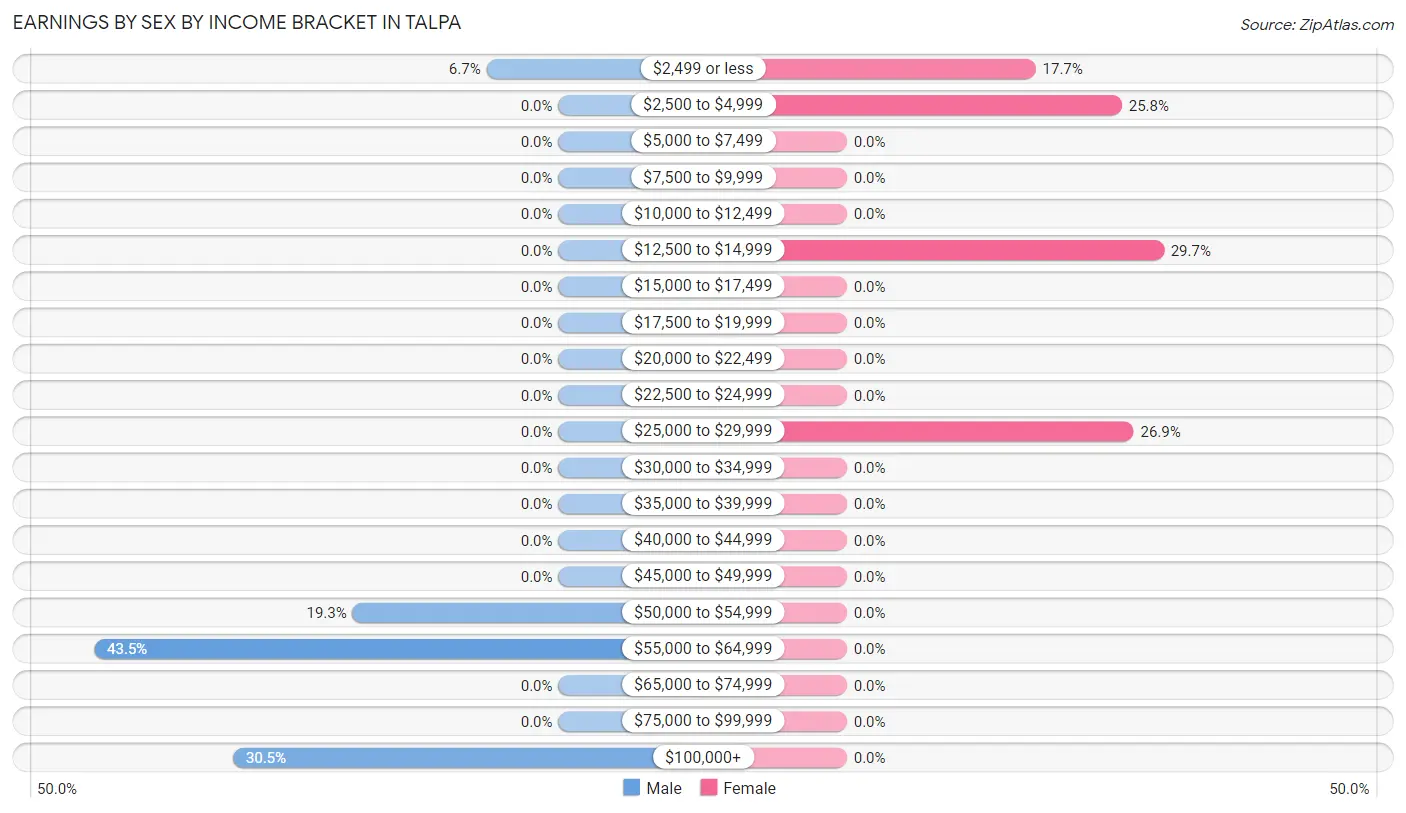
Earnings by Sex by Income Bracket in Talpa
The most common earnings brackets in Talpa are $55,000 to $64,999 for men (97 | 43.5%) and $12,500 to $14,999 for women (136 | 29.7%).
| Income | Male | Female |
| $2,499 or less | 15 (6.7%) | 81 (17.7%) |
| $2,500 to $4,999 | 0 (0.0%) | 118 (25.8%) |
| $5,000 to $7,499 | 0 (0.0%) | 0 (0.0%) |
| $7,500 to $9,999 | 0 (0.0%) | 0 (0.0%) |
| $10,000 to $12,499 | 0 (0.0%) | 0 (0.0%) |
| $12,500 to $14,999 | 0 (0.0%) | 136 (29.7%) |
| $15,000 to $17,499 | 0 (0.0%) | 0 (0.0%) |
| $17,500 to $19,999 | 0 (0.0%) | 0 (0.0%) |
| $20,000 to $22,499 | 0 (0.0%) | 0 (0.0%) |
| $22,500 to $24,999 | 0 (0.0%) | 0 (0.0%) |
| $25,000 to $29,999 | 0 (0.0%) | 123 (26.9%) |
| $30,000 to $34,999 | 0 (0.0%) | 0 (0.0%) |
| $35,000 to $39,999 | 0 (0.0%) | 0 (0.0%) |
| $40,000 to $44,999 | 0 (0.0%) | 0 (0.0%) |
| $45,000 to $49,999 | 0 (0.0%) | 0 (0.0%) |
| $50,000 to $54,999 | 43 (19.3%) | 0 (0.0%) |
| $55,000 to $64,999 | 97 (43.5%) | 0 (0.0%) |
| $65,000 to $74,999 | 0 (0.0%) | 0 (0.0%) |
| $75,000 to $99,999 | 0 (0.0%) | 0 (0.0%) |
| $100,000+ | 68 (30.5%) | 0 (0.0%) |
| Total | 223 (100.0%) | 458 (100.0%) |
Earnings by Sex by Educational Attainment in Talpa
| Educational Attainment | Male Income | Female Income |
| Less than High School | - | - |
| High School Diploma | - | - |
| College or Associate's Degree | - | - |
| Bachelor's Degree | - | - |
| Graduate Degree | - | - |
| Total | $56,737 | $0 |
Family Income in Talpa
Family Income Brackets in Talpa
According to the Talpa family income data, there are 180 families falling into the $100,000 to $149,999 income range, which is the most common income bracket and makes up 45.6% of all families.
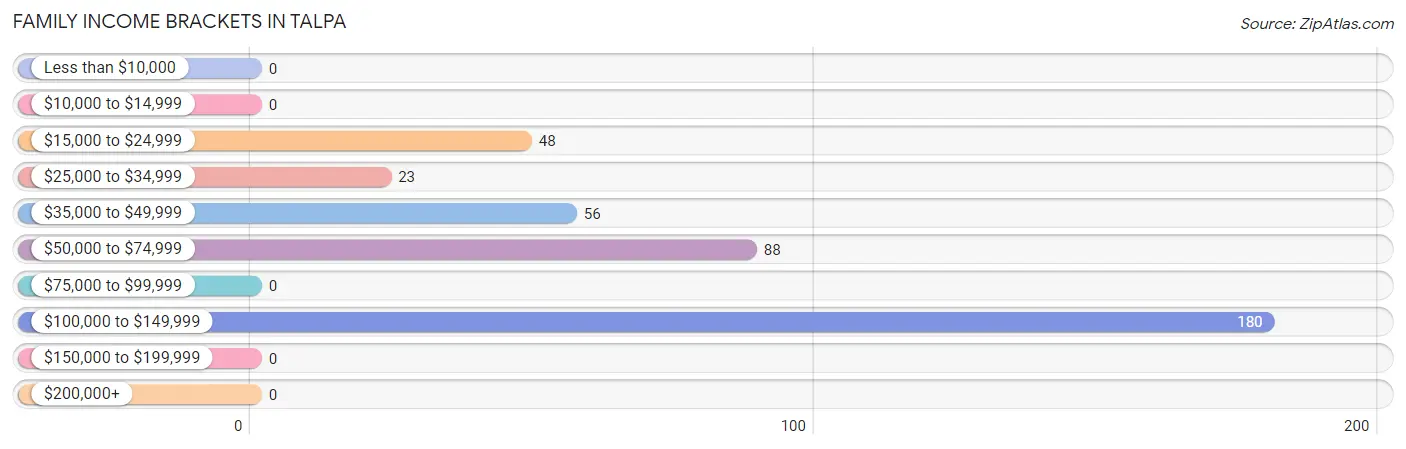
| Income Bracket | # Families | % Families |
| Less than $10,000 | 0 | 0.0% |
| $10,000 to $14,999 | 0 | 0.0% |
| $15,000 to $24,999 | 48 | 12.2% |
| $25,000 to $34,999 | 23 | 5.8% |
| $35,000 to $49,999 | 56 | 14.2% |
| $50,000 to $74,999 | 88 | 22.3% |
| $75,000 to $99,999 | 0 | 0.0% |
| $100,000 to $149,999 | 180 | 45.6% |
| $150,000 to $199,999 | 0 | 0.0% |
| $200,000+ | 0 | 0.0% |
Family Income by Famaliy Size in Talpa
2-person families (206 | 52.1%) account for the highest median family income in Talpa with $47,455 per family, while 2-person families (206 | 52.1%) have the highest median income of $23,728 per family member.
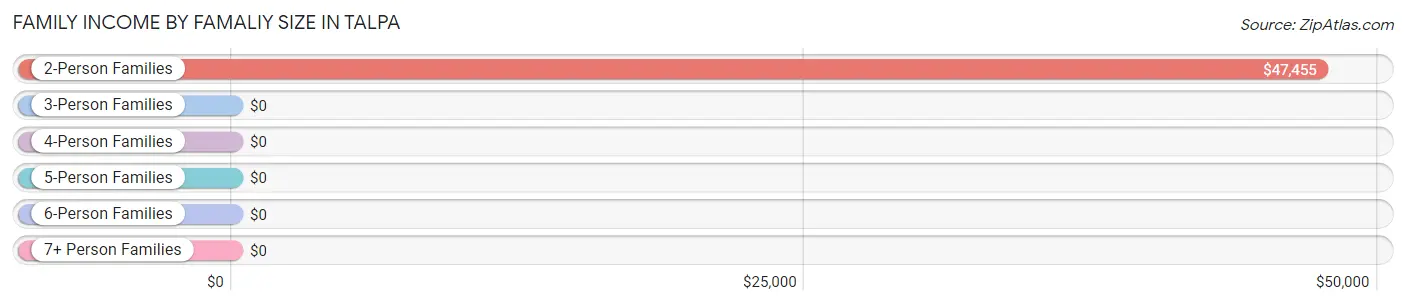
| Income Bracket | # Families | Median Income |
| 2-Person Families | 206 (52.1%) | $47,455 |
| 3-Person Families | 66 (16.7%) | $0 |
| 4-Person Families | 123 (31.1%) | $0 |
| 5-Person Families | 0 (0.0%) | $0 |
| 6-Person Families | 0 (0.0%) | $0 |
| 7+ Person Families | 0 (0.0%) | $0 |
| Total | 395 (100.0%) | $0 |
Family Income by Number of Earners in Talpa
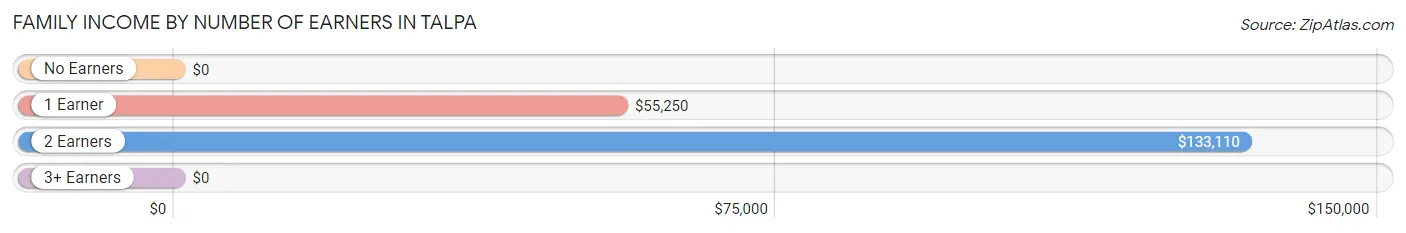
| Number of Earners | # Families | Median Income |
| No Earners | 88 (22.3%) | $0 |
| 1 Earner | 121 (30.6%) | $55,250 |
| 2 Earners | 186 (47.1%) | $133,110 |
| 3+ Earners | 0 (0.0%) | $0 |
| Total | 395 (100.0%) | $0 |
Household Income in Talpa
Household Income Brackets in Talpa
With 180 households falling in the category, the $100,000 to $149,999 income range is the most frequent in Talpa, accounting for 24.5% of all households.
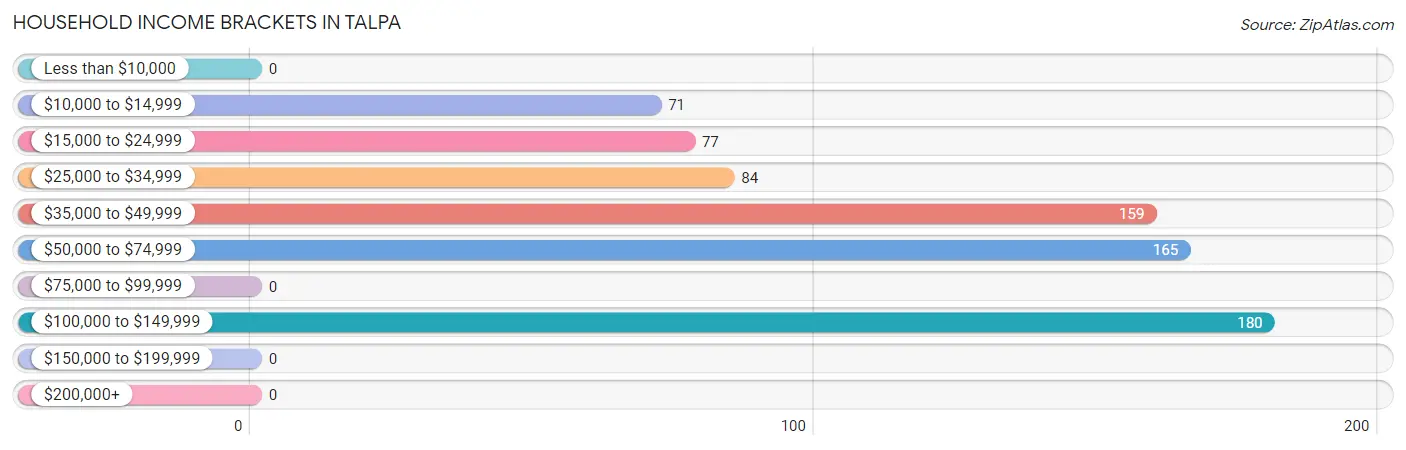
| Income Bracket | # Households | % Households |
| Less than $10,000 | 0 | 0.0% |
| $10,000 to $14,999 | 71 | 9.6% |
| $15,000 to $24,999 | 77 | 10.5% |
| $25,000 to $34,999 | 84 | 11.4% |
| $35,000 to $49,999 | 159 | 21.6% |
| $50,000 to $74,999 | 165 | 22.4% |
| $75,000 to $99,999 | 0 | 0.0% |
| $100,000 to $149,999 | 180 | 24.5% |
| $150,000 to $199,999 | 0 | 0.0% |
| $200,000+ | 0 | 0.0% |
Household Income by Householder Age in Talpa
The median household income in Talpa is $46,473, with the highest median household income of $56,750 found in the 45 to 64 years age bracket for the primary householder. A total of 427 households (58.0%) fall into this category.
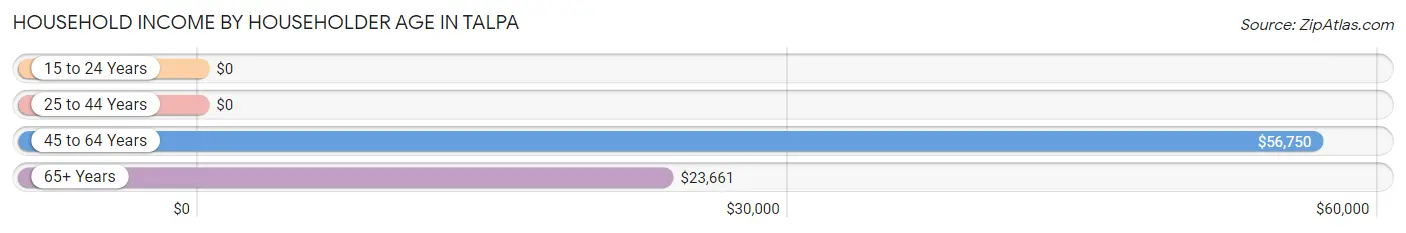
| Income Bracket | # Households | Median Income |
| 15 to 24 Years | 0 (0.0%) | $0 |
| 25 to 44 Years | 43 (5.8%) | $0 |
| 45 to 64 Years | 427 (58.0%) | $56,750 |
| 65+ Years | 266 (36.1%) | $23,661 |
| Total | 736 (100.0%) | $46,473 |
Poverty in Talpa
Income Below Poverty by Sex and Age in Talpa
With 10.5% poverty level for males and 2.7% for females among the residents of Talpa, 75 year old and over males and 65 to 74 year old females are the most vulnerable to poverty, with 42 males (60.0%) and 20 females (15.5%) in their respective age groups living below the poverty level.
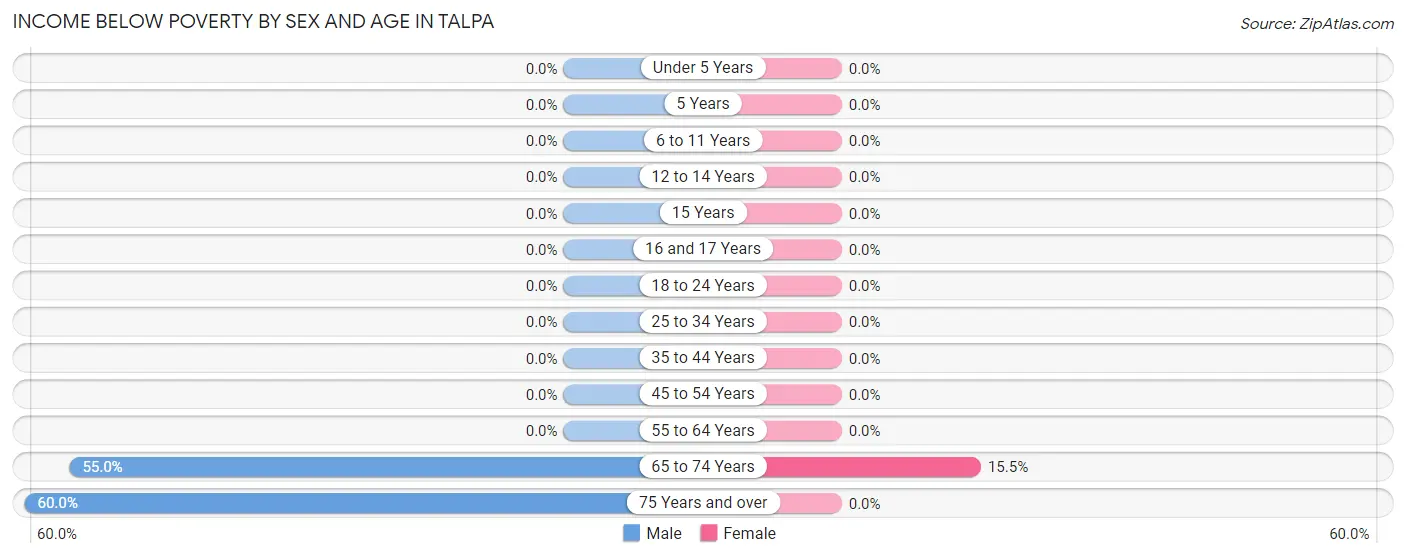
| Age Bracket | Male | Female |
| Under 5 Years | 0 (0.0%) | 0 (0.0%) |
| 5 Years | 0 (0.0%) | 0 (0.0%) |
| 6 to 11 Years | 0 (0.0%) | 0 (0.0%) |
| 12 to 14 Years | 0 (0.0%) | 0 (0.0%) |
| 15 Years | 0 (0.0%) | 0 (0.0%) |
| 16 and 17 Years | 0 (0.0%) | 0 (0.0%) |
| 18 to 24 Years | 0 (0.0%) | 0 (0.0%) |
| 25 to 34 Years | 0 (0.0%) | 0 (0.0%) |
| 35 to 44 Years | 0 (0.0%) | 0 (0.0%) |
| 45 to 54 Years | 0 (0.0%) | 0 (0.0%) |
| 55 to 64 Years | 0 (0.0%) | 0 (0.0%) |
| 65 to 74 Years | 44 (55.0%) | 20 (15.5%) |
| 75 Years and over | 42 (60.0%) | 0 (0.0%) |
| Total | 86 (10.5%) | 20 (2.7%) |
Income Above Poverty by Sex and Age in Talpa
According to the poverty statistics in Talpa, males aged 5 years and females aged 6 to 11 years are the age groups that are most secure financially, with 100.0% of males and 100.0% of females in these age groups living above the poverty line.
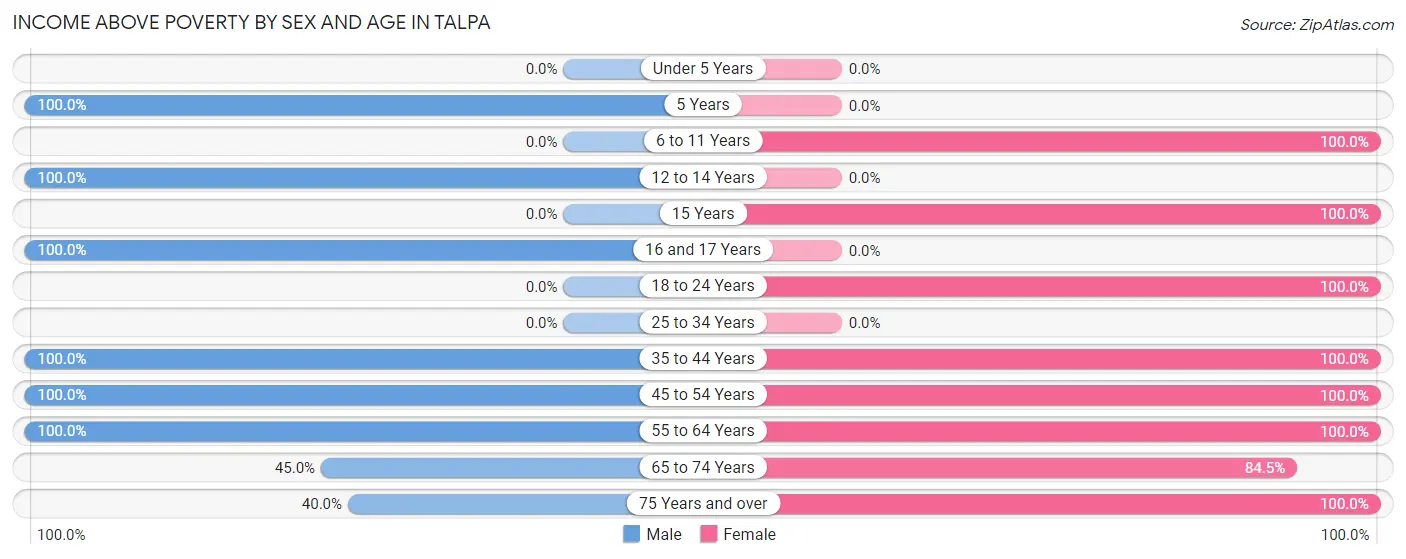
| Age Bracket | Male | Female |
| Under 5 Years | 0 (0.0%) | 0 (0.0%) |
| 5 Years | 175 (100.0%) | 0 (0.0%) |
| 6 to 11 Years | 0 (0.0%) | 22 (100.0%) |
| 12 to 14 Years | 49 (100.0%) | 0 (0.0%) |
| 15 Years | 0 (0.0%) | 56 (100.0%) |
| 16 and 17 Years | 110 (100.0%) | 0 (0.0%) |
| 18 to 24 Years | 0 (0.0%) | 118 (100.0%) |
| 25 to 34 Years | 0 (0.0%) | 0 (0.0%) |
| 35 to 44 Years | 43 (100.0%) | 72 (100.0%) |
| 45 to 54 Years | 113 (100.0%) | 243 (100.0%) |
| 55 to 64 Years | 175 (100.0%) | 44 (100.0%) |
| 65 to 74 Years | 36 (45.0%) | 109 (84.5%) |
| 75 Years and over | 28 (40.0%) | 60 (100.0%) |
| Total | 729 (89.4%) | 724 (97.3%) |
Income Below Poverty Among Married-Couple Families in Talpa
The poverty statistics for married-couple families in Talpa show that 6.3% or 20 of the total 316 families live below the poverty line. Families with no children have the highest poverty rate of 13.3%, comprising of 20 families. On the other hand, families with 1 or 2 children have the lowest poverty rate of 0.0%, which includes 0 families.
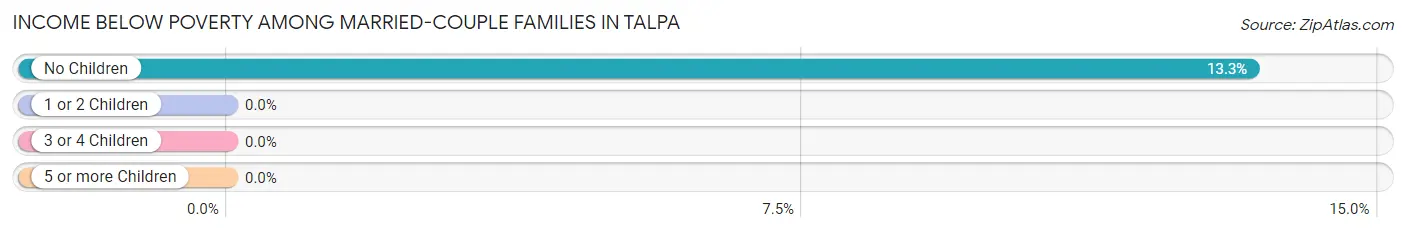
| Children | Above Poverty | Below Poverty |
| No Children | 130 (86.7%) | 20 (13.3%) |
| 1 or 2 Children | 166 (100.0%) | 0 (0.0%) |
| 3 or 4 Children | 0 (0.0%) | 0 (0.0%) |
| 5 or more Children | 0 (0.0%) | 0 (0.0%) |
| Total | 296 (93.7%) | 20 (6.3%) |
Income Below Poverty Among Single-Parent Households in Talpa
| Children | Single Father | Single Mother |
| No Children | 0 (0.0%) | 0 (0.0%) |
| 1 or 2 Children | 0 (0.0%) | 0 (0.0%) |
| 3 or 4 Children | 0 (0.0%) | 0 (0.0%) |
| 5 or more Children | 0 (0.0%) | 0 (0.0%) |
| Total | 0 (0.0%) | 0 (0.0%) |
Income Below Poverty Among Married-Couple vs Single-Parent Households in Talpa
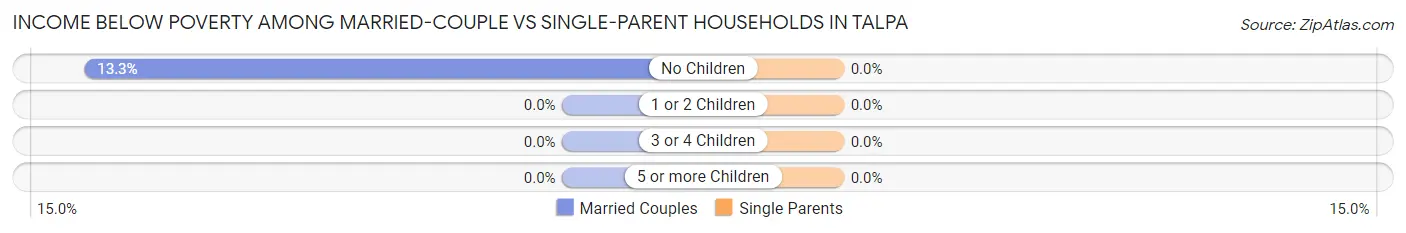
| Children | Married-Couple Families | Single-Parent Households |
| No Children | 20 (13.3%) | 0 (0.0%) |
| 1 or 2 Children | 0 (0.0%) | 0 (0.0%) |
| 3 or 4 Children | 0 (0.0%) | 0 (0.0%) |
| 5 or more Children | 0 (0.0%) | 0 (0.0%) |
| Total | 20 (6.3%) | 0 (0.0%) |
Race in Talpa
The most populous races in Talpa are Hispanic or Latino (900 | 57.7%), White / Caucasian (865 | 55.5%), and Some other Race (517 | 33.2%).
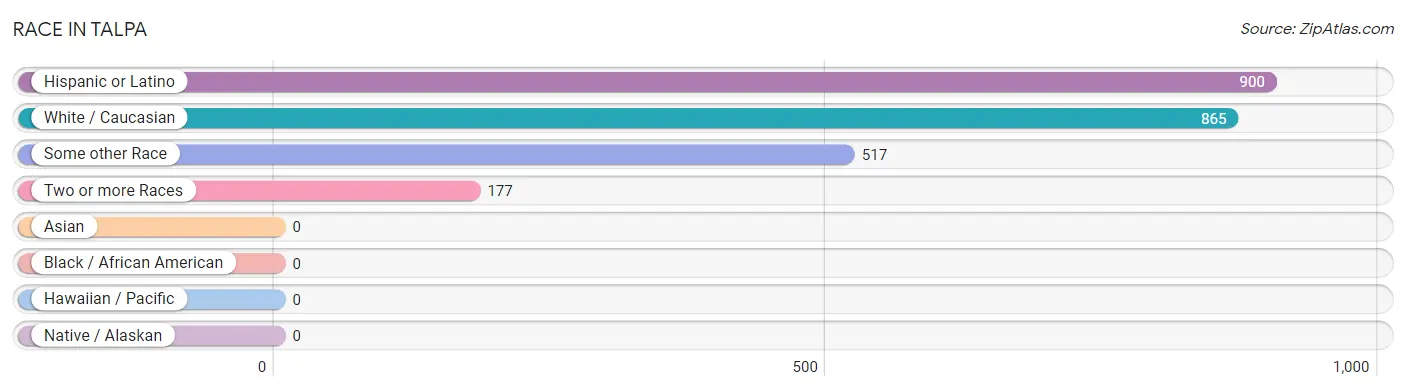
| Race | # Population | % Population |
| Asian | 0 | 0.0% |
| Black / African American | 0 | 0.0% |
| Hawaiian / Pacific | 0 | 0.0% |
| Hispanic or Latino | 900 | 57.7% |
| Native / Alaskan | 0 | 0.0% |
| White / Caucasian | 865 | 55.5% |
| Two or more Races | 177 | 11.4% |
| Some other Race | 517 | 33.2% |
| Total | 1,559 | 100.0% |
Ancestry in Talpa
The most populous ancestries reported in Talpa are Mexican (596 | 38.2%), Irish (411 | 26.4%), German (310 | 19.9%), Spanish (169 | 10.8%), and English (85 | 5.4%), together accounting for 100.8% of all Talpa residents.
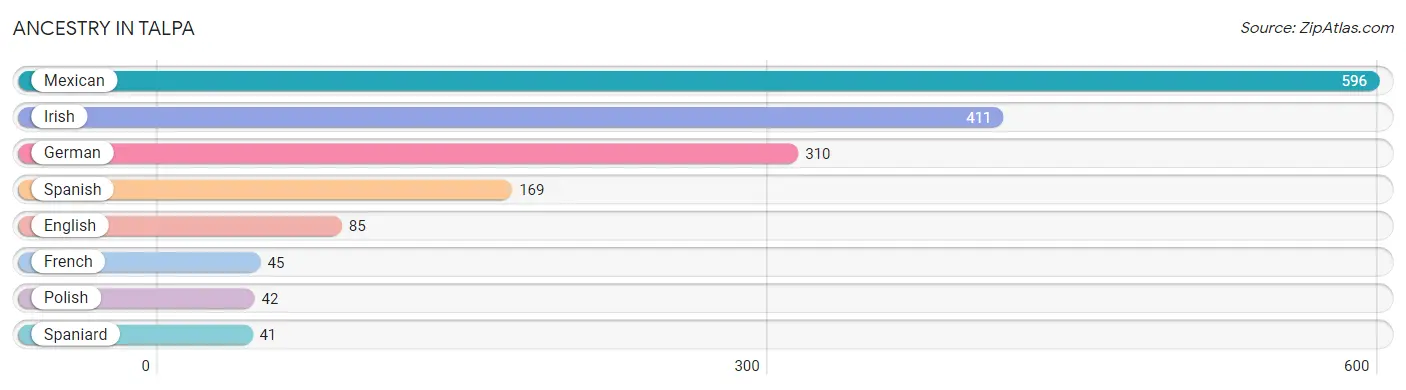
| Ancestry | # Population | % Population |
| English | 85 | 5.4% |
| French | 45 | 2.9% |
| German | 310 | 19.9% |
| Irish | 411 | 26.4% |
| Mexican | 596 | 38.2% |
| Polish | 42 | 2.7% |
| Spaniard | 41 | 2.6% |
| Spanish | 169 | 10.8% | View All 8 Rows |
Immigrants in Talpa
The most numerous immigrant groups reported in Talpa came from Central America (16 | 1.0%), Latin America (16 | 1.0%), and Mexico (16 | 1.0%), together accounting for 3.1% of all Talpa residents.
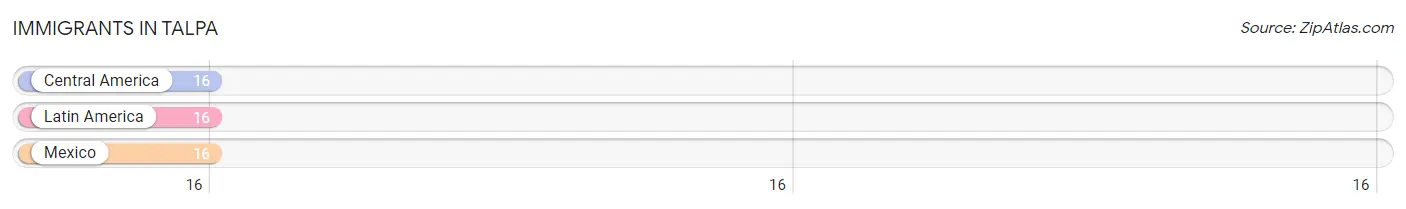
| Immigration Origin | # Population | % Population |
| Central America | 16 | 1.0% |
| Latin America | 16 | 1.0% |
| Mexico | 16 | 1.0% | View All 3 Rows |
Sex and Age in Talpa
Sex and Age in Talpa
The most populous age groups in Talpa are 5 to 9 Years (175 | 21.5%) for men and 15 to 19 Years (174 | 23.4%) for women.
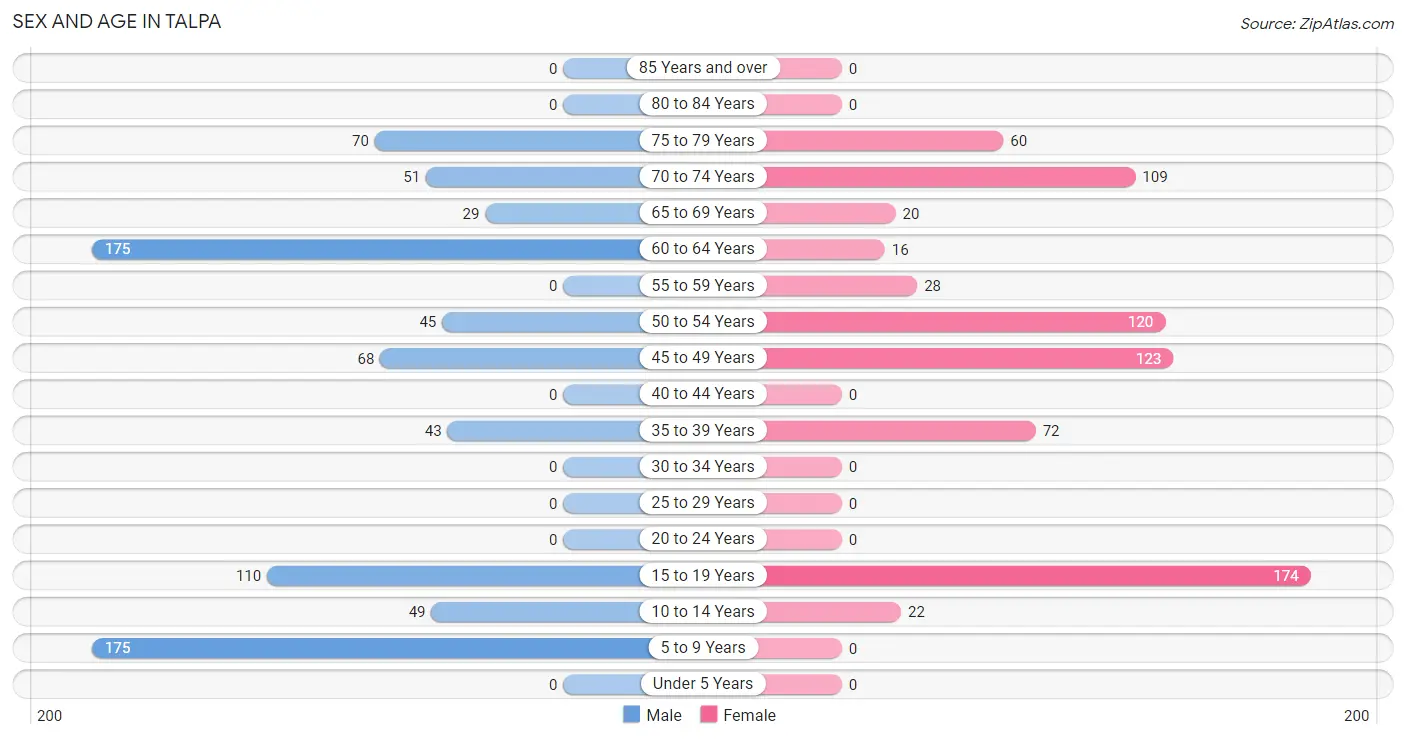
| Age Bracket | Male | Female |
| Under 5 Years | 0 (0.0%) | 0 (0.0%) |
| 5 to 9 Years | 175 (21.5%) | 0 (0.0%) |
| 10 to 14 Years | 49 (6.0%) | 22 (3.0%) |
| 15 to 19 Years | 110 (13.5%) | 174 (23.4%) |
| 20 to 24 Years | 0 (0.0%) | 0 (0.0%) |
| 25 to 29 Years | 0 (0.0%) | 0 (0.0%) |
| 30 to 34 Years | 0 (0.0%) | 0 (0.0%) |
| 35 to 39 Years | 43 (5.3%) | 72 (9.7%) |
| 40 to 44 Years | 0 (0.0%) | 0 (0.0%) |
| 45 to 49 Years | 68 (8.3%) | 123 (16.5%) |
| 50 to 54 Years | 45 (5.5%) | 120 (16.1%) |
| 55 to 59 Years | 0 (0.0%) | 28 (3.8%) |
| 60 to 64 Years | 175 (21.5%) | 16 (2.1%) |
| 65 to 69 Years | 29 (3.6%) | 20 (2.7%) |
| 70 to 74 Years | 51 (6.3%) | 109 (14.6%) |
| 75 to 79 Years | 70 (8.6%) | 60 (8.1%) |
| 80 to 84 Years | 0 (0.0%) | 0 (0.0%) |
| 85 Years and over | 0 (0.0%) | 0 (0.0%) |
| Total | 815 (100.0%) | 744 (100.0%) |
Families and Households in Talpa
Median Family Size in Talpa
The median family size in Talpa is 3.08 persons per family, with single male/father families (23 | 5.8%) accounting for the largest median family size of 4.09 persons per family. On the other hand, married-couple families (316 | 80.0%) represent the smallest median family size with 3.01 persons per family.
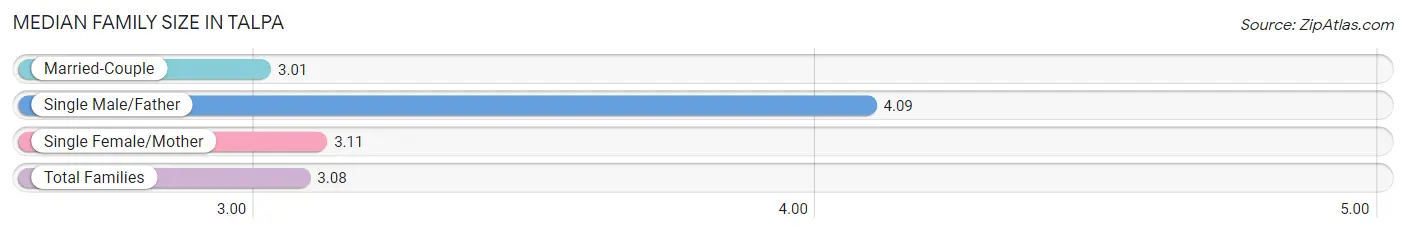
| Family Type | # Families | Family Size |
| Married-Couple | 316 (80.0%) | 3.01 |
| Single Male/Father | 23 (5.8%) | 4.09 |
| Single Female/Mother | 56 (14.2%) | 3.11 |
| Total Families | 395 (100.0%) | 3.08 |
Median Household Size in Talpa
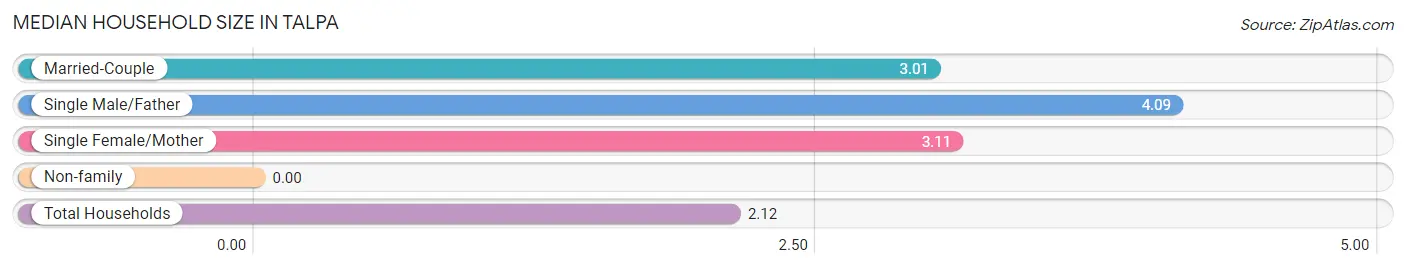
| Household Type | # Households | Household Size |
| Married-Couple | 316 (42.9%) | 3.01 |
| Single Male/Father | 23 (3.1%) | 4.09 |
| Single Female/Mother | 56 (7.6%) | 3.11 |
| Non-family | 341 (46.3%) | - |
| Total Households | 736 (100.0%) | 2.12 |
Household Size by Marriage Status in Talpa
Out of a total of 736 households in Talpa, 395 (53.7%) are family households, while 341 (46.3%) are nonfamily households. The most numerous type of family households are 2-person households, comprising 206, and the most common type of nonfamily households are 1-person households, comprising 341.
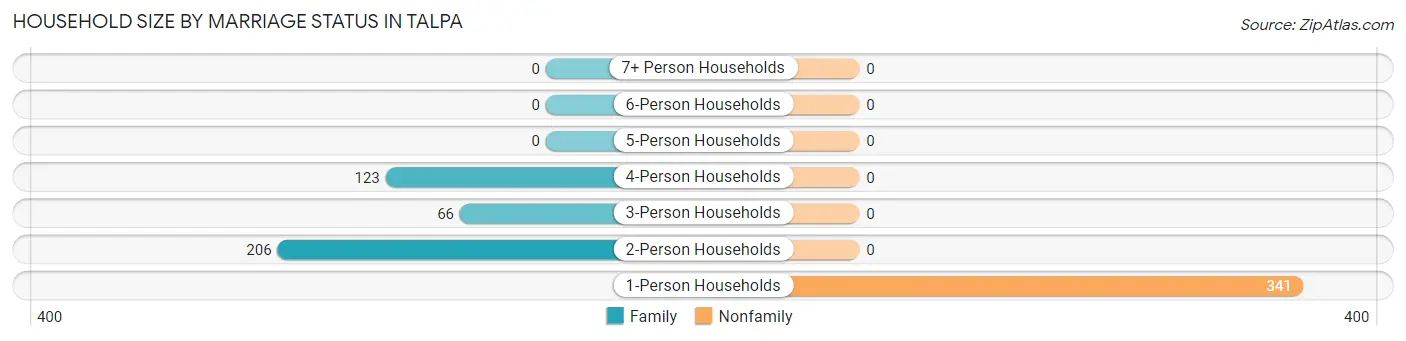
| Household Size | Family Households | Nonfamily Households |
| 1-Person Households | - | 341 (46.3%) |
| 2-Person Households | 206 (28.0%) | 0 (0.0%) |
| 3-Person Households | 66 (9.0%) | 0 (0.0%) |
| 4-Person Households | 123 (16.7%) | 0 (0.0%) |
| 5-Person Households | 0 (0.0%) | 0 (0.0%) |
| 6-Person Households | 0 (0.0%) | 0 (0.0%) |
| 7+ Person Households | 0 (0.0%) | 0 (0.0%) |
| Total | 395 (53.7%) | 341 (46.3%) |
Female Fertility in Talpa
Fertility by Age in Talpa
| Age Bracket | Women with Births | Births / 1,000 Women |
| 15 to 19 years | 0 (0.0%) | 0.0 |
| 20 to 34 years | 0 (0.0%) | 0.0 |
| 35 to 50 years | 0 (0.0%) | 0.0 |
| Total | 0 (0.0%) | 0.0 |
Fertility by Age by Marriage Status in Talpa
| Age Bracket | Married | Unmarried |
| 15 to 19 years | 0 (0.0%) | 0 (0.0%) |
| 20 to 34 years | 0 (0.0%) | 0 (0.0%) |
| 35 to 50 years | 0 (0.0%) | 0 (0.0%) |
| Total | 0 (0.0%) | 0 (0.0%) |
Fertility by Education in Talpa
| Educational Attainment | Women with Births | Births / 1,000 Women |
| Less than High School | 0 (0.0%) | 0.0 |
| High School Diploma | 0 (0.0%) | 0.0 |
| College or Associate's Degree | 0 (0.0%) | 0.0 |
| Bachelor's Degree | 0 (0.0%) | 0.0 |
| Graduate Degree | 0 (0.0%) | 0.0 |
| Total | 0 (0.0%) | 0.0 |
Fertility by Education by Marriage Status in Talpa
| Educational Attainment | Married | Unmarried |
| Less than High School | 0 (0.0%) | 0 (0.0%) |
| High School Diploma | 0 (0.0%) | 0 (0.0%) |
| College or Associate's Degree | 0 (0.0%) | 0 (0.0%) |
| Bachelor's Degree | 0 (0.0%) | 0 (0.0%) |
| Graduate Degree | 0 (0.0%) | 0 (0.0%) |
| Total | 0 (0.0%) | 0 (0.0%) |
Employment Characteristics in Talpa
Employment by Class of Employer in Talpa
Among the 646 employed individuals in Talpa, federal government employees (179 | 27.7%), private company employees (135 | 20.9%), and not-for-profit organizations (132 | 20.4%) make up the most common classes of employment.
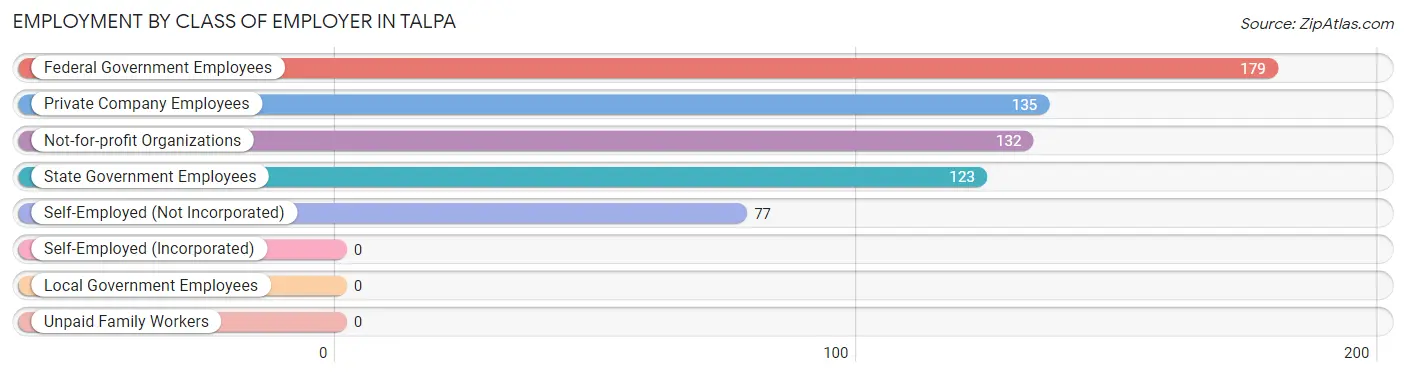
| Employer Class | # Employees | % Employees |
| Private Company Employees | 135 | 20.9% |
| Self-Employed (Incorporated) | 0 | 0.0% |
| Self-Employed (Not Incorporated) | 77 | 11.9% |
| Not-for-profit Organizations | 132 | 20.4% |
| Local Government Employees | 0 | 0.0% |
| State Government Employees | 123 | 19.0% |
| Federal Government Employees | 179 | 27.7% |
| Unpaid Family Workers | 0 | 0.0% |
| Total | 646 | 100.0% |
Employment Status by Age in Talpa
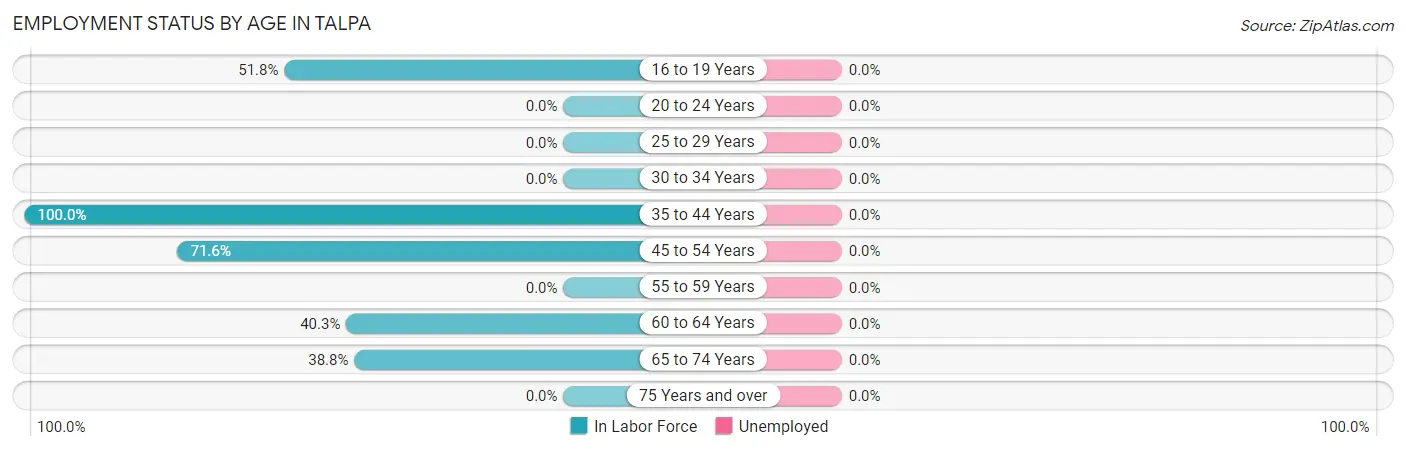
| Age Bracket | In Labor Force | Unemployed |
| 16 to 19 Years | 118 (51.8%) | 0 (0.0%) |
| 20 to 24 Years | 0 (0.0%) | 0 (0.0%) |
| 25 to 29 Years | 0 (0.0%) | 0 (0.0%) |
| 30 to 34 Years | 0 (0.0%) | 0 (0.0%) |
| 35 to 44 Years | 115 (100.0%) | 0 (0.0%) |
| 45 to 54 Years | 255 (71.6%) | 0 (0.0%) |
| 55 to 59 Years | 0 (0.0%) | 0 (0.0%) |
| 60 to 64 Years | 77 (40.3%) | 0 (0.0%) |
| 65 to 74 Years | 81 (38.8%) | 0 (0.0%) |
| 75 Years and over | 0 (0.0%) | 0 (0.0%) |
| Total | 646 (51.4%) | 0 (0.0%) |
Employment Status by Educational Attainment in Talpa
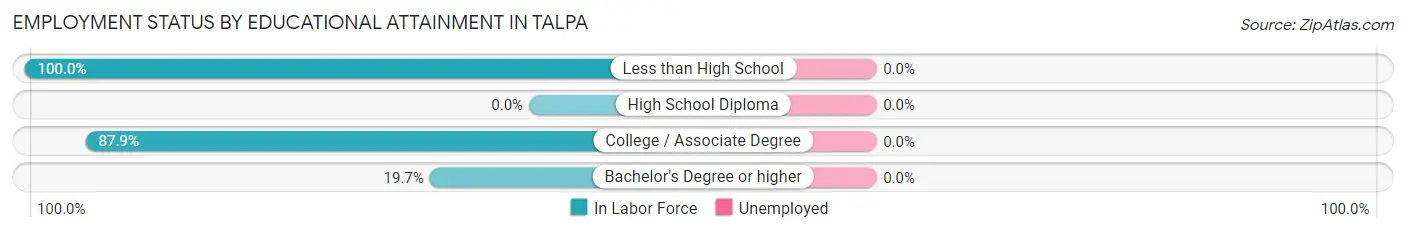
| Educational Attainment | In Labor Force | Unemployed |
| Less than High School | 77 (100.0%) | 0 (0.0%) |
| High School Diploma | 0 (0.0%) | 0 (0.0%) |
| College / Associate Degree | 327 (87.9%) | 0 (0.0%) |
| Bachelor's Degree or higher | 43 (19.7%) | 0 (0.0%) |
| Total | 447 (64.8%) | 0 (0.0%) |
Employment Occupations by Sex in Talpa
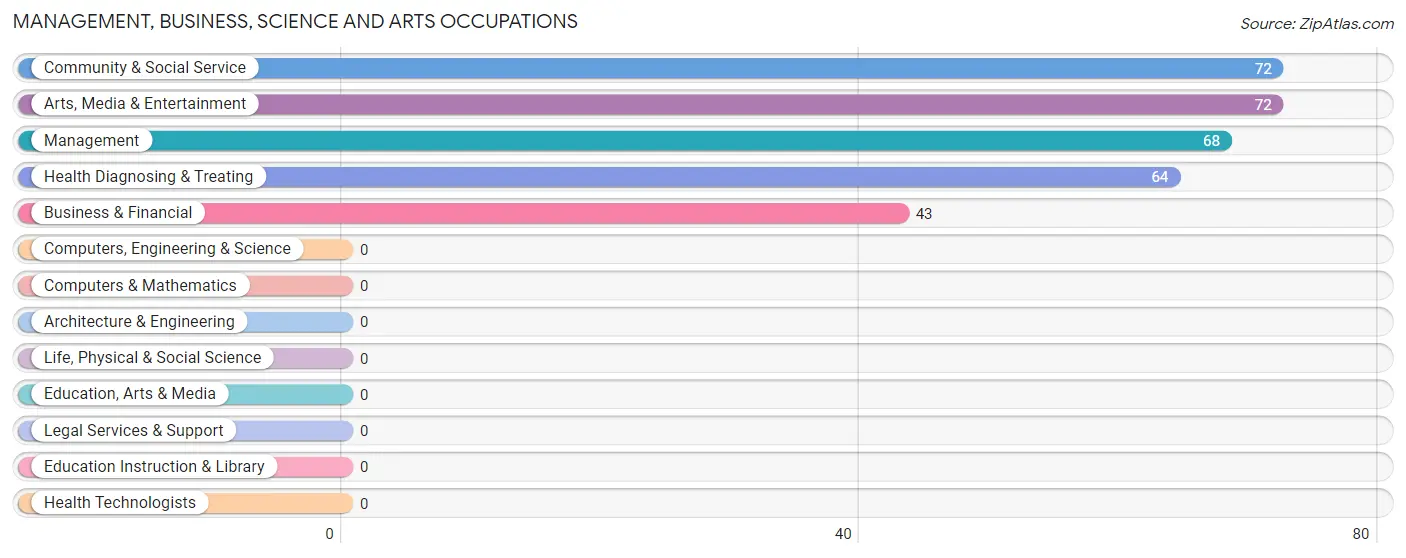
Management, Business, Science and Arts Occupations
The most common Management, Business, Science and Arts occupations in Talpa are Community & Social Service (72 | 11.2%), Arts, Media & Entertainment (72 | 11.2%), Management (68 | 10.5%), Health Diagnosing & Treating (64 | 9.9%), and Business & Financial (43 | 6.7%).
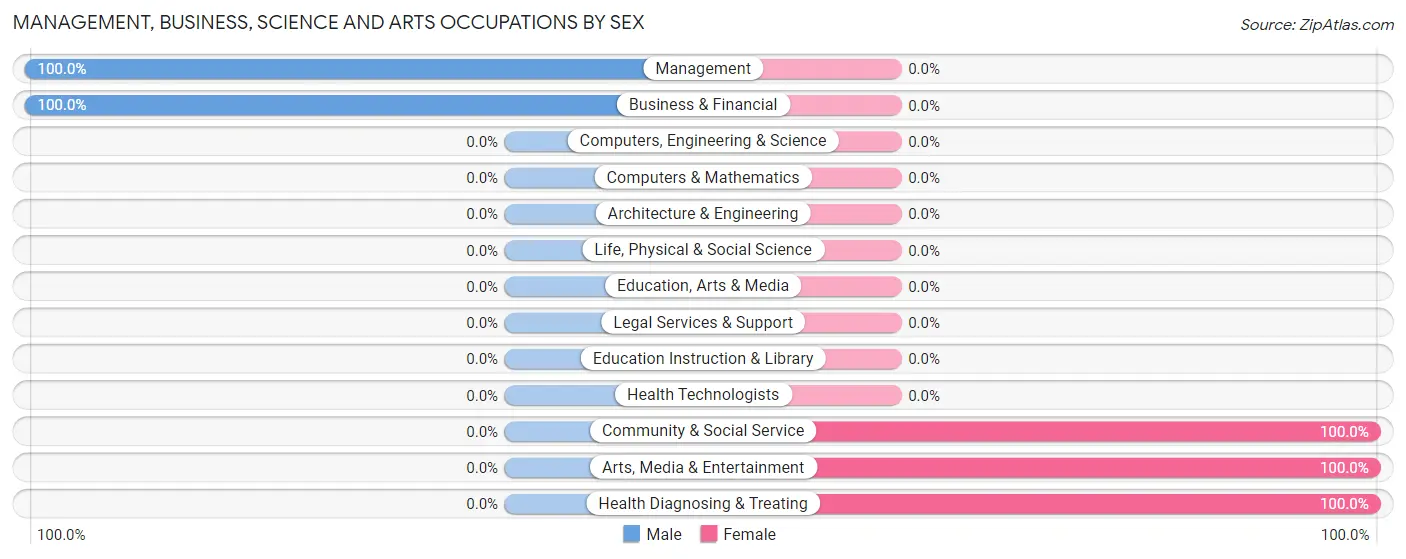
Management, Business, Science and Arts Occupations by Sex
Within the Management, Business, Science and Arts occupations in Talpa, the most male-oriented occupations are Management (100.0%), and Business & Financial (100.0%), while the most female-oriented occupations are Community & Social Service (100.0%), Arts, Media & Entertainment (100.0%), and Health Diagnosing & Treating (100.0%).
| Occupation | Male | Female |
| Management | 68 (100.0%) | 0 (0.0%) |
| Business & Financial | 43 (100.0%) | 0 (0.0%) |
| Computers, Engineering & Science | 0 (0.0%) | 0 (0.0%) |
| Computers & Mathematics | 0 (0.0%) | 0 (0.0%) |
| Architecture & Engineering | 0 (0.0%) | 0 (0.0%) |
| Life, Physical & Social Science | 0 (0.0%) | 0 (0.0%) |
| Community & Social Service | 0 (0.0%) | 72 (100.0%) |
| Education, Arts & Media | 0 (0.0%) | 0 (0.0%) |
| Legal Services & Support | 0 (0.0%) | 0 (0.0%) |
| Education Instruction & Library | 0 (0.0%) | 0 (0.0%) |
| Arts, Media & Entertainment | 0 (0.0%) | 72 (100.0%) |
| Health Diagnosing & Treating | 0 (0.0%) | 64 (100.0%) |
| Health Technologists | 0 (0.0%) | 0 (0.0%) |
| Total (Category) | 111 (44.9%) | 136 (55.1%) |
| Total (Overall) | 208 (32.2%) | 438 (67.8%) |
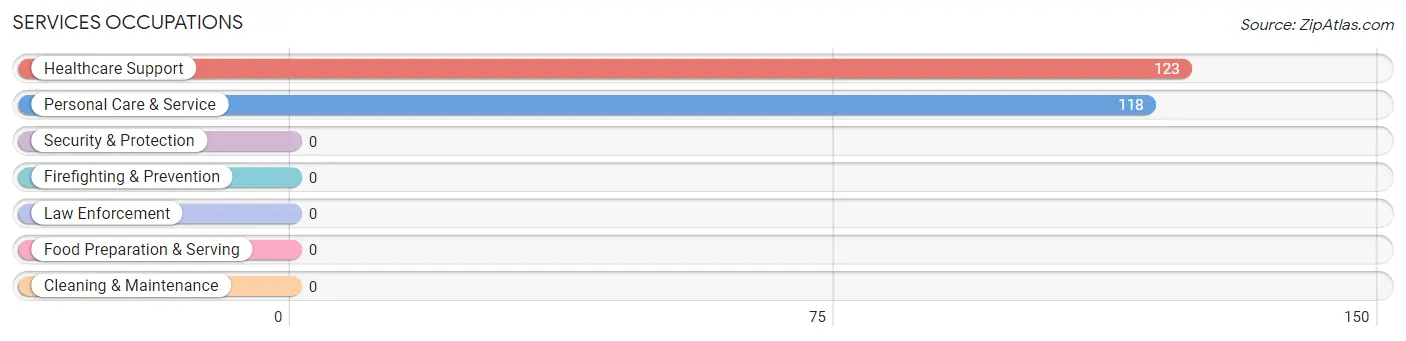
Services Occupations
The most common Services occupations in Talpa are Healthcare Support (123 | 19.0%), and Personal Care & Service (118 | 18.3%).
Services Occupations by Sex
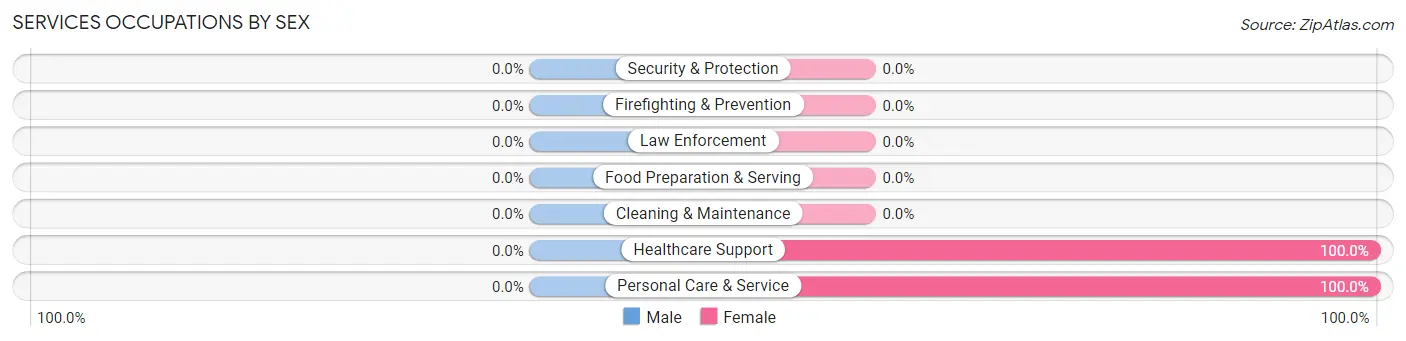
| Occupation | Male | Female |
| Healthcare Support | 0 (0.0%) | 123 (100.0%) |
| Security & Protection | 0 (0.0%) | 0 (0.0%) |
| Firefighting & Prevention | 0 (0.0%) | 0 (0.0%) |
| Law Enforcement | 0 (0.0%) | 0 (0.0%) |
| Food Preparation & Serving | 0 (0.0%) | 0 (0.0%) |
| Cleaning & Maintenance | 0 (0.0%) | 0 (0.0%) |
| Personal Care & Service | 0 (0.0%) | 118 (100.0%) |
| Total (Category) | 0 (0.0%) | 241 (100.0%) |
| Total (Overall) | 208 (32.2%) | 438 (67.8%) |
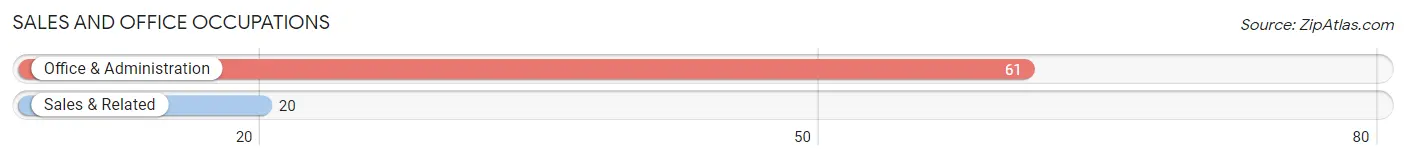
Sales and Office Occupations
The most common Sales and Office occupations in Talpa are Office & Administration (61 | 9.4%), and Sales & Related (20 | 3.1%).
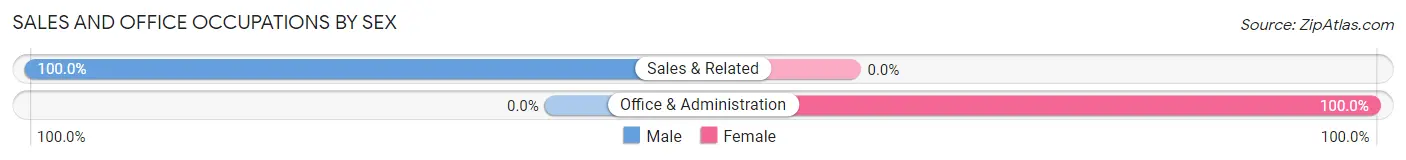
Sales and Office Occupations by Sex
| Occupation | Male | Female |
| Sales & Related | 20 (100.0%) | 0 (0.0%) |
| Office & Administration | 0 (0.0%) | 61 (100.0%) |
| Total (Category) | 20 (24.7%) | 61 (75.3%) |
| Total (Overall) | 208 (32.2%) | 438 (67.8%) |
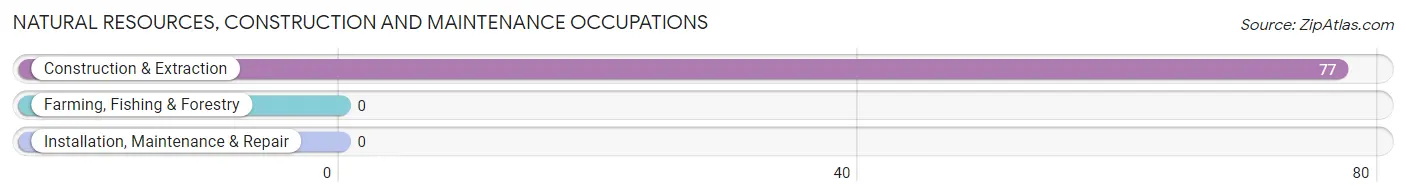
Natural Resources, Construction and Maintenance Occupations
The most common Natural Resources, Construction and Maintenance occupations in Talpa are , and Construction & Extraction (77 | 11.9%).
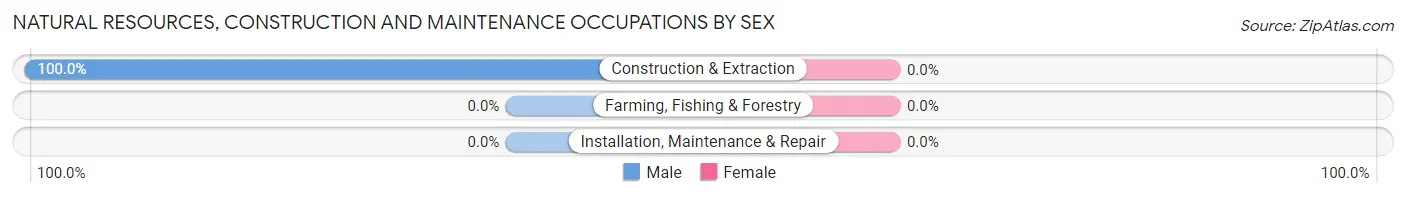
Natural Resources, Construction and Maintenance Occupations by Sex
| Occupation | Male | Female |
| Farming, Fishing & Forestry | 0 (0.0%) | 0 (0.0%) |
| Construction & Extraction | 77 (100.0%) | 0 (0.0%) |
| Installation, Maintenance & Repair | 0 (0.0%) | 0 (0.0%) |
| Total (Category) | 77 (100.0%) | 0 (0.0%) |
| Total (Overall) | 208 (32.2%) | 438 (67.8%) |
Production, Transportation and Moving Occupations
Production, Transportation and Moving Occupations by Sex
| Occupation | Male | Female |
| Production | 0 (0.0%) | 0 (0.0%) |
| Transportation | 0 (0.0%) | 0 (0.0%) |
| Material Moving | 0 (0.0%) | 0 (0.0%) |
| Total (Category) | 0 (0.0%) | 0 (0.0%) |
| Total (Overall) | 208 (32.2%) | 438 (67.8%) |
Employment Industries by Sex in Talpa
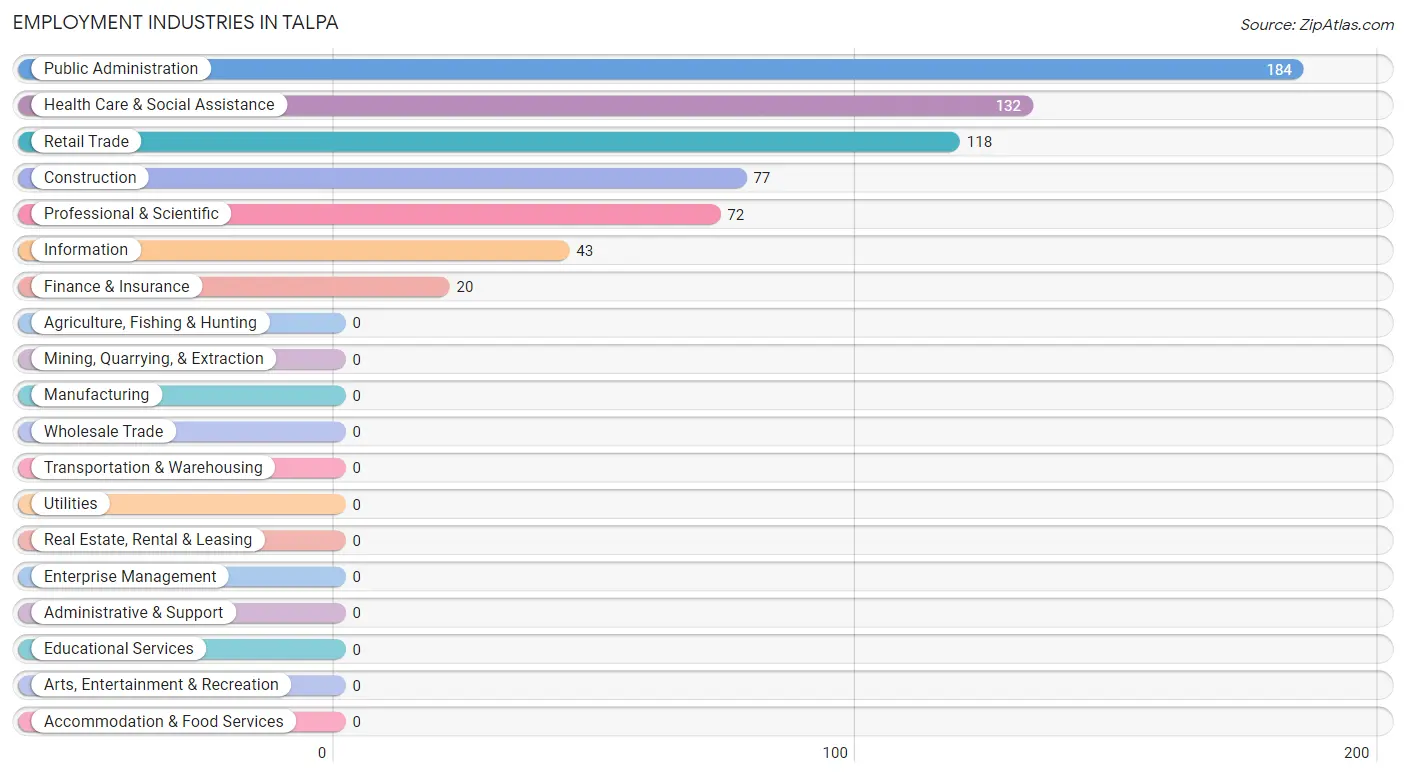
Employment Industries in Talpa
The major employment industries in Talpa include Public Administration (184 | 28.5%), Health Care & Social Assistance (132 | 20.4%), Retail Trade (118 | 18.3%), Construction (77 | 11.9%), and Professional & Scientific (72 | 11.2%).
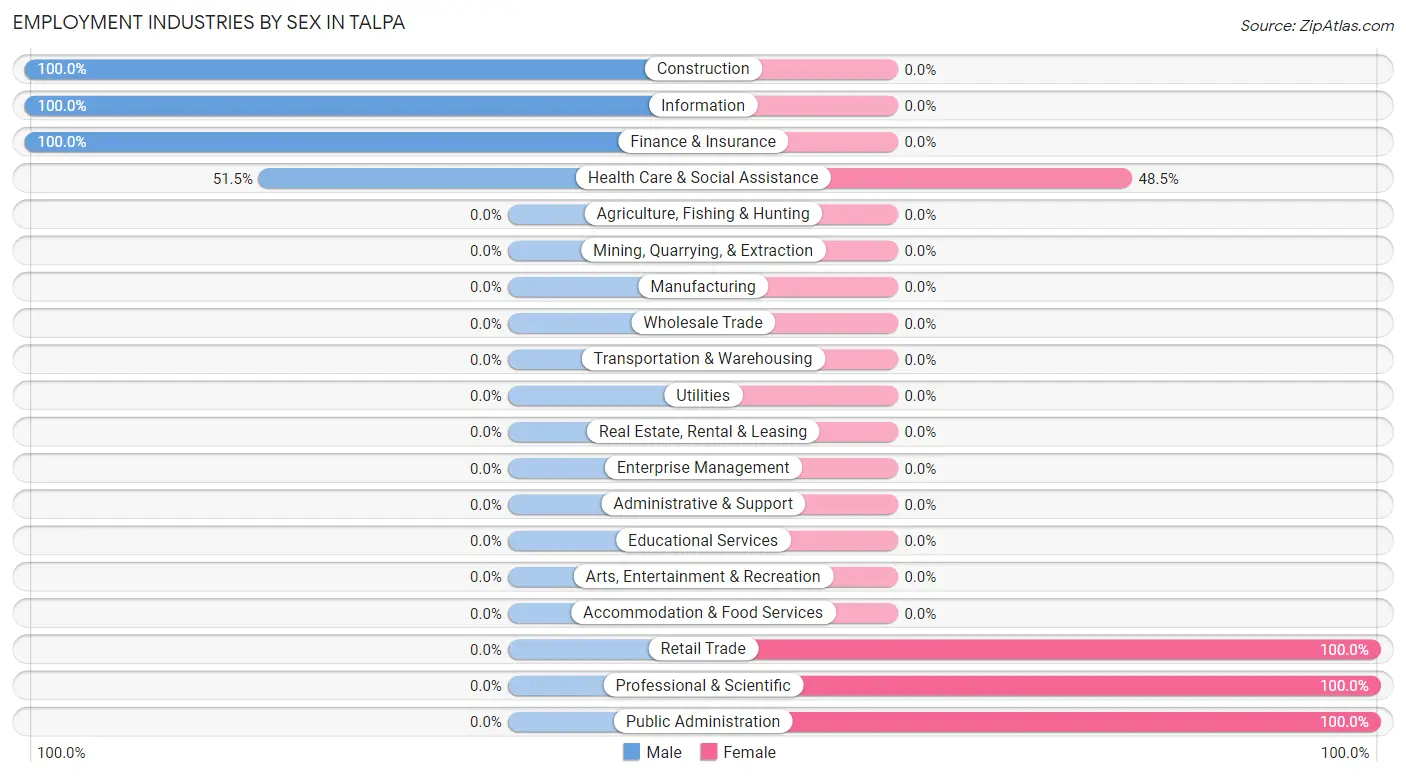
Employment Industries by Sex in Talpa
The Talpa industries that see more men than women are Construction (100.0%), Information (100.0%), and Finance & Insurance (100.0%), whereas the industries that tend to have a higher number of women are Retail Trade (100.0%), Professional & Scientific (100.0%), and Public Administration (100.0%).
| Industry | Male | Female |
| Agriculture, Fishing & Hunting | 0 (0.0%) | 0 (0.0%) |
| Mining, Quarrying, & Extraction | 0 (0.0%) | 0 (0.0%) |
| Construction | 77 (100.0%) | 0 (0.0%) |
| Manufacturing | 0 (0.0%) | 0 (0.0%) |
| Wholesale Trade | 0 (0.0%) | 0 (0.0%) |
| Retail Trade | 0 (0.0%) | 118 (100.0%) |
| Transportation & Warehousing | 0 (0.0%) | 0 (0.0%) |
| Utilities | 0 (0.0%) | 0 (0.0%) |
| Information | 43 (100.0%) | 0 (0.0%) |
| Finance & Insurance | 20 (100.0%) | 0 (0.0%) |
| Real Estate, Rental & Leasing | 0 (0.0%) | 0 (0.0%) |
| Professional & Scientific | 0 (0.0%) | 72 (100.0%) |
| Enterprise Management | 0 (0.0%) | 0 (0.0%) |
| Administrative & Support | 0 (0.0%) | 0 (0.0%) |
| Educational Services | 0 (0.0%) | 0 (0.0%) |
| Health Care & Social Assistance | 68 (51.5%) | 64 (48.5%) |
| Arts, Entertainment & Recreation | 0 (0.0%) | 0 (0.0%) |
| Accommodation & Food Services | 0 (0.0%) | 0 (0.0%) |
| Public Administration | 0 (0.0%) | 184 (100.0%) |
| Total | 208 (32.2%) | 438 (67.8%) |
Education in Talpa
School Enrollment in Talpa
The most common levels of schooling among the 428 students in Talpa are high school (215 | 50.2%), kindergarten (175 | 40.9%), and middle school (22 | 5.1%).
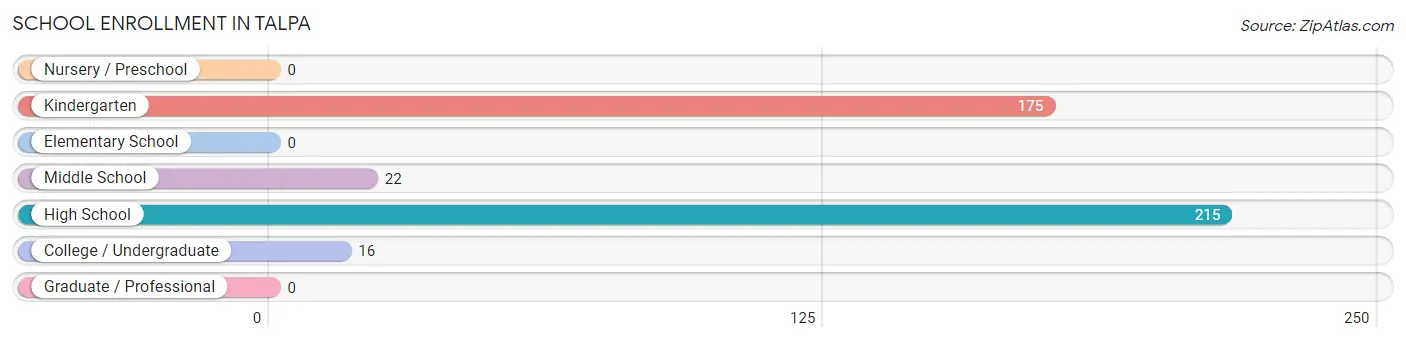
| School Level | # Students | % Students |
| Nursery / Preschool | 0 | 0.0% |
| Kindergarten | 175 | 40.9% |
| Elementary School | 0 | 0.0% |
| Middle School | 22 | 5.1% |
| High School | 215 | 50.2% |
| College / Undergraduate | 16 | 3.7% |
| Graduate / Professional | 0 | 0.0% |
| Total | 428 | 100.0% |
School Enrollment by Age by Funding Source in Talpa
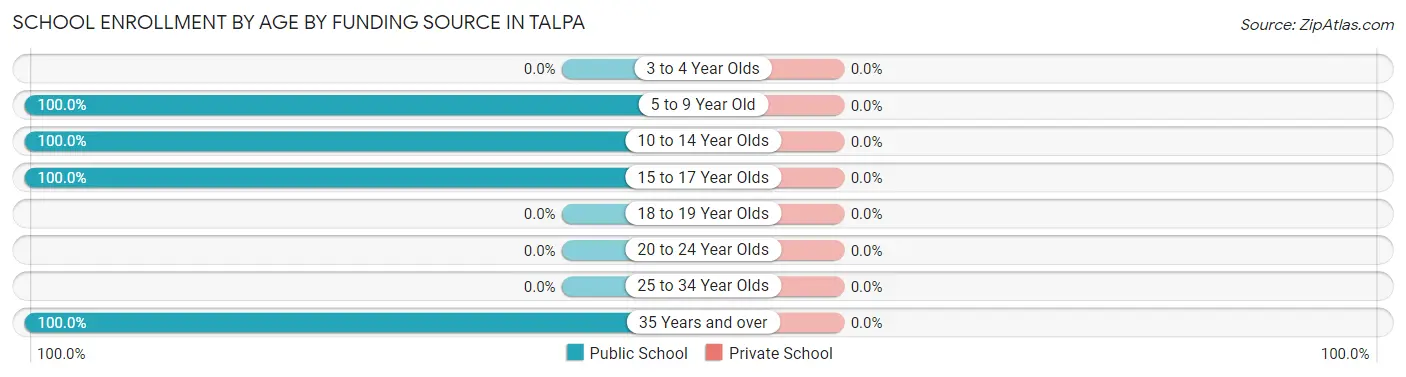
| Age Bracket | Public School | Private School |
| 3 to 4 Year Olds | 0 (0.0%) | 0 (0.0%) |
| 5 to 9 Year Old | 175 (100.0%) | 0 (0.0%) |
| 10 to 14 Year Olds | 71 (100.0%) | 0 (0.0%) |
| 15 to 17 Year Olds | 166 (100.0%) | 0 (0.0%) |
| 18 to 19 Year Olds | 0 (0.0%) | 0 (0.0%) |
| 20 to 24 Year Olds | 0 (0.0%) | 0 (0.0%) |
| 25 to 34 Year Olds | 0 (0.0%) | 0 (0.0%) |
| 35 Years and over | 16 (100.0%) | 0 (0.0%) |
| Total | 428 (100.0%) | 0 (0.0%) |
Educational Attainment by Field of Study in Talpa
Liberal arts & history (147 | 29.4%), business (91 | 18.2%), social sciences (64 | 12.8%), education (61 | 12.2%), and communications (61 | 12.2%) are the most common fields of study among 500 individuals in Talpa who have obtained a bachelor's degree or higher.
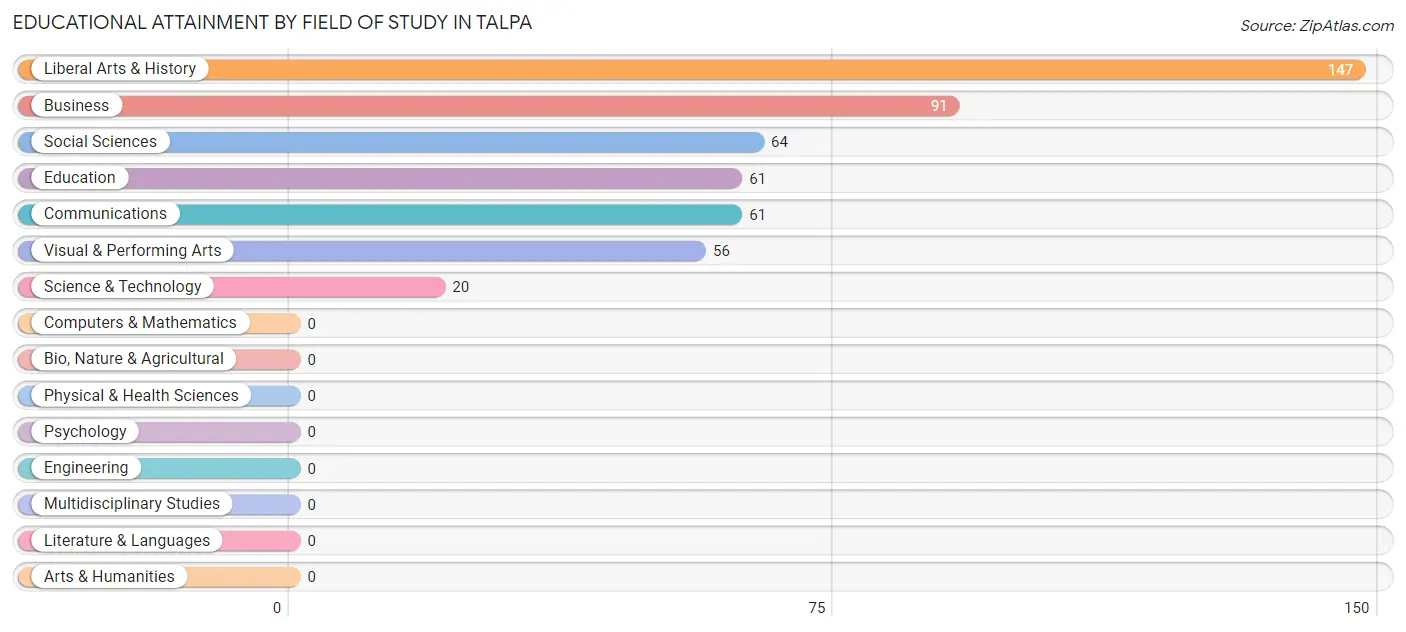
| Field of Study | # Graduates | % Graduates |
| Computers & Mathematics | 0 | 0.0% |
| Bio, Nature & Agricultural | 0 | 0.0% |
| Physical & Health Sciences | 0 | 0.0% |
| Psychology | 0 | 0.0% |
| Social Sciences | 64 | 12.8% |
| Engineering | 0 | 0.0% |
| Multidisciplinary Studies | 0 | 0.0% |
| Science & Technology | 20 | 4.0% |
| Business | 91 | 18.2% |
| Education | 61 | 12.2% |
| Literature & Languages | 0 | 0.0% |
| Liberal Arts & History | 147 | 29.4% |
| Visual & Performing Arts | 56 | 11.2% |
| Communications | 61 | 12.2% |
| Arts & Humanities | 0 | 0.0% |
| Total | 500 | 100.0% |
Transportation & Commute in Talpa
Vehicle Availability by Sex in Talpa
The most prevalent vehicle ownership categories in Talpa are males with 2 vehicles (77, accounting for 37.0%) and females with 2 vehicles (0, making up 17.6%).
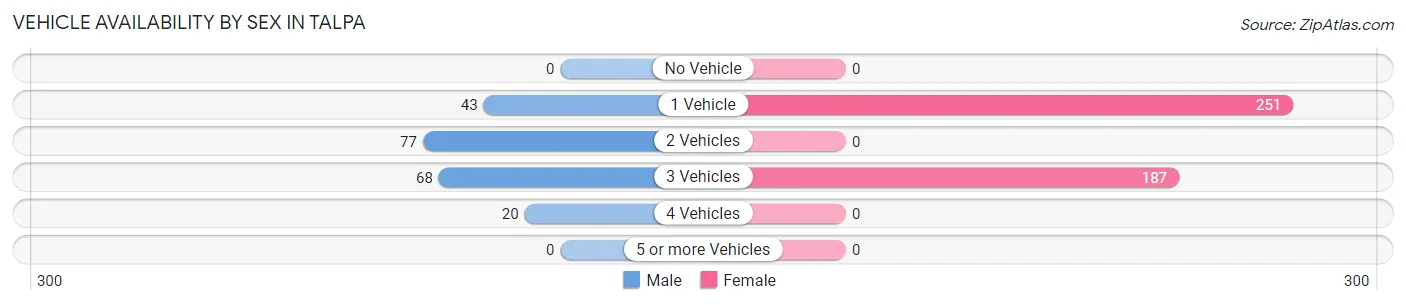
| Vehicles Available | Male | Female |
| No Vehicle | 0 (0.0%) | 0 (0.0%) |
| 1 Vehicle | 43 (20.7%) | 251 (57.3%) |
| 2 Vehicles | 77 (37.0%) | 0 (0.0%) |
| 3 Vehicles | 68 (32.7%) | 187 (42.7%) |
| 4 Vehicles | 20 (9.6%) | 0 (0.0%) |
| 5 or more Vehicles | 0 (0.0%) | 0 (0.0%) |
| Total | 208 (100.0%) | 438 (100.0%) |
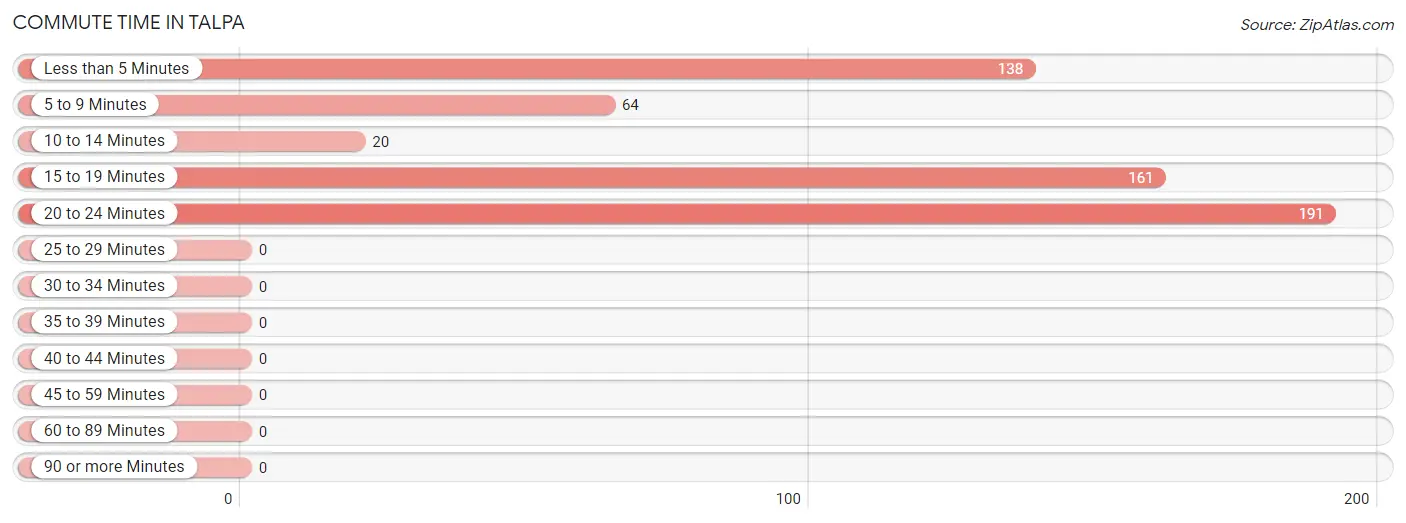
Commute Time in Talpa
The most frequently occuring commute durations in Talpa are 20 to 24 minutes (191 commuters, 33.3%), 15 to 19 minutes (161 commuters, 28.1%), and less than 5 minutes (138 commuters, 24.0%).
| Commute Time | # Commuters | % Commuters |
| Less than 5 Minutes | 138 | 24.0% |
| 5 to 9 Minutes | 64 | 11.2% |
| 10 to 14 Minutes | 20 | 3.5% |
| 15 to 19 Minutes | 161 | 28.1% |
| 20 to 24 Minutes | 191 | 33.3% |
| 25 to 29 Minutes | 0 | 0.0% |
| 30 to 34 Minutes | 0 | 0.0% |
| 35 to 39 Minutes | 0 | 0.0% |
| 40 to 44 Minutes | 0 | 0.0% |
| 45 to 59 Minutes | 0 | 0.0% |
| 60 to 89 Minutes | 0 | 0.0% |
| 90 or more Minutes | 0 | 0.0% |
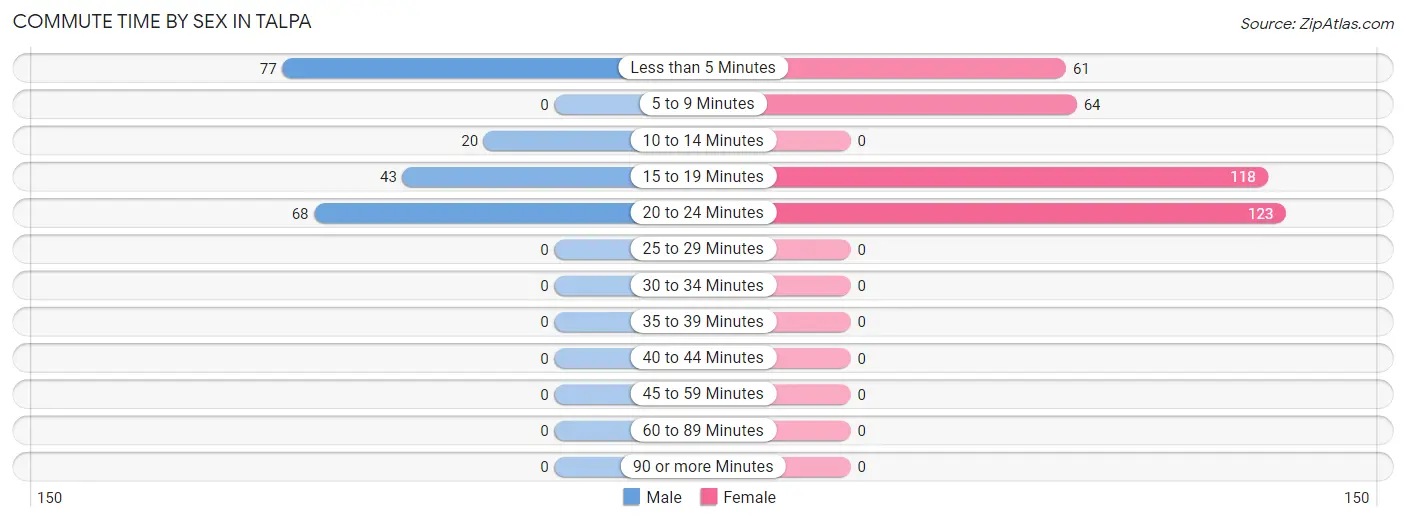
Commute Time by Sex in Talpa
The most common commute times in Talpa are less than 5 minutes (77 commuters, 37.0%) for males and 20 to 24 minutes (123 commuters, 33.6%) for females.
| Commute Time | Male | Female |
| Less than 5 Minutes | 77 (37.0%) | 61 (16.7%) |
| 5 to 9 Minutes | 0 (0.0%) | 64 (17.5%) |
| 10 to 14 Minutes | 20 (9.6%) | 0 (0.0%) |
| 15 to 19 Minutes | 43 (20.7%) | 118 (32.2%) |
| 20 to 24 Minutes | 68 (32.7%) | 123 (33.6%) |
| 25 to 29 Minutes | 0 (0.0%) | 0 (0.0%) |
| 30 to 34 Minutes | 0 (0.0%) | 0 (0.0%) |
| 35 to 39 Minutes | 0 (0.0%) | 0 (0.0%) |
| 40 to 44 Minutes | 0 (0.0%) | 0 (0.0%) |
| 45 to 59 Minutes | 0 (0.0%) | 0 (0.0%) |
| 60 to 89 Minutes | 0 (0.0%) | 0 (0.0%) |
| 90 or more Minutes | 0 (0.0%) | 0 (0.0%) |
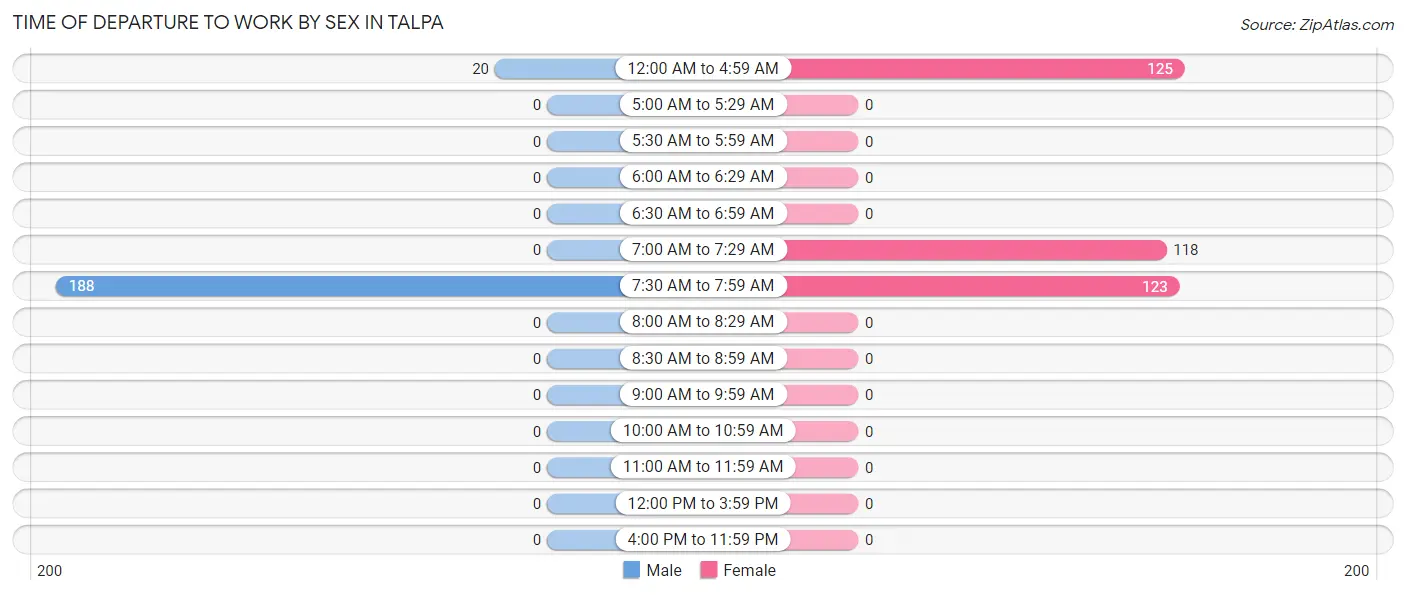
Time of Departure to Work by Sex in Talpa
The most frequent times of departure to work in Talpa are 7:30 AM to 7:59 AM (188, 90.4%) for males and 12:00 AM to 4:59 AM (125, 34.2%) for females.
| Time of Departure | Male | Female |
| 12:00 AM to 4:59 AM | 20 (9.6%) | 125 (34.2%) |
| 5:00 AM to 5:29 AM | 0 (0.0%) | 0 (0.0%) |
| 5:30 AM to 5:59 AM | 0 (0.0%) | 0 (0.0%) |
| 6:00 AM to 6:29 AM | 0 (0.0%) | 0 (0.0%) |
| 6:30 AM to 6:59 AM | 0 (0.0%) | 0 (0.0%) |
| 7:00 AM to 7:29 AM | 0 (0.0%) | 118 (32.2%) |
| 7:30 AM to 7:59 AM | 188 (90.4%) | 123 (33.6%) |
| 8:00 AM to 8:29 AM | 0 (0.0%) | 0 (0.0%) |
| 8:30 AM to 8:59 AM | 0 (0.0%) | 0 (0.0%) |
| 9:00 AM to 9:59 AM | 0 (0.0%) | 0 (0.0%) |
| 10:00 AM to 10:59 AM | 0 (0.0%) | 0 (0.0%) |
| 11:00 AM to 11:59 AM | 0 (0.0%) | 0 (0.0%) |
| 12:00 PM to 3:59 PM | 0 (0.0%) | 0 (0.0%) |
| 4:00 PM to 11:59 PM | 0 (0.0%) | 0 (0.0%) |
| Total | 208 (100.0%) | 366 (100.0%) |
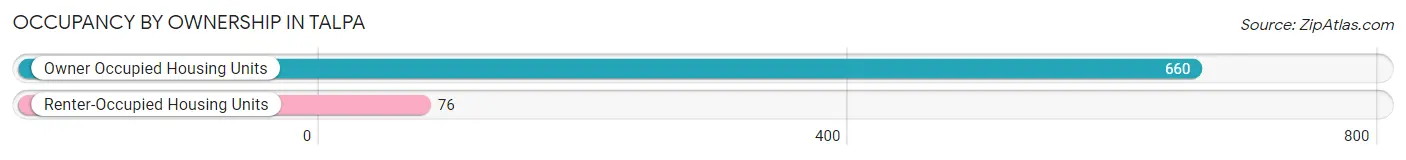
Housing Occupancy in Talpa
Occupancy by Ownership in Talpa
Of the total 736 dwellings in Talpa, owner-occupied units account for 660 (89.7%), while renter-occupied units make up 76 (10.3%).
| Occupancy | # Housing Units | % Housing Units |
| Owner Occupied Housing Units | 660 | 89.7% |
| Renter-Occupied Housing Units | 76 | 10.3% |
| Total Occupied Housing Units | 736 | 100.0% |
Occupancy by Household Size in Talpa
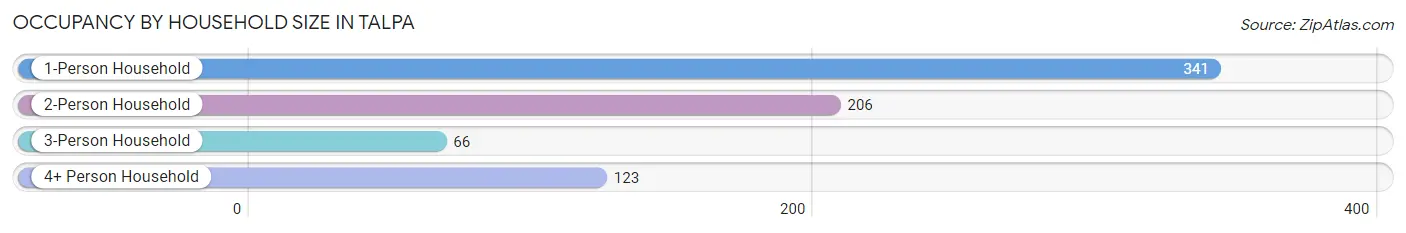
| Household Size | # Housing Units | % Housing Units |
| 1-Person Household | 341 | 46.3% |
| 2-Person Household | 206 | 28.0% |
| 3-Person Household | 66 | 9.0% |
| 4+ Person Household | 123 | 16.7% |
| Total Housing Units | 736 | 100.0% |
Occupancy by Ownership by Household Size in Talpa
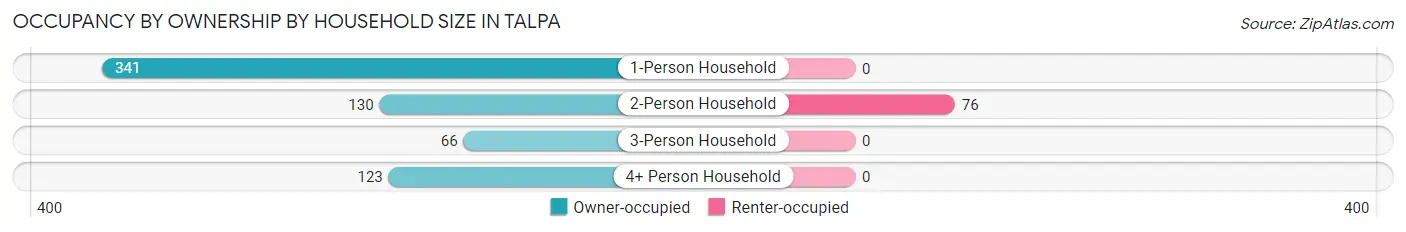
| Household Size | Owner-occupied | Renter-occupied |
| 1-Person Household | 341 (100.0%) | 0 (0.0%) |
| 2-Person Household | 130 (63.1%) | 76 (36.9%) |
| 3-Person Household | 66 (100.0%) | 0 (0.0%) |
| 4+ Person Household | 123 (100.0%) | 0 (0.0%) |
| Total Housing Units | 660 (89.7%) | 76 (10.3%) |
Occupancy by Educational Attainment in Talpa
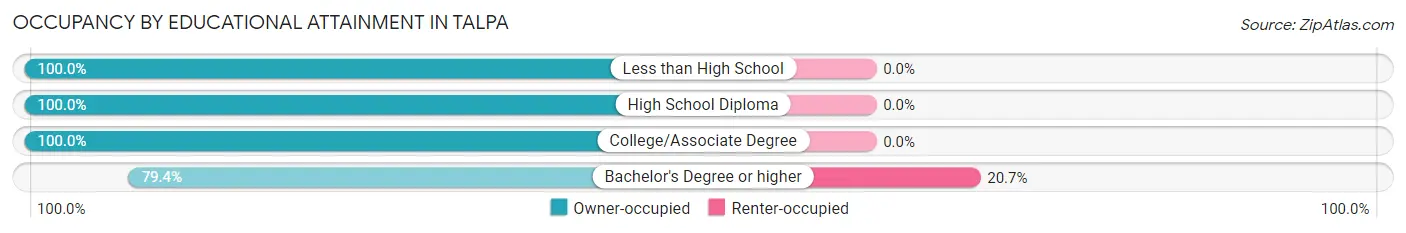
| Household Size | Owner-occupied | Renter-occupied |
| Less than High School | 77 (100.0%) | 0 (0.0%) |
| High School Diploma | 23 (100.0%) | 0 (0.0%) |
| College/Associate Degree | 268 (100.0%) | 0 (0.0%) |
| Bachelor's Degree or higher | 292 (79.3%) | 76 (20.6%) |
Occupancy by Age of Householder in Talpa
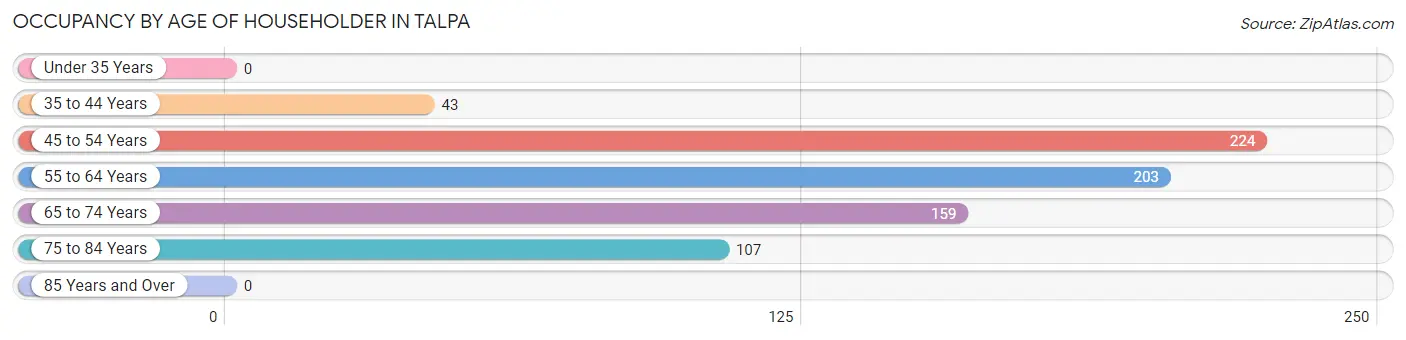
| Age Bracket | # Households | % Households |
| Under 35 Years | 0 | 0.0% |
| 35 to 44 Years | 43 | 5.8% |
| 45 to 54 Years | 224 | 30.4% |
| 55 to 64 Years | 203 | 27.6% |
| 65 to 74 Years | 159 | 21.6% |
| 75 to 84 Years | 107 | 14.5% |
| 85 Years and Over | 0 | 0.0% |
| Total | 736 | 100.0% |
Housing Finances in Talpa
Median Income by Occupancy in Talpa
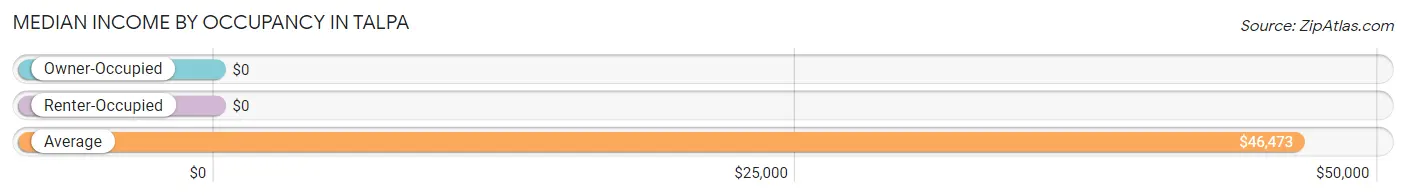
| Occupancy Type | # Households | Median Income |
| Owner-Occupied | 660 (89.7%) | $0 |
| Renter-Occupied | 76 (10.3%) | $0 |
| Average | 736 (100.0%) | $46,473 |
Occupancy by Householder Income Bracket in Talpa
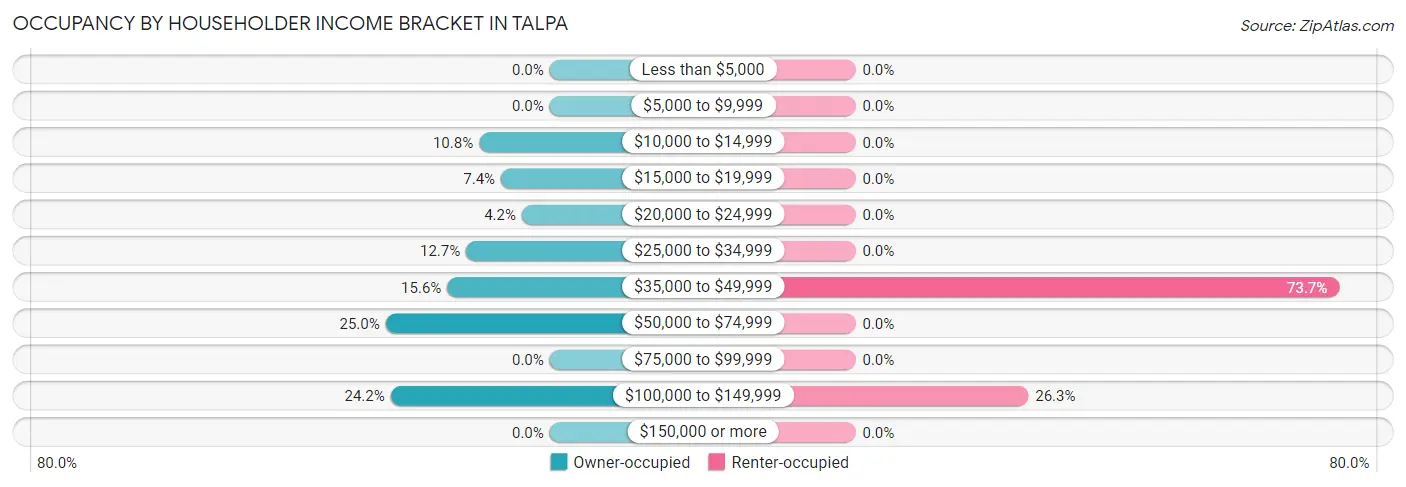
| Income Bracket | Owner-occupied | Renter-occupied |
| Less than $5,000 | 0 (0.0%) | 0 (0.0%) |
| $5,000 to $9,999 | 0 (0.0%) | 0 (0.0%) |
| $10,000 to $14,999 | 71 (10.8%) | 0 (0.0%) |
| $15,000 to $19,999 | 49 (7.4%) | 0 (0.0%) |
| $20,000 to $24,999 | 28 (4.2%) | 0 (0.0%) |
| $25,000 to $34,999 | 84 (12.7%) | 0 (0.0%) |
| $35,000 to $49,999 | 103 (15.6%) | 56 (73.7%) |
| $50,000 to $74,999 | 165 (25.0%) | 0 (0.0%) |
| $75,000 to $99,999 | 0 (0.0%) | 0 (0.0%) |
| $100,000 to $149,999 | 160 (24.2%) | 20 (26.3%) |
| $150,000 or more | 0 (0.0%) | 0 (0.0%) |
| Total | 660 (100.0%) | 76 (100.0%) |
Monthly Housing Cost Tiers in Talpa
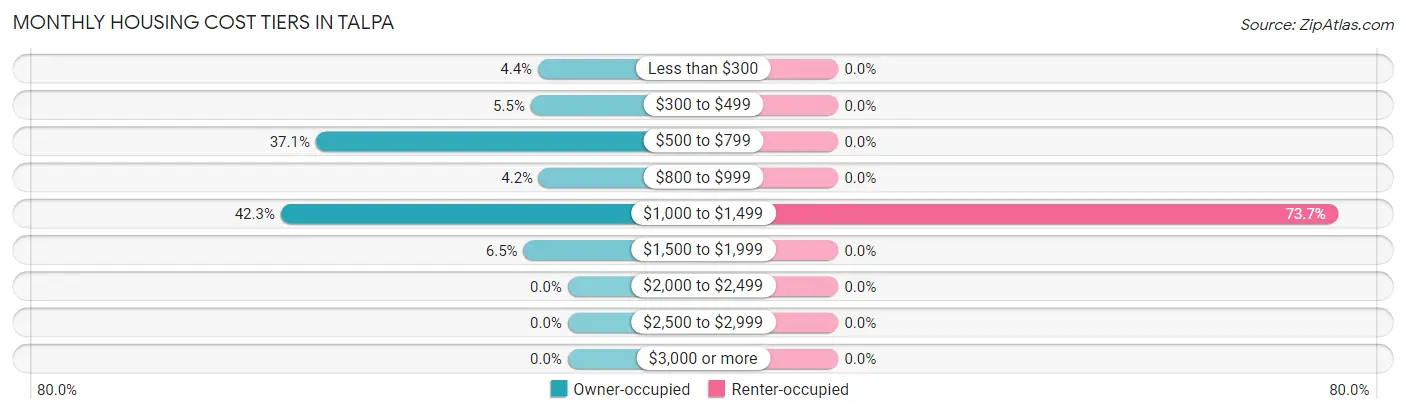
| Monthly Cost | Owner-occupied | Renter-occupied |
| Less than $300 | 29 (4.4%) | 0 (0.0%) |
| $300 to $499 | 36 (5.4%) | 0 (0.0%) |
| $500 to $799 | 245 (37.1%) | 0 (0.0%) |
| $800 to $999 | 28 (4.2%) | 0 (0.0%) |
| $1,000 to $1,499 | 279 (42.3%) | 56 (73.7%) |
| $1,500 to $1,999 | 43 (6.5%) | 0 (0.0%) |
| $2,000 to $2,499 | 0 (0.0%) | 0 (0.0%) |
| $2,500 to $2,999 | 0 (0.0%) | 0 (0.0%) |
| $3,000 or more | 0 (0.0%) | 0 (0.0%) |
| Total | 660 (100.0%) | 76 (100.0%) |
Physical Housing Characteristics in Talpa
Housing Structures in Talpa
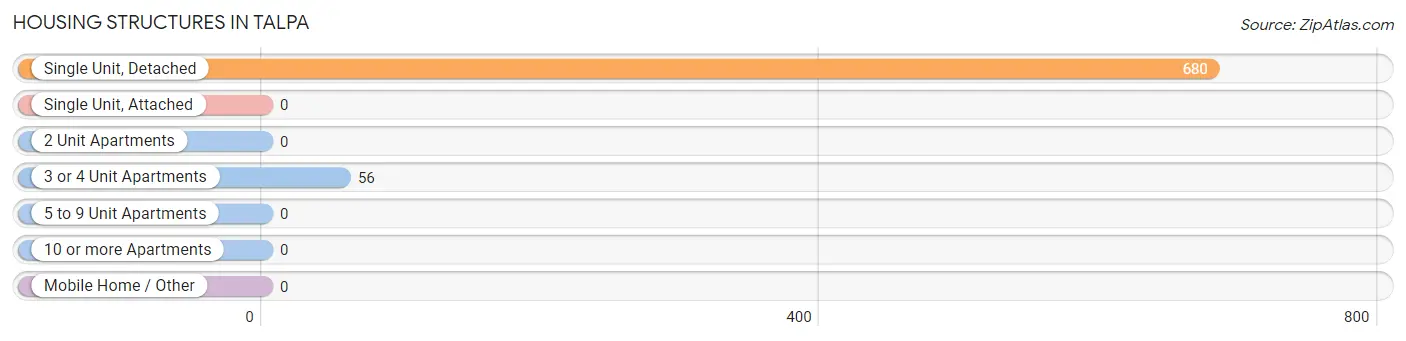
| Structure Type | # Housing Units | % Housing Units |
| Single Unit, Detached | 680 | 92.4% |
| Single Unit, Attached | 0 | 0.0% |
| 2 Unit Apartments | 0 | 0.0% |
| 3 or 4 Unit Apartments | 56 | 7.6% |
| 5 to 9 Unit Apartments | 0 | 0.0% |
| 10 or more Apartments | 0 | 0.0% |
| Mobile Home / Other | 0 | 0.0% |
| Total | 736 | 100.0% |
Housing Structures by Occupancy in Talpa
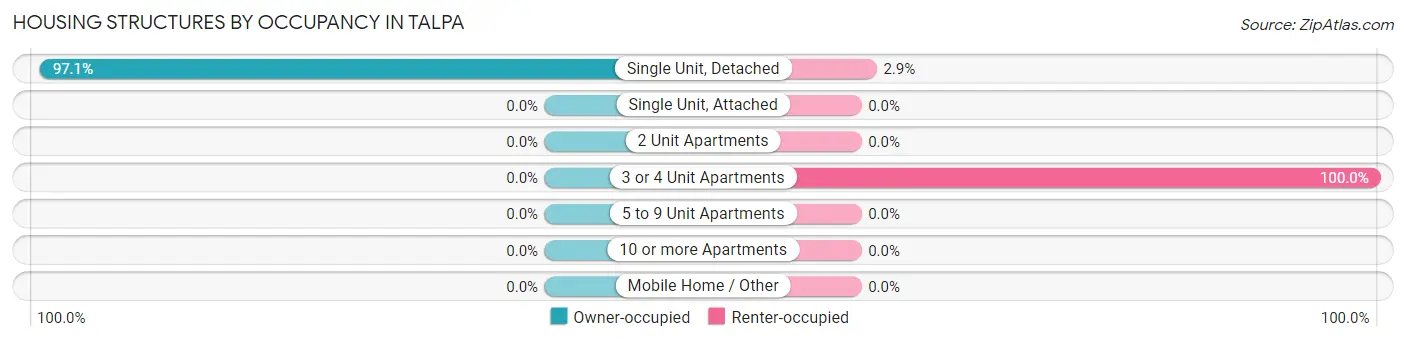
| Structure Type | Owner-occupied | Renter-occupied |
| Single Unit, Detached | 660 (97.1%) | 20 (2.9%) |
| Single Unit, Attached | 0 (0.0%) | 0 (0.0%) |
| 2 Unit Apartments | 0 (0.0%) | 0 (0.0%) |
| 3 or 4 Unit Apartments | 0 (0.0%) | 56 (100.0%) |
| 5 to 9 Unit Apartments | 0 (0.0%) | 0 (0.0%) |
| 10 or more Apartments | 0 (0.0%) | 0 (0.0%) |
| Mobile Home / Other | 0 (0.0%) | 0 (0.0%) |
| Total | 660 (89.7%) | 76 (10.3%) |
Housing Structures by Number of Rooms in Talpa
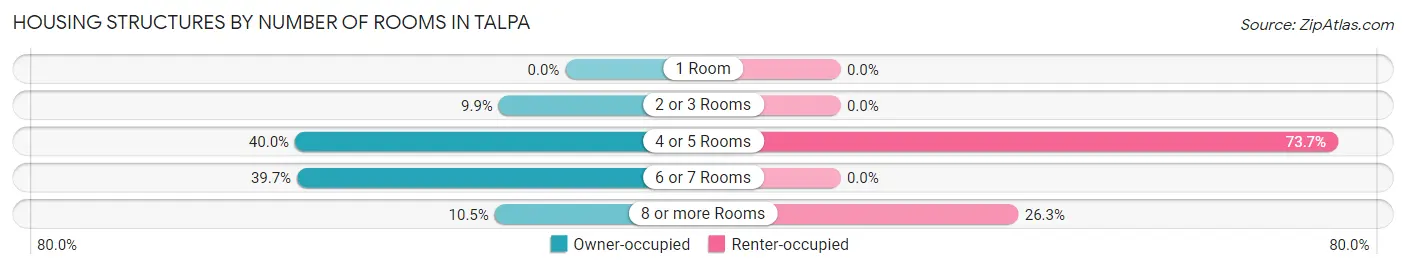
| Number of Rooms | Owner-occupied | Renter-occupied |
| 1 Room | 0 (0.0%) | 0 (0.0%) |
| 2 or 3 Rooms | 65 (9.9%) | 0 (0.0%) |
| 4 or 5 Rooms | 264 (40.0%) | 56 (73.7%) |
| 6 or 7 Rooms | 262 (39.7%) | 0 (0.0%) |
| 8 or more Rooms | 69 (10.4%) | 20 (26.3%) |
| Total | 660 (100.0%) | 76 (100.0%) |
Housing Structure by Heating Type in Talpa
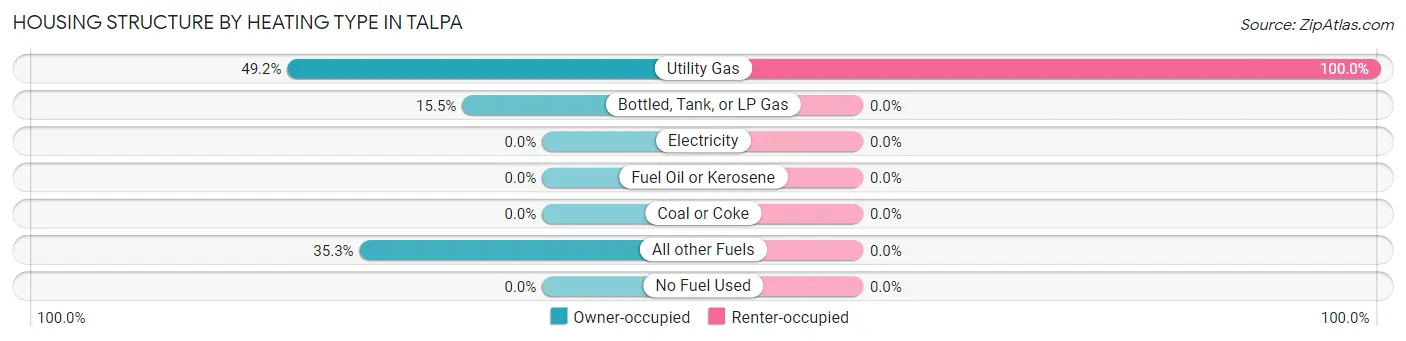
| Heating Type | Owner-occupied | Renter-occupied |
| Utility Gas | 325 (49.2%) | 76 (100.0%) |
| Bottled, Tank, or LP Gas | 102 (15.4%) | 0 (0.0%) |
| Electricity | 0 (0.0%) | 0 (0.0%) |
| Fuel Oil or Kerosene | 0 (0.0%) | 0 (0.0%) |
| Coal or Coke | 0 (0.0%) | 0 (0.0%) |
| All other Fuels | 233 (35.3%) | 0 (0.0%) |
| No Fuel Used | 0 (0.0%) | 0 (0.0%) |
| Total | 660 (100.0%) | 76 (100.0%) |
Household Vehicle Usage in Talpa
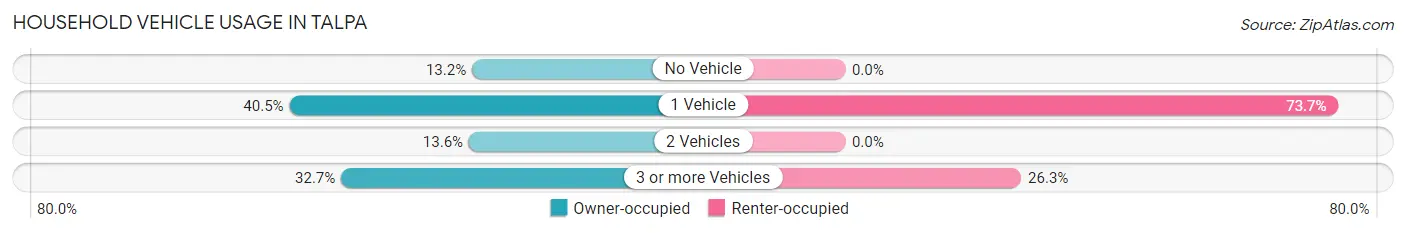
| Vehicles per Household | Owner-occupied | Renter-occupied |
| No Vehicle | 87 (13.2%) | 0 (0.0%) |
| 1 Vehicle | 267 (40.5%) | 56 (73.7%) |
| 2 Vehicles | 90 (13.6%) | 0 (0.0%) |
| 3 or more Vehicles | 216 (32.7%) | 20 (26.3%) |
| Total | 660 (100.0%) | 76 (100.0%) |
Real Estate & Mortgages in Talpa
Real Estate and Mortgage Overview in Talpa
| Characteristic | Without Mortgage | With Mortgage |
| Housing Units | 347 | 313 |
| Median Property Value | $431,600 | $239,900 |
| Median Household Income | $29,509 | $0 |
| Monthly Housing Costs | $604 | $0 |
| Real Estate Taxes | $2,307 | $0 |
Property Value by Mortgage Status in Talpa
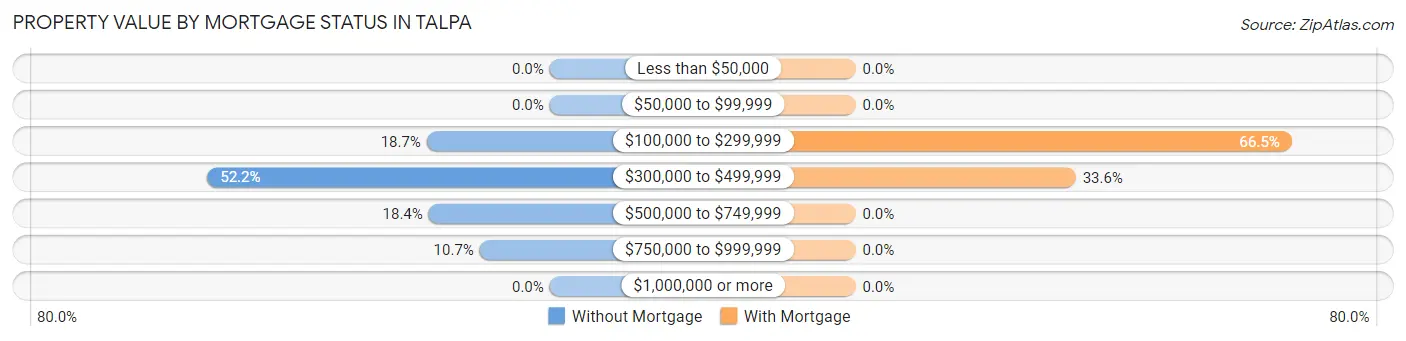
| Property Value | Without Mortgage | With Mortgage |
| Less than $50,000 | 0 (0.0%) | 0 (0.0%) |
| $50,000 to $99,999 | 0 (0.0%) | 0 (0.0%) |
| $100,000 to $299,999 | 65 (18.7%) | 208 (66.4%) |
| $300,000 to $499,999 | 181 (52.2%) | 105 (33.6%) |
| $500,000 to $749,999 | 64 (18.4%) | 0 (0.0%) |
| $750,000 to $999,999 | 37 (10.7%) | 0 (0.0%) |
| $1,000,000 or more | 0 (0.0%) | 0 (0.0%) |
| Total | 347 (100.0%) | 313 (100.0%) |
Household Income by Mortgage Status in Talpa
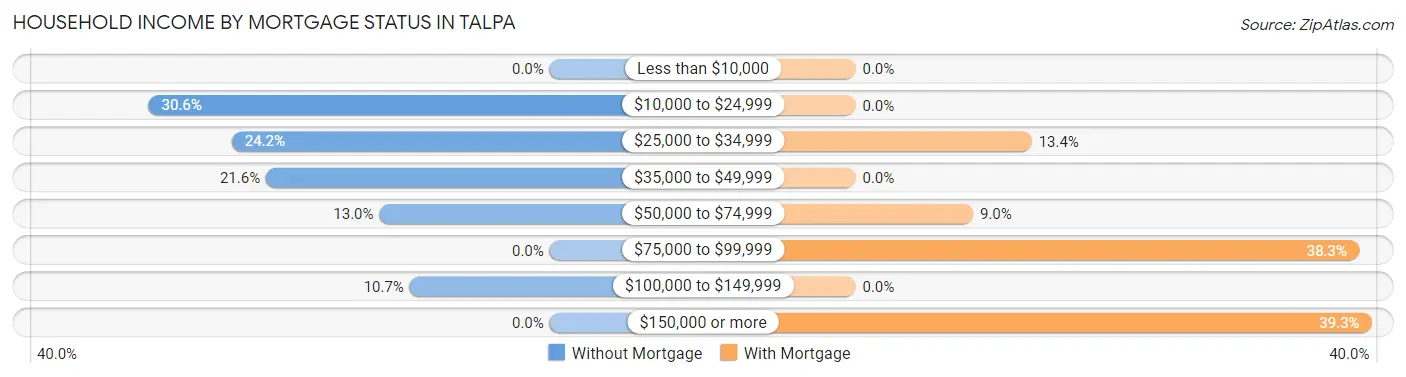
| Household Income | Without Mortgage | With Mortgage |
| Less than $10,000 | 0 (0.0%) | 0 (0.0%) |
| $10,000 to $24,999 | 106 (30.5%) | 0 (0.0%) |
| $25,000 to $34,999 | 84 (24.2%) | 42 (13.4%) |
| $35,000 to $49,999 | 75 (21.6%) | 0 (0.0%) |
| $50,000 to $74,999 | 45 (13.0%) | 28 (8.9%) |
| $75,000 to $99,999 | 0 (0.0%) | 120 (38.3%) |
| $100,000 to $149,999 | 37 (10.7%) | 0 (0.0%) |
| $150,000 or more | 0 (0.0%) | 123 (39.3%) |
| Total | 347 (100.0%) | 313 (100.0%) |
Property Value to Household Income Ratio in Talpa
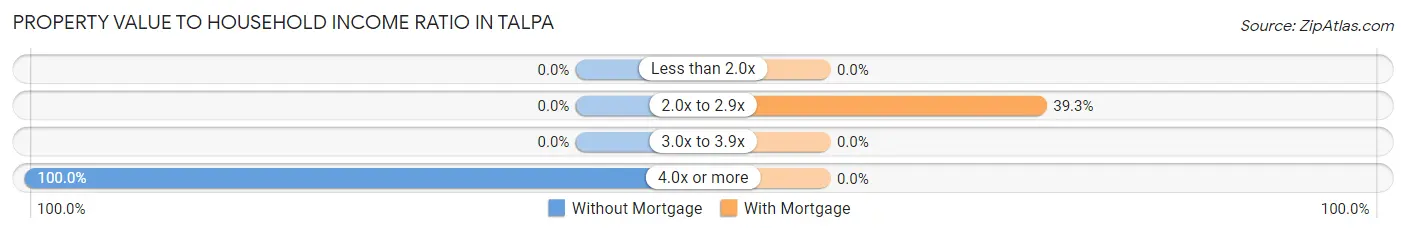
| Value-to-Income Ratio | Without Mortgage | With Mortgage |
| Less than 2.0x | 0 (0.0%) | 0 (0.0%) |
| 2.0x to 2.9x | 0 (0.0%) | 123 (39.3%) |
| 3.0x to 3.9x | 0 (0.0%) | 0 (0.0%) |
| 4.0x or more | 347 (100.0%) | 0 (0.0%) |
| Total | 347 (100.0%) | 313 (100.0%) |
Real Estate Taxes by Mortgage Status in Talpa
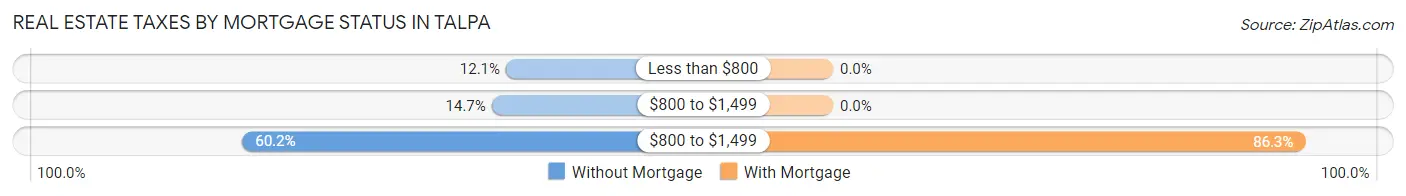
| Property Taxes | Without Mortgage | With Mortgage |
| Less than $800 | 42 (12.1%) | 0 (0.0%) |
| $800 to $1,499 | 51 (14.7%) | 0 (0.0%) |
| $800 to $1,499 | 209 (60.2%) | 270 (86.3%) |
| Total | 347 (100.0%) | 313 (100.0%) |
Health & Disability in Talpa
Health Insurance Coverage by Age in Talpa
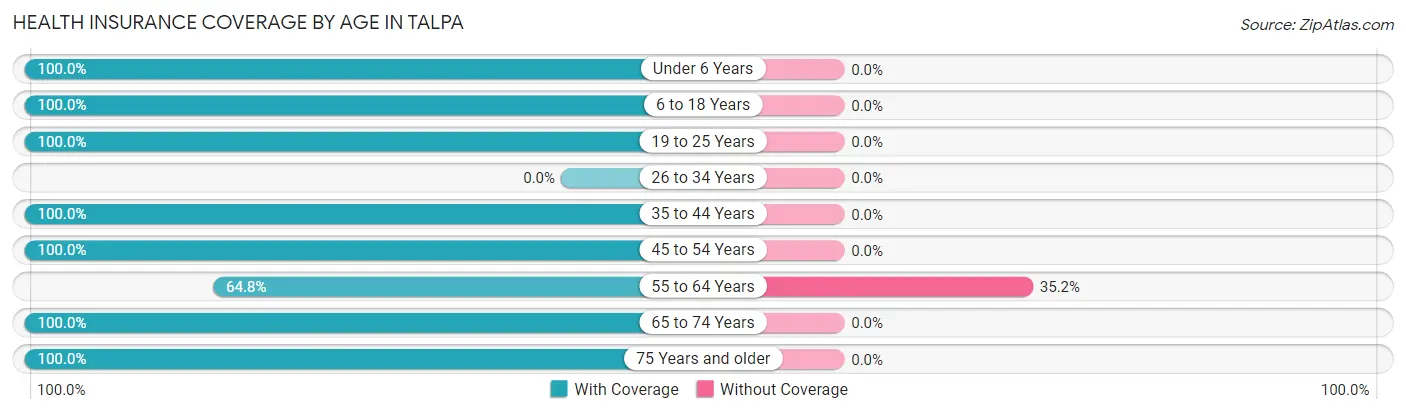
| Age Bracket | With Coverage | Without Coverage |
| Under 6 Years | 175 (100.0%) | 0 (0.0%) |
| 6 to 18 Years | 237 (100.0%) | 0 (0.0%) |
| 19 to 25 Years | 118 (100.0%) | 0 (0.0%) |
| 26 to 34 Years | 0 (0.0%) | 0 (0.0%) |
| 35 to 44 Years | 115 (100.0%) | 0 (0.0%) |
| 45 to 54 Years | 356 (100.0%) | 0 (0.0%) |
| 55 to 64 Years | 142 (64.8%) | 77 (35.2%) |
| 65 to 74 Years | 209 (100.0%) | 0 (0.0%) |
| 75 Years and older | 130 (100.0%) | 0 (0.0%) |
| Total | 1,482 (95.1%) | 77 (4.9%) |
Health Insurance Coverage by Citizenship Status in Talpa
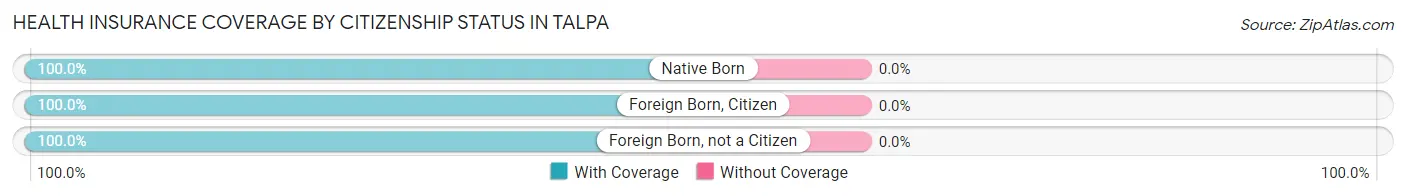
| Citizenship Status | With Coverage | Without Coverage |
| Native Born | 175 (100.0%) | 0 (0.0%) |
| Foreign Born, Citizen | 237 (100.0%) | 0 (0.0%) |
| Foreign Born, not a Citizen | 118 (100.0%) | 0 (0.0%) |
Health Insurance Coverage by Household Income in Talpa
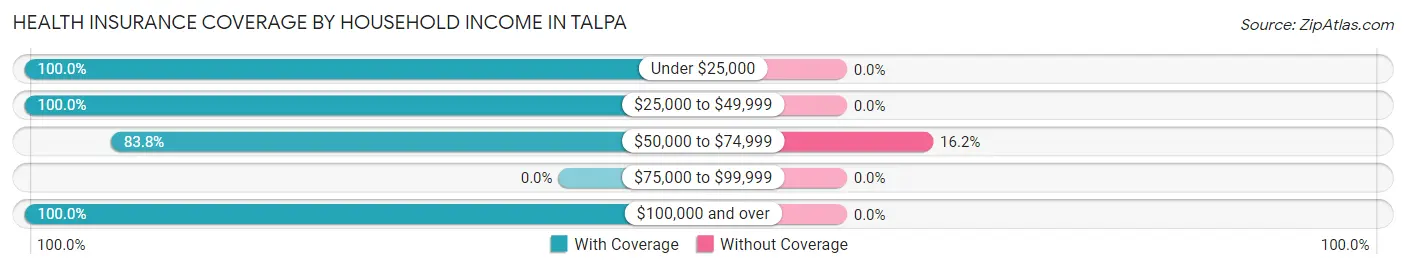
| Household Income | With Coverage | Without Coverage |
| Under $25,000 | 186 (100.0%) | 0 (0.0%) |
| $25,000 to $49,999 | 432 (100.0%) | 0 (0.0%) |
| $50,000 to $74,999 | 399 (83.8%) | 77 (16.2%) |
| $75,000 to $99,999 | 0 (0.0%) | 0 (0.0%) |
| $100,000 and over | 465 (100.0%) | 0 (0.0%) |
Public vs Private Health Insurance Coverage by Age in Talpa
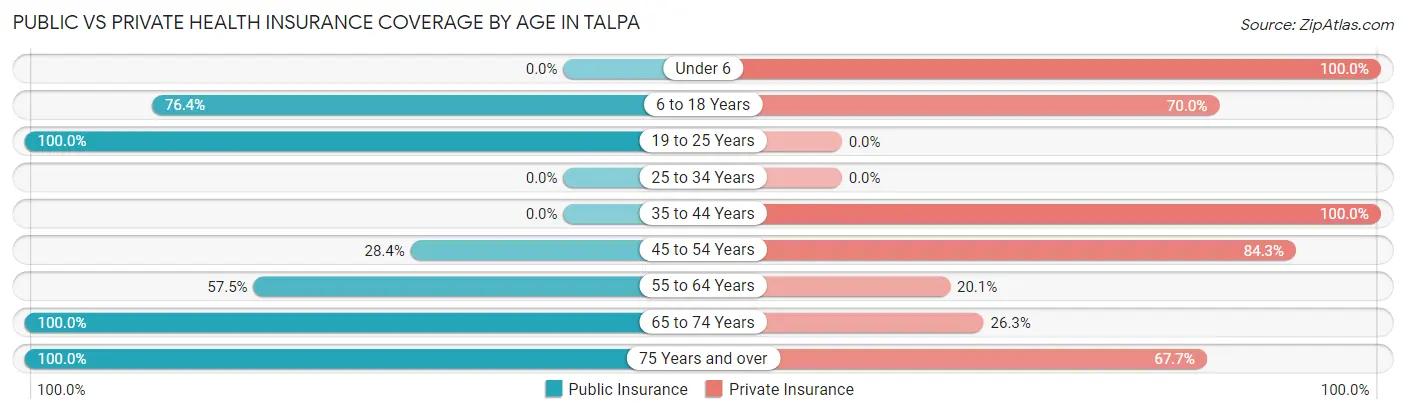
| Age Bracket | Public Insurance | Private Insurance |
| Under 6 | 0 (0.0%) | 175 (100.0%) |
| 6 to 18 Years | 181 (76.4%) | 166 (70.0%) |
| 19 to 25 Years | 118 (100.0%) | 0 (0.0%) |
| 25 to 34 Years | 0 (0.0%) | 0 (0.0%) |
| 35 to 44 Years | 0 (0.0%) | 115 (100.0%) |
| 45 to 54 Years | 101 (28.4%) | 300 (84.3%) |
| 55 to 64 Years | 126 (57.5%) | 44 (20.1%) |
| 65 to 74 Years | 209 (100.0%) | 55 (26.3%) |
| 75 Years and over | 130 (100.0%) | 88 (67.7%) |
| Total | 865 (55.5%) | 943 (60.5%) |
Disability Status by Sex by Age in Talpa
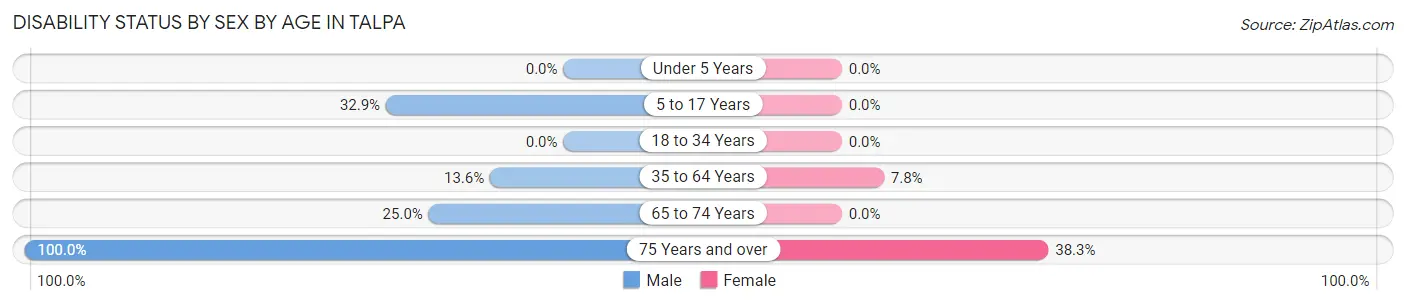
| Age Bracket | Male | Female |
| Under 5 Years | 0 (0.0%) | 0 (0.0%) |
| 5 to 17 Years | 110 (32.9%) | 0 (0.0%) |
| 18 to 34 Years | 0 (0.0%) | 0 (0.0%) |
| 35 to 64 Years | 45 (13.6%) | 28 (7.8%) |
| 65 to 74 Years | 20 (25.0%) | 0 (0.0%) |
| 75 Years and over | 70 (100.0%) | 23 (38.3%) |
Disability Class by Sex by Age in Talpa
Disability Class: Hearing Difficulty
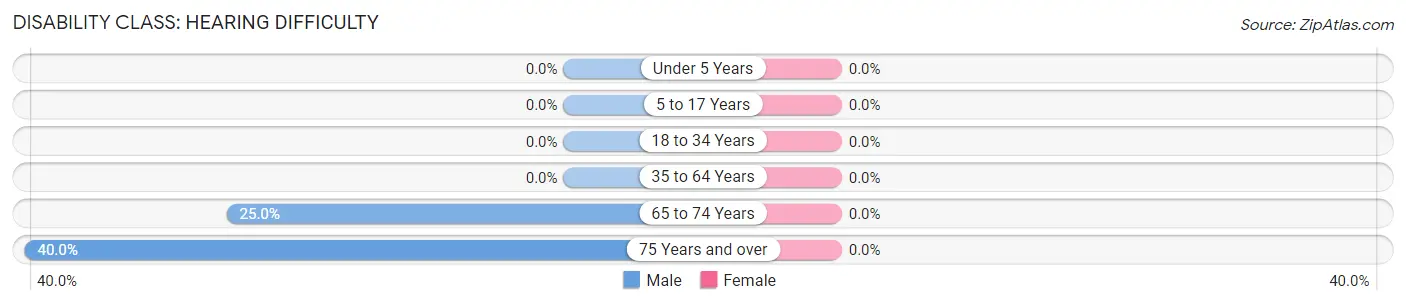
| Age Bracket | Male | Female |
| Under 5 Years | 0 (0.0%) | 0 (0.0%) |
| 5 to 17 Years | 0 (0.0%) | 0 (0.0%) |
| 18 to 34 Years | 0 (0.0%) | 0 (0.0%) |
| 35 to 64 Years | 0 (0.0%) | 0 (0.0%) |
| 65 to 74 Years | 20 (25.0%) | 0 (0.0%) |
| 75 Years and over | 28 (40.0%) | 0 (0.0%) |
Disability Class: Vision Difficulty
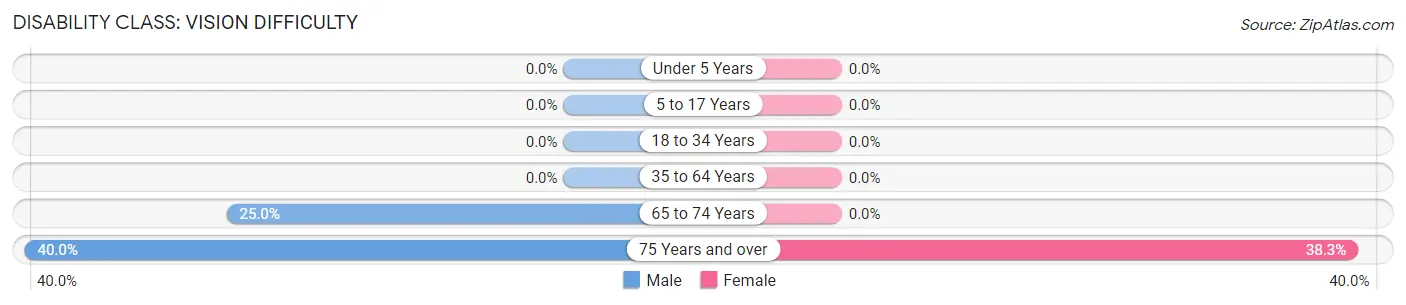
| Age Bracket | Male | Female |
| Under 5 Years | 0 (0.0%) | 0 (0.0%) |
| 5 to 17 Years | 0 (0.0%) | 0 (0.0%) |
| 18 to 34 Years | 0 (0.0%) | 0 (0.0%) |
| 35 to 64 Years | 0 (0.0%) | 0 (0.0%) |
| 65 to 74 Years | 20 (25.0%) | 0 (0.0%) |
| 75 Years and over | 28 (40.0%) | 23 (38.3%) |
Disability Class: Cognitive Difficulty
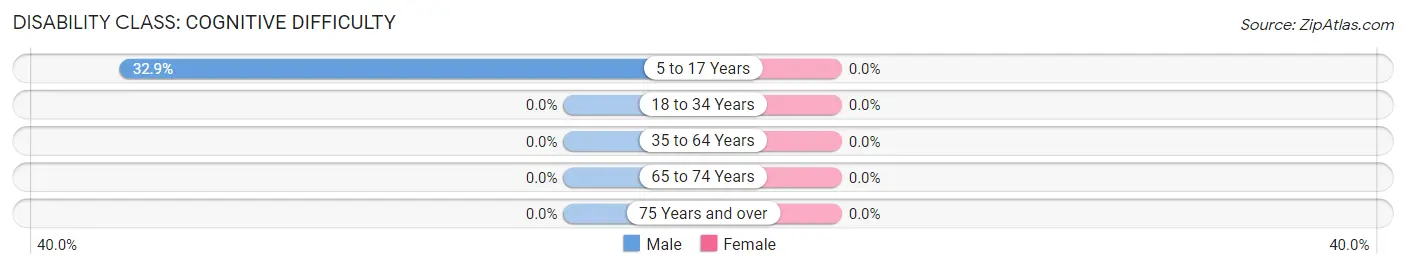
| Age Bracket | Male | Female |
| 5 to 17 Years | 110 (32.9%) | 0 (0.0%) |
| 18 to 34 Years | 0 (0.0%) | 0 (0.0%) |
| 35 to 64 Years | 0 (0.0%) | 0 (0.0%) |
| 65 to 74 Years | 0 (0.0%) | 0 (0.0%) |
| 75 Years and over | 0 (0.0%) | 0 (0.0%) |
Disability Class: Ambulatory Difficulty
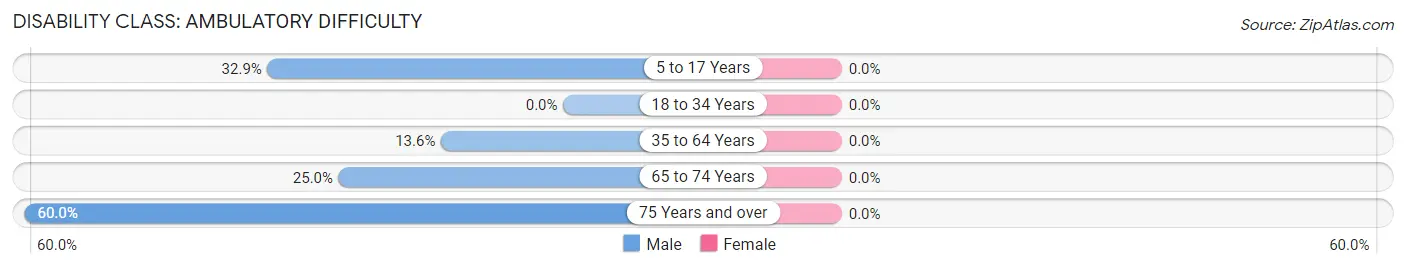
| Age Bracket | Male | Female |
| 5 to 17 Years | 110 (32.9%) | 0 (0.0%) |
| 18 to 34 Years | 0 (0.0%) | 0 (0.0%) |
| 35 to 64 Years | 45 (13.6%) | 0 (0.0%) |
| 65 to 74 Years | 20 (25.0%) | 0 (0.0%) |
| 75 Years and over | 42 (60.0%) | 0 (0.0%) |
Disability Class: Self-Care Difficulty
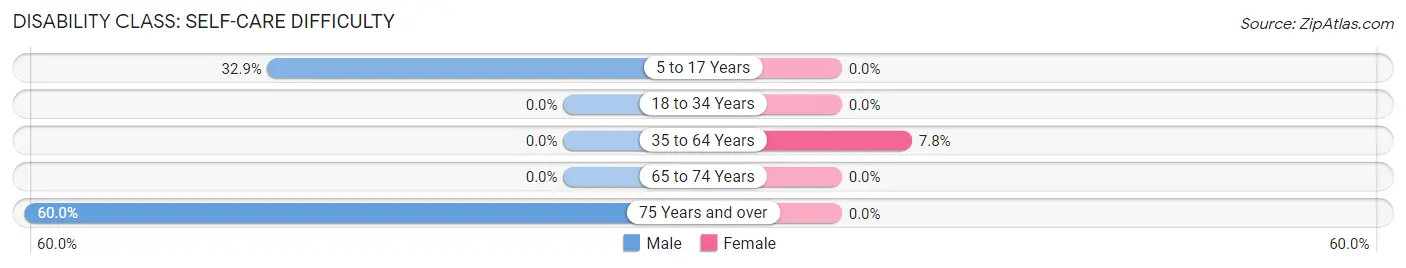
| Age Bracket | Male | Female |
| 5 to 17 Years | 110 (32.9%) | 0 (0.0%) |
| 18 to 34 Years | 0 (0.0%) | 0 (0.0%) |
| 35 to 64 Years | 0 (0.0%) | 28 (7.8%) |
| 65 to 74 Years | 0 (0.0%) | 0 (0.0%) |
| 75 Years and over | 42 (60.0%) | 0 (0.0%) |
Technology Access in Talpa
Computing Device Access in Talpa
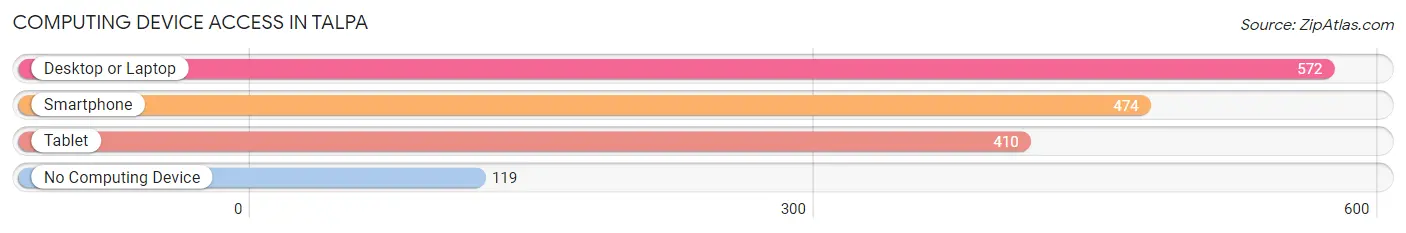
| Device Type | # Households | % Households |
| Desktop or Laptop | 572 | 77.7% |
| Smartphone | 474 | 64.4% |
| Tablet | 410 | 55.7% |
| No Computing Device | 119 | 16.2% |
| Total | 736 | 100.0% |
Internet Access in Talpa
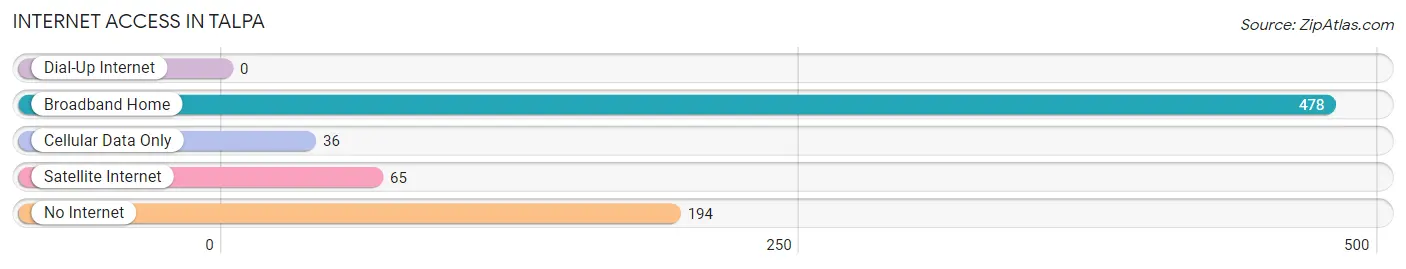
| Internet Type | # Households | % Households |
| Dial-Up Internet | 0 | 0.0% |
| Broadband Home | 478 | 64.9% |
| Cellular Data Only | 36 | 4.9% |
| Satellite Internet | 65 | 8.8% |
| No Internet | 194 | 26.4% |
| Total | 736 | 100.0% |
Talpa Summary
Talpa is a small unincorporated community located in the northern part of Taos County, New Mexico. It is situated in the Sangre de Cristo Mountains, approximately 8 miles south of the town of Taos. The area is known for its rich cultural heritage, stunning natural beauty, and unique history.
Geography
Talpa is located in the northern part of Taos County, New Mexico, in the Sangre de Cristo Mountains. The area is characterized by rolling hills, deep canyons, and lush vegetation. The Rio Grande River runs through the area, providing a source of water for the local population. The elevation of Talpa is approximately 7,000 feet above sea level.
History
The area that is now Talpa has been inhabited for centuries by the Taos Pueblo people. The first European settlers arrived in the area in the late 1700s, and the town of Talpa was established in 1845. The town was named after the nearby Talpa Creek, which was named after a local Native American chief.
Talpa was an important stop on the Santa Fe Trail, and the town grew rapidly in the late 1800s. The town was home to several businesses, including a hotel, a general store, and a post office. In the early 1900s, Talpa was a popular tourist destination, and the town was home to several resorts.
Economy
The economy of Talpa is largely based on tourism. The town is home to several resorts, restaurants, and other tourist attractions. The area is also known for its outdoor recreation opportunities, including hiking, fishing, and camping.
The town is also home to several small businesses, including a grocery store, a hardware store, and a gas station. The local economy is also supported by the nearby Taos Pueblo, which is a major employer in the area.
Demographics
As of the 2010 census, the population of Talpa was 1,072. The racial makeup of the town was 94.3% White, 0.7% African American, 0.7% Native American, 0.3% Asian, 0.1% Pacific Islander, and 3.0% from other races. The median household income was $30,000, and the median age was 44.
Conclusion
Talpa is a small unincorporated community located in the northern part of Taos County, New Mexico. The area is known for its rich cultural heritage, stunning natural beauty, and unique history. The economy of Talpa is largely based on tourism, and the town is home to several resorts, restaurants, and other tourist attractions. The population of Talpa was 1,072 as of the 2010 census, and the median household income was $30,000.
Common Questions
What is Per Capita Income in Talpa?
Per Capita income in Talpa is $25,638.
What is the Median Household income in Talpa?
Median Household Income in Talpa is $46,473.
What is Inequality or Gini Index in Talpa?
Inequality or Gini Index in Talpa is 0.38.
What is the Total Population of Talpa?
Total Population of Talpa is 1,559.
What is the Total Male Population of Talpa?
Total Male Population of Talpa is 815.
What is the Total Female Population of Talpa?
Total Female Population of Talpa is 744.
What is the Ratio of Males per 100 Females in Talpa?
There are 109.54 Males per 100 Females in Talpa.
What is the Ratio of Females per 100 Males in Talpa?
There are 91.29 Females per 100 Males in Talpa.
What is the Median Population Age in Talpa?
Median Population Age in Talpa is 47.5 Years.
What is the Average Family Size in Talpa
Average Family Size in Talpa is 3.1 People.
What is the Average Household Size in Talpa
Average Household Size in Talpa is 2.1 People.
How Large is the Labor Force in Talpa?
There are 646 People in the Labor Forcein in Talpa.
What is the Percentage of People in the Labor Force in Talpa?
51.4% of People are in the Labor Force in Talpa.