Southwest City, MO Map & Demographics
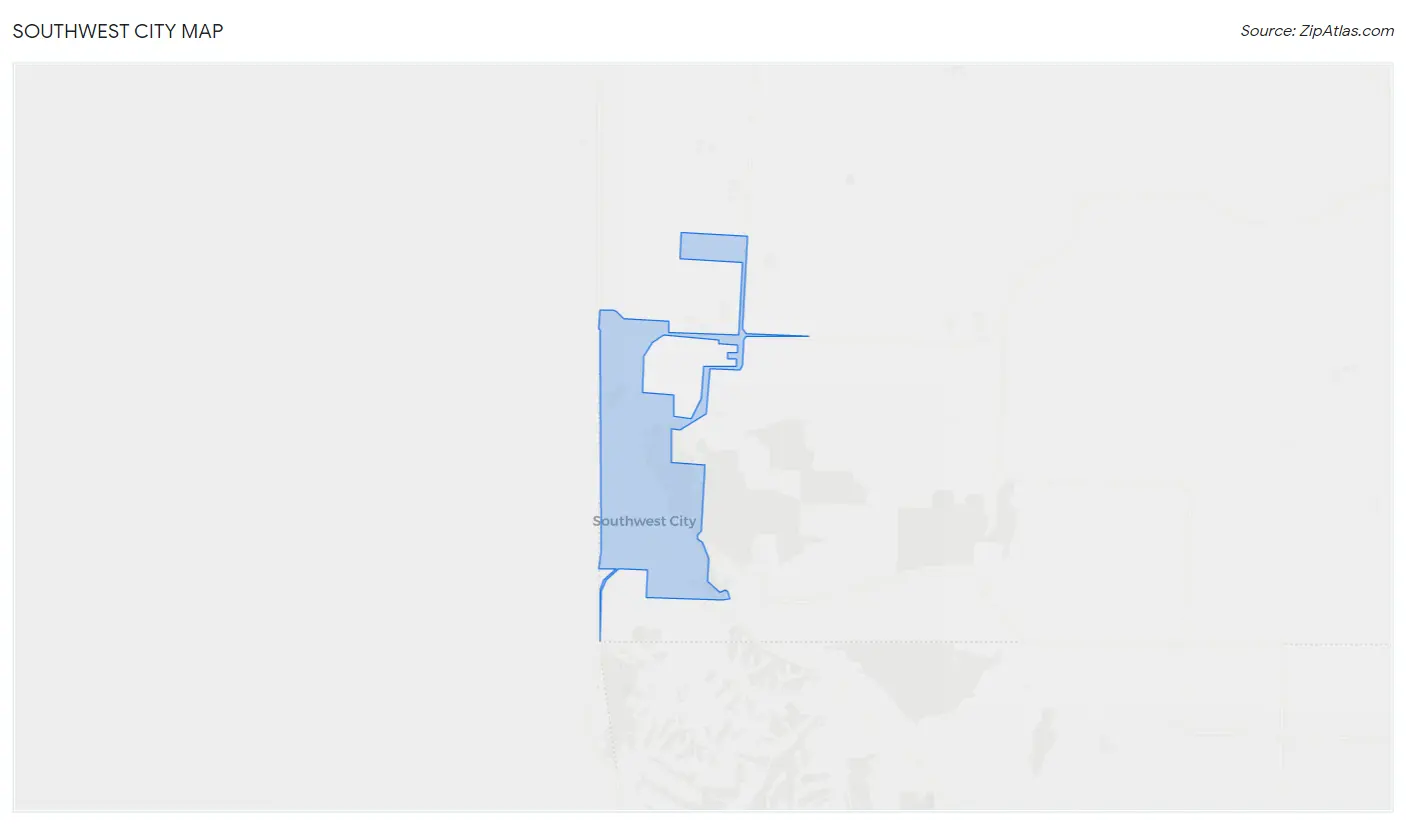
Southwest City Map
Southwest City Overview
$23,720
PER CAPITA INCOME
$68,250
AVG FAMILY INCOME
$49,375
AVG HOUSEHOLD INCOME
12.3%
WAGE / INCOME GAP [ % ]
87.7¢/ $1
WAGE / INCOME GAP [ $ ]
0.54
INEQUALITY / GINI INDEX
988
TOTAL POPULATION
480
MALE POPULATION
508
FEMALE POPULATION
94.49
MALES / 100 FEMALES
105.83
FEMALES / 100 MALES
27.1
MEDIAN AGE
4.6
AVG FAMILY SIZE
3.6
AVG HOUSEHOLD SIZE
432
LABOR FORCE [ PEOPLE ]
67.1%
PERCENT IN LABOR FORCE
3.7%
UNEMPLOYMENT RATE
Income in Southwest City
Income Overview in Southwest City
Per Capita Income in Southwest City is $23,720, while median incomes of families and households are $68,250 and $49,375 respectively.
| Characteristic | Number | Measure |
| Per Capita Income | 988 | $23,720 |
| Median Family Income | 179 | $68,250 |
| Mean Family Income | 179 | $109,326 |
| Median Household Income | 277 | $49,375 |
| Mean Household Income | 277 | $80,970 |
| Income Deficit | 179 | $0 |
| Wage / Income Gap (%) | 988 | 12.33% |
| Wage / Income Gap ($) | 988 | 87.67¢ per $1 |
| Gini / Inequality Index | 988 | 0.54 |
Earnings by Sex in Southwest City
Average Earnings in Southwest City are $33,148, $36,250 for men and $31,780 for women, a difference of 12.3%.
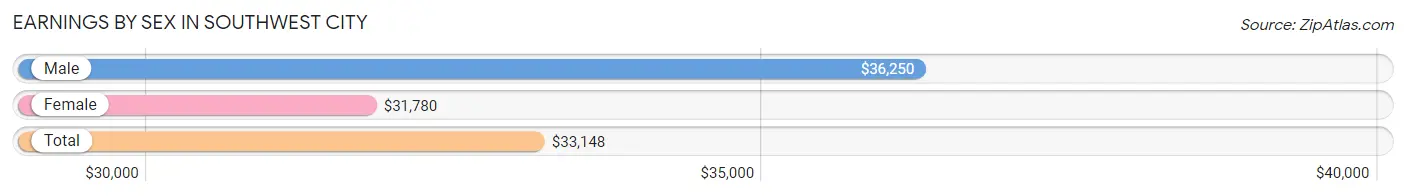
| Sex | Number | Average Earnings |
| Male | 229 (52.8%) | $36,250 |
| Female | 205 (47.2%) | $31,780 |
| Total | 434 (100.0%) | $33,148 |
Earnings by Sex by Income Bracket in Southwest City
The most common earnings brackets in Southwest City are $25,000 to $29,999 for men (51 | 22.3%) and $30,000 to $34,999 for women (56 | 27.3%).
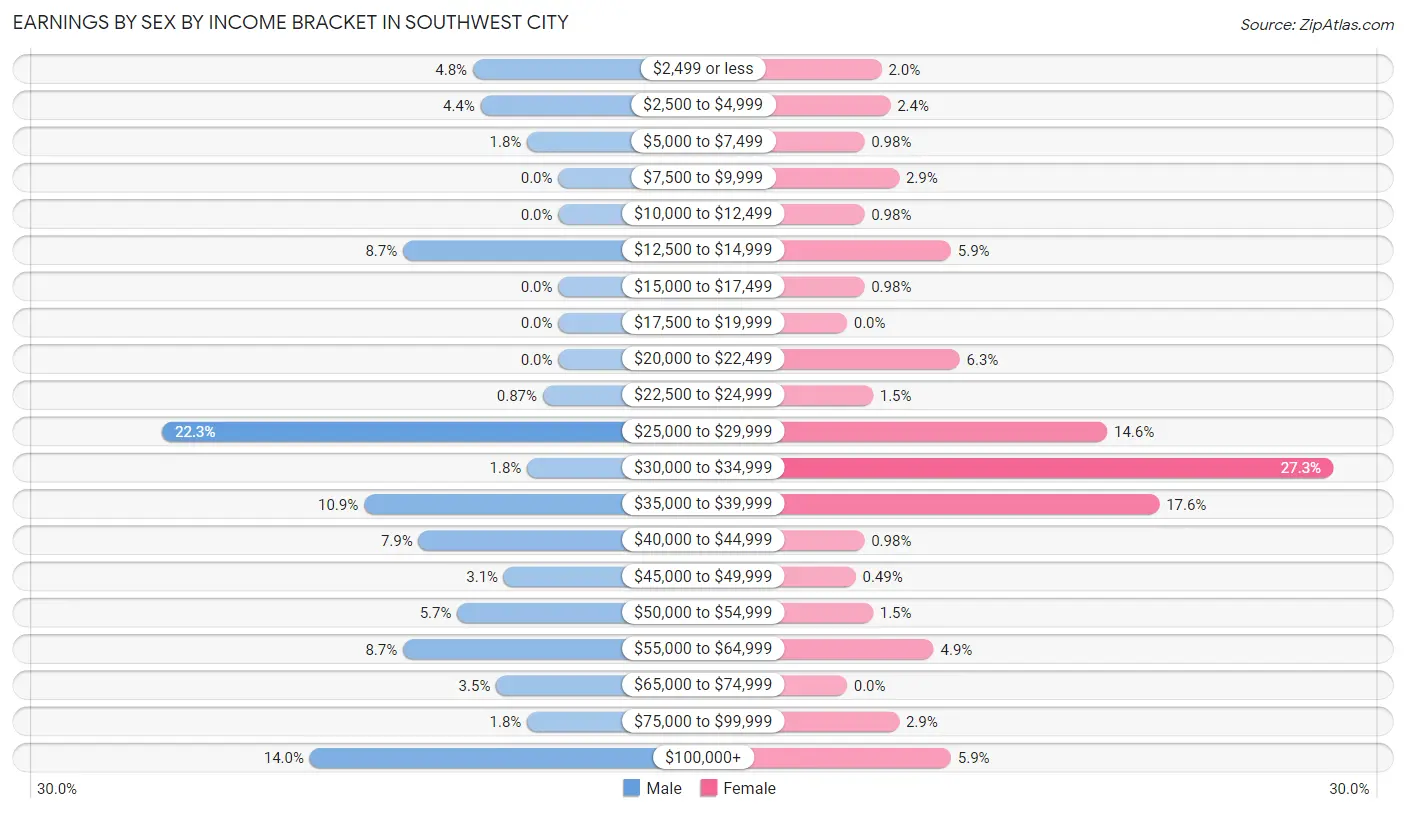
| Income | Male | Female |
| $2,499 or less | 11 (4.8%) | 4 (1.9%) |
| $2,500 to $4,999 | 10 (4.4%) | 5 (2.4%) |
| $5,000 to $7,499 | 4 (1.8%) | 2 (1.0%) |
| $7,500 to $9,999 | 0 (0.0%) | 6 (2.9%) |
| $10,000 to $12,499 | 0 (0.0%) | 2 (1.0%) |
| $12,500 to $14,999 | 20 (8.7%) | 12 (5.9%) |
| $15,000 to $17,499 | 0 (0.0%) | 2 (1.0%) |
| $17,500 to $19,999 | 0 (0.0%) | 0 (0.0%) |
| $20,000 to $22,499 | 0 (0.0%) | 13 (6.3%) |
| $22,500 to $24,999 | 2 (0.9%) | 3 (1.5%) |
| $25,000 to $29,999 | 51 (22.3%) | 30 (14.6%) |
| $30,000 to $34,999 | 4 (1.8%) | 56 (27.3%) |
| $35,000 to $39,999 | 25 (10.9%) | 36 (17.6%) |
| $40,000 to $44,999 | 18 (7.9%) | 2 (1.0%) |
| $45,000 to $49,999 | 7 (3.1%) | 1 (0.5%) |
| $50,000 to $54,999 | 13 (5.7%) | 3 (1.5%) |
| $55,000 to $64,999 | 20 (8.7%) | 10 (4.9%) |
| $65,000 to $74,999 | 8 (3.5%) | 0 (0.0%) |
| $75,000 to $99,999 | 4 (1.8%) | 6 (2.9%) |
| $100,000+ | 32 (14.0%) | 12 (5.9%) |
| Total | 229 (100.0%) | 205 (100.0%) |
Earnings by Sex by Educational Attainment in Southwest City
Average earnings in Southwest City are $40,769 for men and $31,326 for women, a difference of 23.2%. Men with an educational attainment of high school diploma enjoy the highest average annual earnings of $51,250, while those with less than high school education earn the least with $36,875. Women with an educational attainment of college or associate's degree earn the most with the average annual earnings of $35,417, while those with high school diploma education have the smallest earnings of $30,682.
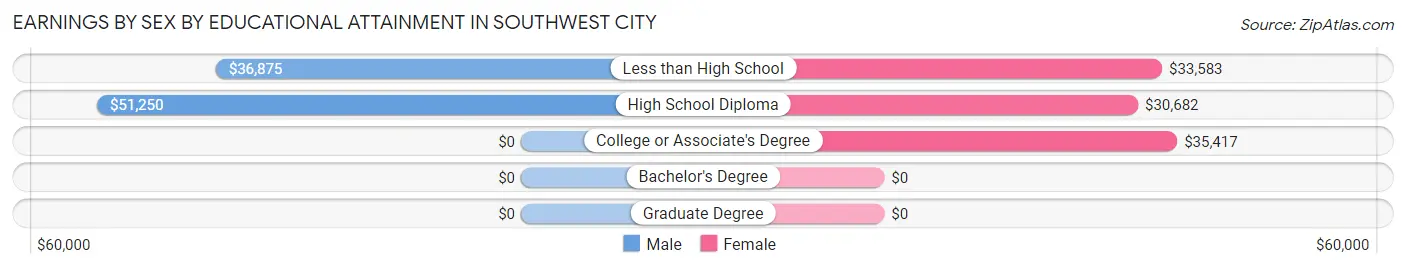
| Educational Attainment | Male Income | Female Income |
| Less than High School | $36,875 | $33,583 |
| High School Diploma | $51,250 | $30,682 |
| College or Associate's Degree | - | - |
| Bachelor's Degree | - | - |
| Graduate Degree | - | - |
| Total | $40,769 | $31,326 |
Family Income in Southwest City
Family Income Brackets in Southwest City
According to the Southwest City family income data, there are 48 families falling into the $50,000 to $74,999 income range, which is the most common income bracket and makes up 26.8% of all families.
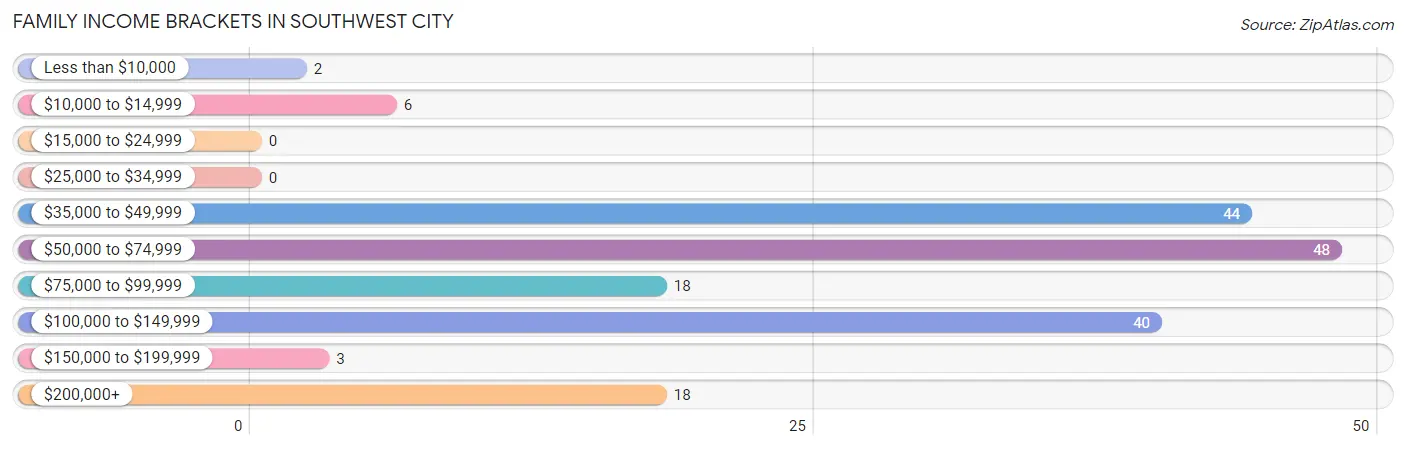
| Income Bracket | # Families | % Families |
| Less than $10,000 | 2 | 1.1% |
| $10,000 to $14,999 | 6 | 3.4% |
| $15,000 to $24,999 | 0 | 0.0% |
| $25,000 to $34,999 | 0 | 0.0% |
| $35,000 to $49,999 | 44 | 24.6% |
| $50,000 to $74,999 | 48 | 26.8% |
| $75,000 to $99,999 | 18 | 10.1% |
| $100,000 to $149,999 | 40 | 22.3% |
| $150,000 to $199,999 | 3 | 1.7% |
| $200,000+ | 18 | 10.1% |
Family Income by Famaliy Size in Southwest City
3-person families (23 | 12.9%) account for the highest median family income in Southwest City with $115,795 per family, while 3-person families (23 | 12.9%) have the highest median income of $38,598 per family member.
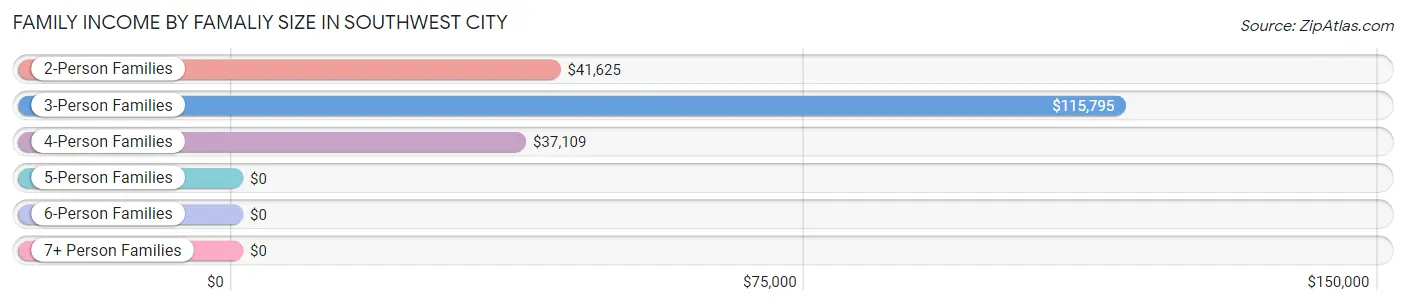
| Income Bracket | # Families | Median Income |
| 2-Person Families | 45 (25.1%) | $41,625 |
| 3-Person Families | 23 (12.9%) | $115,795 |
| 4-Person Families | 31 (17.3%) | $37,109 |
| 5-Person Families | 45 (25.1%) | $0 |
| 6-Person Families | 10 (5.6%) | $0 |
| 7+ Person Families | 25 (14.0%) | $0 |
| Total | 179 (100.0%) | $68,250 |
Family Income by Number of Earners in Southwest City
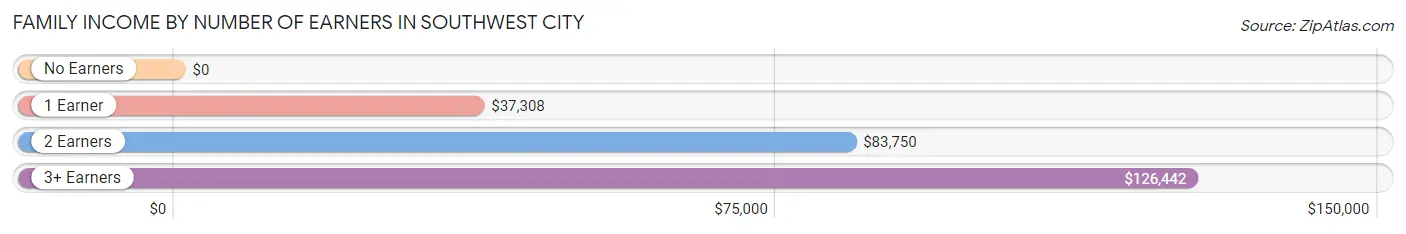
| Number of Earners | # Families | Median Income |
| No Earners | 6 (3.4%) | $0 |
| 1 Earner | 60 (33.5%) | $37,308 |
| 2 Earners | 94 (52.5%) | $83,750 |
| 3+ Earners | 19 (10.6%) | $126,442 |
| Total | 179 (100.0%) | $68,250 |
Household Income in Southwest City
Household Income Brackets in Southwest City
With 58 households falling in the category, the $35,000 to $49,999 income range is the most frequent in Southwest City, accounting for 20.9% of all households. In contrast, only 2 households (0.7%) fall into the $25,000 to $34,999 income bracket, making it the least populous group.
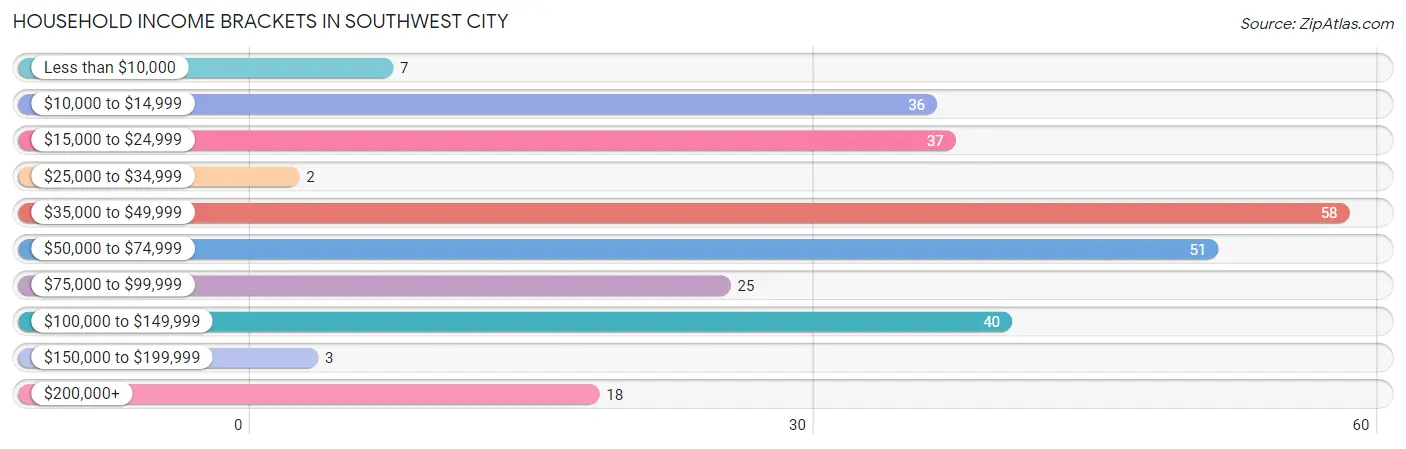
| Income Bracket | # Households | % Households |
| Less than $10,000 | 7 | 2.5% |
| $10,000 to $14,999 | 36 | 13.0% |
| $15,000 to $24,999 | 37 | 13.4% |
| $25,000 to $34,999 | 2 | 0.7% |
| $35,000 to $49,999 | 58 | 20.9% |
| $50,000 to $74,999 | 51 | 18.4% |
| $75,000 to $99,999 | 25 | 9.0% |
| $100,000 to $149,999 | 40 | 14.4% |
| $150,000 to $199,999 | 3 | 1.1% |
| $200,000+ | 18 | 6.5% |
Household Income by Householder Age in Southwest City
The median household income in Southwest City is $49,375, with the highest median household income of $63,542 found in the 25 to 44 years age bracket for the primary householder. A total of 140 households (50.5%) fall into this category. Meanwhile, the 15 to 24 years age bracket for the primary householder has the lowest median household income of $0, with 5 households (1.8%) in this group.
| Income Bracket | # Households | Median Income |
| 15 to 24 Years | 5 (1.8%) | $0 |
| 25 to 44 Years | 140 (50.5%) | $63,542 |
| 45 to 64 Years | 88 (31.8%) | $53,000 |
| 65+ Years | 44 (15.9%) | $0 |
| Total | 277 (100.0%) | $49,375 |
Poverty in Southwest City
Income Below Poverty by Sex and Age in Southwest City
With 1.0% poverty level for males and 10.6% for females among the residents of Southwest City, 45 to 54 year old males and 75 year old and over females are the most vulnerable to poverty, with 2 males (5.6%) and 12 females (38.7%) in their respective age groups living below the poverty level.
| Age Bracket | Male | Female |
| Under 5 Years | 2 (2.0%) | 0 (0.0%) |
| 5 Years | 0 (0.0%) | 0 (0.0%) |
| 6 to 11 Years | 1 (3.1%) | 1 (1.6%) |
| 12 to 14 Years | 0 (0.0%) | 0 (0.0%) |
| 15 Years | 0 (0.0%) | 0 (0.0%) |
| 16 and 17 Years | 0 (0.0%) | 0 (0.0%) |
| 18 to 24 Years | 0 (0.0%) | 3 (8.8%) |
| 25 to 34 Years | 0 (0.0%) | 10 (13.5%) |
| 35 to 44 Years | 0 (0.0%) | 17 (17.9%) |
| 45 to 54 Years | 2 (5.6%) | 0 (0.0%) |
| 55 to 64 Years | 0 (0.0%) | 11 (31.4%) |
| 65 to 74 Years | 0 (0.0%) | 0 (0.0%) |
| 75 Years and over | 0 (0.0%) | 12 (38.7%) |
| Total | 5 (1.0%) | 54 (10.6%) |
Income Above Poverty by Sex and Age in Southwest City
According to the poverty statistics in Southwest City, males aged 5 years and females aged under 5 years are the age groups that are most secure financially, with 100.0% of males and 100.0% of females in these age groups living above the poverty line.
| Age Bracket | Male | Female |
| Under 5 Years | 99 (98.0%) | 47 (100.0%) |
| 5 Years | 12 (100.0%) | 0 (0.0%) |
| 6 to 11 Years | 31 (96.9%) | 61 (98.4%) |
| 12 to 14 Years | 35 (100.0%) | 39 (100.0%) |
| 15 Years | 0 (0.0%) | 16 (100.0%) |
| 16 and 17 Years | 68 (100.0%) | 0 (0.0%) |
| 18 to 24 Years | 23 (100.0%) | 31 (91.2%) |
| 25 to 34 Years | 67 (100.0%) | 64 (86.5%) |
| 35 to 44 Years | 75 (100.0%) | 78 (82.1%) |
| 45 to 54 Years | 34 (94.4%) | 58 (100.0%) |
| 55 to 64 Years | 22 (100.0%) | 24 (68.6%) |
| 65 to 74 Years | 5 (100.0%) | 17 (100.0%) |
| 75 Years and over | 4 (100.0%) | 19 (61.3%) |
| Total | 475 (99.0%) | 454 (89.4%) |
Income Below Poverty Among Married-Couple Families in Southwest City
| Children | Above Poverty | Below Poverty |
| No Children | 31 (100.0%) | 0 (0.0%) |
| 1 or 2 Children | 41 (100.0%) | 0 (0.0%) |
| 3 or 4 Children | 54 (100.0%) | 0 (0.0%) |
| 5 or more Children | 12 (100.0%) | 0 (0.0%) |
| Total | 138 (100.0%) | 0 (0.0%) |
Income Below Poverty Among Single-Parent Households in Southwest City
| Children | Single Father | Single Mother |
| No Children | 0 (0.0%) | 0 (0.0%) |
| 1 or 2 Children | 0 (0.0%) | 8 (53.3%) |
| 3 or 4 Children | 0 (0.0%) | 0 (0.0%) |
| 5 or more Children | 0 (0.0%) | 0 (0.0%) |
| Total | 0 (0.0%) | 8 (32.0%) |
Income Below Poverty Among Married-Couple vs Single-Parent Households in Southwest City
| Children | Married-Couple Families | Single-Parent Households |
| No Children | 0 (0.0%) | 0 (0.0%) |
| 1 or 2 Children | 0 (0.0%) | 8 (30.8%) |
| 3 or 4 Children | 0 (0.0%) | 0 (0.0%) |
| 5 or more Children | 0 (0.0%) | 0 (0.0%) |
| Total | 0 (0.0%) | 8 (19.5%) |
Race in Southwest City
The most populous races in Southwest City are Hispanic or Latino (670 | 67.8%), White / Caucasian (475 | 48.1%), and Two or more Races (239 | 24.2%).
| Race | # Population | % Population |
| Asian | 0 | 0.0% |
| Black / African American | 0 | 0.0% |
| Hawaiian / Pacific | 0 | 0.0% |
| Hispanic or Latino | 670 | 67.8% |
| Native / Alaskan | 40 | 4.1% |
| White / Caucasian | 475 | 48.1% |
| Two or more Races | 239 | 24.2% |
| Some other Race | 234 | 23.7% |
| Total | 988 | 100.0% |
Ancestry in Southwest City
The most populous ancestries reported in Southwest City are Mexican (476 | 48.2%), Central American (183 | 18.5%), Guatemalan (123 | 12.4%), Honduran (60 | 6.1%), and German (32 | 3.2%), together accounting for 88.5% of all Southwest City residents.
| Ancestry | # Population | % Population |
| American | 14 | 1.4% |
| Bolivian | 2 | 0.2% |
| Central American | 183 | 18.5% |
| Central American Indian | 11 | 1.1% |
| Cherokee | 29 | 2.9% |
| Dutch | 4 | 0.4% |
| Dutch West Indian | 9 | 0.9% |
| English | 22 | 2.2% |
| European | 3 | 0.3% |
| French | 3 | 0.3% |
| German | 32 | 3.2% |
| Guatemalan | 123 | 12.4% |
| Honduran | 60 | 6.1% |
| Irish | 23 | 2.3% |
| Mexican | 476 | 48.2% |
| Osage | 3 | 0.3% |
| South American | 2 | 0.2% |
| Swedish | 2 | 0.2% | View All 18 Rows |
Immigrants in Southwest City
The most numerous immigrant groups reported in Southwest City came from Central America (271 | 27.4%), Latin America (271 | 27.4%), Mexico (170 | 17.2%), Guatemala (69 | 7.0%), and Honduras (32 | 3.2%), together accounting for 82.3% of all Southwest City residents.
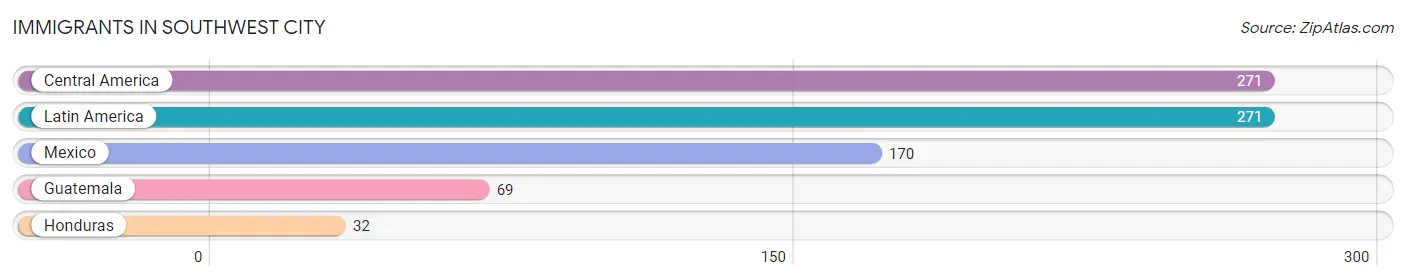
| Immigration Origin | # Population | % Population |
| Central America | 271 | 27.4% |
| Guatemala | 69 | 7.0% |
| Honduras | 32 | 3.2% |
| Latin America | 271 | 27.4% |
| Mexico | 170 | 17.2% | View All 5 Rows |
Sex and Age in Southwest City
Sex and Age in Southwest City
The most populous age groups in Southwest City are Under 5 Years (101 | 21.0%) for men and 40 to 44 Years (82 | 16.1%) for women.
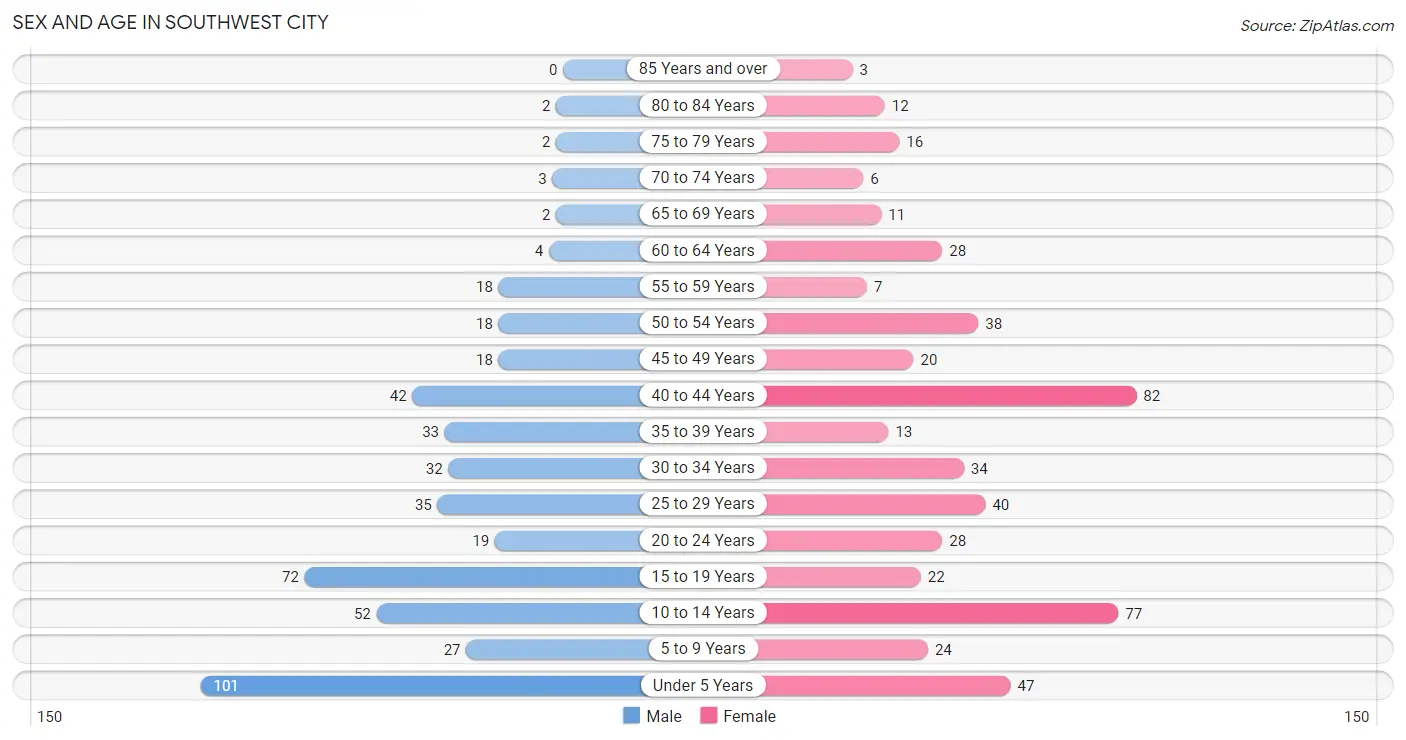
| Age Bracket | Male | Female |
| Under 5 Years | 101 (21.0%) | 47 (9.2%) |
| 5 to 9 Years | 27 (5.6%) | 24 (4.7%) |
| 10 to 14 Years | 52 (10.8%) | 77 (15.2%) |
| 15 to 19 Years | 72 (15.0%) | 22 (4.3%) |
| 20 to 24 Years | 19 (4.0%) | 28 (5.5%) |
| 25 to 29 Years | 35 (7.3%) | 40 (7.9%) |
| 30 to 34 Years | 32 (6.7%) | 34 (6.7%) |
| 35 to 39 Years | 33 (6.9%) | 13 (2.6%) |
| 40 to 44 Years | 42 (8.7%) | 82 (16.1%) |
| 45 to 49 Years | 18 (3.7%) | 20 (3.9%) |
| 50 to 54 Years | 18 (3.7%) | 38 (7.5%) |
| 55 to 59 Years | 18 (3.7%) | 7 (1.4%) |
| 60 to 64 Years | 4 (0.8%) | 28 (5.5%) |
| 65 to 69 Years | 2 (0.4%) | 11 (2.2%) |
| 70 to 74 Years | 3 (0.6%) | 6 (1.2%) |
| 75 to 79 Years | 2 (0.4%) | 16 (3.2%) |
| 80 to 84 Years | 2 (0.4%) | 12 (2.4%) |
| 85 Years and over | 0 (0.0%) | 3 (0.6%) |
| Total | 480 (100.0%) | 508 (100.0%) |
Families and Households in Southwest City
Median Family Size in Southwest City
The median family size in Southwest City is 4.61 persons per family, with married-couple families (138 | 77.1%) accounting for the largest median family size of 5.05 persons per family. On the other hand, single female/mother families (25 | 14.0%) represent the smallest median family size with 2.96 persons per family.
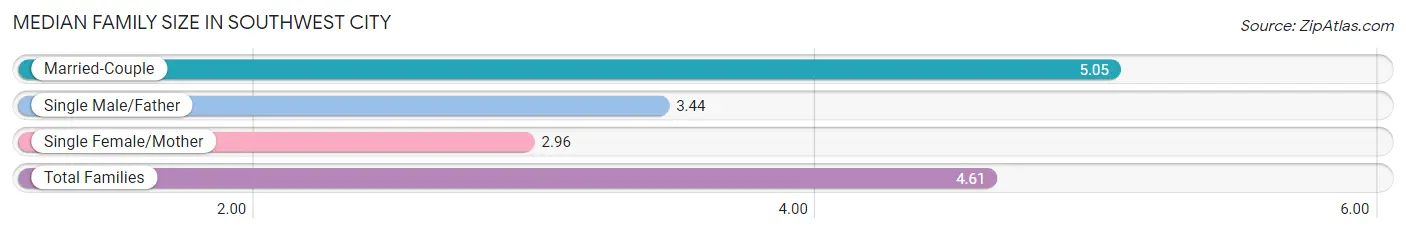
| Family Type | # Families | Family Size |
| Married-Couple | 138 (77.1%) | 5.05 |
| Single Male/Father | 16 (8.9%) | 3.44 |
| Single Female/Mother | 25 (14.0%) | 2.96 |
| Total Families | 179 (100.0%) | 4.61 |
Median Household Size in Southwest City
The median household size in Southwest City is 3.57 persons per household, with single male/father households (16 | 5.8%) accounting for the largest median household size of 5.63 persons per household. non-family households (98 | 35.4%) represent the smallest median household size with 1.19 persons per household.
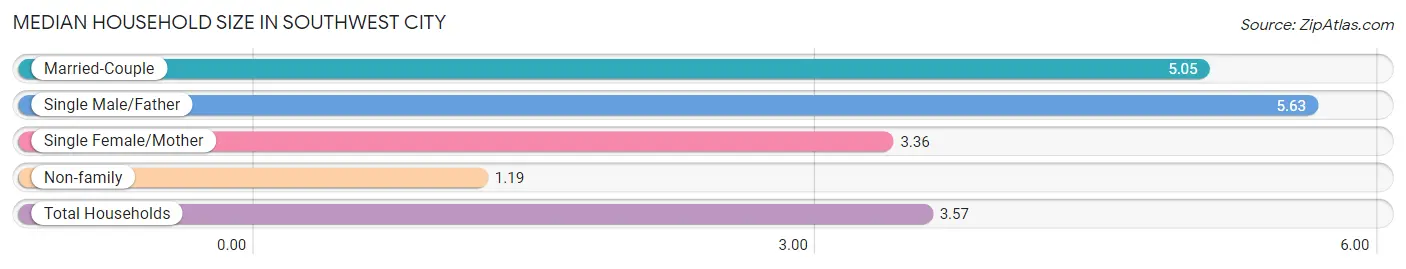
| Household Type | # Households | Household Size |
| Married-Couple | 138 (49.8%) | 5.05 |
| Single Male/Father | 16 (5.8%) | 5.63 |
| Single Female/Mother | 25 (9.0%) | 3.36 |
| Non-family | 98 (35.4%) | 1.19 |
| Total Households | 277 (100.0%) | 3.57 |
Household Size by Marriage Status in Southwest City
Out of a total of 277 households in Southwest City, 179 (64.6%) are family households, while 98 (35.4%) are nonfamily households. The most numerous type of family households are 5-person households, comprising 46, and the most common type of nonfamily households are 1-person households, comprising 81.
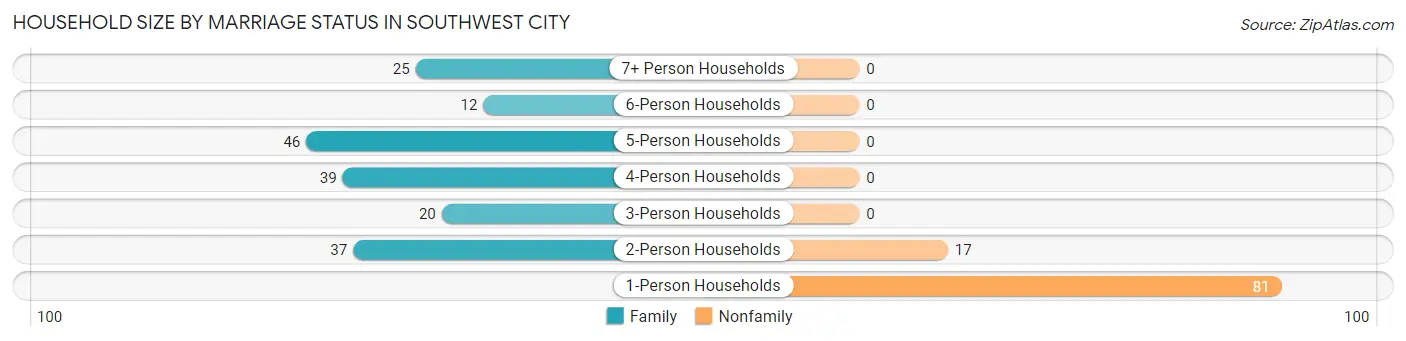
| Household Size | Family Households | Nonfamily Households |
| 1-Person Households | - | 81 (29.2%) |
| 2-Person Households | 37 (13.4%) | 17 (6.1%) |
| 3-Person Households | 20 (7.2%) | 0 (0.0%) |
| 4-Person Households | 39 (14.1%) | 0 (0.0%) |
| 5-Person Households | 46 (16.6%) | 0 (0.0%) |
| 6-Person Households | 12 (4.3%) | 0 (0.0%) |
| 7+ Person Households | 25 (9.0%) | 0 (0.0%) |
| Total | 179 (64.6%) | 98 (35.4%) |
Female Fertility in Southwest City
Fertility by Age in Southwest City
Average fertility rate in Southwest City is 23.0 births per 1,000 women. Women in the age bracket of 35 to 50 years have the highest fertility rate with 45.0 births per 1,000 women. Women in the age bracket of 35 to 50 years acount for 100.0% of all women with births.
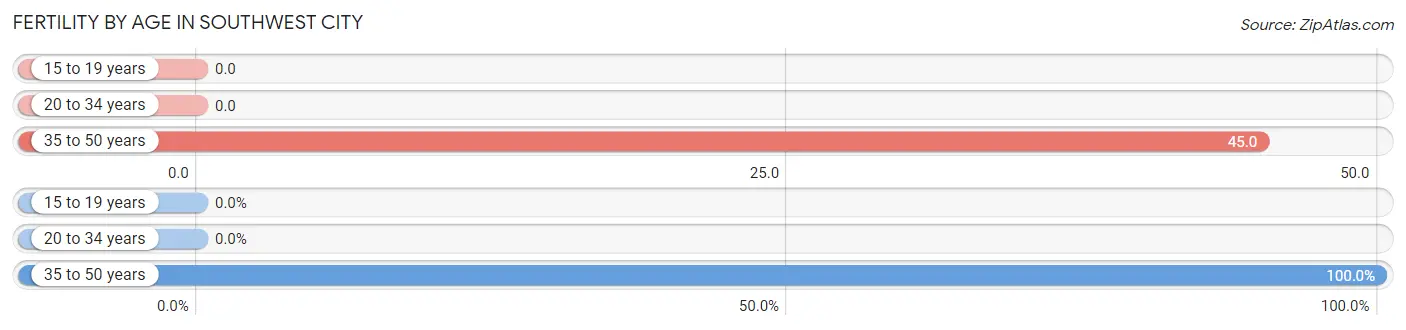
| Age Bracket | Women with Births | Births / 1,000 Women |
| 15 to 19 years | 0 (0.0%) | 0.0 |
| 20 to 34 years | 0 (0.0%) | 0.0 |
| 35 to 50 years | 6 (100.0%) | 45.0 |
| Total | 6 (100.0%) | 23.0 |
Fertility by Age by Marriage Status in Southwest City
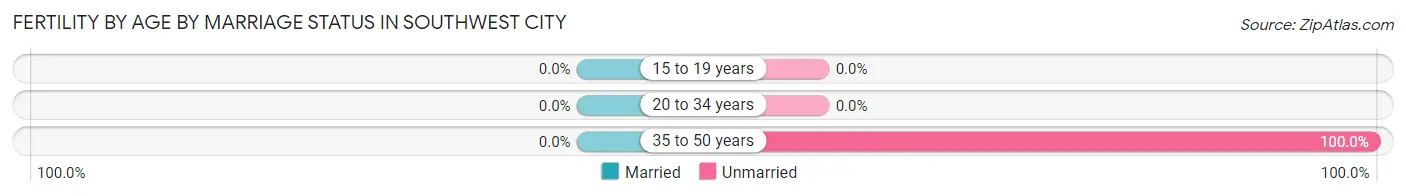
| Age Bracket | Married | Unmarried |
| 15 to 19 years | 0 (0.0%) | 0 (0.0%) |
| 20 to 34 years | 0 (0.0%) | 0 (0.0%) |
| 35 to 50 years | 0 (0.0%) | 6 (100.0%) |
| Total | 0 (0.0%) | 6 (100.0%) |
Fertility by Education in Southwest City
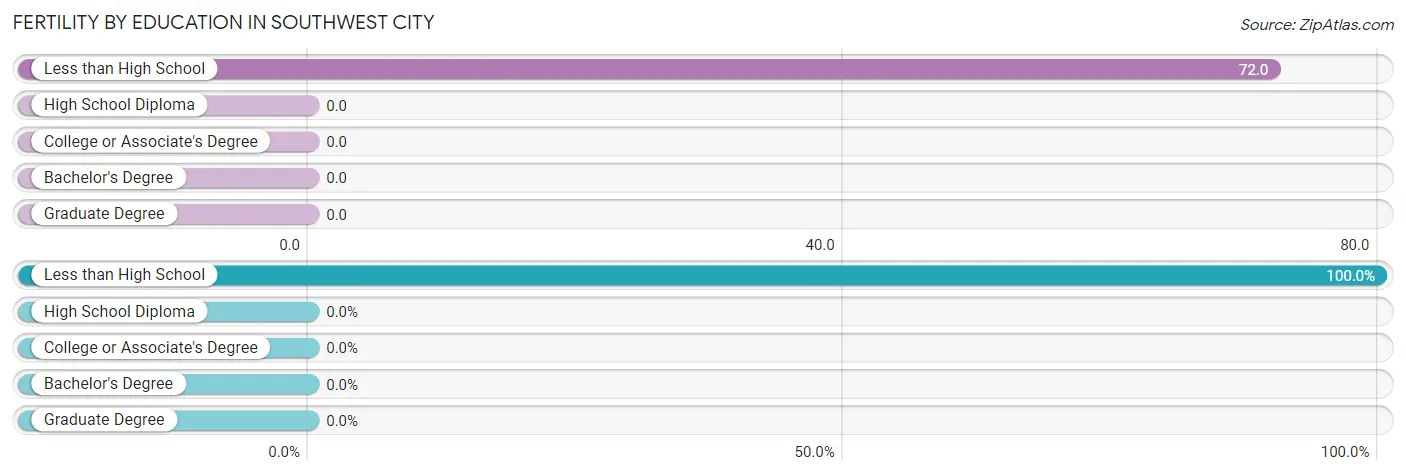
| Educational Attainment | Women with Births | Births / 1,000 Women |
| Less than High School | 6 (100.0%) | 72.0 |
| High School Diploma | 0 (0.0%) | 0.0 |
| College or Associate's Degree | 0 (0.0%) | 0.0 |
| Bachelor's Degree | 0 (0.0%) | 0.0 |
| Graduate Degree | 0 (0.0%) | 0.0 |
| Total | 6 (100.0%) | 23.0 |
Fertility by Education by Marriage Status in Southwest City
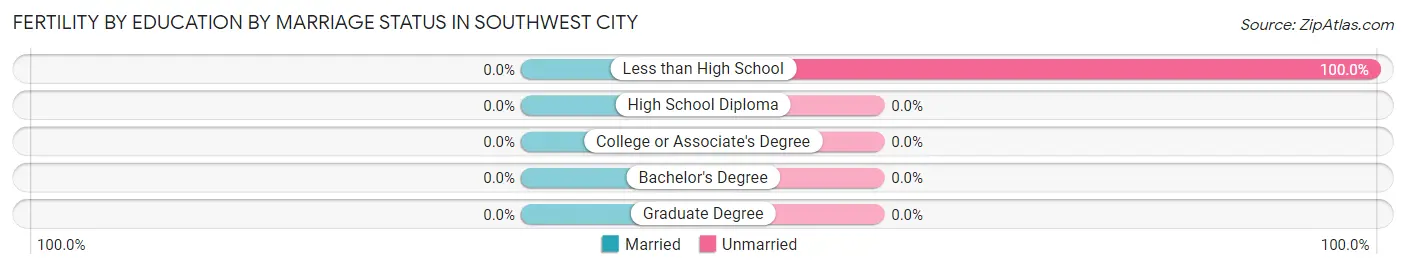
| Educational Attainment | Married | Unmarried |
| Less than High School | 0 (0.0%) | 6 (100.0%) |
| High School Diploma | 0 (0.0%) | 0 (0.0%) |
| College or Associate's Degree | 0 (0.0%) | 0 (0.0%) |
| Bachelor's Degree | 0 (0.0%) | 0 (0.0%) |
| Graduate Degree | 0 (0.0%) | 0 (0.0%) |
| Total | 0 (0.0%) | 6 (100.0%) |
Employment Characteristics in Southwest City
Employment by Class of Employer in Southwest City
Among the 416 employed individuals in Southwest City, private company employees (338 | 81.2%), not-for-profit organizations (33 | 7.9%), and self-employed (not incorporated) (18 | 4.3%) make up the most common classes of employment.
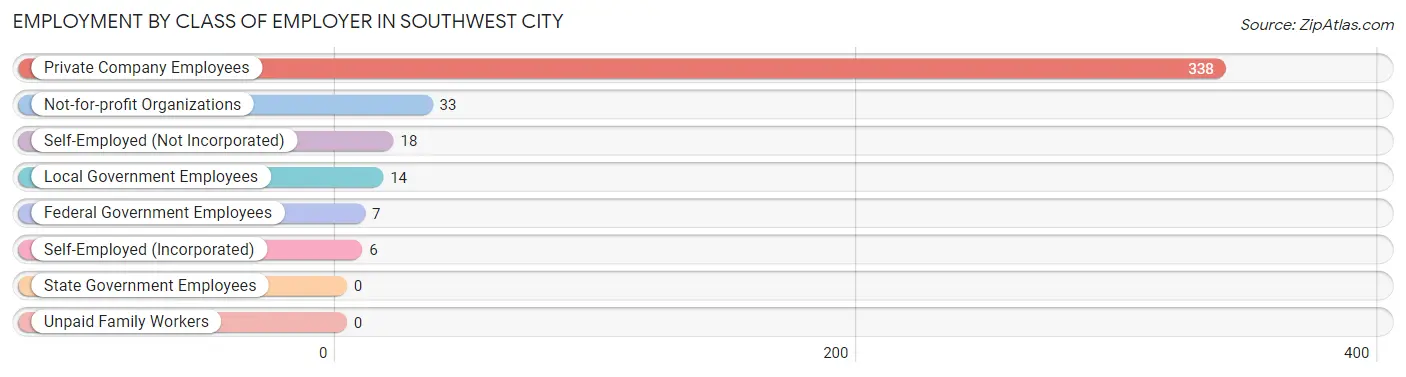
| Employer Class | # Employees | % Employees |
| Private Company Employees | 338 | 81.2% |
| Self-Employed (Incorporated) | 6 | 1.4% |
| Self-Employed (Not Incorporated) | 18 | 4.3% |
| Not-for-profit Organizations | 33 | 7.9% |
| Local Government Employees | 14 | 3.4% |
| State Government Employees | 0 | 0.0% |
| Federal Government Employees | 7 | 1.7% |
| Unpaid Family Workers | 0 | 0.0% |
| Total | 416 | 100.0% |
Employment Status by Age in Southwest City
According to the labor force statistics for Southwest City, out of the total population over 16 years of age (644), 67.1% or 432 individuals are in the labor force, with 3.7% or 16 of them unemployed. The age group with the highest labor force participation rate is 25 to 29 years, with 94.7% or 71 individuals in the labor force. Within the labor force, the 60 to 64 years age range has the highest percentage of unemployed individuals, with 50.0% or 6 of them being unemployed.
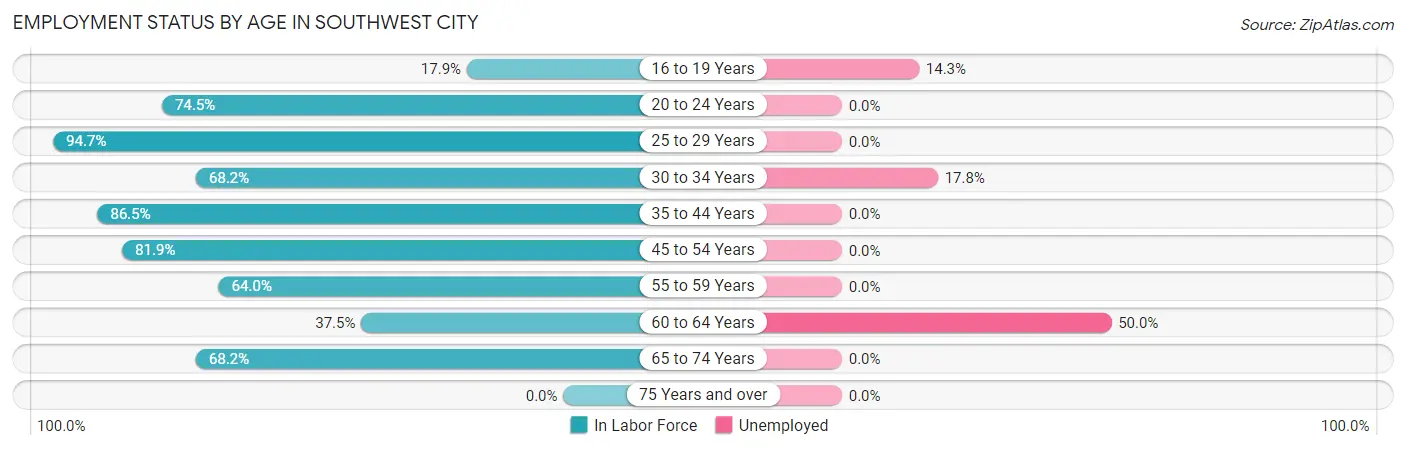
| Age Bracket | In Labor Force | Unemployed |
| 16 to 19 Years | 14 (17.9%) | 2 (14.3%) |
| 20 to 24 Years | 35 (74.5%) | 0 (0.0%) |
| 25 to 29 Years | 71 (94.7%) | 0 (0.0%) |
| 30 to 34 Years | 45 (68.2%) | 8 (17.8%) |
| 35 to 44 Years | 147 (86.5%) | 0 (0.0%) |
| 45 to 54 Years | 77 (81.9%) | 0 (0.0%) |
| 55 to 59 Years | 16 (64.0%) | 0 (0.0%) |
| 60 to 64 Years | 12 (37.5%) | 6 (50.0%) |
| 65 to 74 Years | 15 (68.2%) | 0 (0.0%) |
| 75 Years and over | 0 (0.0%) | 0 (0.0%) |
| Total | 432 (67.1%) | 16 (3.7%) |
Employment Status by Educational Attainment in Southwest City
According to labor force statistics for Southwest City, 79.7% of individuals (368) out of the total population between 25 and 64 years of age (462) are in the labor force, with 3.8% or 14 of them being unemployed. The group with the highest labor force participation rate are those with the educational attainment of bachelor's degree or higher, with 100.0% or 17 individuals in the labor force. Within the labor force, individuals with bachelor's degree or higher education have the highest percentage of unemployment, with 35.3% or 6 of them being unemployed.
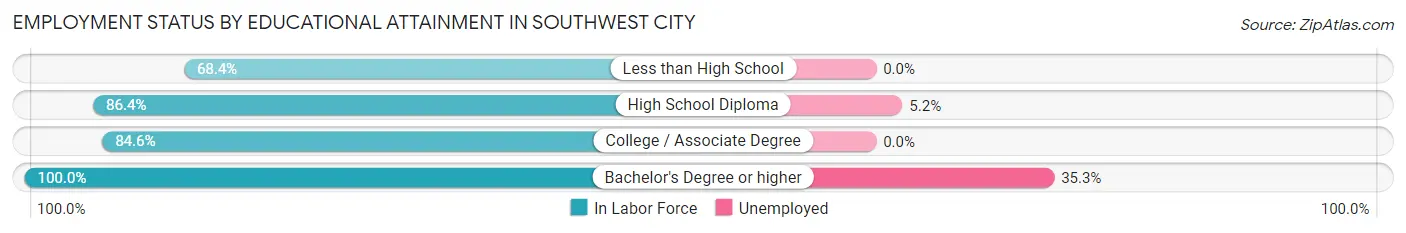
| Educational Attainment | In Labor Force | Unemployed |
| Less than High School | 121 (68.4%) | 0 (0.0%) |
| High School Diploma | 153 (86.4%) | 9 (5.2%) |
| College / Associate Degree | 77 (84.6%) | 0 (0.0%) |
| Bachelor's Degree or higher | 17 (100.0%) | 6 (35.3%) |
| Total | 368 (79.7%) | 18 (3.8%) |
Employment Occupations by Sex in Southwest City
Management, Business, Science and Arts Occupations
The most common Management, Business, Science and Arts occupations in Southwest City are Management (16 | 3.8%), Community & Social Service (12 | 2.9%), Health Diagnosing & Treating (10 | 2.4%), Health Technologists (10 | 2.4%), and Business & Financial (9 | 2.2%).
Management, Business, Science and Arts Occupations by Sex
Within the Management, Business, Science and Arts occupations in Southwest City, the most male-oriented occupations are Management (100.0%), Business & Financial (100.0%), and Education, Arts & Media (100.0%), while the most female-oriented occupations are Computers, Engineering & Science (100.0%), Life, Physical & Social Science (100.0%), and Education Instruction & Library (100.0%).
| Occupation | Male | Female |
| Management | 16 (100.0%) | 0 (0.0%) |
| Business & Financial | 9 (100.0%) | 0 (0.0%) |
| Computers, Engineering & Science | 0 (0.0%) | 2 (100.0%) |
| Computers & Mathematics | 0 (0.0%) | 0 (0.0%) |
| Architecture & Engineering | 0 (0.0%) | 0 (0.0%) |
| Life, Physical & Social Science | 0 (0.0%) | 2 (100.0%) |
| Community & Social Service | 3 (25.0%) | 9 (75.0%) |
| Education, Arts & Media | 3 (100.0%) | 0 (0.0%) |
| Legal Services & Support | 0 (0.0%) | 0 (0.0%) |
| Education Instruction & Library | 0 (0.0%) | 8 (100.0%) |
| Arts, Media & Entertainment | 0 (0.0%) | 1 (100.0%) |
| Health Diagnosing & Treating | 0 (0.0%) | 10 (100.0%) |
| Health Technologists | 0 (0.0%) | 10 (100.0%) |
| Total (Category) | 28 (57.1%) | 21 (42.9%) |
| Total (Overall) | 221 (53.1%) | 195 (46.9%) |
Services Occupations
The most common Services occupations in Southwest City are Cleaning & Maintenance (16 | 3.8%), Food Preparation & Serving (14 | 3.4%), Healthcare Support (12 | 2.9%), Security & Protection (10 | 2.4%), and Firefighting & Prevention (10 | 2.4%).
Services Occupations by Sex
Within the Services occupations in Southwest City, the most male-oriented occupations are Security & Protection (100.0%), Firefighting & Prevention (100.0%), and Food Preparation & Serving (57.1%), while the most female-oriented occupations are Healthcare Support (66.7%), Cleaning & Maintenance (62.5%), and Food Preparation & Serving (42.9%).
| Occupation | Male | Female |
| Healthcare Support | 4 (33.3%) | 8 (66.7%) |
| Security & Protection | 10 (100.0%) | 0 (0.0%) |
| Firefighting & Prevention | 10 (100.0%) | 0 (0.0%) |
| Law Enforcement | 0 (0.0%) | 0 (0.0%) |
| Food Preparation & Serving | 8 (57.1%) | 6 (42.9%) |
| Cleaning & Maintenance | 6 (37.5%) | 10 (62.5%) |
| Personal Care & Service | 0 (0.0%) | 0 (0.0%) |
| Total (Category) | 28 (53.8%) | 24 (46.2%) |
| Total (Overall) | 221 (53.1%) | 195 (46.9%) |
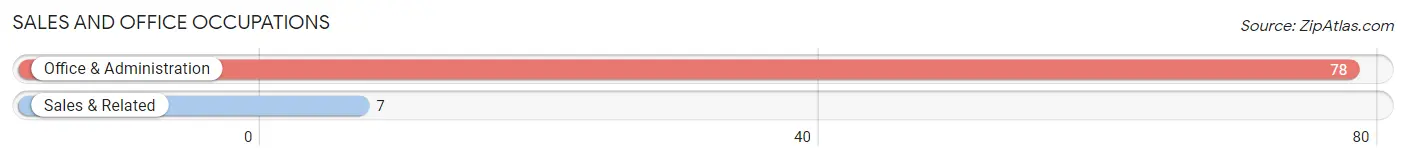
Sales and Office Occupations
The most common Sales and Office occupations in Southwest City are Office & Administration (78 | 18.8%), and Sales & Related (7 | 1.7%).
Sales and Office Occupations by Sex
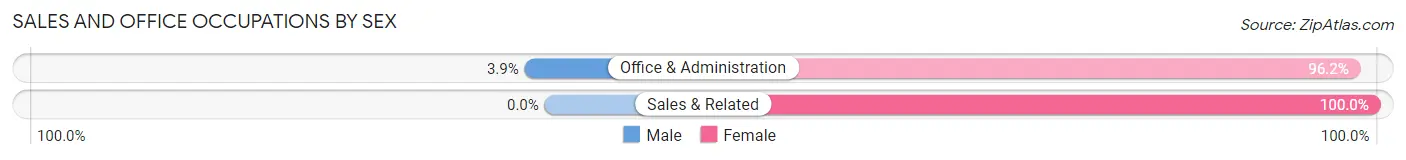
| Occupation | Male | Female |
| Sales & Related | 0 (0.0%) | 7 (100.0%) |
| Office & Administration | 3 (3.8%) | 75 (96.2%) |
| Total (Category) | 3 (3.5%) | 82 (96.5%) |
| Total (Overall) | 221 (53.1%) | 195 (46.9%) |
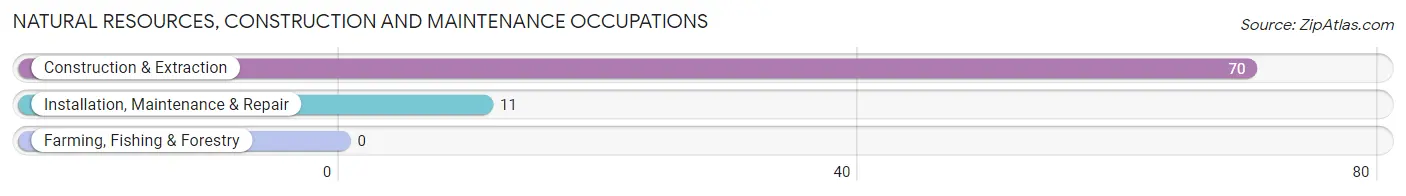
Natural Resources, Construction and Maintenance Occupations
The most common Natural Resources, Construction and Maintenance occupations in Southwest City are Construction & Extraction (70 | 16.8%), and Installation, Maintenance & Repair (11 | 2.6%).
Natural Resources, Construction and Maintenance Occupations by Sex
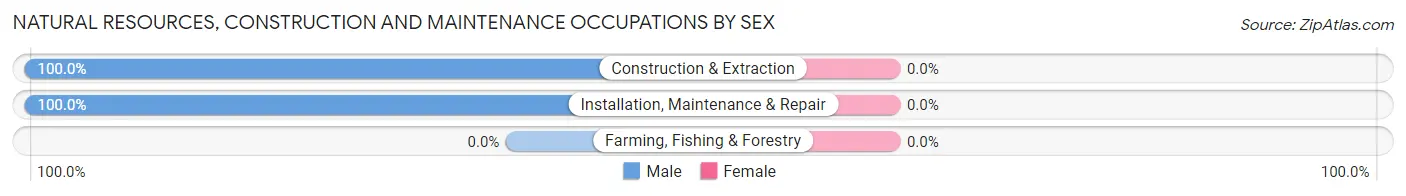
| Occupation | Male | Female |
| Farming, Fishing & Forestry | 0 (0.0%) | 0 (0.0%) |
| Construction & Extraction | 70 (100.0%) | 0 (0.0%) |
| Installation, Maintenance & Repair | 11 (100.0%) | 0 (0.0%) |
| Total (Category) | 81 (100.0%) | 0 (0.0%) |
| Total (Overall) | 221 (53.1%) | 195 (46.9%) |
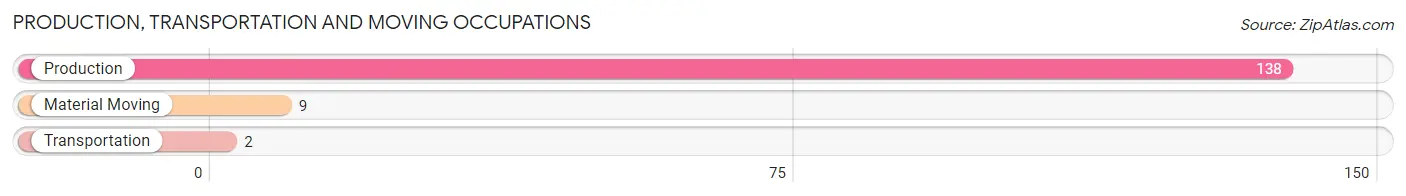
Production, Transportation and Moving Occupations
The most common Production, Transportation and Moving occupations in Southwest City are Production (138 | 33.2%), Material Moving (9 | 2.2%), and Transportation (2 | 0.5%).
Production, Transportation and Moving Occupations by Sex
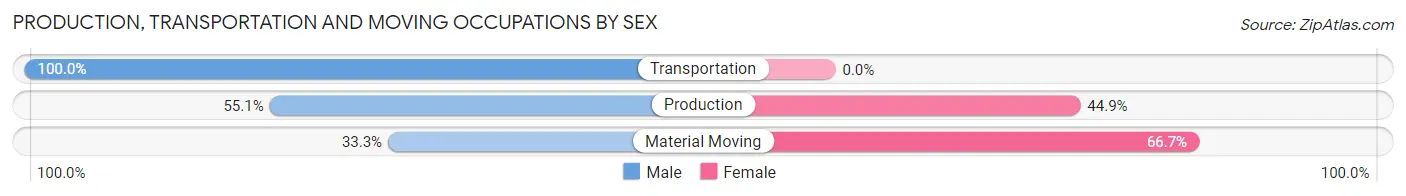
| Occupation | Male | Female |
| Production | 76 (55.1%) | 62 (44.9%) |
| Transportation | 2 (100.0%) | 0 (0.0%) |
| Material Moving | 3 (33.3%) | 6 (66.7%) |
| Total (Category) | 81 (54.4%) | 68 (45.6%) |
| Total (Overall) | 221 (53.1%) | 195 (46.9%) |
Employment Industries by Sex in Southwest City
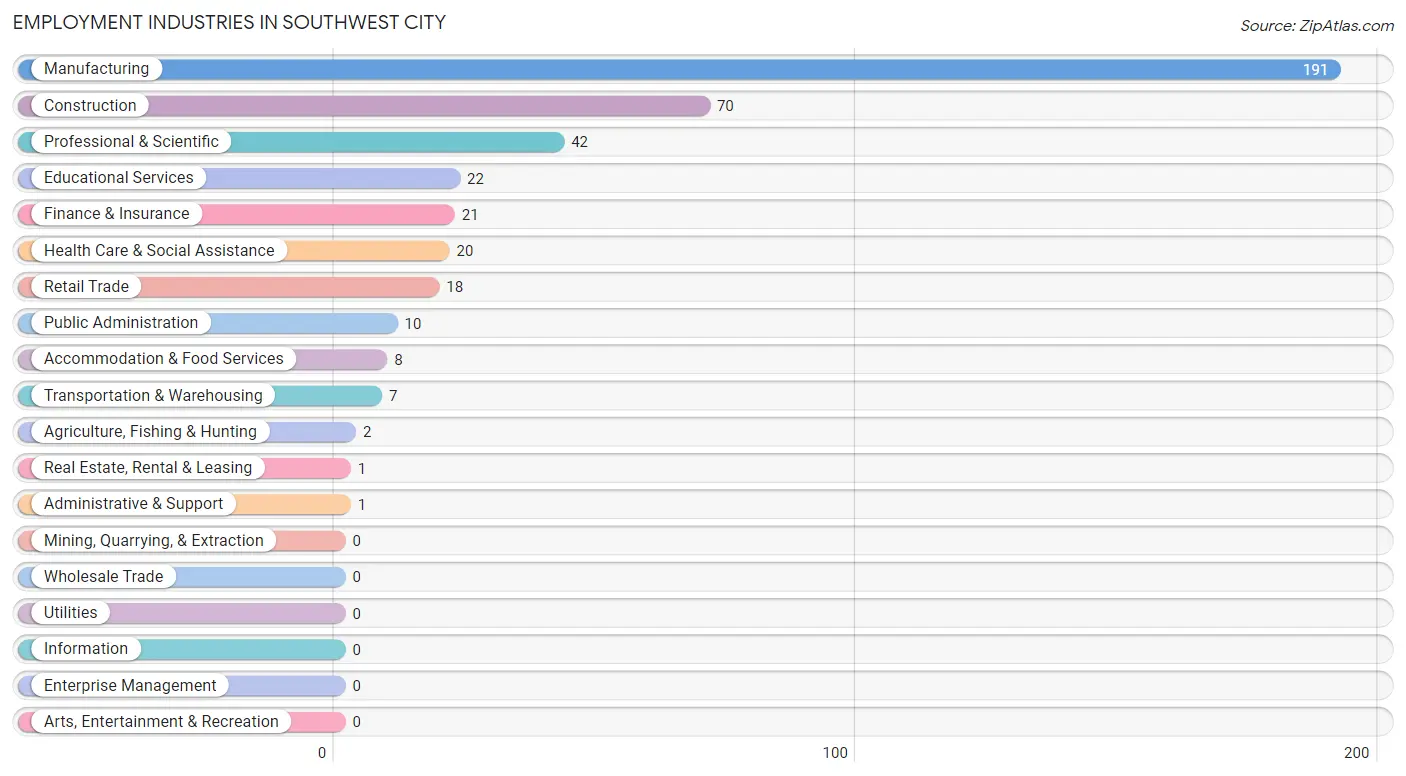
Employment Industries in Southwest City
The major employment industries in Southwest City include Manufacturing (191 | 45.9%), Construction (70 | 16.8%), Professional & Scientific (42 | 10.1%), Educational Services (22 | 5.3%), and Finance & Insurance (21 | 5.1%).
Employment Industries by Sex in Southwest City
The Southwest City industries that see more men than women are Agriculture, Fishing & Hunting (100.0%), Construction (100.0%), and Real Estate, Rental & Leasing (100.0%), whereas the industries that tend to have a higher number of women are Finance & Insurance (100.0%), Educational Services (100.0%), and Retail Trade (88.9%).
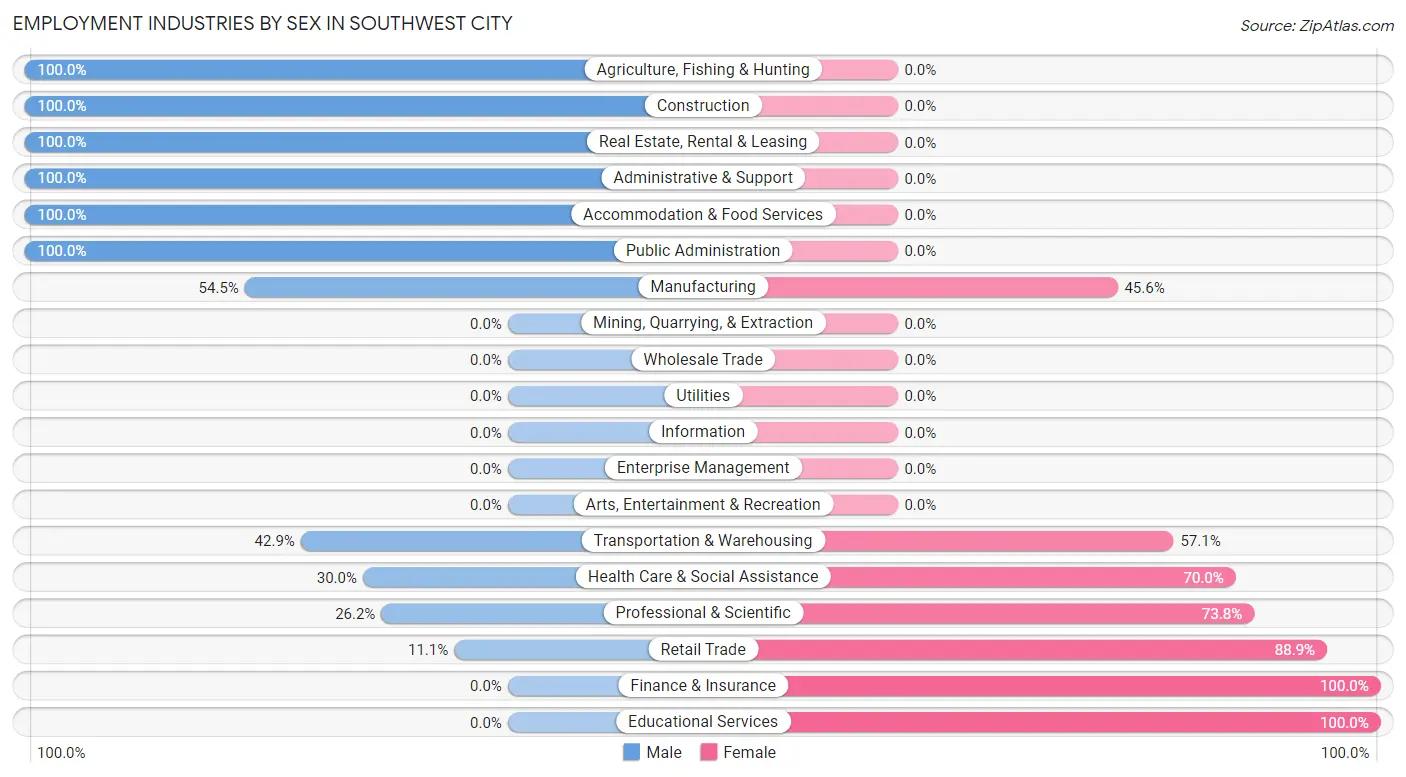
| Industry | Male | Female |
| Agriculture, Fishing & Hunting | 2 (100.0%) | 0 (0.0%) |
| Mining, Quarrying, & Extraction | 0 (0.0%) | 0 (0.0%) |
| Construction | 70 (100.0%) | 0 (0.0%) |
| Manufacturing | 104 (54.4%) | 87 (45.6%) |
| Wholesale Trade | 0 (0.0%) | 0 (0.0%) |
| Retail Trade | 2 (11.1%) | 16 (88.9%) |
| Transportation & Warehousing | 3 (42.9%) | 4 (57.1%) |
| Utilities | 0 (0.0%) | 0 (0.0%) |
| Information | 0 (0.0%) | 0 (0.0%) |
| Finance & Insurance | 0 (0.0%) | 21 (100.0%) |
| Real Estate, Rental & Leasing | 1 (100.0%) | 0 (0.0%) |
| Professional & Scientific | 11 (26.2%) | 31 (73.8%) |
| Enterprise Management | 0 (0.0%) | 0 (0.0%) |
| Administrative & Support | 1 (100.0%) | 0 (0.0%) |
| Educational Services | 0 (0.0%) | 22 (100.0%) |
| Health Care & Social Assistance | 6 (30.0%) | 14 (70.0%) |
| Arts, Entertainment & Recreation | 0 (0.0%) | 0 (0.0%) |
| Accommodation & Food Services | 8 (100.0%) | 0 (0.0%) |
| Public Administration | 10 (100.0%) | 0 (0.0%) |
| Total | 221 (53.1%) | 195 (46.9%) |
Education in Southwest City
School Enrollment in Southwest City
The most common levels of schooling among the 368 students in Southwest City are middle school (113 | 30.7%), high school (94 | 25.5%), and nursery / preschool (72 | 19.6%).
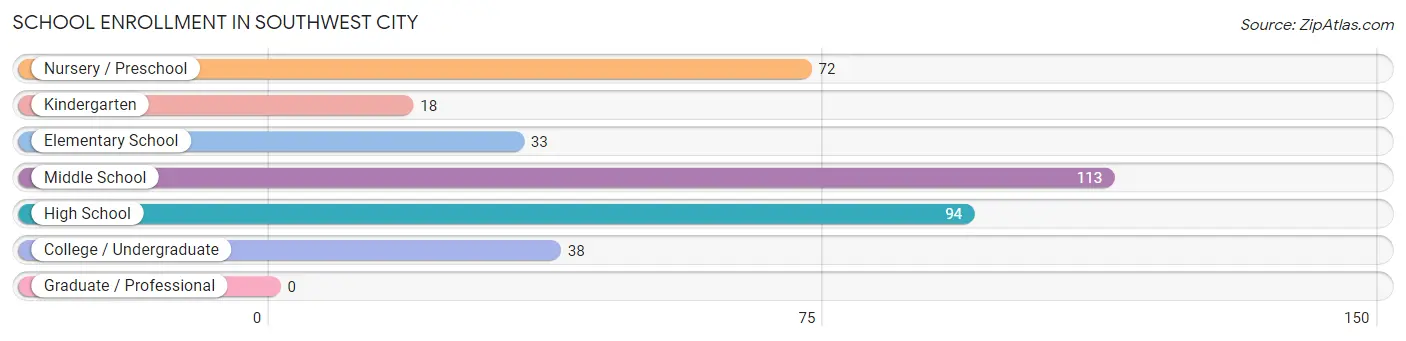
| School Level | # Students | % Students |
| Nursery / Preschool | 72 | 19.6% |
| Kindergarten | 18 | 4.9% |
| Elementary School | 33 | 9.0% |
| Middle School | 113 | 30.7% |
| High School | 94 | 25.5% |
| College / Undergraduate | 38 | 10.3% |
| Graduate / Professional | 0 | 0.0% |
| Total | 368 | 100.0% |
School Enrollment by Age by Funding Source in Southwest City
Out of a total of 368 students who are enrolled in schools in Southwest City, 9 (2.4%) attend a private institution, while the remaining 359 (97.6%) are enrolled in public schools. The age group of 15 to 17 year olds has the highest likelihood of being enrolled in private schools, with 4 (4.8% in the age bracket) enrolled. Conversely, the age group of 3 to 4 year olds has the lowest likelihood of being enrolled in a private school, with 64 (100.0% in the age bracket) attending a public institution.
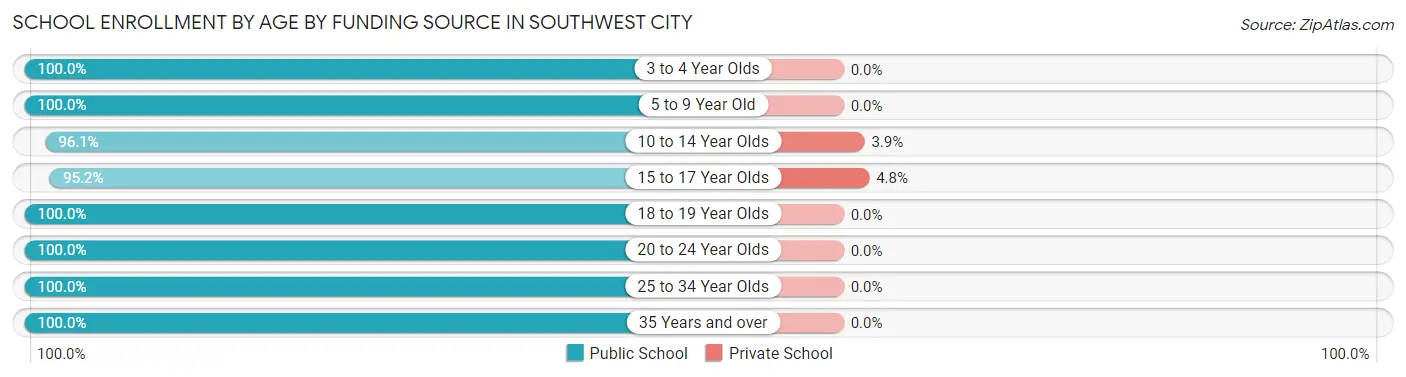
| Age Bracket | Public School | Private School |
| 3 to 4 Year Olds | 64 (100.0%) | 0 (0.0%) |
| 5 to 9 Year Old | 51 (100.0%) | 0 (0.0%) |
| 10 to 14 Year Olds | 124 (96.1%) | 5 (3.9%) |
| 15 to 17 Year Olds | 80 (95.2%) | 4 (4.8%) |
| 18 to 19 Year Olds | 6 (100.0%) | 0 (0.0%) |
| 20 to 24 Year Olds | 22 (100.0%) | 0 (0.0%) |
| 25 to 34 Year Olds | 2 (100.0%) | 0 (0.0%) |
| 35 Years and over | 10 (100.0%) | 0 (0.0%) |
| Total | 359 (97.6%) | 9 (2.4%) |
Educational Attainment by Field of Study in Southwest City
Education (9 | 37.5%), business (8 | 33.3%), liberal arts & history (4 | 16.7%), and communications (3 | 12.5%) are the most common fields of study among 24 individuals in Southwest City who have obtained a bachelor's degree or higher.
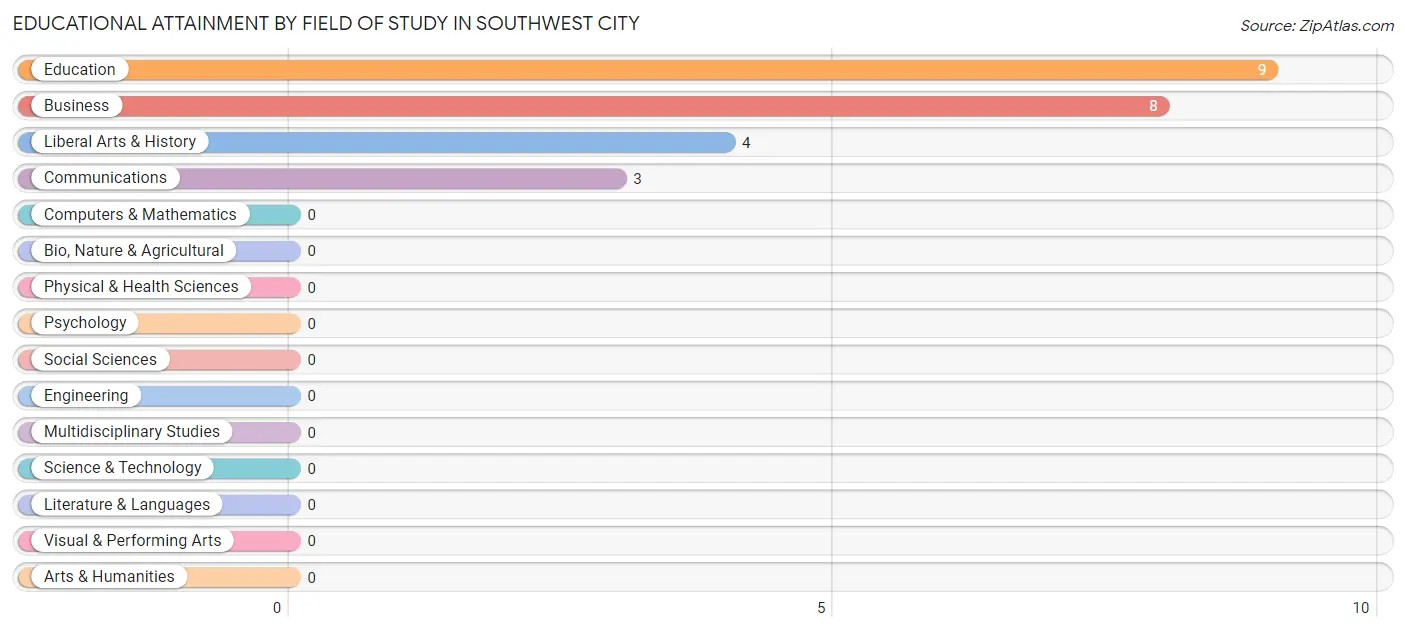
| Field of Study | # Graduates | % Graduates |
| Computers & Mathematics | 0 | 0.0% |
| Bio, Nature & Agricultural | 0 | 0.0% |
| Physical & Health Sciences | 0 | 0.0% |
| Psychology | 0 | 0.0% |
| Social Sciences | 0 | 0.0% |
| Engineering | 0 | 0.0% |
| Multidisciplinary Studies | 0 | 0.0% |
| Science & Technology | 0 | 0.0% |
| Business | 8 | 33.3% |
| Education | 9 | 37.5% |
| Literature & Languages | 0 | 0.0% |
| Liberal Arts & History | 4 | 16.7% |
| Visual & Performing Arts | 0 | 0.0% |
| Communications | 3 | 12.5% |
| Arts & Humanities | 0 | 0.0% |
| Total | 24 | 100.0% |
Transportation & Commute in Southwest City
Vehicle Availability by Sex in Southwest City
The most prevalent vehicle ownership categories in Southwest City are males with 1 vehicle (55, accounting for 24.9%) and females with 1 vehicle (28, making up 28.2%).
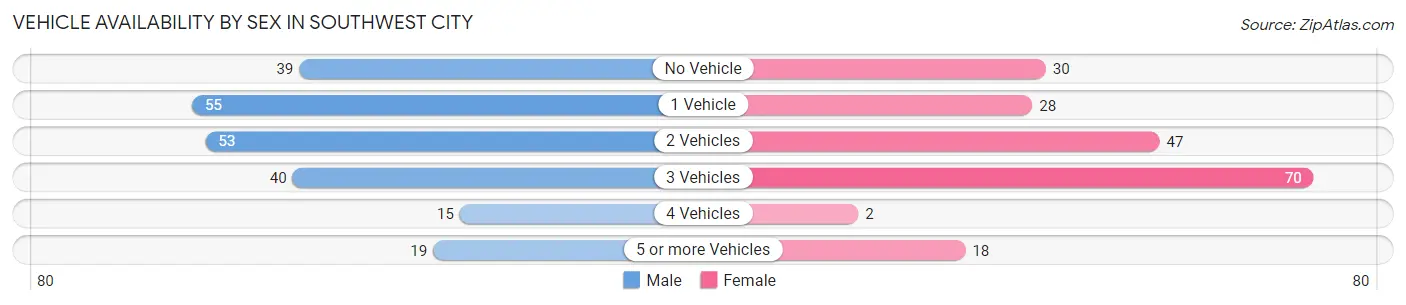
| Vehicles Available | Male | Female |
| No Vehicle | 39 (17.6%) | 30 (15.4%) |
| 1 Vehicle | 55 (24.9%) | 28 (14.4%) |
| 2 Vehicles | 53 (24.0%) | 47 (24.1%) |
| 3 Vehicles | 40 (18.1%) | 70 (35.9%) |
| 4 Vehicles | 15 (6.8%) | 2 (1.0%) |
| 5 or more Vehicles | 19 (8.6%) | 18 (9.2%) |
| Total | 221 (100.0%) | 195 (100.0%) |
Commute Time in Southwest City
The most frequently occuring commute durations in Southwest City are less than 5 minutes (70 commuters, 17.8%), 20 to 24 minutes (62 commuters, 15.8%), and 5 to 9 minutes (56 commuters, 14.2%).
| Commute Time | # Commuters | % Commuters |
| Less than 5 Minutes | 70 | 17.8% |
| 5 to 9 Minutes | 56 | 14.2% |
| 10 to 14 Minutes | 44 | 11.2% |
| 15 to 19 Minutes | 37 | 9.4% |
| 20 to 24 Minutes | 62 | 15.8% |
| 25 to 29 Minutes | 12 | 3.0% |
| 30 to 34 Minutes | 15 | 3.8% |
| 35 to 39 Minutes | 14 | 3.6% |
| 40 to 44 Minutes | 0 | 0.0% |
| 45 to 59 Minutes | 42 | 10.7% |
| 60 to 89 Minutes | 31 | 7.9% |
| 90 or more Minutes | 10 | 2.5% |
Commute Time by Sex in Southwest City
The most common commute times in Southwest City are 5 to 9 minutes (44 commuters, 20.9%) for males and 45 to 59 minutes (35 commuters, 19.1%) for females.
| Commute Time | Male | Female |
| Less than 5 Minutes | 36 (17.1%) | 34 (18.6%) |
| 5 to 9 Minutes | 44 (20.9%) | 12 (6.6%) |
| 10 to 14 Minutes | 15 (7.1%) | 29 (15.9%) |
| 15 to 19 Minutes | 15 (7.1%) | 22 (12.0%) |
| 20 to 24 Minutes | 33 (15.7%) | 29 (15.9%) |
| 25 to 29 Minutes | 8 (3.8%) | 4 (2.2%) |
| 30 to 34 Minutes | 12 (5.7%) | 3 (1.6%) |
| 35 to 39 Minutes | 14 (6.7%) | 0 (0.0%) |
| 40 to 44 Minutes | 0 (0.0%) | 0 (0.0%) |
| 45 to 59 Minutes | 7 (3.3%) | 35 (19.1%) |
| 60 to 89 Minutes | 26 (12.4%) | 5 (2.7%) |
| 90 or more Minutes | 0 (0.0%) | 10 (5.5%) |
Time of Departure to Work by Sex in Southwest City
The most frequent times of departure to work in Southwest City are 5:00 AM to 5:29 AM (62, 29.5%) for males and 12:00 PM to 3:59 PM (37, 20.2%) for females.
| Time of Departure | Male | Female |
| 12:00 AM to 4:59 AM | 0 (0.0%) | 23 (12.6%) |
| 5:00 AM to 5:29 AM | 62 (29.5%) | 25 (13.7%) |
| 5:30 AM to 5:59 AM | 3 (1.4%) | 0 (0.0%) |
| 6:00 AM to 6:29 AM | 33 (15.7%) | 9 (4.9%) |
| 6:30 AM to 6:59 AM | 23 (11.0%) | 20 (10.9%) |
| 7:00 AM to 7:29 AM | 45 (21.4%) | 28 (15.3%) |
| 7:30 AM to 7:59 AM | 0 (0.0%) | 12 (6.6%) |
| 8:00 AM to 8:29 AM | 0 (0.0%) | 19 (10.4%) |
| 8:30 AM to 8:59 AM | 6 (2.9%) | 1 (0.5%) |
| 9:00 AM to 9:59 AM | 0 (0.0%) | 0 (0.0%) |
| 10:00 AM to 10:59 AM | 0 (0.0%) | 0 (0.0%) |
| 11:00 AM to 11:59 AM | 2 (0.9%) | 0 (0.0%) |
| 12:00 PM to 3:59 PM | 2 (0.9%) | 37 (20.2%) |
| 4:00 PM to 11:59 PM | 34 (16.2%) | 9 (4.9%) |
| Total | 210 (100.0%) | 183 (100.0%) |
Housing Occupancy in Southwest City
Occupancy by Ownership in Southwest City
Of the total 277 dwellings in Southwest City, owner-occupied units account for 180 (65.0%), while renter-occupied units make up 97 (35.0%).
| Occupancy | # Housing Units | % Housing Units |
| Owner Occupied Housing Units | 180 | 65.0% |
| Renter-Occupied Housing Units | 97 | 35.0% |
| Total Occupied Housing Units | 277 | 100.0% |
Occupancy by Household Size in Southwest City
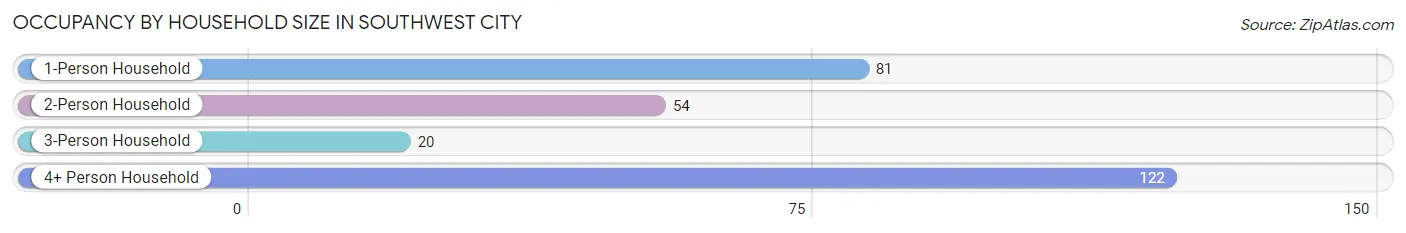
| Household Size | # Housing Units | % Housing Units |
| 1-Person Household | 81 | 29.2% |
| 2-Person Household | 54 | 19.5% |
| 3-Person Household | 20 | 7.2% |
| 4+ Person Household | 122 | 44.0% |
| Total Housing Units | 277 | 100.0% |
Occupancy by Ownership by Household Size in Southwest City
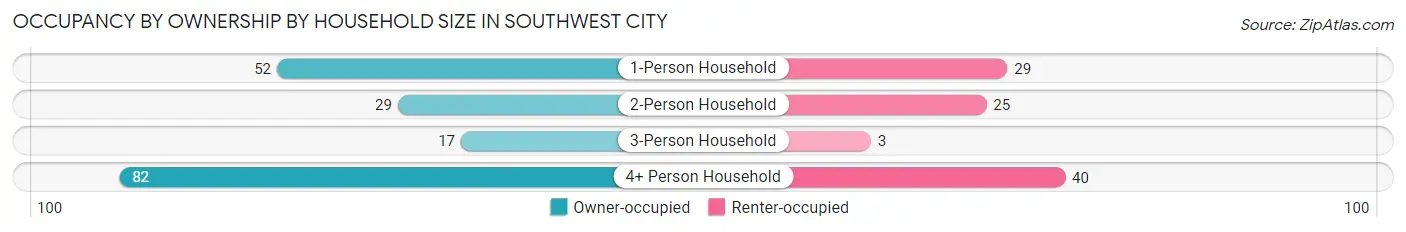
| Household Size | Owner-occupied | Renter-occupied |
| 1-Person Household | 52 (64.2%) | 29 (35.8%) |
| 2-Person Household | 29 (53.7%) | 25 (46.3%) |
| 3-Person Household | 17 (85.0%) | 3 (15.0%) |
| 4+ Person Household | 82 (67.2%) | 40 (32.8%) |
| Total Housing Units | 180 (65.0%) | 97 (35.0%) |
Occupancy by Educational Attainment in Southwest City
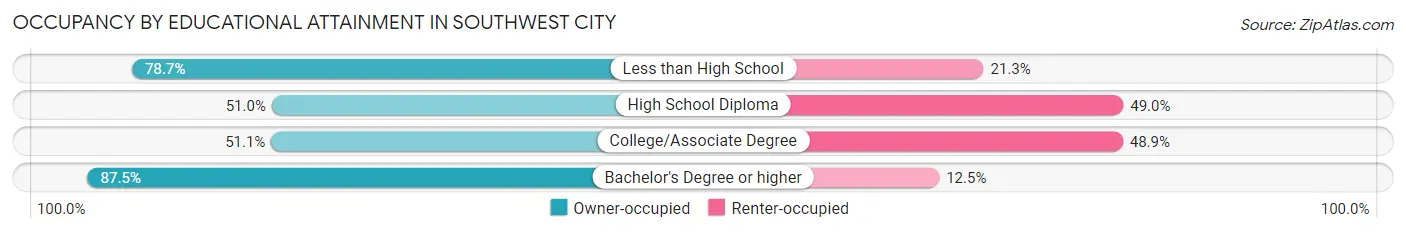
| Household Size | Owner-occupied | Renter-occupied |
| Less than High School | 85 (78.7%) | 23 (21.3%) |
| High School Diploma | 51 (51.0%) | 49 (49.0%) |
| College/Associate Degree | 23 (51.1%) | 22 (48.9%) |
| Bachelor's Degree or higher | 21 (87.5%) | 3 (12.5%) |
Occupancy by Age of Householder in Southwest City
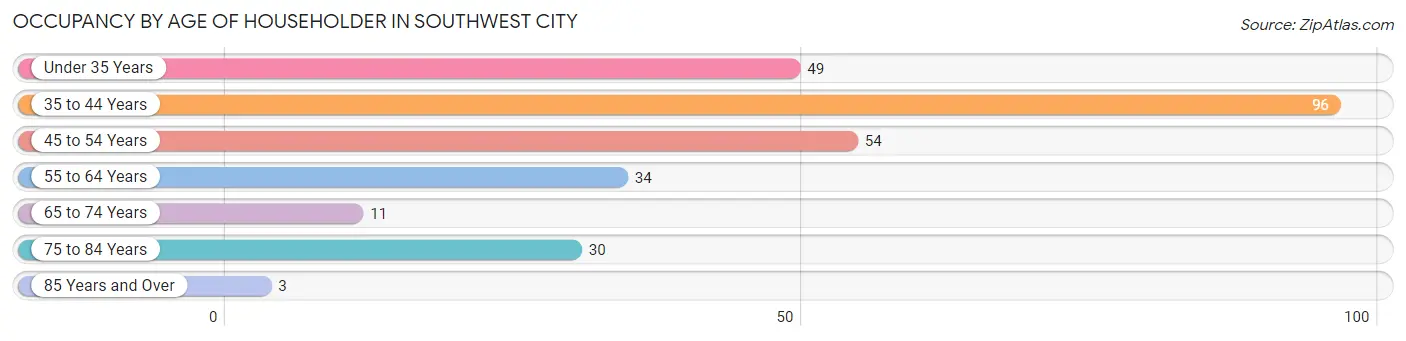
| Age Bracket | # Households | % Households |
| Under 35 Years | 49 | 17.7% |
| 35 to 44 Years | 96 | 34.7% |
| 45 to 54 Years | 54 | 19.5% |
| 55 to 64 Years | 34 | 12.3% |
| 65 to 74 Years | 11 | 4.0% |
| 75 to 84 Years | 30 | 10.8% |
| 85 Years and Over | 3 | 1.1% |
| Total | 277 | 100.0% |
Housing Finances in Southwest City
Median Income by Occupancy in Southwest City
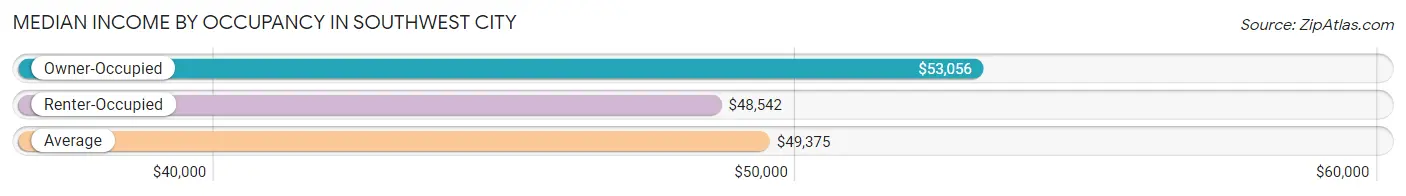
| Occupancy Type | # Households | Median Income |
| Owner-Occupied | 180 (65.0%) | $53,056 |
| Renter-Occupied | 97 (35.0%) | $48,542 |
| Average | 277 (100.0%) | $49,375 |
Occupancy by Householder Income Bracket in Southwest City
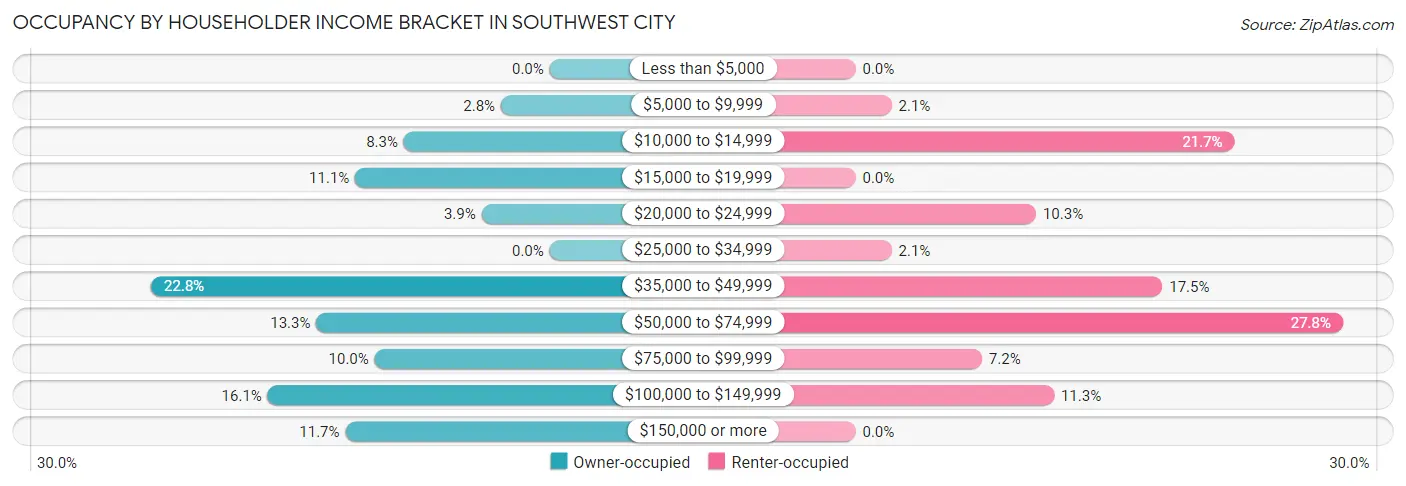
| Income Bracket | Owner-occupied | Renter-occupied |
| Less than $5,000 | 0 (0.0%) | 0 (0.0%) |
| $5,000 to $9,999 | 5 (2.8%) | 2 (2.1%) |
| $10,000 to $14,999 | 15 (8.3%) | 21 (21.6%) |
| $15,000 to $19,999 | 20 (11.1%) | 0 (0.0%) |
| $20,000 to $24,999 | 7 (3.9%) | 10 (10.3%) |
| $25,000 to $34,999 | 0 (0.0%) | 2 (2.1%) |
| $35,000 to $49,999 | 41 (22.8%) | 17 (17.5%) |
| $50,000 to $74,999 | 24 (13.3%) | 27 (27.8%) |
| $75,000 to $99,999 | 18 (10.0%) | 7 (7.2%) |
| $100,000 to $149,999 | 29 (16.1%) | 11 (11.3%) |
| $150,000 or more | 21 (11.7%) | 0 (0.0%) |
| Total | 180 (100.0%) | 97 (100.0%) |
Monthly Housing Cost Tiers in Southwest City
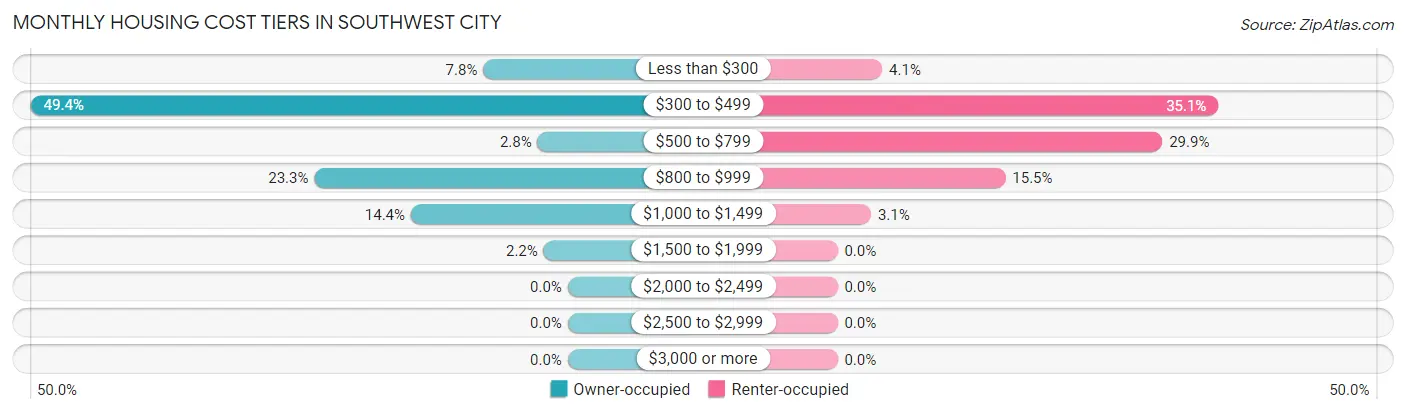
| Monthly Cost | Owner-occupied | Renter-occupied |
| Less than $300 | 14 (7.8%) | 4 (4.1%) |
| $300 to $499 | 89 (49.4%) | 34 (35.0%) |
| $500 to $799 | 5 (2.8%) | 29 (29.9%) |
| $800 to $999 | 42 (23.3%) | 15 (15.5%) |
| $1,000 to $1,499 | 26 (14.4%) | 3 (3.1%) |
| $1,500 to $1,999 | 4 (2.2%) | 0 (0.0%) |
| $2,000 to $2,499 | 0 (0.0%) | 0 (0.0%) |
| $2,500 to $2,999 | 0 (0.0%) | 0 (0.0%) |
| $3,000 or more | 0 (0.0%) | 0 (0.0%) |
| Total | 180 (100.0%) | 97 (100.0%) |
Physical Housing Characteristics in Southwest City
Housing Structures in Southwest City
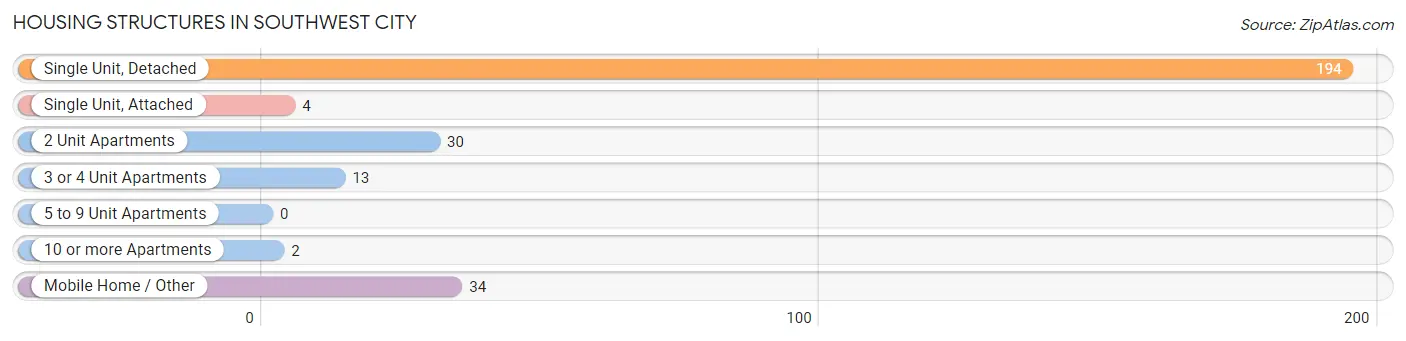
| Structure Type | # Housing Units | % Housing Units |
| Single Unit, Detached | 194 | 70.0% |
| Single Unit, Attached | 4 | 1.4% |
| 2 Unit Apartments | 30 | 10.8% |
| 3 or 4 Unit Apartments | 13 | 4.7% |
| 5 to 9 Unit Apartments | 0 | 0.0% |
| 10 or more Apartments | 2 | 0.7% |
| Mobile Home / Other | 34 | 12.3% |
| Total | 277 | 100.0% |
Housing Structures by Occupancy in Southwest City
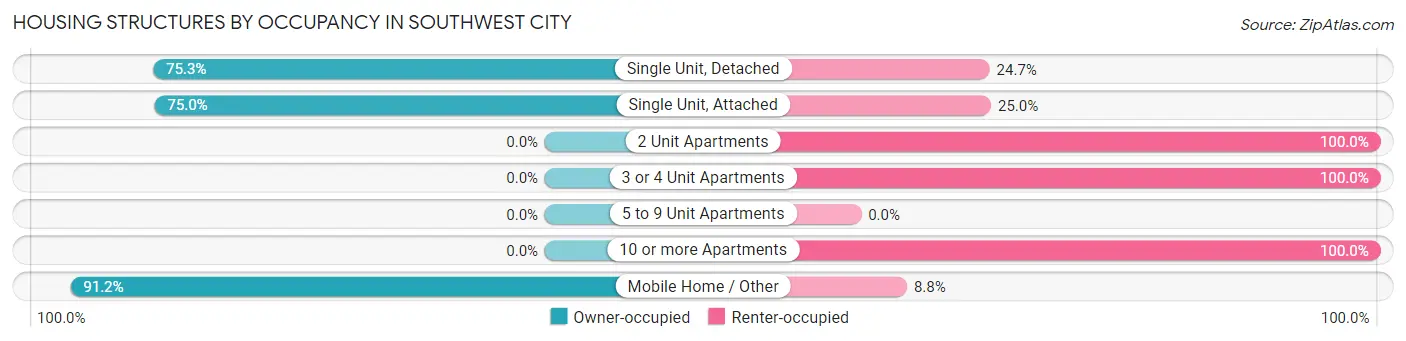
| Structure Type | Owner-occupied | Renter-occupied |
| Single Unit, Detached | 146 (75.3%) | 48 (24.7%) |
| Single Unit, Attached | 3 (75.0%) | 1 (25.0%) |
| 2 Unit Apartments | 0 (0.0%) | 30 (100.0%) |
| 3 or 4 Unit Apartments | 0 (0.0%) | 13 (100.0%) |
| 5 to 9 Unit Apartments | 0 (0.0%) | 0 (0.0%) |
| 10 or more Apartments | 0 (0.0%) | 2 (100.0%) |
| Mobile Home / Other | 31 (91.2%) | 3 (8.8%) |
| Total | 180 (65.0%) | 97 (35.0%) |
Housing Structures by Number of Rooms in Southwest City
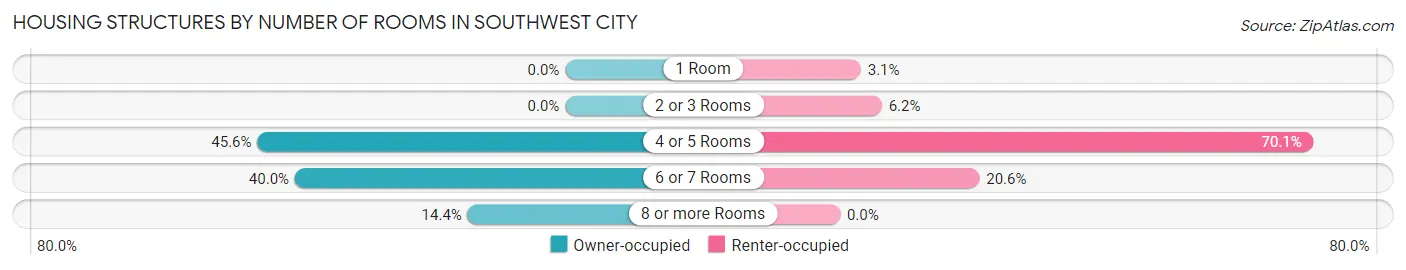
| Number of Rooms | Owner-occupied | Renter-occupied |
| 1 Room | 0 (0.0%) | 3 (3.1%) |
| 2 or 3 Rooms | 0 (0.0%) | 6 (6.2%) |
| 4 or 5 Rooms | 82 (45.6%) | 68 (70.1%) |
| 6 or 7 Rooms | 72 (40.0%) | 20 (20.6%) |
| 8 or more Rooms | 26 (14.4%) | 0 (0.0%) |
| Total | 180 (100.0%) | 97 (100.0%) |
Housing Structure by Heating Type in Southwest City
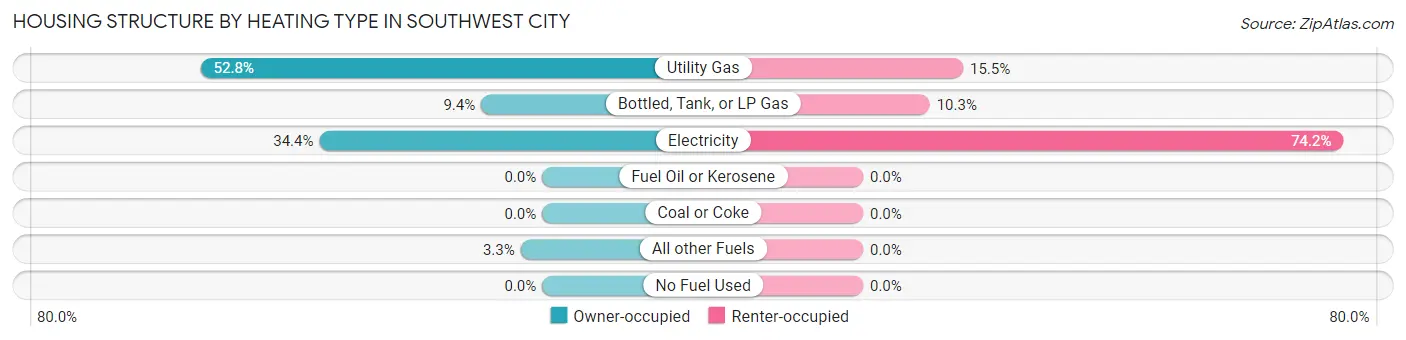
| Heating Type | Owner-occupied | Renter-occupied |
| Utility Gas | 95 (52.8%) | 15 (15.5%) |
| Bottled, Tank, or LP Gas | 17 (9.4%) | 10 (10.3%) |
| Electricity | 62 (34.4%) | 72 (74.2%) |
| Fuel Oil or Kerosene | 0 (0.0%) | 0 (0.0%) |
| Coal or Coke | 0 (0.0%) | 0 (0.0%) |
| All other Fuels | 6 (3.3%) | 0 (0.0%) |
| No Fuel Used | 0 (0.0%) | 0 (0.0%) |
| Total | 180 (100.0%) | 97 (100.0%) |
Household Vehicle Usage in Southwest City
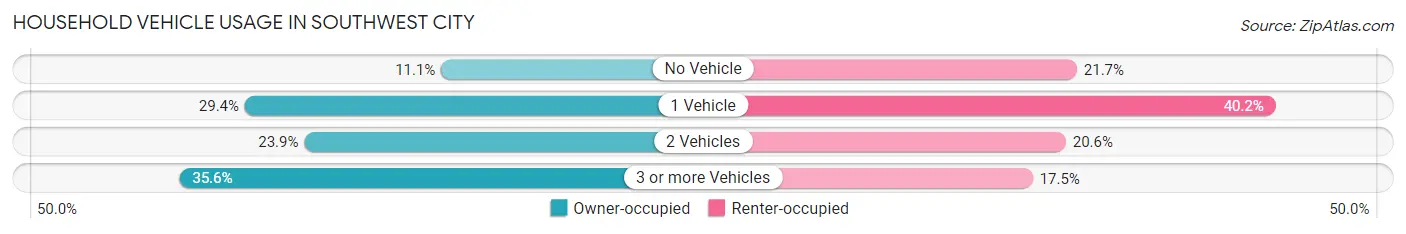
| Vehicles per Household | Owner-occupied | Renter-occupied |
| No Vehicle | 20 (11.1%) | 21 (21.6%) |
| 1 Vehicle | 53 (29.4%) | 39 (40.2%) |
| 2 Vehicles | 43 (23.9%) | 20 (20.6%) |
| 3 or more Vehicles | 64 (35.6%) | 17 (17.5%) |
| Total | 180 (100.0%) | 97 (100.0%) |
Real Estate & Mortgages in Southwest City
Real Estate and Mortgage Overview in Southwest City
| Characteristic | Without Mortgage | With Mortgage |
| Housing Units | 90 | 90 |
| Median Property Value | $63,800 | $58,600 |
| Median Household Income | $38,750 | $13 |
| Monthly Housing Costs | $368 | $0 |
| Real Estate Taxes | $325 | $0 |
Property Value by Mortgage Status in Southwest City
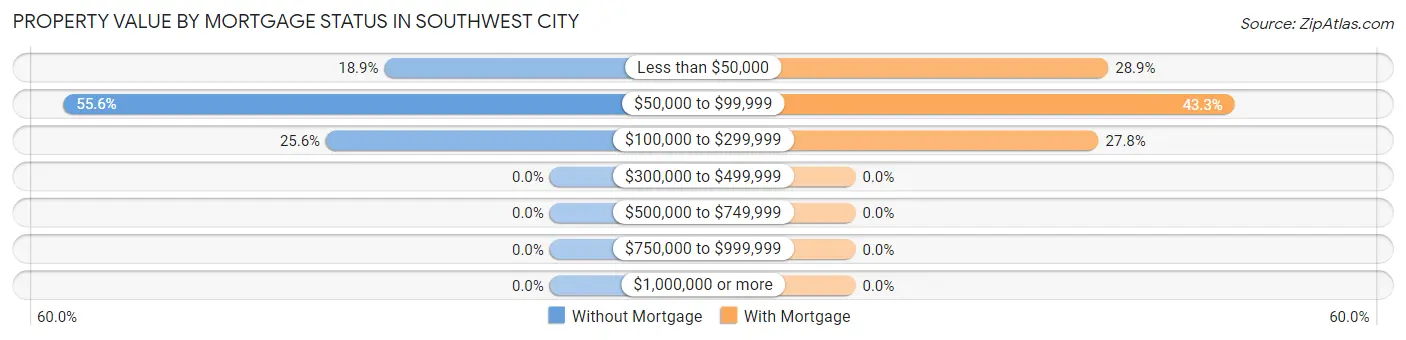
| Property Value | Without Mortgage | With Mortgage |
| Less than $50,000 | 17 (18.9%) | 26 (28.9%) |
| $50,000 to $99,999 | 50 (55.6%) | 39 (43.3%) |
| $100,000 to $299,999 | 23 (25.6%) | 25 (27.8%) |
| $300,000 to $499,999 | 0 (0.0%) | 0 (0.0%) |
| $500,000 to $749,999 | 0 (0.0%) | 0 (0.0%) |
| $750,000 to $999,999 | 0 (0.0%) | 0 (0.0%) |
| $1,000,000 or more | 0 (0.0%) | 0 (0.0%) |
| Total | 90 (100.0%) | 90 (100.0%) |
Household Income by Mortgage Status in Southwest City
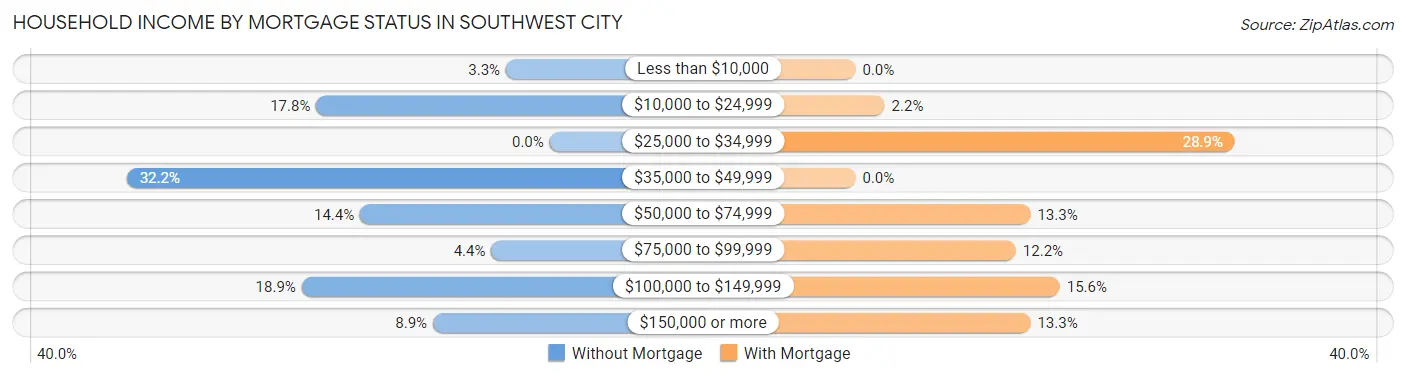
| Household Income | Without Mortgage | With Mortgage |
| Less than $10,000 | 3 (3.3%) | 0 (0.0%) |
| $10,000 to $24,999 | 16 (17.8%) | 2 (2.2%) |
| $25,000 to $34,999 | 0 (0.0%) | 26 (28.9%) |
| $35,000 to $49,999 | 29 (32.2%) | 0 (0.0%) |
| $50,000 to $74,999 | 13 (14.4%) | 12 (13.3%) |
| $75,000 to $99,999 | 4 (4.4%) | 11 (12.2%) |
| $100,000 to $149,999 | 17 (18.9%) | 14 (15.6%) |
| $150,000 or more | 8 (8.9%) | 12 (13.3%) |
| Total | 90 (100.0%) | 90 (100.0%) |
Property Value to Household Income Ratio in Southwest City
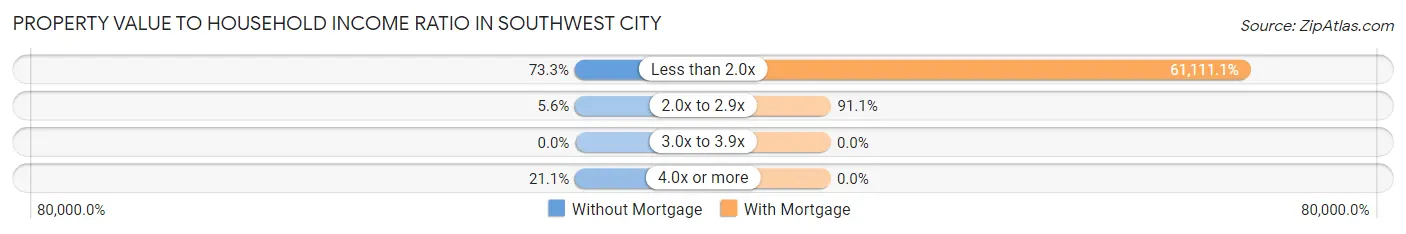
| Value-to-Income Ratio | Without Mortgage | With Mortgage |
| Less than 2.0x | 66 (73.3%) | 55,000 (61,111.1%) |
| 2.0x to 2.9x | 5 (5.6%) | 82 (91.1%) |
| 3.0x to 3.9x | 0 (0.0%) | 0 (0.0%) |
| 4.0x or more | 19 (21.1%) | 0 (0.0%) |
| Total | 90 (100.0%) | 90 (100.0%) |
Real Estate Taxes by Mortgage Status in Southwest City
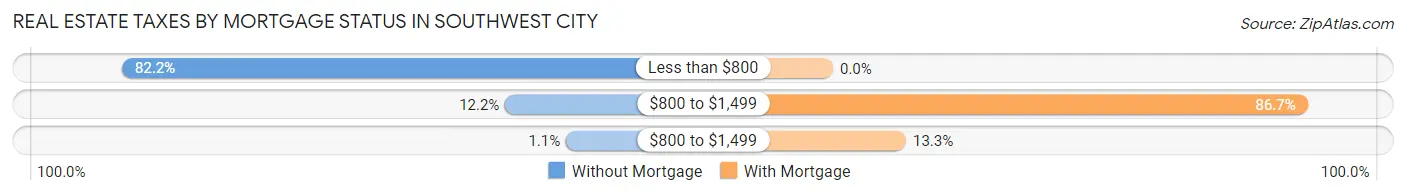
| Property Taxes | Without Mortgage | With Mortgage |
| Less than $800 | 74 (82.2%) | 0 (0.0%) |
| $800 to $1,499 | 11 (12.2%) | 78 (86.7%) |
| $800 to $1,499 | 1 (1.1%) | 12 (13.3%) |
| Total | 90 (100.0%) | 90 (100.0%) |
Health & Disability in Southwest City
Health Insurance Coverage by Age in Southwest City
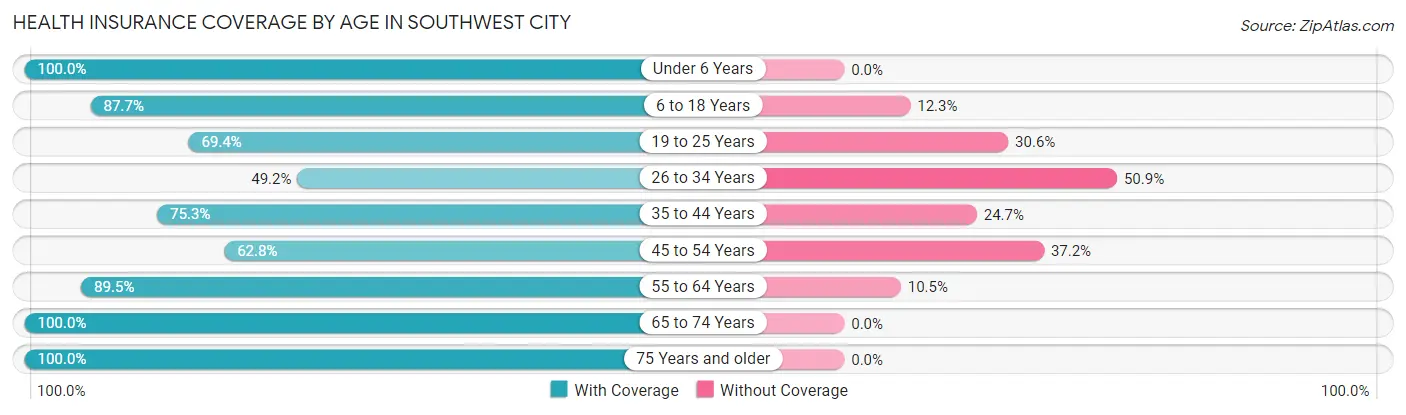
| Age Bracket | With Coverage | Without Coverage |
| Under 6 Years | 160 (100.0%) | 0 (0.0%) |
| 6 to 18 Years | 228 (87.7%) | 32 (12.3%) |
| 19 to 25 Years | 50 (69.4%) | 22 (30.6%) |
| 26 to 34 Years | 58 (49.1%) | 60 (50.8%) |
| 35 to 44 Years | 128 (75.3%) | 42 (24.7%) |
| 45 to 54 Years | 59 (62.8%) | 35 (37.2%) |
| 55 to 64 Years | 51 (89.5%) | 6 (10.5%) |
| 65 to 74 Years | 22 (100.0%) | 0 (0.0%) |
| 75 Years and older | 35 (100.0%) | 0 (0.0%) |
| Total | 791 (80.1%) | 197 (19.9%) |
Health Insurance Coverage by Citizenship Status in Southwest City
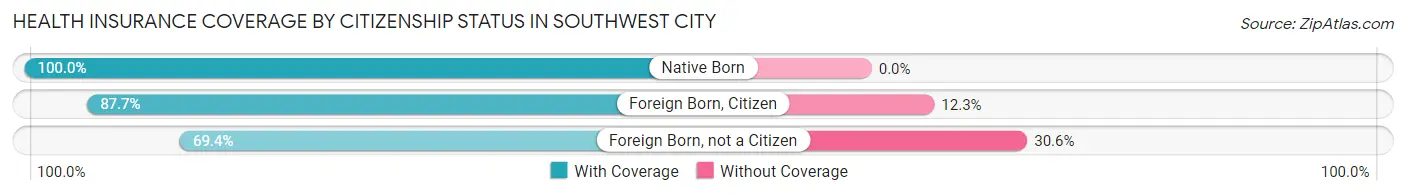
| Citizenship Status | With Coverage | Without Coverage |
| Native Born | 160 (100.0%) | 0 (0.0%) |
| Foreign Born, Citizen | 228 (87.7%) | 32 (12.3%) |
| Foreign Born, not a Citizen | 50 (69.4%) | 22 (30.6%) |
Health Insurance Coverage by Household Income in Southwest City
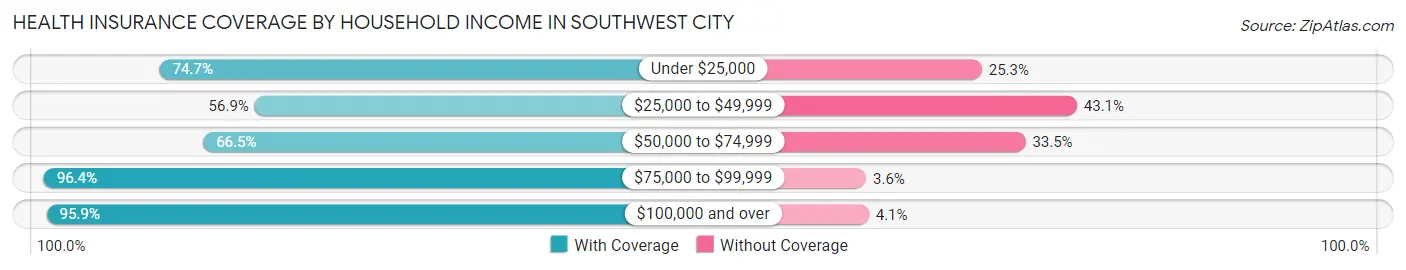
| Household Income | With Coverage | Without Coverage |
| Under $25,000 | 65 (74.7%) | 22 (25.3%) |
| $25,000 to $49,999 | 99 (56.9%) | 75 (43.1%) |
| $50,000 to $74,999 | 161 (66.5%) | 81 (33.5%) |
| $75,000 to $99,999 | 187 (96.4%) | 7 (3.6%) |
| $100,000 and over | 279 (95.9%) | 12 (4.1%) |
Public vs Private Health Insurance Coverage by Age in Southwest City
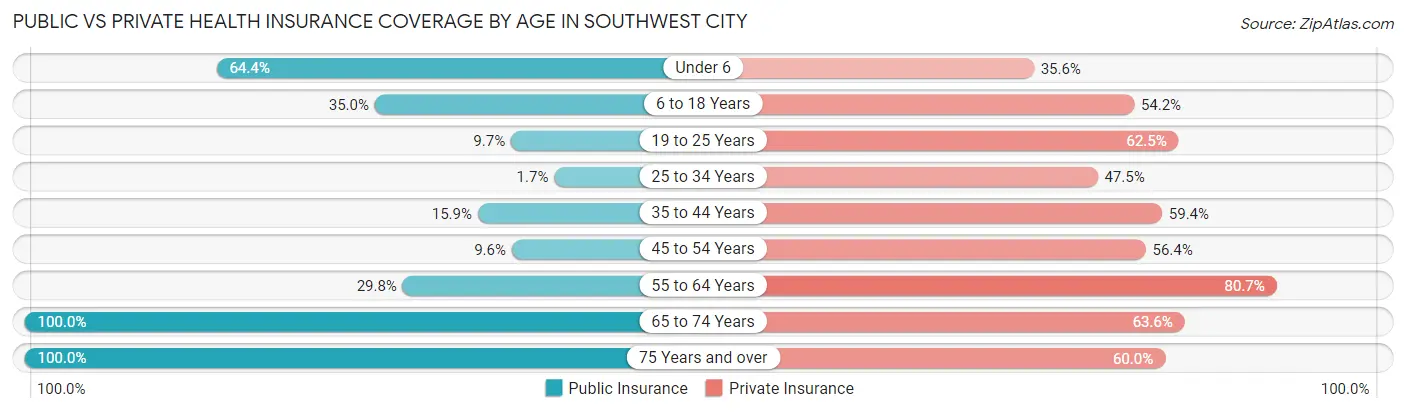
| Age Bracket | Public Insurance | Private Insurance |
| Under 6 | 103 (64.4%) | 57 (35.6%) |
| 6 to 18 Years | 91 (35.0%) | 141 (54.2%) |
| 19 to 25 Years | 7 (9.7%) | 45 (62.5%) |
| 25 to 34 Years | 2 (1.7%) | 56 (47.5%) |
| 35 to 44 Years | 27 (15.9%) | 101 (59.4%) |
| 45 to 54 Years | 9 (9.6%) | 53 (56.4%) |
| 55 to 64 Years | 17 (29.8%) | 46 (80.7%) |
| 65 to 74 Years | 22 (100.0%) | 14 (63.6%) |
| 75 Years and over | 35 (100.0%) | 21 (60.0%) |
| Total | 313 (31.7%) | 534 (54.0%) |
Disability Status by Sex by Age in Southwest City
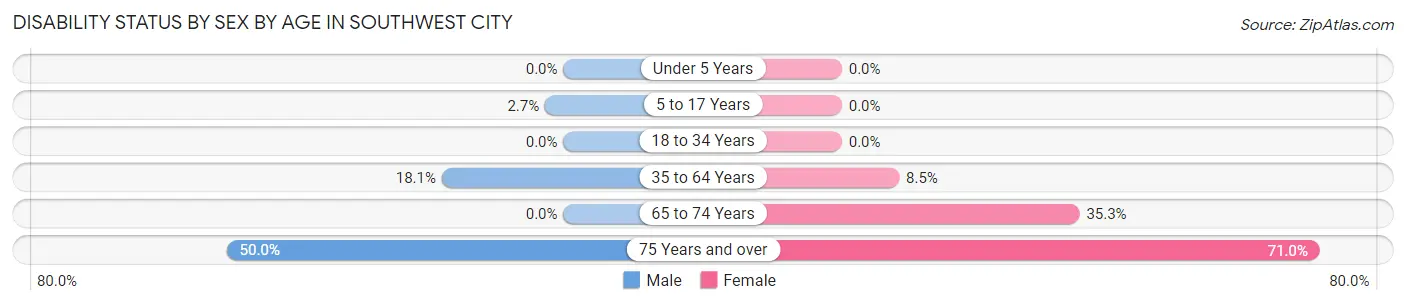
| Age Bracket | Male | Female |
| Under 5 Years | 0 (0.0%) | 0 (0.0%) |
| 5 to 17 Years | 4 (2.7%) | 0 (0.0%) |
| 18 to 34 Years | 0 (0.0%) | 0 (0.0%) |
| 35 to 64 Years | 24 (18.0%) | 16 (8.5%) |
| 65 to 74 Years | 0 (0.0%) | 6 (35.3%) |
| 75 Years and over | 2 (50.0%) | 22 (71.0%) |
Disability Class by Sex by Age in Southwest City
Disability Class: Hearing Difficulty
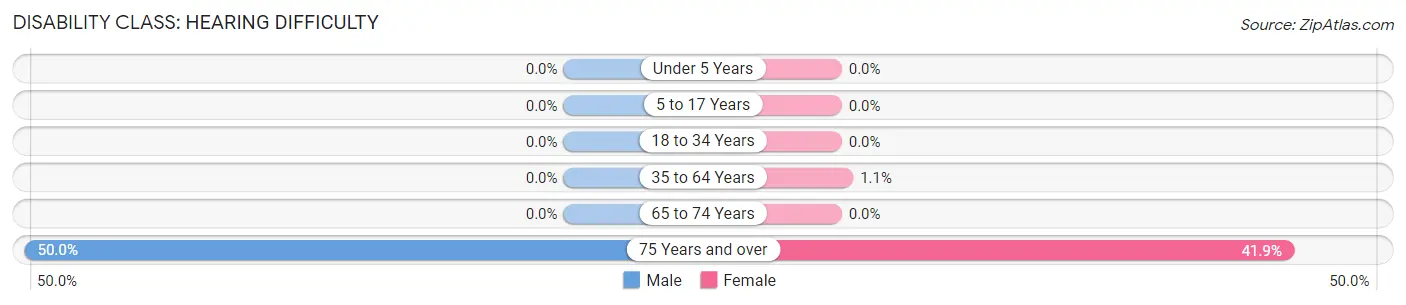
| Age Bracket | Male | Female |
| Under 5 Years | 0 (0.0%) | 0 (0.0%) |
| 5 to 17 Years | 0 (0.0%) | 0 (0.0%) |
| 18 to 34 Years | 0 (0.0%) | 0 (0.0%) |
| 35 to 64 Years | 0 (0.0%) | 2 (1.1%) |
| 65 to 74 Years | 0 (0.0%) | 0 (0.0%) |
| 75 Years and over | 2 (50.0%) | 13 (41.9%) |
Disability Class: Vision Difficulty
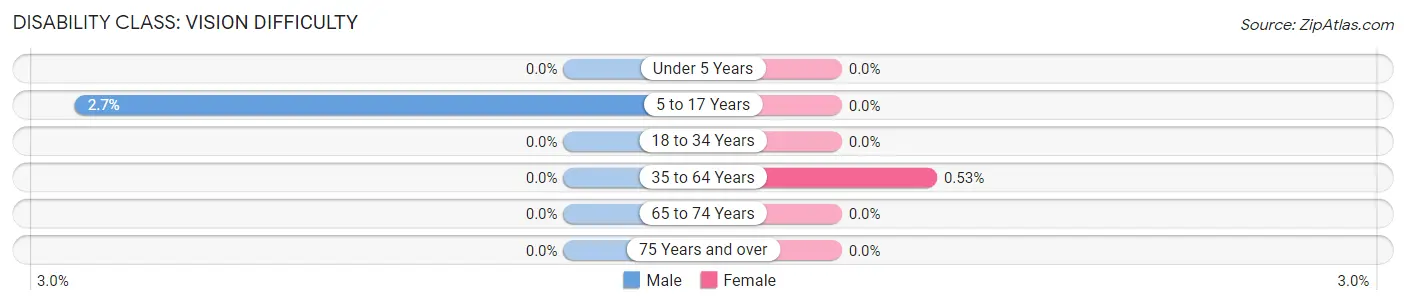
| Age Bracket | Male | Female |
| Under 5 Years | 0 (0.0%) | 0 (0.0%) |
| 5 to 17 Years | 4 (2.7%) | 0 (0.0%) |
| 18 to 34 Years | 0 (0.0%) | 0 (0.0%) |
| 35 to 64 Years | 0 (0.0%) | 1 (0.5%) |
| 65 to 74 Years | 0 (0.0%) | 0 (0.0%) |
| 75 Years and over | 0 (0.0%) | 0 (0.0%) |
Disability Class: Cognitive Difficulty
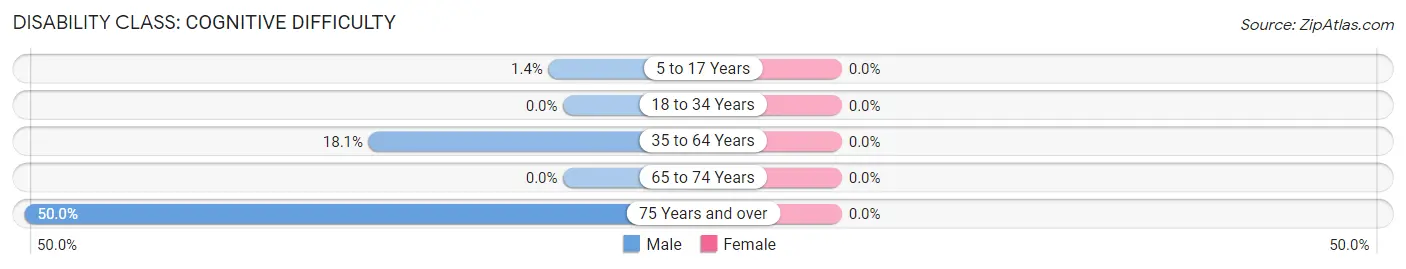
| Age Bracket | Male | Female |
| 5 to 17 Years | 2 (1.4%) | 0 (0.0%) |
| 18 to 34 Years | 0 (0.0%) | 0 (0.0%) |
| 35 to 64 Years | 24 (18.0%) | 0 (0.0%) |
| 65 to 74 Years | 0 (0.0%) | 0 (0.0%) |
| 75 Years and over | 2 (50.0%) | 0 (0.0%) |
Disability Class: Ambulatory Difficulty
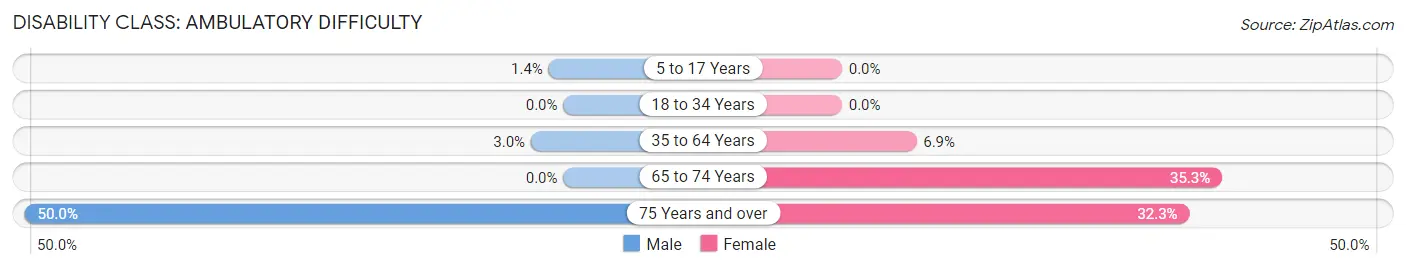
| Age Bracket | Male | Female |
| 5 to 17 Years | 2 (1.4%) | 0 (0.0%) |
| 18 to 34 Years | 0 (0.0%) | 0 (0.0%) |
| 35 to 64 Years | 4 (3.0%) | 13 (6.9%) |
| 65 to 74 Years | 0 (0.0%) | 6 (35.3%) |
| 75 Years and over | 2 (50.0%) | 10 (32.3%) |
Disability Class: Self-Care Difficulty
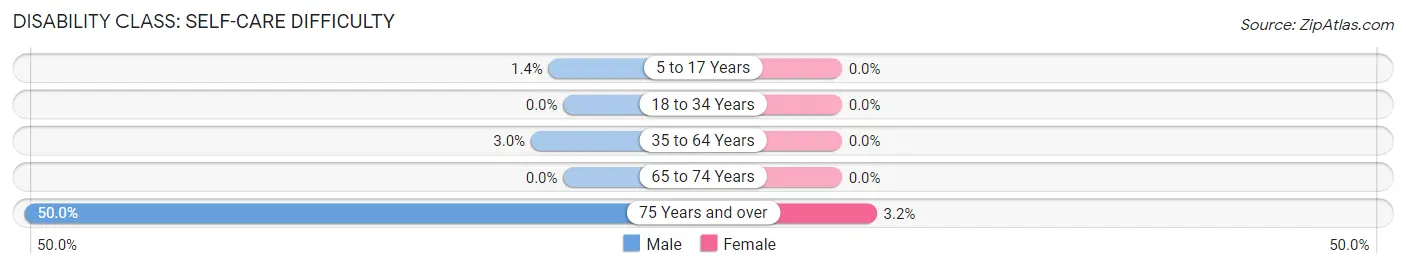
| Age Bracket | Male | Female |
| 5 to 17 Years | 2 (1.4%) | 0 (0.0%) |
| 18 to 34 Years | 0 (0.0%) | 0 (0.0%) |
| 35 to 64 Years | 4 (3.0%) | 0 (0.0%) |
| 65 to 74 Years | 0 (0.0%) | 0 (0.0%) |
| 75 Years and over | 2 (50.0%) | 1 (3.2%) |
Technology Access in Southwest City
Computing Device Access in Southwest City
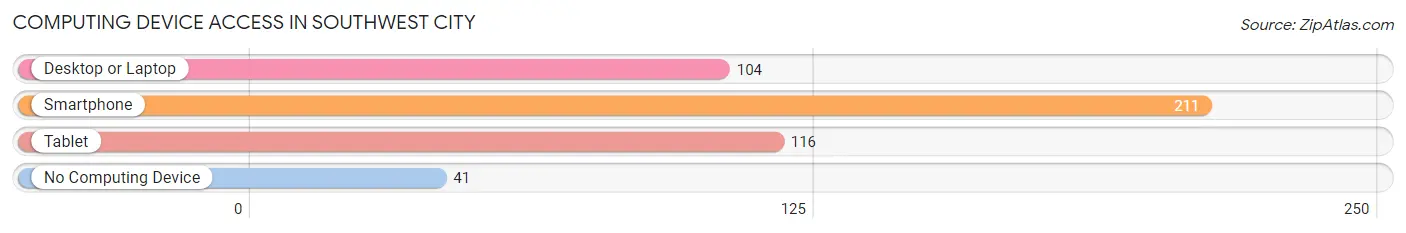
| Device Type | # Households | % Households |
| Desktop or Laptop | 104 | 37.6% |
| Smartphone | 211 | 76.2% |
| Tablet | 116 | 41.9% |
| No Computing Device | 41 | 14.8% |
| Total | 277 | 100.0% |
Internet Access in Southwest City
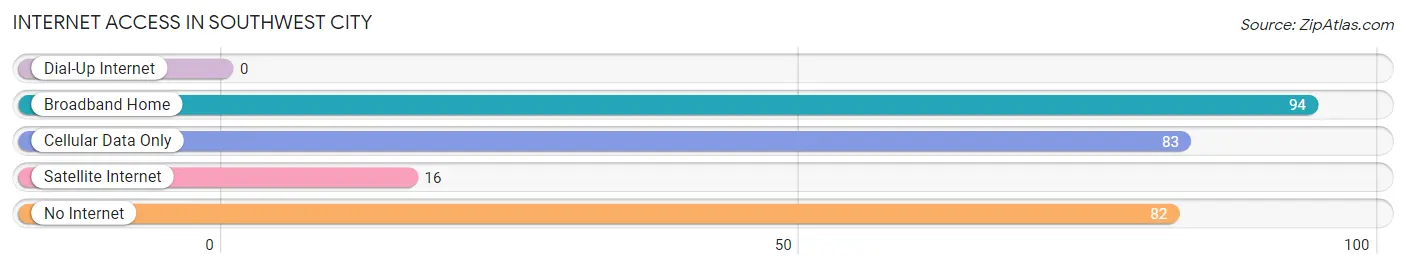
| Internet Type | # Households | % Households |
| Dial-Up Internet | 0 | 0.0% |
| Broadband Home | 94 | 33.9% |
| Cellular Data Only | 83 | 30.0% |
| Satellite Internet | 16 | 5.8% |
| No Internet | 82 | 29.6% |
| Total | 277 | 100.0% |
Southwest City Summary
Southwest City is a small town located in the far southwestern corner of Missouri, near the Arkansas and Oklahoma borders. It is part of McDonald County, and is situated in the Ozark Mountains. The town has a population of approximately 1,000 people, and is known for its rural charm and friendly atmosphere.
History
Southwest City was founded in 1881 by a group of settlers from Arkansas. The town was originally called “Hickory Grove”, but the name was changed to Southwest City in 1883. The town was incorporated in 1887, and the first post office was established in 1888.
The town was originally a farming community, and the main crops were cotton, corn, and wheat. The town also had a few small businesses, including a general store, a blacksmith shop, and a sawmill.
In the early 1900s, the town began to grow and prosper. The railroad came to town in 1906, and the town was connected to the national highway system in the 1920s. This allowed the town to become a trading center for the surrounding area.
The town continued to grow and prosper throughout the 20th century. In the 1950s, the town was home to a large poultry processing plant, which provided jobs for many of the town’s residents. The plant closed in the 1980s, but the town has continued to grow and thrive.
Geography
Southwest City is located in the Ozark Mountains of Missouri. The town is situated in a valley, surrounded by rolling hills and forests. The town is located near the Arkansas and Oklahoma borders, and is about 30 miles from the nearest major city, Joplin, Missouri.
The town is located in a temperate climate, with hot summers and mild winters. The average annual temperature is around 60 degrees Fahrenheit. The town receives an average of 40 inches of precipitation per year.
Economy
The economy of Southwest City is largely based on agriculture and tourism. The town is home to several farms, which produce a variety of crops, including corn, soybeans, wheat, and hay. The town is also home to several small businesses, including restaurants, shops, and a few manufacturing plants.
The town is also a popular tourist destination, due to its rural charm and proximity to the Ozark Mountains. The town is home to several campgrounds, as well as a few small lakes and rivers. The town also hosts several festivals and events throughout the year, including the annual Southwest City Days celebration.
Demographics
As of the 2010 census, the population of Southwest City was 1,039. The town is predominantly white, with a small African American population. The median household income is around $35,000, and the median home value is around $90,000. The town has a low unemployment rate, and the poverty rate is below the national average.
Common Questions
What is Per Capita Income in Southwest City?
Per Capita income in Southwest City is $23,720.
What is the Median Family Income in Southwest City?
Median Family Income in Southwest City is $68,250.
What is the Median Household income in Southwest City?
Median Household Income in Southwest City is $49,375.
What is Income or Wage Gap in Southwest City?
Income or Wage Gap in Southwest City is 12.3%.
Women in Southwest City earn 87.7 cents for every dollar earned by a man.
What is Inequality or Gini Index in Southwest City?
Inequality or Gini Index in Southwest City is 0.54.
What is the Total Population of Southwest City?
Total Population of Southwest City is 988.
What is the Total Male Population of Southwest City?
Total Male Population of Southwest City is 480.
What is the Total Female Population of Southwest City?
Total Female Population of Southwest City is 508.
What is the Ratio of Males per 100 Females in Southwest City?
There are 94.49 Males per 100 Females in Southwest City.
What is the Ratio of Females per 100 Males in Southwest City?
There are 105.83 Females per 100 Males in Southwest City.
What is the Median Population Age in Southwest City?
Median Population Age in Southwest City is 27.1 Years.
What is the Average Family Size in Southwest City
Average Family Size in Southwest City is 4.6 People.
What is the Average Household Size in Southwest City
Average Household Size in Southwest City is 3.6 People.
How Large is the Labor Force in Southwest City?
There are 432 People in the Labor Forcein in Southwest City.
What is the Percentage of People in the Labor Force in Southwest City?
67.1% of People are in the Labor Force in Southwest City.
What is the Unemployment Rate in Southwest City?
Unemployment Rate in Southwest City is 3.7%.