Mindenmines, MO Map & Demographics
Mindenmines Map
Mindenmines Overview
$17,493
PER CAPITA INCOME
$42,500
AVG FAMILY INCOME
33.2%
WAGE / INCOME GAP [ % ]
66.8¢/ $1
WAGE / INCOME GAP [ $ ]
0.46
INEQUALITY / GINI INDEX
387
TOTAL POPULATION
173
MALE POPULATION
214
FEMALE POPULATION
80.84
MALES / 100 FEMALES
123.70
FEMALES / 100 MALES
48.5
MEDIAN AGE
3.3
AVG FAMILY SIZE
2.1
AVG HOUSEHOLD SIZE
108
LABOR FORCE [ PEOPLE ]
33.0%
PERCENT IN LABOR FORCE
Mindenmines Zip Codes
Mindenmines Area Codes
Income in Mindenmines
Income Overview in Mindenmines
| Characteristic | Number | Measure |
| Per Capita Income | 387 | $17,493 |
| Median Family Income | 82 | $42,500 |
| Mean Family Income | 82 | $52,515 |
| Median Household Income | 183 | $0 |
| Mean Household Income | 183 | $33,667 |
| Income Deficit | 82 | $0 |
| Wage / Income Gap (%) | 387 | 33.17% |
| Wage / Income Gap ($) | 387 | 66.83¢ per $1 |
| Gini / Inequality Index | 387 | 0.46 |
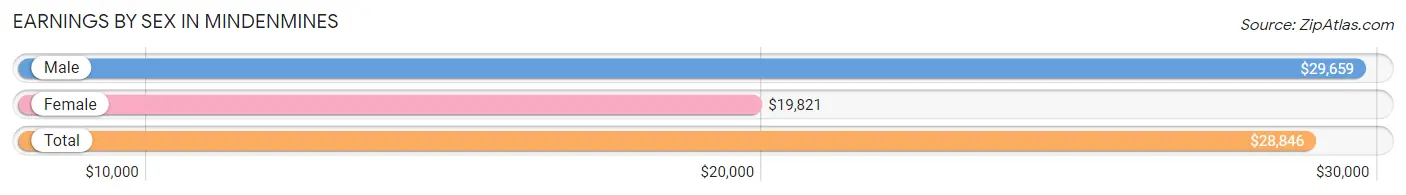
Earnings by Sex in Mindenmines
Average Earnings in Mindenmines are $28,846, $29,659 for men and $19,821 for women, a difference of 33.2%.
| Sex | Number | Average Earnings |
| Male | 67 (54.0%) | $29,659 |
| Female | 57 (46.0%) | $19,821 |
| Total | 124 (100.0%) | $28,846 |
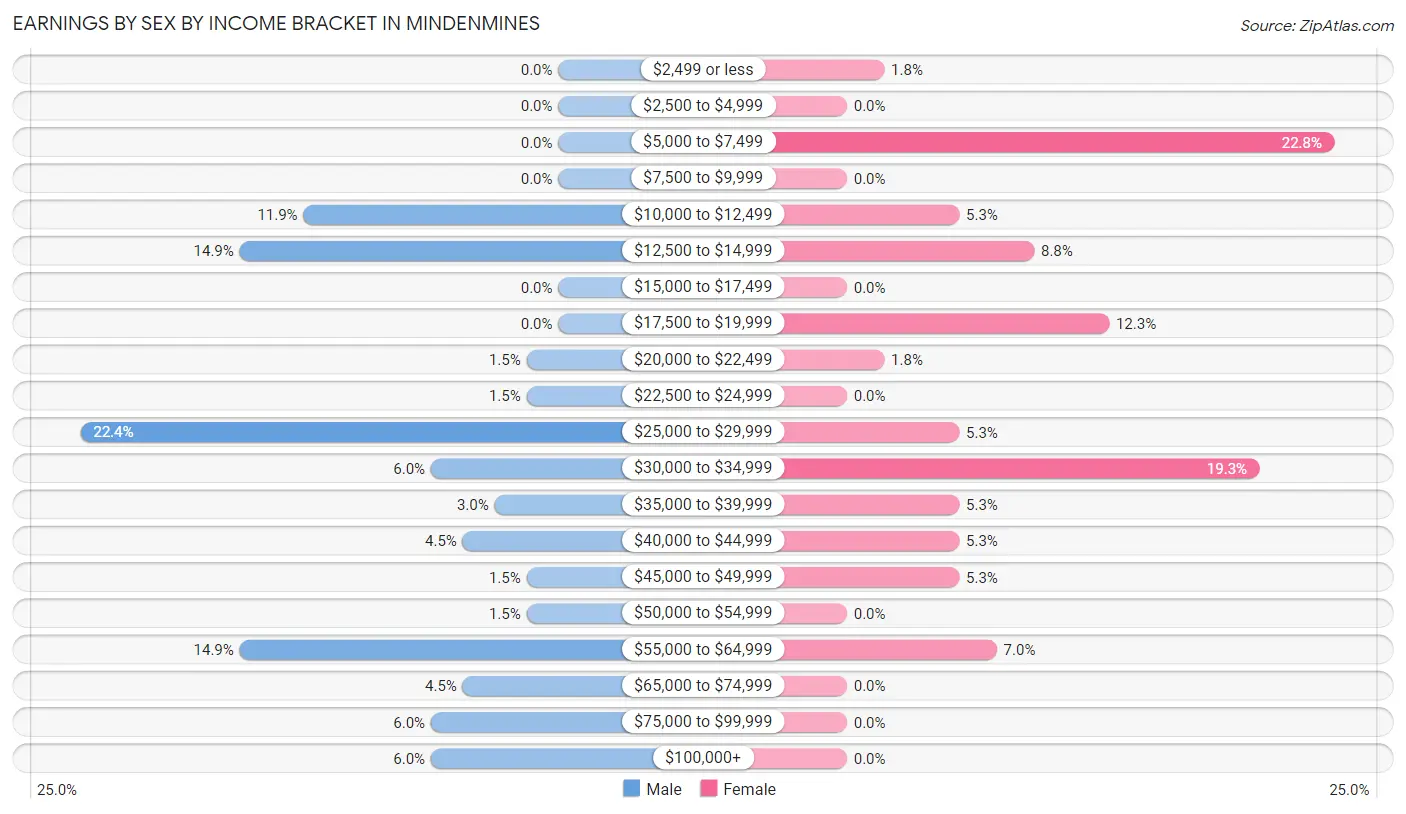
Earnings by Sex by Income Bracket in Mindenmines
The most common earnings brackets in Mindenmines are $25,000 to $29,999 for men (15 | 22.4%) and $5,000 to $7,499 for women (13 | 22.8%).
| Income | Male | Female |
| $2,499 or less | 0 (0.0%) | 1 (1.8%) |
| $2,500 to $4,999 | 0 (0.0%) | 0 (0.0%) |
| $5,000 to $7,499 | 0 (0.0%) | 13 (22.8%) |
| $7,500 to $9,999 | 0 (0.0%) | 0 (0.0%) |
| $10,000 to $12,499 | 8 (11.9%) | 3 (5.3%) |
| $12,500 to $14,999 | 10 (14.9%) | 5 (8.8%) |
| $15,000 to $17,499 | 0 (0.0%) | 0 (0.0%) |
| $17,500 to $19,999 | 0 (0.0%) | 7 (12.3%) |
| $20,000 to $22,499 | 1 (1.5%) | 1 (1.8%) |
| $22,500 to $24,999 | 1 (1.5%) | 0 (0.0%) |
| $25,000 to $29,999 | 15 (22.4%) | 3 (5.3%) |
| $30,000 to $34,999 | 4 (6.0%) | 11 (19.3%) |
| $35,000 to $39,999 | 2 (3.0%) | 3 (5.3%) |
| $40,000 to $44,999 | 3 (4.5%) | 3 (5.3%) |
| $45,000 to $49,999 | 1 (1.5%) | 3 (5.3%) |
| $50,000 to $54,999 | 1 (1.5%) | 0 (0.0%) |
| $55,000 to $64,999 | 10 (14.9%) | 4 (7.0%) |
| $65,000 to $74,999 | 3 (4.5%) | 0 (0.0%) |
| $75,000 to $99,999 | 4 (6.0%) | 0 (0.0%) |
| $100,000+ | 4 (6.0%) | 0 (0.0%) |
| Total | 67 (100.0%) | 57 (100.0%) |
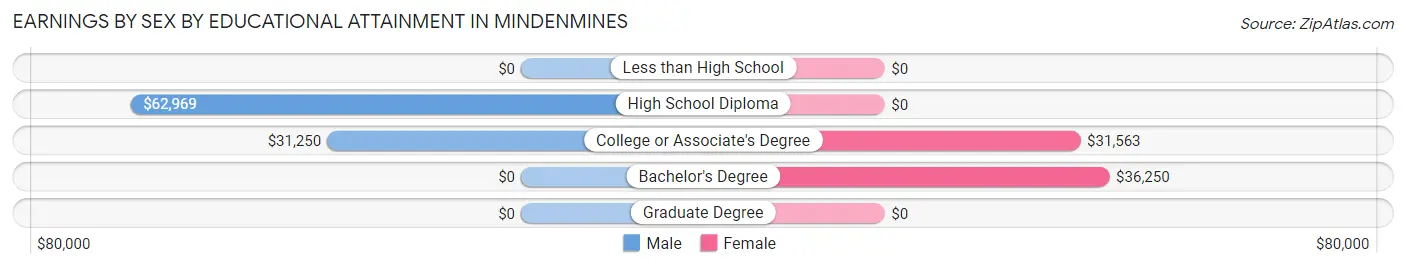
Earnings by Sex by Educational Attainment in Mindenmines
Average earnings in Mindenmines are $37,500 for men and $28,750 for women, a difference of 23.3%. Men with an educational attainment of high school diploma enjoy the highest average annual earnings of $62,969, while those with college or associate's degree education earn the least with $31,250. Women with an educational attainment of bachelor's degree earn the most with the average annual earnings of $36,250, while those with college or associate's degree education have the smallest earnings of $31,563.
| Educational Attainment | Male Income | Female Income |
| Less than High School | - | - |
| High School Diploma | $62,969 | $0 |
| College or Associate's Degree | $31,250 | $31,563 |
| Bachelor's Degree | - | - |
| Graduate Degree | - | - |
| Total | $37,500 | $28,750 |
Family Income in Mindenmines
Family Income Brackets in Mindenmines
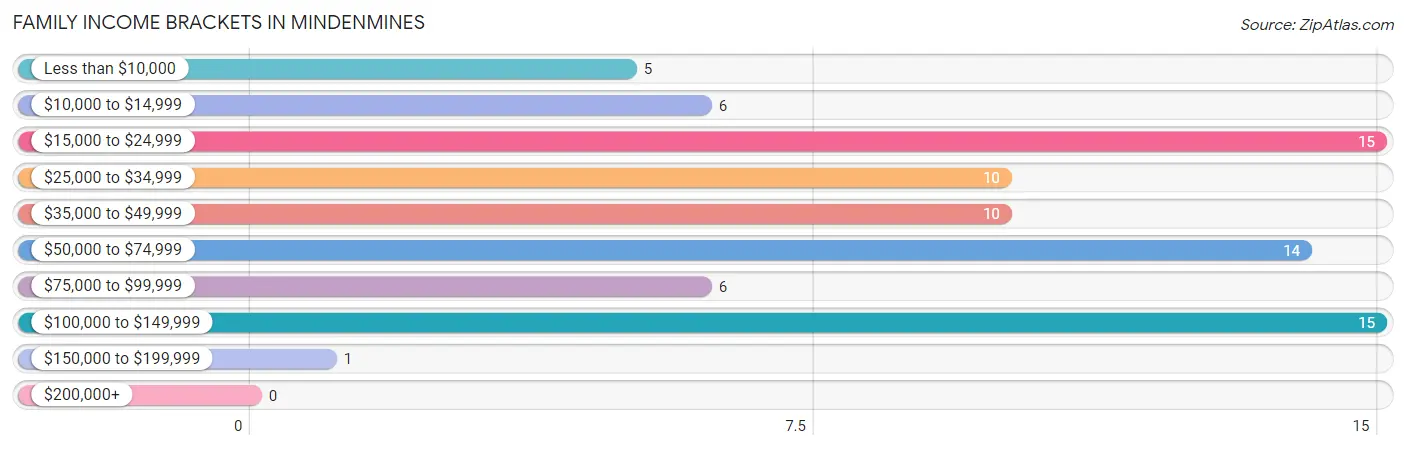
According to the Mindenmines family income data, there are 15 families falling into the $15,000 to $24,999 income range, which is the most common income bracket and makes up 18.3% of all families.
| Income Bracket | # Families | % Families |
| Less than $10,000 | 5 | 6.1% |
| $10,000 to $14,999 | 6 | 7.3% |
| $15,000 to $24,999 | 15 | 18.3% |
| $25,000 to $34,999 | 10 | 12.2% |
| $35,000 to $49,999 | 10 | 12.2% |
| $50,000 to $74,999 | 14 | 17.1% |
| $75,000 to $99,999 | 6 | 7.3% |
| $100,000 to $149,999 | 15 | 18.3% |
| $150,000 to $199,999 | 1 | 1.2% |
| $200,000+ | 0 | 0.0% |
Family Income by Famaliy Size in Mindenmines
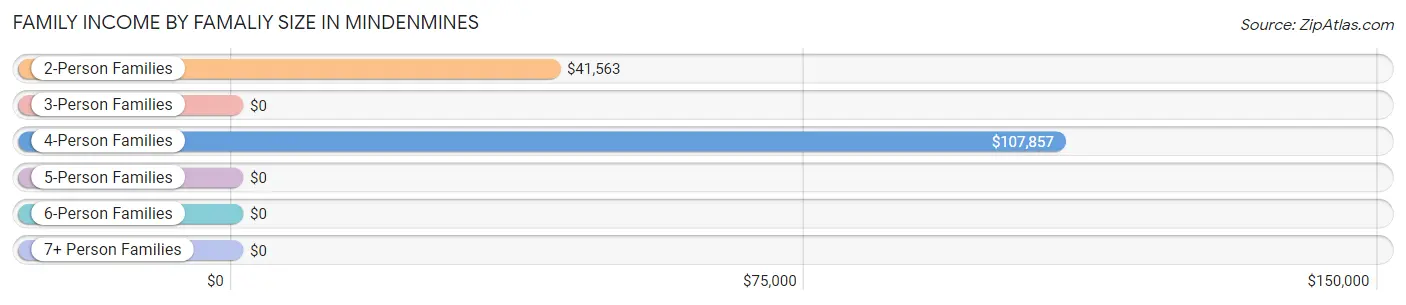
4-person families (18 | 22.0%) account for the highest median family income in Mindenmines with $107,857 per family, while 4-person families (18 | 22.0%) have the highest median income of $26,964 per family member.
| Income Bracket | # Families | Median Income |
| 2-Person Families | 47 (57.3%) | $41,563 |
| 3-Person Families | 11 (13.4%) | $0 |
| 4-Person Families | 18 (22.0%) | $107,857 |
| 5-Person Families | 0 (0.0%) | $0 |
| 6-Person Families | 6 (7.3%) | $0 |
| 7+ Person Families | 0 (0.0%) | $0 |
| Total | 82 (100.0%) | $42,500 |
Family Income by Number of Earners in Mindenmines
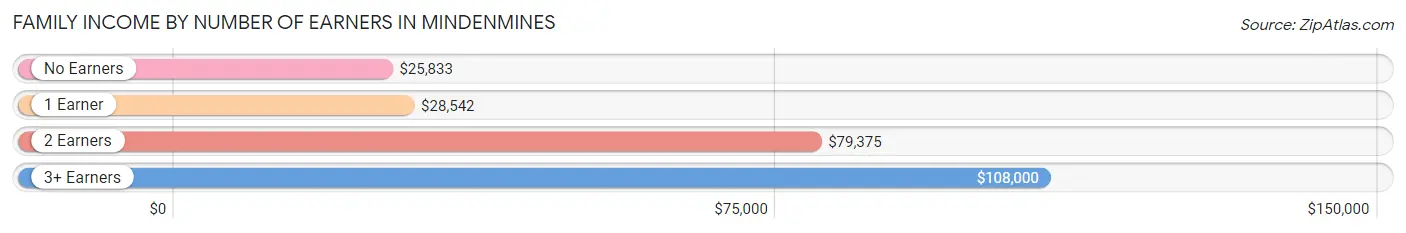
The median family income in Mindenmines is $42,500, with families comprising 3+ earners (8) having the highest median family income of $108,000, while families with no earners (24) have the lowest median family income of $25,833, accounting for 9.8% and 29.3% of families, respectively.
| Number of Earners | # Families | Median Income |
| No Earners | 24 (29.3%) | $25,833 |
| 1 Earner | 29 (35.4%) | $28,542 |
| 2 Earners | 21 (25.6%) | $79,375 |
| 3+ Earners | 8 (9.8%) | $108,000 |
| Total | 82 (100.0%) | $42,500 |
Household Income in Mindenmines
Household Income Brackets in Mindenmines
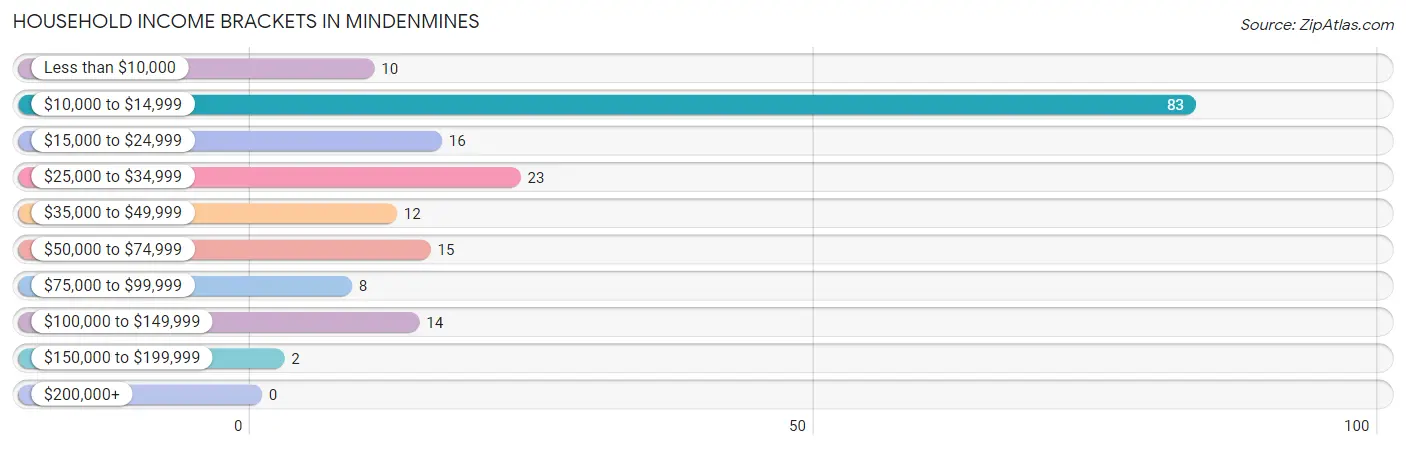
With 83 households falling in the category, the $10,000 to $14,999 income range is the most frequent in Mindenmines, accounting for 45.4% of all households.
| Income Bracket | # Households | % Households |
| Less than $10,000 | 10 | 5.5% |
| $10,000 to $14,999 | 83 | 45.4% |
| $15,000 to $24,999 | 16 | 8.7% |
| $25,000 to $34,999 | 23 | 12.6% |
| $35,000 to $49,999 | 12 | 6.6% |
| $50,000 to $74,999 | 15 | 8.2% |
| $75,000 to $99,999 | 8 | 4.4% |
| $100,000 to $149,999 | 14 | 7.7% |
| $150,000 to $199,999 | 2 | 1.1% |
| $200,000+ | 0 | 0.0% |
Household Income by Householder Age in Mindenmines
The median household income in Mindenmines is $0, with the highest median household income of $14,422 found in the 65+ years age bracket for the primary householder. A total of 113 households (61.8%) fall into this category. Meanwhile, the 15 to 24 years age bracket for the primary householder has the lowest median household income of $0, with 1 households (0.5%) in this group.
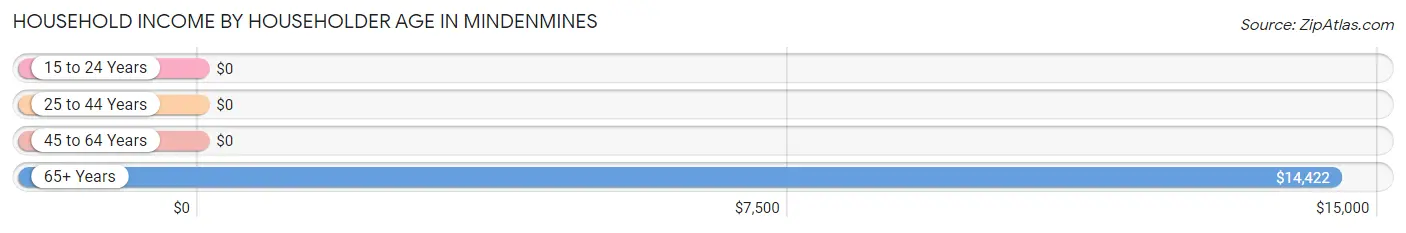
| Income Bracket | # Households | Median Income |
| 15 to 24 Years | 1 (0.5%) | $0 |
| 25 to 44 Years | 31 (16.9%) | $0 |
| 45 to 64 Years | 38 (20.8%) | $0 |
| 65+ Years | 113 (61.8%) | $14,422 |
| Total | 183 (100.0%) | $0 |
Poverty in Mindenmines
Income Below Poverty by Sex and Age in Mindenmines
With 41.0% poverty level for males and 56.1% for females among the residents of Mindenmines, under 5 year old males and under 5 year old females are the most vulnerable to poverty, with 30 males (100.0%) and 2 females (100.0%) in their respective age groups living below the poverty level.
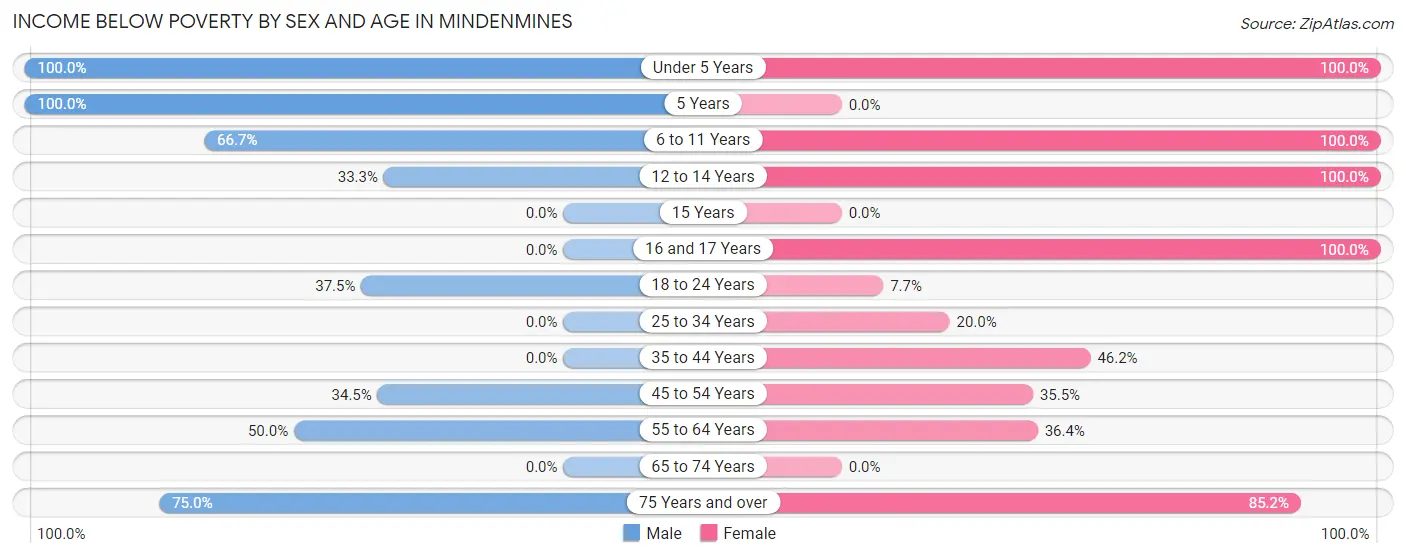
| Age Bracket | Male | Female |
| Under 5 Years | 30 (100.0%) | 2 (100.0%) |
| 5 Years | 1 (100.0%) | 0 (0.0%) |
| 6 to 11 Years | 8 (66.7%) | 2 (100.0%) |
| 12 to 14 Years | 2 (33.3%) | 6 (100.0%) |
| 15 Years | 0 (0.0%) | 0 (0.0%) |
| 16 and 17 Years | 0 (0.0%) | 8 (100.0%) |
| 18 to 24 Years | 9 (37.5%) | 1 (7.7%) |
| 25 to 34 Years | 0 (0.0%) | 1 (20.0%) |
| 35 to 44 Years | 0 (0.0%) | 12 (46.2%) |
| 45 to 54 Years | 10 (34.5%) | 11 (35.5%) |
| 55 to 64 Years | 5 (50.0%) | 8 (36.4%) |
| 65 to 74 Years | 0 (0.0%) | 0 (0.0%) |
| 75 Years and over | 6 (75.0%) | 69 (85.2%) |
| Total | 71 (41.0%) | 120 (56.1%) |
Income Above Poverty by Sex and Age in Mindenmines
According to the poverty statistics in Mindenmines, males aged 16 and 17 years and females aged 15 years are the age groups that are most secure financially, with 100.0% of males and 100.0% of females in these age groups living above the poverty line.
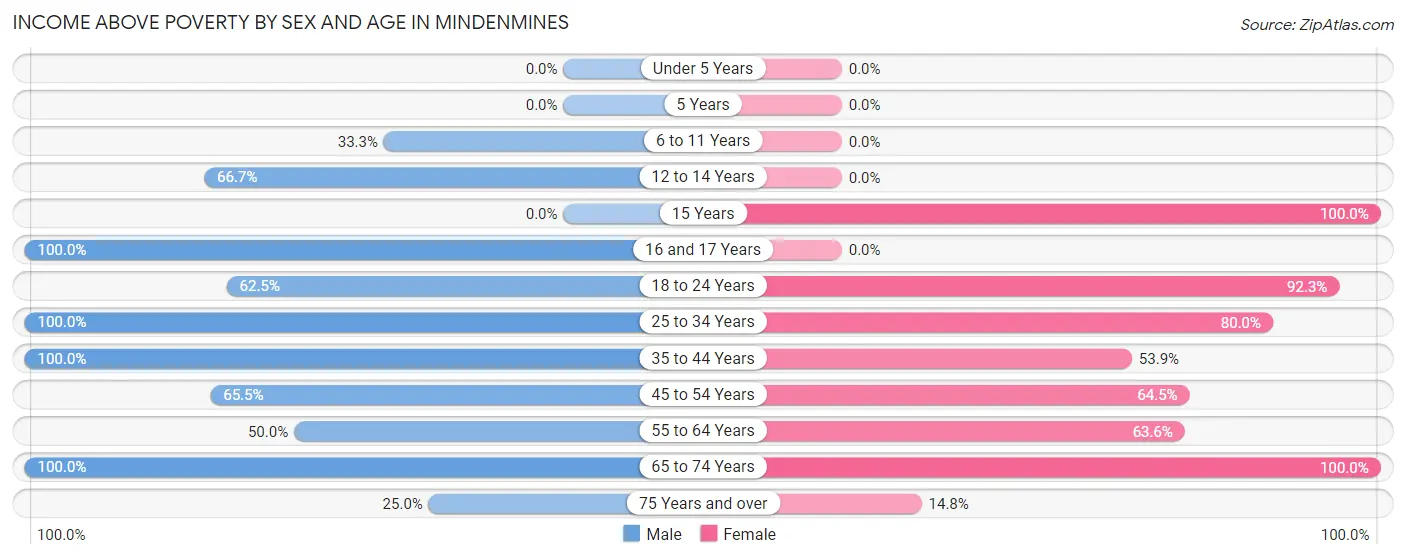
| Age Bracket | Male | Female |
| Under 5 Years | 0 (0.0%) | 0 (0.0%) |
| 5 Years | 0 (0.0%) | 0 (0.0%) |
| 6 to 11 Years | 4 (33.3%) | 0 (0.0%) |
| 12 to 14 Years | 4 (66.7%) | 0 (0.0%) |
| 15 Years | 0 (0.0%) | 1 (100.0%) |
| 16 and 17 Years | 3 (100.0%) | 0 (0.0%) |
| 18 to 24 Years | 15 (62.5%) | 12 (92.3%) |
| 25 to 34 Years | 10 (100.0%) | 4 (80.0%) |
| 35 to 44 Years | 15 (100.0%) | 14 (53.8%) |
| 45 to 54 Years | 19 (65.5%) | 20 (64.5%) |
| 55 to 64 Years | 5 (50.0%) | 14 (63.6%) |
| 65 to 74 Years | 25 (100.0%) | 17 (100.0%) |
| 75 Years and over | 2 (25.0%) | 12 (14.8%) |
| Total | 102 (59.0%) | 94 (43.9%) |
Income Below Poverty Among Married-Couple Families in Mindenmines
The poverty statistics for married-couple families in Mindenmines show that 19.4% or 14 of the total 72 families live below the poverty line. Families with 3 or 4 children have the highest poverty rate of 100.0%, comprising of 6 families. On the other hand, families with no children have the lowest poverty rate of 8.8%, which includes 5 families.
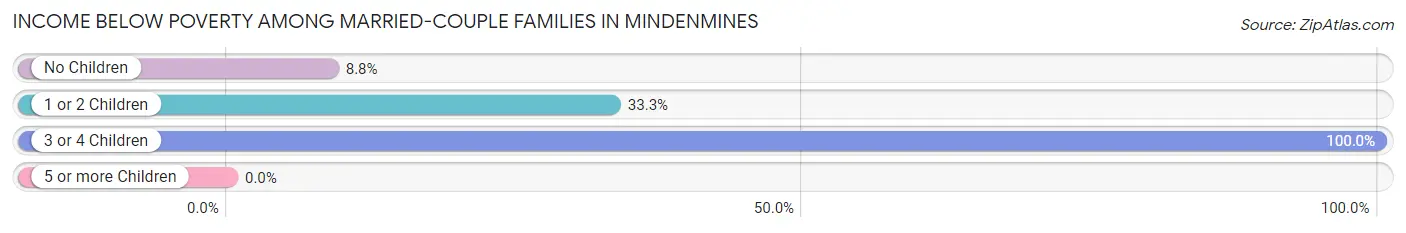
| Children | Above Poverty | Below Poverty |
| No Children | 52 (91.2%) | 5 (8.8%) |
| 1 or 2 Children | 6 (66.7%) | 3 (33.3%) |
| 3 or 4 Children | 0 (0.0%) | 6 (100.0%) |
| 5 or more Children | 0 (0.0%) | 0 (0.0%) |
| Total | 58 (80.6%) | 14 (19.4%) |
Income Below Poverty Among Single-Parent Households in Mindenmines
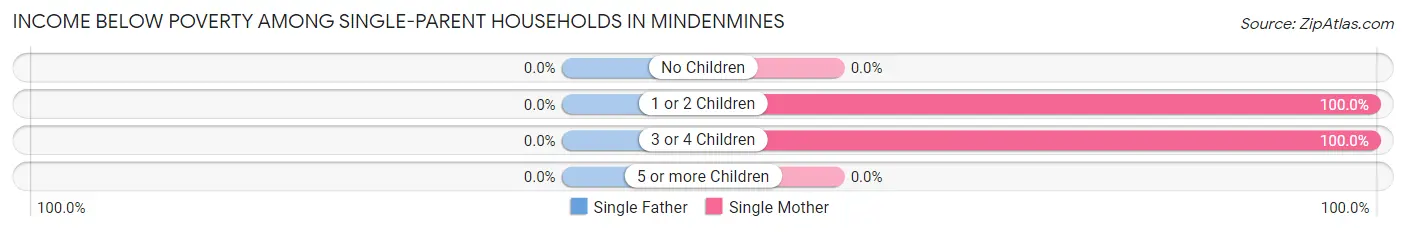
| Children | Single Father | Single Mother |
| No Children | 0 (0.0%) | 0 (0.0%) |
| 1 or 2 Children | 0 (0.0%) | 6 (100.0%) |
| 3 or 4 Children | 0 (0.0%) | 1 (100.0%) |
| 5 or more Children | 0 (0.0%) | 0 (0.0%) |
| Total | 0 (0.0%) | 7 (77.8%) |
Income Below Poverty Among Married-Couple vs Single-Parent Households in Mindenmines
The poverty data for Mindenmines shows that 14 of the married-couple family households (19.4%) and 7 of the single-parent households (70.0%) are living below the poverty level. Within the married-couple family households, those with 3 or 4 children have the highest poverty rate, with 6 households (100.0%) falling below the poverty line. Among the single-parent households, those with 1 or 2 children have the highest poverty rate, with 6 household (100.0%) living below poverty.
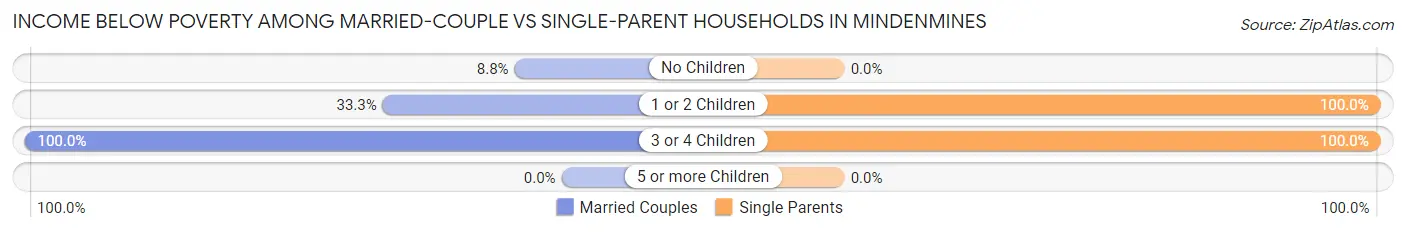
| Children | Married-Couple Families | Single-Parent Households |
| No Children | 5 (8.8%) | 0 (0.0%) |
| 1 or 2 Children | 3 (33.3%) | 6 (100.0%) |
| 3 or 4 Children | 6 (100.0%) | 1 (100.0%) |
| 5 or more Children | 0 (0.0%) | 0 (0.0%) |
| Total | 14 (19.4%) | 7 (70.0%) |
Race in Mindenmines
The most populous races in Mindenmines are White / Caucasian (322 | 83.2%), Two or more Races (60 | 15.5%), and Hispanic or Latino (53 | 13.7%).
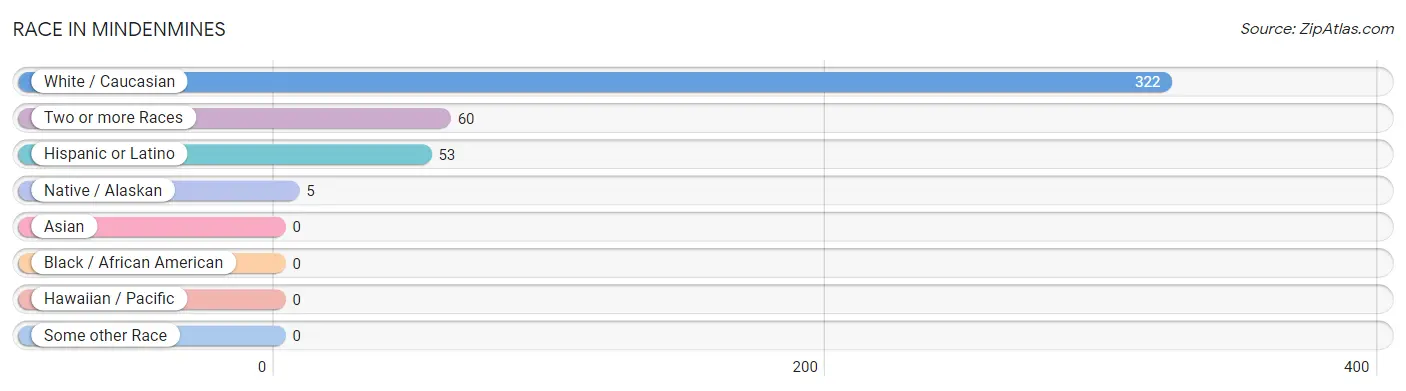
| Race | # Population | % Population |
| Asian | 0 | 0.0% |
| Black / African American | 0 | 0.0% |
| Hawaiian / Pacific | 0 | 0.0% |
| Hispanic or Latino | 53 | 13.7% |
| Native / Alaskan | 5 | 1.3% |
| White / Caucasian | 322 | 83.2% |
| Two or more Races | 60 | 15.5% |
| Some other Race | 0 | 0.0% |
| Total | 387 | 100.0% |
Ancestry in Mindenmines
The most populous ancestries reported in Mindenmines are Irish (65 | 16.8%), Cherokee (64 | 16.5%), Swiss (62 | 16.0%), Mexican (53 | 13.7%), and Cheyenne (51 | 13.2%), together accounting for 76.2% of all Mindenmines residents.
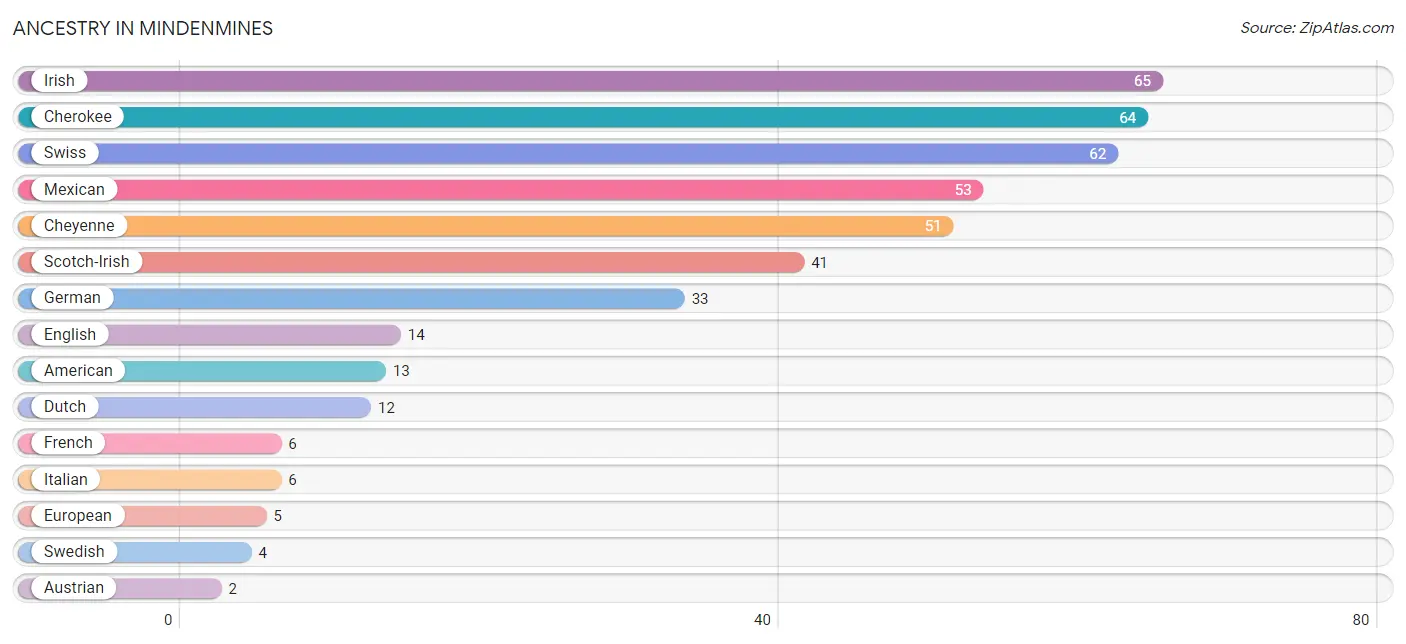
| Ancestry | # Population | % Population |
| American | 13 | 3.4% |
| Austrian | 2 | 0.5% |
| Cherokee | 64 | 16.5% |
| Cheyenne | 51 | 13.2% |
| Choctaw | 1 | 0.3% |
| Czech | 2 | 0.5% |
| Dutch | 12 | 3.1% |
| English | 14 | 3.6% |
| European | 5 | 1.3% |
| French | 6 | 1.5% |
| German | 33 | 8.5% |
| Greek | 1 | 0.3% |
| Irish | 65 | 16.8% |
| Italian | 6 | 1.5% |
| Mexican | 53 | 13.7% |
| Northern European | 1 | 0.3% |
| Polish | 2 | 0.5% |
| Scotch-Irish | 41 | 10.6% |
| Swedish | 4 | 1.0% |
| Swiss | 62 | 16.0% |
| Welsh | 1 | 0.3% | View All 21 Rows |
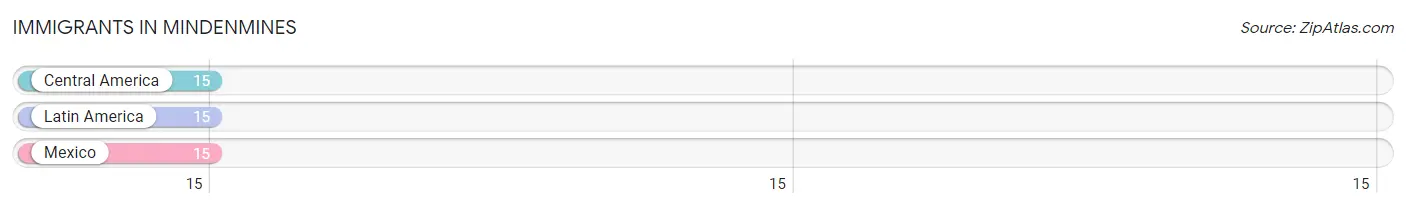
Immigrants in Mindenmines
The most numerous immigrant groups reported in Mindenmines came from Central America (15 | 3.9%), Latin America (15 | 3.9%), and Mexico (15 | 3.9%), together accounting for 11.6% of all Mindenmines residents.
| Immigration Origin | # Population | % Population |
| Central America | 15 | 3.9% |
| Latin America | 15 | 3.9% |
| Mexico | 15 | 3.9% | View All 3 Rows |
Sex and Age in Mindenmines
Sex and Age in Mindenmines
The most populous age groups in Mindenmines are Under 5 Years (30 | 17.3%) for men and 75 to 79 Years (65 | 30.4%) for women.
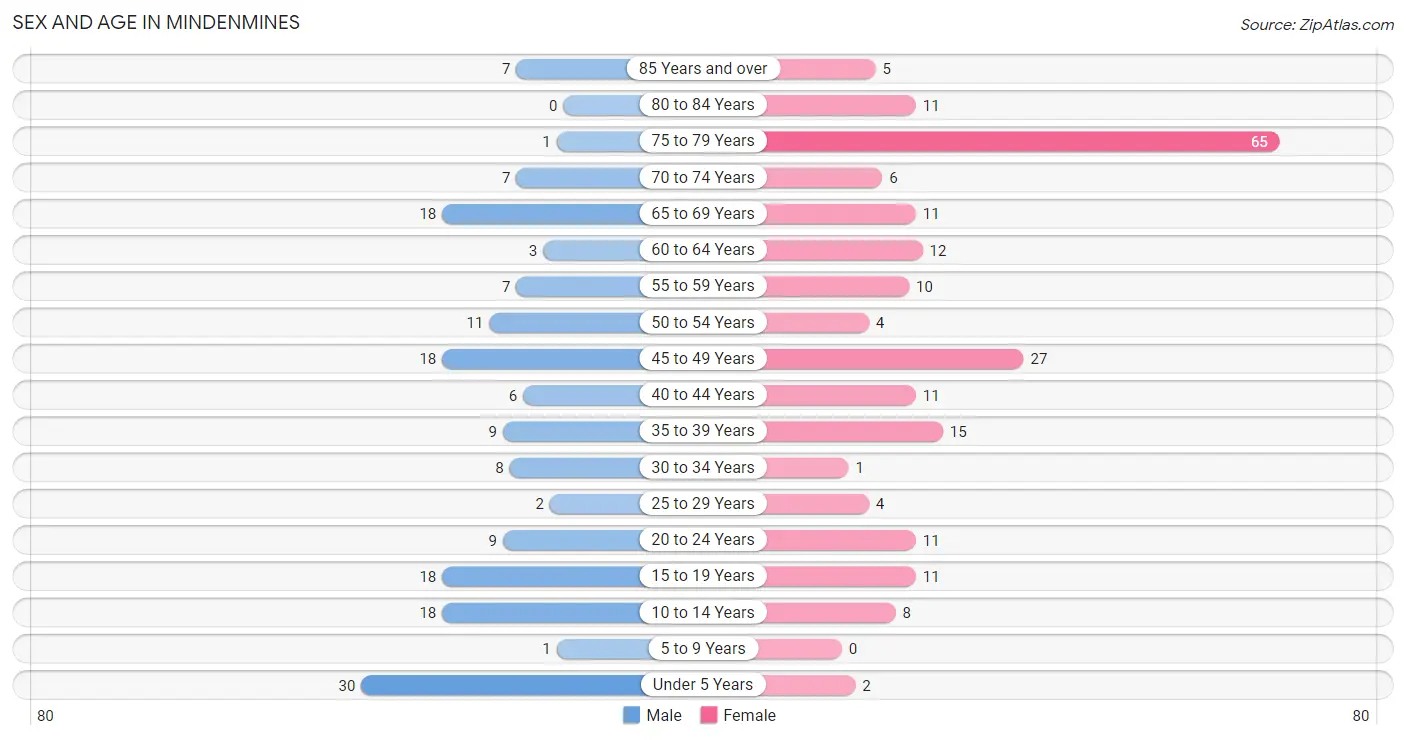
| Age Bracket | Male | Female |
| Under 5 Years | 30 (17.3%) | 2 (0.9%) |
| 5 to 9 Years | 1 (0.6%) | 0 (0.0%) |
| 10 to 14 Years | 18 (10.4%) | 8 (3.7%) |
| 15 to 19 Years | 18 (10.4%) | 11 (5.1%) |
| 20 to 24 Years | 9 (5.2%) | 11 (5.1%) |
| 25 to 29 Years | 2 (1.2%) | 4 (1.9%) |
| 30 to 34 Years | 8 (4.6%) | 1 (0.5%) |
| 35 to 39 Years | 9 (5.2%) | 15 (7.0%) |
| 40 to 44 Years | 6 (3.5%) | 11 (5.1%) |
| 45 to 49 Years | 18 (10.4%) | 27 (12.6%) |
| 50 to 54 Years | 11 (6.4%) | 4 (1.9%) |
| 55 to 59 Years | 7 (4.1%) | 10 (4.7%) |
| 60 to 64 Years | 3 (1.7%) | 12 (5.6%) |
| 65 to 69 Years | 18 (10.4%) | 11 (5.1%) |
| 70 to 74 Years | 7 (4.1%) | 6 (2.8%) |
| 75 to 79 Years | 1 (0.6%) | 65 (30.4%) |
| 80 to 84 Years | 0 (0.0%) | 11 (5.1%) |
| 85 Years and over | 7 (4.1%) | 5 (2.3%) |
| Total | 173 (100.0%) | 214 (100.0%) |
Families and Households in Mindenmines
Median Family Size in Mindenmines
The median family size in Mindenmines is 3.29 persons per family, with single female/mother families (9 | 11.0%) accounting for the largest median family size of 4.78 persons per family. On the other hand, married-couple families (72 | 87.8%) represent the smallest median family size with 3.10 persons per family.
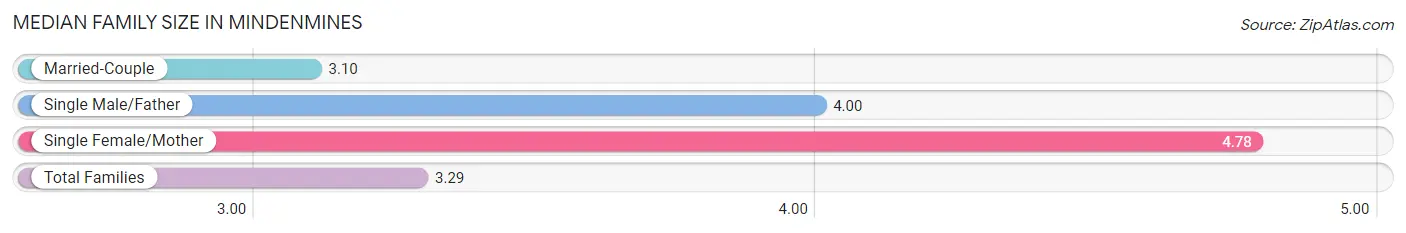
| Family Type | # Families | Family Size |
| Married-Couple | 72 (87.8%) | 3.10 |
| Single Male/Father | 1 (1.2%) | 4.00 |
| Single Female/Mother | 9 (11.0%) | 4.78 |
| Total Families | 82 (100.0%) | 3.29 |
Median Household Size in Mindenmines
The median household size in Mindenmines is 2.11 persons per household, with single female/mother households (9 | 4.9%) accounting for the largest median household size of 4.78 persons per household. non-family households (101 | 55.2%) represent the smallest median household size with 1.08 persons per household.
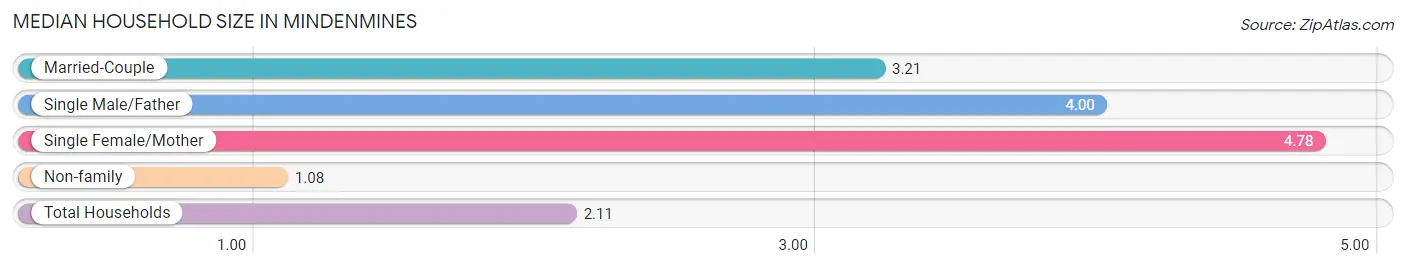
| Household Type | # Households | Household Size |
| Married-Couple | 72 (39.3%) | 3.21 |
| Single Male/Father | 1 (0.5%) | 4.00 |
| Single Female/Mother | 9 (4.9%) | 4.78 |
| Non-family | 101 (55.2%) | 1.08 |
| Total Households | 183 (100.0%) | 2.11 |
Household Size by Marriage Status in Mindenmines
Out of a total of 183 households in Mindenmines, 82 (44.8%) are family households, while 101 (55.2%) are nonfamily households. The most numerous type of family households are 2-person households, comprising 46, and the most common type of nonfamily households are 1-person households, comprising 99.
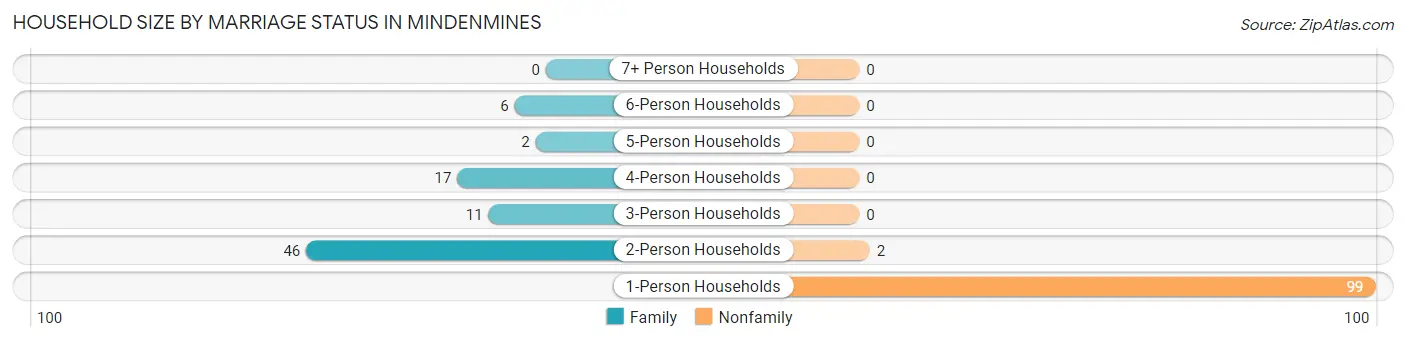
| Household Size | Family Households | Nonfamily Households |
| 1-Person Households | - | 99 (54.1%) |
| 2-Person Households | 46 (25.1%) | 2 (1.1%) |
| 3-Person Households | 11 (6.0%) | 0 (0.0%) |
| 4-Person Households | 17 (9.3%) | 0 (0.0%) |
| 5-Person Households | 2 (1.1%) | 0 (0.0%) |
| 6-Person Households | 6 (3.3%) | 0 (0.0%) |
| 7+ Person Households | 0 (0.0%) | 0 (0.0%) |
| Total | 82 (44.8%) | 101 (55.2%) |
Female Fertility in Mindenmines
Fertility by Age in Mindenmines
| Age Bracket | Women with Births | Births / 1,000 Women |
| 15 to 19 years | 0 (0.0%) | 0.0 |
| 20 to 34 years | 0 (0.0%) | 0.0 |
| 35 to 50 years | 0 (0.0%) | 0.0 |
| Total | 0 (0.0%) | 0.0 |
Fertility by Age by Marriage Status in Mindenmines
| Age Bracket | Married | Unmarried |
| 15 to 19 years | 0 (0.0%) | 0 (0.0%) |
| 20 to 34 years | 0 (0.0%) | 0 (0.0%) |
| 35 to 50 years | 0 (0.0%) | 0 (0.0%) |
| Total | 0 (0.0%) | 0 (0.0%) |
Fertility by Education in Mindenmines
| Educational Attainment | Women with Births | Births / 1,000 Women |
| Less than High School | 0 (0.0%) | 0.0 |
| High School Diploma | 0 (0.0%) | 0.0 |
| College or Associate's Degree | 0 (0.0%) | 0.0 |
| Bachelor's Degree | 0 (0.0%) | 0.0 |
| Graduate Degree | 0 (0.0%) | 0.0 |
| Total | 0 (0.0%) | 0.0 |
Fertility by Education by Marriage Status in Mindenmines
| Educational Attainment | Married | Unmarried |
| Less than High School | 0 (0.0%) | 0 (0.0%) |
| High School Diploma | 0 (0.0%) | 0 (0.0%) |
| College or Associate's Degree | 0 (0.0%) | 0 (0.0%) |
| Bachelor's Degree | 0 (0.0%) | 0 (0.0%) |
| Graduate Degree | 0 (0.0%) | 0 (0.0%) |
| Total | 0 (0.0%) | 0 (0.0%) |
Employment Characteristics in Mindenmines
Employment by Class of Employer in Mindenmines
Among the 106 employed individuals in Mindenmines, private company employees (76 | 71.7%), state government employees (15 | 14.1%), and not-for-profit organizations (6 | 5.7%) make up the most common classes of employment.
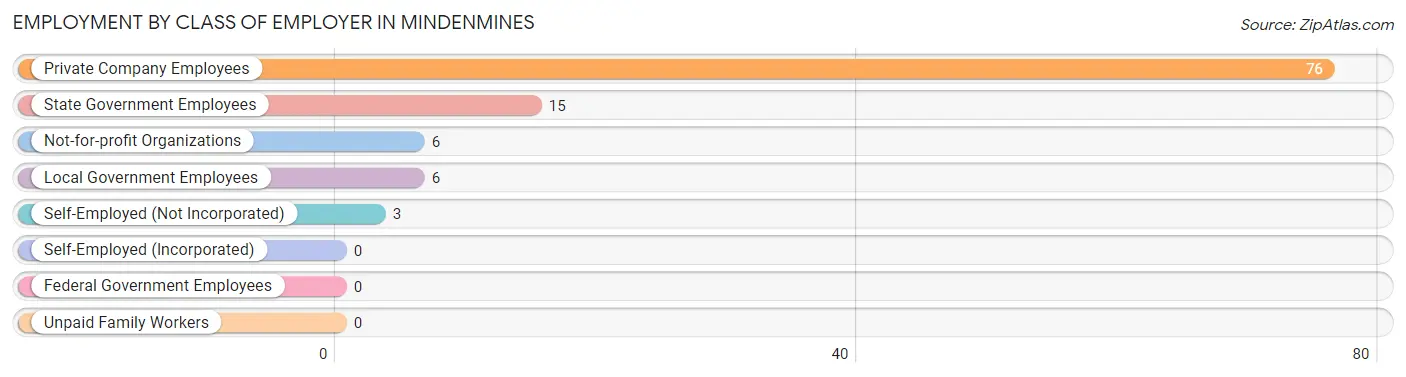
| Employer Class | # Employees | % Employees |
| Private Company Employees | 76 | 71.7% |
| Self-Employed (Incorporated) | 0 | 0.0% |
| Self-Employed (Not Incorporated) | 3 | 2.8% |
| Not-for-profit Organizations | 6 | 5.7% |
| Local Government Employees | 6 | 5.7% |
| State Government Employees | 15 | 14.1% |
| Federal Government Employees | 0 | 0.0% |
| Unpaid Family Workers | 0 | 0.0% |
| Total | 106 | 100.0% |
Employment Status by Age in Mindenmines
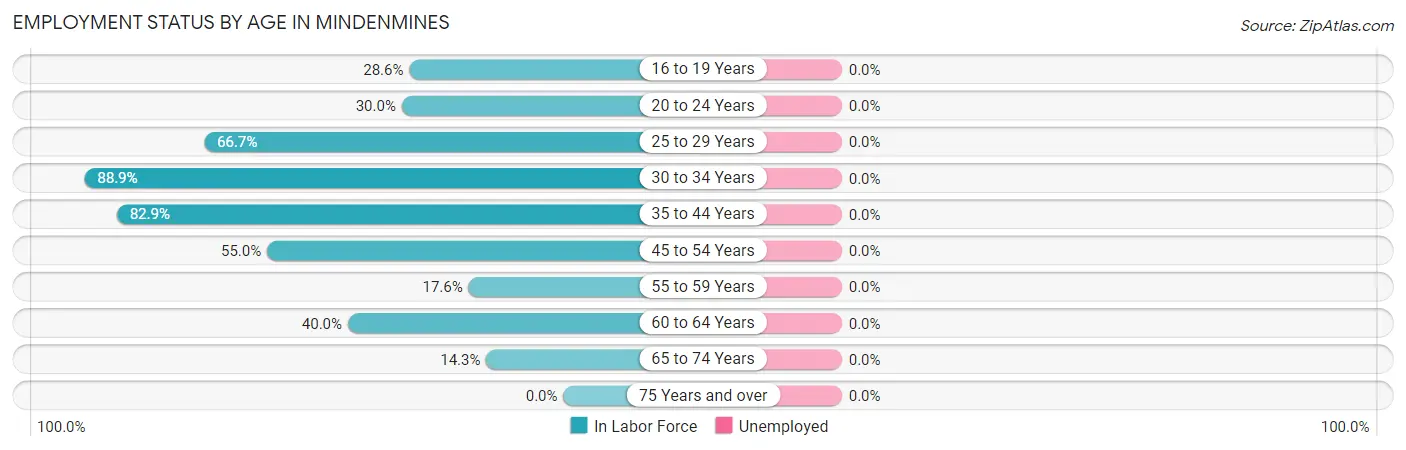
| Age Bracket | In Labor Force | Unemployed |
| 16 to 19 Years | 8 (28.6%) | 0 (0.0%) |
| 20 to 24 Years | 6 (30.0%) | 0 (0.0%) |
| 25 to 29 Years | 4 (66.7%) | 0 (0.0%) |
| 30 to 34 Years | 8 (88.9%) | 0 (0.0%) |
| 35 to 44 Years | 34 (82.9%) | 0 (0.0%) |
| 45 to 54 Years | 33 (55.0%) | 0 (0.0%) |
| 55 to 59 Years | 3 (17.6%) | 0 (0.0%) |
| 60 to 64 Years | 6 (40.0%) | 0 (0.0%) |
| 65 to 74 Years | 6 (14.3%) | 0 (0.0%) |
| 75 Years and over | 0 (0.0%) | 0 (0.0%) |
| Total | 108 (33.0%) | 0 (0.0%) |
Employment Status by Educational Attainment in Mindenmines
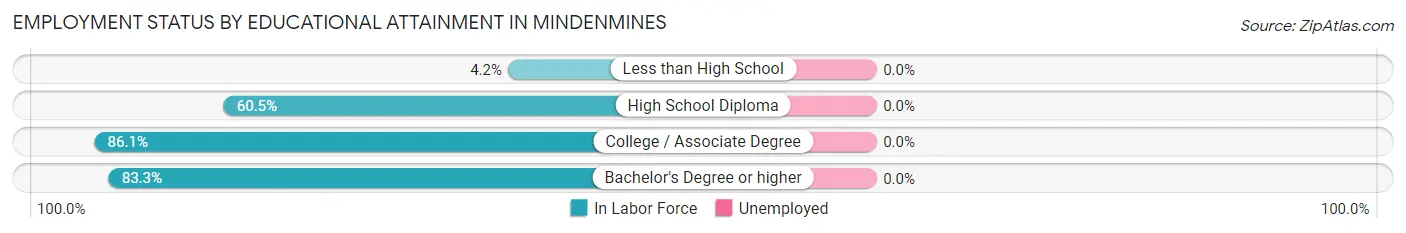
| Educational Attainment | In Labor Force | Unemployed |
| Less than High School | 1 (4.2%) | 0 (0.0%) |
| High School Diploma | 46 (60.5%) | 0 (0.0%) |
| College / Associate Degree | 31 (86.1%) | 0 (0.0%) |
| Bachelor's Degree or higher | 10 (83.3%) | 0 (0.0%) |
| Total | 88 (59.5%) | 0 (0.0%) |
Employment Occupations by Sex in Mindenmines
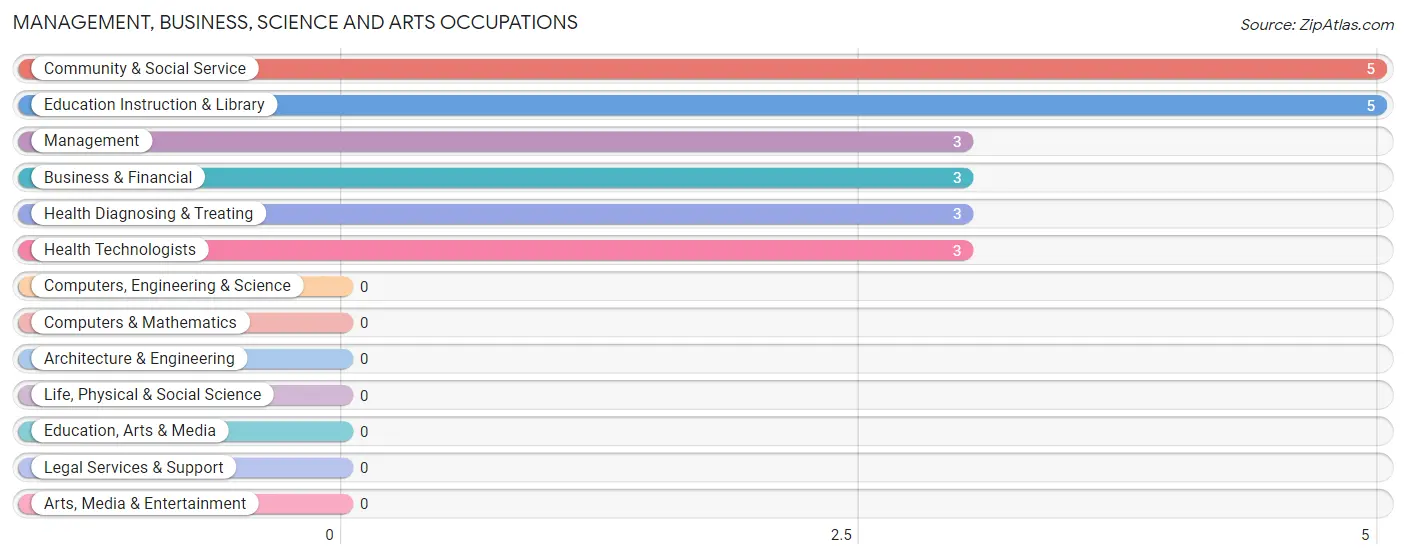
Management, Business, Science and Arts Occupations
The most common Management, Business, Science and Arts occupations in Mindenmines are Community & Social Service (5 | 4.6%), Education Instruction & Library (5 | 4.6%), Management (3 | 2.8%), Business & Financial (3 | 2.8%), and Health Diagnosing & Treating (3 | 2.8%).
Management, Business, Science and Arts Occupations by Sex
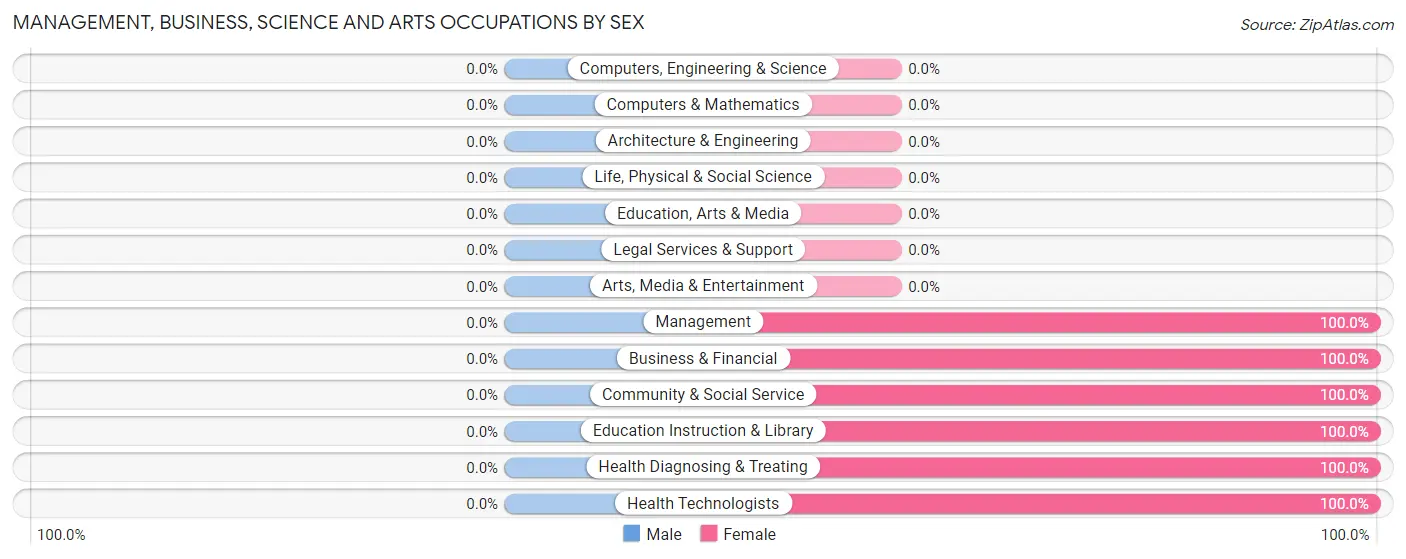
| Occupation | Male | Female |
| Management | 0 (0.0%) | 3 (100.0%) |
| Business & Financial | 0 (0.0%) | 3 (100.0%) |
| Computers, Engineering & Science | 0 (0.0%) | 0 (0.0%) |
| Computers & Mathematics | 0 (0.0%) | 0 (0.0%) |
| Architecture & Engineering | 0 (0.0%) | 0 (0.0%) |
| Life, Physical & Social Science | 0 (0.0%) | 0 (0.0%) |
| Community & Social Service | 0 (0.0%) | 5 (100.0%) |
| Education, Arts & Media | 0 (0.0%) | 0 (0.0%) |
| Legal Services & Support | 0 (0.0%) | 0 (0.0%) |
| Education Instruction & Library | 0 (0.0%) | 5 (100.0%) |
| Arts, Media & Entertainment | 0 (0.0%) | 0 (0.0%) |
| Health Diagnosing & Treating | 0 (0.0%) | 3 (100.0%) |
| Health Technologists | 0 (0.0%) | 3 (100.0%) |
| Total (Category) | 0 (0.0%) | 14 (100.0%) |
| Total (Overall) | 58 (53.7%) | 50 (46.3%) |
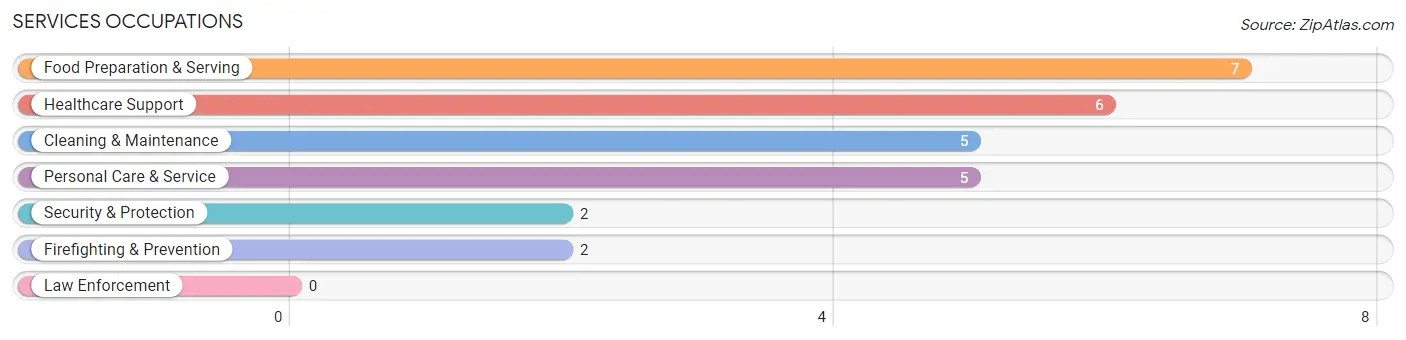
Services Occupations
The most common Services occupations in Mindenmines are Food Preparation & Serving (7 | 6.5%), Healthcare Support (6 | 5.6%), Cleaning & Maintenance (5 | 4.6%), Personal Care & Service (5 | 4.6%), and Security & Protection (2 | 1.8%).
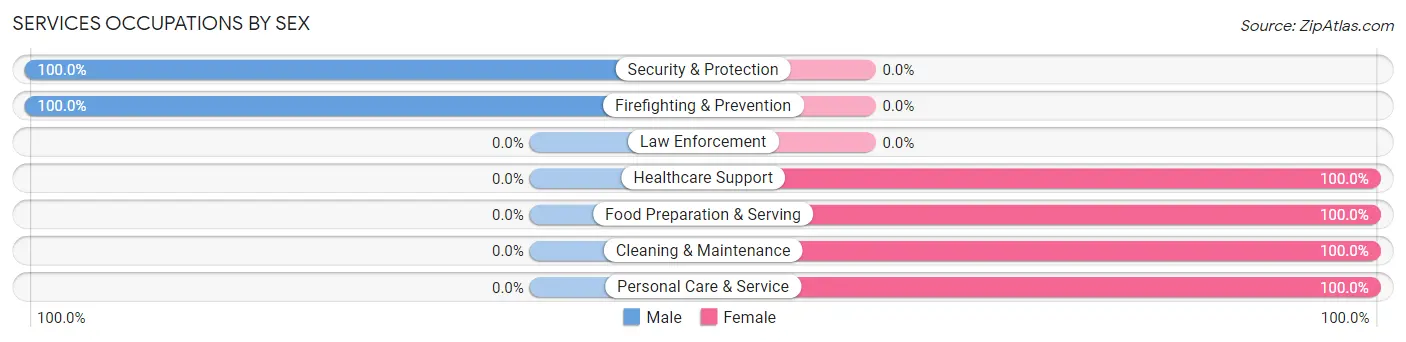
Services Occupations by Sex
Within the Services occupations in Mindenmines, the most male-oriented occupations are Security & Protection (100.0%), and Firefighting & Prevention (100.0%), while the most female-oriented occupations are Healthcare Support (100.0%), Food Preparation & Serving (100.0%), and Cleaning & Maintenance (100.0%).
| Occupation | Male | Female |
| Healthcare Support | 0 (0.0%) | 6 (100.0%) |
| Security & Protection | 2 (100.0%) | 0 (0.0%) |
| Firefighting & Prevention | 2 (100.0%) | 0 (0.0%) |
| Law Enforcement | 0 (0.0%) | 0 (0.0%) |
| Food Preparation & Serving | 0 (0.0%) | 7 (100.0%) |
| Cleaning & Maintenance | 0 (0.0%) | 5 (100.0%) |
| Personal Care & Service | 0 (0.0%) | 5 (100.0%) |
| Total (Category) | 2 (8.0%) | 23 (92.0%) |
| Total (Overall) | 58 (53.7%) | 50 (46.3%) |
Sales and Office Occupations
The most common Sales and Office occupations in Mindenmines are , and Office & Administration (16 | 14.8%).
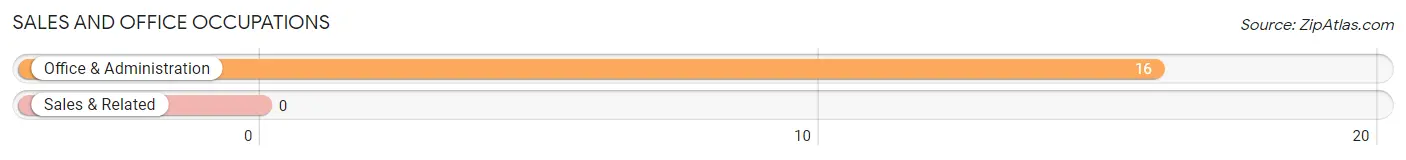
Sales and Office Occupations by Sex
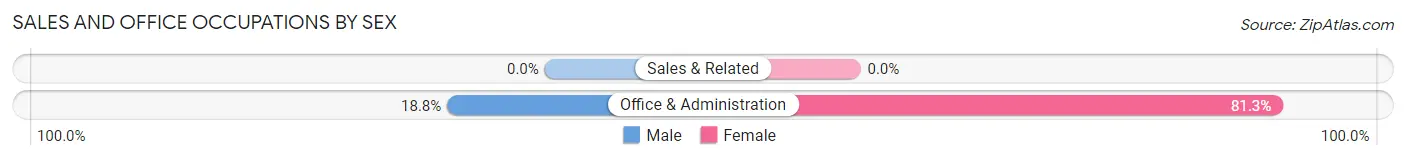
| Occupation | Male | Female |
| Sales & Related | 0 (0.0%) | 0 (0.0%) |
| Office & Administration | 3 (18.8%) | 13 (81.2%) |
| Total (Category) | 3 (18.8%) | 13 (81.2%) |
| Total (Overall) | 58 (53.7%) | 50 (46.3%) |
Natural Resources, Construction and Maintenance Occupations
The most common Natural Resources, Construction and Maintenance occupations in Mindenmines are Construction & Extraction (17 | 15.7%), Installation, Maintenance & Repair (16 | 14.8%), and Farming, Fishing & Forestry (4 | 3.7%).
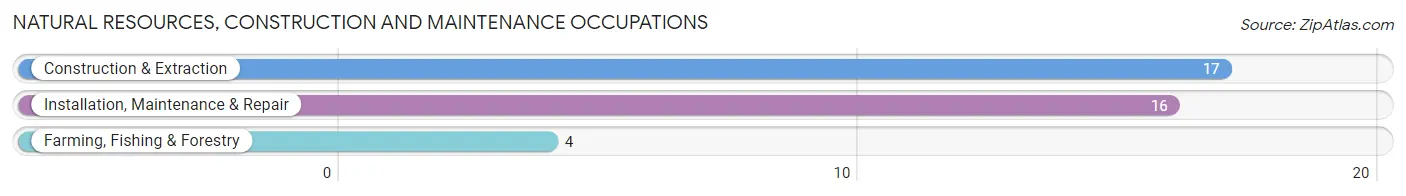
Natural Resources, Construction and Maintenance Occupations by Sex
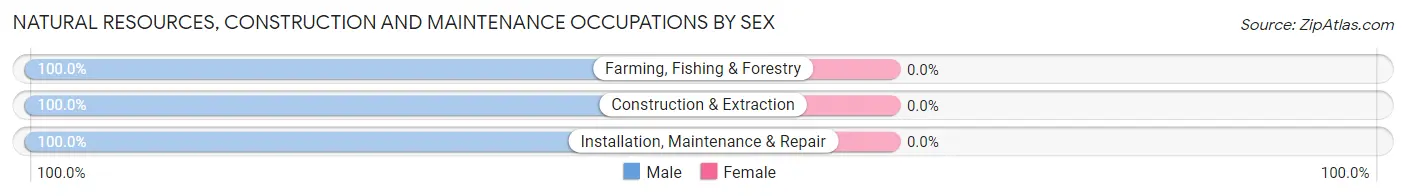
| Occupation | Male | Female |
| Farming, Fishing & Forestry | 4 (100.0%) | 0 (0.0%) |
| Construction & Extraction | 17 (100.0%) | 0 (0.0%) |
| Installation, Maintenance & Repair | 16 (100.0%) | 0 (0.0%) |
| Total (Category) | 37 (100.0%) | 0 (0.0%) |
| Total (Overall) | 58 (53.7%) | 50 (46.3%) |
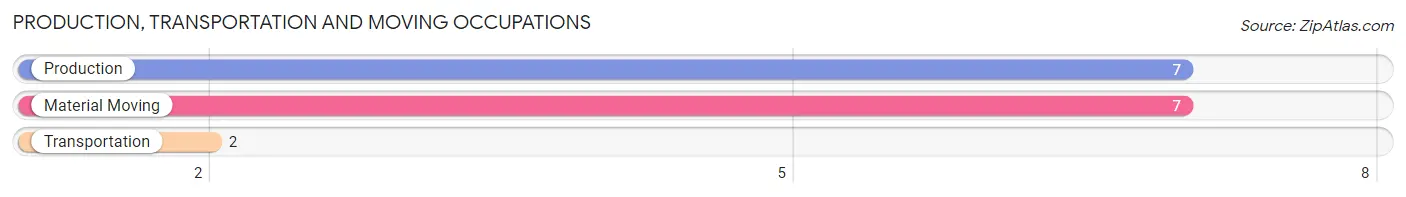
Production, Transportation and Moving Occupations
The most common Production, Transportation and Moving occupations in Mindenmines are Production (7 | 6.5%), Material Moving (7 | 6.5%), and Transportation (2 | 1.8%).
Production, Transportation and Moving Occupations by Sex
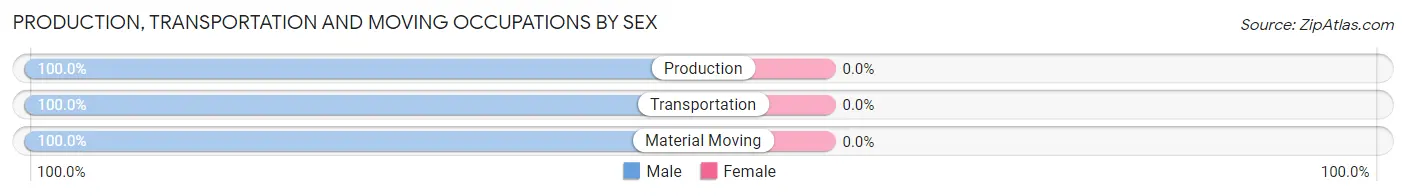
| Occupation | Male | Female |
| Production | 7 (100.0%) | 0 (0.0%) |
| Transportation | 2 (100.0%) | 0 (0.0%) |
| Material Moving | 7 (100.0%) | 0 (0.0%) |
| Total (Category) | 16 (100.0%) | 0 (0.0%) |
| Total (Overall) | 58 (53.7%) | 50 (46.3%) |
Employment Industries by Sex in Mindenmines
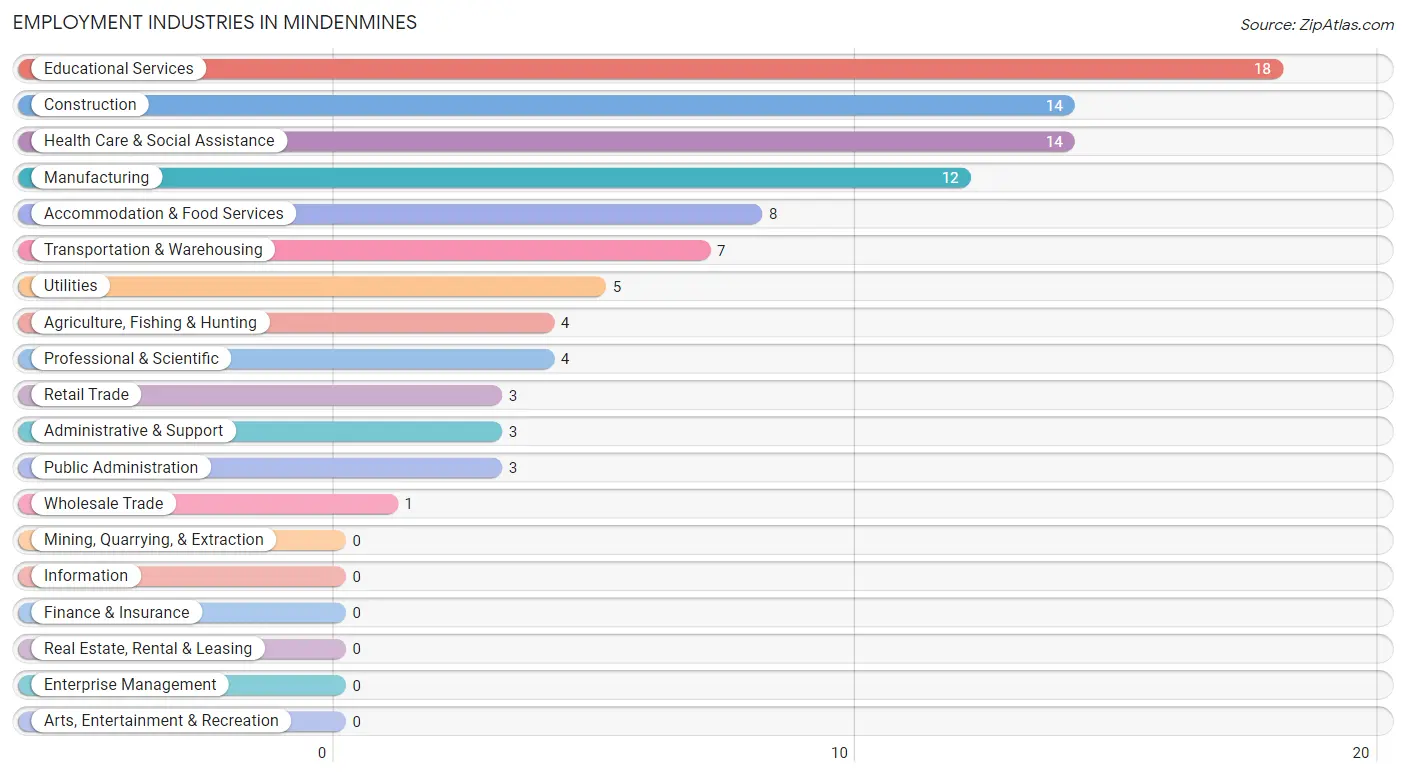
Employment Industries in Mindenmines
The major employment industries in Mindenmines include Educational Services (18 | 16.7%), Construction (14 | 13.0%), Health Care & Social Assistance (14 | 13.0%), Manufacturing (12 | 11.1%), and Accommodation & Food Services (8 | 7.4%).
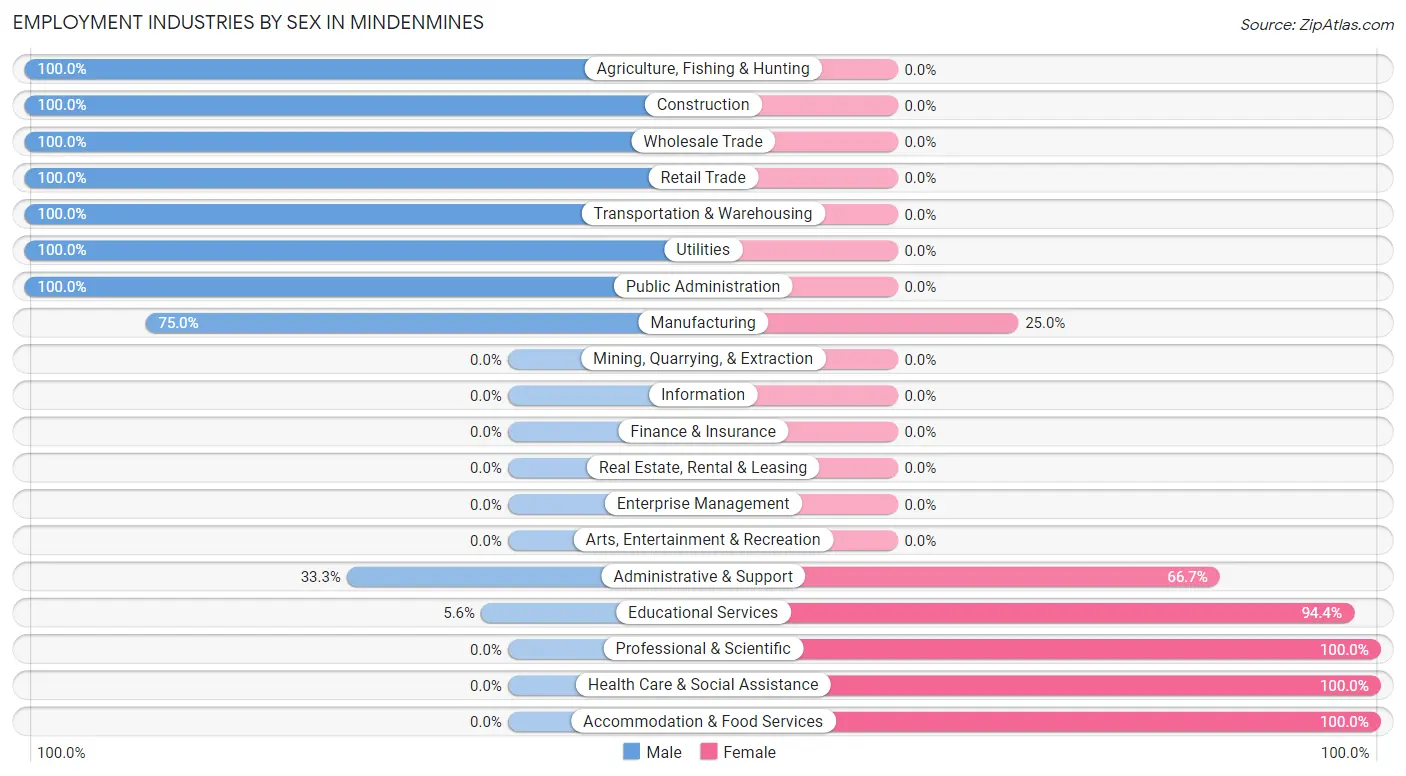
Employment Industries by Sex in Mindenmines
The Mindenmines industries that see more men than women are Agriculture, Fishing & Hunting (100.0%), Construction (100.0%), and Wholesale Trade (100.0%), whereas the industries that tend to have a higher number of women are Professional & Scientific (100.0%), Health Care & Social Assistance (100.0%), and Accommodation & Food Services (100.0%).
| Industry | Male | Female |
| Agriculture, Fishing & Hunting | 4 (100.0%) | 0 (0.0%) |
| Mining, Quarrying, & Extraction | 0 (0.0%) | 0 (0.0%) |
| Construction | 14 (100.0%) | 0 (0.0%) |
| Manufacturing | 9 (75.0%) | 3 (25.0%) |
| Wholesale Trade | 1 (100.0%) | 0 (0.0%) |
| Retail Trade | 3 (100.0%) | 0 (0.0%) |
| Transportation & Warehousing | 7 (100.0%) | 0 (0.0%) |
| Utilities | 5 (100.0%) | 0 (0.0%) |
| Information | 0 (0.0%) | 0 (0.0%) |
| Finance & Insurance | 0 (0.0%) | 0 (0.0%) |
| Real Estate, Rental & Leasing | 0 (0.0%) | 0 (0.0%) |
| Professional & Scientific | 0 (0.0%) | 4 (100.0%) |
| Enterprise Management | 0 (0.0%) | 0 (0.0%) |
| Administrative & Support | 1 (33.3%) | 2 (66.7%) |
| Educational Services | 1 (5.6%) | 17 (94.4%) |
| Health Care & Social Assistance | 0 (0.0%) | 14 (100.0%) |
| Arts, Entertainment & Recreation | 0 (0.0%) | 0 (0.0%) |
| Accommodation & Food Services | 0 (0.0%) | 8 (100.0%) |
| Public Administration | 3 (100.0%) | 0 (0.0%) |
| Total | 58 (53.7%) | 50 (46.3%) |
Education in Mindenmines
School Enrollment in Mindenmines
The most common levels of schooling among the 61 students in Mindenmines are middle school (26 | 42.6%), high school (21 | 34.4%), and college / undergraduate (10 | 16.4%).
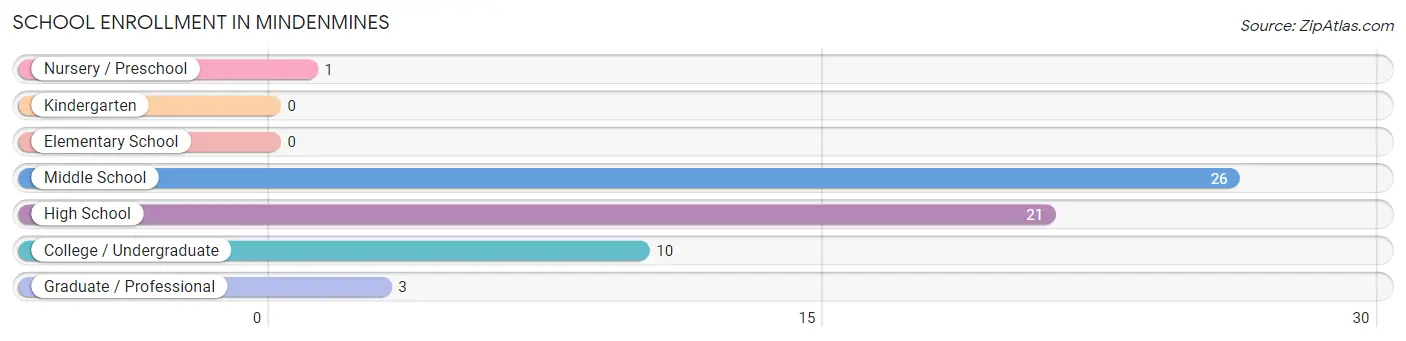
| School Level | # Students | % Students |
| Nursery / Preschool | 1 | 1.6% |
| Kindergarten | 0 | 0.0% |
| Elementary School | 0 | 0.0% |
| Middle School | 26 | 42.6% |
| High School | 21 | 34.4% |
| College / Undergraduate | 10 | 16.4% |
| Graduate / Professional | 3 | 4.9% |
| Total | 61 | 100.0% |
School Enrollment by Age by Funding Source in Mindenmines
Out of a total of 61 students who are enrolled in schools in Mindenmines, 1 (1.6%) attend a private institution, while the remaining 60 (98.4%) are enrolled in public schools. The age group of 20 to 24 year olds has the highest likelihood of being enrolled in private schools, with 1 (20.0% in the age bracket) enrolled. Conversely, the age group of 5 to 9 year old has the lowest likelihood of being enrolled in a private school, with 1 (100.0% in the age bracket) attending a public institution.
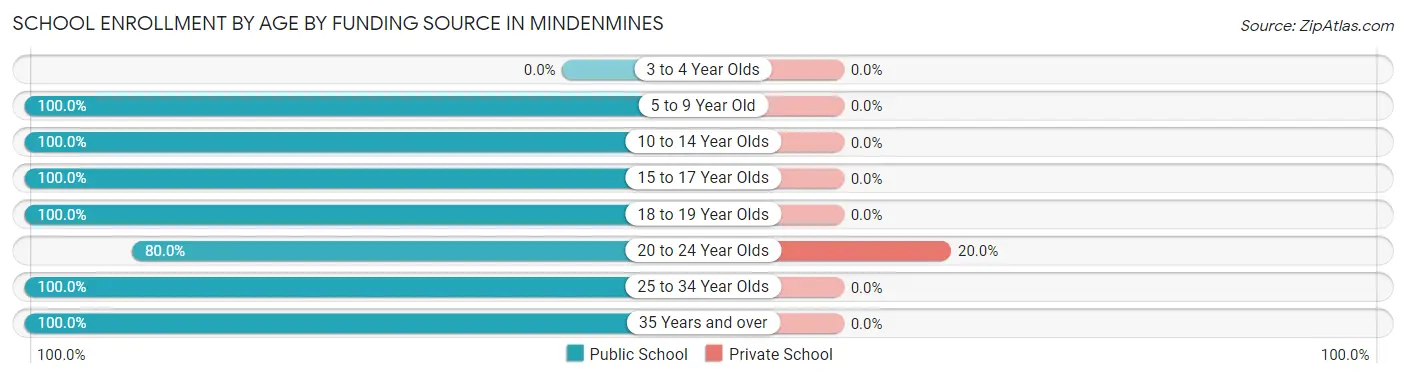
| Age Bracket | Public School | Private School |
| 3 to 4 Year Olds | 0 (0.0%) | 0 (0.0%) |
| 5 to 9 Year Old | 1 (100.0%) | 0 (0.0%) |
| 10 to 14 Year Olds | 26 (100.0%) | 0 (0.0%) |
| 15 to 17 Year Olds | 12 (100.0%) | 0 (0.0%) |
| 18 to 19 Year Olds | 9 (100.0%) | 0 (0.0%) |
| 20 to 24 Year Olds | 4 (80.0%) | 1 (20.0%) |
| 25 to 34 Year Olds | 4 (100.0%) | 0 (0.0%) |
| 35 Years and over | 4 (100.0%) | 0 (0.0%) |
| Total | 60 (98.4%) | 1 (1.6%) |
Educational Attainment by Field of Study in Mindenmines
Education (15 | 53.6%), science & technology (3 | 10.7%), business (3 | 10.7%), psychology (2 | 7.1%), and literature & languages (2 | 7.1%) are the most common fields of study among 28 individuals in Mindenmines who have obtained a bachelor's degree or higher.
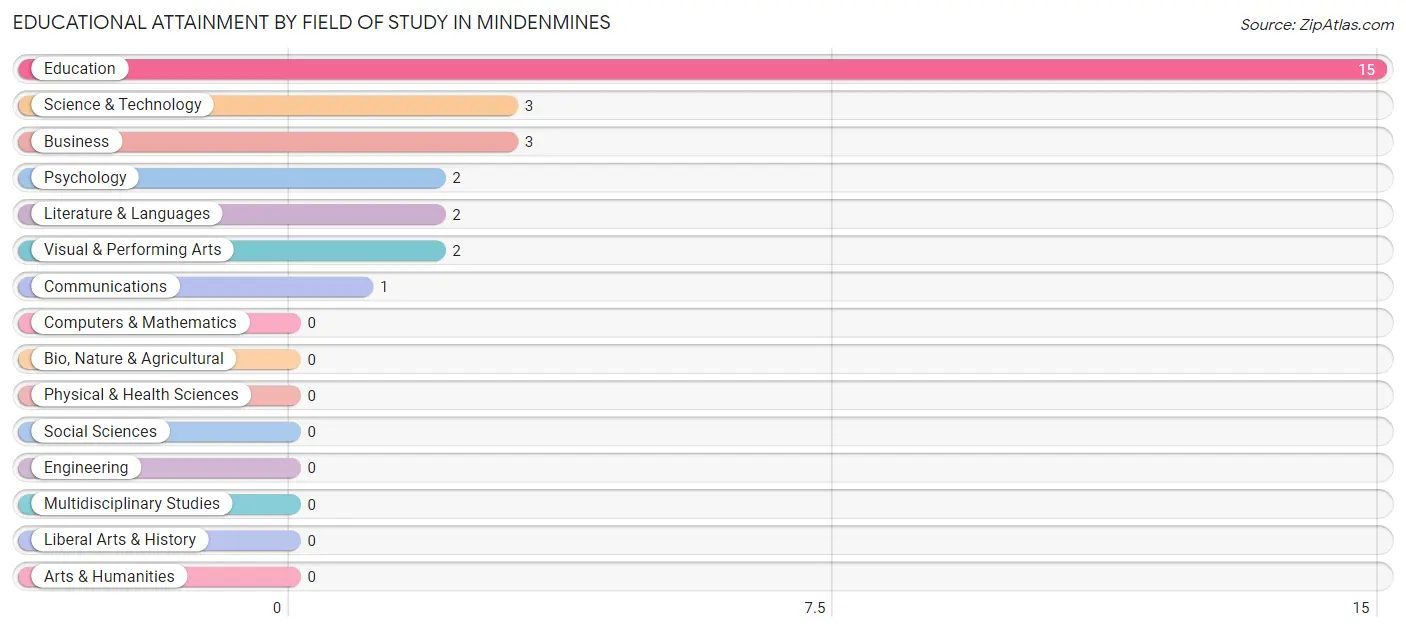
| Field of Study | # Graduates | % Graduates |
| Computers & Mathematics | 0 | 0.0% |
| Bio, Nature & Agricultural | 0 | 0.0% |
| Physical & Health Sciences | 0 | 0.0% |
| Psychology | 2 | 7.1% |
| Social Sciences | 0 | 0.0% |
| Engineering | 0 | 0.0% |
| Multidisciplinary Studies | 0 | 0.0% |
| Science & Technology | 3 | 10.7% |
| Business | 3 | 10.7% |
| Education | 15 | 53.6% |
| Literature & Languages | 2 | 7.1% |
| Liberal Arts & History | 0 | 0.0% |
| Visual & Performing Arts | 2 | 7.1% |
| Communications | 1 | 3.6% |
| Arts & Humanities | 0 | 0.0% |
| Total | 28 | 100.0% |
Transportation & Commute in Mindenmines
Vehicle Availability by Sex in Mindenmines
The most prevalent vehicle ownership categories in Mindenmines are males with 2 vehicles (18, accounting for 31.0%) and females with 2 vehicles (15, making up 37.5%).
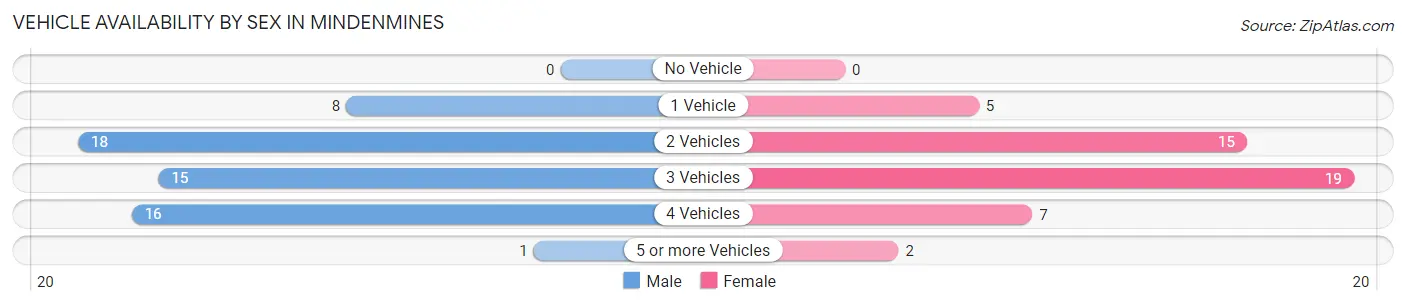
| Vehicles Available | Male | Female |
| No Vehicle | 0 (0.0%) | 0 (0.0%) |
| 1 Vehicle | 8 (13.8%) | 5 (10.4%) |
| 2 Vehicles | 18 (31.0%) | 15 (31.2%) |
| 3 Vehicles | 15 (25.9%) | 19 (39.6%) |
| 4 Vehicles | 16 (27.6%) | 7 (14.6%) |
| 5 or more Vehicles | 1 (1.7%) | 2 (4.2%) |
| Total | 58 (100.0%) | 48 (100.0%) |
Commute Time in Mindenmines
The most frequently occuring commute durations in Mindenmines are 15 to 19 minutes (33 commuters, 32.4%), 20 to 24 minutes (25 commuters, 24.5%), and 10 to 14 minutes (18 commuters, 17.6%).
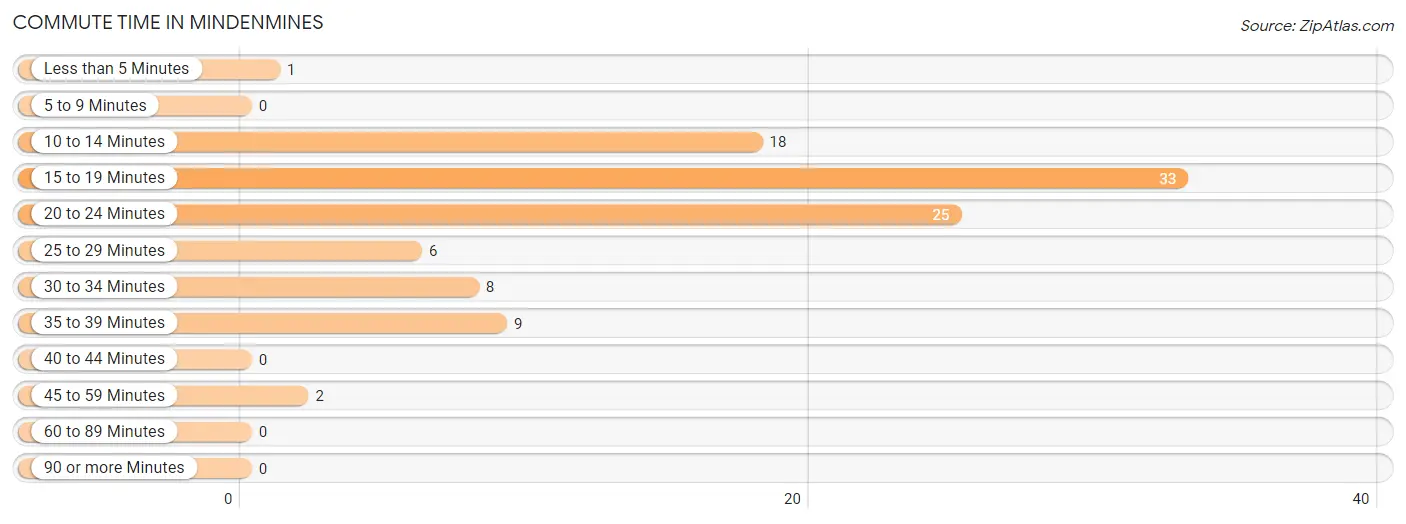
| Commute Time | # Commuters | % Commuters |
| Less than 5 Minutes | 1 | 1.0% |
| 5 to 9 Minutes | 0 | 0.0% |
| 10 to 14 Minutes | 18 | 17.6% |
| 15 to 19 Minutes | 33 | 32.4% |
| 20 to 24 Minutes | 25 | 24.5% |
| 25 to 29 Minutes | 6 | 5.9% |
| 30 to 34 Minutes | 8 | 7.8% |
| 35 to 39 Minutes | 9 | 8.8% |
| 40 to 44 Minutes | 0 | 0.0% |
| 45 to 59 Minutes | 2 | 2.0% |
| 60 to 89 Minutes | 0 | 0.0% |
| 90 or more Minutes | 0 | 0.0% |
Commute Time by Sex in Mindenmines
The most common commute times in Mindenmines are 10 to 14 minutes (16 commuters, 29.1%) for males and 15 to 19 minutes (24 commuters, 51.1%) for females.
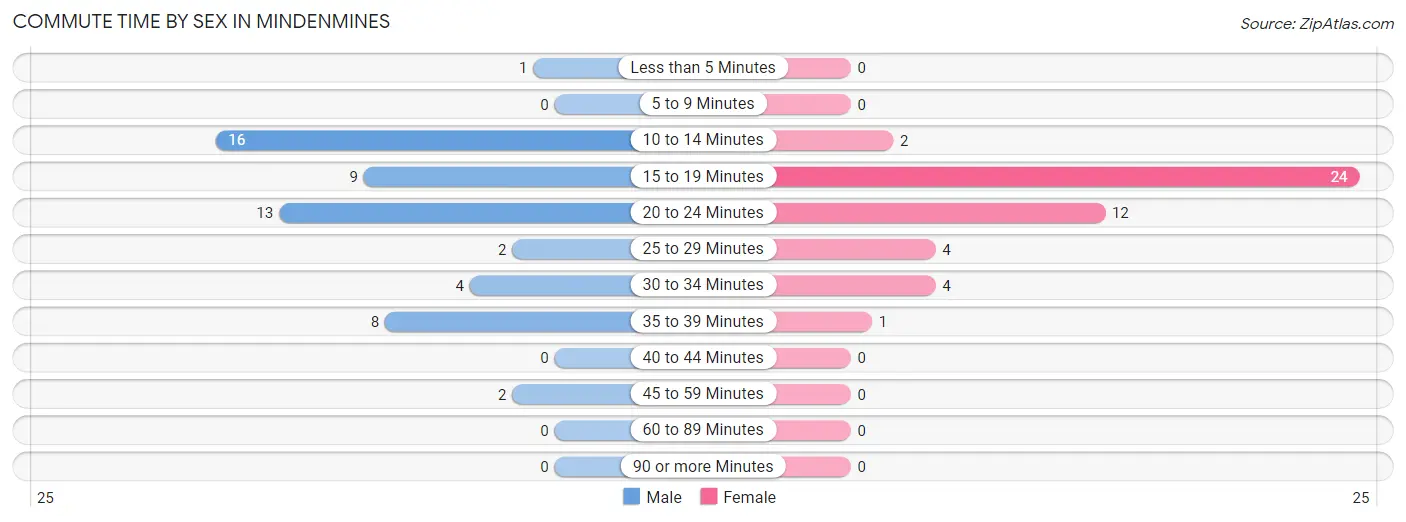
| Commute Time | Male | Female |
| Less than 5 Minutes | 1 (1.8%) | 0 (0.0%) |
| 5 to 9 Minutes | 0 (0.0%) | 0 (0.0%) |
| 10 to 14 Minutes | 16 (29.1%) | 2 (4.3%) |
| 15 to 19 Minutes | 9 (16.4%) | 24 (51.1%) |
| 20 to 24 Minutes | 13 (23.6%) | 12 (25.5%) |
| 25 to 29 Minutes | 2 (3.6%) | 4 (8.5%) |
| 30 to 34 Minutes | 4 (7.3%) | 4 (8.5%) |
| 35 to 39 Minutes | 8 (14.5%) | 1 (2.1%) |
| 40 to 44 Minutes | 0 (0.0%) | 0 (0.0%) |
| 45 to 59 Minutes | 2 (3.6%) | 0 (0.0%) |
| 60 to 89 Minutes | 0 (0.0%) | 0 (0.0%) |
| 90 or more Minutes | 0 (0.0%) | 0 (0.0%) |
Time of Departure to Work by Sex in Mindenmines
The most frequent times of departure to work in Mindenmines are 6:00 AM to 6:29 AM (18, 32.7%) for males and 6:30 AM to 6:59 AM (12, 25.5%) for females.
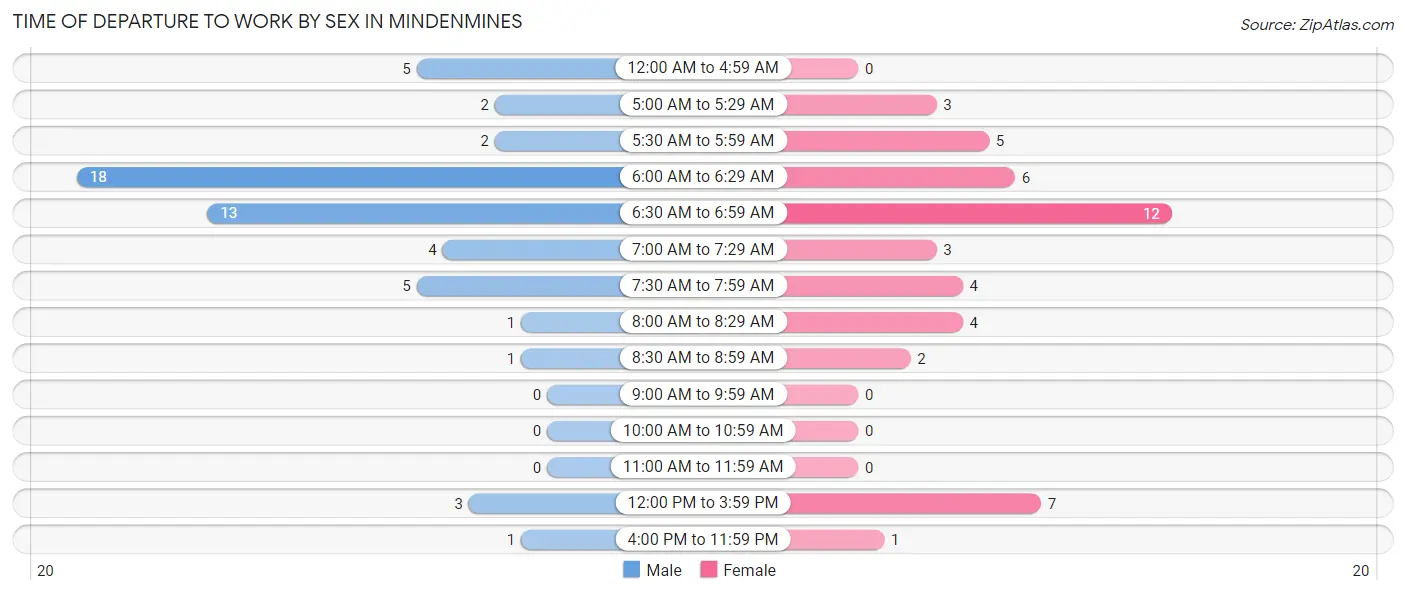
| Time of Departure | Male | Female |
| 12:00 AM to 4:59 AM | 5 (9.1%) | 0 (0.0%) |
| 5:00 AM to 5:29 AM | 2 (3.6%) | 3 (6.4%) |
| 5:30 AM to 5:59 AM | 2 (3.6%) | 5 (10.6%) |
| 6:00 AM to 6:29 AM | 18 (32.7%) | 6 (12.8%) |
| 6:30 AM to 6:59 AM | 13 (23.6%) | 12 (25.5%) |
| 7:00 AM to 7:29 AM | 4 (7.3%) | 3 (6.4%) |
| 7:30 AM to 7:59 AM | 5 (9.1%) | 4 (8.5%) |
| 8:00 AM to 8:29 AM | 1 (1.8%) | 4 (8.5%) |
| 8:30 AM to 8:59 AM | 1 (1.8%) | 2 (4.3%) |
| 9:00 AM to 9:59 AM | 0 (0.0%) | 0 (0.0%) |
| 10:00 AM to 10:59 AM | 0 (0.0%) | 0 (0.0%) |
| 11:00 AM to 11:59 AM | 0 (0.0%) | 0 (0.0%) |
| 12:00 PM to 3:59 PM | 3 (5.4%) | 7 (14.9%) |
| 4:00 PM to 11:59 PM | 1 (1.8%) | 1 (2.1%) |
| Total | 55 (100.0%) | 47 (100.0%) |
Housing Occupancy in Mindenmines
Occupancy by Ownership in Mindenmines
Of the total 183 dwellings in Mindenmines, owner-occupied units account for 159 (86.9%), while renter-occupied units make up 24 (13.1%).
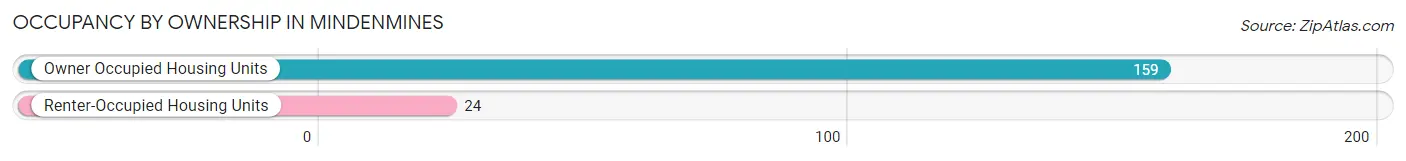
| Occupancy | # Housing Units | % Housing Units |
| Owner Occupied Housing Units | 159 | 86.9% |
| Renter-Occupied Housing Units | 24 | 13.1% |
| Total Occupied Housing Units | 183 | 100.0% |
Occupancy by Household Size in Mindenmines
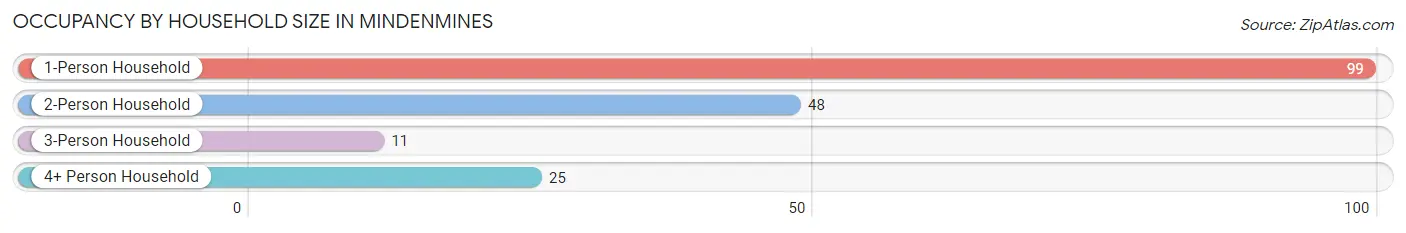
| Household Size | # Housing Units | % Housing Units |
| 1-Person Household | 99 | 54.1% |
| 2-Person Household | 48 | 26.2% |
| 3-Person Household | 11 | 6.0% |
| 4+ Person Household | 25 | 13.7% |
| Total Housing Units | 183 | 100.0% |
Occupancy by Ownership by Household Size in Mindenmines
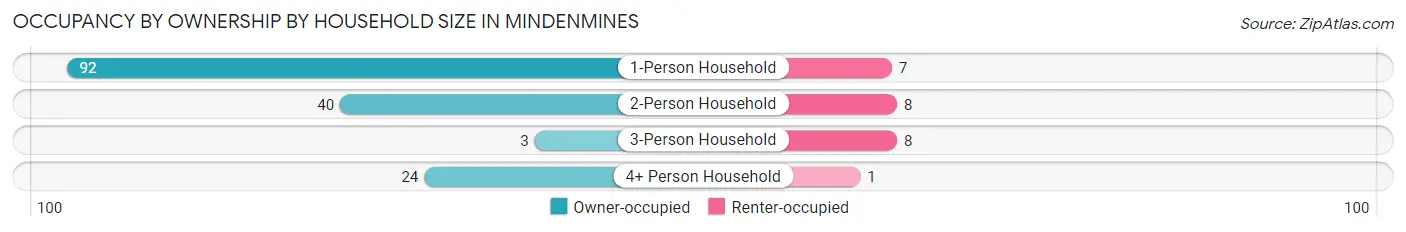
| Household Size | Owner-occupied | Renter-occupied |
| 1-Person Household | 92 (92.9%) | 7 (7.1%) |
| 2-Person Household | 40 (83.3%) | 8 (16.7%) |
| 3-Person Household | 3 (27.3%) | 8 (72.7%) |
| 4+ Person Household | 24 (96.0%) | 1 (4.0%) |
| Total Housing Units | 159 (86.9%) | 24 (13.1%) |
Occupancy by Educational Attainment in Mindenmines
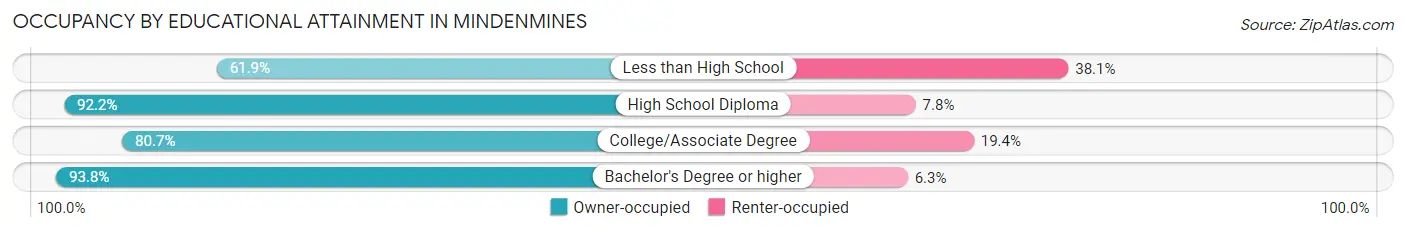
| Household Size | Owner-occupied | Renter-occupied |
| Less than High School | 13 (61.9%) | 8 (38.1%) |
| High School Diploma | 106 (92.2%) | 9 (7.8%) |
| College/Associate Degree | 25 (80.6%) | 6 (19.4%) |
| Bachelor's Degree or higher | 15 (93.8%) | 1 (6.2%) |
Occupancy by Age of Householder in Mindenmines
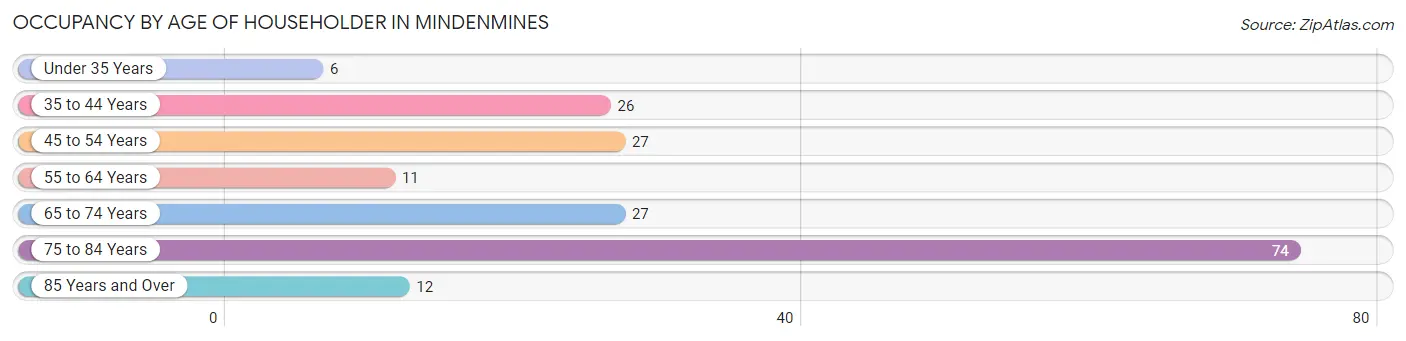
| Age Bracket | # Households | % Households |
| Under 35 Years | 6 | 3.3% |
| 35 to 44 Years | 26 | 14.2% |
| 45 to 54 Years | 27 | 14.7% |
| 55 to 64 Years | 11 | 6.0% |
| 65 to 74 Years | 27 | 14.7% |
| 75 to 84 Years | 74 | 40.4% |
| 85 Years and Over | 12 | 6.6% |
| Total | 183 | 100.0% |
Housing Finances in Mindenmines
Median Income by Occupancy in Mindenmines
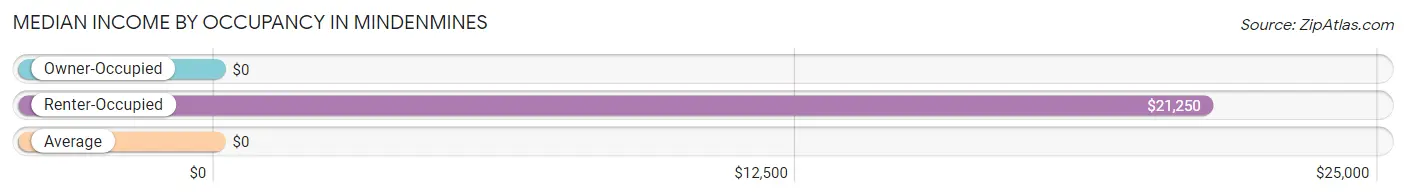
| Occupancy Type | # Households | Median Income |
| Owner-Occupied | 159 (86.9%) | $0 |
| Renter-Occupied | 24 (13.1%) | $21,250 |
| Average | 183 (100.0%) | $0 |
Occupancy by Householder Income Bracket in Mindenmines
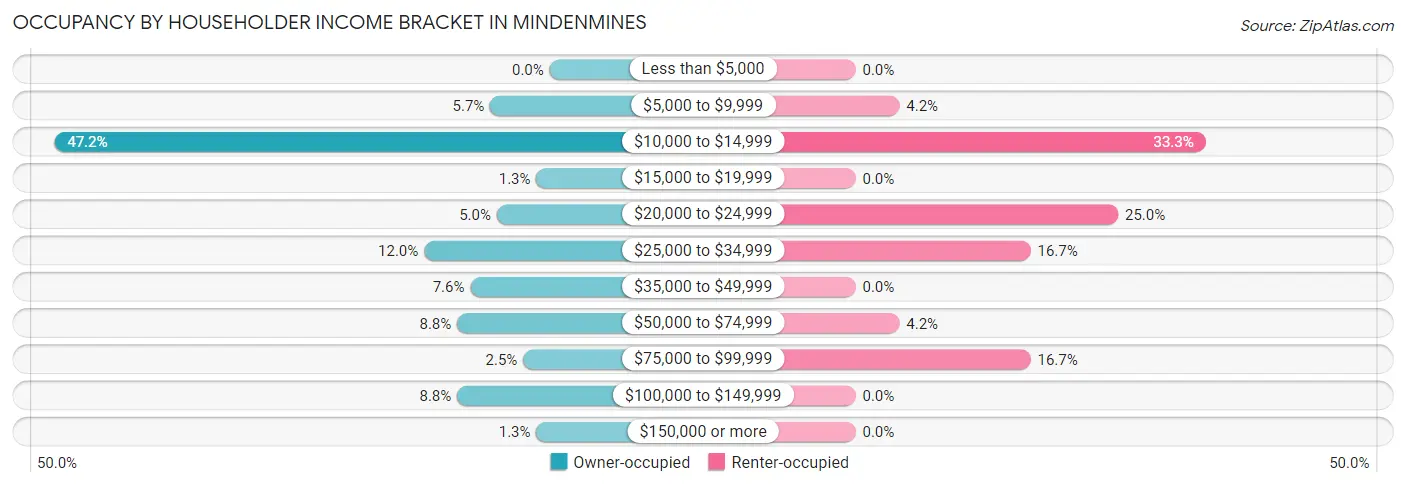
| Income Bracket | Owner-occupied | Renter-occupied |
| Less than $5,000 | 0 (0.0%) | 0 (0.0%) |
| $5,000 to $9,999 | 9 (5.7%) | 1 (4.2%) |
| $10,000 to $14,999 | 75 (47.2%) | 8 (33.3%) |
| $15,000 to $19,999 | 2 (1.3%) | 0 (0.0%) |
| $20,000 to $24,999 | 8 (5.0%) | 6 (25.0%) |
| $25,000 to $34,999 | 19 (11.9%) | 4 (16.7%) |
| $35,000 to $49,999 | 12 (7.5%) | 0 (0.0%) |
| $50,000 to $74,999 | 14 (8.8%) | 1 (4.2%) |
| $75,000 to $99,999 | 4 (2.5%) | 4 (16.7%) |
| $100,000 to $149,999 | 14 (8.8%) | 0 (0.0%) |
| $150,000 or more | 2 (1.3%) | 0 (0.0%) |
| Total | 159 (100.0%) | 24 (100.0%) |
Monthly Housing Cost Tiers in Mindenmines
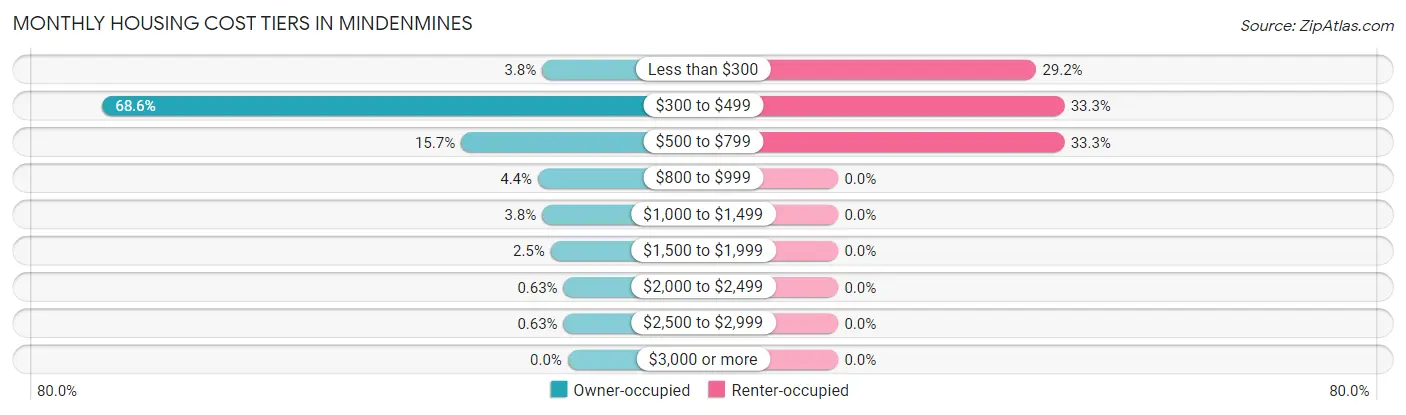
| Monthly Cost | Owner-occupied | Renter-occupied |
| Less than $300 | 6 (3.8%) | 7 (29.2%) |
| $300 to $499 | 109 (68.5%) | 8 (33.3%) |
| $500 to $799 | 25 (15.7%) | 8 (33.3%) |
| $800 to $999 | 7 (4.4%) | 0 (0.0%) |
| $1,000 to $1,499 | 6 (3.8%) | 0 (0.0%) |
| $1,500 to $1,999 | 4 (2.5%) | 0 (0.0%) |
| $2,000 to $2,499 | 1 (0.6%) | 0 (0.0%) |
| $2,500 to $2,999 | 1 (0.6%) | 0 (0.0%) |
| $3,000 or more | 0 (0.0%) | 0 (0.0%) |
| Total | 159 (100.0%) | 24 (100.0%) |
Physical Housing Characteristics in Mindenmines
Housing Structures in Mindenmines
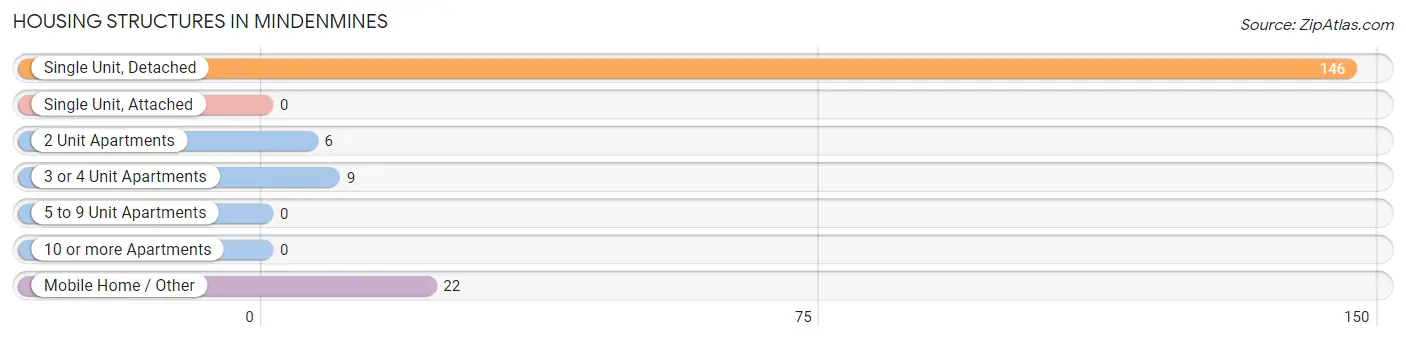
| Structure Type | # Housing Units | % Housing Units |
| Single Unit, Detached | 146 | 79.8% |
| Single Unit, Attached | 0 | 0.0% |
| 2 Unit Apartments | 6 | 3.3% |
| 3 or 4 Unit Apartments | 9 | 4.9% |
| 5 to 9 Unit Apartments | 0 | 0.0% |
| 10 or more Apartments | 0 | 0.0% |
| Mobile Home / Other | 22 | 12.0% |
| Total | 183 | 100.0% |
Housing Structures by Occupancy in Mindenmines
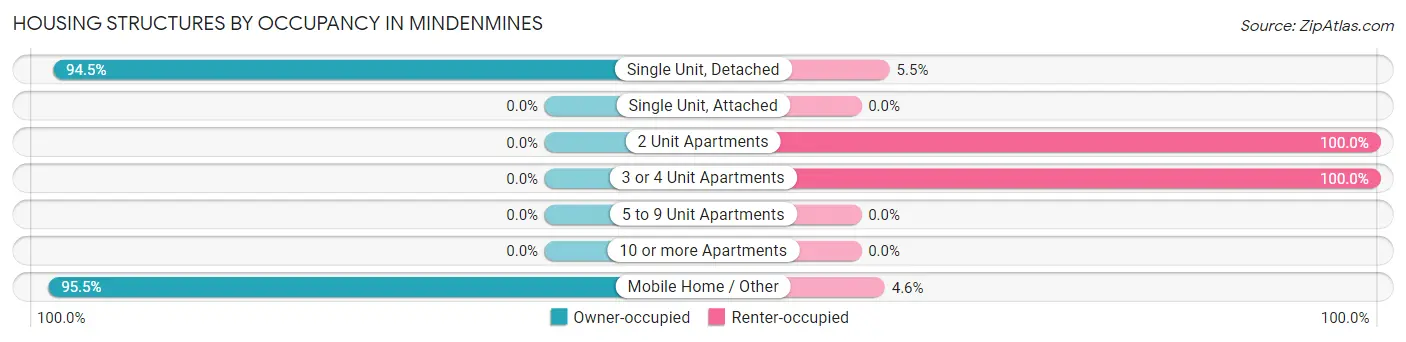
| Structure Type | Owner-occupied | Renter-occupied |
| Single Unit, Detached | 138 (94.5%) | 8 (5.5%) |
| Single Unit, Attached | 0 (0.0%) | 0 (0.0%) |
| 2 Unit Apartments | 0 (0.0%) | 6 (100.0%) |
| 3 or 4 Unit Apartments | 0 (0.0%) | 9 (100.0%) |
| 5 to 9 Unit Apartments | 0 (0.0%) | 0 (0.0%) |
| 10 or more Apartments | 0 (0.0%) | 0 (0.0%) |
| Mobile Home / Other | 21 (95.5%) | 1 (4.5%) |
| Total | 159 (86.9%) | 24 (13.1%) |
Housing Structures by Number of Rooms in Mindenmines
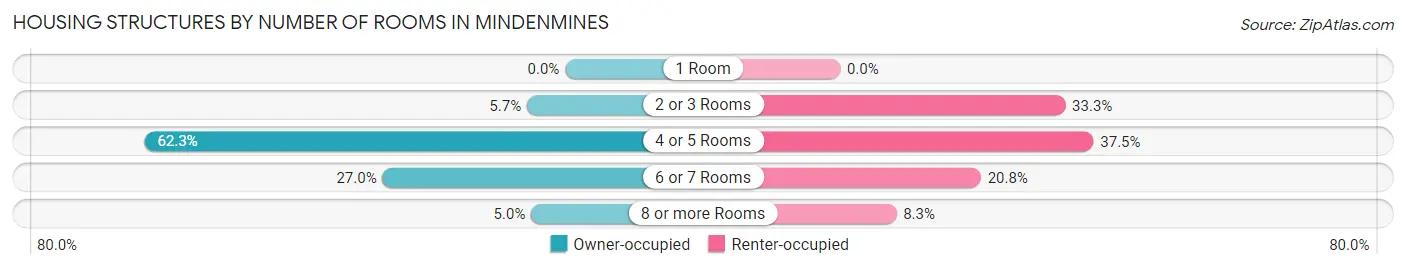
| Number of Rooms | Owner-occupied | Renter-occupied |
| 1 Room | 0 (0.0%) | 0 (0.0%) |
| 2 or 3 Rooms | 9 (5.7%) | 8 (33.3%) |
| 4 or 5 Rooms | 99 (62.3%) | 9 (37.5%) |
| 6 or 7 Rooms | 43 (27.0%) | 5 (20.8%) |
| 8 or more Rooms | 8 (5.0%) | 2 (8.3%) |
| Total | 159 (100.0%) | 24 (100.0%) |
Housing Structure by Heating Type in Mindenmines
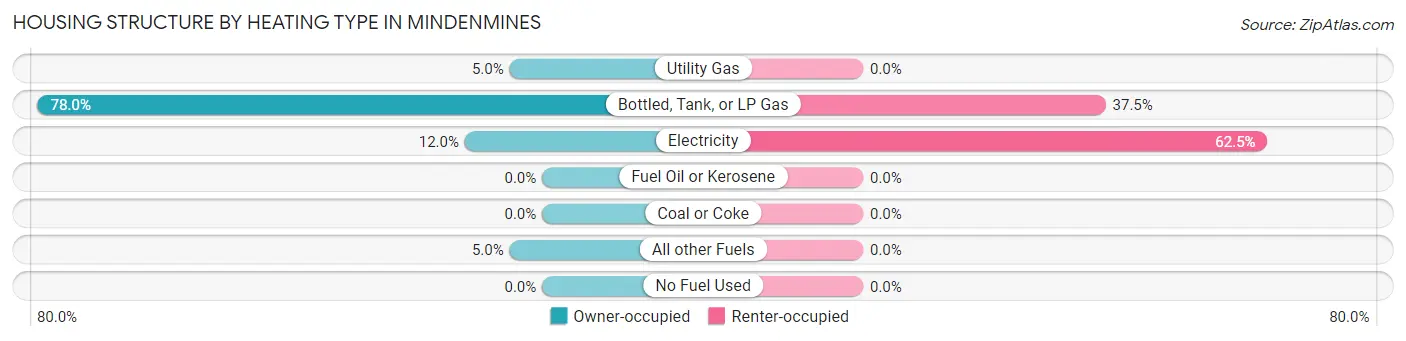
| Heating Type | Owner-occupied | Renter-occupied |
| Utility Gas | 8 (5.0%) | 0 (0.0%) |
| Bottled, Tank, or LP Gas | 124 (78.0%) | 9 (37.5%) |
| Electricity | 19 (11.9%) | 15 (62.5%) |
| Fuel Oil or Kerosene | 0 (0.0%) | 0 (0.0%) |
| Coal or Coke | 0 (0.0%) | 0 (0.0%) |
| All other Fuels | 8 (5.0%) | 0 (0.0%) |
| No Fuel Used | 0 (0.0%) | 0 (0.0%) |
| Total | 159 (100.0%) | 24 (100.0%) |
Household Vehicle Usage in Mindenmines
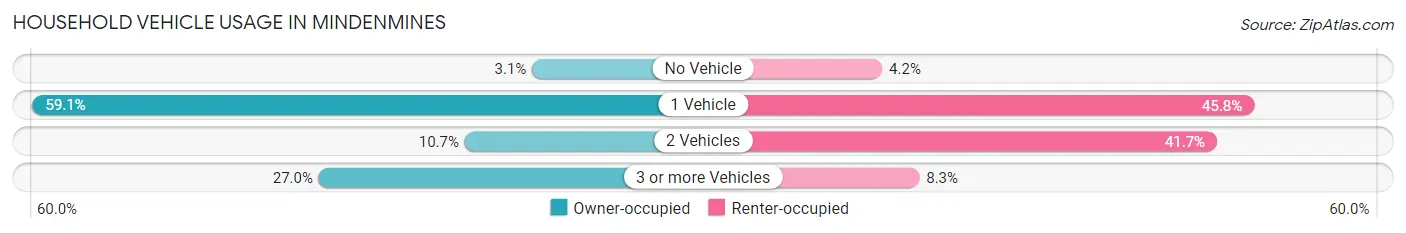
| Vehicles per Household | Owner-occupied | Renter-occupied |
| No Vehicle | 5 (3.1%) | 1 (4.2%) |
| 1 Vehicle | 94 (59.1%) | 11 (45.8%) |
| 2 Vehicles | 17 (10.7%) | 10 (41.7%) |
| 3 or more Vehicles | 43 (27.0%) | 2 (8.3%) |
| Total | 159 (100.0%) | 24 (100.0%) |
Real Estate & Mortgages in Mindenmines
Real Estate and Mortgage Overview in Mindenmines
| Characteristic | Without Mortgage | With Mortgage |
| Housing Units | 140 | 19 |
| Median Property Value | $38,500 | $91,700 |
| Median Household Income | $14,533 | $1 |
| Monthly Housing Costs | $344 | $0 |
| Real Estate Taxes | $199 | $0 |
Property Value by Mortgage Status in Mindenmines
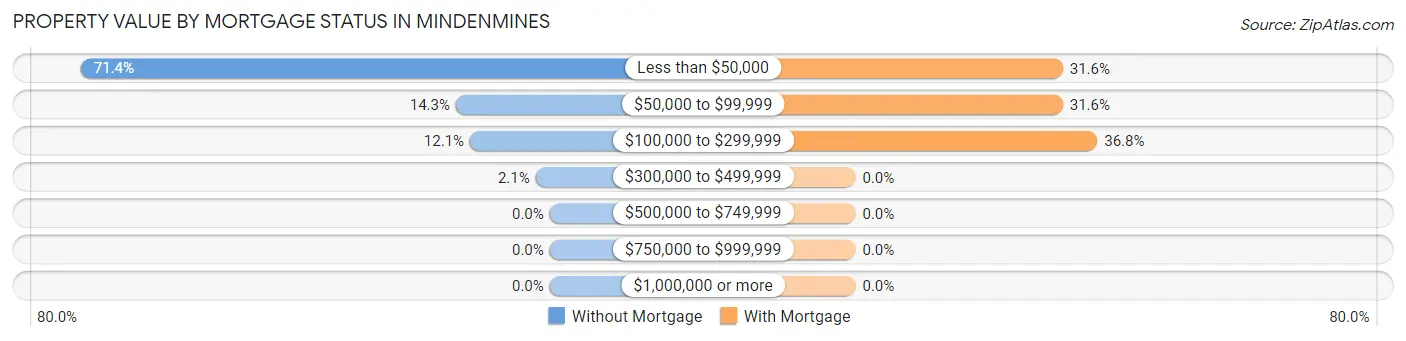
| Property Value | Without Mortgage | With Mortgage |
| Less than $50,000 | 100 (71.4%) | 6 (31.6%) |
| $50,000 to $99,999 | 20 (14.3%) | 6 (31.6%) |
| $100,000 to $299,999 | 17 (12.1%) | 7 (36.8%) |
| $300,000 to $499,999 | 3 (2.1%) | 0 (0.0%) |
| $500,000 to $749,999 | 0 (0.0%) | 0 (0.0%) |
| $750,000 to $999,999 | 0 (0.0%) | 0 (0.0%) |
| $1,000,000 or more | 0 (0.0%) | 0 (0.0%) |
| Total | 140 (100.0%) | 19 (100.0%) |
Household Income by Mortgage Status in Mindenmines
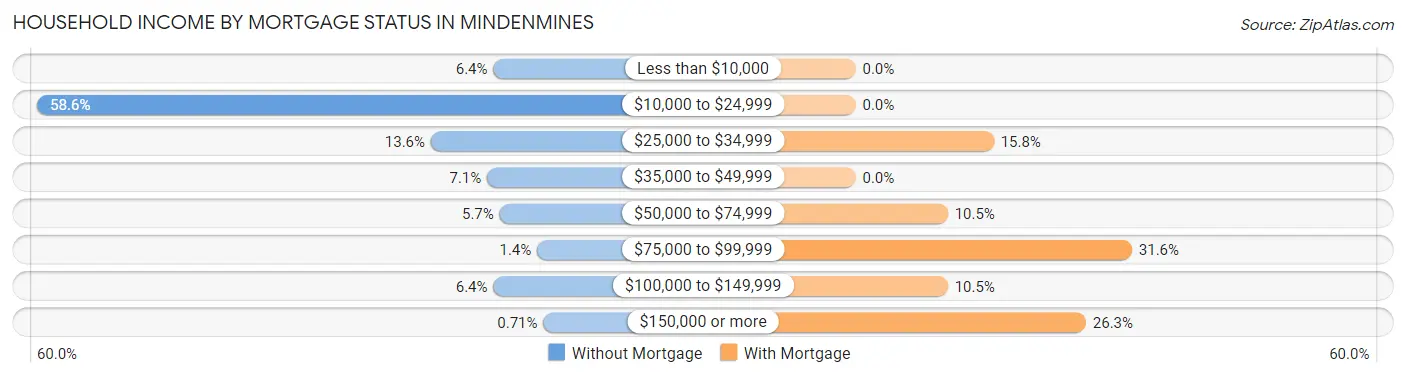
| Household Income | Without Mortgage | With Mortgage |
| Less than $10,000 | 9 (6.4%) | 0 (0.0%) |
| $10,000 to $24,999 | 82 (58.6%) | 0 (0.0%) |
| $25,000 to $34,999 | 19 (13.6%) | 3 (15.8%) |
| $35,000 to $49,999 | 10 (7.1%) | 0 (0.0%) |
| $50,000 to $74,999 | 8 (5.7%) | 2 (10.5%) |
| $75,000 to $99,999 | 2 (1.4%) | 6 (31.6%) |
| $100,000 to $149,999 | 9 (6.4%) | 2 (10.5%) |
| $150,000 or more | 1 (0.7%) | 5 (26.3%) |
| Total | 140 (100.0%) | 19 (100.0%) |
Property Value to Household Income Ratio in Mindenmines
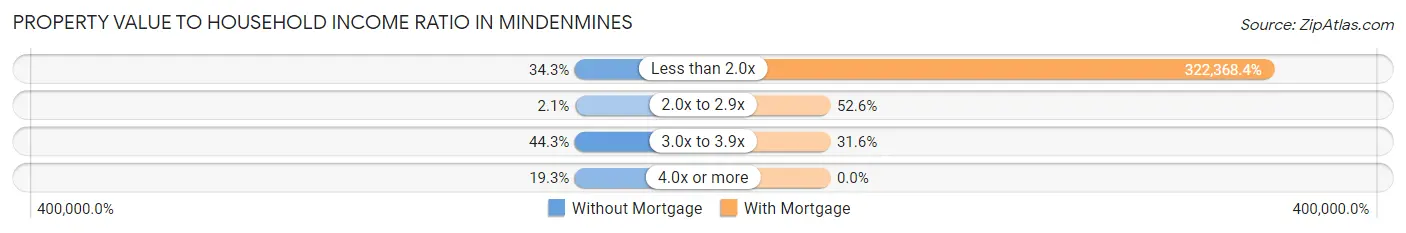
| Value-to-Income Ratio | Without Mortgage | With Mortgage |
| Less than 2.0x | 48 (34.3%) | 61,250 (322,368.4%) |
| 2.0x to 2.9x | 3 (2.1%) | 10 (52.6%) |
| 3.0x to 3.9x | 62 (44.3%) | 6 (31.6%) |
| 4.0x or more | 27 (19.3%) | 0 (0.0%) |
| Total | 140 (100.0%) | 19 (100.0%) |
Real Estate Taxes by Mortgage Status in Mindenmines
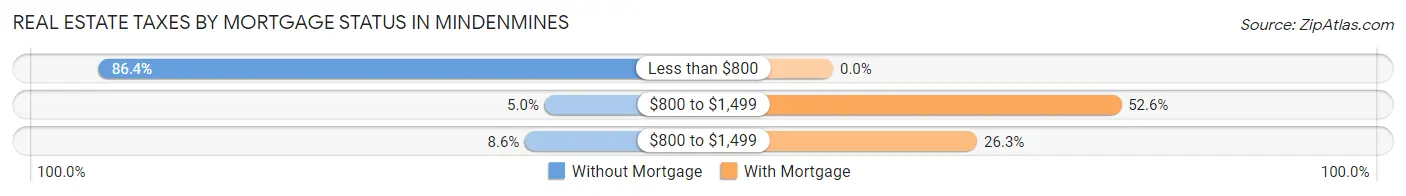
| Property Taxes | Without Mortgage | With Mortgage |
| Less than $800 | 121 (86.4%) | 0 (0.0%) |
| $800 to $1,499 | 7 (5.0%) | 10 (52.6%) |
| $800 to $1,499 | 12 (8.6%) | 5 (26.3%) |
| Total | 140 (100.0%) | 19 (100.0%) |
Health & Disability in Mindenmines
Health Insurance Coverage by Age in Mindenmines
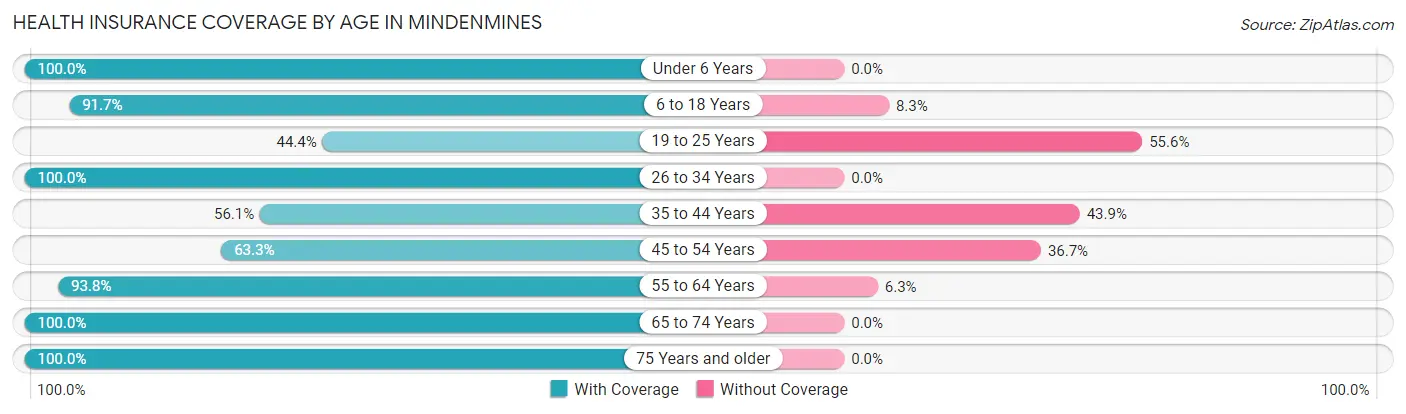
| Age Bracket | With Coverage | Without Coverage |
| Under 6 Years | 33 (100.0%) | 0 (0.0%) |
| 6 to 18 Years | 44 (91.7%) | 4 (8.3%) |
| 19 to 25 Years | 12 (44.4%) | 15 (55.6%) |
| 26 to 34 Years | 15 (100.0%) | 0 (0.0%) |
| 35 to 44 Years | 23 (56.1%) | 18 (43.9%) |
| 45 to 54 Years | 38 (63.3%) | 22 (36.7%) |
| 55 to 64 Years | 30 (93.8%) | 2 (6.2%) |
| 65 to 74 Years | 42 (100.0%) | 0 (0.0%) |
| 75 Years and older | 89 (100.0%) | 0 (0.0%) |
| Total | 326 (84.2%) | 61 (15.8%) |
Health Insurance Coverage by Citizenship Status in Mindenmines
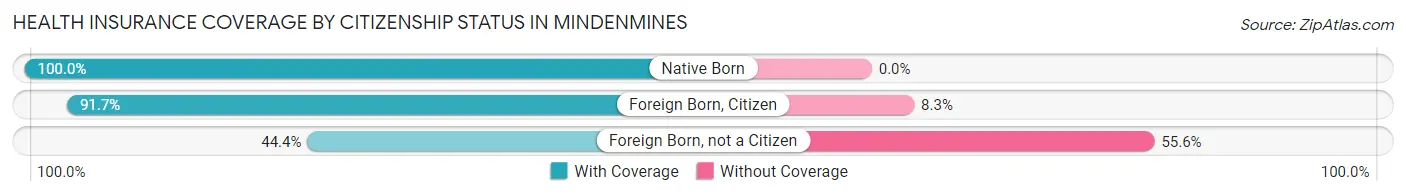
| Citizenship Status | With Coverage | Without Coverage |
| Native Born | 33 (100.0%) | 0 (0.0%) |
| Foreign Born, Citizen | 44 (91.7%) | 4 (8.3%) |
| Foreign Born, not a Citizen | 12 (44.4%) | 15 (55.6%) |
Health Insurance Coverage by Household Income in Mindenmines
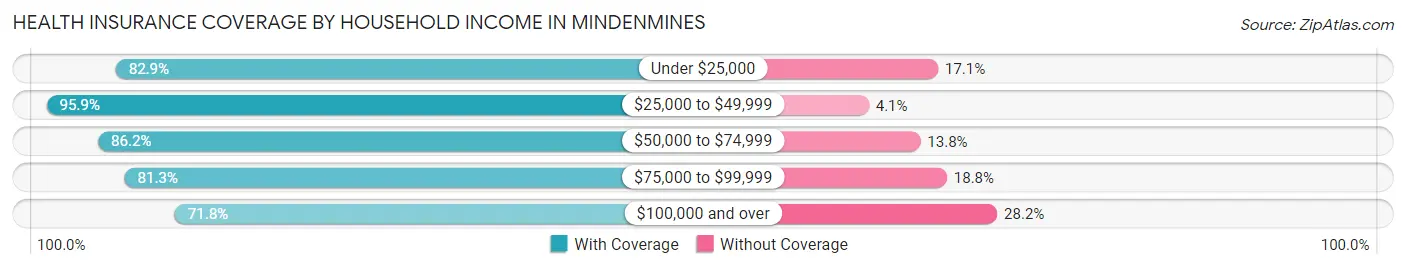
| Household Income | With Coverage | Without Coverage |
| Under $25,000 | 131 (82.9%) | 27 (17.1%) |
| $25,000 to $49,999 | 93 (95.9%) | 4 (4.1%) |
| $50,000 to $74,999 | 25 (86.2%) | 4 (13.8%) |
| $75,000 to $99,999 | 26 (81.2%) | 6 (18.8%) |
| $100,000 and over | 51 (71.8%) | 20 (28.2%) |
Public vs Private Health Insurance Coverage by Age in Mindenmines
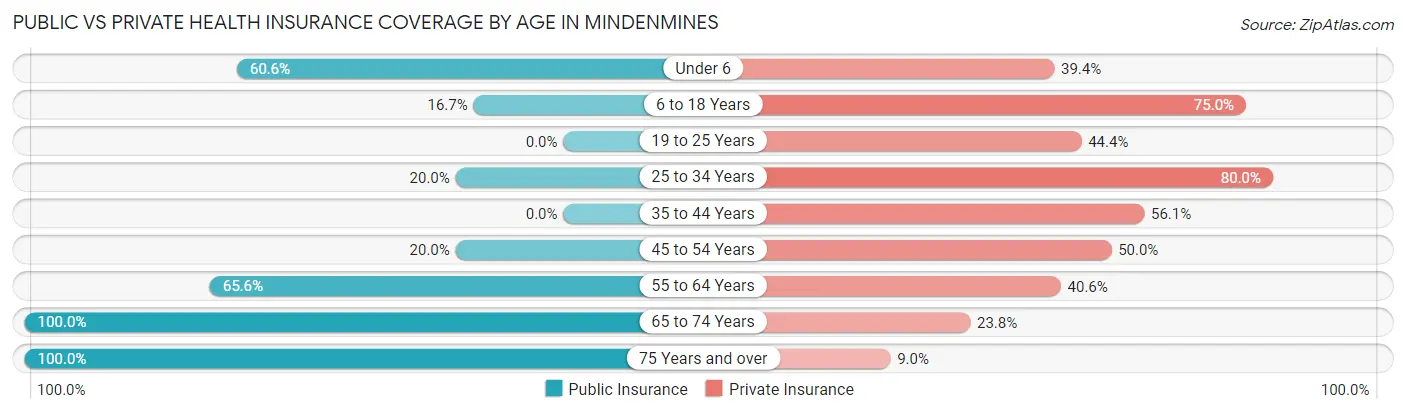
| Age Bracket | Public Insurance | Private Insurance |
| Under 6 | 20 (60.6%) | 13 (39.4%) |
| 6 to 18 Years | 8 (16.7%) | 36 (75.0%) |
| 19 to 25 Years | 0 (0.0%) | 12 (44.4%) |
| 25 to 34 Years | 3 (20.0%) | 12 (80.0%) |
| 35 to 44 Years | 0 (0.0%) | 23 (56.1%) |
| 45 to 54 Years | 12 (20.0%) | 30 (50.0%) |
| 55 to 64 Years | 21 (65.6%) | 13 (40.6%) |
| 65 to 74 Years | 42 (100.0%) | 10 (23.8%) |
| 75 Years and over | 89 (100.0%) | 8 (9.0%) |
| Total | 195 (50.4%) | 157 (40.6%) |
Disability Status by Sex by Age in Mindenmines
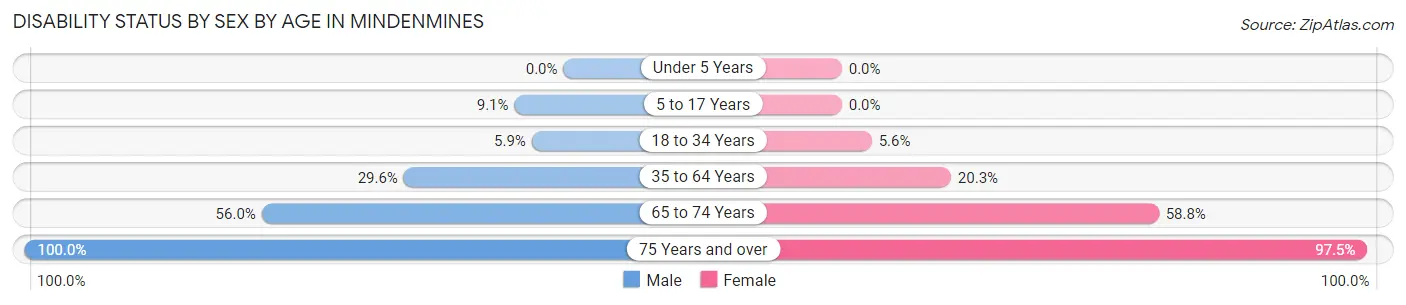
| Age Bracket | Male | Female |
| Under 5 Years | 0 (0.0%) | 0 (0.0%) |
| 5 to 17 Years | 2 (9.1%) | 0 (0.0%) |
| 18 to 34 Years | 2 (5.9%) | 1 (5.6%) |
| 35 to 64 Years | 16 (29.6%) | 16 (20.3%) |
| 65 to 74 Years | 14 (56.0%) | 10 (58.8%) |
| 75 Years and over | 8 (100.0%) | 79 (97.5%) |
Disability Class by Sex by Age in Mindenmines
Disability Class: Hearing Difficulty
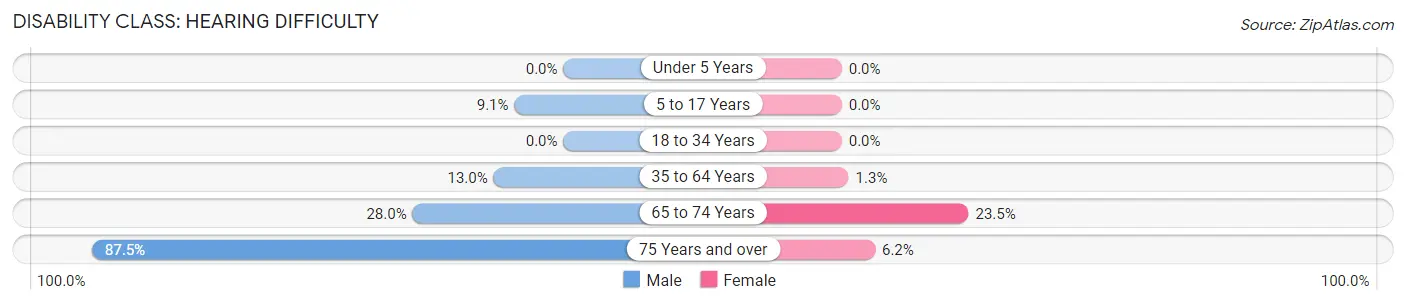
| Age Bracket | Male | Female |
| Under 5 Years | 0 (0.0%) | 0 (0.0%) |
| 5 to 17 Years | 2 (9.1%) | 0 (0.0%) |
| 18 to 34 Years | 0 (0.0%) | 0 (0.0%) |
| 35 to 64 Years | 7 (13.0%) | 1 (1.3%) |
| 65 to 74 Years | 7 (28.0%) | 4 (23.5%) |
| 75 Years and over | 7 (87.5%) | 5 (6.2%) |
Disability Class: Vision Difficulty
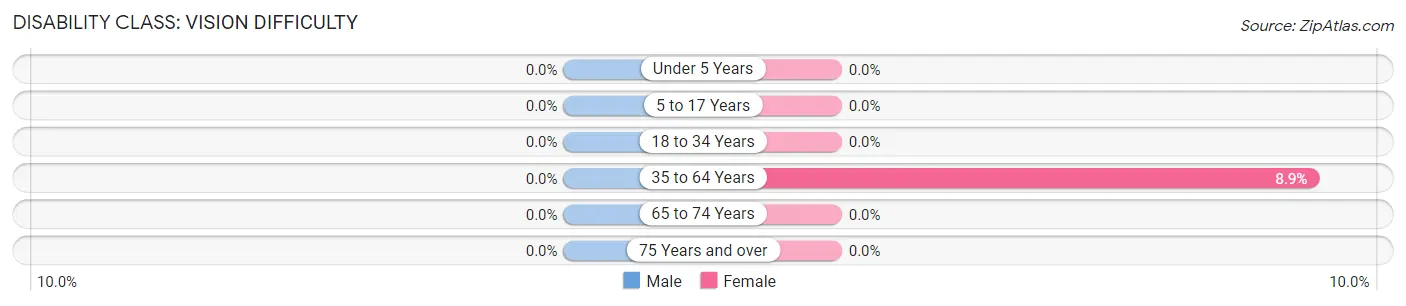
| Age Bracket | Male | Female |
| Under 5 Years | 0 (0.0%) | 0 (0.0%) |
| 5 to 17 Years | 0 (0.0%) | 0 (0.0%) |
| 18 to 34 Years | 0 (0.0%) | 0 (0.0%) |
| 35 to 64 Years | 0 (0.0%) | 7 (8.9%) |
| 65 to 74 Years | 0 (0.0%) | 0 (0.0%) |
| 75 Years and over | 0 (0.0%) | 0 (0.0%) |
Disability Class: Cognitive Difficulty
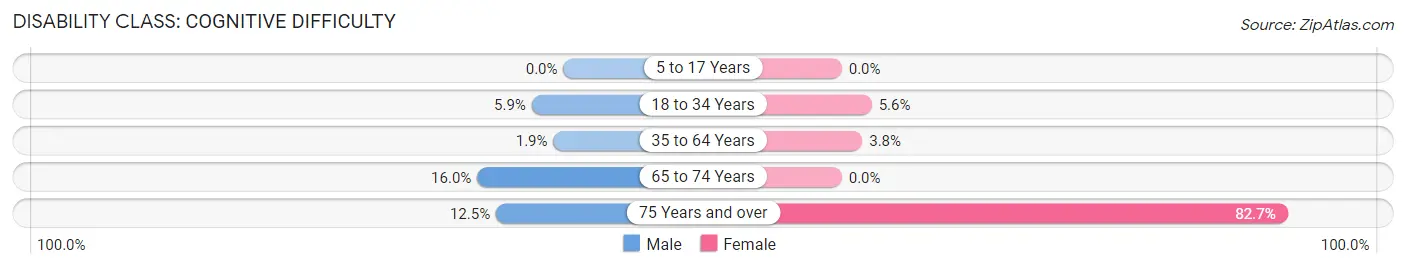
| Age Bracket | Male | Female |
| 5 to 17 Years | 0 (0.0%) | 0 (0.0%) |
| 18 to 34 Years | 2 (5.9%) | 1 (5.6%) |
| 35 to 64 Years | 1 (1.8%) | 3 (3.8%) |
| 65 to 74 Years | 4 (16.0%) | 0 (0.0%) |
| 75 Years and over | 1 (12.5%) | 67 (82.7%) |
Disability Class: Ambulatory Difficulty
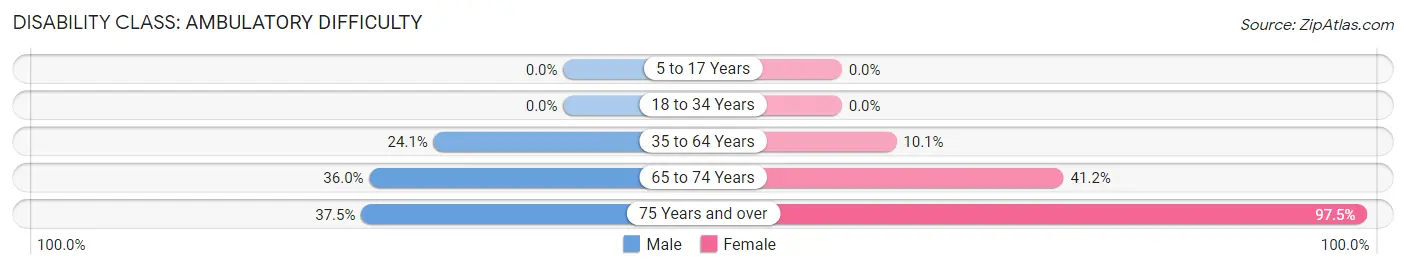
| Age Bracket | Male | Female |
| 5 to 17 Years | 0 (0.0%) | 0 (0.0%) |
| 18 to 34 Years | 0 (0.0%) | 0 (0.0%) |
| 35 to 64 Years | 13 (24.1%) | 8 (10.1%) |
| 65 to 74 Years | 9 (36.0%) | 7 (41.2%) |
| 75 Years and over | 3 (37.5%) | 79 (97.5%) |
Disability Class: Self-Care Difficulty
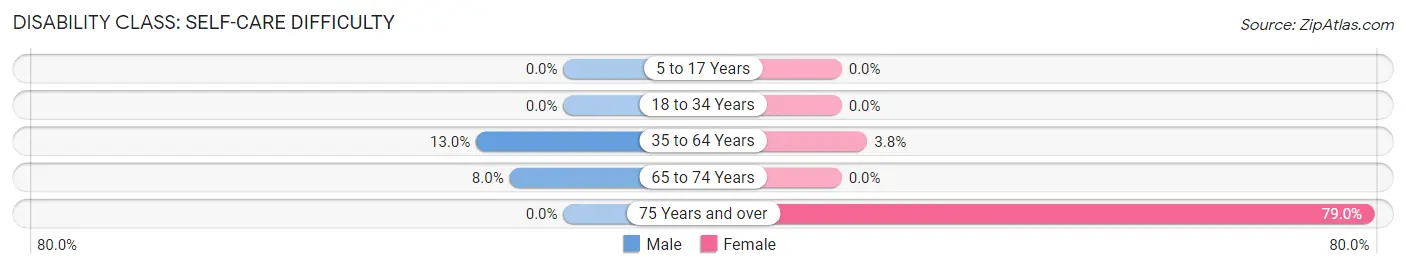
| Age Bracket | Male | Female |
| 5 to 17 Years | 0 (0.0%) | 0 (0.0%) |
| 18 to 34 Years | 0 (0.0%) | 0 (0.0%) |
| 35 to 64 Years | 7 (13.0%) | 3 (3.8%) |
| 65 to 74 Years | 2 (8.0%) | 0 (0.0%) |
| 75 Years and over | 0 (0.0%) | 64 (79.0%) |
Technology Access in Mindenmines
Computing Device Access in Mindenmines
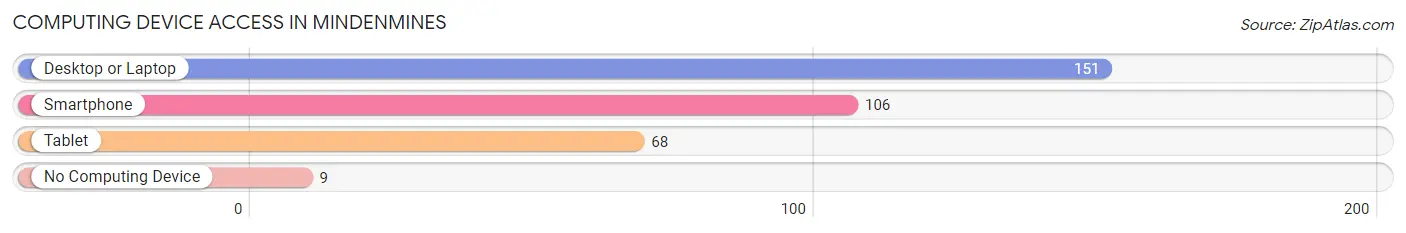
| Device Type | # Households | % Households |
| Desktop or Laptop | 151 | 82.5% |
| Smartphone | 106 | 57.9% |
| Tablet | 68 | 37.2% |
| No Computing Device | 9 | 4.9% |
| Total | 183 | 100.0% |
Internet Access in Mindenmines
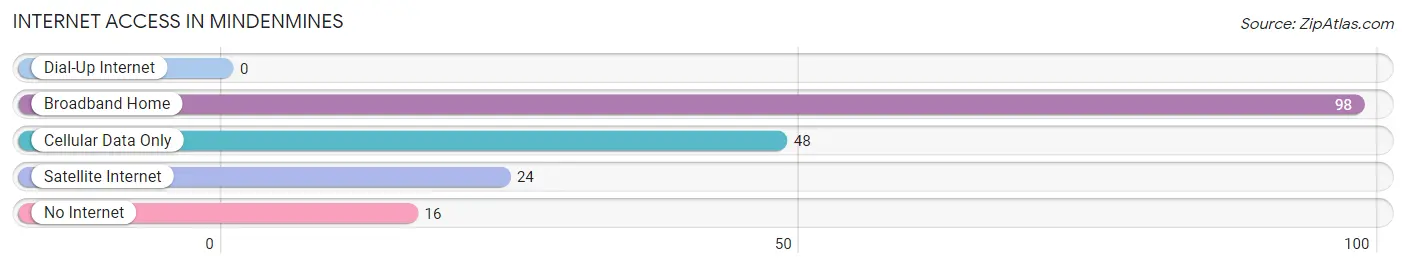
| Internet Type | # Households | % Households |
| Dial-Up Internet | 0 | 0.0% |
| Broadband Home | 98 | 53.5% |
| Cellular Data Only | 48 | 26.2% |
| Satellite Internet | 24 | 13.1% |
| No Internet | 16 | 8.7% |
| Total | 183 | 100.0% |
Mindenmines Summary
History
The small town of Mindenmines, Missouri is located in the southwestern corner of the state, in Barton County. It was founded in 1883 by a group of settlers from Minden, Germany, who were looking for a place to settle and start a new life. The town was named after the German city of Minden, and the mines that were located nearby.
The town was originally a farming community, but in the early 1900s, the discovery of coal in the area led to the development of a coal mining industry. The coal mines provided jobs for many of the town’s residents, and the town grew rapidly. By the 1920s, Mindenmines had become a thriving community with a population of over 1,000 people.
The coal mining industry in Mindenmines declined in the 1950s, and the town’s population began to decline as well. In the 1970s, the town was hit hard by the economic recession, and many of the businesses in the area closed. However, the town has since recovered and is now a small but thriving community.
Geography
Mindenmines is located in the southwestern corner of Missouri, in Barton County. It is situated on the banks of the Marmaton River, and is surrounded by rolling hills and farmland. The town is located about 25 miles from the state capital of Jefferson City, and is about an hour’s drive from Kansas City.
The climate in Mindenmines is typical of the Midwest, with hot summers and cold winters. The average temperature in the summer is around 80 degrees Fahrenheit, and in the winter it is around 40 degrees Fahrenheit. The town receives an average of 40 inches of rain per year, and the area is prone to severe thunderstorms and tornadoes.
Economy
The economy of Mindenmines is largely based on agriculture and tourism. The town is home to several farms, which produce a variety of crops, including corn, soybeans, wheat, and hay. The town also has several small businesses, including a grocery store, a hardware store, and a few restaurants.
The town is also a popular tourist destination, as it is located near several state parks and recreational areas. The town is home to several festivals and events throughout the year, including the Mindenmines Music Festival and the Mindenmines Harvest Festival.
Demographics
As of the 2010 census, the population of Mindenmines was 845 people. The town is predominantly white, with a small African American population. The median household income in the town is $37,000, and the median age is 44 years old. The town has a low unemployment rate, and the majority of the population is employed in the agricultural and tourism industries.
Common Questions
What is Per Capita Income in Mindenmines?
Per Capita income in Mindenmines is $17,493.
What is the Median Family Income in Mindenmines?
Median Family Income in Mindenmines is $42,500.
What is Income or Wage Gap in Mindenmines?
Income or Wage Gap in Mindenmines is 33.2%.
Women in Mindenmines earn 66.8 cents for every dollar earned by a man.
What is Inequality or Gini Index in Mindenmines?
Inequality or Gini Index in Mindenmines is 0.46.
What is the Total Population of Mindenmines?
Total Population of Mindenmines is 387.
What is the Total Male Population of Mindenmines?
Total Male Population of Mindenmines is 173.
What is the Total Female Population of Mindenmines?
Total Female Population of Mindenmines is 214.
What is the Ratio of Males per 100 Females in Mindenmines?
There are 80.84 Males per 100 Females in Mindenmines.
What is the Ratio of Females per 100 Males in Mindenmines?
There are 123.70 Females per 100 Males in Mindenmines.
What is the Median Population Age in Mindenmines?
Median Population Age in Mindenmines is 48.5 Years.
What is the Average Family Size in Mindenmines
Average Family Size in Mindenmines is 3.3 People.
What is the Average Household Size in Mindenmines
Average Household Size in Mindenmines is 2.1 People.
How Large is the Labor Force in Mindenmines?
There are 108 People in the Labor Forcein in Mindenmines.
What is the Percentage of People in the Labor Force in Mindenmines?
33.0% of People are in the Labor Force in Mindenmines.