Excelsior Estates, MO Map & Demographics
Excelsior Estates Map
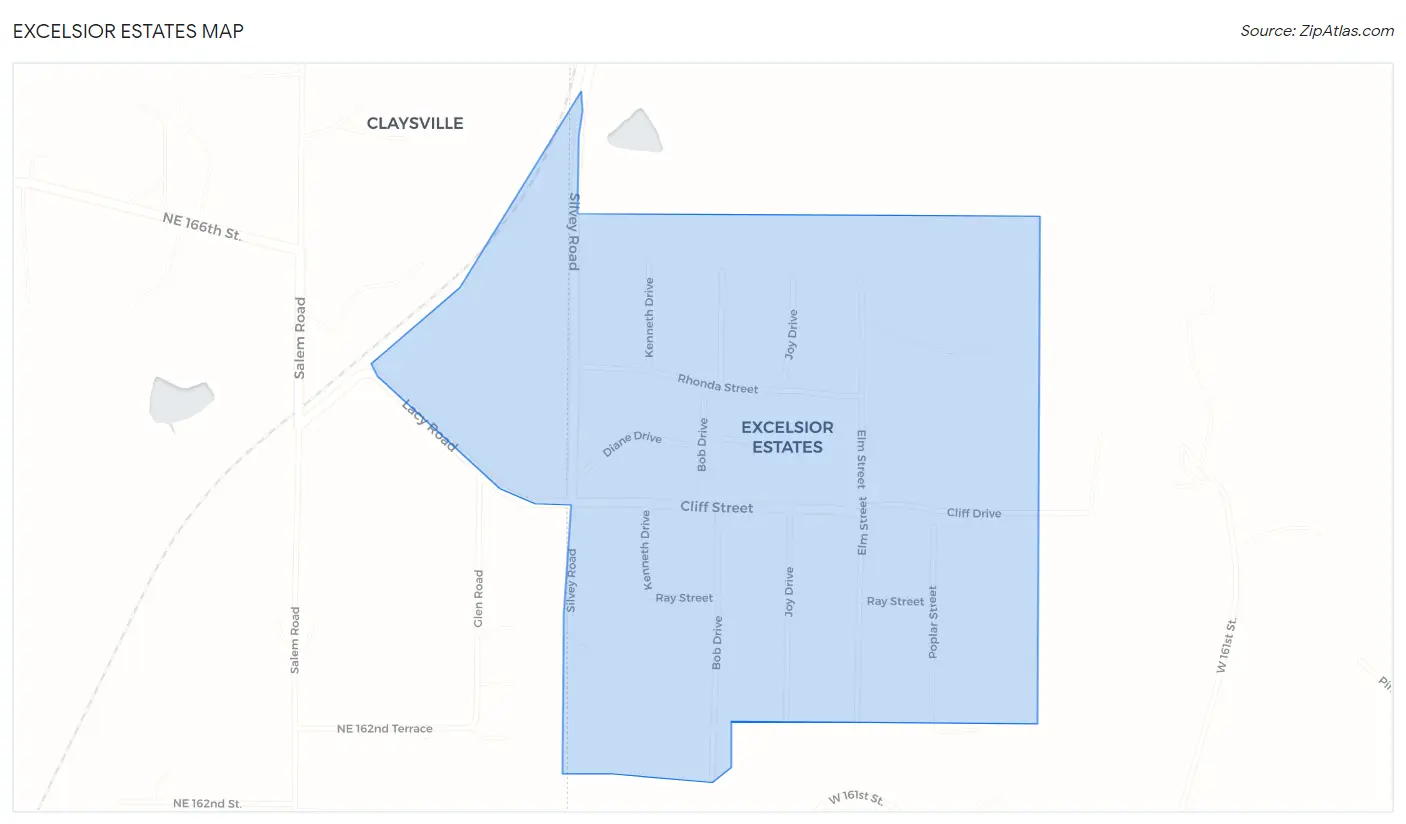
Excelsior Estates Overview
$19,864
PER CAPITA INCOME
$73,594
AVG FAMILY INCOME
$73,594
AVG HOUSEHOLD INCOME
37.4%
WAGE / INCOME GAP [ % ]
62.6¢/ $1
WAGE / INCOME GAP [ $ ]
0.28
INEQUALITY / GINI INDEX
313
TOTAL POPULATION
126
MALE POPULATION
187
FEMALE POPULATION
67.38
MALES / 100 FEMALES
148.41
FEMALES / 100 MALES
42.0
MEDIAN AGE
3.8
AVG FAMILY SIZE
3.6
AVG HOUSEHOLD SIZE
150
LABOR FORCE [ PEOPLE ]
52.8%
PERCENT IN LABOR FORCE
6.0%
UNEMPLOYMENT RATE
Excelsior Estates Area Codes
Income in Excelsior Estates
Income Overview in Excelsior Estates
Per Capita Income in Excelsior Estates is $19,864, while median incomes of families and households are $73,594 and $73,594 respectively.
| Characteristic | Number | Measure |
| Per Capita Income | 313 | $19,864 |
| Median Family Income | 74 | $73,594 |
| Mean Family Income | 74 | $64,526 |
| Median Household Income | 86 | $73,594 |
| Mean Household Income | 86 | $65,185 |
| Income Deficit | 74 | $0 |
| Wage / Income Gap (%) | 313 | 37.45% |
| Wage / Income Gap ($) | 313 | 62.55¢ per $1 |
| Gini / Inequality Index | 313 | 0.28 |
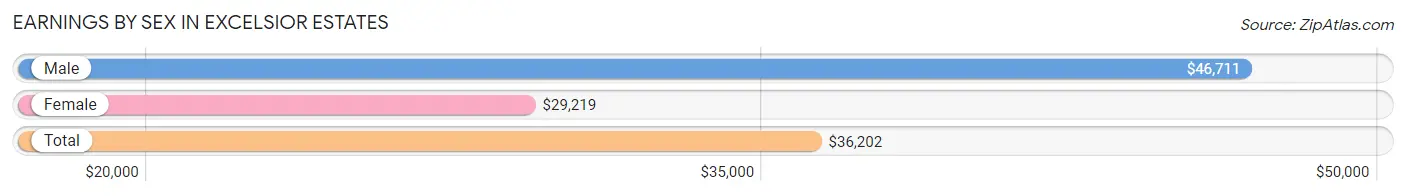
Earnings by Sex in Excelsior Estates
Average Earnings in Excelsior Estates are $36,202, $46,711 for men and $29,219 for women, a difference of 37.4%.
| Sex | Number | Average Earnings |
| Male | 78 (53.1%) | $46,711 |
| Female | 69 (46.9%) | $29,219 |
| Total | 147 (100.0%) | $36,202 |
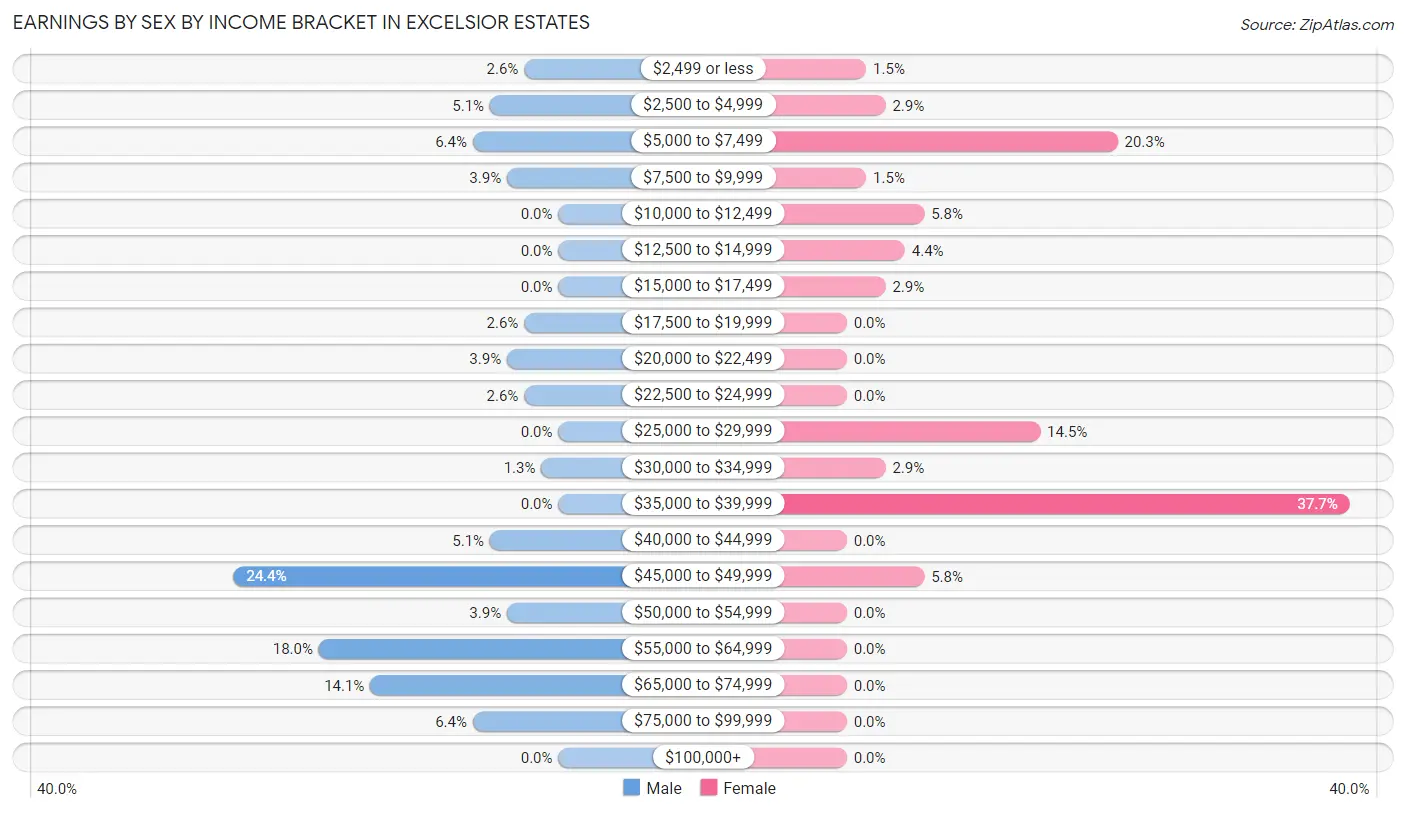
Earnings by Sex by Income Bracket in Excelsior Estates
The most common earnings brackets in Excelsior Estates are $45,000 to $49,999 for men (19 | 24.4%) and $35,000 to $39,999 for women (26 | 37.7%).
| Income | Male | Female |
| $2,499 or less | 2 (2.6%) | 1 (1.5%) |
| $2,500 to $4,999 | 4 (5.1%) | 2 (2.9%) |
| $5,000 to $7,499 | 5 (6.4%) | 14 (20.3%) |
| $7,500 to $9,999 | 3 (3.8%) | 1 (1.5%) |
| $10,000 to $12,499 | 0 (0.0%) | 4 (5.8%) |
| $12,500 to $14,999 | 0 (0.0%) | 3 (4.3%) |
| $15,000 to $17,499 | 0 (0.0%) | 2 (2.9%) |
| $17,500 to $19,999 | 2 (2.6%) | 0 (0.0%) |
| $20,000 to $22,499 | 3 (3.8%) | 0 (0.0%) |
| $22,500 to $24,999 | 2 (2.6%) | 0 (0.0%) |
| $25,000 to $29,999 | 0 (0.0%) | 10 (14.5%) |
| $30,000 to $34,999 | 1 (1.3%) | 2 (2.9%) |
| $35,000 to $39,999 | 0 (0.0%) | 26 (37.7%) |
| $40,000 to $44,999 | 4 (5.1%) | 0 (0.0%) |
| $45,000 to $49,999 | 19 (24.4%) | 4 (5.8%) |
| $50,000 to $54,999 | 3 (3.8%) | 0 (0.0%) |
| $55,000 to $64,999 | 14 (17.9%) | 0 (0.0%) |
| $65,000 to $74,999 | 11 (14.1%) | 0 (0.0%) |
| $75,000 to $99,999 | 5 (6.4%) | 0 (0.0%) |
| $100,000+ | 0 (0.0%) | 0 (0.0%) |
| Total | 78 (100.0%) | 69 (100.0%) |
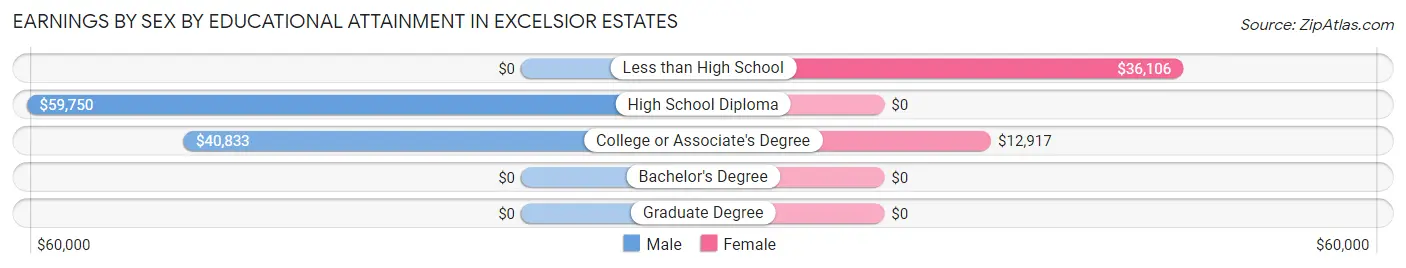
Earnings by Sex by Educational Attainment in Excelsior Estates
Average earnings in Excelsior Estates are $58,000 for men and $29,688 for women, a difference of 48.8%. Men with an educational attainment of high school diploma enjoy the highest average annual earnings of $59,750, while those with college or associate's degree education earn the least with $40,833. Women with an educational attainment of less than high school earn the most with the average annual earnings of $36,106, while those with college or associate's degree education have the smallest earnings of $12,917.
| Educational Attainment | Male Income | Female Income |
| Less than High School | - | - |
| High School Diploma | $59,750 | $0 |
| College or Associate's Degree | $40,833 | $12,917 |
| Bachelor's Degree | - | - |
| Graduate Degree | - | - |
| Total | $58,000 | $29,688 |
Family Income in Excelsior Estates
Family Income Brackets in Excelsior Estates
According to the Excelsior Estates family income data, there are 23 families falling into the $75,000 to $99,999 income range, which is the most common income bracket and makes up 31.1% of all families.
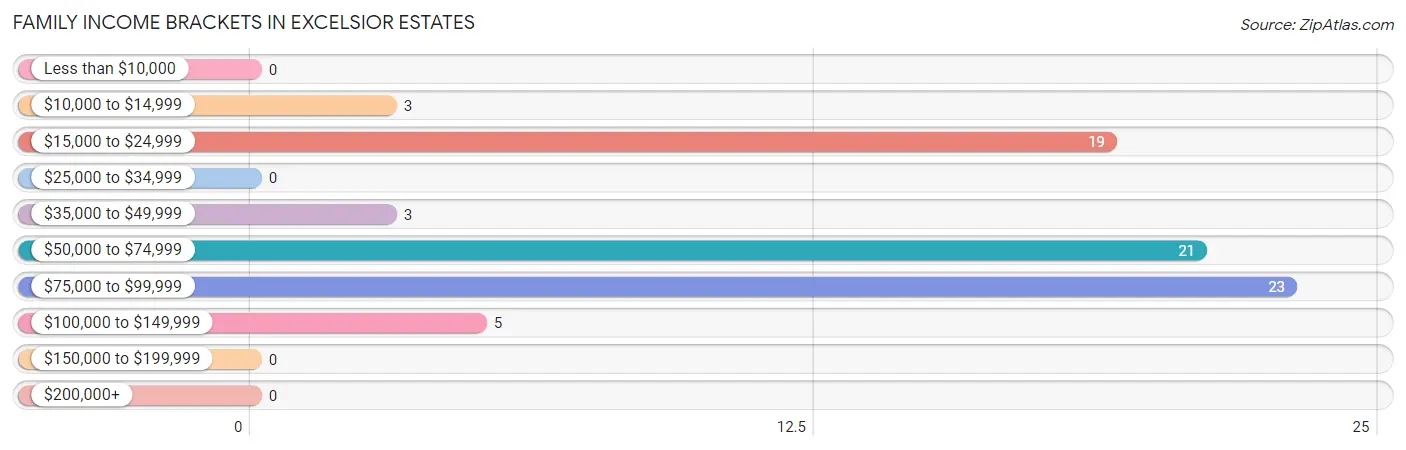
| Income Bracket | # Families | % Families |
| Less than $10,000 | 0 | 0.0% |
| $10,000 to $14,999 | 3 | 4.1% |
| $15,000 to $24,999 | 19 | 25.7% |
| $25,000 to $34,999 | 0 | 0.0% |
| $35,000 to $49,999 | 3 | 4.1% |
| $50,000 to $74,999 | 21 | 28.4% |
| $75,000 to $99,999 | 23 | 31.1% |
| $100,000 to $149,999 | 5 | 6.8% |
| $150,000 to $199,999 | 0 | 0.0% |
| $200,000+ | 0 | 0.0% |
Family Income by Famaliy Size in Excelsior Estates
4-person families (30 | 40.5%) account for the highest median family income in Excelsior Estates with $94,028 per family, while 4-person families (30 | 40.5%) have the highest median income of $23,507 per family member.
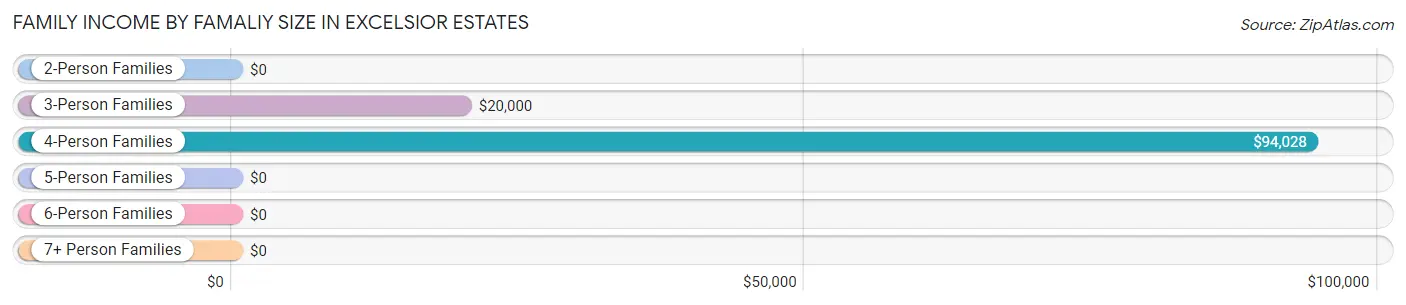
| Income Bracket | # Families | Median Income |
| 2-Person Families | 20 (27.0%) | $0 |
| 3-Person Families | 6 (8.1%) | $20,000 |
| 4-Person Families | 30 (40.5%) | $94,028 |
| 5-Person Families | 16 (21.6%) | $0 |
| 6-Person Families | 2 (2.7%) | $0 |
| 7+ Person Families | 0 (0.0%) | $0 |
| Total | 74 (100.0%) | $73,594 |
Family Income by Number of Earners in Excelsior Estates
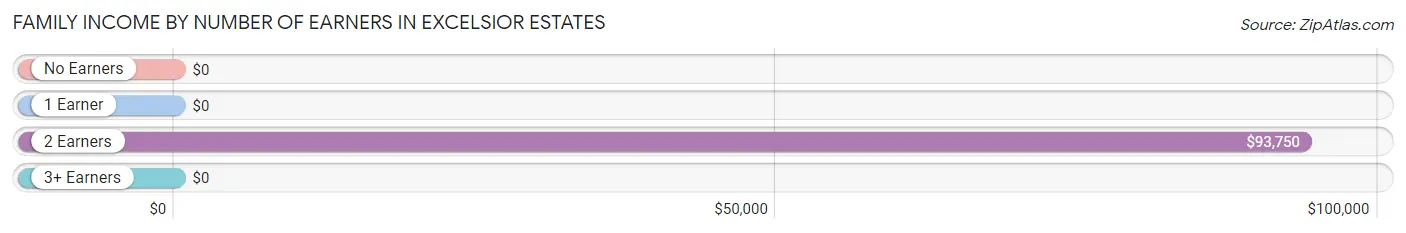
| Number of Earners | # Families | Median Income |
| No Earners | 7 (9.5%) | $0 |
| 1 Earner | 35 (47.3%) | $0 |
| 2 Earners | 28 (37.8%) | $93,750 |
| 3+ Earners | 4 (5.4%) | $0 |
| Total | 74 (100.0%) | $73,594 |
Household Income in Excelsior Estates
Household Income Brackets in Excelsior Estates
With 25 households falling in the category, the $75,000 to $99,999 income range is the most frequent in Excelsior Estates, accounting for 29.1% of all households.
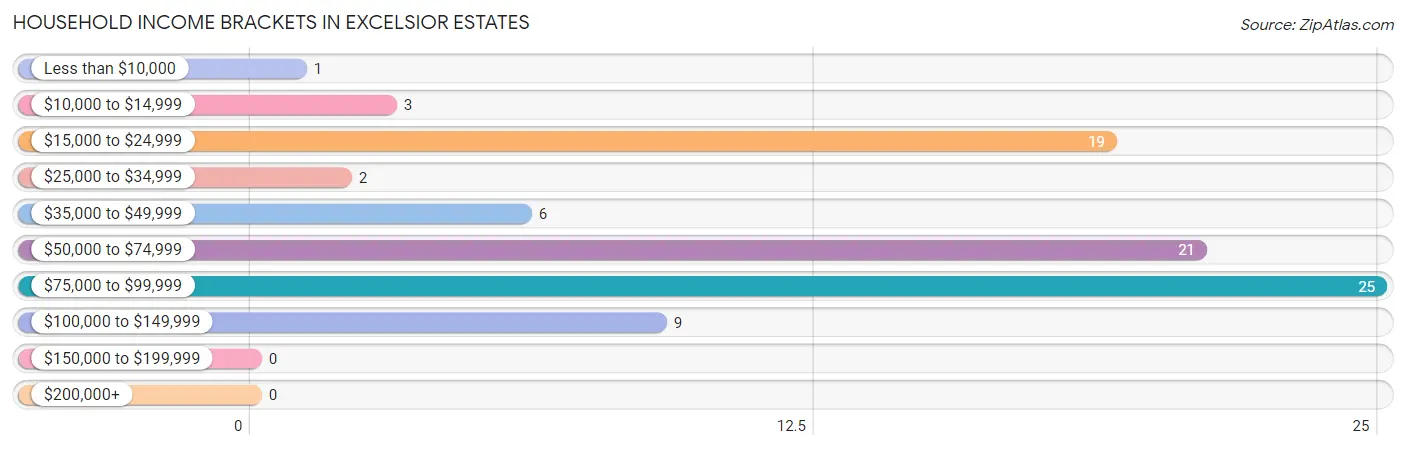
| Income Bracket | # Households | % Households |
| Less than $10,000 | 1 | 1.2% |
| $10,000 to $14,999 | 3 | 3.5% |
| $15,000 to $24,999 | 19 | 22.1% |
| $25,000 to $34,999 | 2 | 2.3% |
| $35,000 to $49,999 | 6 | 7.0% |
| $50,000 to $74,999 | 21 | 24.4% |
| $75,000 to $99,999 | 25 | 29.1% |
| $100,000 to $149,999 | 9 | 10.5% |
| $150,000 to $199,999 | 0 | 0.0% |
| $200,000+ | 0 | 0.0% |
Household Income by Householder Age in Excelsior Estates
The median household income in Excelsior Estates is $73,594, with the highest median household income of $93,611 found in the 15 to 24 years age bracket for the primary householder. A total of 20 households (23.3%) fall into this category. Meanwhile, the 65+ years age bracket for the primary householder has the lowest median household income of $0, with 9 households (10.5%) in this group.
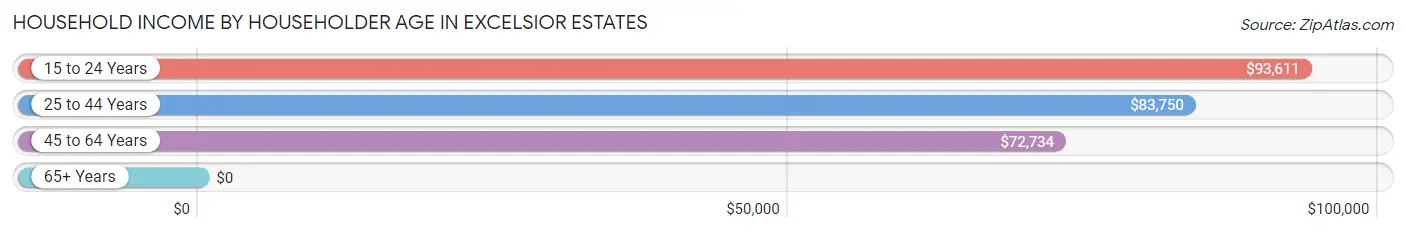
| Income Bracket | # Households | Median Income |
| 15 to 24 Years | 20 (23.3%) | $93,611 |
| 25 to 44 Years | 12 (14.0%) | $83,750 |
| 45 to 64 Years | 45 (52.3%) | $72,734 |
| 65+ Years | 9 (10.5%) | $0 |
| Total | 86 (100.0%) | $73,594 |
Poverty in Excelsior Estates
Income Below Poverty by Sex and Age in Excelsior Estates
With 16.7% poverty level for males and 18.7% for females among the residents of Excelsior Estates, 5 year old males and 6 to 11 year old females are the most vulnerable to poverty, with 3 males (100.0%) and 4 females (100.0%) in their respective age groups living below the poverty level.
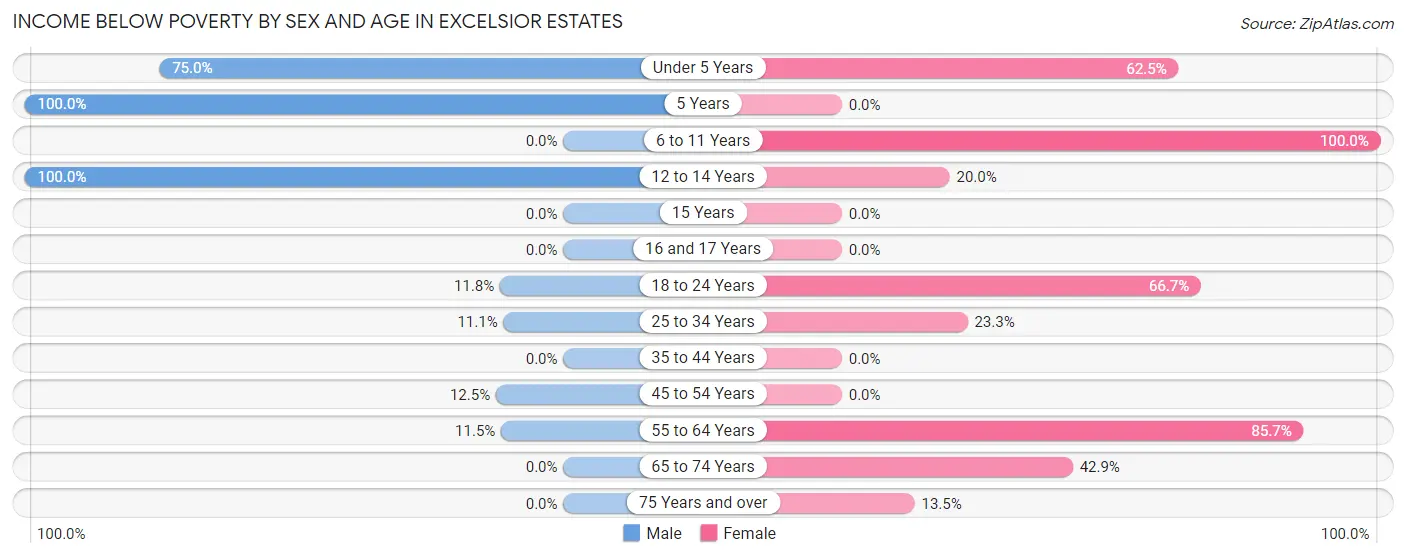
| Age Bracket | Male | Female |
| Under 5 Years | 6 (75.0%) | 5 (62.5%) |
| 5 Years | 3 (100.0%) | 0 (0.0%) |
| 6 to 11 Years | 0 (0.0%) | 4 (100.0%) |
| 12 to 14 Years | 1 (100.0%) | 1 (20.0%) |
| 15 Years | 0 (0.0%) | 0 (0.0%) |
| 16 and 17 Years | 0 (0.0%) | 0 (0.0%) |
| 18 to 24 Years | 4 (11.8%) | 4 (66.7%) |
| 25 to 34 Years | 2 (11.1%) | 7 (23.3%) |
| 35 to 44 Years | 0 (0.0%) | 0 (0.0%) |
| 45 to 54 Years | 2 (12.5%) | 0 (0.0%) |
| 55 to 64 Years | 3 (11.5%) | 6 (85.7%) |
| 65 to 74 Years | 0 (0.0%) | 3 (42.9%) |
| 75 Years and over | 0 (0.0%) | 5 (13.5%) |
| Total | 21 (16.7%) | 35 (18.7%) |
Income Above Poverty by Sex and Age in Excelsior Estates
According to the poverty statistics in Excelsior Estates, males aged 16 and 17 years and females aged 16 and 17 years are the age groups that are most secure financially, with 100.0% of males and 100.0% of females in these age groups living above the poverty line.
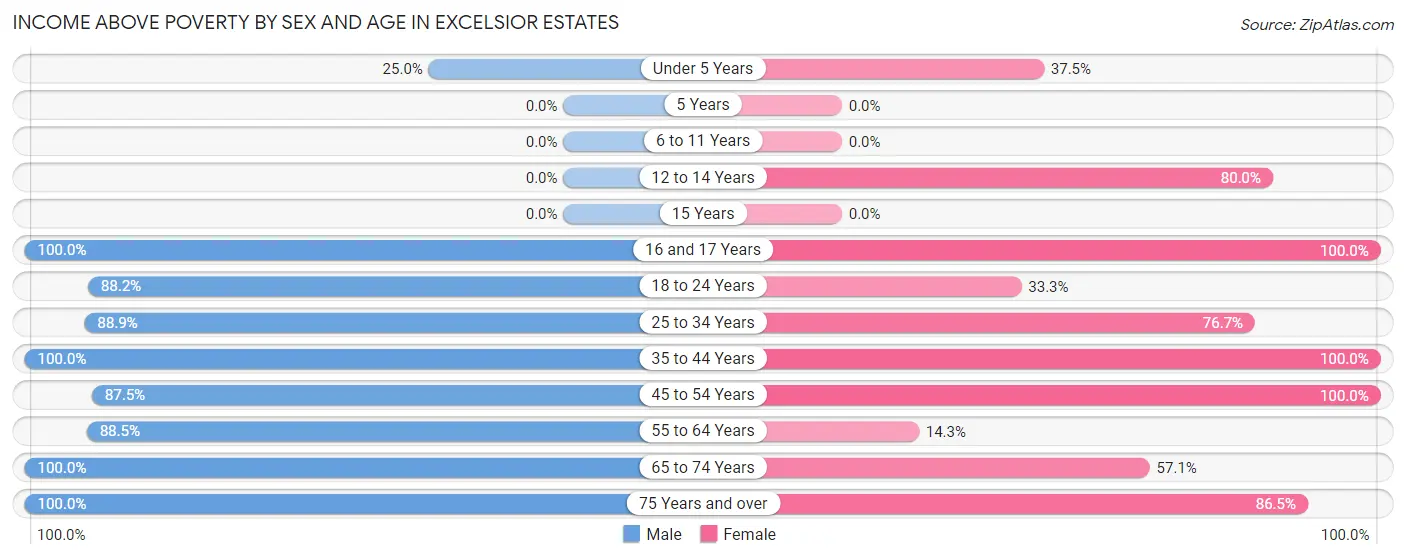
| Age Bracket | Male | Female |
| Under 5 Years | 2 (25.0%) | 3 (37.5%) |
| 5 Years | 0 (0.0%) | 0 (0.0%) |
| 6 to 11 Years | 0 (0.0%) | 0 (0.0%) |
| 12 to 14 Years | 0 (0.0%) | 4 (80.0%) |
| 15 Years | 0 (0.0%) | 0 (0.0%) |
| 16 and 17 Years | 13 (100.0%) | 19 (100.0%) |
| 18 to 24 Years | 30 (88.2%) | 2 (33.3%) |
| 25 to 34 Years | 16 (88.9%) | 23 (76.7%) |
| 35 to 44 Years | 4 (100.0%) | 32 (100.0%) |
| 45 to 54 Years | 14 (87.5%) | 32 (100.0%) |
| 55 to 64 Years | 23 (88.5%) | 1 (14.3%) |
| 65 to 74 Years | 1 (100.0%) | 4 (57.1%) |
| 75 Years and over | 2 (100.0%) | 32 (86.5%) |
| Total | 105 (83.3%) | 152 (81.3%) |
Income Below Poverty Among Married-Couple Families in Excelsior Estates
The poverty statistics for married-couple families in Excelsior Estates show that 13.8% or 4 of the total 29 families live below the poverty line. Families with no children have the highest poverty rate of 60.0%, comprising of 3 families. On the other hand, families with 1 or 2 children have the lowest poverty rate of 4.2%, which includes 1 families.
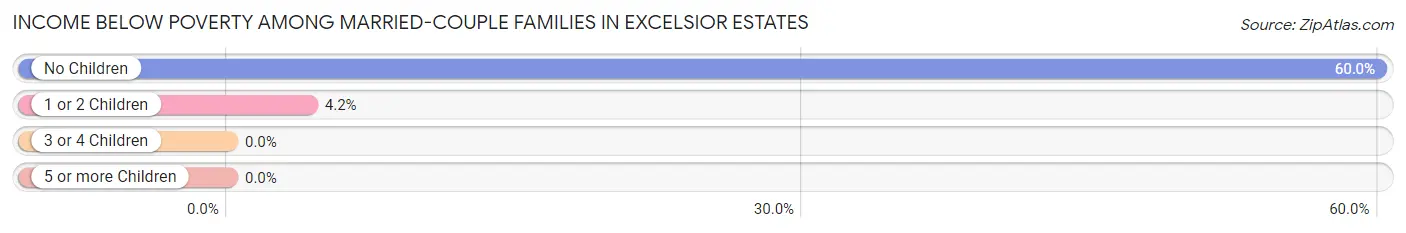
| Children | Above Poverty | Below Poverty |
| No Children | 2 (40.0%) | 3 (60.0%) |
| 1 or 2 Children | 23 (95.8%) | 1 (4.2%) |
| 3 or 4 Children | 0 (0.0%) | 0 (0.0%) |
| 5 or more Children | 0 (0.0%) | 0 (0.0%) |
| Total | 25 (86.2%) | 4 (13.8%) |
Income Below Poverty Among Single-Parent Households in Excelsior Estates
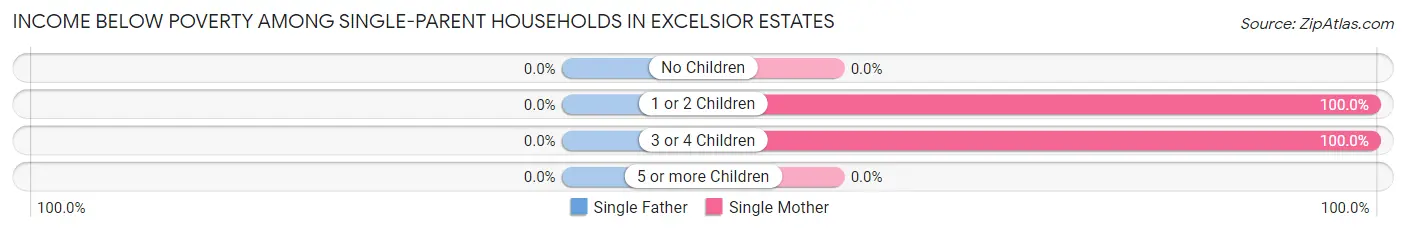
| Children | Single Father | Single Mother |
| No Children | 0 (0.0%) | 0 (0.0%) |
| 1 or 2 Children | 0 (0.0%) | 4 (100.0%) |
| 3 or 4 Children | 0 (0.0%) | 3 (100.0%) |
| 5 or more Children | 0 (0.0%) | 0 (0.0%) |
| Total | 0 (0.0%) | 7 (38.9%) |
Income Below Poverty Among Married-Couple vs Single-Parent Households in Excelsior Estates
The poverty data for Excelsior Estates shows that 4 of the married-couple family households (13.8%) and 7 of the single-parent households (15.6%) are living below the poverty level. Within the married-couple family households, those with no children have the highest poverty rate, with 3 households (60.0%) falling below the poverty line. Among the single-parent households, those with 3 or 4 children have the highest poverty rate, with 3 household (100.0%) living below poverty.
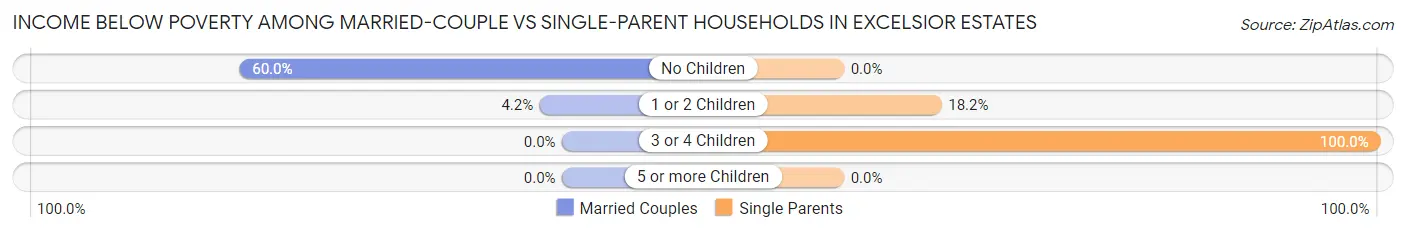
| Children | Married-Couple Families | Single-Parent Households |
| No Children | 3 (60.0%) | 0 (0.0%) |
| 1 or 2 Children | 1 (4.2%) | 4 (18.2%) |
| 3 or 4 Children | 0 (0.0%) | 3 (100.0%) |
| 5 or more Children | 0 (0.0%) | 0 (0.0%) |
| Total | 4 (13.8%) | 7 (15.6%) |
Race in Excelsior Estates
The most populous races in Excelsior Estates are White / Caucasian (297 | 94.9%), Hispanic or Latino (30 | 9.6%), and Two or more Races (16 | 5.1%).
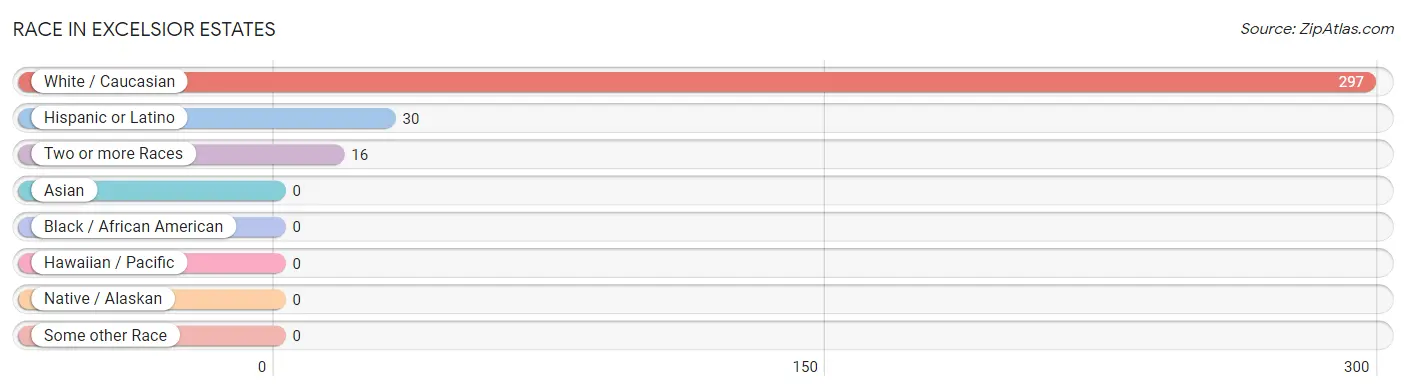
| Race | # Population | % Population |
| Asian | 0 | 0.0% |
| Black / African American | 0 | 0.0% |
| Hawaiian / Pacific | 0 | 0.0% |
| Hispanic or Latino | 30 | 9.6% |
| Native / Alaskan | 0 | 0.0% |
| White / Caucasian | 297 | 94.9% |
| Two or more Races | 16 | 5.1% |
| Some other Race | 0 | 0.0% |
| Total | 313 | 100.0% |
Ancestry in Excelsior Estates
The most populous ancestries reported in Excelsior Estates are German (40 | 12.8%), Irish (27 | 8.6%), Mexican (25 | 8.0%), American (14 | 4.5%), and Scandinavian (5 | 1.6%), together accounting for 35.5% of all Excelsior Estates residents.
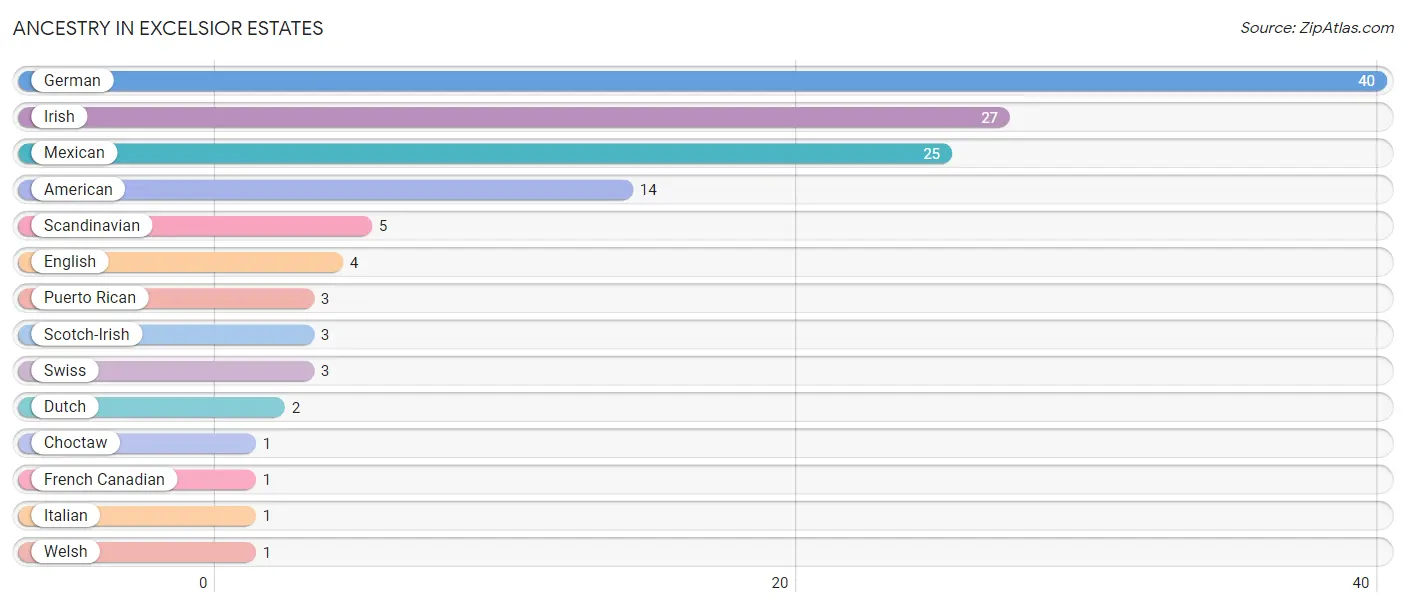
| Ancestry | # Population | % Population |
| American | 14 | 4.5% |
| Choctaw | 1 | 0.3% |
| Dutch | 2 | 0.6% |
| English | 4 | 1.3% |
| French Canadian | 1 | 0.3% |
| German | 40 | 12.8% |
| Irish | 27 | 8.6% |
| Italian | 1 | 0.3% |
| Mexican | 25 | 8.0% |
| Puerto Rican | 3 | 1.0% |
| Scandinavian | 5 | 1.6% |
| Scotch-Irish | 3 | 1.0% |
| Swiss | 3 | 1.0% |
| Welsh | 1 | 0.3% | View All 14 Rows |
Immigrants in Excelsior Estates

| Immigration Origin | # Population | % Population | View All 0 Rows |
Sex and Age in Excelsior Estates
Sex and Age in Excelsior Estates
The most populous age groups in Excelsior Estates are 20 to 24 Years (28 | 22.2%) for men and 75 to 79 Years (34 | 18.2%) for women.
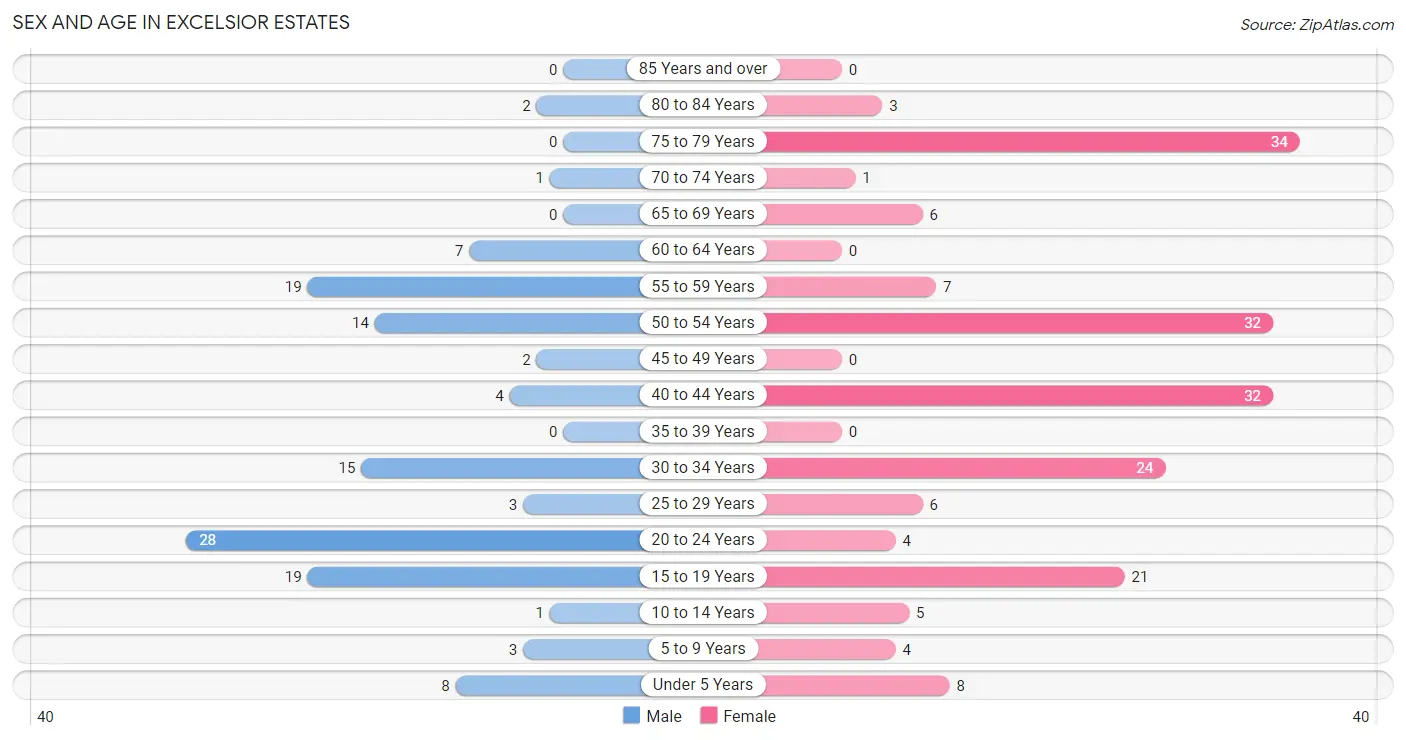
| Age Bracket | Male | Female |
| Under 5 Years | 8 (6.4%) | 8 (4.3%) |
| 5 to 9 Years | 3 (2.4%) | 4 (2.1%) |
| 10 to 14 Years | 1 (0.8%) | 5 (2.7%) |
| 15 to 19 Years | 19 (15.1%) | 21 (11.2%) |
| 20 to 24 Years | 28 (22.2%) | 4 (2.1%) |
| 25 to 29 Years | 3 (2.4%) | 6 (3.2%) |
| 30 to 34 Years | 15 (11.9%) | 24 (12.8%) |
| 35 to 39 Years | 0 (0.0%) | 0 (0.0%) |
| 40 to 44 Years | 4 (3.2%) | 32 (17.1%) |
| 45 to 49 Years | 2 (1.6%) | 0 (0.0%) |
| 50 to 54 Years | 14 (11.1%) | 32 (17.1%) |
| 55 to 59 Years | 19 (15.1%) | 7 (3.7%) |
| 60 to 64 Years | 7 (5.6%) | 0 (0.0%) |
| 65 to 69 Years | 0 (0.0%) | 6 (3.2%) |
| 70 to 74 Years | 1 (0.8%) | 1 (0.5%) |
| 75 to 79 Years | 0 (0.0%) | 34 (18.2%) |
| 80 to 84 Years | 2 (1.6%) | 3 (1.6%) |
| 85 Years and over | 0 (0.0%) | 0 (0.0%) |
| Total | 126 (100.0%) | 187 (100.0%) |
Families and Households in Excelsior Estates
Median Family Size in Excelsior Estates
The median family size in Excelsior Estates is 3.81 persons per family, with single male/father families (27 | 36.5%) accounting for the largest median family size of 4.81 persons per family. On the other hand, single female/mother families (18 | 24.3%) represent the smallest median family size with 3.11 persons per family.
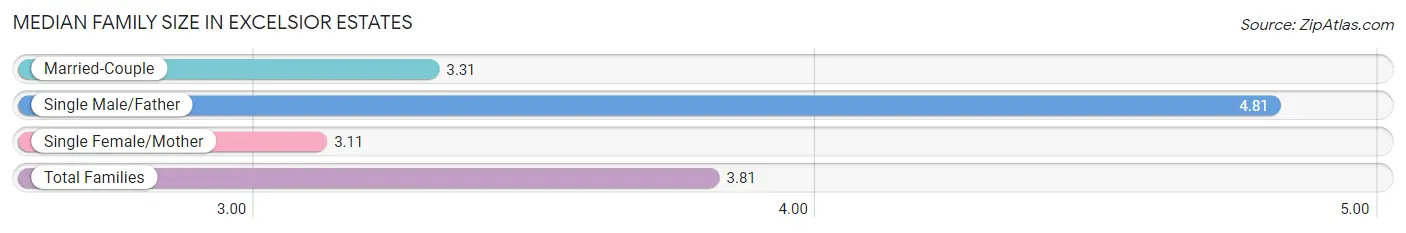
| Family Type | # Families | Family Size |
| Married-Couple | 29 (39.2%) | 3.31 |
| Single Male/Father | 27 (36.5%) | 4.81 |
| Single Female/Mother | 18 (24.3%) | 3.11 |
| Total Families | 74 (100.0%) | 3.81 |
Median Household Size in Excelsior Estates
The median household size in Excelsior Estates is 3.64 persons per household, with single male/father households (27 | 31.4%) accounting for the largest median household size of 4.89 persons per household. non-family households (12 | 14.0%) represent the smallest median household size with 1.25 persons per household.
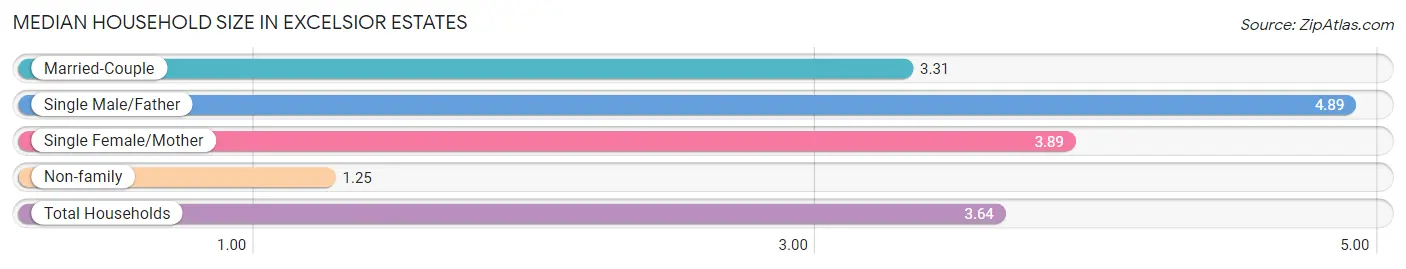
| Household Type | # Households | Household Size |
| Married-Couple | 29 (33.7%) | 3.31 |
| Single Male/Father | 27 (31.4%) | 4.89 |
| Single Female/Mother | 18 (20.9%) | 3.89 |
| Non-family | 12 (14.0%) | 1.25 |
| Total Households | 86 (100.0%) | 3.64 |
Household Size by Marriage Status in Excelsior Estates
Out of a total of 86 households in Excelsior Estates, 74 (86.1%) are family households, while 12 (14.0%) are nonfamily households. The most numerous type of family households are 4-person households, comprising 31, and the most common type of nonfamily households are 1-person households, comprising 8.
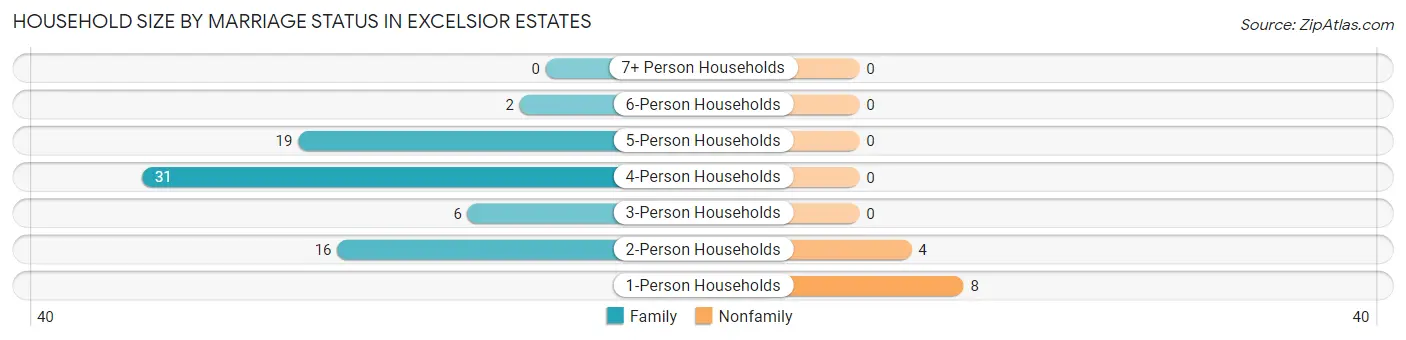
| Household Size | Family Households | Nonfamily Households |
| 1-Person Households | - | 8 (9.3%) |
| 2-Person Households | 16 (18.6%) | 4 (4.6%) |
| 3-Person Households | 6 (7.0%) | 0 (0.0%) |
| 4-Person Households | 31 (36.0%) | 0 (0.0%) |
| 5-Person Households | 19 (22.1%) | 0 (0.0%) |
| 6-Person Households | 2 (2.3%) | 0 (0.0%) |
| 7+ Person Households | 0 (0.0%) | 0 (0.0%) |
| Total | 74 (86.1%) | 12 (14.0%) |
Female Fertility in Excelsior Estates
Fertility by Age in Excelsior Estates
Average fertility rate in Excelsior Estates is 69.0 births per 1,000 women. Women in the age bracket of 20 to 34 years have the highest fertility rate with 176.0 births per 1,000 women. Women in the age bracket of 20 to 34 years acount for 100.0% of all women with births.
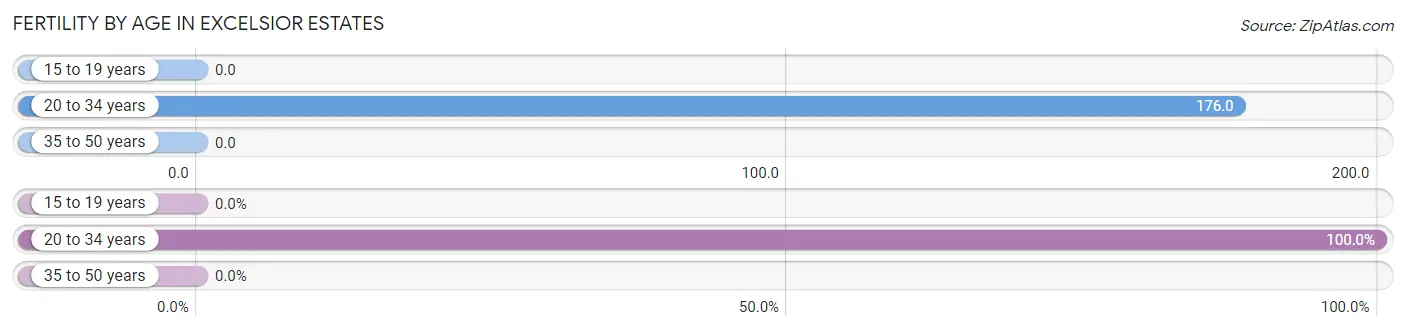
| Age Bracket | Women with Births | Births / 1,000 Women |
| 15 to 19 years | 0 (0.0%) | 0.0 |
| 20 to 34 years | 6 (100.0%) | 176.0 |
| 35 to 50 years | 0 (0.0%) | 0.0 |
| Total | 6 (100.0%) | 69.0 |
Fertility by Age by Marriage Status in Excelsior Estates
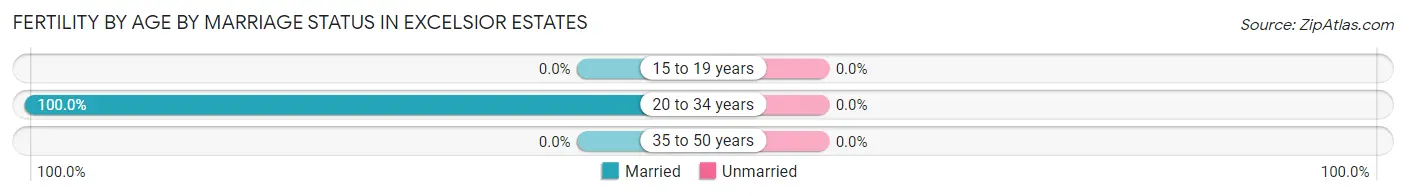
| Age Bracket | Married | Unmarried |
| 15 to 19 years | 0 (0.0%) | 0 (0.0%) |
| 20 to 34 years | 6 (100.0%) | 0 (0.0%) |
| 35 to 50 years | 0 (0.0%) | 0 (0.0%) |
| Total | 6 (100.0%) | 0 (0.0%) |
Fertility by Education in Excelsior Estates
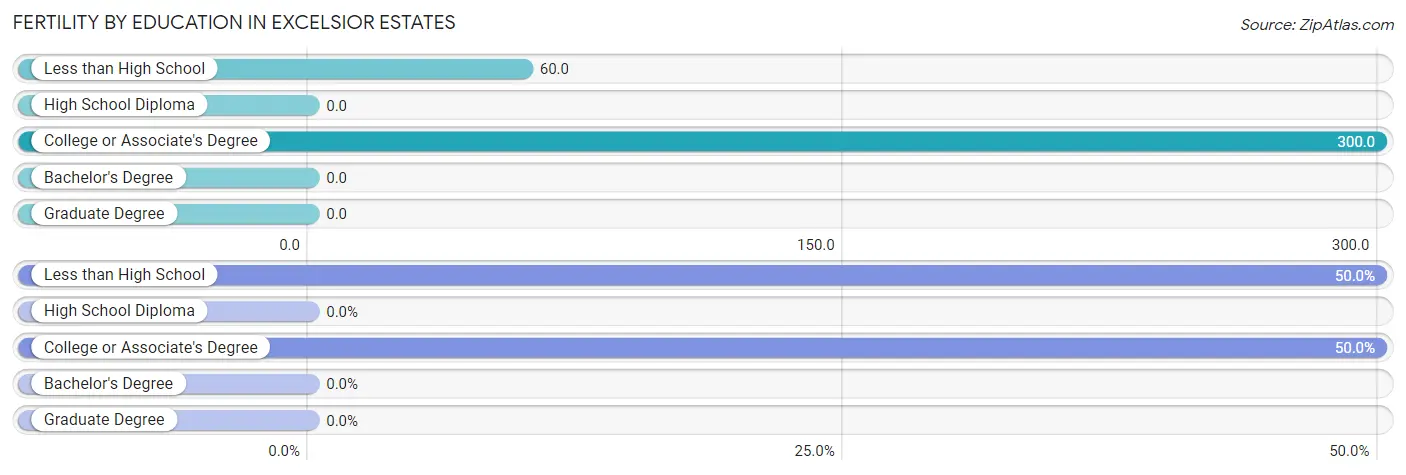
| Educational Attainment | Women with Births | Births / 1,000 Women |
| Less than High School | 3 (50.0%) | 60.0 |
| High School Diploma | 0 (0.0%) | 0.0 |
| College or Associate's Degree | 3 (50.0%) | 300.0 |
| Bachelor's Degree | 0 (0.0%) | 0.0 |
| Graduate Degree | 0 (0.0%) | 0.0 |
| Total | 6 (100.0%) | 69.0 |
Fertility by Education by Marriage Status in Excelsior Estates
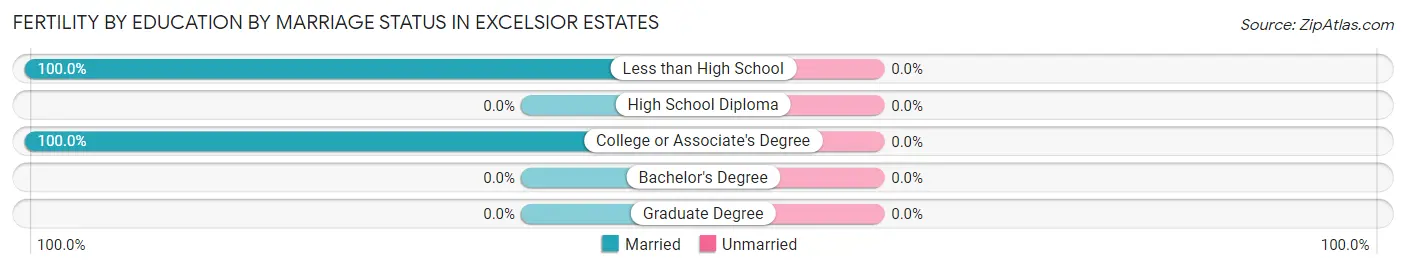
| Educational Attainment | Married | Unmarried |
| Less than High School | 3 (100.0%) | 0 (0.0%) |
| High School Diploma | 0 (0.0%) | 0 (0.0%) |
| College or Associate's Degree | 3 (100.0%) | 0 (0.0%) |
| Bachelor's Degree | 0 (0.0%) | 0 (0.0%) |
| Graduate Degree | 0 (0.0%) | 0 (0.0%) |
| Total | 6 (100.0%) | 0 (0.0%) |
Employment Characteristics in Excelsior Estates
Employment by Class of Employer in Excelsior Estates
Among the 139 employed individuals in Excelsior Estates, private company employees (103 | 74.1%), and not-for-profit organizations (36 | 25.9%) make up the most common classes of employment.
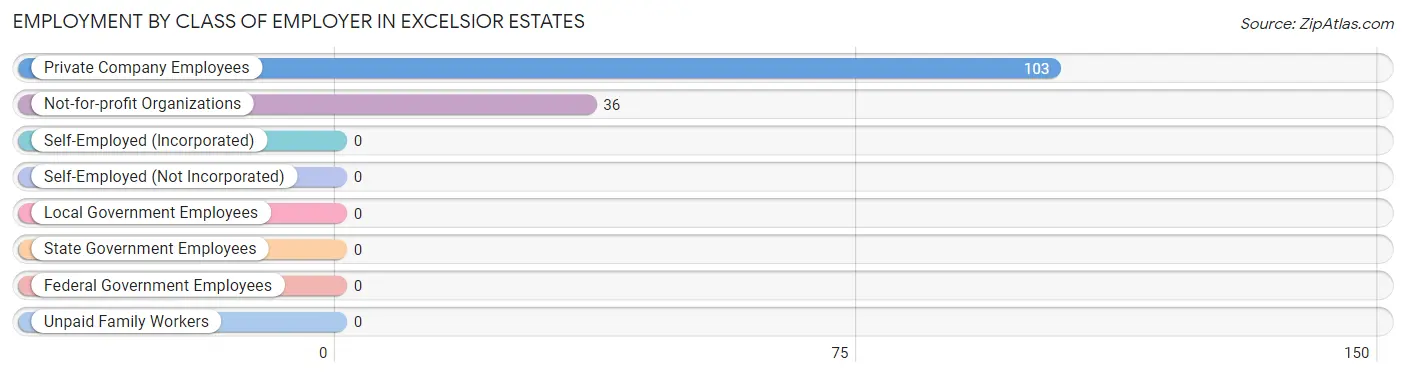
| Employer Class | # Employees | % Employees |
| Private Company Employees | 103 | 74.1% |
| Self-Employed (Incorporated) | 0 | 0.0% |
| Self-Employed (Not Incorporated) | 0 | 0.0% |
| Not-for-profit Organizations | 36 | 25.9% |
| Local Government Employees | 0 | 0.0% |
| State Government Employees | 0 | 0.0% |
| Federal Government Employees | 0 | 0.0% |
| Unpaid Family Workers | 0 | 0.0% |
| Total | 139 | 100.0% |
Employment Status by Age in Excelsior Estates
According to the labor force statistics for Excelsior Estates, out of the total population over 16 years of age (284), 52.8% or 150 individuals are in the labor force, with 6.0% or 9 of them unemployed. The age group with the highest labor force participation rate is 25 to 29 years, with 100.0% or 9 individuals in the labor force. Within the labor force, the 16 to 19 years age range has the highest percentage of unemployed individuals, with 33.3% or 1 of them being unemployed.
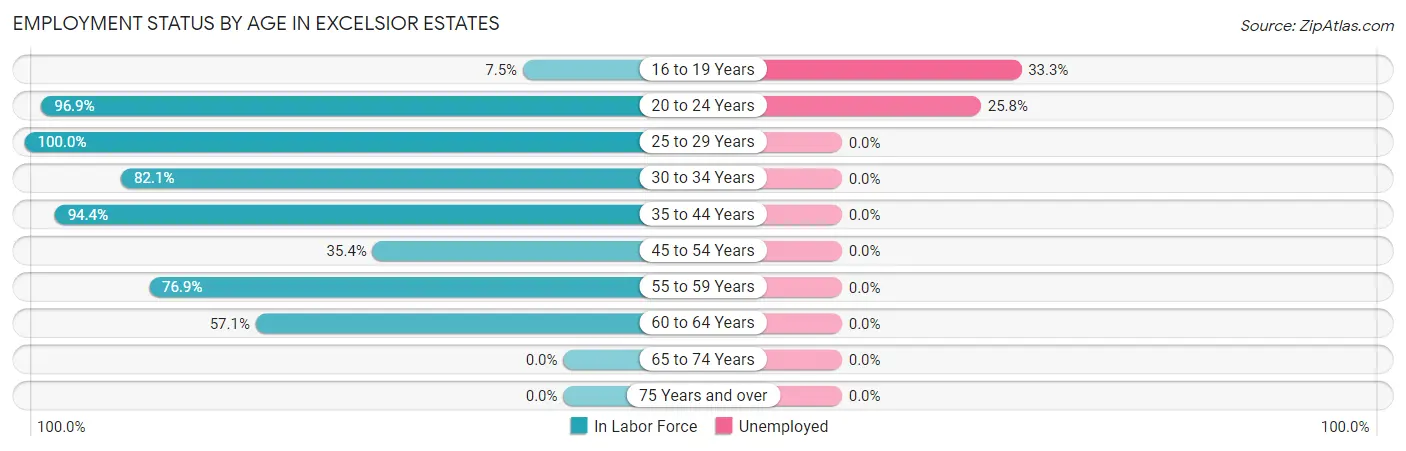
| Age Bracket | In Labor Force | Unemployed |
| 16 to 19 Years | 3 (7.5%) | 1 (33.3%) |
| 20 to 24 Years | 31 (96.9%) | 8 (25.8%) |
| 25 to 29 Years | 9 (100.0%) | 0 (0.0%) |
| 30 to 34 Years | 32 (82.1%) | 0 (0.0%) |
| 35 to 44 Years | 34 (94.4%) | 0 (0.0%) |
| 45 to 54 Years | 17 (35.4%) | 0 (0.0%) |
| 55 to 59 Years | 20 (76.9%) | 0 (0.0%) |
| 60 to 64 Years | 4 (57.1%) | 0 (0.0%) |
| 65 to 74 Years | 0 (0.0%) | 0 (0.0%) |
| 75 Years and over | 0 (0.0%) | 0 (0.0%) |
| Total | 150 (52.8%) | 9 (6.0%) |
Employment Status by Educational Attainment in Excelsior Estates
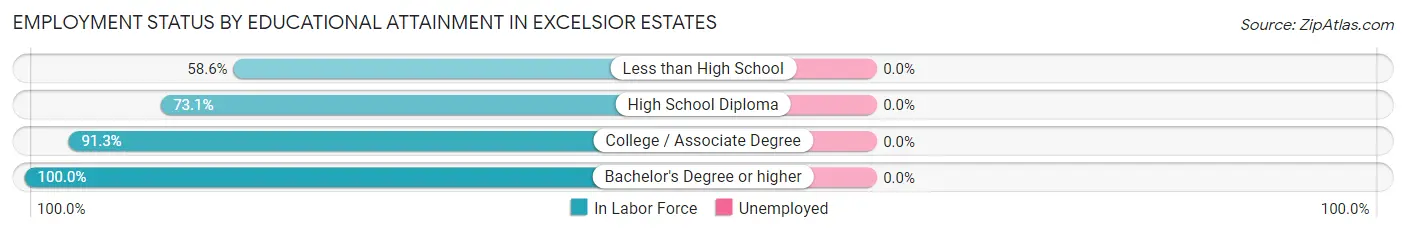
| Educational Attainment | In Labor Force | Unemployed |
| Less than High School | 41 (58.6%) | 0 (0.0%) |
| High School Diploma | 49 (73.1%) | 0 (0.0%) |
| College / Associate Degree | 21 (91.3%) | 0 (0.0%) |
| Bachelor's Degree or higher | 5 (100.0%) | 0 (0.0%) |
| Total | 116 (70.3%) | 0 (0.0%) |
Employment Occupations by Sex in Excelsior Estates
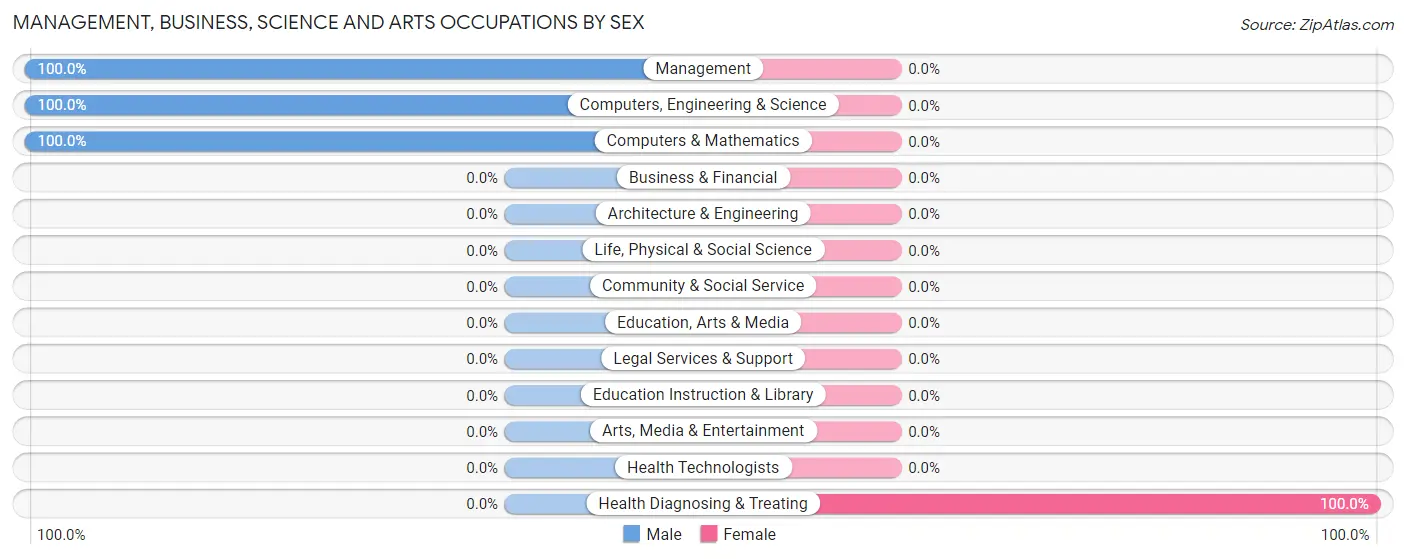
Management, Business, Science and Arts Occupations
The most common Management, Business, Science and Arts occupations in Excelsior Estates are Computers, Engineering & Science (3 | 2.1%), Computers & Mathematics (3 | 2.1%), Health Diagnosing & Treating (2 | 1.4%), and Management (1 | 0.7%).
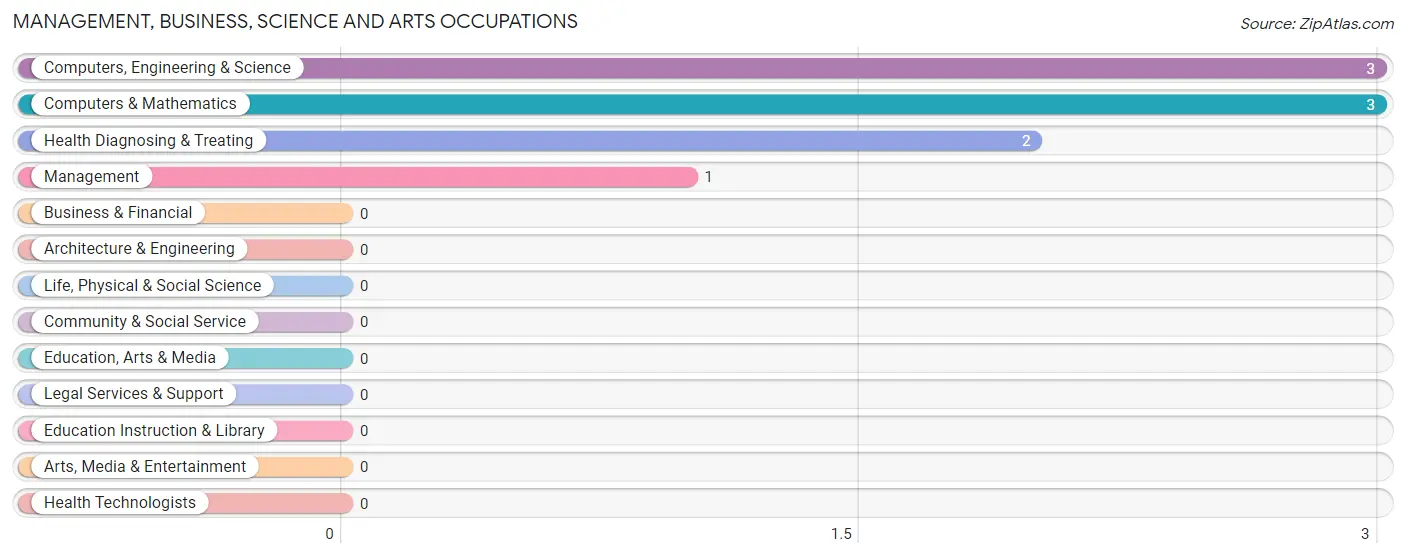
Management, Business, Science and Arts Occupations by Sex
| Occupation | Male | Female |
| Management | 1 (100.0%) | 0 (0.0%) |
| Business & Financial | 0 (0.0%) | 0 (0.0%) |
| Computers, Engineering & Science | 3 (100.0%) | 0 (0.0%) |
| Computers & Mathematics | 3 (100.0%) | 0 (0.0%) |
| Architecture & Engineering | 0 (0.0%) | 0 (0.0%) |
| Life, Physical & Social Science | 0 (0.0%) | 0 (0.0%) |
| Community & Social Service | 0 (0.0%) | 0 (0.0%) |
| Education, Arts & Media | 0 (0.0%) | 0 (0.0%) |
| Legal Services & Support | 0 (0.0%) | 0 (0.0%) |
| Education Instruction & Library | 0 (0.0%) | 0 (0.0%) |
| Arts, Media & Entertainment | 0 (0.0%) | 0 (0.0%) |
| Health Diagnosing & Treating | 0 (0.0%) | 2 (100.0%) |
| Health Technologists | 0 (0.0%) | 0 (0.0%) |
| Total (Category) | 4 (66.7%) | 2 (33.3%) |
| Total (Overall) | 73 (51.8%) | 68 (48.2%) |
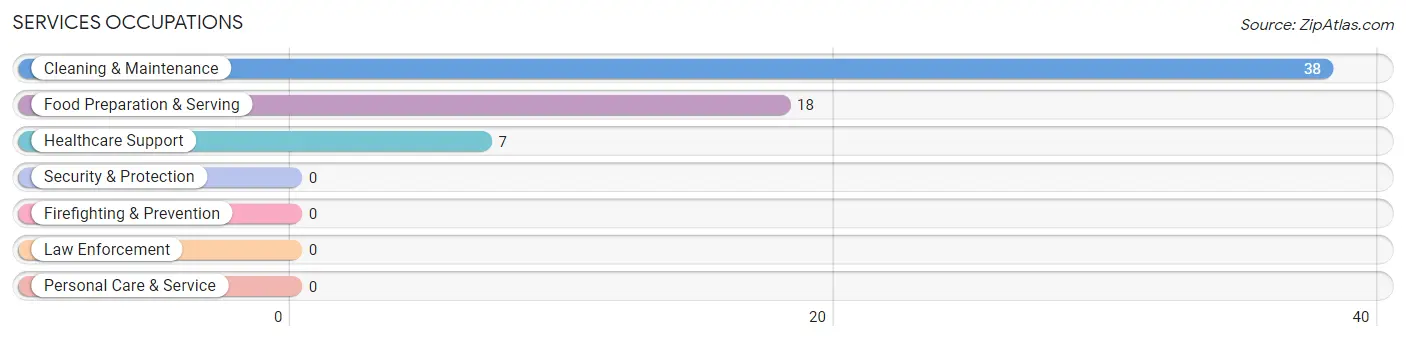
Services Occupations
The most common Services occupations in Excelsior Estates are Cleaning & Maintenance (38 | 27.0%), Food Preparation & Serving (18 | 12.8%), and Healthcare Support (7 | 5.0%).
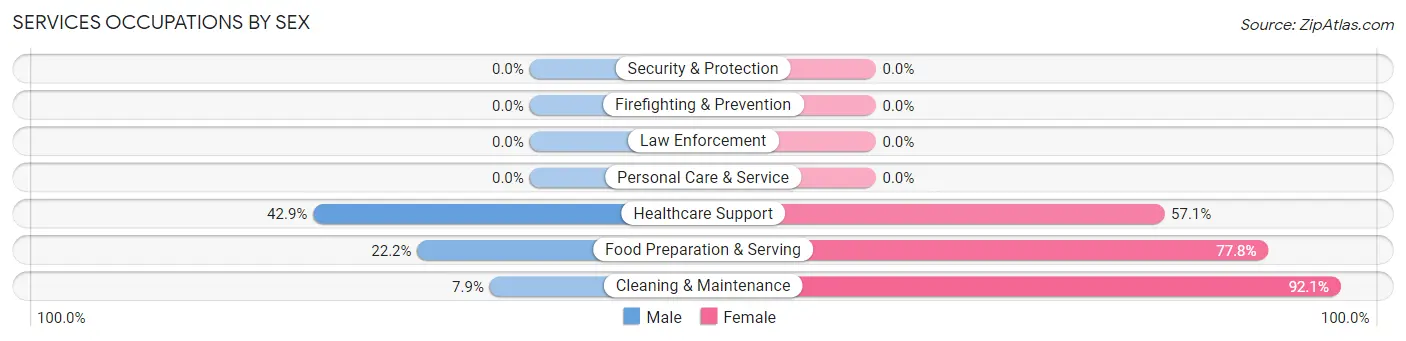
Services Occupations by Sex
Within the Services occupations in Excelsior Estates, the most male-oriented occupations are Healthcare Support (42.9%), Food Preparation & Serving (22.2%), and Cleaning & Maintenance (7.9%), while the most female-oriented occupations are Cleaning & Maintenance (92.1%), Food Preparation & Serving (77.8%), and Healthcare Support (57.1%).
| Occupation | Male | Female |
| Healthcare Support | 3 (42.9%) | 4 (57.1%) |
| Security & Protection | 0 (0.0%) | 0 (0.0%) |
| Firefighting & Prevention | 0 (0.0%) | 0 (0.0%) |
| Law Enforcement | 0 (0.0%) | 0 (0.0%) |
| Food Preparation & Serving | 4 (22.2%) | 14 (77.8%) |
| Cleaning & Maintenance | 3 (7.9%) | 35 (92.1%) |
| Personal Care & Service | 0 (0.0%) | 0 (0.0%) |
| Total (Category) | 10 (15.9%) | 53 (84.1%) |
| Total (Overall) | 73 (51.8%) | 68 (48.2%) |
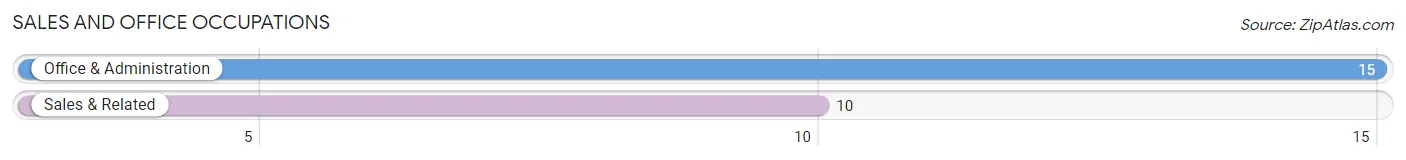
Sales and Office Occupations
The most common Sales and Office occupations in Excelsior Estates are Office & Administration (15 | 10.6%), and Sales & Related (10 | 7.1%).
Sales and Office Occupations by Sex

| Occupation | Male | Female |
| Sales & Related | 10 (100.0%) | 0 (0.0%) |
| Office & Administration | 3 (20.0%) | 12 (80.0%) |
| Total (Category) | 13 (52.0%) | 12 (48.0%) |
| Total (Overall) | 73 (51.8%) | 68 (48.2%) |
Natural Resources, Construction and Maintenance Occupations
The most common Natural Resources, Construction and Maintenance occupations in Excelsior Estates are , and Installation, Maintenance & Repair (26 | 18.4%).
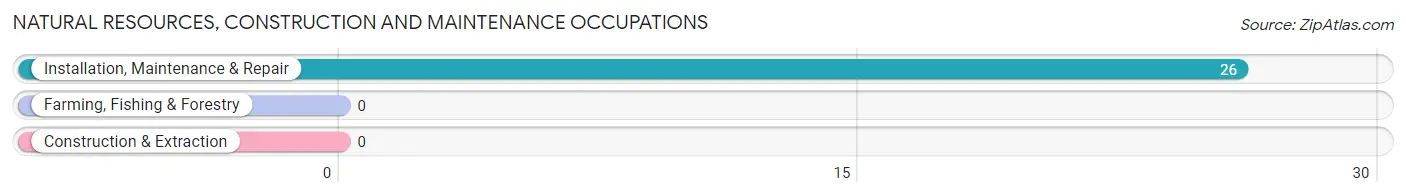
Natural Resources, Construction and Maintenance Occupations by Sex
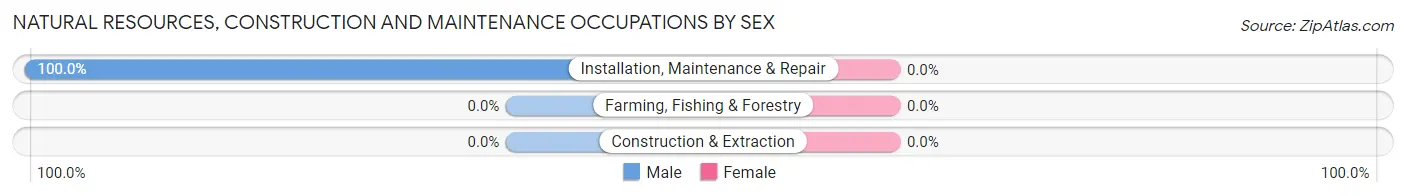
| Occupation | Male | Female |
| Farming, Fishing & Forestry | 0 (0.0%) | 0 (0.0%) |
| Construction & Extraction | 0 (0.0%) | 0 (0.0%) |
| Installation, Maintenance & Repair | 26 (100.0%) | 0 (0.0%) |
| Total (Category) | 26 (100.0%) | 0 (0.0%) |
| Total (Overall) | 73 (51.8%) | 68 (48.2%) |
Production, Transportation and Moving Occupations
The most common Production, Transportation and Moving occupations in Excelsior Estates are Transportation (14 | 9.9%), Production (4 | 2.8%), and Material Moving (3 | 2.1%).
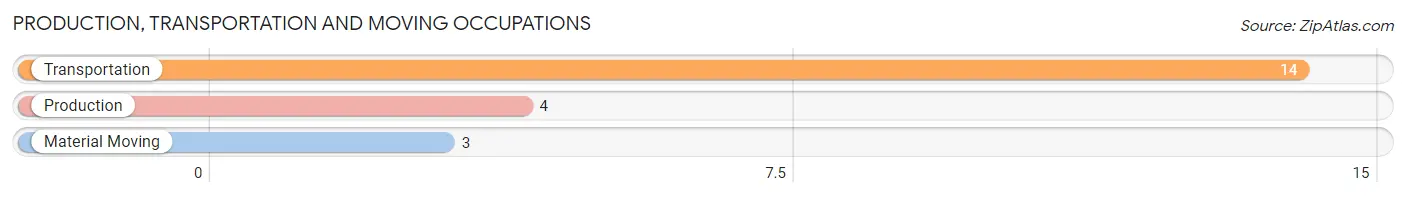
Production, Transportation and Moving Occupations by Sex
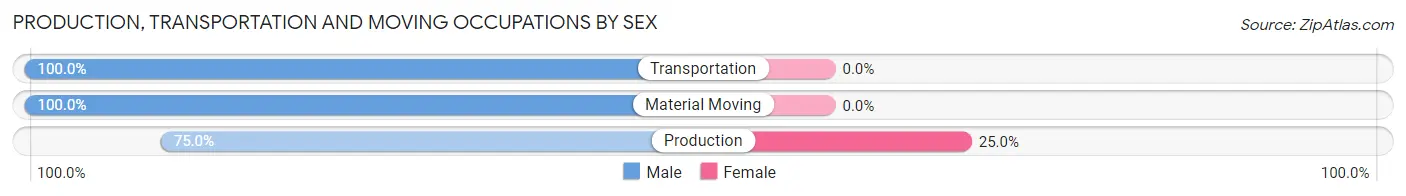
| Occupation | Male | Female |
| Production | 3 (75.0%) | 1 (25.0%) |
| Transportation | 14 (100.0%) | 0 (0.0%) |
| Material Moving | 3 (100.0%) | 0 (0.0%) |
| Total (Category) | 20 (95.2%) | 1 (4.8%) |
| Total (Overall) | 73 (51.8%) | 68 (48.2%) |
Employment Industries by Sex in Excelsior Estates
Employment Industries in Excelsior Estates
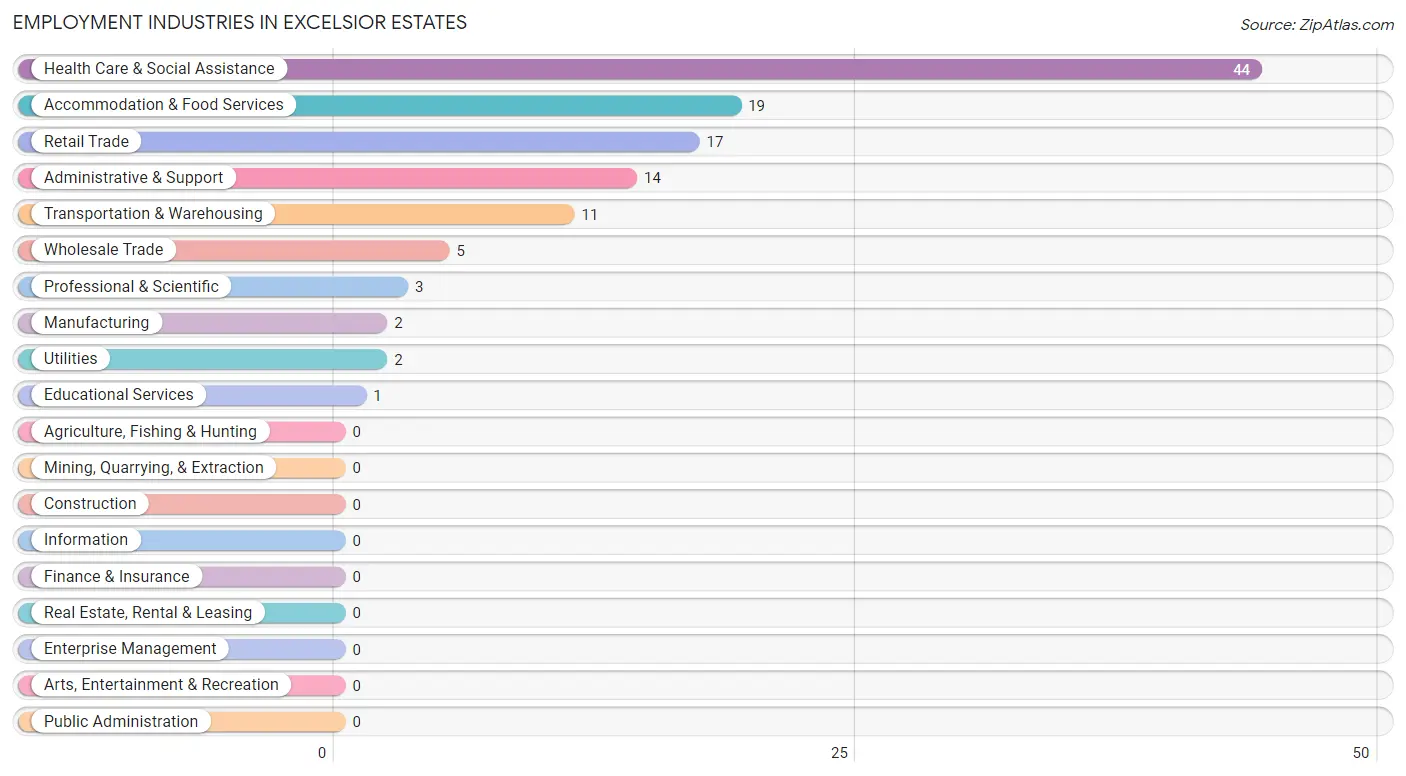
The major employment industries in Excelsior Estates include Health Care & Social Assistance (44 | 31.2%), Accommodation & Food Services (19 | 13.5%), Retail Trade (17 | 12.1%), Administrative & Support (14 | 9.9%), and Transportation & Warehousing (11 | 7.8%).
Employment Industries by Sex in Excelsior Estates
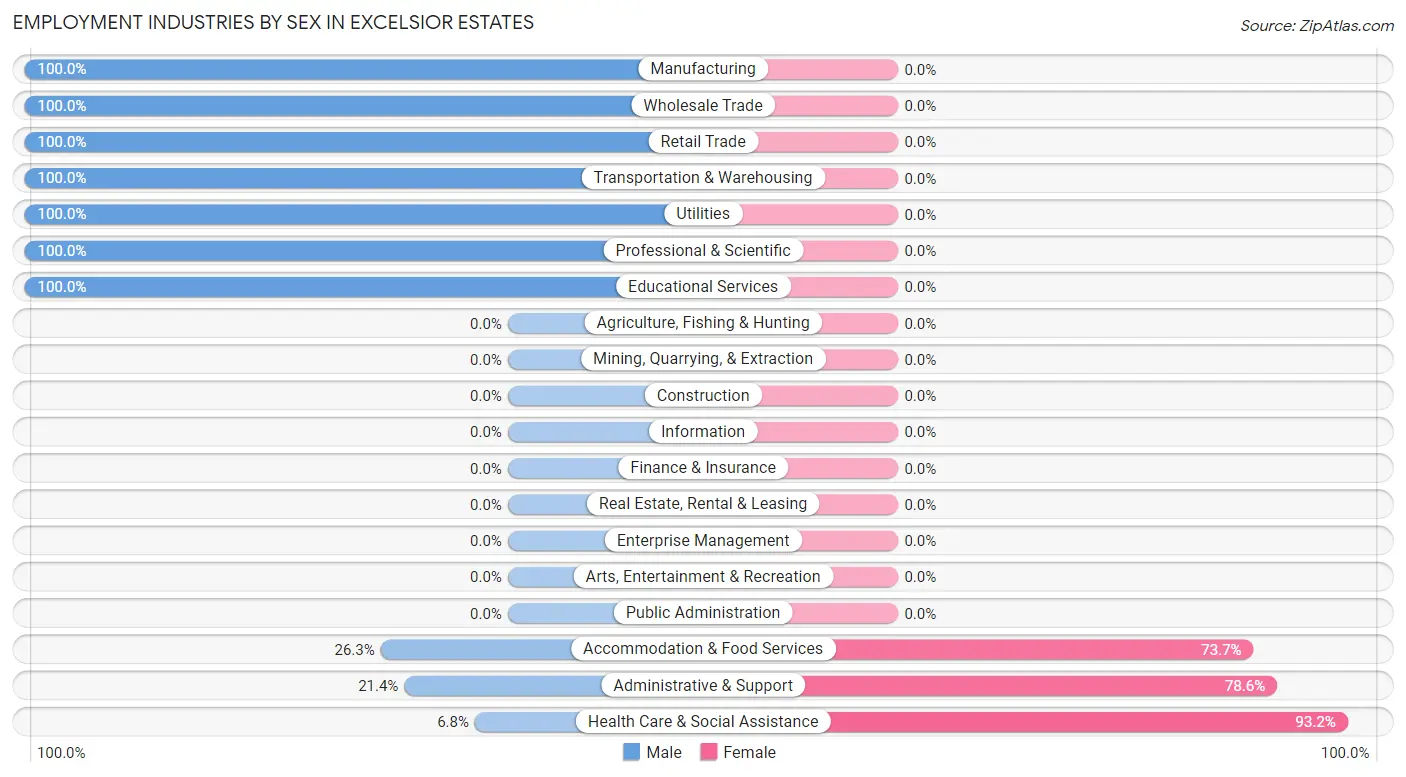
The Excelsior Estates industries that see more men than women are Manufacturing (100.0%), Wholesale Trade (100.0%), and Retail Trade (100.0%), whereas the industries that tend to have a higher number of women are Health Care & Social Assistance (93.2%), Administrative & Support (78.6%), and Accommodation & Food Services (73.7%).
| Industry | Male | Female |
| Agriculture, Fishing & Hunting | 0 (0.0%) | 0 (0.0%) |
| Mining, Quarrying, & Extraction | 0 (0.0%) | 0 (0.0%) |
| Construction | 0 (0.0%) | 0 (0.0%) |
| Manufacturing | 2 (100.0%) | 0 (0.0%) |
| Wholesale Trade | 5 (100.0%) | 0 (0.0%) |
| Retail Trade | 17 (100.0%) | 0 (0.0%) |
| Transportation & Warehousing | 11 (100.0%) | 0 (0.0%) |
| Utilities | 2 (100.0%) | 0 (0.0%) |
| Information | 0 (0.0%) | 0 (0.0%) |
| Finance & Insurance | 0 (0.0%) | 0 (0.0%) |
| Real Estate, Rental & Leasing | 0 (0.0%) | 0 (0.0%) |
| Professional & Scientific | 3 (100.0%) | 0 (0.0%) |
| Enterprise Management | 0 (0.0%) | 0 (0.0%) |
| Administrative & Support | 3 (21.4%) | 11 (78.6%) |
| Educational Services | 1 (100.0%) | 0 (0.0%) |
| Health Care & Social Assistance | 3 (6.8%) | 41 (93.2%) |
| Arts, Entertainment & Recreation | 0 (0.0%) | 0 (0.0%) |
| Accommodation & Food Services | 5 (26.3%) | 14 (73.7%) |
| Public Administration | 0 (0.0%) | 0 (0.0%) |
| Total | 73 (51.8%) | 68 (48.2%) |
Education in Excelsior Estates
School Enrollment in Excelsior Estates
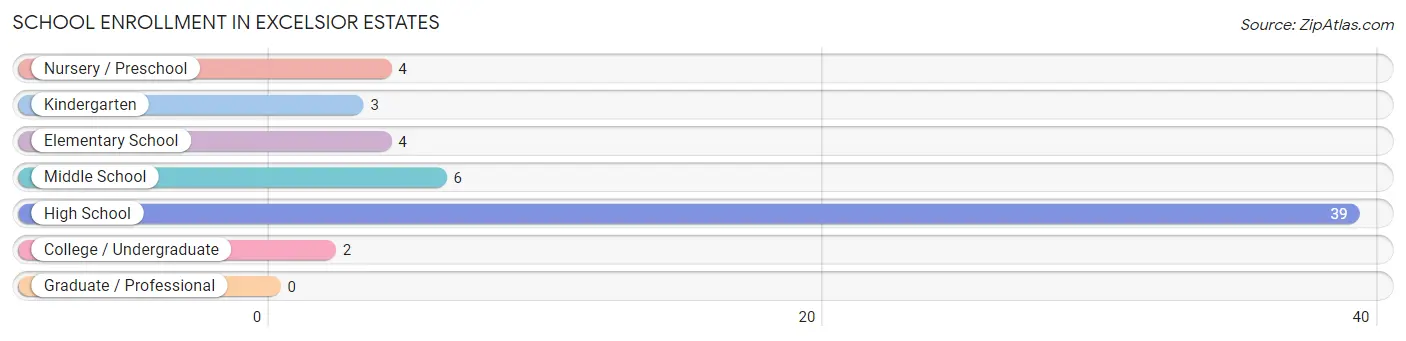
The most common levels of schooling among the 58 students in Excelsior Estates are high school (39 | 67.2%), middle school (6 | 10.3%), and nursery / preschool (4 | 6.9%).
| School Level | # Students | % Students |
| Nursery / Preschool | 4 | 6.9% |
| Kindergarten | 3 | 5.2% |
| Elementary School | 4 | 6.9% |
| Middle School | 6 | 10.3% |
| High School | 39 | 67.2% |
| College / Undergraduate | 2 | 3.5% |
| Graduate / Professional | 0 | 0.0% |
| Total | 58 | 100.0% |
School Enrollment by Age by Funding Source in Excelsior Estates
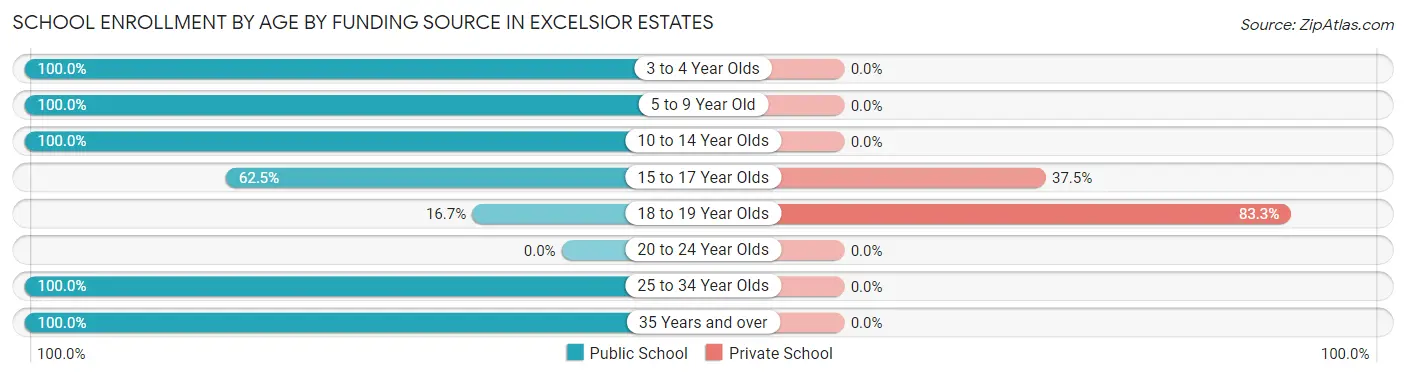
Out of a total of 58 students who are enrolled in schools in Excelsior Estates, 17 (29.3%) attend a private institution, while the remaining 41 (70.7%) are enrolled in public schools. The age group of 18 to 19 year olds has the highest likelihood of being enrolled in private schools, with 5 (83.3% in the age bracket) enrolled. Conversely, the age group of 3 to 4 year olds has the lowest likelihood of being enrolled in a private school, with 4 (100.0% in the age bracket) attending a public institution.
| Age Bracket | Public School | Private School |
| 3 to 4 Year Olds | 4 (100.0%) | 0 (0.0%) |
| 5 to 9 Year Old | 7 (100.0%) | 0 (0.0%) |
| 10 to 14 Year Olds | 6 (100.0%) | 0 (0.0%) |
| 15 to 17 Year Olds | 20 (62.5%) | 12 (37.5%) |
| 18 to 19 Year Olds | 1 (16.7%) | 5 (83.3%) |
| 20 to 24 Year Olds | 0 (0.0%) | 0 (0.0%) |
| 25 to 34 Year Olds | 2 (100.0%) | 0 (0.0%) |
| 35 Years and over | 1 (100.0%) | 0 (0.0%) |
| Total | 41 (70.7%) | 17 (29.3%) |
Educational Attainment by Field of Study in Excelsior Estates
Liberal arts & history (3 | 60.0%), and communications (2 | 40.0%) are the most common fields of study among 5 individuals in Excelsior Estates who have obtained a bachelor's degree or higher.
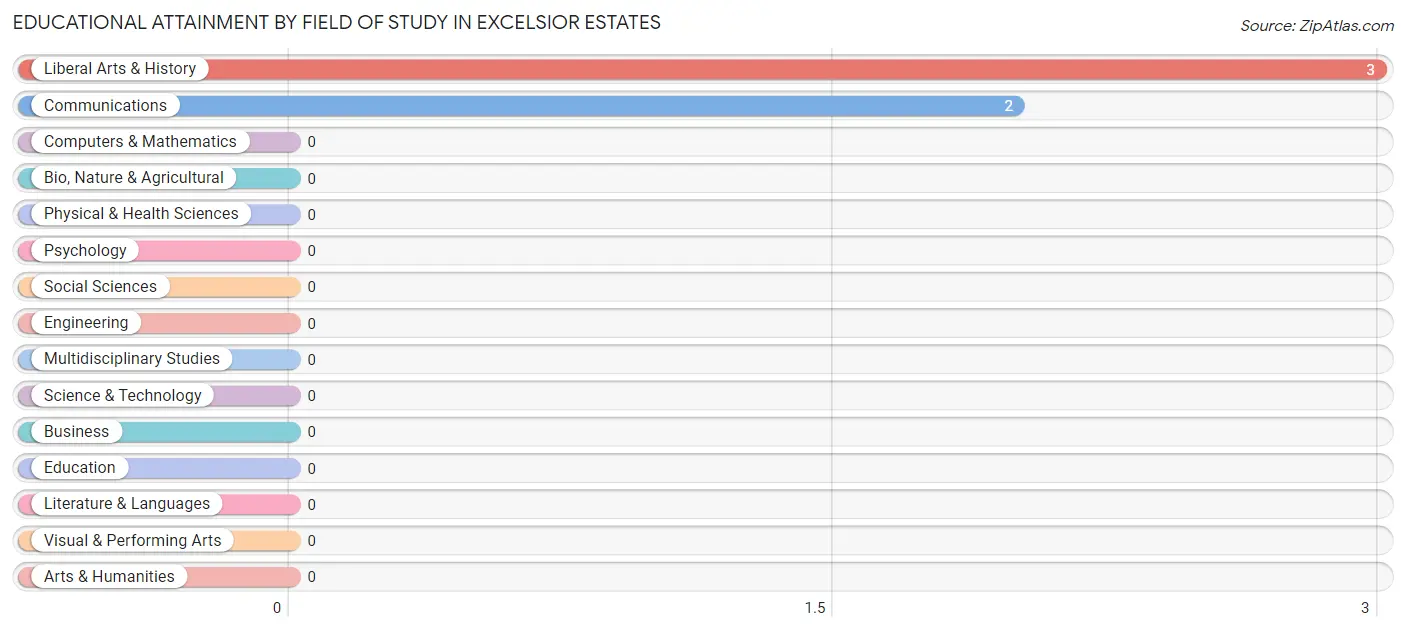
| Field of Study | # Graduates | % Graduates |
| Computers & Mathematics | 0 | 0.0% |
| Bio, Nature & Agricultural | 0 | 0.0% |
| Physical & Health Sciences | 0 | 0.0% |
| Psychology | 0 | 0.0% |
| Social Sciences | 0 | 0.0% |
| Engineering | 0 | 0.0% |
| Multidisciplinary Studies | 0 | 0.0% |
| Science & Technology | 0 | 0.0% |
| Business | 0 | 0.0% |
| Education | 0 | 0.0% |
| Literature & Languages | 0 | 0.0% |
| Liberal Arts & History | 3 | 60.0% |
| Visual & Performing Arts | 0 | 0.0% |
| Communications | 2 | 40.0% |
| Arts & Humanities | 0 | 0.0% |
| Total | 5 | 100.0% |
Transportation & Commute in Excelsior Estates
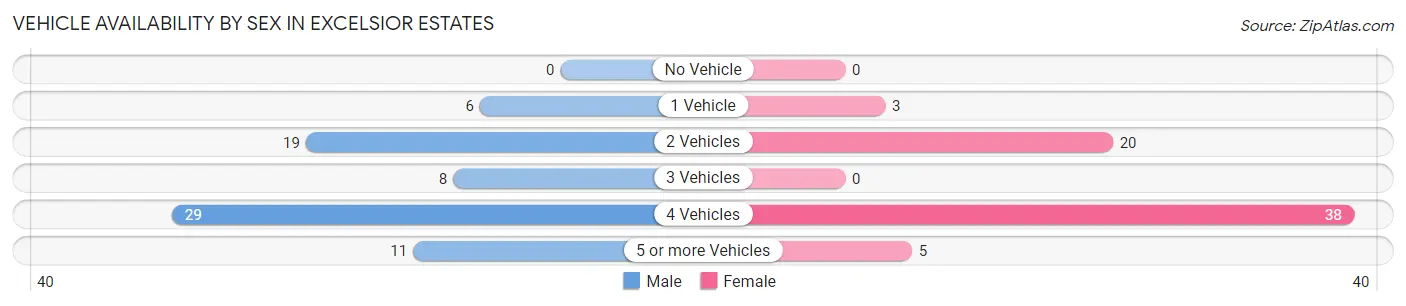
Vehicle Availability by Sex in Excelsior Estates
The most prevalent vehicle ownership categories in Excelsior Estates are males with 4 vehicles (29, accounting for 39.7%) and females with 4 vehicles (38, making up 43.9%).
| Vehicles Available | Male | Female |
| No Vehicle | 0 (0.0%) | 0 (0.0%) |
| 1 Vehicle | 6 (8.2%) | 3 (4.5%) |
| 2 Vehicles | 19 (26.0%) | 20 (30.3%) |
| 3 Vehicles | 8 (11.0%) | 0 (0.0%) |
| 4 Vehicles | 29 (39.7%) | 38 (57.6%) |
| 5 or more Vehicles | 11 (15.1%) | 5 (7.6%) |
| Total | 73 (100.0%) | 66 (100.0%) |
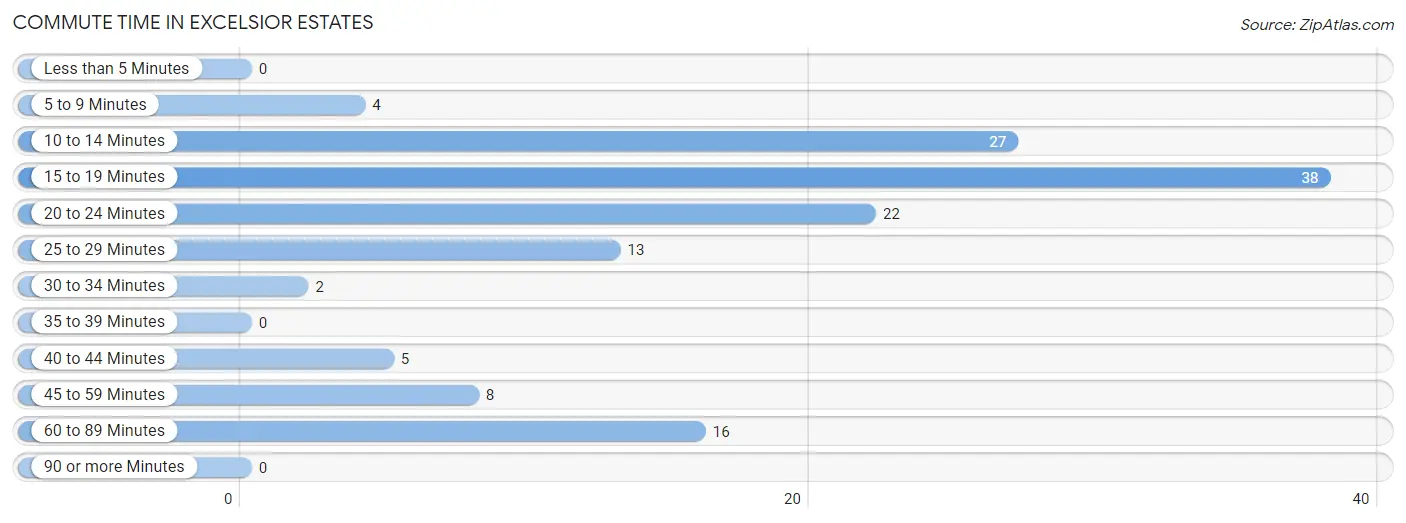
Commute Time in Excelsior Estates
The most frequently occuring commute durations in Excelsior Estates are 15 to 19 minutes (38 commuters, 28.1%), 10 to 14 minutes (27 commuters, 20.0%), and 20 to 24 minutes (22 commuters, 16.3%).
| Commute Time | # Commuters | % Commuters |
| Less than 5 Minutes | 0 | 0.0% |
| 5 to 9 Minutes | 4 | 3.0% |
| 10 to 14 Minutes | 27 | 20.0% |
| 15 to 19 Minutes | 38 | 28.1% |
| 20 to 24 Minutes | 22 | 16.3% |
| 25 to 29 Minutes | 13 | 9.6% |
| 30 to 34 Minutes | 2 | 1.5% |
| 35 to 39 Minutes | 0 | 0.0% |
| 40 to 44 Minutes | 5 | 3.7% |
| 45 to 59 Minutes | 8 | 5.9% |
| 60 to 89 Minutes | 16 | 11.8% |
| 90 or more Minutes | 0 | 0.0% |
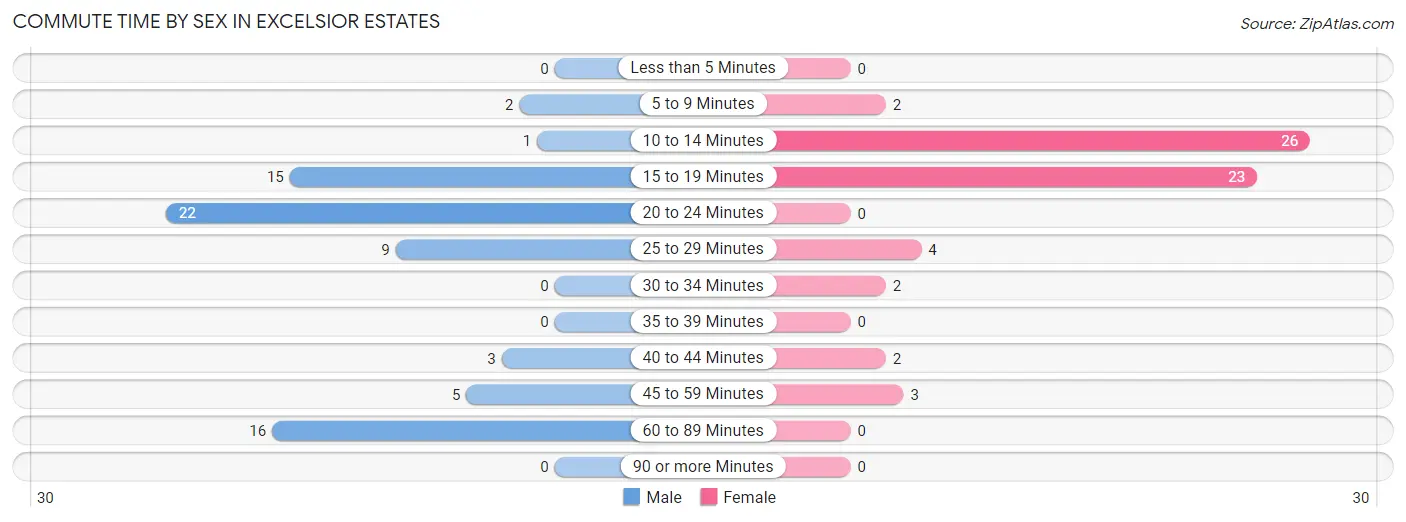
Commute Time by Sex in Excelsior Estates
The most common commute times in Excelsior Estates are 20 to 24 minutes (22 commuters, 30.1%) for males and 10 to 14 minutes (26 commuters, 41.9%) for females.
| Commute Time | Male | Female |
| Less than 5 Minutes | 0 (0.0%) | 0 (0.0%) |
| 5 to 9 Minutes | 2 (2.7%) | 2 (3.2%) |
| 10 to 14 Minutes | 1 (1.4%) | 26 (41.9%) |
| 15 to 19 Minutes | 15 (20.5%) | 23 (37.1%) |
| 20 to 24 Minutes | 22 (30.1%) | 0 (0.0%) |
| 25 to 29 Minutes | 9 (12.3%) | 4 (6.5%) |
| 30 to 34 Minutes | 0 (0.0%) | 2 (3.2%) |
| 35 to 39 Minutes | 0 (0.0%) | 0 (0.0%) |
| 40 to 44 Minutes | 3 (4.1%) | 2 (3.2%) |
| 45 to 59 Minutes | 5 (6.9%) | 3 (4.8%) |
| 60 to 89 Minutes | 16 (21.9%) | 0 (0.0%) |
| 90 or more Minutes | 0 (0.0%) | 0 (0.0%) |
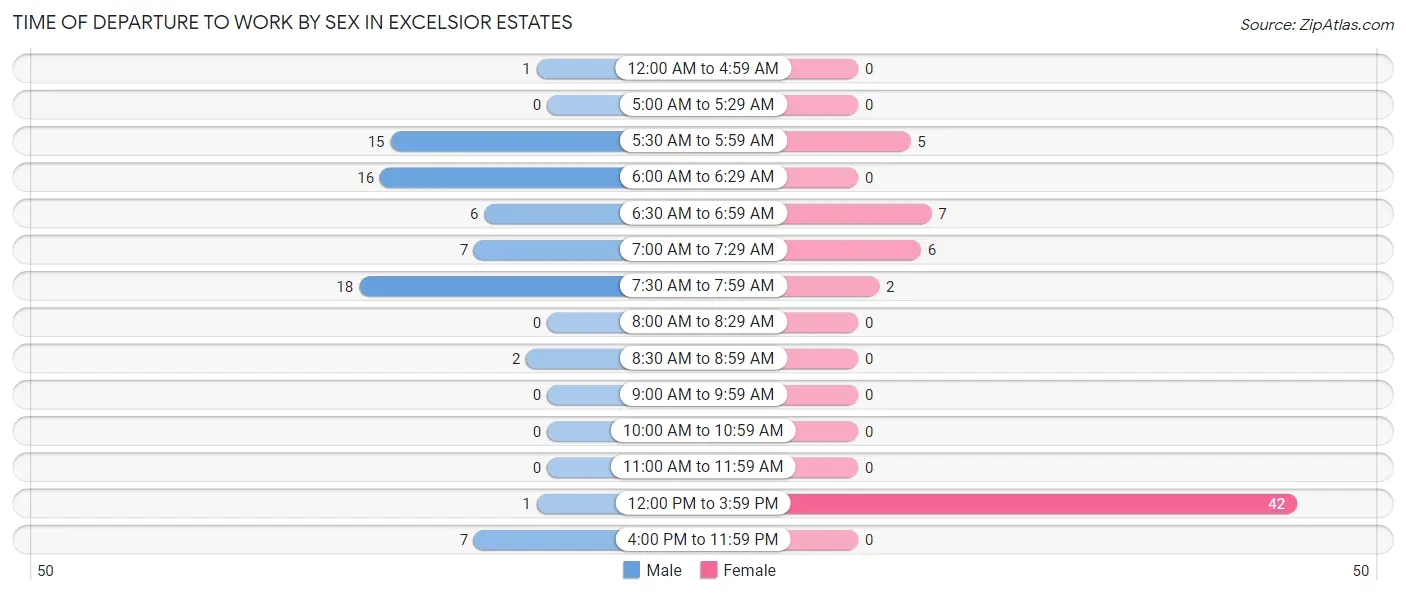
Time of Departure to Work by Sex in Excelsior Estates
The most frequent times of departure to work in Excelsior Estates are 7:30 AM to 7:59 AM (18, 24.7%) for males and 12:00 PM to 3:59 PM (42, 67.7%) for females.
| Time of Departure | Male | Female |
| 12:00 AM to 4:59 AM | 1 (1.4%) | 0 (0.0%) |
| 5:00 AM to 5:29 AM | 0 (0.0%) | 0 (0.0%) |
| 5:30 AM to 5:59 AM | 15 (20.5%) | 5 (8.1%) |
| 6:00 AM to 6:29 AM | 16 (21.9%) | 0 (0.0%) |
| 6:30 AM to 6:59 AM | 6 (8.2%) | 7 (11.3%) |
| 7:00 AM to 7:29 AM | 7 (9.6%) | 6 (9.7%) |
| 7:30 AM to 7:59 AM | 18 (24.7%) | 2 (3.2%) |
| 8:00 AM to 8:29 AM | 0 (0.0%) | 0 (0.0%) |
| 8:30 AM to 8:59 AM | 2 (2.7%) | 0 (0.0%) |
| 9:00 AM to 9:59 AM | 0 (0.0%) | 0 (0.0%) |
| 10:00 AM to 10:59 AM | 0 (0.0%) | 0 (0.0%) |
| 11:00 AM to 11:59 AM | 0 (0.0%) | 0 (0.0%) |
| 12:00 PM to 3:59 PM | 1 (1.4%) | 42 (67.7%) |
| 4:00 PM to 11:59 PM | 7 (9.6%) | 0 (0.0%) |
| Total | 73 (100.0%) | 62 (100.0%) |
Housing Occupancy in Excelsior Estates
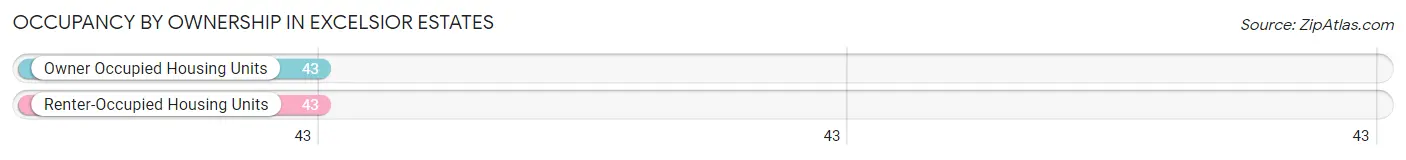
Occupancy by Ownership in Excelsior Estates
Of the total 86 dwellings in Excelsior Estates, owner-occupied units account for 43 (50.0%), while renter-occupied units make up 43 (50.0%).
| Occupancy | # Housing Units | % Housing Units |
| Owner Occupied Housing Units | 43 | 50.0% |
| Renter-Occupied Housing Units | 43 | 50.0% |
| Total Occupied Housing Units | 86 | 100.0% |
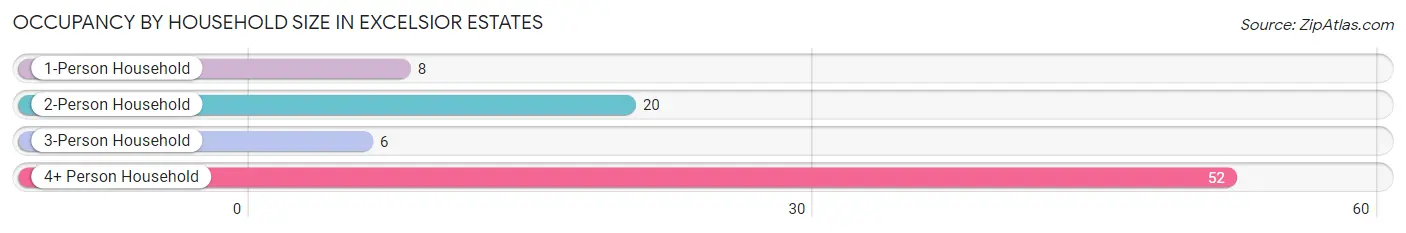
Occupancy by Household Size in Excelsior Estates
| Household Size | # Housing Units | % Housing Units |
| 1-Person Household | 8 | 9.3% |
| 2-Person Household | 20 | 23.3% |
| 3-Person Household | 6 | 7.0% |
| 4+ Person Household | 52 | 60.5% |
| Total Housing Units | 86 | 100.0% |
Occupancy by Ownership by Household Size in Excelsior Estates
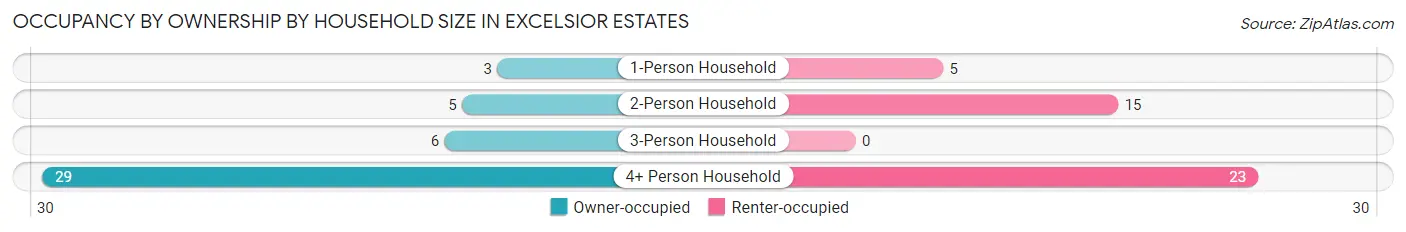
| Household Size | Owner-occupied | Renter-occupied |
| 1-Person Household | 3 (37.5%) | 5 (62.5%) |
| 2-Person Household | 5 (25.0%) | 15 (75.0%) |
| 3-Person Household | 6 (100.0%) | 0 (0.0%) |
| 4+ Person Household | 29 (55.8%) | 23 (44.2%) |
| Total Housing Units | 43 (50.0%) | 43 (50.0%) |
Occupancy by Educational Attainment in Excelsior Estates
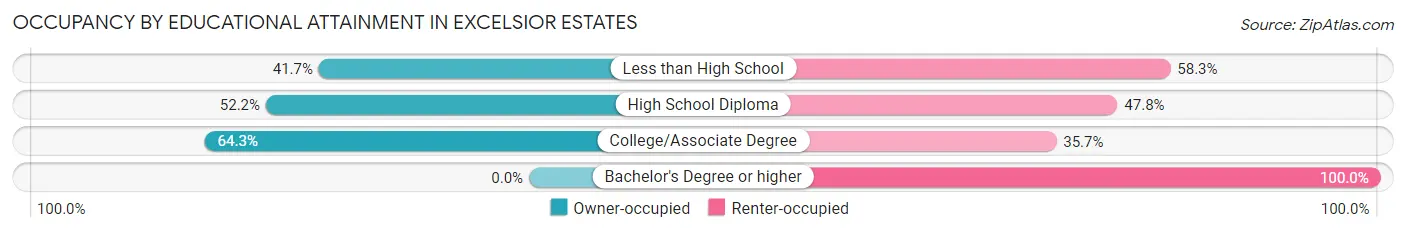
| Household Size | Owner-occupied | Renter-occupied |
| Less than High School | 10 (41.7%) | 14 (58.3%) |
| High School Diploma | 24 (52.2%) | 22 (47.8%) |
| College/Associate Degree | 9 (64.3%) | 5 (35.7%) |
| Bachelor's Degree or higher | 0 (0.0%) | 2 (100.0%) |
Occupancy by Age of Householder in Excelsior Estates
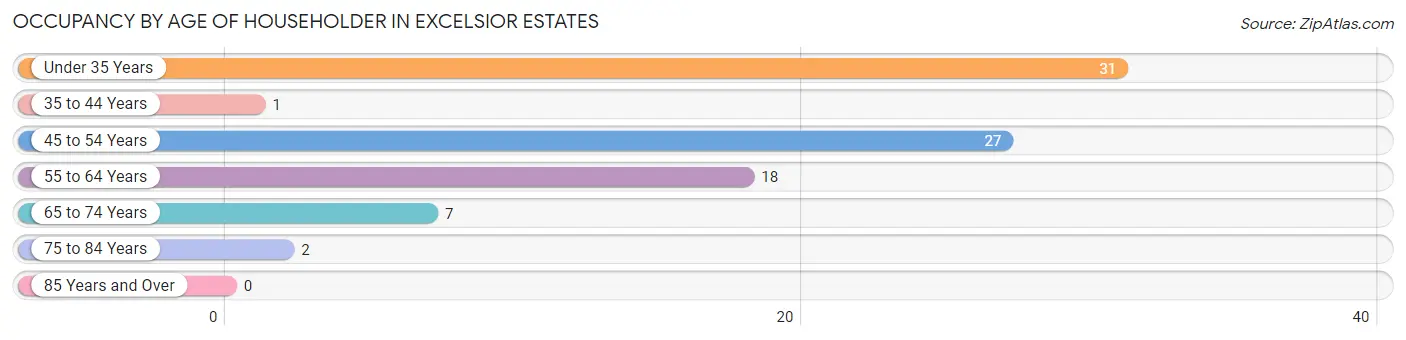
| Age Bracket | # Households | % Households |
| Under 35 Years | 31 | 36.0% |
| 35 to 44 Years | 1 | 1.2% |
| 45 to 54 Years | 27 | 31.4% |
| 55 to 64 Years | 18 | 20.9% |
| 65 to 74 Years | 7 | 8.1% |
| 75 to 84 Years | 2 | 2.3% |
| 85 Years and Over | 0 | 0.0% |
| Total | 86 | 100.0% |
Housing Finances in Excelsior Estates
Median Income by Occupancy in Excelsior Estates
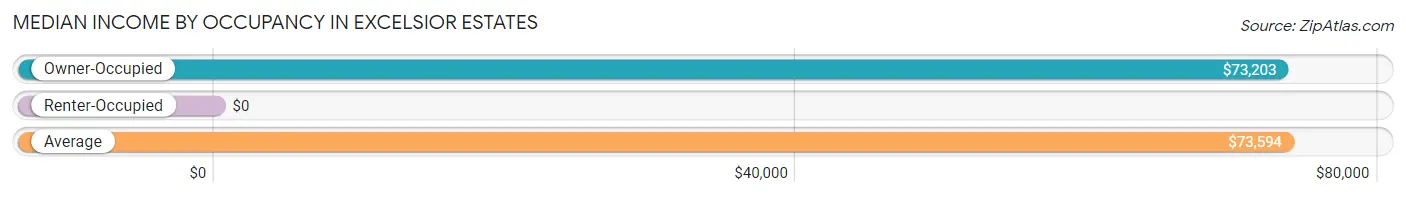
| Occupancy Type | # Households | Median Income |
| Owner-Occupied | 43 (50.0%) | $73,203 |
| Renter-Occupied | 43 (50.0%) | $0 |
| Average | 86 (100.0%) | $73,594 |
Occupancy by Householder Income Bracket in Excelsior Estates
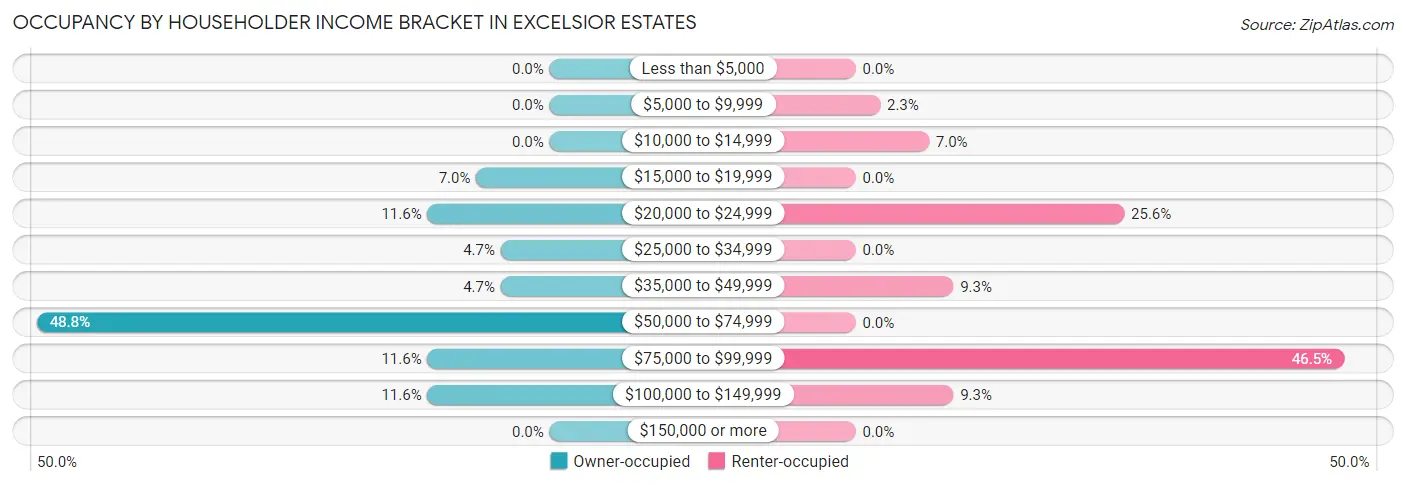
| Income Bracket | Owner-occupied | Renter-occupied |
| Less than $5,000 | 0 (0.0%) | 0 (0.0%) |
| $5,000 to $9,999 | 0 (0.0%) | 1 (2.3%) |
| $10,000 to $14,999 | 0 (0.0%) | 3 (7.0%) |
| $15,000 to $19,999 | 3 (7.0%) | 0 (0.0%) |
| $20,000 to $24,999 | 5 (11.6%) | 11 (25.6%) |
| $25,000 to $34,999 | 2 (4.6%) | 0 (0.0%) |
| $35,000 to $49,999 | 2 (4.6%) | 4 (9.3%) |
| $50,000 to $74,999 | 21 (48.8%) | 0 (0.0%) |
| $75,000 to $99,999 | 5 (11.6%) | 20 (46.5%) |
| $100,000 to $149,999 | 5 (11.6%) | 4 (9.3%) |
| $150,000 or more | 0 (0.0%) | 0 (0.0%) |
| Total | 43 (100.0%) | 43 (100.0%) |
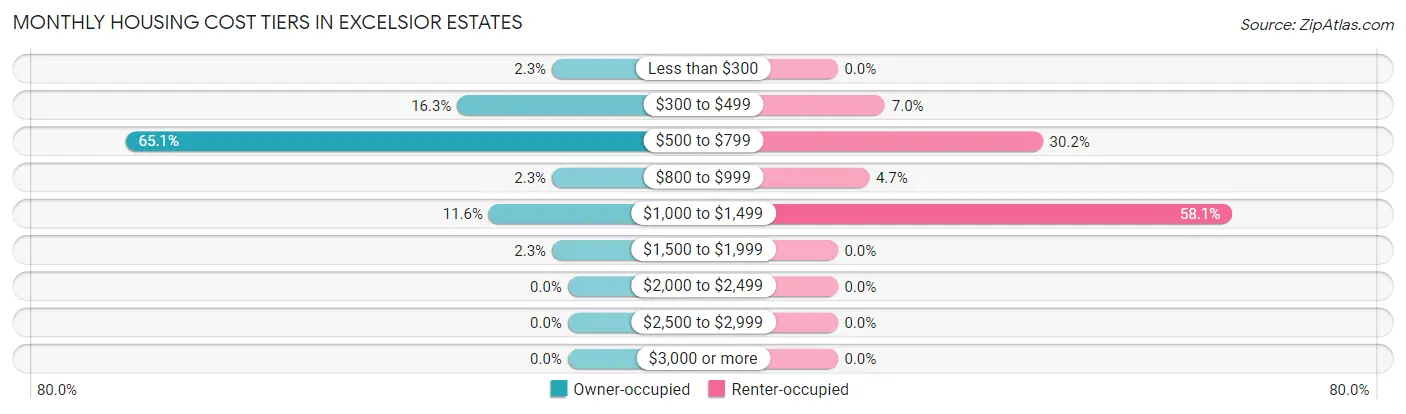
Monthly Housing Cost Tiers in Excelsior Estates
| Monthly Cost | Owner-occupied | Renter-occupied |
| Less than $300 | 1 (2.3%) | 0 (0.0%) |
| $300 to $499 | 7 (16.3%) | 3 (7.0%) |
| $500 to $799 | 28 (65.1%) | 13 (30.2%) |
| $800 to $999 | 1 (2.3%) | 2 (4.6%) |
| $1,000 to $1,499 | 5 (11.6%) | 25 (58.1%) |
| $1,500 to $1,999 | 1 (2.3%) | 0 (0.0%) |
| $2,000 to $2,499 | 0 (0.0%) | 0 (0.0%) |
| $2,500 to $2,999 | 0 (0.0%) | 0 (0.0%) |
| $3,000 or more | 0 (0.0%) | 0 (0.0%) |
| Total | 43 (100.0%) | 43 (100.0%) |
Physical Housing Characteristics in Excelsior Estates
Housing Structures in Excelsior Estates
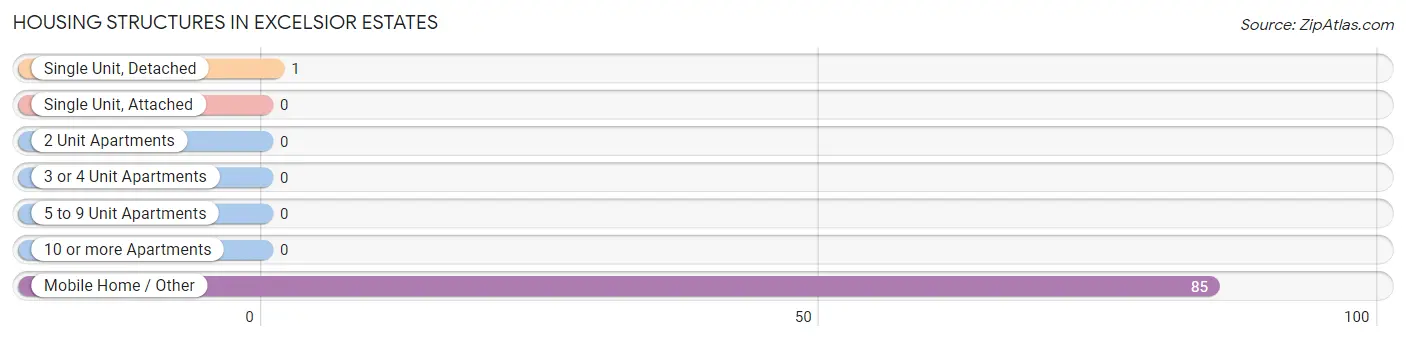
| Structure Type | # Housing Units | % Housing Units |
| Single Unit, Detached | 1 | 1.2% |
| Single Unit, Attached | 0 | 0.0% |
| 2 Unit Apartments | 0 | 0.0% |
| 3 or 4 Unit Apartments | 0 | 0.0% |
| 5 to 9 Unit Apartments | 0 | 0.0% |
| 10 or more Apartments | 0 | 0.0% |
| Mobile Home / Other | 85 | 98.8% |
| Total | 86 | 100.0% |
Housing Structures by Occupancy in Excelsior Estates
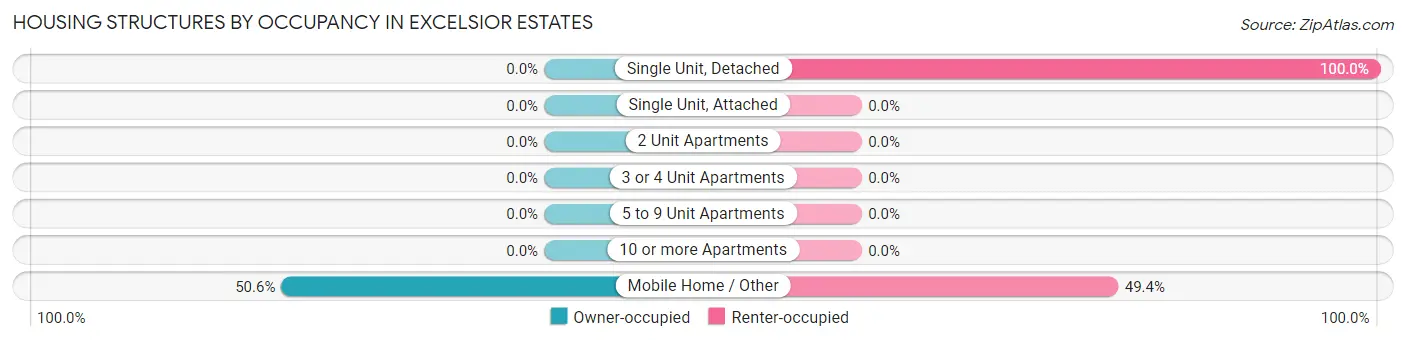
| Structure Type | Owner-occupied | Renter-occupied |
| Single Unit, Detached | 0 (0.0%) | 1 (100.0%) |
| Single Unit, Attached | 0 (0.0%) | 0 (0.0%) |
| 2 Unit Apartments | 0 (0.0%) | 0 (0.0%) |
| 3 or 4 Unit Apartments | 0 (0.0%) | 0 (0.0%) |
| 5 to 9 Unit Apartments | 0 (0.0%) | 0 (0.0%) |
| 10 or more Apartments | 0 (0.0%) | 0 (0.0%) |
| Mobile Home / Other | 43 (50.6%) | 42 (49.4%) |
| Total | 43 (50.0%) | 43 (50.0%) |
Housing Structures by Number of Rooms in Excelsior Estates
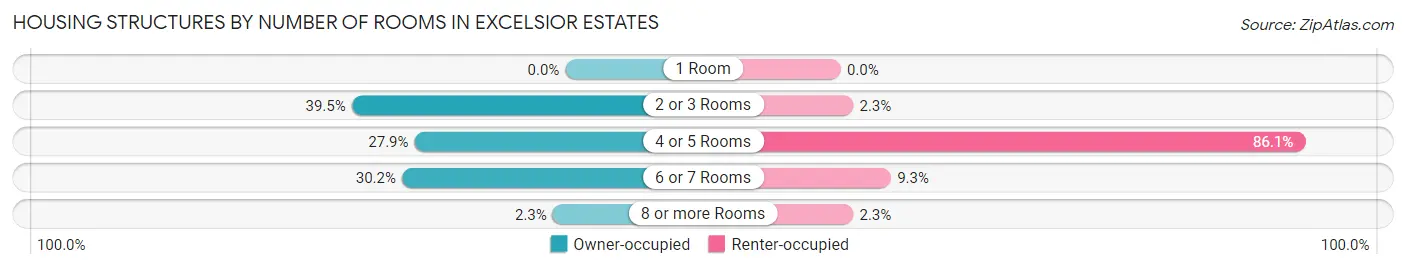
| Number of Rooms | Owner-occupied | Renter-occupied |
| 1 Room | 0 (0.0%) | 0 (0.0%) |
| 2 or 3 Rooms | 17 (39.5%) | 1 (2.3%) |
| 4 or 5 Rooms | 12 (27.9%) | 37 (86.1%) |
| 6 or 7 Rooms | 13 (30.2%) | 4 (9.3%) |
| 8 or more Rooms | 1 (2.3%) | 1 (2.3%) |
| Total | 43 (100.0%) | 43 (100.0%) |
Housing Structure by Heating Type in Excelsior Estates
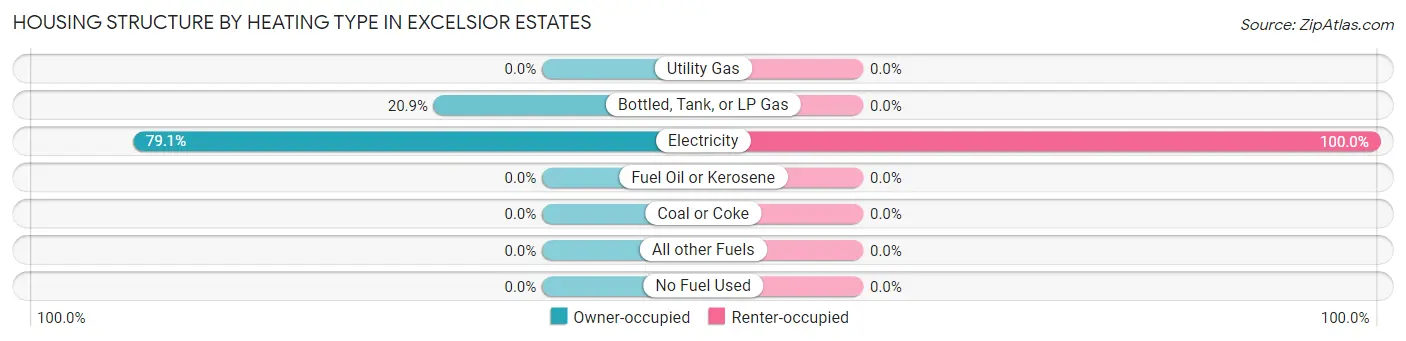
| Heating Type | Owner-occupied | Renter-occupied |
| Utility Gas | 0 (0.0%) | 0 (0.0%) |
| Bottled, Tank, or LP Gas | 9 (20.9%) | 0 (0.0%) |
| Electricity | 34 (79.1%) | 43 (100.0%) |
| Fuel Oil or Kerosene | 0 (0.0%) | 0 (0.0%) |
| Coal or Coke | 0 (0.0%) | 0 (0.0%) |
| All other Fuels | 0 (0.0%) | 0 (0.0%) |
| No Fuel Used | 0 (0.0%) | 0 (0.0%) |
| Total | 43 (100.0%) | 43 (100.0%) |
Household Vehicle Usage in Excelsior Estates
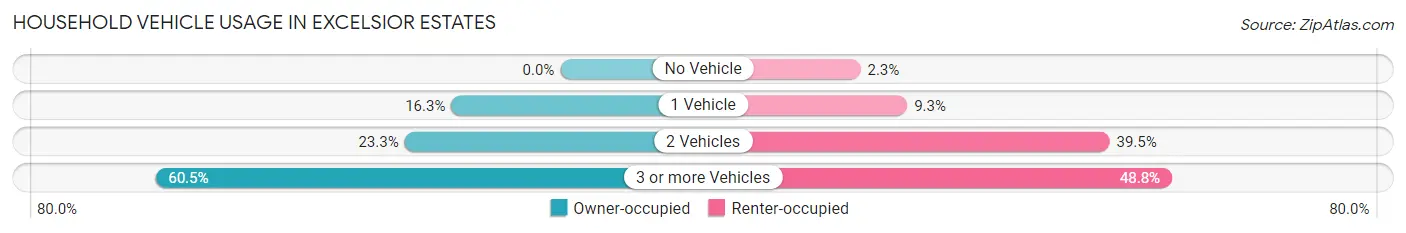
| Vehicles per Household | Owner-occupied | Renter-occupied |
| No Vehicle | 0 (0.0%) | 1 (2.3%) |
| 1 Vehicle | 7 (16.3%) | 4 (9.3%) |
| 2 Vehicles | 10 (23.3%) | 17 (39.5%) |
| 3 or more Vehicles | 26 (60.5%) | 21 (48.8%) |
| Total | 43 (100.0%) | 43 (100.0%) |
Real Estate & Mortgages in Excelsior Estates
Real Estate and Mortgage Overview in Excelsior Estates
| Characteristic | Without Mortgage | With Mortgage |
| Housing Units | 30 | 13 |
| Median Property Value | $55,300 | $39,200 |
| Median Household Income | $73,594 | $0 |
| Monthly Housing Costs | $629 | $0 |
| Real Estate Taxes | $1,097 | $1 |
Property Value by Mortgage Status in Excelsior Estates
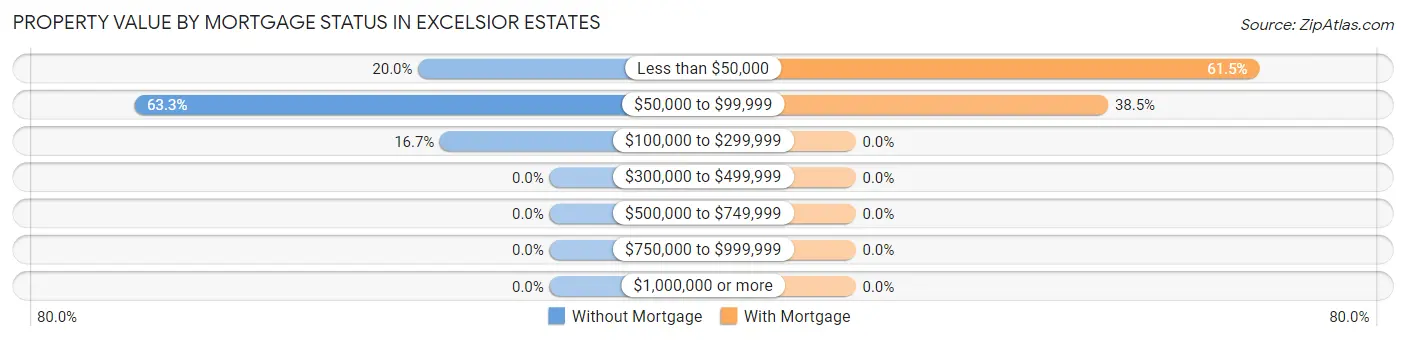
| Property Value | Without Mortgage | With Mortgage |
| Less than $50,000 | 6 (20.0%) | 8 (61.5%) |
| $50,000 to $99,999 | 19 (63.3%) | 5 (38.5%) |
| $100,000 to $299,999 | 5 (16.7%) | 0 (0.0%) |
| $300,000 to $499,999 | 0 (0.0%) | 0 (0.0%) |
| $500,000 to $749,999 | 0 (0.0%) | 0 (0.0%) |
| $750,000 to $999,999 | 0 (0.0%) | 0 (0.0%) |
| $1,000,000 or more | 0 (0.0%) | 0 (0.0%) |
| Total | 30 (100.0%) | 13 (100.0%) |
Household Income by Mortgage Status in Excelsior Estates
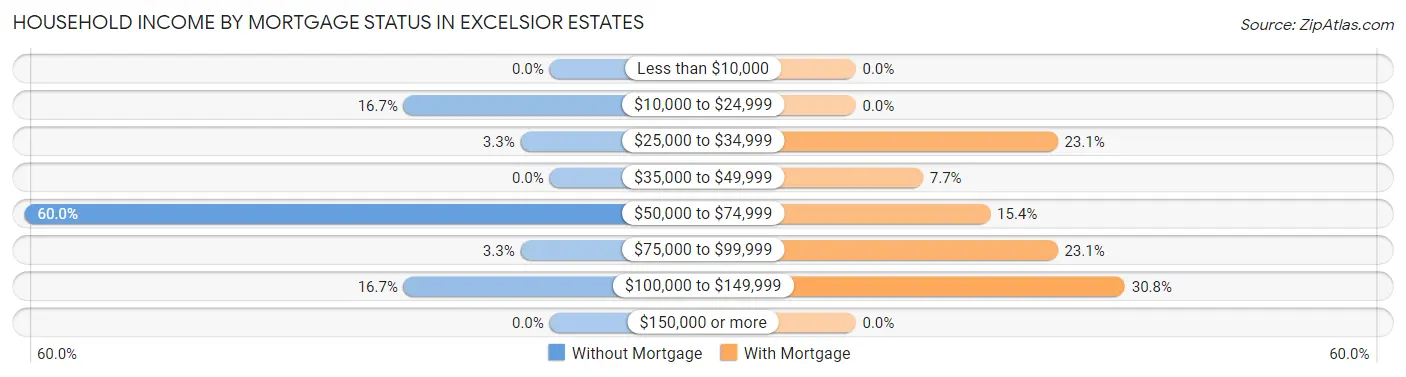
| Household Income | Without Mortgage | With Mortgage |
| Less than $10,000 | 0 (0.0%) | 0 (0.0%) |
| $10,000 to $24,999 | 5 (16.7%) | 0 (0.0%) |
| $25,000 to $34,999 | 1 (3.3%) | 3 (23.1%) |
| $35,000 to $49,999 | 0 (0.0%) | 1 (7.7%) |
| $50,000 to $74,999 | 18 (60.0%) | 2 (15.4%) |
| $75,000 to $99,999 | 1 (3.3%) | 3 (23.1%) |
| $100,000 to $149,999 | 5 (16.7%) | 4 (30.8%) |
| $150,000 or more | 0 (0.0%) | 0 (0.0%) |
| Total | 30 (100.0%) | 13 (100.0%) |
Property Value to Household Income Ratio in Excelsior Estates
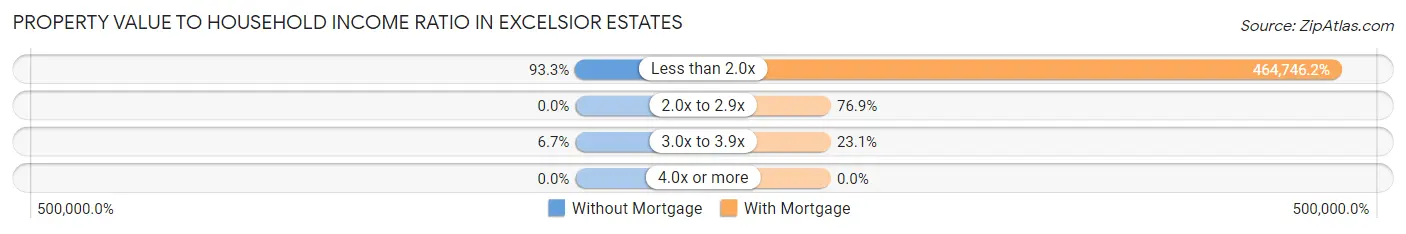
| Value-to-Income Ratio | Without Mortgage | With Mortgage |
| Less than 2.0x | 28 (93.3%) | 60,417 (464,746.2%) |
| 2.0x to 2.9x | 0 (0.0%) | 10 (76.9%) |
| 3.0x to 3.9x | 2 (6.7%) | 3 (23.1%) |
| 4.0x or more | 0 (0.0%) | 0 (0.0%) |
| Total | 30 (100.0%) | 13 (100.0%) |
Real Estate Taxes by Mortgage Status in Excelsior Estates
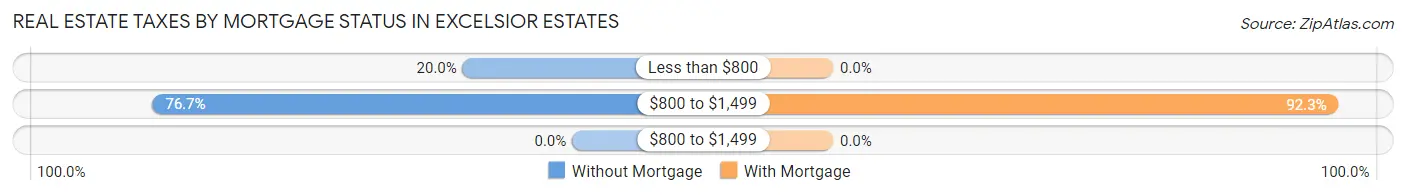
| Property Taxes | Without Mortgage | With Mortgage |
| Less than $800 | 6 (20.0%) | 0 (0.0%) |
| $800 to $1,499 | 23 (76.7%) | 12 (92.3%) |
| $800 to $1,499 | 0 (0.0%) | 0 (0.0%) |
| Total | 30 (100.0%) | 13 (100.0%) |
Health & Disability in Excelsior Estates
Health Insurance Coverage by Age in Excelsior Estates
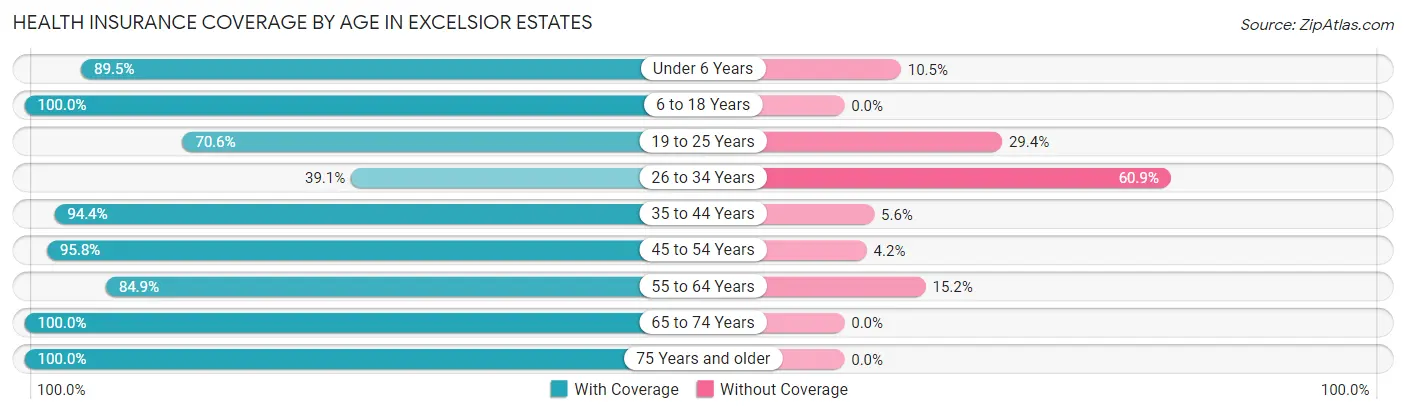
| Age Bracket | With Coverage | Without Coverage |
| Under 6 Years | 17 (89.5%) | 2 (10.5%) |
| 6 to 18 Years | 50 (100.0%) | 0 (0.0%) |
| 19 to 25 Years | 24 (70.6%) | 10 (29.4%) |
| 26 to 34 Years | 18 (39.1%) | 28 (60.9%) |
| 35 to 44 Years | 34 (94.4%) | 2 (5.6%) |
| 45 to 54 Years | 46 (95.8%) | 2 (4.2%) |
| 55 to 64 Years | 28 (84.9%) | 5 (15.1%) |
| 65 to 74 Years | 8 (100.0%) | 0 (0.0%) |
| 75 Years and older | 39 (100.0%) | 0 (0.0%) |
| Total | 264 (84.4%) | 49 (15.7%) |
Health Insurance Coverage by Citizenship Status in Excelsior Estates
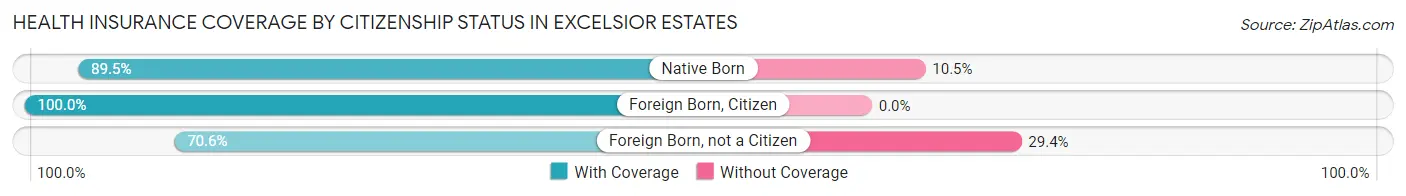
| Citizenship Status | With Coverage | Without Coverage |
| Native Born | 17 (89.5%) | 2 (10.5%) |
| Foreign Born, Citizen | 50 (100.0%) | 0 (0.0%) |
| Foreign Born, not a Citizen | 24 (70.6%) | 10 (29.4%) |
Health Insurance Coverage by Household Income in Excelsior Estates
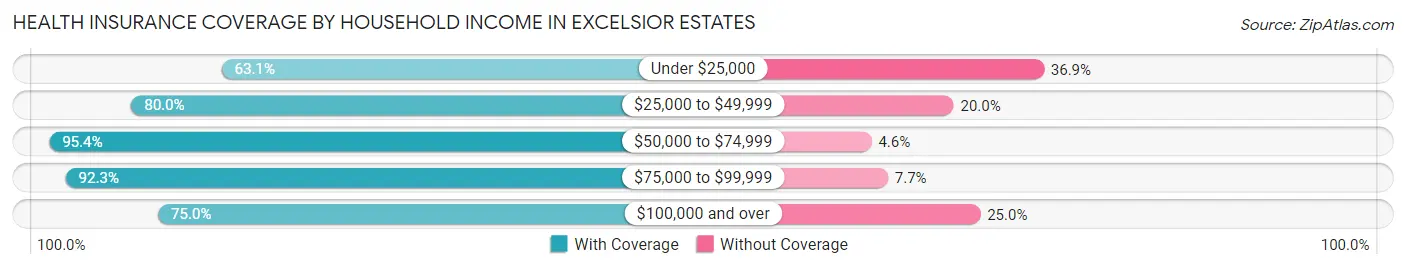
| Household Income | With Coverage | Without Coverage |
| Under $25,000 | 41 (63.1%) | 24 (36.9%) |
| $25,000 to $49,999 | 20 (80.0%) | 5 (20.0%) |
| $50,000 to $74,999 | 62 (95.4%) | 3 (4.6%) |
| $75,000 to $99,999 | 120 (92.3%) | 10 (7.7%) |
| $100,000 and over | 21 (75.0%) | 7 (25.0%) |
Public vs Private Health Insurance Coverage by Age in Excelsior Estates
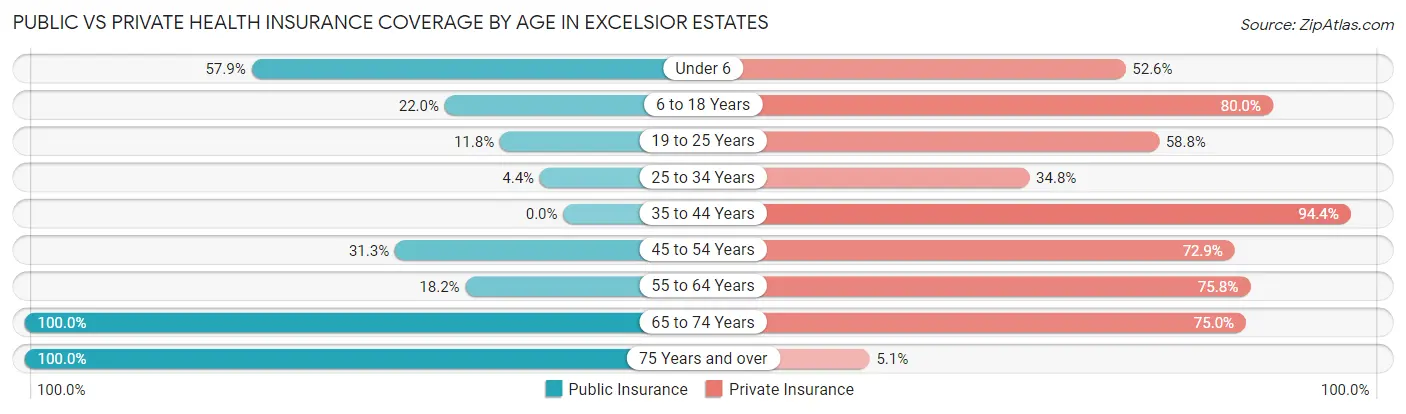
| Age Bracket | Public Insurance | Private Insurance |
| Under 6 | 11 (57.9%) | 10 (52.6%) |
| 6 to 18 Years | 11 (22.0%) | 40 (80.0%) |
| 19 to 25 Years | 4 (11.8%) | 20 (58.8%) |
| 25 to 34 Years | 2 (4.3%) | 16 (34.8%) |
| 35 to 44 Years | 0 (0.0%) | 34 (94.4%) |
| 45 to 54 Years | 15 (31.2%) | 35 (72.9%) |
| 55 to 64 Years | 6 (18.2%) | 25 (75.8%) |
| 65 to 74 Years | 8 (100.0%) | 6 (75.0%) |
| 75 Years and over | 39 (100.0%) | 2 (5.1%) |
| Total | 96 (30.7%) | 188 (60.1%) |
Disability Status by Sex by Age in Excelsior Estates
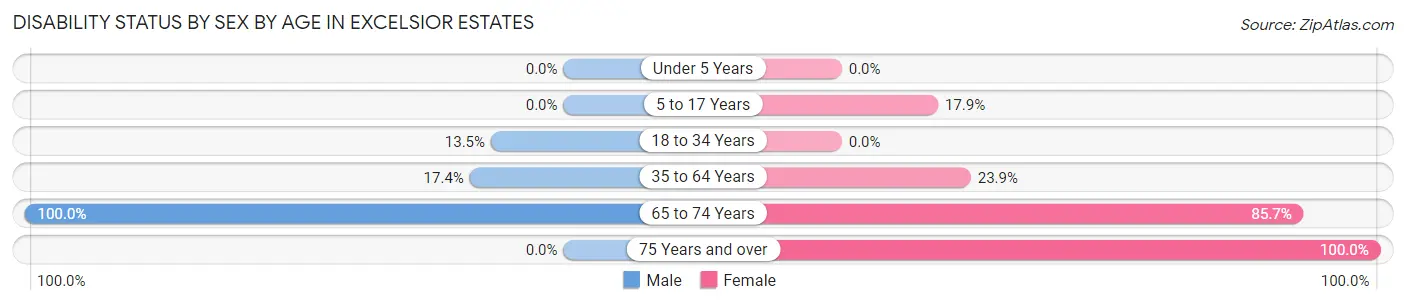
| Age Bracket | Male | Female |
| Under 5 Years | 0 (0.0%) | 0 (0.0%) |
| 5 to 17 Years | 0 (0.0%) | 5 (17.9%) |
| 18 to 34 Years | 7 (13.5%) | 0 (0.0%) |
| 35 to 64 Years | 8 (17.4%) | 17 (23.9%) |
| 65 to 74 Years | 1 (100.0%) | 6 (85.7%) |
| 75 Years and over | 0 (0.0%) | 37 (100.0%) |
Disability Class by Sex by Age in Excelsior Estates
Disability Class: Hearing Difficulty
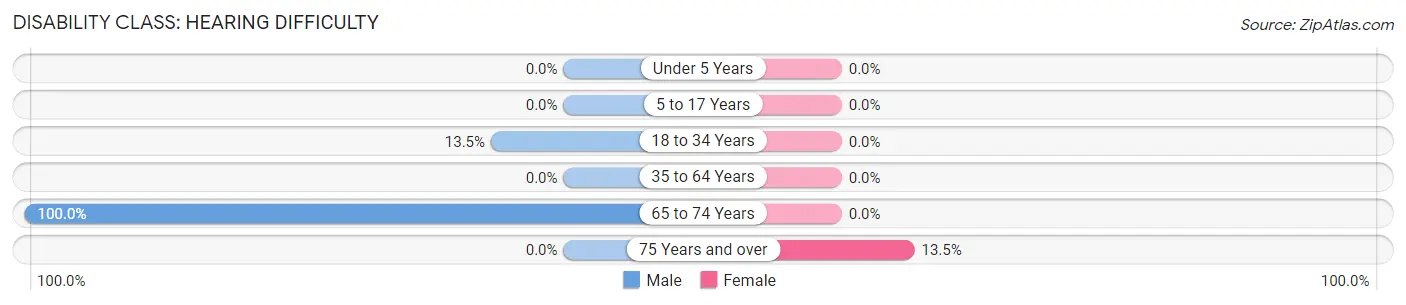
| Age Bracket | Male | Female |
| Under 5 Years | 0 (0.0%) | 0 (0.0%) |
| 5 to 17 Years | 0 (0.0%) | 0 (0.0%) |
| 18 to 34 Years | 7 (13.5%) | 0 (0.0%) |
| 35 to 64 Years | 0 (0.0%) | 0 (0.0%) |
| 65 to 74 Years | 1 (100.0%) | 0 (0.0%) |
| 75 Years and over | 0 (0.0%) | 5 (13.5%) |
Disability Class: Vision Difficulty
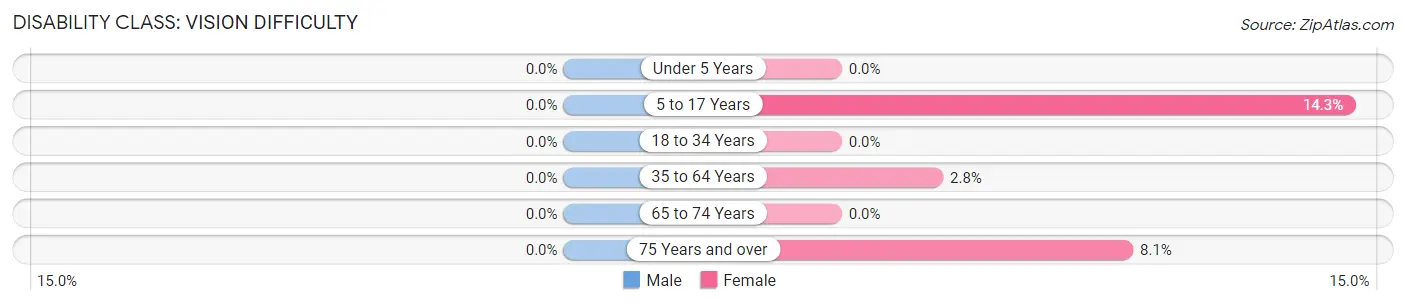
| Age Bracket | Male | Female |
| Under 5 Years | 0 (0.0%) | 0 (0.0%) |
| 5 to 17 Years | 0 (0.0%) | 4 (14.3%) |
| 18 to 34 Years | 0 (0.0%) | 0 (0.0%) |
| 35 to 64 Years | 0 (0.0%) | 2 (2.8%) |
| 65 to 74 Years | 0 (0.0%) | 0 (0.0%) |
| 75 Years and over | 0 (0.0%) | 3 (8.1%) |
Disability Class: Cognitive Difficulty
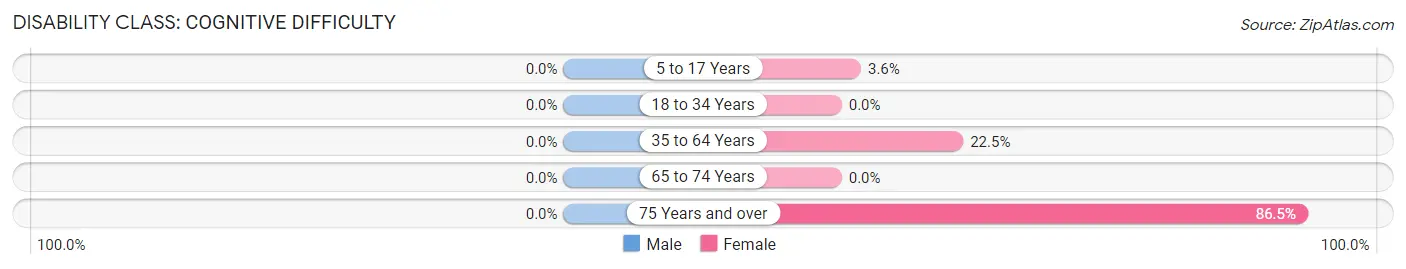
| Age Bracket | Male | Female |
| 5 to 17 Years | 0 (0.0%) | 1 (3.6%) |
| 18 to 34 Years | 0 (0.0%) | 0 (0.0%) |
| 35 to 64 Years | 0 (0.0%) | 16 (22.5%) |
| 65 to 74 Years | 0 (0.0%) | 0 (0.0%) |
| 75 Years and over | 0 (0.0%) | 32 (86.5%) |
Disability Class: Ambulatory Difficulty
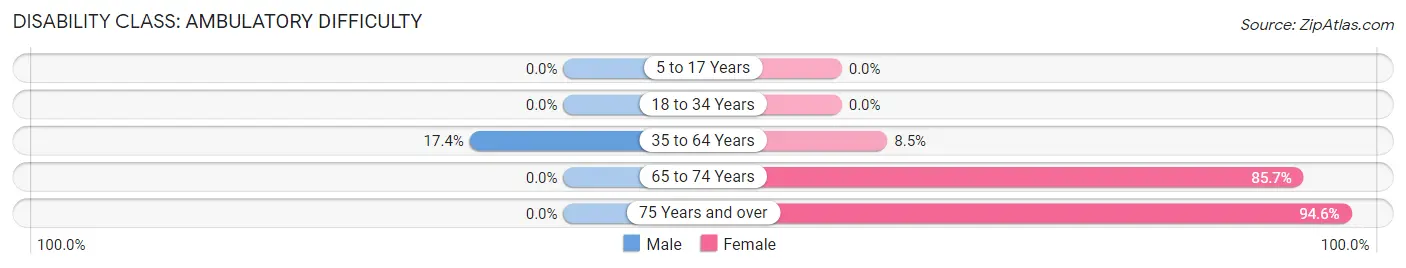
| Age Bracket | Male | Female |
| 5 to 17 Years | 0 (0.0%) | 0 (0.0%) |
| 18 to 34 Years | 0 (0.0%) | 0 (0.0%) |
| 35 to 64 Years | 8 (17.4%) | 6 (8.5%) |
| 65 to 74 Years | 0 (0.0%) | 6 (85.7%) |
| 75 Years and over | 0 (0.0%) | 35 (94.6%) |
Disability Class: Self-Care Difficulty
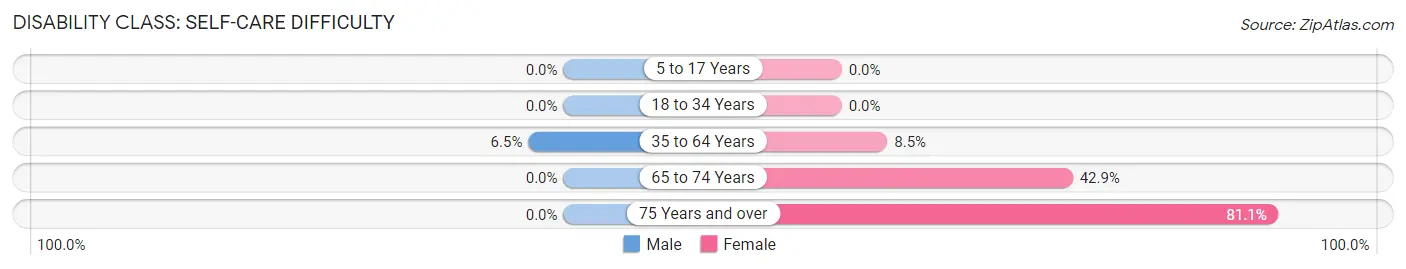
| Age Bracket | Male | Female |
| 5 to 17 Years | 0 (0.0%) | 0 (0.0%) |
| 18 to 34 Years | 0 (0.0%) | 0 (0.0%) |
| 35 to 64 Years | 3 (6.5%) | 6 (8.5%) |
| 65 to 74 Years | 0 (0.0%) | 3 (42.9%) |
| 75 Years and over | 0 (0.0%) | 30 (81.1%) |
Technology Access in Excelsior Estates
Computing Device Access in Excelsior Estates
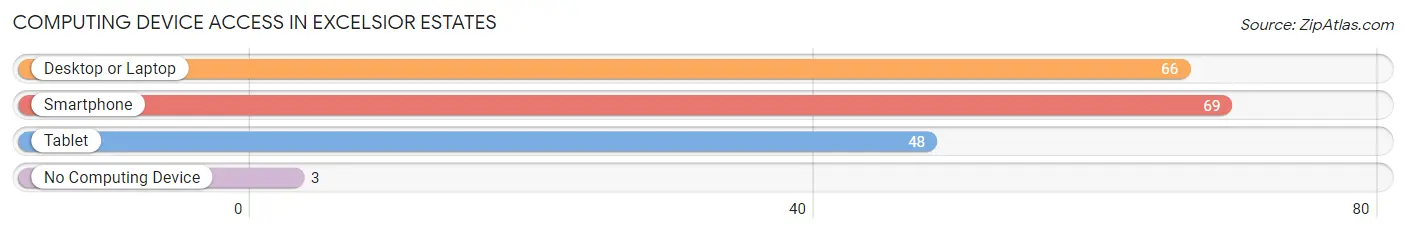
| Device Type | # Households | % Households |
| Desktop or Laptop | 66 | 76.7% |
| Smartphone | 69 | 80.2% |
| Tablet | 48 | 55.8% |
| No Computing Device | 3 | 3.5% |
| Total | 86 | 100.0% |
Internet Access in Excelsior Estates
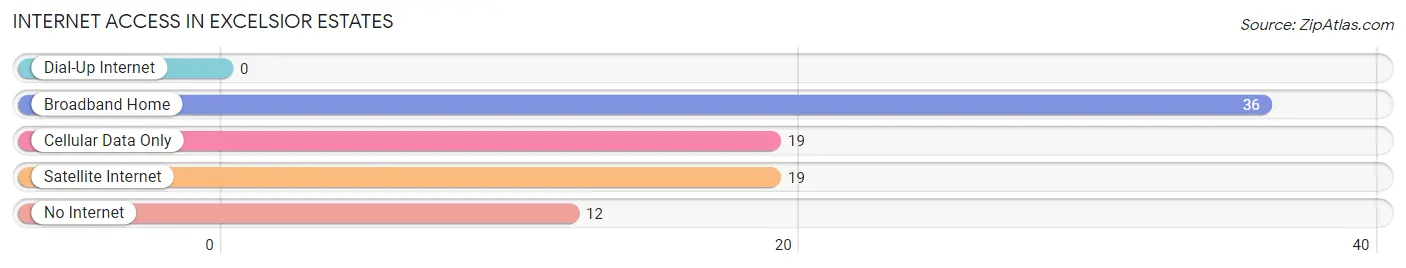
| Internet Type | # Households | % Households |
| Dial-Up Internet | 0 | 0.0% |
| Broadband Home | 36 | 41.9% |
| Cellular Data Only | 19 | 22.1% |
| Satellite Internet | 19 | 22.1% |
| No Internet | 12 | 14.0% |
| Total | 86 | 100.0% |
Excelsior Estates Summary
Excelsior Estates is a small city located in St. Louis County, Missouri. It is situated on the banks of the Missouri River, just north of the city of St. Louis. The city is home to a population of approximately 4,000 people, and is known for its small-town charm and friendly atmosphere.
History
Excelsior Estates was founded in 1876 by a group of German immigrants who had recently arrived in the United States. The city was named after the Latin phrase “Excelsior,” which means “ever upward.” The city was originally a farming community, and the immigrants quickly established a thriving agricultural industry. The city was incorporated in 1883, and the population quickly grew to over 1,000 people.
In the early 1900s, the city began to experience a period of rapid growth and development. The city was home to a number of factories and businesses, and the population continued to grow. By the mid-1900s, the city had become a popular destination for tourists and vacationers.
Geography
Excelsior Estates is located in St. Louis County, Missouri. The city is situated on the banks of the Missouri River, just north of the city of St. Louis. The city is located in a flat, low-lying area, and is surrounded by rolling hills and wooded areas. The city is home to a number of parks and recreational areas, including the Excelsior Estates Park and the Excelsior Estates Golf Course.
Economy
Excelsior Estates is home to a number of businesses and industries. The city is home to a number of manufacturing and industrial companies, as well as a number of retail stores and restaurants. The city is also home to a number of medical facilities, including a hospital and several clinics. The city is also home to a number of educational institutions, including a community college and a number of private schools.
Demographics
As of the 2010 census, the population of Excelsior Estates was 4,000 people. The population is predominantly white, with a small percentage of African Americans and other minority groups. The median household income in the city is $50,000, and the median home value is $150,000. The city is home to a number of churches, and the majority of the population is Christian.
Excelsior Estates is a small city with a rich history and a friendly atmosphere. The city is home to a number of businesses and industries, and the population is diverse and welcoming. The city is a great place to live, work, and raise a family, and is a great place to visit for those looking for a small-town experience.
Common Questions
What is Per Capita Income in Excelsior Estates?
Per Capita income in Excelsior Estates is $19,864.
What is the Median Family Income in Excelsior Estates?
Median Family Income in Excelsior Estates is $73,594.
What is the Median Household income in Excelsior Estates?
Median Household Income in Excelsior Estates is $73,594.
What is Income or Wage Gap in Excelsior Estates?
Income or Wage Gap in Excelsior Estates is 37.4%.
Women in Excelsior Estates earn 62.6 cents for every dollar earned by a man.
What is Inequality or Gini Index in Excelsior Estates?
Inequality or Gini Index in Excelsior Estates is 0.28.
What is the Total Population of Excelsior Estates?
Total Population of Excelsior Estates is 313.
What is the Total Male Population of Excelsior Estates?
Total Male Population of Excelsior Estates is 126.
What is the Total Female Population of Excelsior Estates?
Total Female Population of Excelsior Estates is 187.
What is the Ratio of Males per 100 Females in Excelsior Estates?
There are 67.38 Males per 100 Females in Excelsior Estates.
What is the Ratio of Females per 100 Males in Excelsior Estates?
There are 148.41 Females per 100 Males in Excelsior Estates.
What is the Median Population Age in Excelsior Estates?
Median Population Age in Excelsior Estates is 42.0 Years.
What is the Average Family Size in Excelsior Estates
Average Family Size in Excelsior Estates is 3.8 People.
What is the Average Household Size in Excelsior Estates
Average Household Size in Excelsior Estates is 3.6 People.
How Large is the Labor Force in Excelsior Estates?
There are 150 People in the Labor Forcein in Excelsior Estates.
What is the Percentage of People in the Labor Force in Excelsior Estates?
52.8% of People are in the Labor Force in Excelsior Estates.
What is the Unemployment Rate in Excelsior Estates?
Unemployment Rate in Excelsior Estates is 6.0%.