Annapolis, MO Map & Demographics
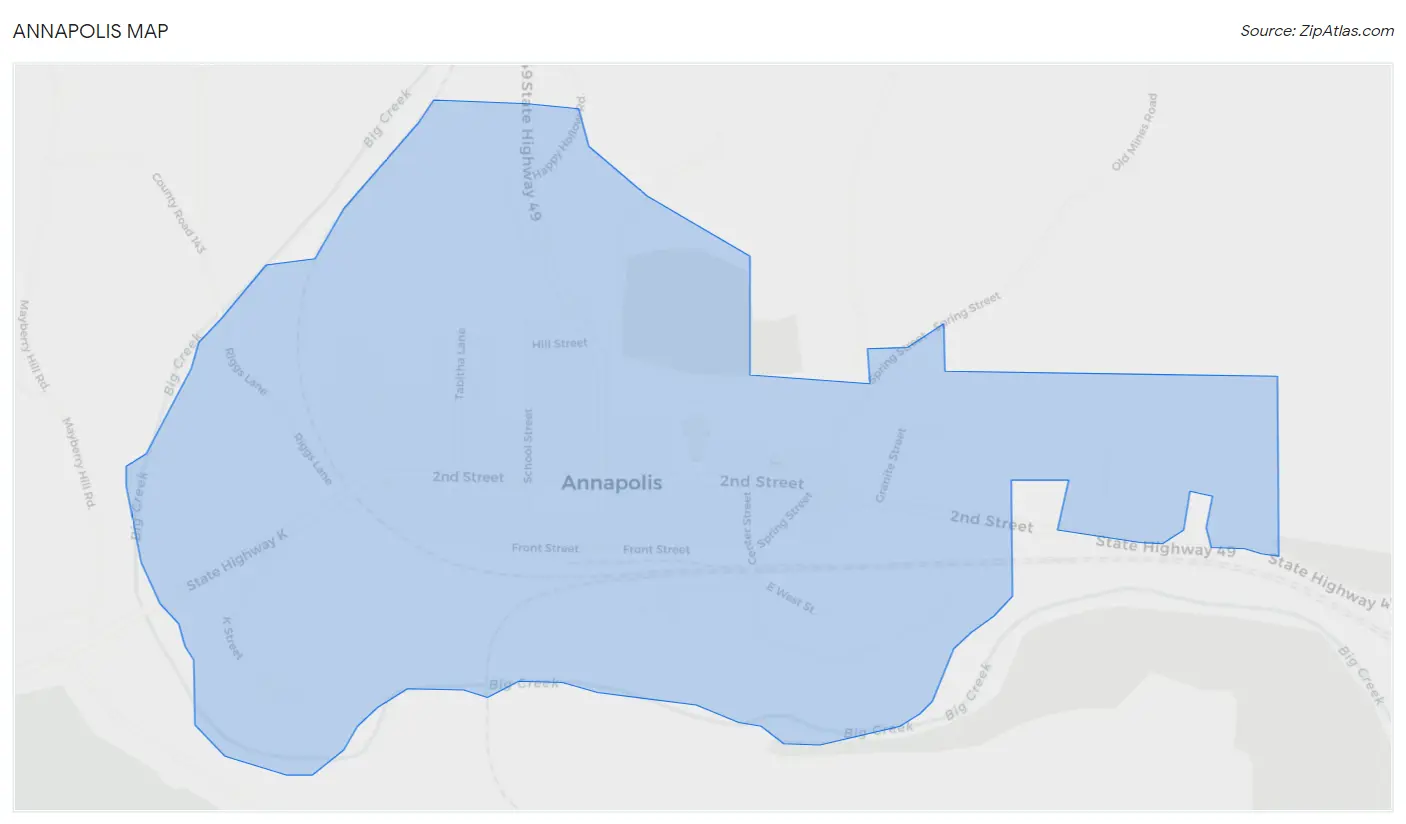
Annapolis Map
Annapolis Overview
$15,085
PER CAPITA INCOME
$37,875
AVG FAMILY INCOME
$35,625
AVG HOUSEHOLD INCOME
0.42
INEQUALITY / GINI INDEX
422
TOTAL POPULATION
227
MALE POPULATION
195
FEMALE POPULATION
116.41
MALES / 100 FEMALES
85.90
FEMALES / 100 MALES
32.7
MEDIAN AGE
3.9
AVG FAMILY SIZE
3.2
AVG HOUSEHOLD SIZE
148
LABOR FORCE [ PEOPLE ]
45.8%
PERCENT IN LABOR FORCE
23.0%
UNEMPLOYMENT RATE
Annapolis Zip Codes
Annapolis Area Codes
Income in Annapolis
Income Overview in Annapolis
Per Capita Income in Annapolis is $15,085, while median incomes of families and households are $37,875 and $35,625 respectively.
| Characteristic | Number | Measure |
| Per Capita Income | 422 | $15,085 |
| Median Family Income | 93 | $37,875 |
| Mean Family Income | 93 | $51,211 |
| Median Household Income | 130 | $35,625 |
| Mean Household Income | 130 | $45,795 |
| Income Deficit | 93 | $0 |
| Wage / Income Gap (%) | 422 | 0.00% |
| Wage / Income Gap ($) | 422 | 100.00¢ per $1 |
| Gini / Inequality Index | 422 | 0.42 |
Earnings by Sex in Annapolis
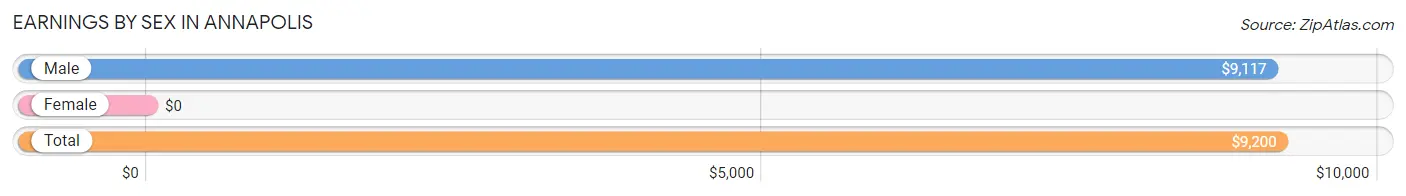
| Sex | Number | Average Earnings |
| Male | 117 (52.7%) | $9,117 |
| Female | 105 (47.3%) | $0 |
| Total | 222 (100.0%) | $9,200 |
Earnings by Sex by Income Bracket in Annapolis
The most common earnings brackets in Annapolis are $7,500 to $9,999 for men (75 | 64.1%) and $2,500 to $4,999 for women (41 | 39.1%).
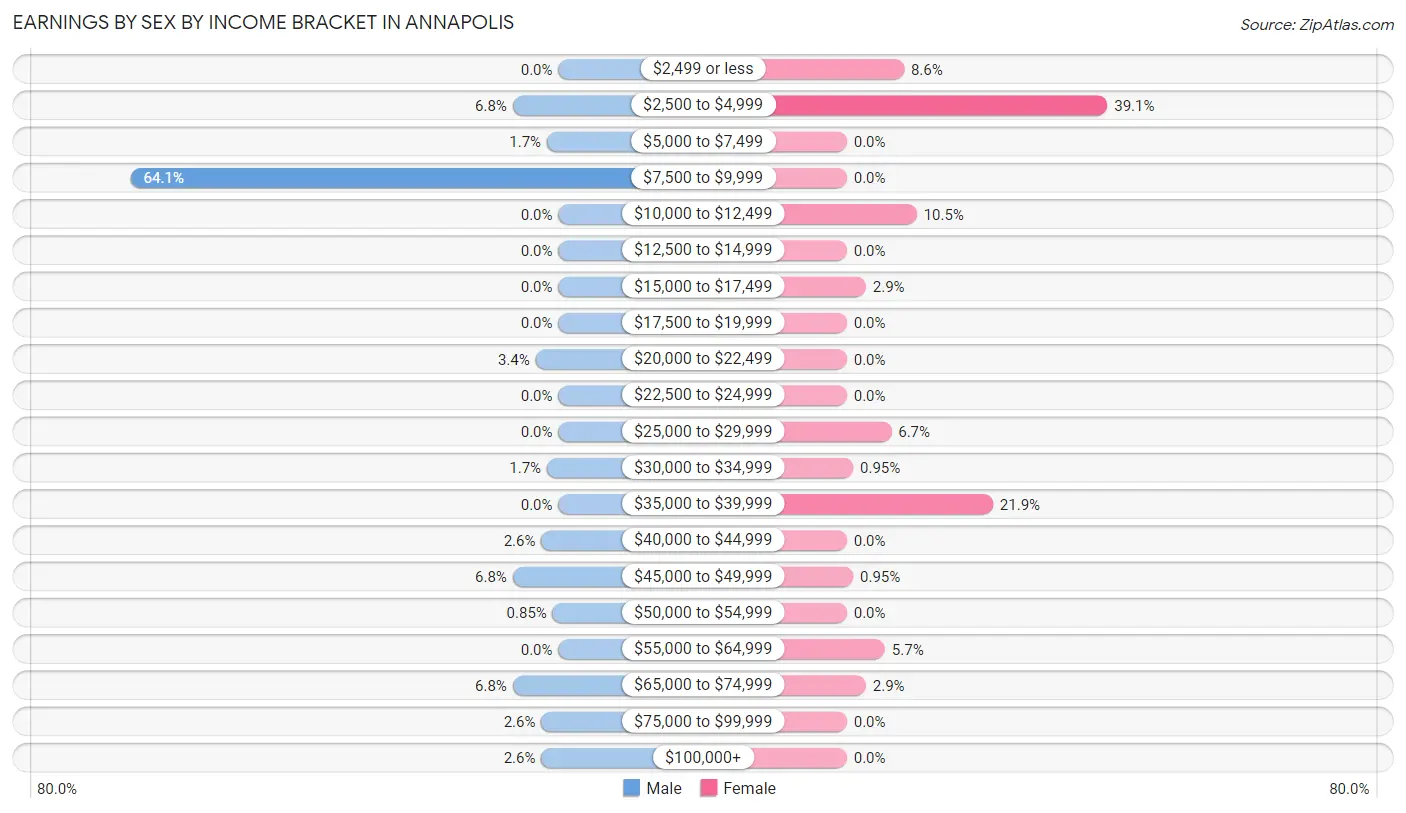
| Income | Male | Female |
| $2,499 or less | 0 (0.0%) | 9 (8.6%) |
| $2,500 to $4,999 | 8 (6.8%) | 41 (39.1%) |
| $5,000 to $7,499 | 2 (1.7%) | 0 (0.0%) |
| $7,500 to $9,999 | 75 (64.1%) | 0 (0.0%) |
| $10,000 to $12,499 | 0 (0.0%) | 11 (10.5%) |
| $12,500 to $14,999 | 0 (0.0%) | 0 (0.0%) |
| $15,000 to $17,499 | 0 (0.0%) | 3 (2.9%) |
| $17,500 to $19,999 | 0 (0.0%) | 0 (0.0%) |
| $20,000 to $22,499 | 4 (3.4%) | 0 (0.0%) |
| $22,500 to $24,999 | 0 (0.0%) | 0 (0.0%) |
| $25,000 to $29,999 | 0 (0.0%) | 7 (6.7%) |
| $30,000 to $34,999 | 2 (1.7%) | 1 (0.9%) |
| $35,000 to $39,999 | 0 (0.0%) | 23 (21.9%) |
| $40,000 to $44,999 | 3 (2.6%) | 0 (0.0%) |
| $45,000 to $49,999 | 8 (6.8%) | 1 (0.9%) |
| $50,000 to $54,999 | 1 (0.9%) | 0 (0.0%) |
| $55,000 to $64,999 | 0 (0.0%) | 6 (5.7%) |
| $65,000 to $74,999 | 8 (6.8%) | 3 (2.9%) |
| $75,000 to $99,999 | 3 (2.6%) | 0 (0.0%) |
| $100,000+ | 3 (2.6%) | 0 (0.0%) |
| Total | 117 (100.0%) | 105 (100.0%) |
Earnings by Sex by Educational Attainment in Annapolis
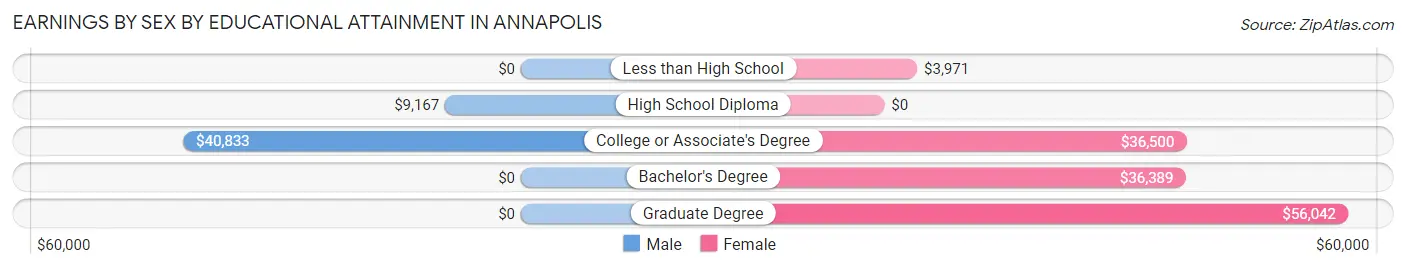
| Educational Attainment | Male Income | Female Income |
| Less than High School | - | - |
| High School Diploma | $9,167 | $0 |
| College or Associate's Degree | $40,833 | $36,500 |
| Bachelor's Degree | - | - |
| Graduate Degree | - | - |
| Total | $9,233 | $0 |
Family Income in Annapolis
Family Income Brackets in Annapolis
According to the Annapolis family income data, there are 25 families falling into the $35,000 to $49,999 income range, which is the most common income bracket and makes up 26.9% of all families.
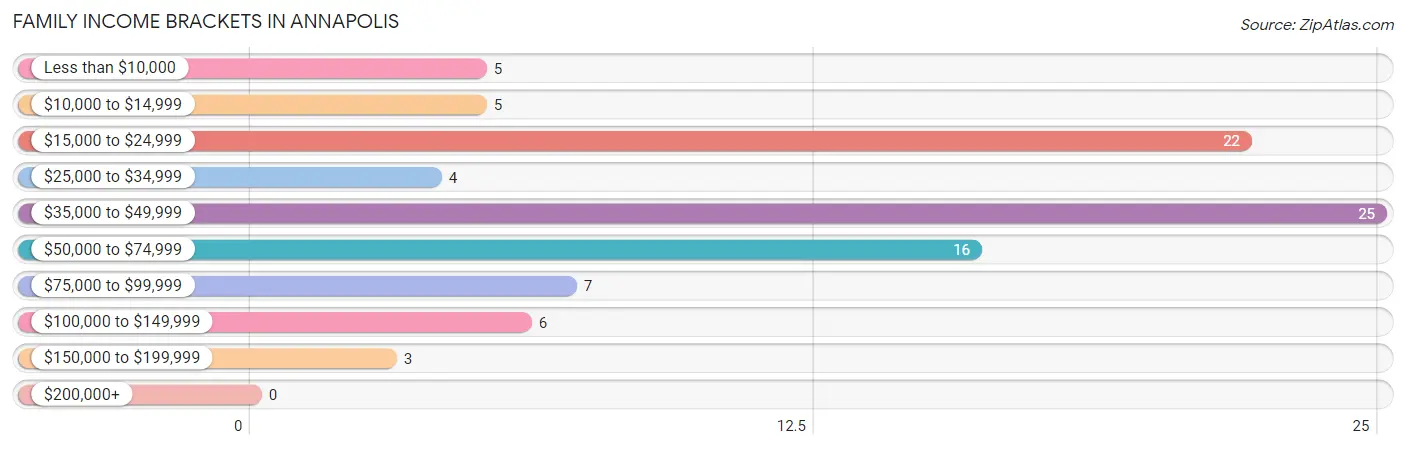
| Income Bracket | # Families | % Families |
| Less than $10,000 | 5 | 5.4% |
| $10,000 to $14,999 | 5 | 5.4% |
| $15,000 to $24,999 | 22 | 23.7% |
| $25,000 to $34,999 | 4 | 4.3% |
| $35,000 to $49,999 | 25 | 26.9% |
| $50,000 to $74,999 | 16 | 17.2% |
| $75,000 to $99,999 | 7 | 7.5% |
| $100,000 to $149,999 | 6 | 6.5% |
| $150,000 to $199,999 | 3 | 3.2% |
| $200,000+ | 0 | 0.0% |
Family Income by Famaliy Size in Annapolis
2-person families (47 | 50.5%) account for the highest median family income in Annapolis with $38,625 per family, while 2-person families (47 | 50.5%) have the highest median income of $19,312 per family member.
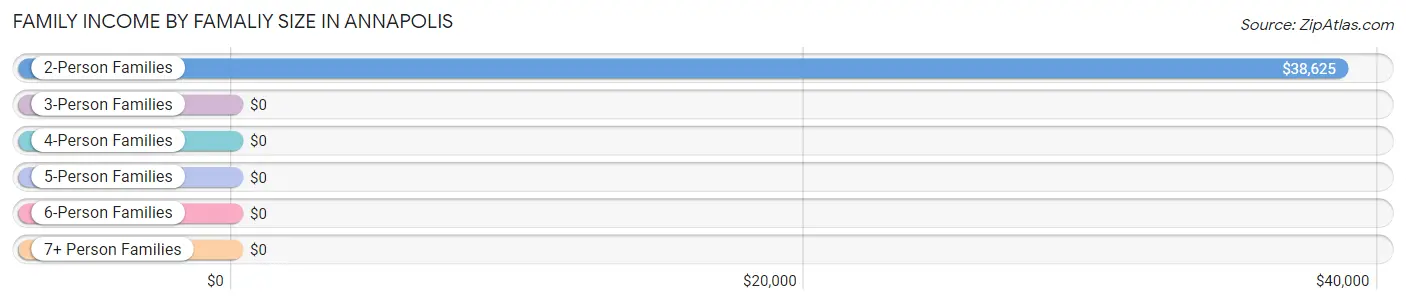
| Income Bracket | # Families | Median Income |
| 2-Person Families | 47 (50.5%) | $38,625 |
| 3-Person Families | 12 (12.9%) | $0 |
| 4-Person Families | 5 (5.4%) | $0 |
| 5-Person Families | 29 (31.2%) | $0 |
| 6-Person Families | 0 (0.0%) | $0 |
| 7+ Person Families | 0 (0.0%) | $0 |
| Total | 93 (100.0%) | $37,875 |
Family Income by Number of Earners in Annapolis
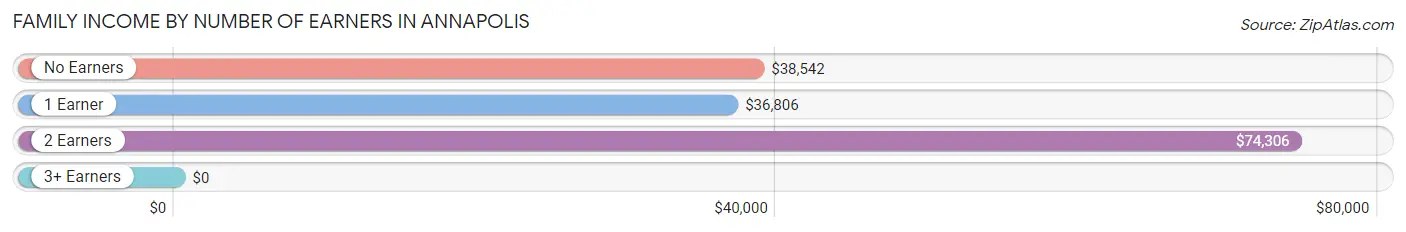
| Number of Earners | # Families | Median Income |
| No Earners | 13 (14.0%) | $38,542 |
| 1 Earner | 35 (37.6%) | $36,806 |
| 2 Earners | 13 (14.0%) | $74,306 |
| 3+ Earners | 32 (34.4%) | $0 |
| Total | 93 (100.0%) | $37,875 |
Household Income in Annapolis
Household Income Brackets in Annapolis
With 31 households falling in the category, the $15,000 to $24,999 income range is the most frequent in Annapolis, accounting for 23.8% of all households.
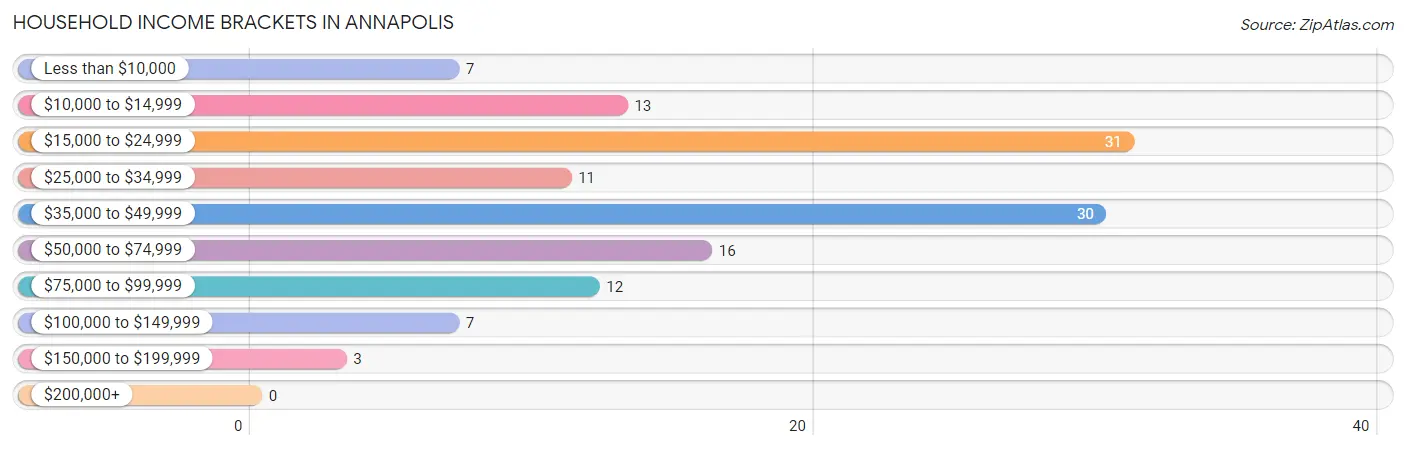
| Income Bracket | # Households | % Households |
| Less than $10,000 | 7 | 5.4% |
| $10,000 to $14,999 | 13 | 10.0% |
| $15,000 to $24,999 | 31 | 23.8% |
| $25,000 to $34,999 | 11 | 8.5% |
| $35,000 to $49,999 | 30 | 23.1% |
| $50,000 to $74,999 | 16 | 12.3% |
| $75,000 to $99,999 | 12 | 9.2% |
| $100,000 to $149,999 | 7 | 5.4% |
| $150,000 to $199,999 | 3 | 2.3% |
| $200,000+ | 0 | 0.0% |
Household Income by Householder Age in Annapolis
The median household income in Annapolis is $35,625, with the highest median household income of $73,250 found in the 25 to 44 years age bracket for the primary householder. A total of 27 households (20.8%) fall into this category. Meanwhile, the 15 to 24 years age bracket for the primary householder has the lowest median household income of $0, with 2 households (1.5%) in this group.
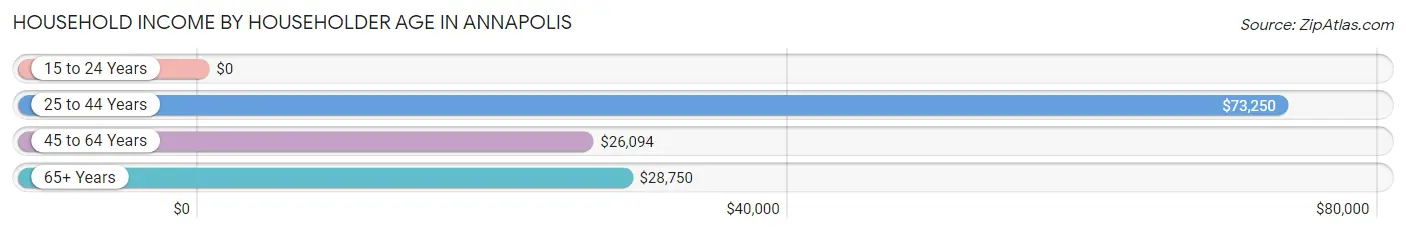
| Income Bracket | # Households | Median Income |
| 15 to 24 Years | 2 (1.5%) | $0 |
| 25 to 44 Years | 27 (20.8%) | $73,250 |
| 45 to 64 Years | 73 (56.1%) | $26,094 |
| 65+ Years | 28 (21.5%) | $28,750 |
| Total | 130 (100.0%) | $35,625 |
Poverty in Annapolis
Income Below Poverty by Sex and Age in Annapolis
With 59.2% poverty level for males and 50.3% for females among the residents of Annapolis, 15 year old males and 6 to 11 year old females are the most vulnerable to poverty, with 4 males (100.0%) and 22 females (95.7%) in their respective age groups living below the poverty level.
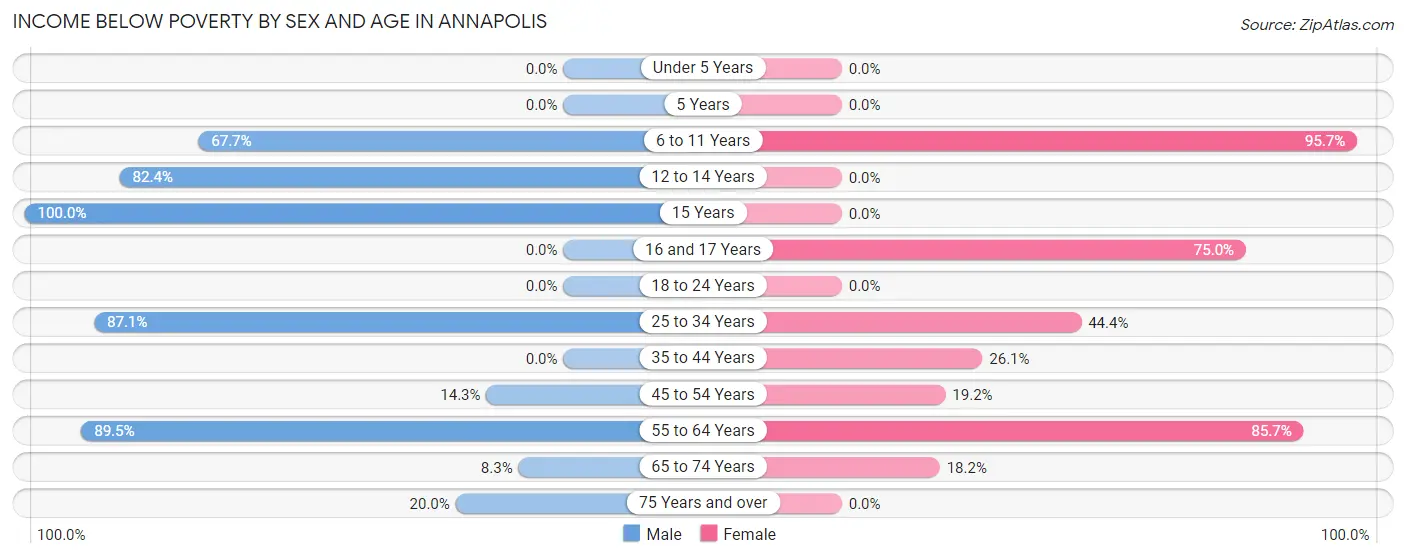
| Age Bracket | Male | Female |
| Under 5 Years | 0 (0.0%) | 0 (0.0%) |
| 5 Years | 0 (0.0%) | 0 (0.0%) |
| 6 to 11 Years | 21 (67.7%) | 22 (95.7%) |
| 12 to 14 Years | 14 (82.4%) | 0 (0.0%) |
| 15 Years | 4 (100.0%) | 0 (0.0%) |
| 16 and 17 Years | 0 (0.0%) | 18 (75.0%) |
| 18 to 24 Years | 0 (0.0%) | 0 (0.0%) |
| 25 to 34 Years | 54 (87.1%) | 4 (44.4%) |
| 35 to 44 Years | 0 (0.0%) | 6 (26.1%) |
| 45 to 54 Years | 3 (14.3%) | 5 (19.2%) |
| 55 to 64 Years | 34 (89.5%) | 36 (85.7%) |
| 65 to 74 Years | 1 (8.3%) | 2 (18.2%) |
| 75 Years and over | 1 (20.0%) | 0 (0.0%) |
| Total | 132 (59.2%) | 93 (50.3%) |
Income Above Poverty by Sex and Age in Annapolis
According to the poverty statistics in Annapolis, males aged under 5 years and females aged under 5 years are the age groups that are most secure financially, with 100.0% of males and 100.0% of females in these age groups living above the poverty line.
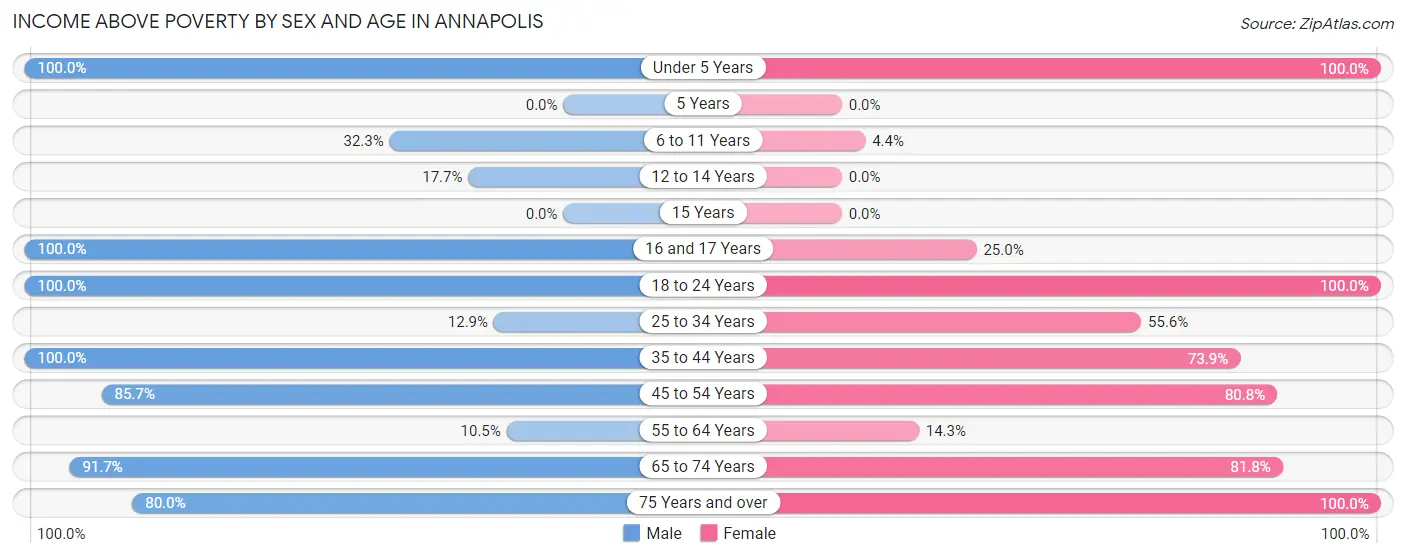
| Age Bracket | Male | Female |
| Under 5 Years | 9 (100.0%) | 1 (100.0%) |
| 5 Years | 0 (0.0%) | 0 (0.0%) |
| 6 to 11 Years | 10 (32.3%) | 1 (4.3%) |
| 12 to 14 Years | 3 (17.6%) | 0 (0.0%) |
| 15 Years | 0 (0.0%) | 0 (0.0%) |
| 16 and 17 Years | 14 (100.0%) | 6 (25.0%) |
| 18 to 24 Years | 1 (100.0%) | 17 (100.0%) |
| 25 to 34 Years | 8 (12.9%) | 5 (55.6%) |
| 35 to 44 Years | 9 (100.0%) | 17 (73.9%) |
| 45 to 54 Years | 18 (85.7%) | 21 (80.8%) |
| 55 to 64 Years | 4 (10.5%) | 6 (14.3%) |
| 65 to 74 Years | 11 (91.7%) | 9 (81.8%) |
| 75 Years and over | 4 (80.0%) | 9 (100.0%) |
| Total | 91 (40.8%) | 92 (49.7%) |
Income Below Poverty Among Married-Couple Families in Annapolis
The poverty statistics for married-couple families in Annapolis show that 41.3% or 26 of the total 63 families live below the poverty line. Families with 1 or 2 children have the highest poverty rate of 80.8%, comprising of 21 families. On the other hand, families with 3 or 4 children have the lowest poverty rate of 0.0%, which includes 0 families.
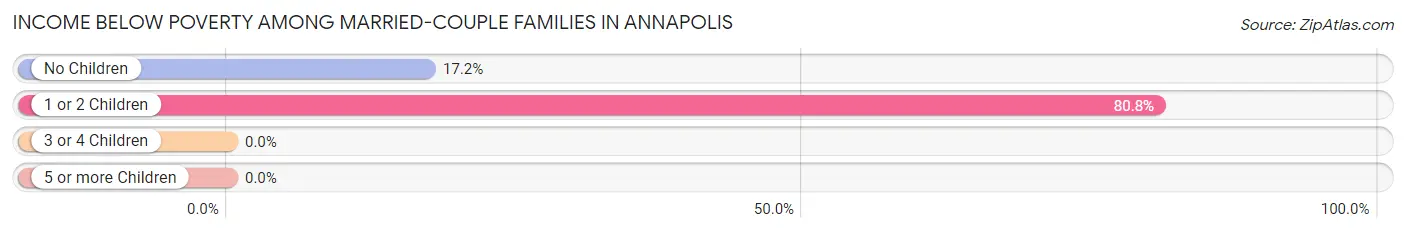
| Children | Above Poverty | Below Poverty |
| No Children | 24 (82.8%) | 5 (17.2%) |
| 1 or 2 Children | 5 (19.2%) | 21 (80.8%) |
| 3 or 4 Children | 8 (100.0%) | 0 (0.0%) |
| 5 or more Children | 0 (0.0%) | 0 (0.0%) |
| Total | 37 (58.7%) | 26 (41.3%) |
Income Below Poverty Among Single-Parent Households in Annapolis
According to the poverty data in Annapolis, 33.3% or 1 single-father households and 14.8% or 4 single-mother households are living below the poverty line. Among single-father households, those with 1 or 2 children have the highest poverty rate, with 1 households (100.0%) experiencing poverty. Likewise, among single-mother households, those with 1 or 2 children have the highest poverty rate, with 4 households (16.7%) falling below the poverty line.
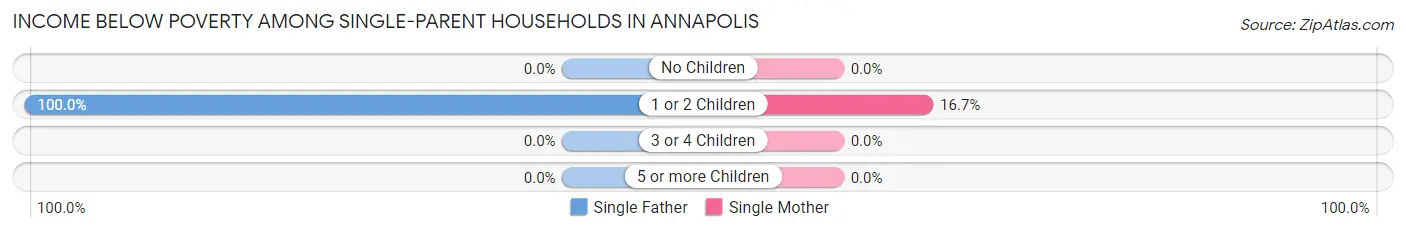
| Children | Single Father | Single Mother |
| No Children | 0 (0.0%) | 0 (0.0%) |
| 1 or 2 Children | 1 (100.0%) | 4 (16.7%) |
| 3 or 4 Children | 0 (0.0%) | 0 (0.0%) |
| 5 or more Children | 0 (0.0%) | 0 (0.0%) |
| Total | 1 (33.3%) | 4 (14.8%) |
Income Below Poverty Among Married-Couple vs Single-Parent Households in Annapolis
The poverty data for Annapolis shows that 26 of the married-couple family households (41.3%) and 5 of the single-parent households (16.7%) are living below the poverty level. Within the married-couple family households, those with 1 or 2 children have the highest poverty rate, with 21 households (80.8%) falling below the poverty line. Among the single-parent households, those with 1 or 2 children have the highest poverty rate, with 5 household (20.0%) living below poverty.
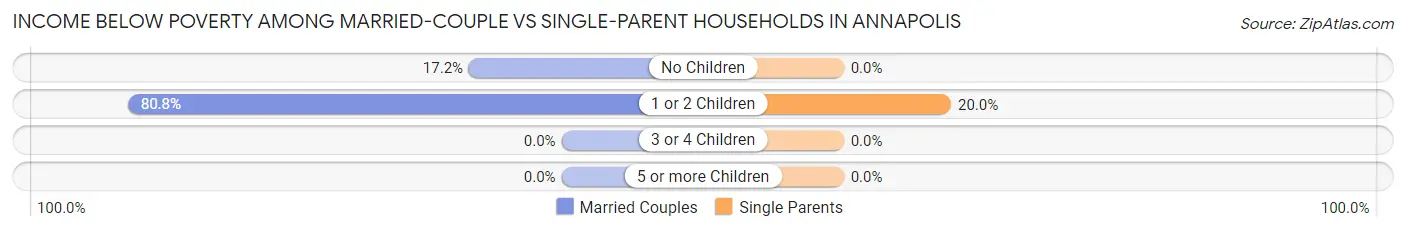
| Children | Married-Couple Families | Single-Parent Households |
| No Children | 5 (17.2%) | 0 (0.0%) |
| 1 or 2 Children | 21 (80.8%) | 5 (20.0%) |
| 3 or 4 Children | 0 (0.0%) | 0 (0.0%) |
| 5 or more Children | 0 (0.0%) | 0 (0.0%) |
| Total | 26 (41.3%) | 5 (16.7%) |
Race in Annapolis
The most populous races in Annapolis are White / Caucasian (373 | 88.4%), Two or more Races (45 | 10.7%), and Hispanic or Latino (43 | 10.2%).
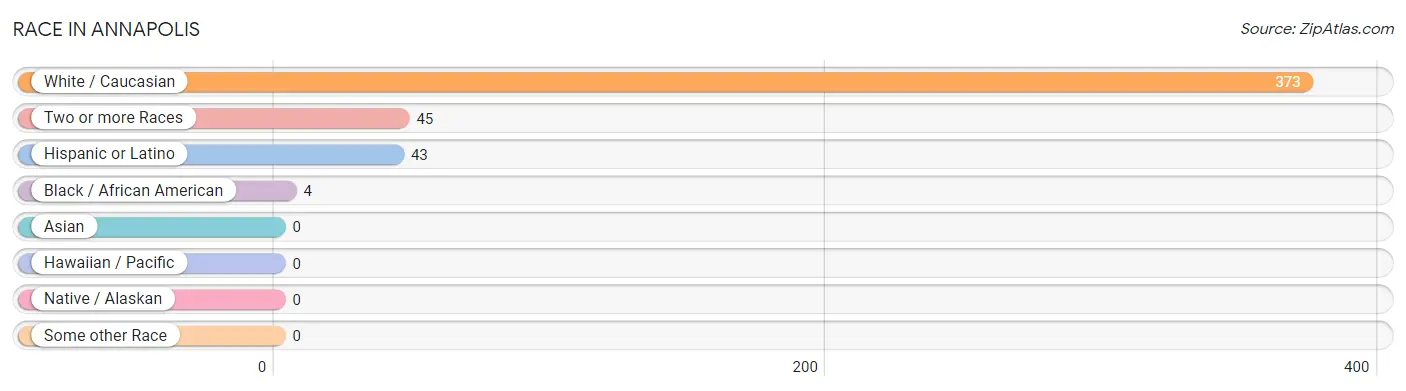
| Race | # Population | % Population |
| Asian | 0 | 0.0% |
| Black / African American | 4 | 0.9% |
| Hawaiian / Pacific | 0 | 0.0% |
| Hispanic or Latino | 43 | 10.2% |
| Native / Alaskan | 0 | 0.0% |
| White / Caucasian | 373 | 88.4% |
| Two or more Races | 45 | 10.7% |
| Some other Race | 0 | 0.0% |
| Total | 422 | 100.0% |
Ancestry in Annapolis
The most populous ancestries reported in Annapolis are German (102 | 24.2%), American (65 | 15.4%), Italian (49 | 11.6%), Mexican (43 | 10.2%), and English (38 | 9.0%), together accounting for 70.4% of all Annapolis residents.
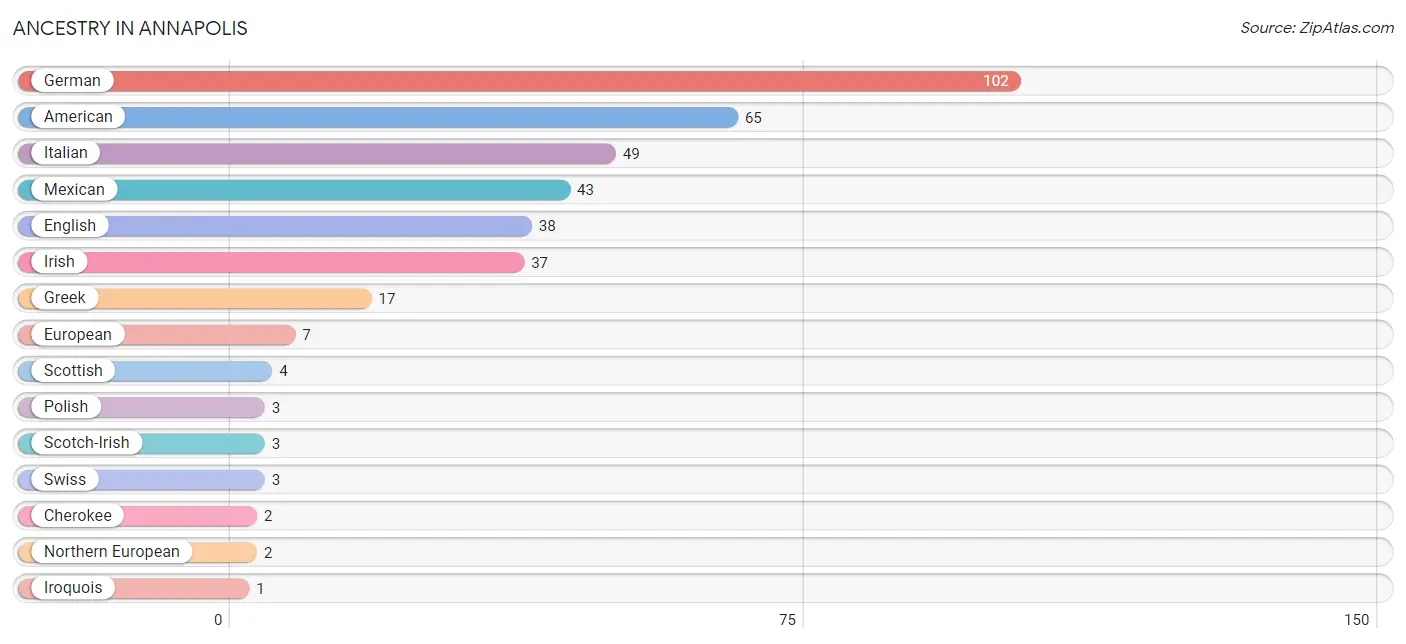
| Ancestry | # Population | % Population |
| American | 65 | 15.4% |
| Cherokee | 2 | 0.5% |
| English | 38 | 9.0% |
| European | 7 | 1.7% |
| German | 102 | 24.2% |
| Greek | 17 | 4.0% |
| Irish | 37 | 8.8% |
| Iroquois | 1 | 0.2% |
| Italian | 49 | 11.6% |
| Mexican | 43 | 10.2% |
| Northern European | 2 | 0.5% |
| Polish | 3 | 0.7% |
| Scotch-Irish | 3 | 0.7% |
| Scottish | 4 | 0.9% |
| Sioux | 1 | 0.2% |
| Swiss | 3 | 0.7% | View All 16 Rows |
Immigrants in Annapolis

| Immigration Origin | # Population | % Population | View All 0 Rows |
Sex and Age in Annapolis
Sex and Age in Annapolis
The most populous age groups in Annapolis are 30 to 34 Years (56 | 24.7%) for men and 55 to 59 Years (38 | 19.5%) for women.
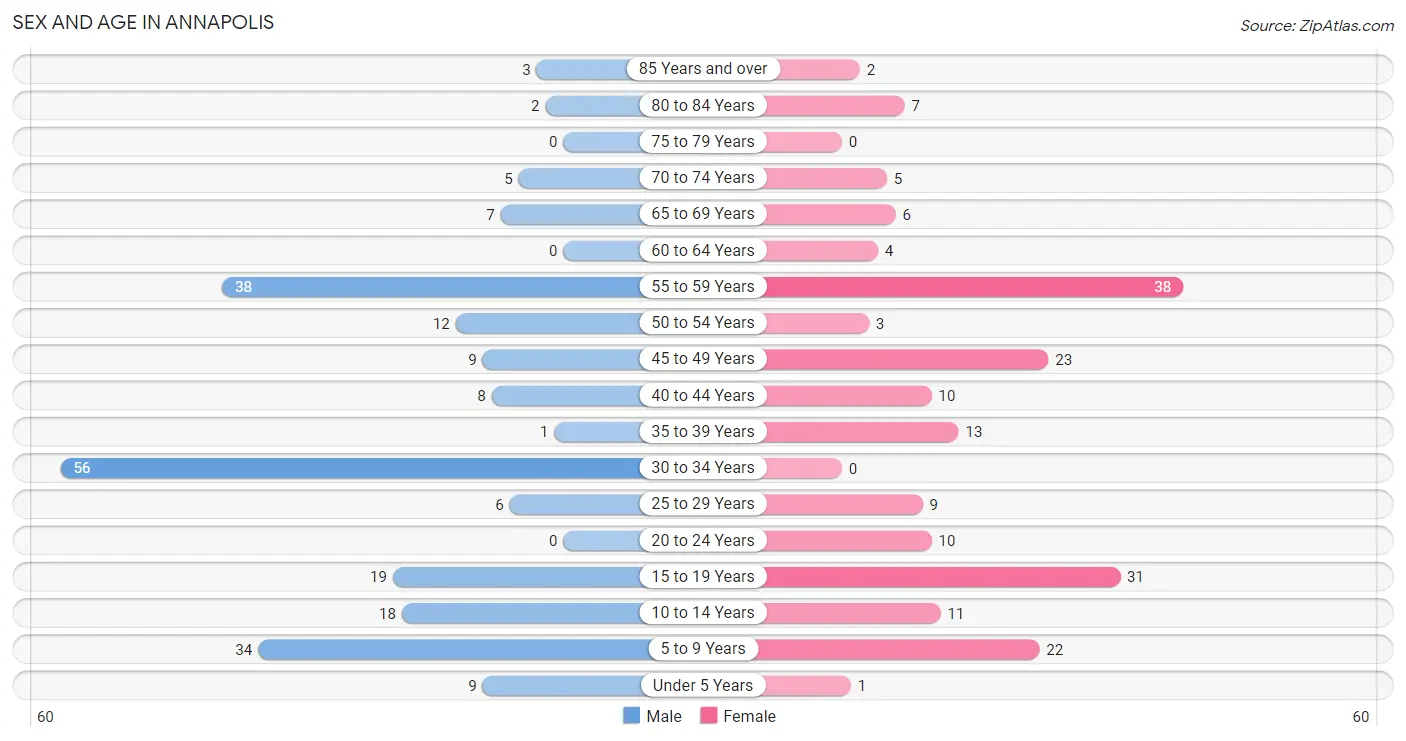
| Age Bracket | Male | Female |
| Under 5 Years | 9 (4.0%) | 1 (0.5%) |
| 5 to 9 Years | 34 (15.0%) | 22 (11.3%) |
| 10 to 14 Years | 18 (7.9%) | 11 (5.6%) |
| 15 to 19 Years | 19 (8.4%) | 31 (15.9%) |
| 20 to 24 Years | 0 (0.0%) | 10 (5.1%) |
| 25 to 29 Years | 6 (2.6%) | 9 (4.6%) |
| 30 to 34 Years | 56 (24.7%) | 0 (0.0%) |
| 35 to 39 Years | 1 (0.4%) | 13 (6.7%) |
| 40 to 44 Years | 8 (3.5%) | 10 (5.1%) |
| 45 to 49 Years | 9 (4.0%) | 23 (11.8%) |
| 50 to 54 Years | 12 (5.3%) | 3 (1.5%) |
| 55 to 59 Years | 38 (16.7%) | 38 (19.5%) |
| 60 to 64 Years | 0 (0.0%) | 4 (2.1%) |
| 65 to 69 Years | 7 (3.1%) | 6 (3.1%) |
| 70 to 74 Years | 5 (2.2%) | 5 (2.6%) |
| 75 to 79 Years | 0 (0.0%) | 0 (0.0%) |
| 80 to 84 Years | 2 (0.9%) | 7 (3.6%) |
| 85 Years and over | 3 (1.3%) | 2 (1.0%) |
| Total | 227 (100.0%) | 195 (100.0%) |
Families and Households in Annapolis
Median Family Size in Annapolis
The median family size in Annapolis is 3.88 persons per family, with married-couple families (63 | 67.7%) accounting for the largest median family size of 4.21 persons per family. On the other hand, single male/father families (3 | 3.2%) represent the smallest median family size with 3.00 persons per family.
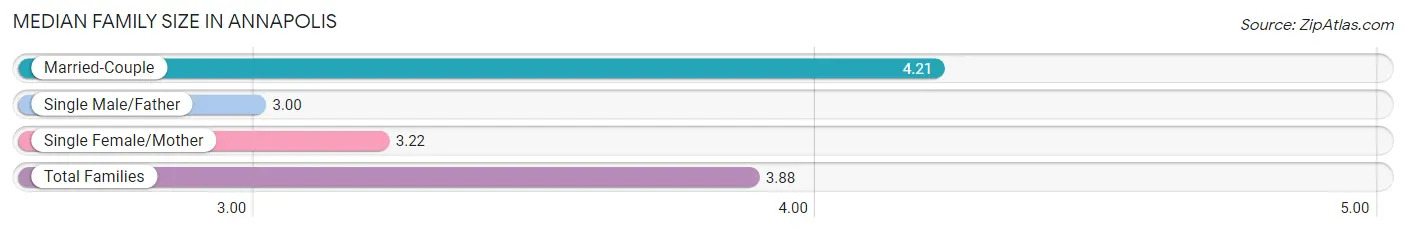
| Family Type | # Families | Family Size |
| Married-Couple | 63 (67.7%) | 4.21 |
| Single Male/Father | 3 (3.2%) | 3.00 |
| Single Female/Mother | 27 (29.0%) | 3.22 |
| Total Families | 93 (100.0%) | 3.88 |
Median Household Size in Annapolis
The median household size in Annapolis is 3.25 persons per household, with married-couple households (63 | 48.5%) accounting for the largest median household size of 4.21 persons per household. non-family households (37 | 28.5%) represent the smallest median household size with 1.65 persons per household.
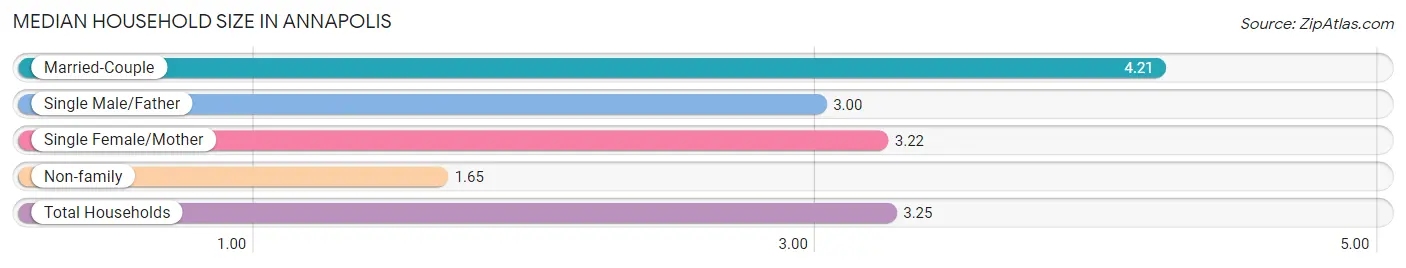
| Household Type | # Households | Household Size |
| Married-Couple | 63 (48.5%) | 4.21 |
| Single Male/Father | 3 (2.3%) | 3.00 |
| Single Female/Mother | 27 (20.8%) | 3.22 |
| Non-family | 37 (28.5%) | 1.65 |
| Total Households | 130 (100.0%) | 3.25 |
Household Size by Marriage Status in Annapolis
Out of a total of 130 households in Annapolis, 93 (71.5%) are family households, while 37 (28.5%) are nonfamily households. The most numerous type of family households are 2-person households, comprising 47, and the most common type of nonfamily households are 1-person households, comprising 30.
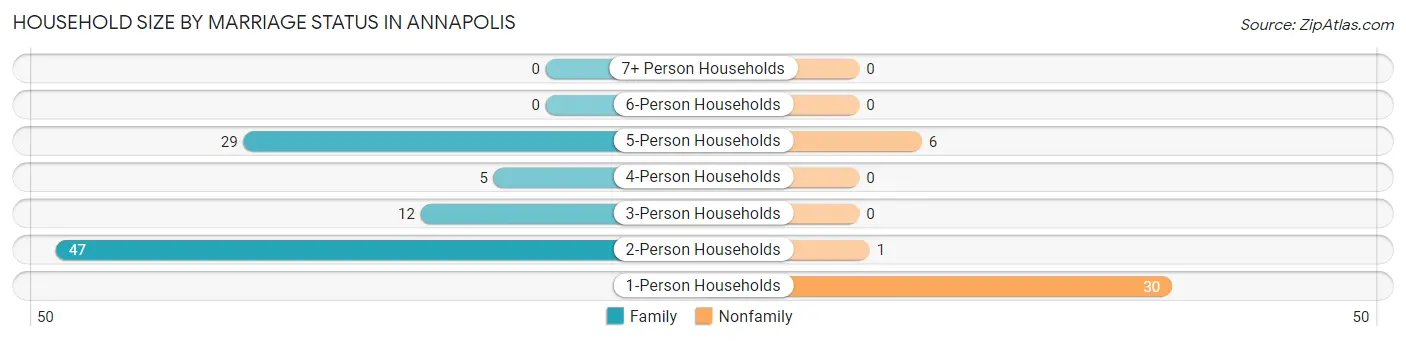
| Household Size | Family Households | Nonfamily Households |
| 1-Person Households | - | 30 (23.1%) |
| 2-Person Households | 47 (36.1%) | 1 (0.8%) |
| 3-Person Households | 12 (9.2%) | 0 (0.0%) |
| 4-Person Households | 5 (3.8%) | 0 (0.0%) |
| 5-Person Households | 29 (22.3%) | 6 (4.6%) |
| 6-Person Households | 0 (0.0%) | 0 (0.0%) |
| 7+ Person Households | 0 (0.0%) | 0 (0.0%) |
| Total | 93 (71.5%) | 37 (28.5%) |
Female Fertility in Annapolis
Fertility by Age in Annapolis
Average fertility rate in Annapolis is 20.0 births per 1,000 women. Women in the age bracket of 20 to 34 years have the highest fertility rate with 105.0 births per 1,000 women. Women in the age bracket of 20 to 34 years acount for 100.0% of all women with births.
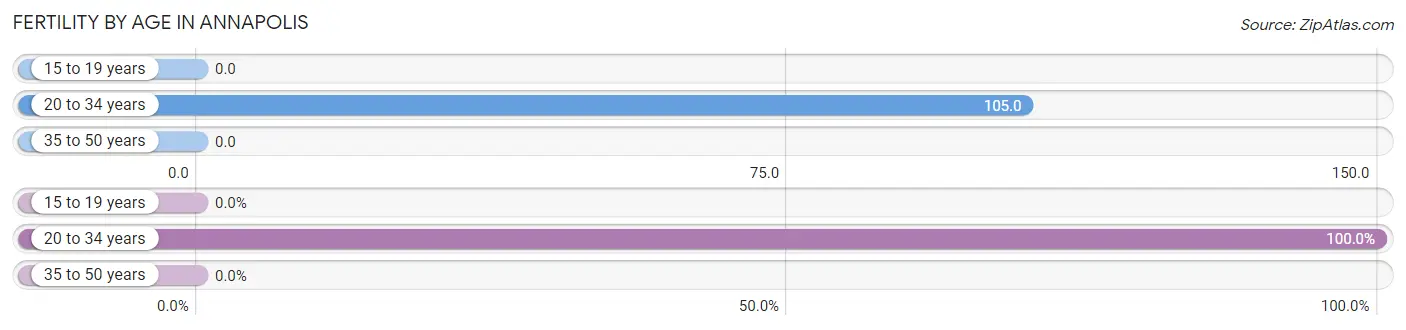
| Age Bracket | Women with Births | Births / 1,000 Women |
| 15 to 19 years | 0 (0.0%) | 0.0 |
| 20 to 34 years | 2 (100.0%) | 105.0 |
| 35 to 50 years | 0 (0.0%) | 0.0 |
| Total | 2 (100.0%) | 20.0 |
Fertility by Age by Marriage Status in Annapolis
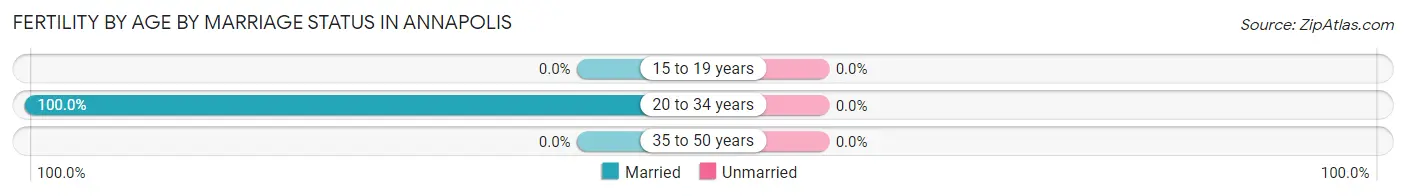
| Age Bracket | Married | Unmarried |
| 15 to 19 years | 0 (0.0%) | 0 (0.0%) |
| 20 to 34 years | 2 (100.0%) | 0 (0.0%) |
| 35 to 50 years | 0 (0.0%) | 0 (0.0%) |
| Total | 2 (100.0%) | 0 (0.0%) |
Fertility by Education in Annapolis
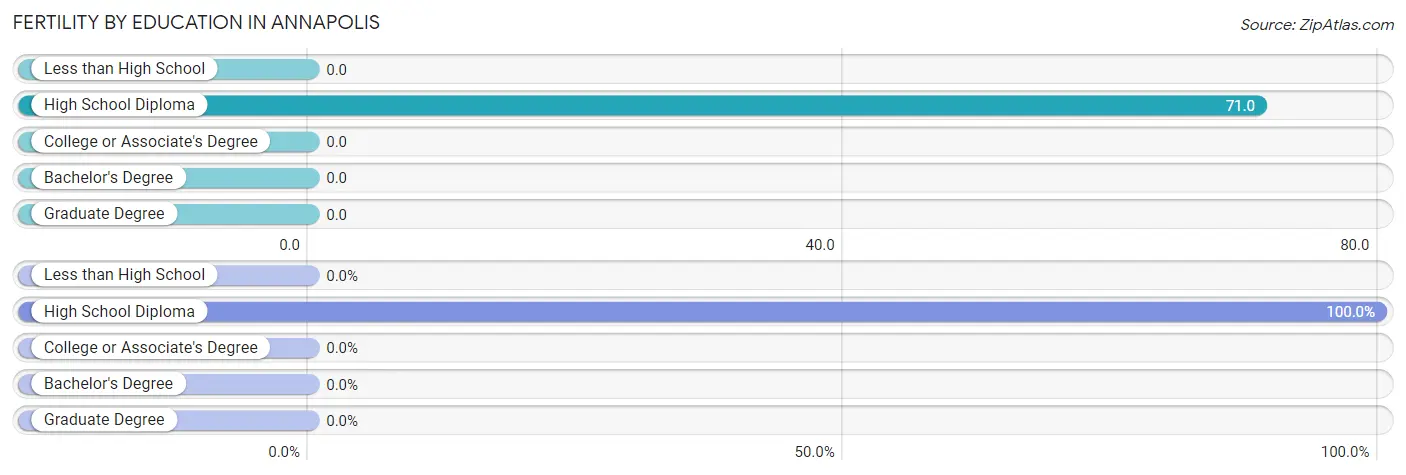
| Educational Attainment | Women with Births | Births / 1,000 Women |
| Less than High School | 0 (0.0%) | 0.0 |
| High School Diploma | 2 (100.0%) | 71.0 |
| College or Associate's Degree | 0 (0.0%) | 0.0 |
| Bachelor's Degree | 0 (0.0%) | 0.0 |
| Graduate Degree | 0 (0.0%) | 0.0 |
| Total | 2 (100.0%) | 20.0 |
Fertility by Education by Marriage Status in Annapolis
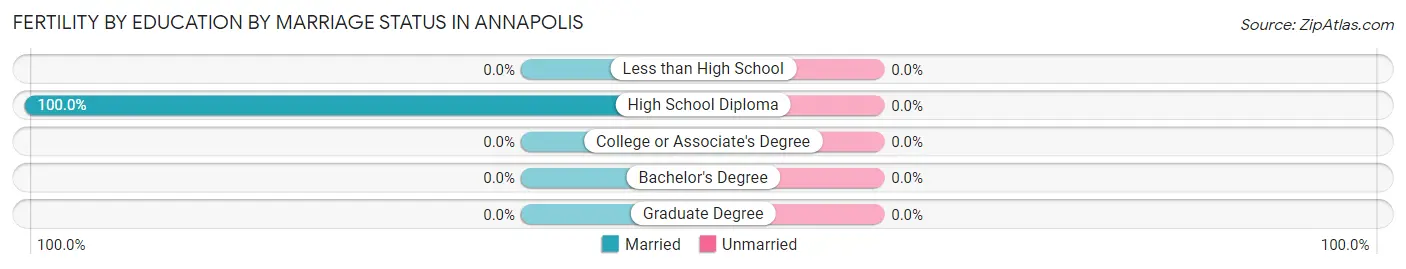
| Educational Attainment | Married | Unmarried |
| Less than High School | 0 (0.0%) | 0 (0.0%) |
| High School Diploma | 2 (100.0%) | 0 (0.0%) |
| College or Associate's Degree | 0 (0.0%) | 0 (0.0%) |
| Bachelor's Degree | 0 (0.0%) | 0 (0.0%) |
| Graduate Degree | 0 (0.0%) | 0 (0.0%) |
| Total | 2 (100.0%) | 0 (0.0%) |
Employment Characteristics in Annapolis
Employment by Class of Employer in Annapolis
Among the 110 employed individuals in Annapolis, private company employees (52 | 47.3%), not-for-profit organizations (23 | 20.9%), and local government employees (13 | 11.8%) make up the most common classes of employment.
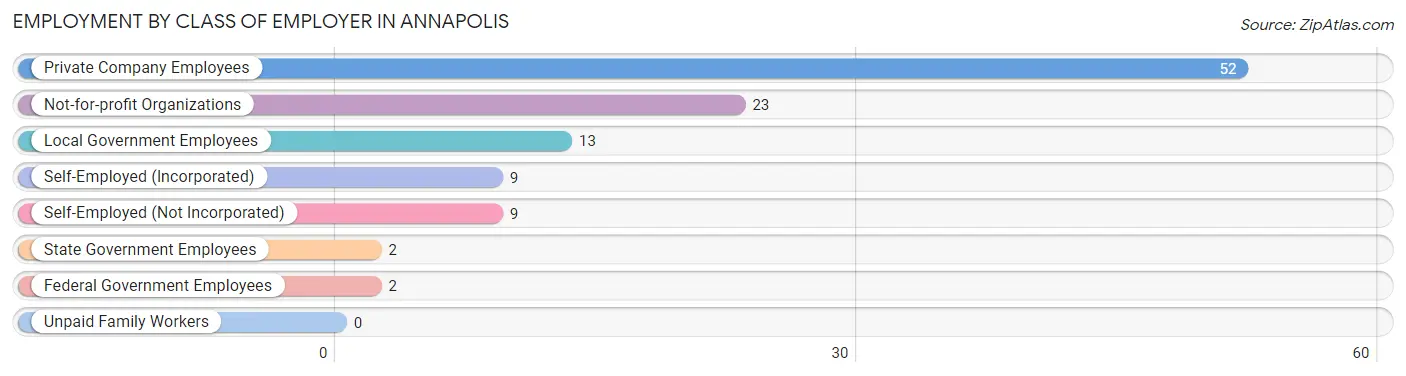
| Employer Class | # Employees | % Employees |
| Private Company Employees | 52 | 47.3% |
| Self-Employed (Incorporated) | 9 | 8.2% |
| Self-Employed (Not Incorporated) | 9 | 8.2% |
| Not-for-profit Organizations | 23 | 20.9% |
| Local Government Employees | 13 | 11.8% |
| State Government Employees | 2 | 1.8% |
| Federal Government Employees | 2 | 1.8% |
| Unpaid Family Workers | 0 | 0.0% |
| Total | 110 | 100.0% |
Employment Status by Age in Annapolis
According to the labor force statistics for Annapolis, out of the total population over 16 years of age (323), 45.8% or 148 individuals are in the labor force, with 23.0% or 34 of them unemployed. The age group with the highest labor force participation rate is 35 to 44 years, with 100.0% or 32 individuals in the labor force. Within the labor force, the 55 to 59 years age range has the highest percentage of unemployed individuals, with 57.6% or 34 of them being unemployed.
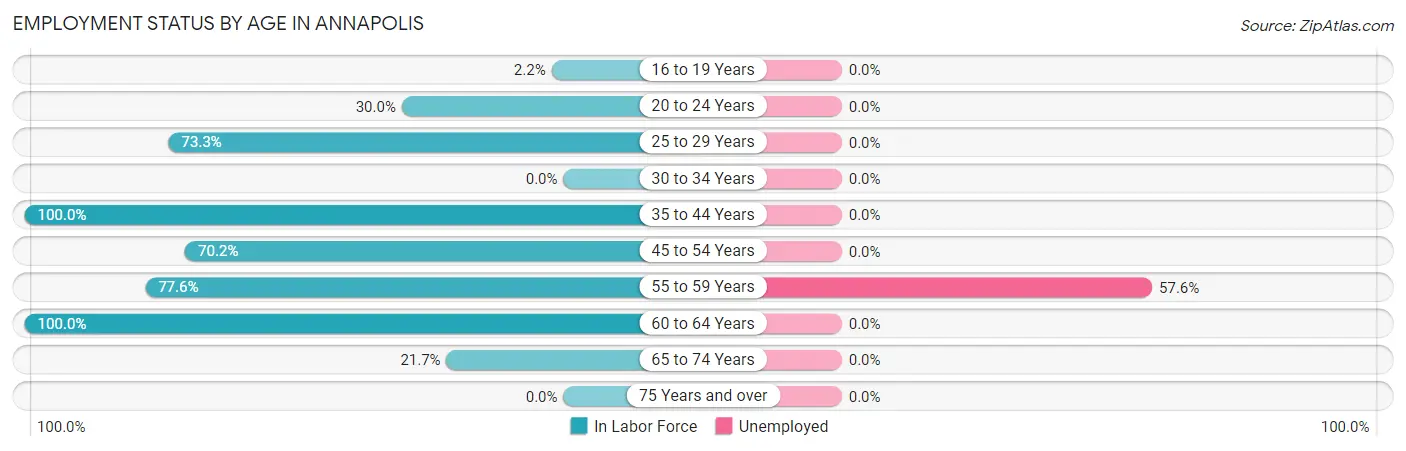
| Age Bracket | In Labor Force | Unemployed |
| 16 to 19 Years | 1 (2.2%) | 0 (0.0%) |
| 20 to 24 Years | 3 (30.0%) | 0 (0.0%) |
| 25 to 29 Years | 11 (73.3%) | 0 (0.0%) |
| 30 to 34 Years | 0 (0.0%) | 0 (0.0%) |
| 35 to 44 Years | 32 (100.0%) | 0 (0.0%) |
| 45 to 54 Years | 33 (70.2%) | 0 (0.0%) |
| 55 to 59 Years | 59 (77.6%) | 34 (57.6%) |
| 60 to 64 Years | 4 (100.0%) | 0 (0.0%) |
| 65 to 74 Years | 5 (21.7%) | 0 (0.0%) |
| 75 Years and over | 0 (0.0%) | 0 (0.0%) |
| Total | 148 (45.8%) | 34 (23.0%) |
Employment Status by Educational Attainment in Annapolis
According to labor force statistics for Annapolis, 60.4% of individuals (139) out of the total population between 25 and 64 years of age (230) are in the labor force, with 24.5% or 34 of them being unemployed. The group with the highest labor force participation rate are those with the educational attainment of bachelor's degree or higher, with 97.4% or 38 individuals in the labor force. Within the labor force, individuals with less than high school education have the highest percentage of unemployment, with 81.0% or 34 of them being unemployed.
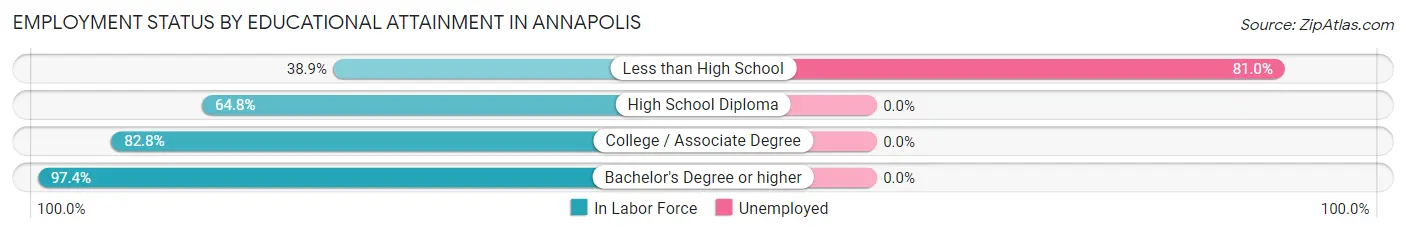
| Educational Attainment | In Labor Force | Unemployed |
| Less than High School | 42 (38.9%) | 87 (81.0%) |
| High School Diploma | 35 (64.8%) | 0 (0.0%) |
| College / Associate Degree | 24 (82.8%) | 0 (0.0%) |
| Bachelor's Degree or higher | 38 (97.4%) | 0 (0.0%) |
| Total | 139 (60.4%) | 56 (24.5%) |
Employment Occupations by Sex in Annapolis
Management, Business, Science and Arts Occupations
The most common Management, Business, Science and Arts occupations in Annapolis are Community & Social Service (29 | 25.4%), Education, Arts & Media (19 | 16.7%), Management (10 | 8.8%), Education Instruction & Library (10 | 8.8%), and Health Diagnosing & Treating (10 | 8.8%).
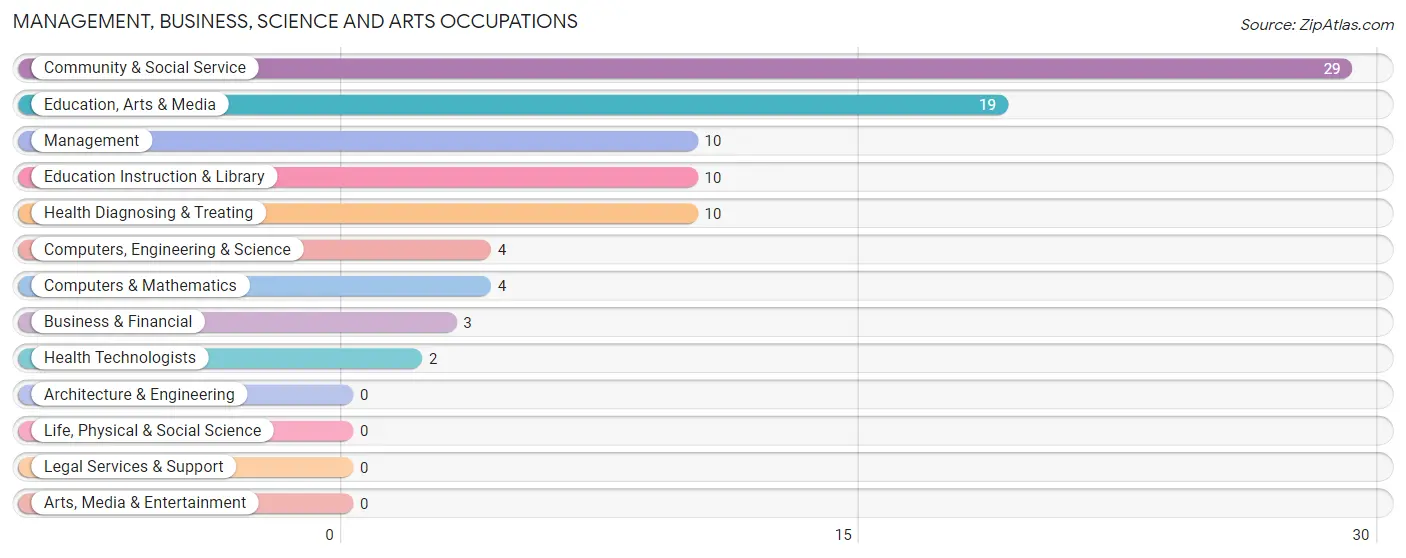
Management, Business, Science and Arts Occupations by Sex
Within the Management, Business, Science and Arts occupations in Annapolis, the most male-oriented occupations are Management (80.0%), Education Instruction & Library (40.0%), and Health Diagnosing & Treating (30.0%), while the most female-oriented occupations are Business & Financial (100.0%), Computers, Engineering & Science (100.0%), and Computers & Mathematics (100.0%).
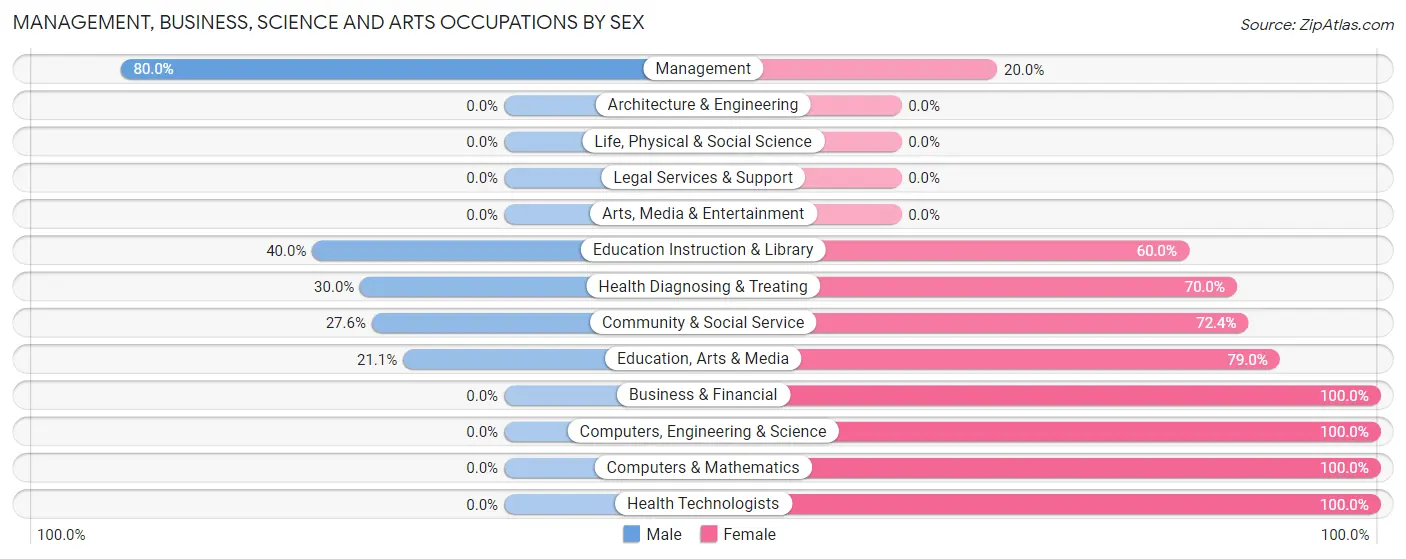
| Occupation | Male | Female |
| Management | 8 (80.0%) | 2 (20.0%) |
| Business & Financial | 0 (0.0%) | 3 (100.0%) |
| Computers, Engineering & Science | 0 (0.0%) | 4 (100.0%) |
| Computers & Mathematics | 0 (0.0%) | 4 (100.0%) |
| Architecture & Engineering | 0 (0.0%) | 0 (0.0%) |
| Life, Physical & Social Science | 0 (0.0%) | 0 (0.0%) |
| Community & Social Service | 8 (27.6%) | 21 (72.4%) |
| Education, Arts & Media | 4 (21.0%) | 15 (78.9%) |
| Legal Services & Support | 0 (0.0%) | 0 (0.0%) |
| Education Instruction & Library | 4 (40.0%) | 6 (60.0%) |
| Arts, Media & Entertainment | 0 (0.0%) | 0 (0.0%) |
| Health Diagnosing & Treating | 3 (30.0%) | 7 (70.0%) |
| Health Technologists | 0 (0.0%) | 2 (100.0%) |
| Total (Category) | 19 (33.9%) | 37 (66.1%) |
| Total (Overall) | 55 (48.2%) | 59 (51.7%) |
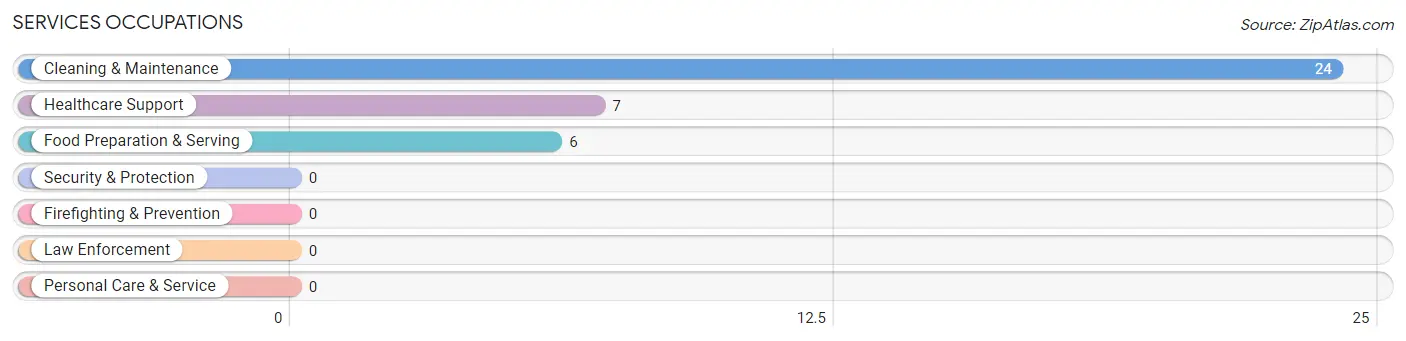
Services Occupations
The most common Services occupations in Annapolis are Cleaning & Maintenance (24 | 21.0%), Healthcare Support (7 | 6.1%), and Food Preparation & Serving (6 | 5.3%).
Services Occupations by Sex
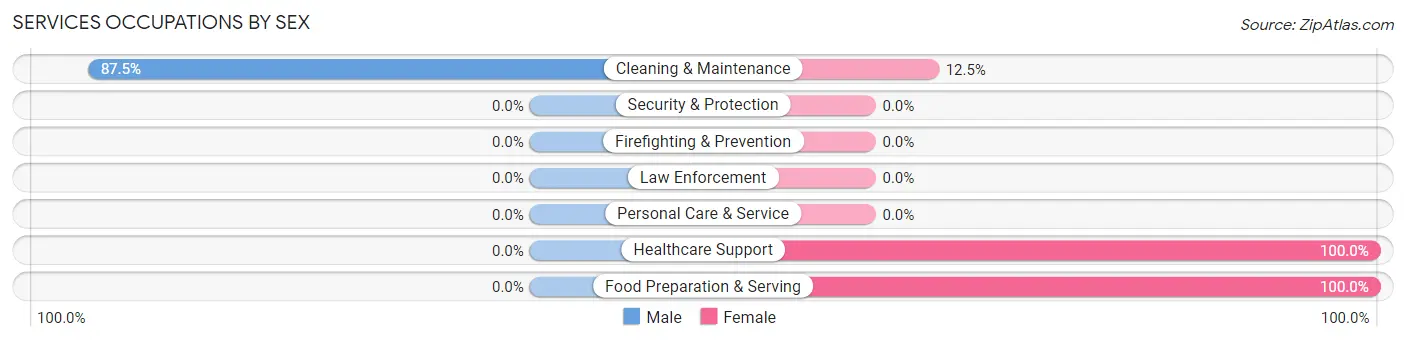
| Occupation | Male | Female |
| Healthcare Support | 0 (0.0%) | 7 (100.0%) |
| Security & Protection | 0 (0.0%) | 0 (0.0%) |
| Firefighting & Prevention | 0 (0.0%) | 0 (0.0%) |
| Law Enforcement | 0 (0.0%) | 0 (0.0%) |
| Food Preparation & Serving | 0 (0.0%) | 6 (100.0%) |
| Cleaning & Maintenance | 21 (87.5%) | 3 (12.5%) |
| Personal Care & Service | 0 (0.0%) | 0 (0.0%) |
| Total (Category) | 21 (56.8%) | 16 (43.2%) |
| Total (Overall) | 55 (48.2%) | 59 (51.7%) |
Sales and Office Occupations
The most common Sales and Office occupations in Annapolis are , and Office & Administration (6 | 5.3%).
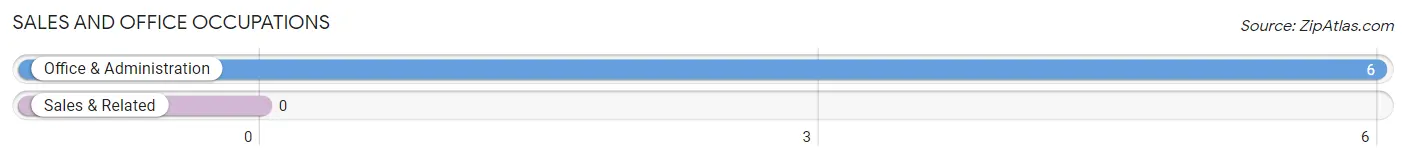
Sales and Office Occupations by Sex
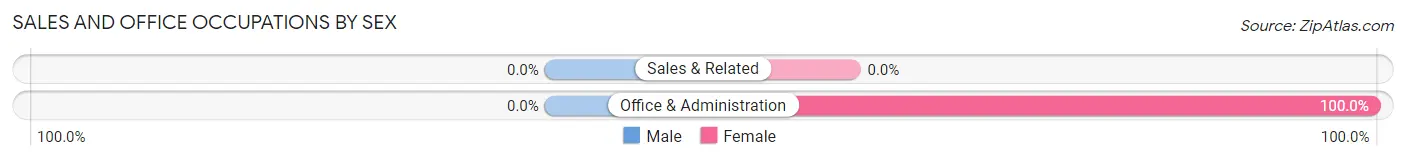
| Occupation | Male | Female |
| Sales & Related | 0 (0.0%) | 0 (0.0%) |
| Office & Administration | 0 (0.0%) | 6 (100.0%) |
| Total (Category) | 0 (0.0%) | 6 (100.0%) |
| Total (Overall) | 55 (48.2%) | 59 (51.7%) |
Natural Resources, Construction and Maintenance Occupations
The most common Natural Resources, Construction and Maintenance occupations in Annapolis are , and Construction & Extraction (8 | 7.0%).
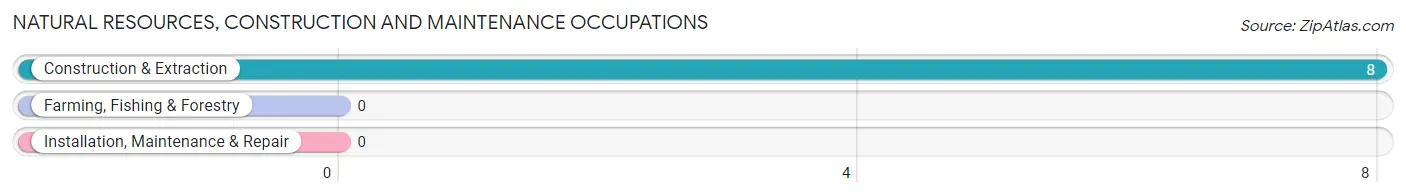
Natural Resources, Construction and Maintenance Occupations by Sex
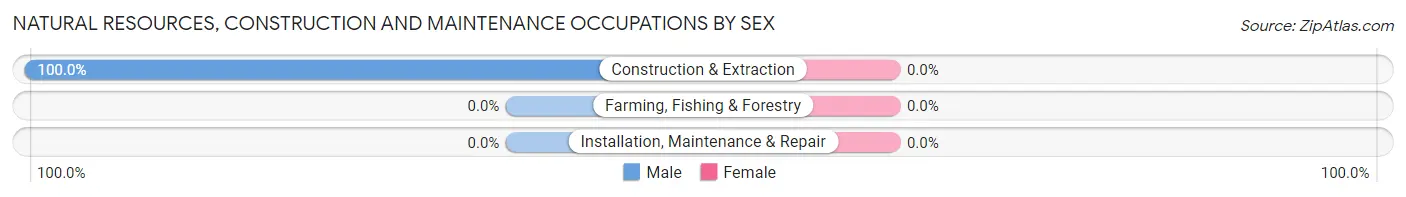
| Occupation | Male | Female |
| Farming, Fishing & Forestry | 0 (0.0%) | 0 (0.0%) |
| Construction & Extraction | 8 (100.0%) | 0 (0.0%) |
| Installation, Maintenance & Repair | 0 (0.0%) | 0 (0.0%) |
| Total (Category) | 8 (100.0%) | 0 (0.0%) |
| Total (Overall) | 55 (48.2%) | 59 (51.7%) |
Production, Transportation and Moving Occupations
The most common Production, Transportation and Moving occupations in Annapolis are Transportation (5 | 4.4%), and Production (2 | 1.8%).
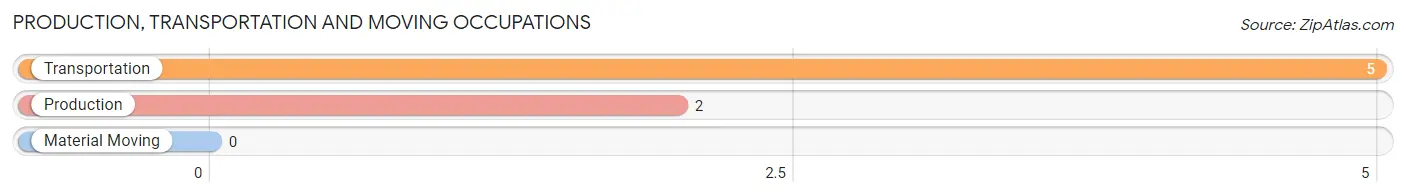
Production, Transportation and Moving Occupations by Sex
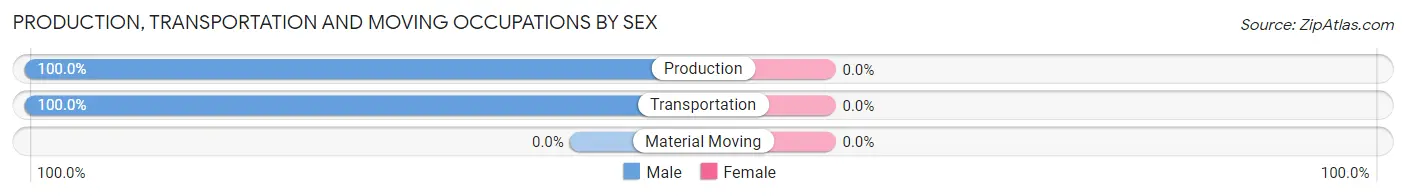
| Occupation | Male | Female |
| Production | 2 (100.0%) | 0 (0.0%) |
| Transportation | 5 (100.0%) | 0 (0.0%) |
| Material Moving | 0 (0.0%) | 0 (0.0%) |
| Total (Category) | 7 (100.0%) | 0 (0.0%) |
| Total (Overall) | 55 (48.2%) | 59 (51.7%) |
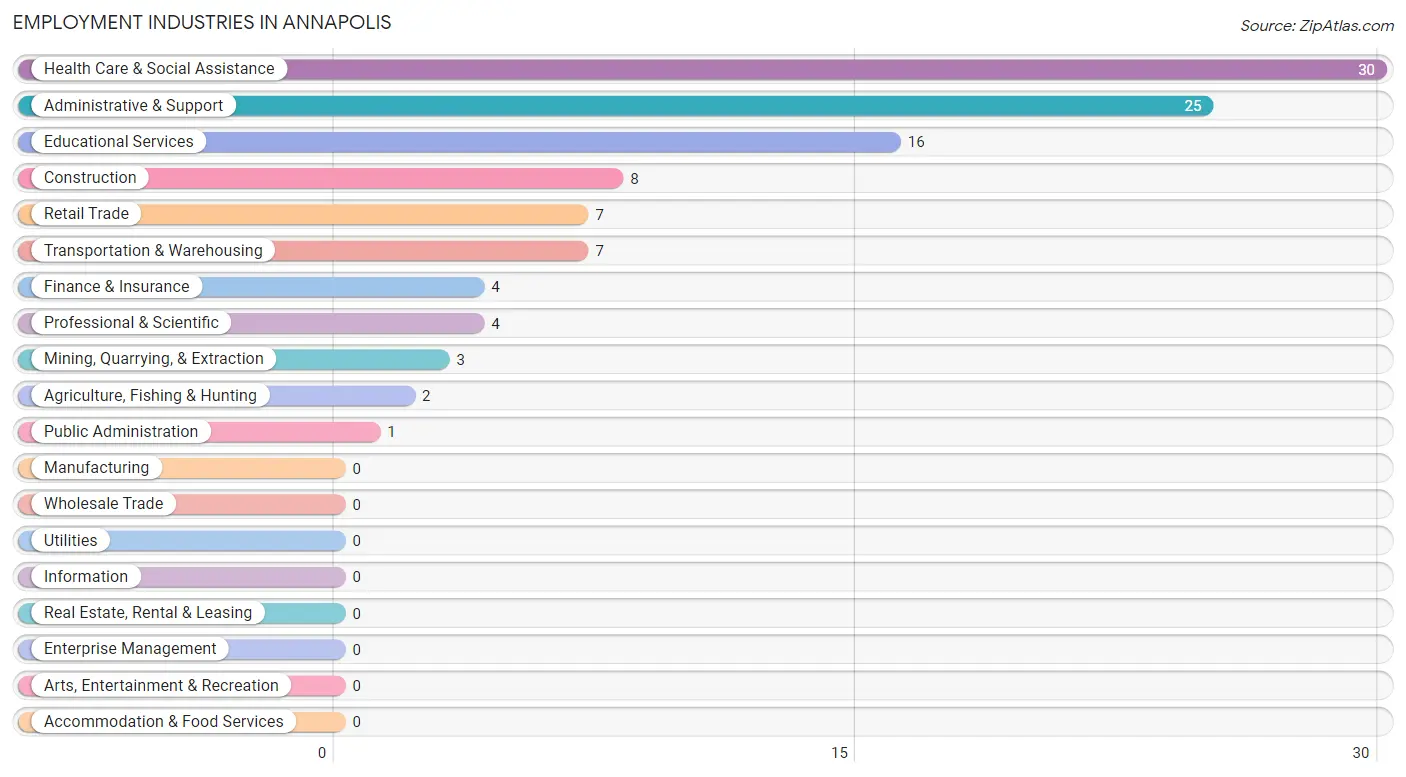
Employment Industries by Sex in Annapolis
Employment Industries in Annapolis
The major employment industries in Annapolis include Health Care & Social Assistance (30 | 26.3%), Administrative & Support (25 | 21.9%), Educational Services (16 | 14.0%), Construction (8 | 7.0%), and Retail Trade (7 | 6.1%).
Employment Industries by Sex in Annapolis
The Annapolis industries that see more men than women are Agriculture, Fishing & Hunting (100.0%), Construction (100.0%), and Administrative & Support (92.0%), whereas the industries that tend to have a higher number of women are Mining, Quarrying, & Extraction (100.0%), Finance & Insurance (100.0%), and Professional & Scientific (100.0%).
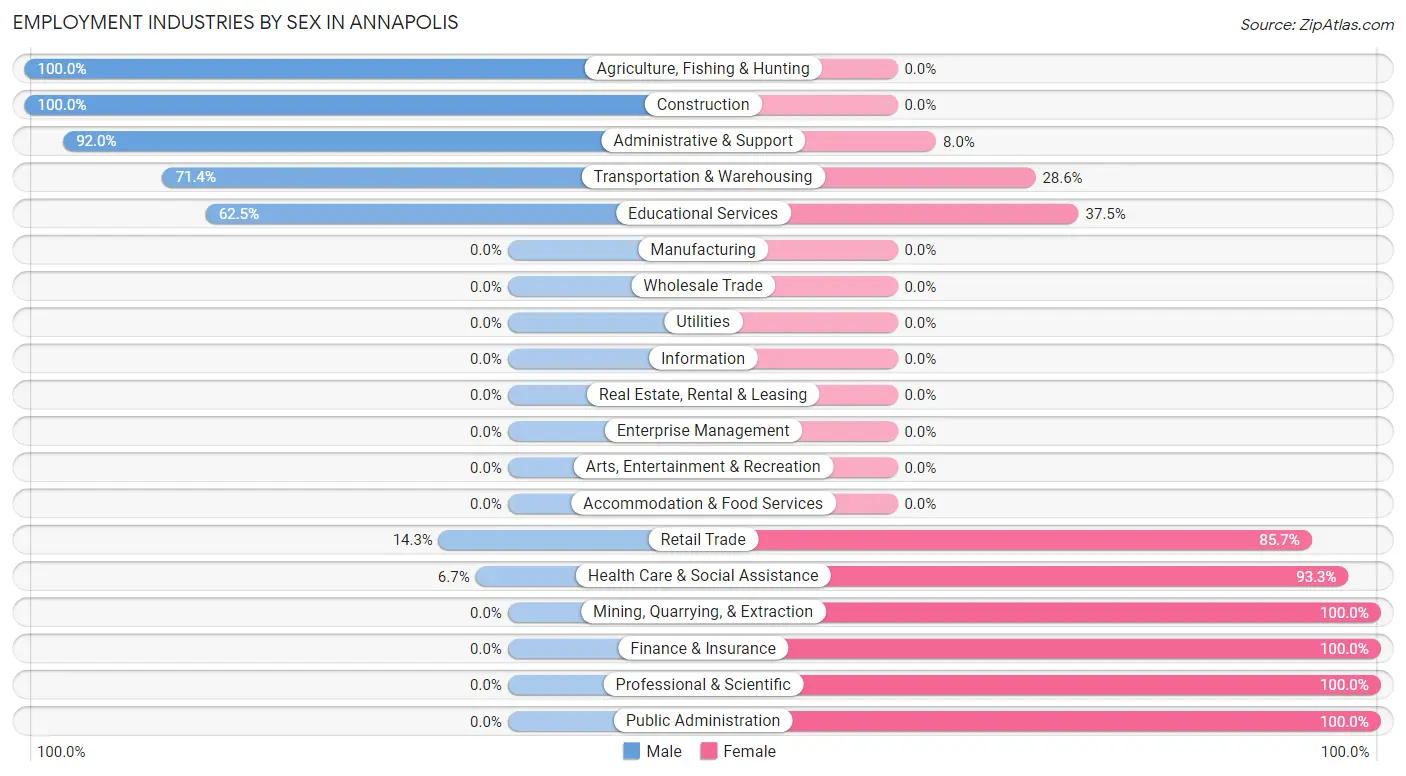
| Industry | Male | Female |
| Agriculture, Fishing & Hunting | 2 (100.0%) | 0 (0.0%) |
| Mining, Quarrying, & Extraction | 0 (0.0%) | 3 (100.0%) |
| Construction | 8 (100.0%) | 0 (0.0%) |
| Manufacturing | 0 (0.0%) | 0 (0.0%) |
| Wholesale Trade | 0 (0.0%) | 0 (0.0%) |
| Retail Trade | 1 (14.3%) | 6 (85.7%) |
| Transportation & Warehousing | 5 (71.4%) | 2 (28.6%) |
| Utilities | 0 (0.0%) | 0 (0.0%) |
| Information | 0 (0.0%) | 0 (0.0%) |
| Finance & Insurance | 0 (0.0%) | 4 (100.0%) |
| Real Estate, Rental & Leasing | 0 (0.0%) | 0 (0.0%) |
| Professional & Scientific | 0 (0.0%) | 4 (100.0%) |
| Enterprise Management | 0 (0.0%) | 0 (0.0%) |
| Administrative & Support | 23 (92.0%) | 2 (8.0%) |
| Educational Services | 10 (62.5%) | 6 (37.5%) |
| Health Care & Social Assistance | 2 (6.7%) | 28 (93.3%) |
| Arts, Entertainment & Recreation | 0 (0.0%) | 0 (0.0%) |
| Accommodation & Food Services | 0 (0.0%) | 0 (0.0%) |
| Public Administration | 0 (0.0%) | 1 (100.0%) |
| Total | 55 (48.2%) | 59 (51.7%) |
Education in Annapolis
School Enrollment in Annapolis
The most common levels of schooling among the 154 students in Annapolis are high school (52 | 33.8%), elementary school (35 | 22.7%), and kindergarten (26 | 16.9%).
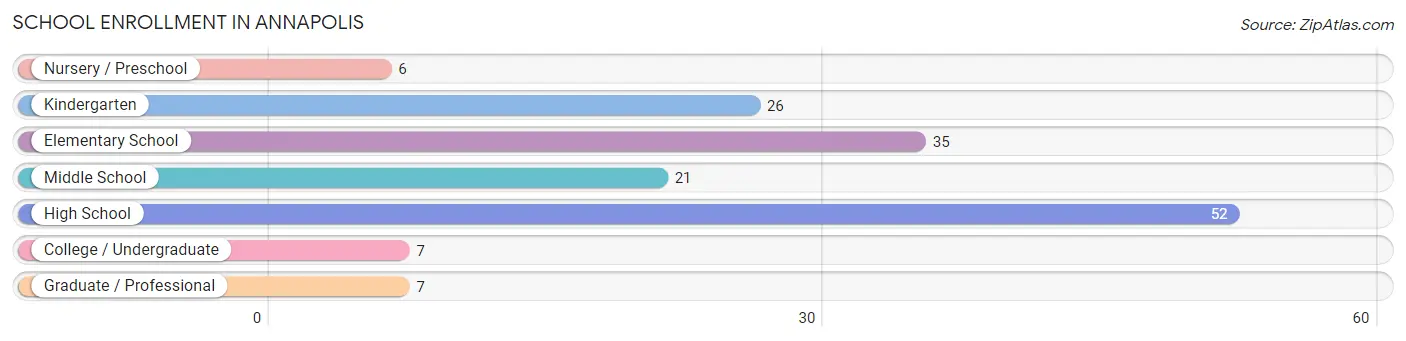
| School Level | # Students | % Students |
| Nursery / Preschool | 6 | 3.9% |
| Kindergarten | 26 | 16.9% |
| Elementary School | 35 | 22.7% |
| Middle School | 21 | 13.6% |
| High School | 52 | 33.8% |
| College / Undergraduate | 7 | 4.5% |
| Graduate / Professional | 7 | 4.5% |
| Total | 154 | 100.0% |
School Enrollment by Age by Funding Source in Annapolis
Out of a total of 154 students who are enrolled in schools in Annapolis, 9 (5.8%) attend a private institution, while the remaining 145 (94.2%) are enrolled in public schools. The age group of 35 years and over has the highest likelihood of being enrolled in private schools, with 3 (33.3% in the age bracket) enrolled. Conversely, the age group of 3 to 4 year olds has the lowest likelihood of being enrolled in a private school, with 6 (100.0% in the age bracket) attending a public institution.
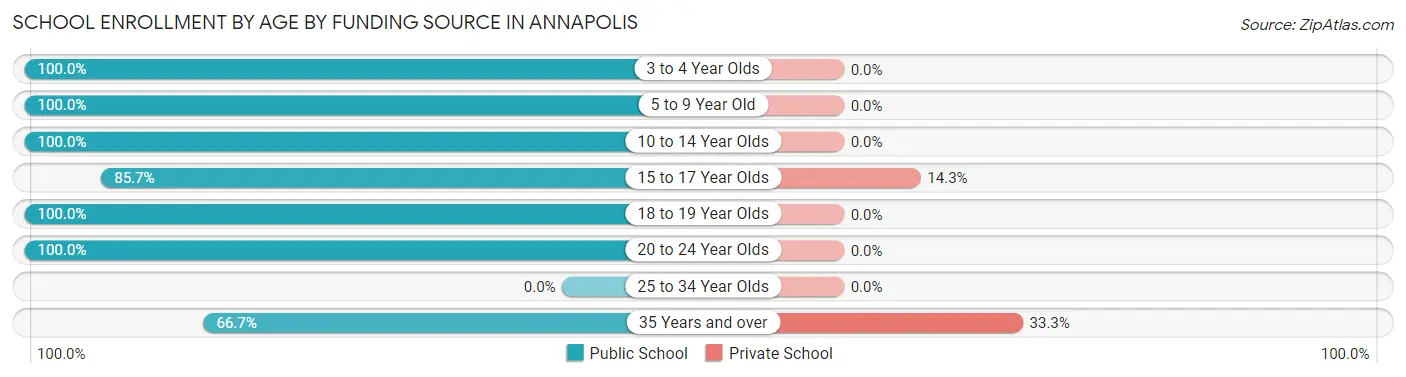
| Age Bracket | Public School | Private School |
| 3 to 4 Year Olds | 6 (100.0%) | 0 (0.0%) |
| 5 to 9 Year Old | 56 (100.0%) | 0 (0.0%) |
| 10 to 14 Year Olds | 29 (100.0%) | 0 (0.0%) |
| 15 to 17 Year Olds | 36 (85.7%) | 6 (14.3%) |
| 18 to 19 Year Olds | 7 (100.0%) | 0 (0.0%) |
| 20 to 24 Year Olds | 5 (100.0%) | 0 (0.0%) |
| 25 to 34 Year Olds | 0 (0.0%) | 0 (0.0%) |
| 35 Years and over | 6 (66.7%) | 3 (33.3%) |
| Total | 145 (94.2%) | 9 (5.8%) |
Educational Attainment by Field of Study in Annapolis
Education (16 | 41.0%), psychology (9 | 23.1%), arts & humanities (6 | 15.4%), business (4 | 10.3%), and liberal arts & history (4 | 10.3%) are the most common fields of study among 39 individuals in Annapolis who have obtained a bachelor's degree or higher.
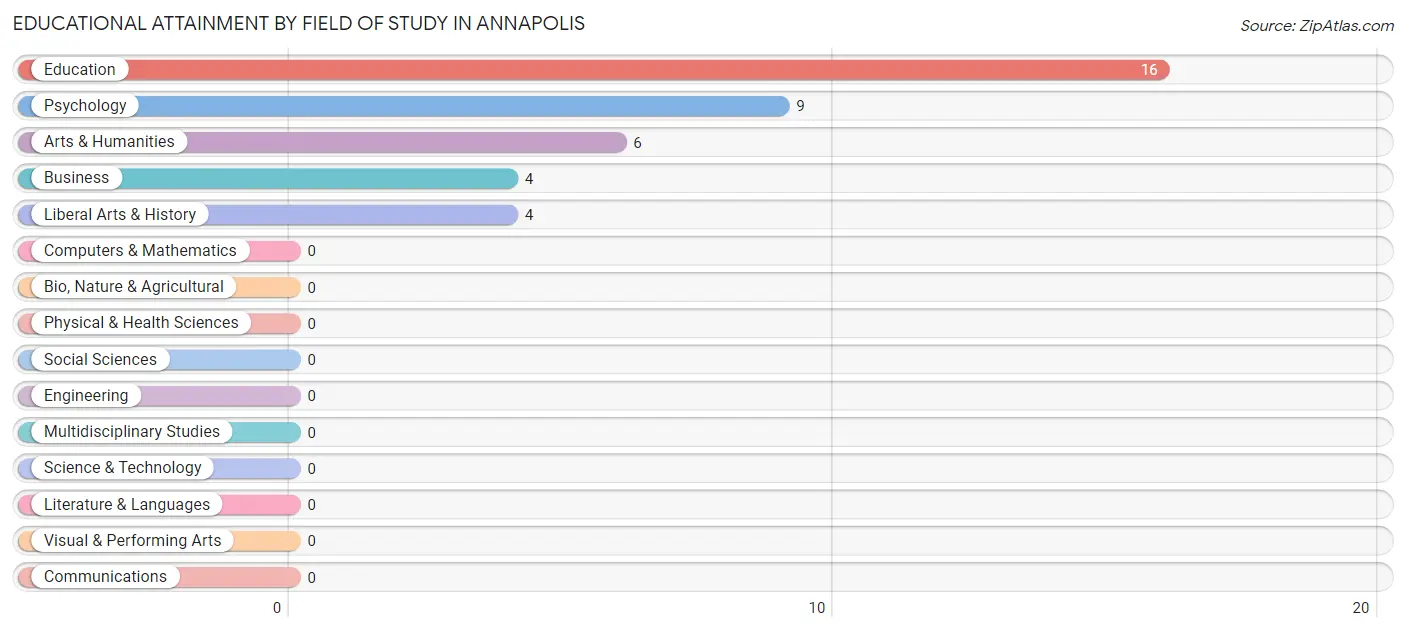
| Field of Study | # Graduates | % Graduates |
| Computers & Mathematics | 0 | 0.0% |
| Bio, Nature & Agricultural | 0 | 0.0% |
| Physical & Health Sciences | 0 | 0.0% |
| Psychology | 9 | 23.1% |
| Social Sciences | 0 | 0.0% |
| Engineering | 0 | 0.0% |
| Multidisciplinary Studies | 0 | 0.0% |
| Science & Technology | 0 | 0.0% |
| Business | 4 | 10.3% |
| Education | 16 | 41.0% |
| Literature & Languages | 0 | 0.0% |
| Liberal Arts & History | 4 | 10.3% |
| Visual & Performing Arts | 0 | 0.0% |
| Communications | 0 | 0.0% |
| Arts & Humanities | 6 | 15.4% |
| Total | 39 | 100.0% |
Transportation & Commute in Annapolis
Vehicle Availability by Sex in Annapolis
The most prevalent vehicle ownership categories in Annapolis are males with 3 vehicles (30, accounting for 58.8%) and females with 3 vehicles (13, making up 50.8%).
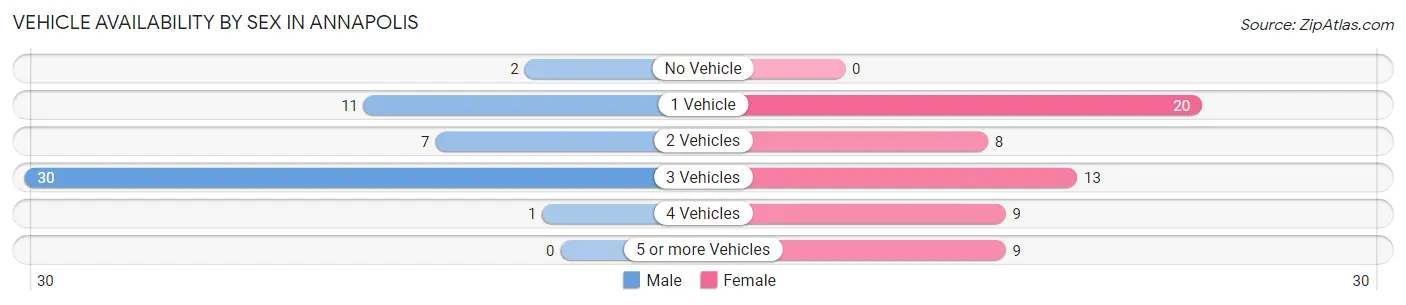
| Vehicles Available | Male | Female |
| No Vehicle | 2 (3.9%) | 0 (0.0%) |
| 1 Vehicle | 11 (21.6%) | 20 (33.9%) |
| 2 Vehicles | 7 (13.7%) | 8 (13.6%) |
| 3 Vehicles | 30 (58.8%) | 13 (22.0%) |
| 4 Vehicles | 1 (2.0%) | 9 (15.2%) |
| 5 or more Vehicles | 0 (0.0%) | 9 (15.2%) |
| Total | 51 (100.0%) | 59 (100.0%) |
Commute Time in Annapolis
The most frequently occuring commute durations in Annapolis are less than 5 minutes (33 commuters, 34.0%), 5 to 9 minutes (28 commuters, 28.9%), and 30 to 34 minutes (11 commuters, 11.3%).
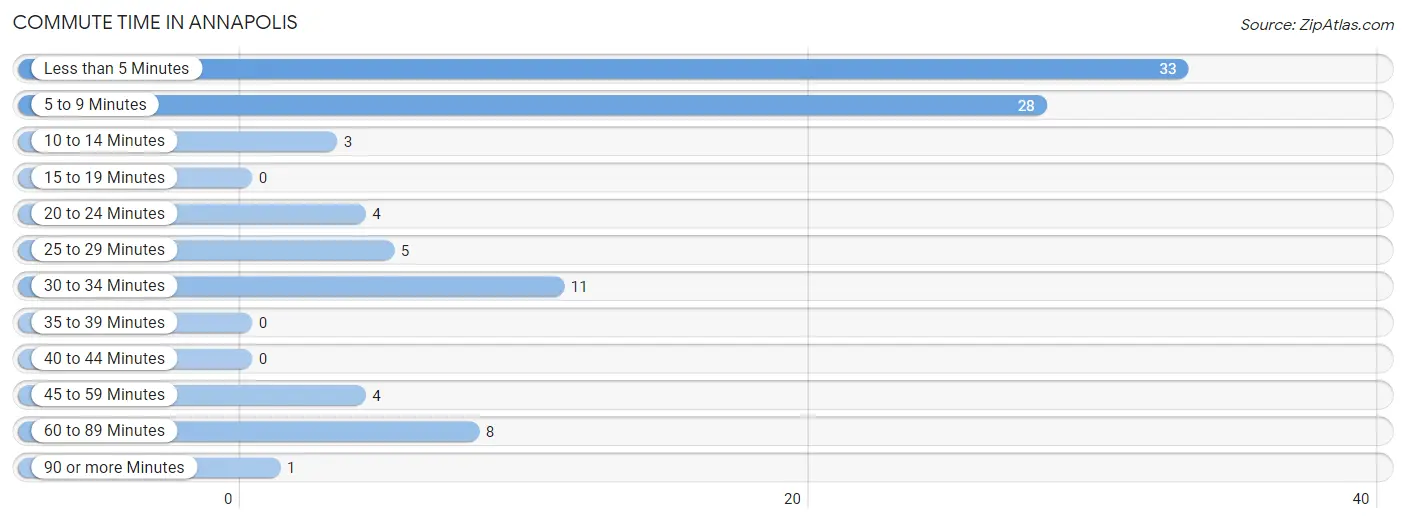
| Commute Time | # Commuters | % Commuters |
| Less than 5 Minutes | 33 | 34.0% |
| 5 to 9 Minutes | 28 | 28.9% |
| 10 to 14 Minutes | 3 | 3.1% |
| 15 to 19 Minutes | 0 | 0.0% |
| 20 to 24 Minutes | 4 | 4.1% |
| 25 to 29 Minutes | 5 | 5.1% |
| 30 to 34 Minutes | 11 | 11.3% |
| 35 to 39 Minutes | 0 | 0.0% |
| 40 to 44 Minutes | 0 | 0.0% |
| 45 to 59 Minutes | 4 | 4.1% |
| 60 to 89 Minutes | 8 | 8.3% |
| 90 or more Minutes | 1 | 1.0% |
Commute Time by Sex in Annapolis
The most common commute times in Annapolis are 5 to 9 minutes (21 commuters, 41.2%) for males and less than 5 minutes (22 commuters, 47.8%) for females.
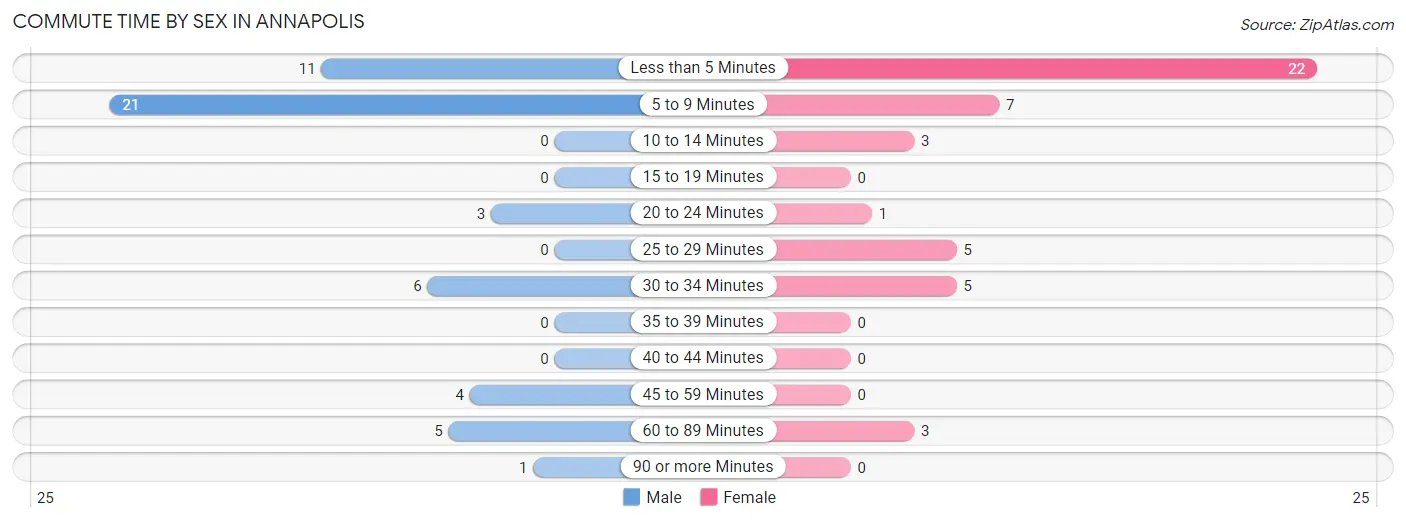
| Commute Time | Male | Female |
| Less than 5 Minutes | 11 (21.6%) | 22 (47.8%) |
| 5 to 9 Minutes | 21 (41.2%) | 7 (15.2%) |
| 10 to 14 Minutes | 0 (0.0%) | 3 (6.5%) |
| 15 to 19 Minutes | 0 (0.0%) | 0 (0.0%) |
| 20 to 24 Minutes | 3 (5.9%) | 1 (2.2%) |
| 25 to 29 Minutes | 0 (0.0%) | 5 (10.9%) |
| 30 to 34 Minutes | 6 (11.8%) | 5 (10.9%) |
| 35 to 39 Minutes | 0 (0.0%) | 0 (0.0%) |
| 40 to 44 Minutes | 0 (0.0%) | 0 (0.0%) |
| 45 to 59 Minutes | 4 (7.8%) | 0 (0.0%) |
| 60 to 89 Minutes | 5 (9.8%) | 3 (6.5%) |
| 90 or more Minutes | 1 (2.0%) | 0 (0.0%) |
Time of Departure to Work by Sex in Annapolis
The most frequent times of departure to work in Annapolis are 12:00 AM to 4:59 AM (22, 43.1%) for males and 7:00 AM to 7:29 AM (11, 23.9%) for females.
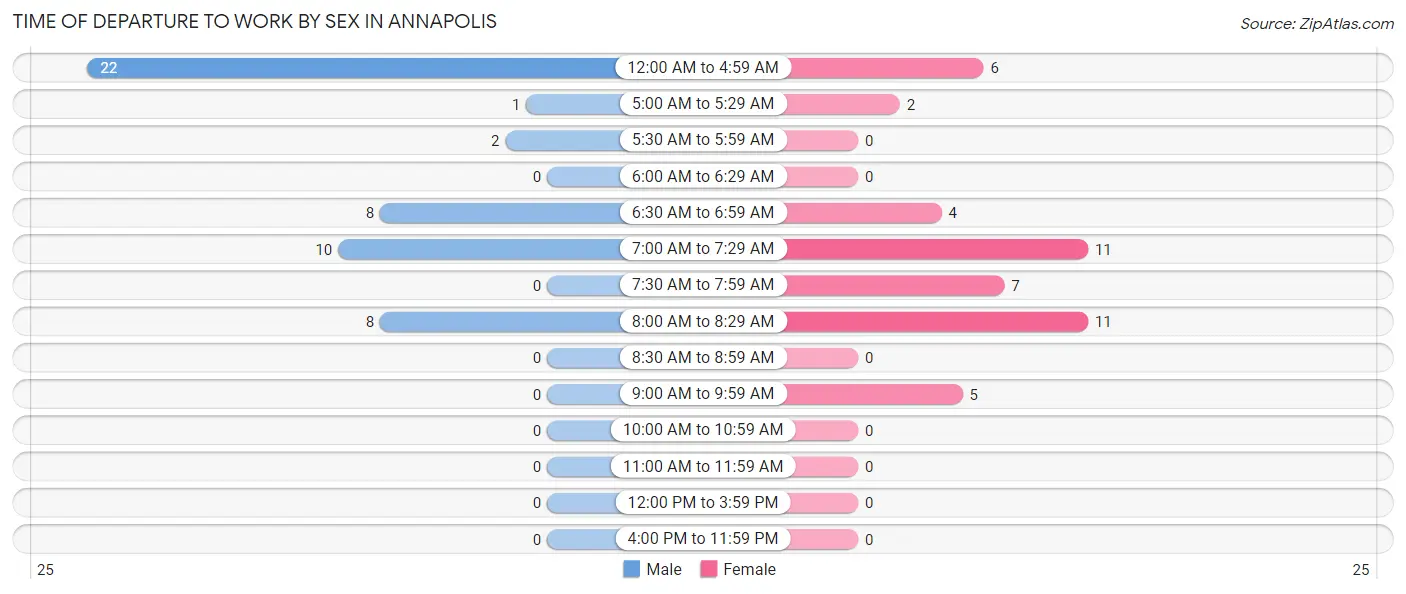
| Time of Departure | Male | Female |
| 12:00 AM to 4:59 AM | 22 (43.1%) | 6 (13.0%) |
| 5:00 AM to 5:29 AM | 1 (2.0%) | 2 (4.3%) |
| 5:30 AM to 5:59 AM | 2 (3.9%) | 0 (0.0%) |
| 6:00 AM to 6:29 AM | 0 (0.0%) | 0 (0.0%) |
| 6:30 AM to 6:59 AM | 8 (15.7%) | 4 (8.7%) |
| 7:00 AM to 7:29 AM | 10 (19.6%) | 11 (23.9%) |
| 7:30 AM to 7:59 AM | 0 (0.0%) | 7 (15.2%) |
| 8:00 AM to 8:29 AM | 8 (15.7%) | 11 (23.9%) |
| 8:30 AM to 8:59 AM | 0 (0.0%) | 0 (0.0%) |
| 9:00 AM to 9:59 AM | 0 (0.0%) | 5 (10.9%) |
| 10:00 AM to 10:59 AM | 0 (0.0%) | 0 (0.0%) |
| 11:00 AM to 11:59 AM | 0 (0.0%) | 0 (0.0%) |
| 12:00 PM to 3:59 PM | 0 (0.0%) | 0 (0.0%) |
| 4:00 PM to 11:59 PM | 0 (0.0%) | 0 (0.0%) |
| Total | 51 (100.0%) | 46 (100.0%) |
Housing Occupancy in Annapolis
Occupancy by Ownership in Annapolis
Of the total 130 dwellings in Annapolis, owner-occupied units account for 81 (62.3%), while renter-occupied units make up 49 (37.7%).
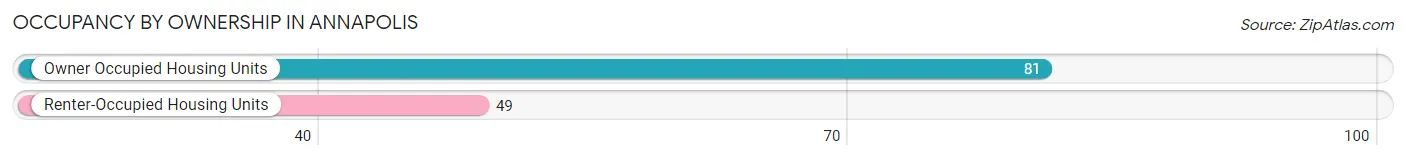
| Occupancy | # Housing Units | % Housing Units |
| Owner Occupied Housing Units | 81 | 62.3% |
| Renter-Occupied Housing Units | 49 | 37.7% |
| Total Occupied Housing Units | 130 | 100.0% |
Occupancy by Household Size in Annapolis
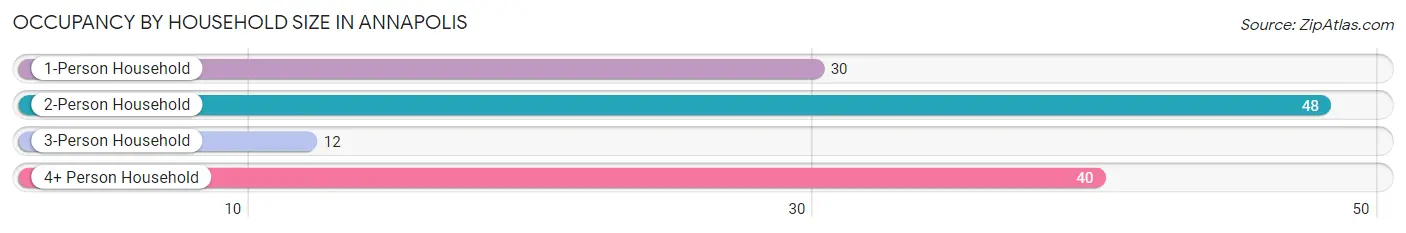
| Household Size | # Housing Units | % Housing Units |
| 1-Person Household | 30 | 23.1% |
| 2-Person Household | 48 | 36.9% |
| 3-Person Household | 12 | 9.2% |
| 4+ Person Household | 40 | 30.8% |
| Total Housing Units | 130 | 100.0% |
Occupancy by Ownership by Household Size in Annapolis
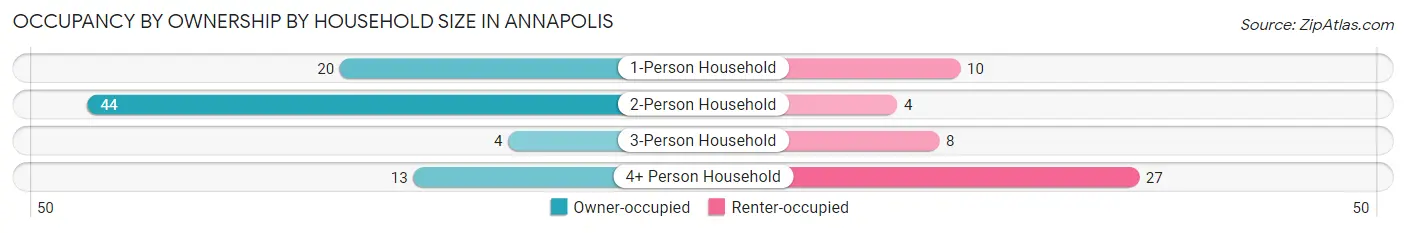
| Household Size | Owner-occupied | Renter-occupied |
| 1-Person Household | 20 (66.7%) | 10 (33.3%) |
| 2-Person Household | 44 (91.7%) | 4 (8.3%) |
| 3-Person Household | 4 (33.3%) | 8 (66.7%) |
| 4+ Person Household | 13 (32.5%) | 27 (67.5%) |
| Total Housing Units | 81 (62.3%) | 49 (37.7%) |
Occupancy by Educational Attainment in Annapolis
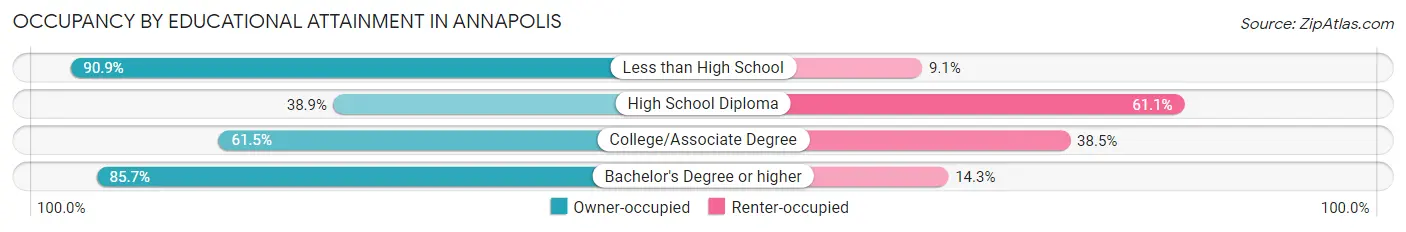
| Household Size | Owner-occupied | Renter-occupied |
| Less than High School | 20 (90.9%) | 2 (9.1%) |
| High School Diploma | 21 (38.9%) | 33 (61.1%) |
| College/Associate Degree | 16 (61.5%) | 10 (38.5%) |
| Bachelor's Degree or higher | 24 (85.7%) | 4 (14.3%) |
Occupancy by Age of Householder in Annapolis
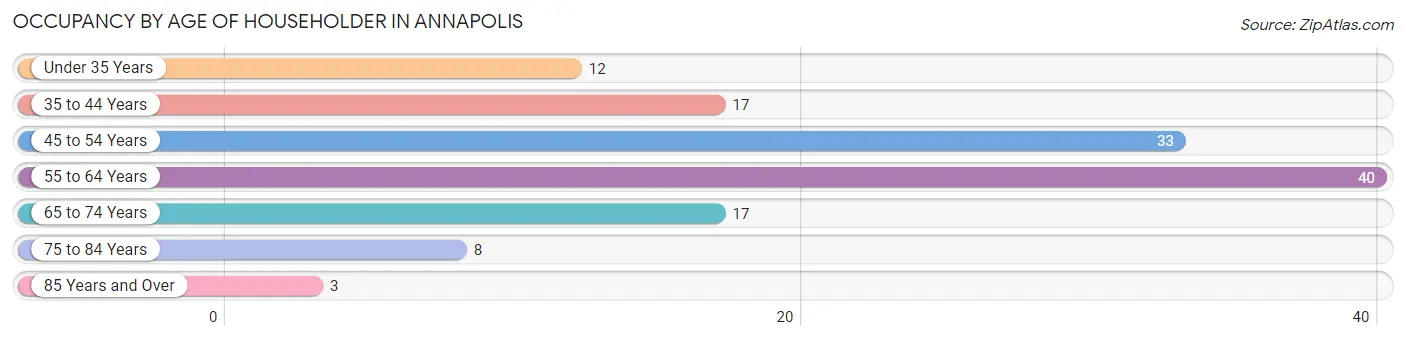
| Age Bracket | # Households | % Households |
| Under 35 Years | 12 | 9.2% |
| 35 to 44 Years | 17 | 13.1% |
| 45 to 54 Years | 33 | 25.4% |
| 55 to 64 Years | 40 | 30.8% |
| 65 to 74 Years | 17 | 13.1% |
| 75 to 84 Years | 8 | 6.1% |
| 85 Years and Over | 3 | 2.3% |
| Total | 130 | 100.0% |
Housing Finances in Annapolis
Median Income by Occupancy in Annapolis
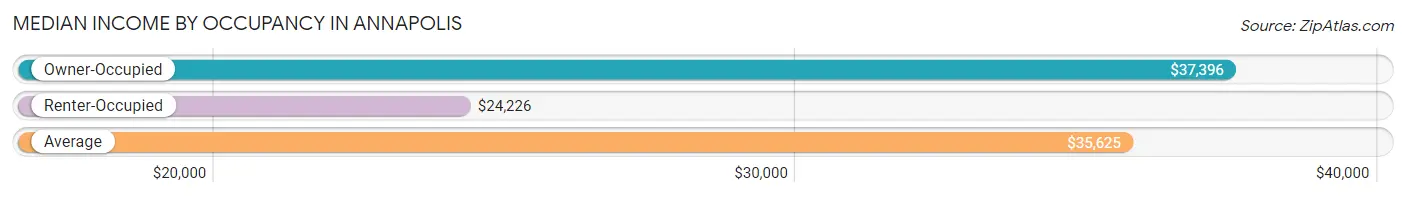
| Occupancy Type | # Households | Median Income |
| Owner-Occupied | 81 (62.3%) | $37,396 |
| Renter-Occupied | 49 (37.7%) | $24,226 |
| Average | 130 (100.0%) | $35,625 |
Occupancy by Householder Income Bracket in Annapolis
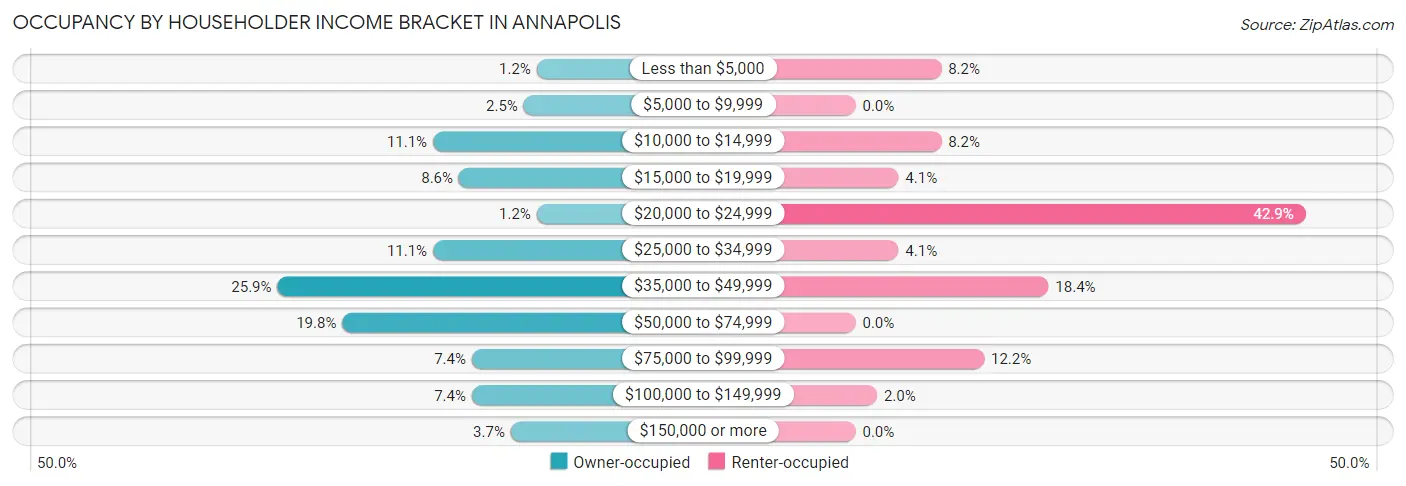
| Income Bracket | Owner-occupied | Renter-occupied |
| Less than $5,000 | 1 (1.2%) | 4 (8.2%) |
| $5,000 to $9,999 | 2 (2.5%) | 0 (0.0%) |
| $10,000 to $14,999 | 9 (11.1%) | 4 (8.2%) |
| $15,000 to $19,999 | 7 (8.6%) | 2 (4.1%) |
| $20,000 to $24,999 | 1 (1.2%) | 21 (42.9%) |
| $25,000 to $34,999 | 9 (11.1%) | 2 (4.1%) |
| $35,000 to $49,999 | 21 (25.9%) | 9 (18.4%) |
| $50,000 to $74,999 | 16 (19.8%) | 0 (0.0%) |
| $75,000 to $99,999 | 6 (7.4%) | 6 (12.2%) |
| $100,000 to $149,999 | 6 (7.4%) | 1 (2.0%) |
| $150,000 or more | 3 (3.7%) | 0 (0.0%) |
| Total | 81 (100.0%) | 49 (100.0%) |
Monthly Housing Cost Tiers in Annapolis
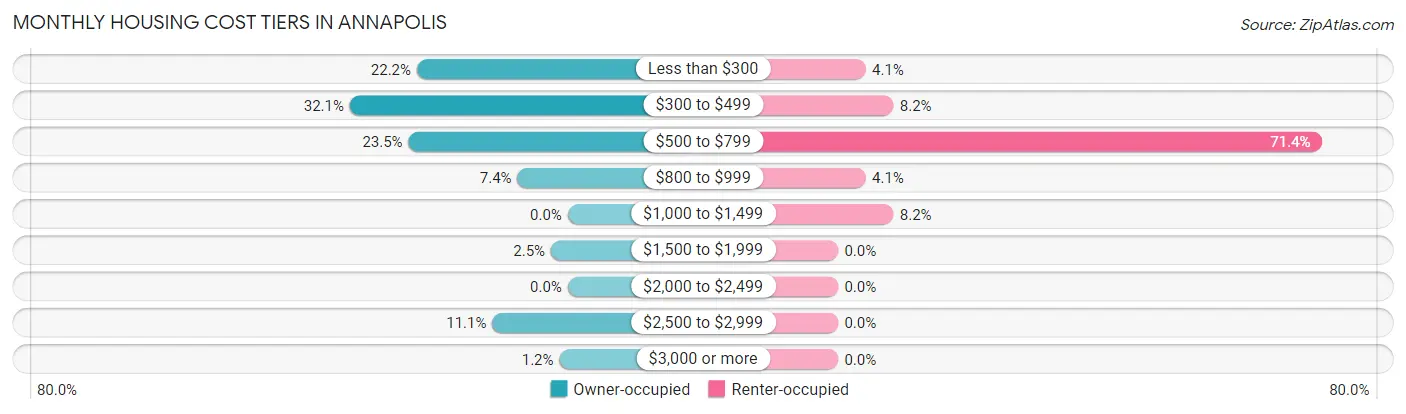
| Monthly Cost | Owner-occupied | Renter-occupied |
| Less than $300 | 18 (22.2%) | 2 (4.1%) |
| $300 to $499 | 26 (32.1%) | 4 (8.2%) |
| $500 to $799 | 19 (23.5%) | 35 (71.4%) |
| $800 to $999 | 6 (7.4%) | 2 (4.1%) |
| $1,000 to $1,499 | 0 (0.0%) | 4 (8.2%) |
| $1,500 to $1,999 | 2 (2.5%) | 0 (0.0%) |
| $2,000 to $2,499 | 0 (0.0%) | 0 (0.0%) |
| $2,500 to $2,999 | 9 (11.1%) | 0 (0.0%) |
| $3,000 or more | 1 (1.2%) | 0 (0.0%) |
| Total | 81 (100.0%) | 49 (100.0%) |
Physical Housing Characteristics in Annapolis
Housing Structures in Annapolis
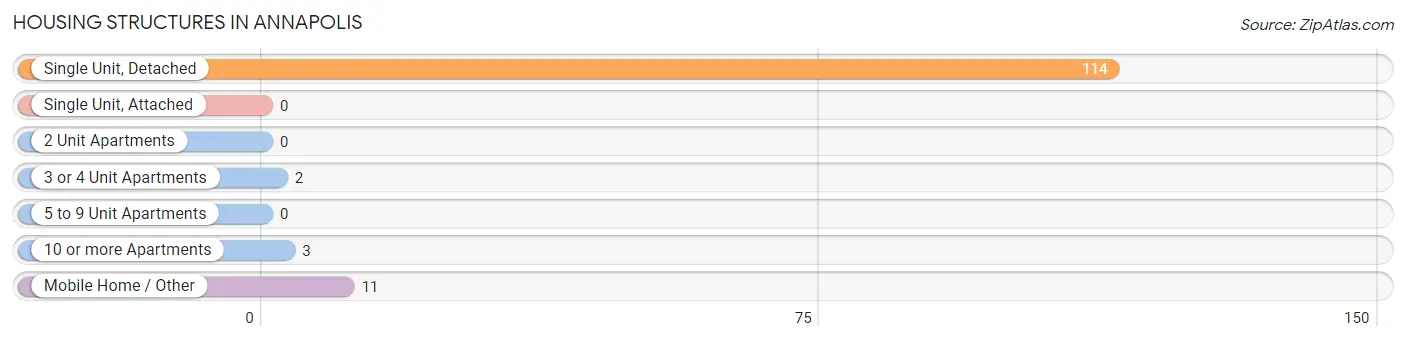
| Structure Type | # Housing Units | % Housing Units |
| Single Unit, Detached | 114 | 87.7% |
| Single Unit, Attached | 0 | 0.0% |
| 2 Unit Apartments | 0 | 0.0% |
| 3 or 4 Unit Apartments | 2 | 1.5% |
| 5 to 9 Unit Apartments | 0 | 0.0% |
| 10 or more Apartments | 3 | 2.3% |
| Mobile Home / Other | 11 | 8.5% |
| Total | 130 | 100.0% |
Housing Structures by Occupancy in Annapolis
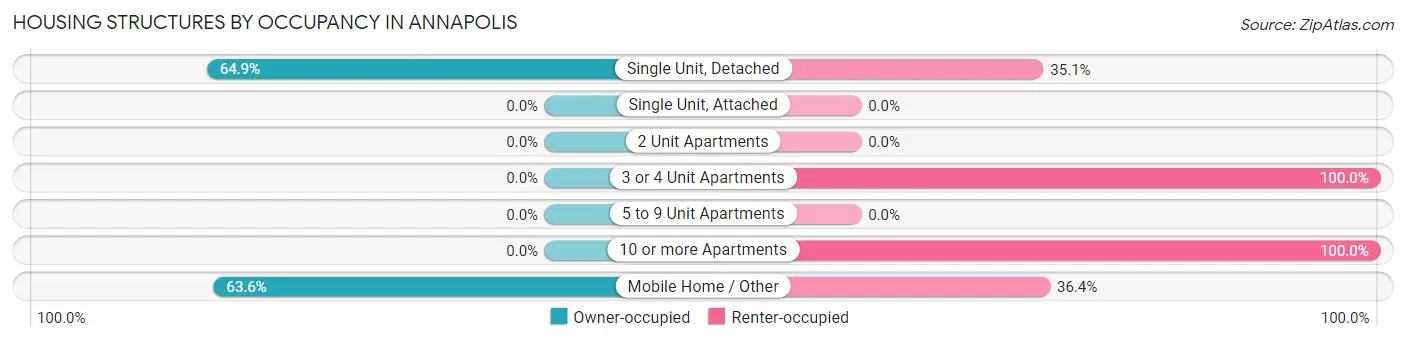
| Structure Type | Owner-occupied | Renter-occupied |
| Single Unit, Detached | 74 (64.9%) | 40 (35.1%) |
| Single Unit, Attached | 0 (0.0%) | 0 (0.0%) |
| 2 Unit Apartments | 0 (0.0%) | 0 (0.0%) |
| 3 or 4 Unit Apartments | 0 (0.0%) | 2 (100.0%) |
| 5 to 9 Unit Apartments | 0 (0.0%) | 0 (0.0%) |
| 10 or more Apartments | 0 (0.0%) | 3 (100.0%) |
| Mobile Home / Other | 7 (63.6%) | 4 (36.4%) |
| Total | 81 (62.3%) | 49 (37.7%) |
Housing Structures by Number of Rooms in Annapolis
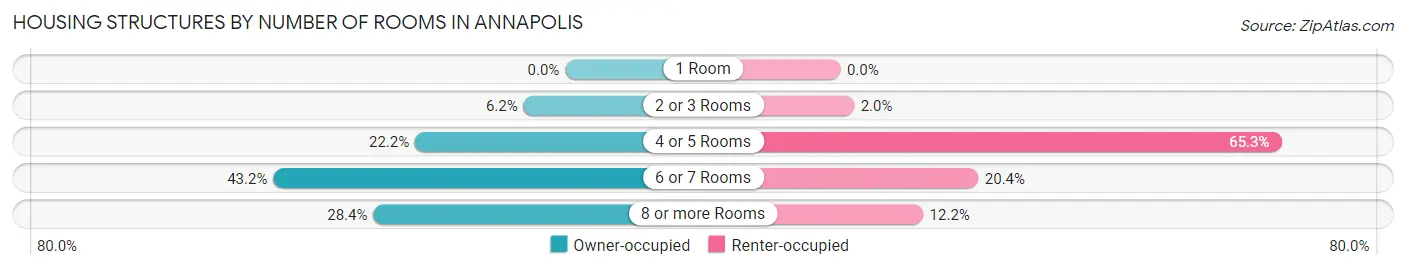
| Number of Rooms | Owner-occupied | Renter-occupied |
| 1 Room | 0 (0.0%) | 0 (0.0%) |
| 2 or 3 Rooms | 5 (6.2%) | 1 (2.0%) |
| 4 or 5 Rooms | 18 (22.2%) | 32 (65.3%) |
| 6 or 7 Rooms | 35 (43.2%) | 10 (20.4%) |
| 8 or more Rooms | 23 (28.4%) | 6 (12.2%) |
| Total | 81 (100.0%) | 49 (100.0%) |
Housing Structure by Heating Type in Annapolis
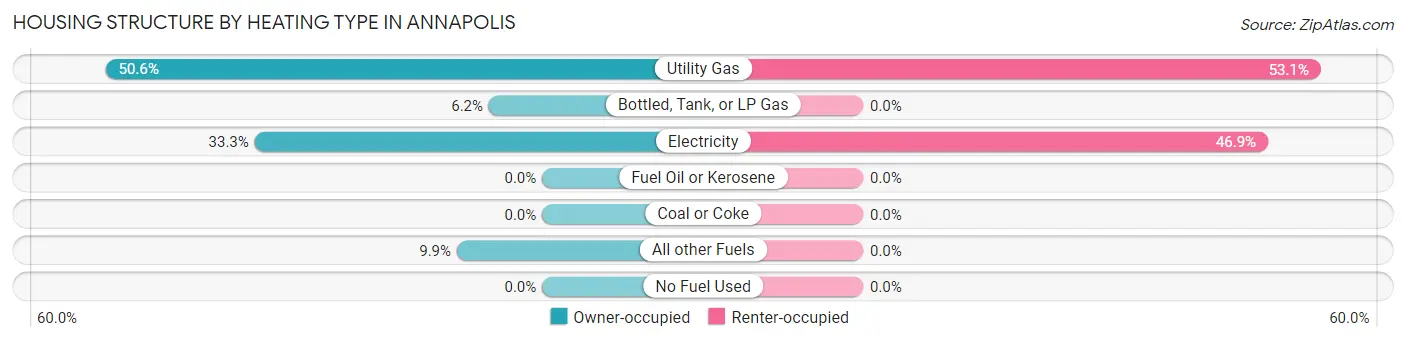
| Heating Type | Owner-occupied | Renter-occupied |
| Utility Gas | 41 (50.6%) | 26 (53.1%) |
| Bottled, Tank, or LP Gas | 5 (6.2%) | 0 (0.0%) |
| Electricity | 27 (33.3%) | 23 (46.9%) |
| Fuel Oil or Kerosene | 0 (0.0%) | 0 (0.0%) |
| Coal or Coke | 0 (0.0%) | 0 (0.0%) |
| All other Fuels | 8 (9.9%) | 0 (0.0%) |
| No Fuel Used | 0 (0.0%) | 0 (0.0%) |
| Total | 81 (100.0%) | 49 (100.0%) |
Household Vehicle Usage in Annapolis
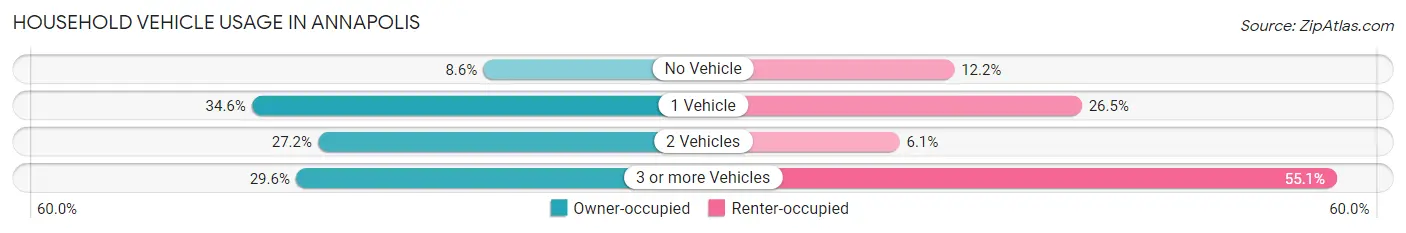
| Vehicles per Household | Owner-occupied | Renter-occupied |
| No Vehicle | 7 (8.6%) | 6 (12.2%) |
| 1 Vehicle | 28 (34.6%) | 13 (26.5%) |
| 2 Vehicles | 22 (27.2%) | 3 (6.1%) |
| 3 or more Vehicles | 24 (29.6%) | 27 (55.1%) |
| Total | 81 (100.0%) | 49 (100.0%) |
Real Estate & Mortgages in Annapolis
Real Estate and Mortgage Overview in Annapolis
| Characteristic | Without Mortgage | With Mortgage |
| Housing Units | 45 | 36 |
| Median Property Value | $74,200 | $112,500 |
| Median Household Income | $26,719 | $3 |
| Monthly Housing Costs | $381 | $0 |
| Real Estate Taxes | $805 | $0 |
Property Value by Mortgage Status in Annapolis
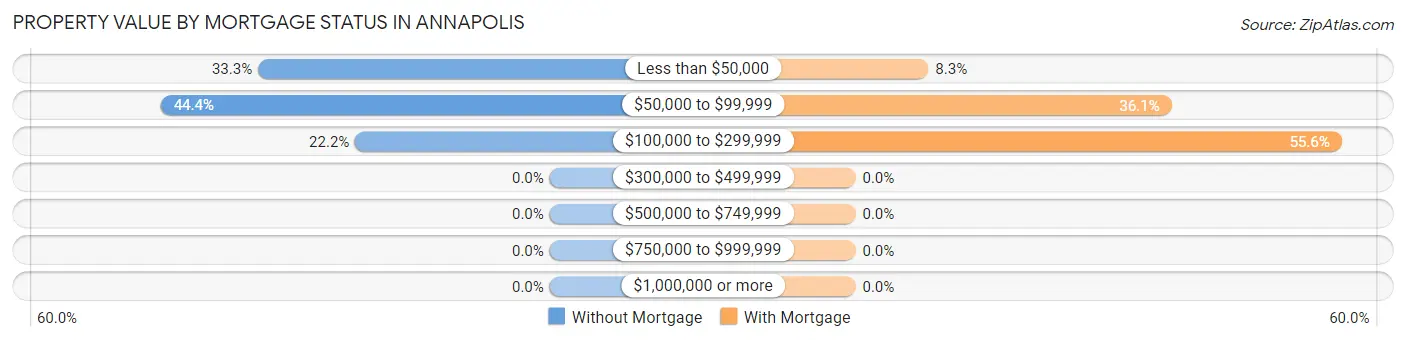
| Property Value | Without Mortgage | With Mortgage |
| Less than $50,000 | 15 (33.3%) | 3 (8.3%) |
| $50,000 to $99,999 | 20 (44.4%) | 13 (36.1%) |
| $100,000 to $299,999 | 10 (22.2%) | 20 (55.6%) |
| $300,000 to $499,999 | 0 (0.0%) | 0 (0.0%) |
| $500,000 to $749,999 | 0 (0.0%) | 0 (0.0%) |
| $750,000 to $999,999 | 0 (0.0%) | 0 (0.0%) |
| $1,000,000 or more | 0 (0.0%) | 0 (0.0%) |
| Total | 45 (100.0%) | 36 (100.0%) |
Household Income by Mortgage Status in Annapolis
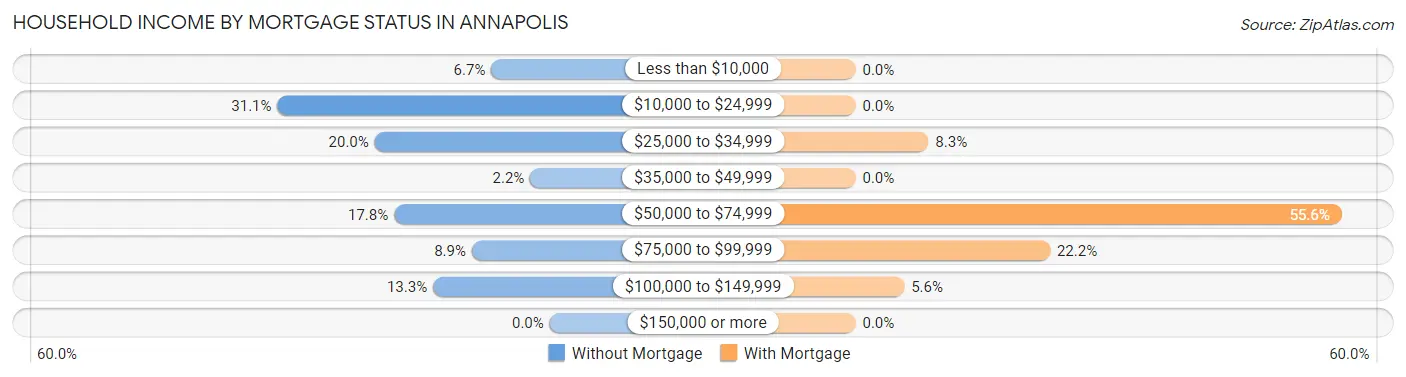
| Household Income | Without Mortgage | With Mortgage |
| Less than $10,000 | 3 (6.7%) | 0 (0.0%) |
| $10,000 to $24,999 | 14 (31.1%) | 0 (0.0%) |
| $25,000 to $34,999 | 9 (20.0%) | 3 (8.3%) |
| $35,000 to $49,999 | 1 (2.2%) | 0 (0.0%) |
| $50,000 to $74,999 | 8 (17.8%) | 20 (55.6%) |
| $75,000 to $99,999 | 4 (8.9%) | 8 (22.2%) |
| $100,000 to $149,999 | 6 (13.3%) | 2 (5.6%) |
| $150,000 or more | 0 (0.0%) | 0 (0.0%) |
| Total | 45 (100.0%) | 36 (100.0%) |
Property Value to Household Income Ratio in Annapolis
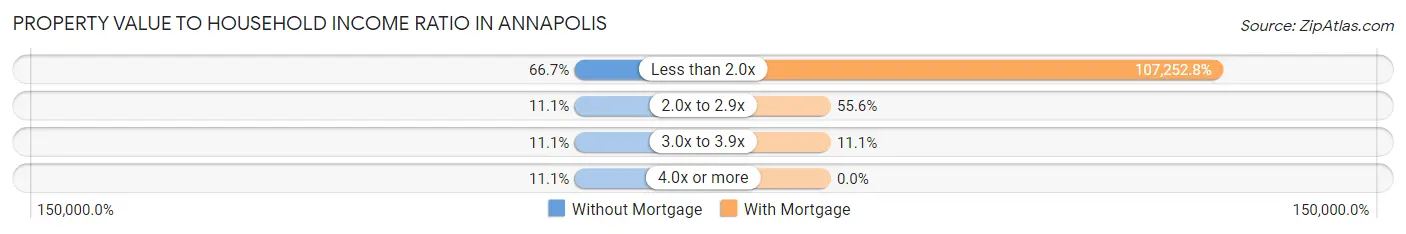
| Value-to-Income Ratio | Without Mortgage | With Mortgage |
| Less than 2.0x | 30 (66.7%) | 38,611 (107,252.8%) |
| 2.0x to 2.9x | 5 (11.1%) | 20 (55.6%) |
| 3.0x to 3.9x | 5 (11.1%) | 4 (11.1%) |
| 4.0x or more | 5 (11.1%) | 0 (0.0%) |
| Total | 45 (100.0%) | 36 (100.0%) |
Real Estate Taxes by Mortgage Status in Annapolis
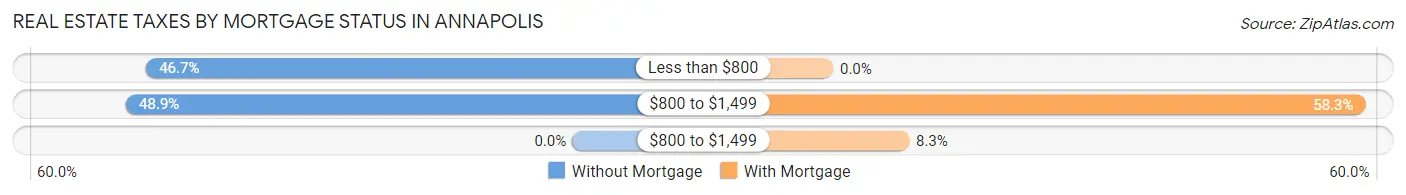
| Property Taxes | Without Mortgage | With Mortgage |
| Less than $800 | 21 (46.7%) | 0 (0.0%) |
| $800 to $1,499 | 22 (48.9%) | 21 (58.3%) |
| $800 to $1,499 | 0 (0.0%) | 3 (8.3%) |
| Total | 45 (100.0%) | 36 (100.0%) |
Health & Disability in Annapolis
Health Insurance Coverage by Age in Annapolis
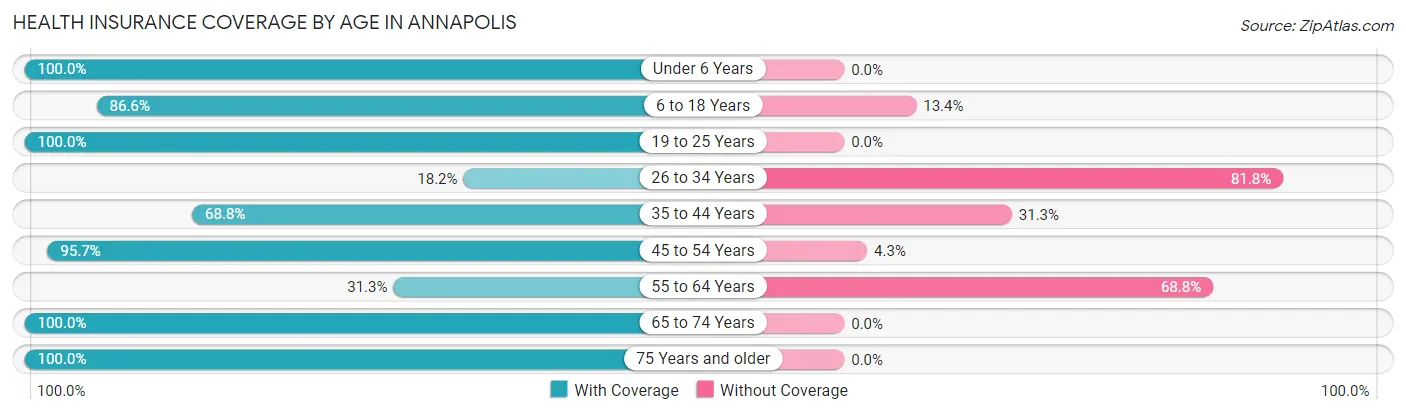
| Age Bracket | With Coverage | Without Coverage |
| Under 6 Years | 10 (100.0%) | 0 (0.0%) |
| 6 to 18 Years | 116 (86.6%) | 18 (13.4%) |
| 19 to 25 Years | 16 (100.0%) | 0 (0.0%) |
| 26 to 34 Years | 12 (18.2%) | 54 (81.8%) |
| 35 to 44 Years | 22 (68.8%) | 10 (31.2%) |
| 45 to 54 Years | 45 (95.7%) | 2 (4.3%) |
| 55 to 64 Years | 25 (31.2%) | 55 (68.8%) |
| 65 to 74 Years | 23 (100.0%) | 0 (0.0%) |
| 75 Years and older | 14 (100.0%) | 0 (0.0%) |
| Total | 283 (67.1%) | 139 (32.9%) |
Health Insurance Coverage by Citizenship Status in Annapolis
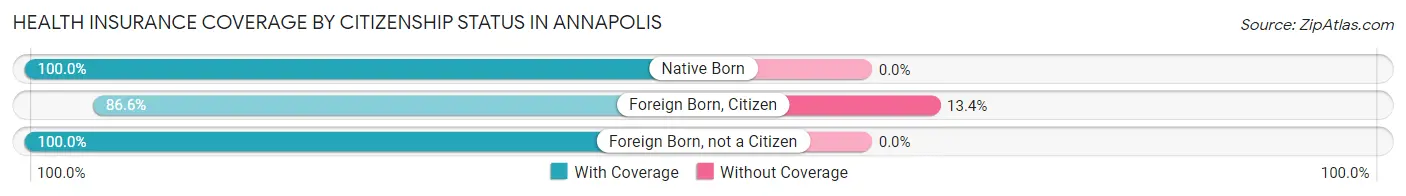
| Citizenship Status | With Coverage | Without Coverage |
| Native Born | 10 (100.0%) | 0 (0.0%) |
| Foreign Born, Citizen | 116 (86.6%) | 18 (13.4%) |
| Foreign Born, not a Citizen | 16 (100.0%) | 0 (0.0%) |
Health Insurance Coverage by Household Income in Annapolis
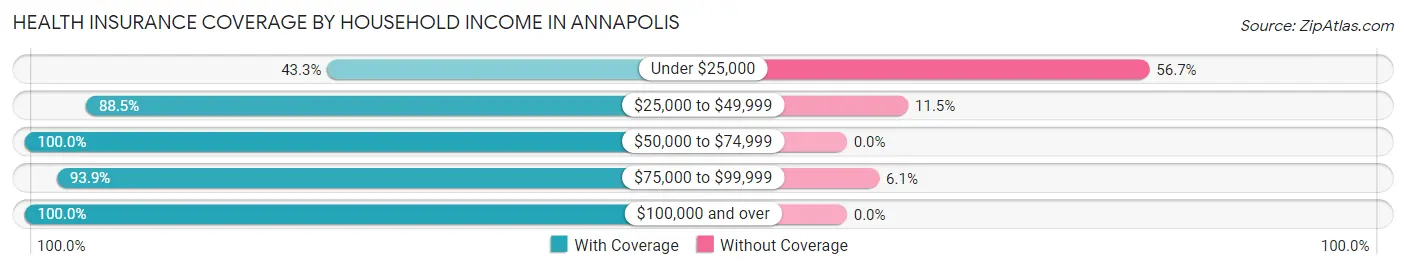
| Household Income | With Coverage | Without Coverage |
| Under $25,000 | 97 (43.3%) | 127 (56.7%) |
| $25,000 to $49,999 | 77 (88.5%) | 10 (11.5%) |
| $50,000 to $74,999 | 30 (100.0%) | 0 (0.0%) |
| $75,000 to $99,999 | 31 (93.9%) | 2 (6.1%) |
| $100,000 and over | 48 (100.0%) | 0 (0.0%) |
Public vs Private Health Insurance Coverage by Age in Annapolis
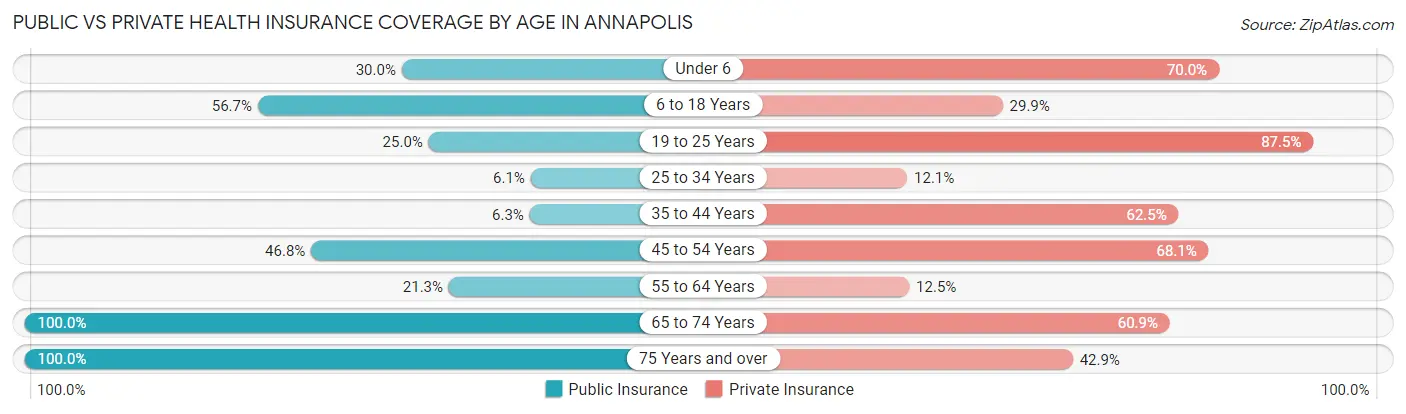
| Age Bracket | Public Insurance | Private Insurance |
| Under 6 | 3 (30.0%) | 7 (70.0%) |
| 6 to 18 Years | 76 (56.7%) | 40 (29.8%) |
| 19 to 25 Years | 4 (25.0%) | 14 (87.5%) |
| 25 to 34 Years | 4 (6.1%) | 8 (12.1%) |
| 35 to 44 Years | 2 (6.2%) | 20 (62.5%) |
| 45 to 54 Years | 22 (46.8%) | 32 (68.1%) |
| 55 to 64 Years | 17 (21.2%) | 10 (12.5%) |
| 65 to 74 Years | 23 (100.0%) | 14 (60.9%) |
| 75 Years and over | 14 (100.0%) | 6 (42.9%) |
| Total | 165 (39.1%) | 151 (35.8%) |
Disability Status by Sex by Age in Annapolis
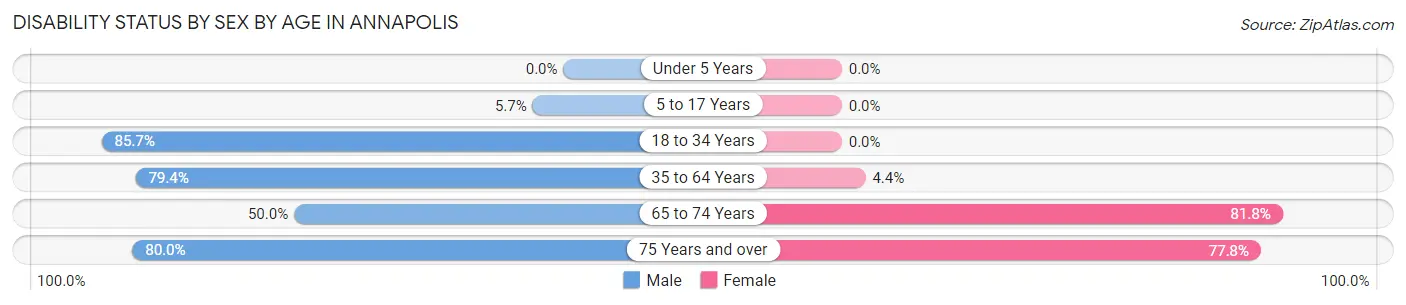
| Age Bracket | Male | Female |
| Under 5 Years | 0 (0.0%) | 0 (0.0%) |
| 5 to 17 Years | 4 (5.7%) | 0 (0.0%) |
| 18 to 34 Years | 54 (85.7%) | 0 (0.0%) |
| 35 to 64 Years | 54 (79.4%) | 4 (4.4%) |
| 65 to 74 Years | 6 (50.0%) | 9 (81.8%) |
| 75 Years and over | 4 (80.0%) | 7 (77.8%) |
Disability Class by Sex by Age in Annapolis
Disability Class: Hearing Difficulty
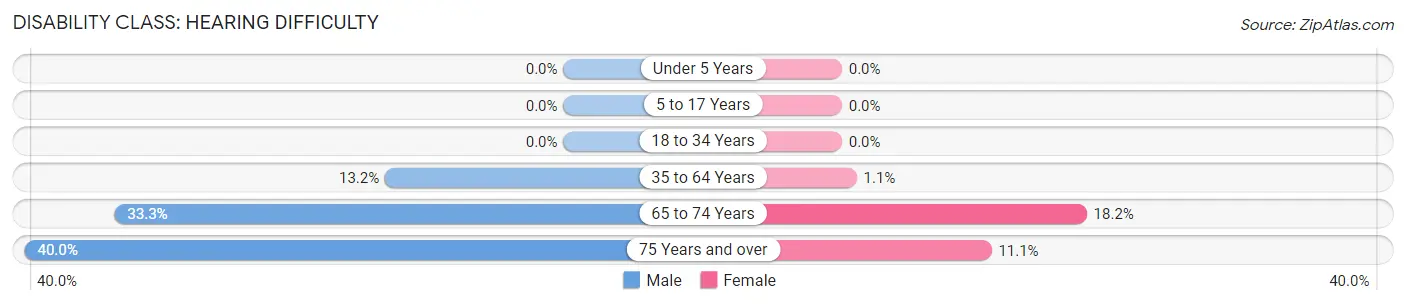
| Age Bracket | Male | Female |
| Under 5 Years | 0 (0.0%) | 0 (0.0%) |
| 5 to 17 Years | 0 (0.0%) | 0 (0.0%) |
| 18 to 34 Years | 0 (0.0%) | 0 (0.0%) |
| 35 to 64 Years | 9 (13.2%) | 1 (1.1%) |
| 65 to 74 Years | 4 (33.3%) | 2 (18.2%) |
| 75 Years and over | 2 (40.0%) | 1 (11.1%) |
Disability Class: Vision Difficulty
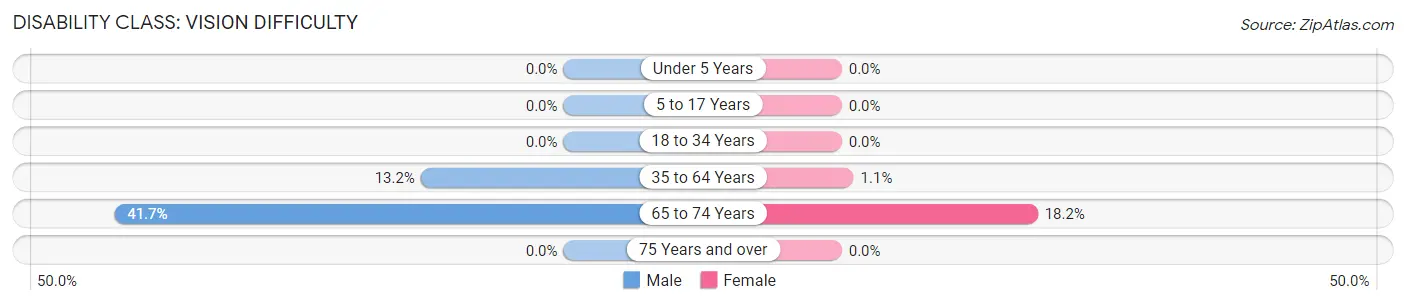
| Age Bracket | Male | Female |
| Under 5 Years | 0 (0.0%) | 0 (0.0%) |
| 5 to 17 Years | 0 (0.0%) | 0 (0.0%) |
| 18 to 34 Years | 0 (0.0%) | 0 (0.0%) |
| 35 to 64 Years | 9 (13.2%) | 1 (1.1%) |
| 65 to 74 Years | 5 (41.7%) | 2 (18.2%) |
| 75 Years and over | 0 (0.0%) | 0 (0.0%) |
Disability Class: Cognitive Difficulty
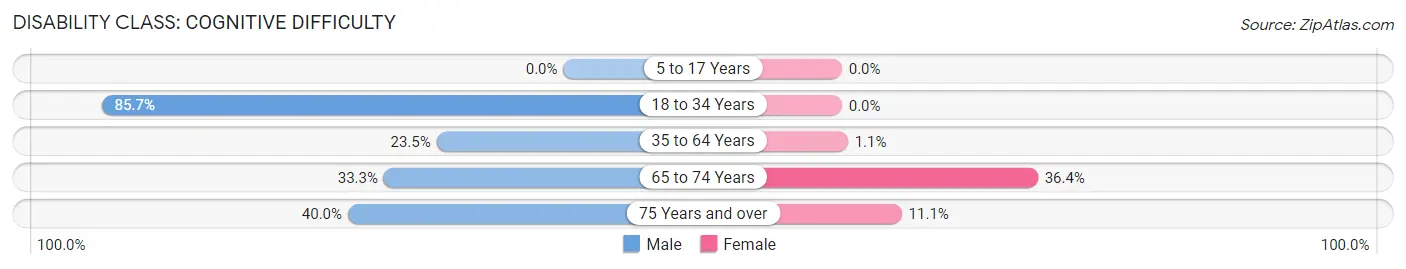
| Age Bracket | Male | Female |
| 5 to 17 Years | 0 (0.0%) | 0 (0.0%) |
| 18 to 34 Years | 54 (85.7%) | 0 (0.0%) |
| 35 to 64 Years | 16 (23.5%) | 1 (1.1%) |
| 65 to 74 Years | 4 (33.3%) | 4 (36.4%) |
| 75 Years and over | 2 (40.0%) | 1 (11.1%) |
Disability Class: Ambulatory Difficulty
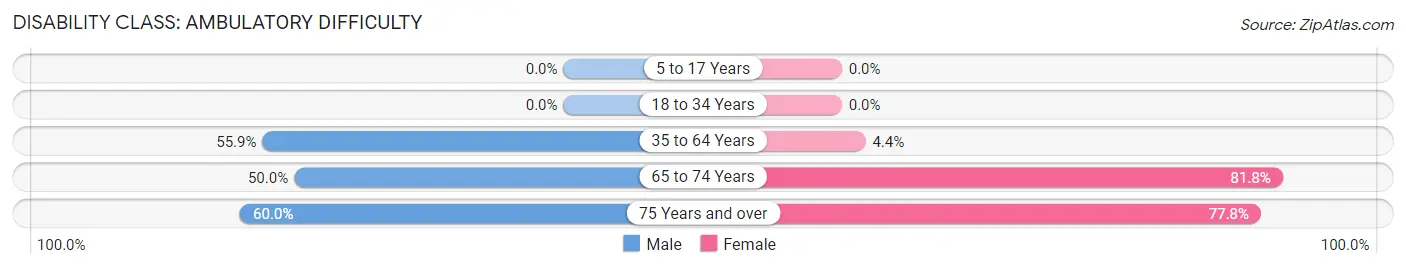
| Age Bracket | Male | Female |
| 5 to 17 Years | 0 (0.0%) | 0 (0.0%) |
| 18 to 34 Years | 0 (0.0%) | 0 (0.0%) |
| 35 to 64 Years | 38 (55.9%) | 4 (4.4%) |
| 65 to 74 Years | 6 (50.0%) | 9 (81.8%) |
| 75 Years and over | 3 (60.0%) | 7 (77.8%) |
Disability Class: Self-Care Difficulty
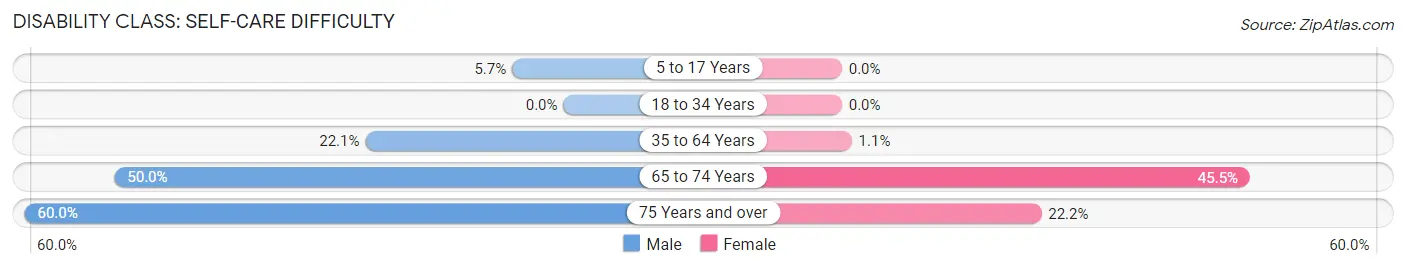
| Age Bracket | Male | Female |
| 5 to 17 Years | 4 (5.7%) | 0 (0.0%) |
| 18 to 34 Years | 0 (0.0%) | 0 (0.0%) |
| 35 to 64 Years | 15 (22.1%) | 1 (1.1%) |
| 65 to 74 Years | 6 (50.0%) | 5 (45.5%) |
| 75 Years and over | 3 (60.0%) | 2 (22.2%) |
Technology Access in Annapolis
Computing Device Access in Annapolis
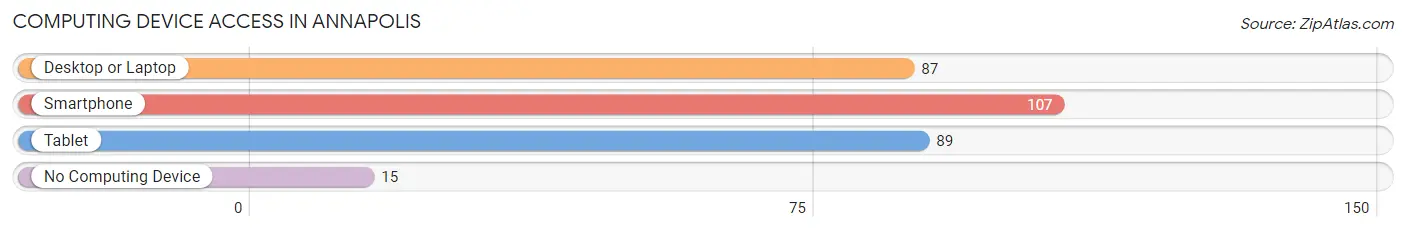
| Device Type | # Households | % Households |
| Desktop or Laptop | 87 | 66.9% |
| Smartphone | 107 | 82.3% |
| Tablet | 89 | 68.5% |
| No Computing Device | 15 | 11.5% |
| Total | 130 | 100.0% |
Internet Access in Annapolis
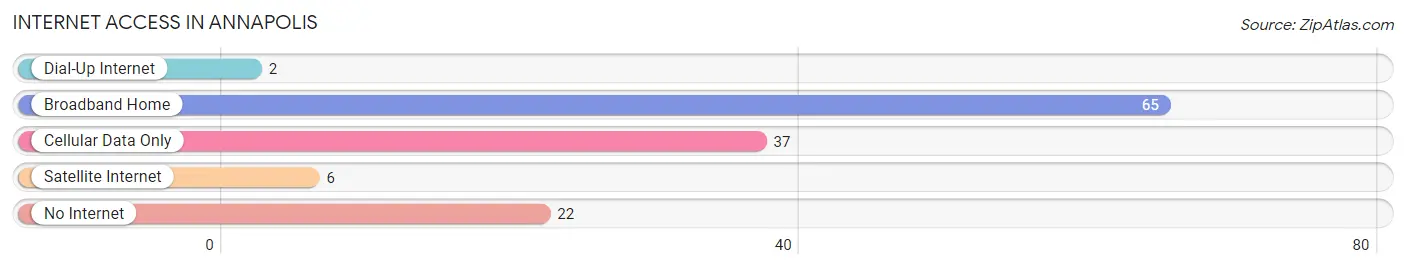
| Internet Type | # Households | % Households |
| Dial-Up Internet | 2 | 1.5% |
| Broadband Home | 65 | 50.0% |
| Cellular Data Only | 37 | 28.5% |
| Satellite Internet | 6 | 4.6% |
| No Internet | 22 | 16.9% |
| Total | 130 | 100.0% |
Annapolis Summary
Annapolis, Missouri is a small town located in Iron County, Missouri. It is situated in the southeastern corner of the state, near the border of Arkansas. The town was founded in 1871 and has a population of approximately 1,000 people.
History
Annapolis was founded in 1871 by a group of settlers from the nearby town of Pilot Knob. The town was named after Annapolis, Maryland, which was the capital of the United States at the time. The town was originally a farming community, but it soon became a mining town when iron ore was discovered in the area. The ore was used to make steel and other products. The town grew rapidly and by the early 1900s, it had a population of over 1,000 people.
The town was also home to a number of businesses, including a hotel, a bank, a general store, and a blacksmith shop. The town also had a school, a post office, and a newspaper.
In the early 1900s, the town was hit hard by the Great Depression. Many of the businesses closed and the population declined. The town was also affected by the Dust Bowl, which caused many of the farmers to leave the area.
Geography
Annapolis is located in the southeastern corner of Iron County, Missouri. It is situated near the border of Arkansas and is about 30 miles from the nearest major city, Poplar Bluff. The town is located in a rural area and is surrounded by rolling hills and forests. The town is situated on the banks of the Black River, which is a tributary of the White River.
Economy
The economy of Annapolis is largely based on agriculture. The town is home to several farms, which produce a variety of crops, including corn, soybeans, and wheat. The town also has a number of small businesses, including a grocery store, a hardware store, and a restaurant.
Demographics
As of the 2010 census, the population of Annapolis was 1,000 people. The town is predominantly white, with about 95% of the population being white. The median household income is $35,000 and the median home value is $90,000. The town has a low unemployment rate of 4.2%.
Conclusion
Annapolis, Missouri is a small town located in Iron County, Missouri. It was founded in 1871 and has a population of approximately 1,000 people. The town is largely based on agriculture and has a number of small businesses. The town is predominantly white, with a median household income of $35,000 and a median home value of $90,000. The town has a low unemployment rate of 4.2%.
Common Questions
What is Per Capita Income in Annapolis?
Per Capita income in Annapolis is $15,085.
What is the Median Family Income in Annapolis?
Median Family Income in Annapolis is $37,875.
What is the Median Household income in Annapolis?
Median Household Income in Annapolis is $35,625.
What is Inequality or Gini Index in Annapolis?
Inequality or Gini Index in Annapolis is 0.42.
What is the Total Population of Annapolis?
Total Population of Annapolis is 422.
What is the Total Male Population of Annapolis?
Total Male Population of Annapolis is 227.
What is the Total Female Population of Annapolis?
Total Female Population of Annapolis is 195.
What is the Ratio of Males per 100 Females in Annapolis?
There are 116.41 Males per 100 Females in Annapolis.
What is the Ratio of Females per 100 Males in Annapolis?
There are 85.90 Females per 100 Males in Annapolis.
What is the Median Population Age in Annapolis?
Median Population Age in Annapolis is 32.7 Years.
What is the Average Family Size in Annapolis
Average Family Size in Annapolis is 3.9 People.
What is the Average Household Size in Annapolis
Average Household Size in Annapolis is 3.2 People.
How Large is the Labor Force in Annapolis?
There are 148 People in the Labor Forcein in Annapolis.
What is the Percentage of People in the Labor Force in Annapolis?
45.8% of People are in the Labor Force in Annapolis.
What is the Unemployment Rate in Annapolis?
Unemployment Rate in Annapolis is 23.0%.