Peaceful Village, MO Map & Demographics
Peaceful Village Map
Peaceful Village Overview
$19,791
PER CAPITA INCOME
$56,397
AVG FAMILY INCOME
$56,324
AVG HOUSEHOLD INCOME
0.27
INEQUALITY / GINI INDEX
127
TOTAL POPULATION
40
MALE POPULATION
87
FEMALE POPULATION
45.98
MALES / 100 FEMALES
217.50
FEMALES / 100 MALES
35.6
MEDIAN AGE
3.0
AVG FAMILY SIZE
3.4
AVG HOUSEHOLD SIZE
51
LABOR FORCE [ PEOPLE ]
47.2%
PERCENT IN LABOR FORCE
5.9%
UNEMPLOYMENT RATE
Income in Peaceful Village
Income Overview in Peaceful Village
Per Capita Income in Peaceful Village is $19,791, while median incomes of families and households are $56,397 and $56,324 respectively.
| Characteristic | Number | Measure |
| Per Capita Income | 127 | $19,791 |
| Median Family Income | 29 | $56,397 |
| Mean Family Income | 29 | $59,634 |
| Median Household Income | 36 | $56,324 |
| Mean Household Income | 36 | $64,233 |
| Income Deficit | 29 | $0 |
| Wage / Income Gap (%) | 127 | 0.00% |
| Wage / Income Gap ($) | 127 | 100.00¢ per $1 |
| Gini / Inequality Index | 127 | 0.27 |
Earnings by Sex in Peaceful Village
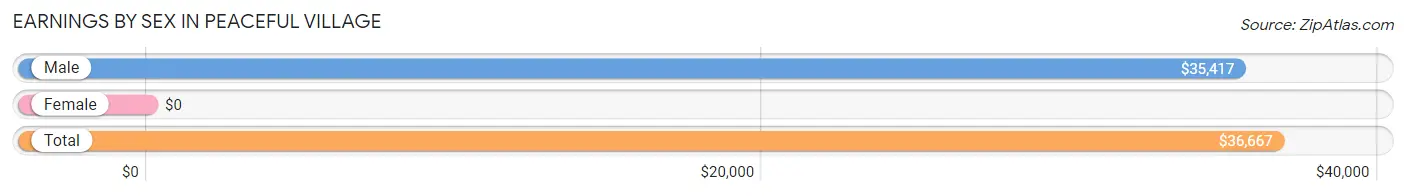
| Sex | Number | Average Earnings |
| Male | 12 (21.4%) | $35,417 |
| Female | 44 (78.6%) | $0 |
| Total | 56 (100.0%) | $36,667 |
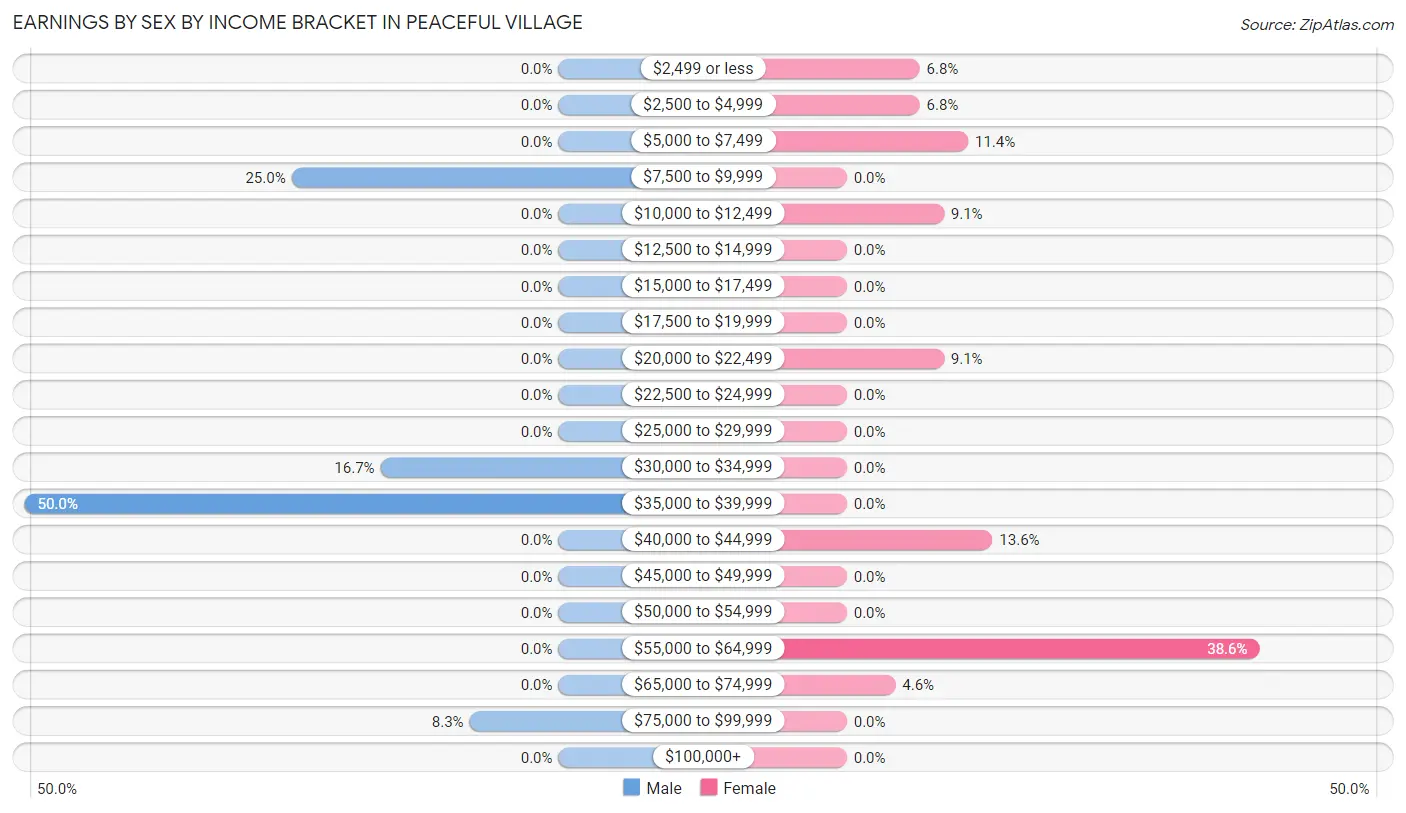
Earnings by Sex by Income Bracket in Peaceful Village
The most common earnings brackets in Peaceful Village are $35,000 to $39,999 for men (6 | 50.0%) and $55,000 to $64,999 for women (17 | 38.6%).
| Income | Male | Female |
| $2,499 or less | 0 (0.0%) | 3 (6.8%) |
| $2,500 to $4,999 | 0 (0.0%) | 3 (6.8%) |
| $5,000 to $7,499 | 0 (0.0%) | 5 (11.4%) |
| $7,500 to $9,999 | 3 (25.0%) | 0 (0.0%) |
| $10,000 to $12,499 | 0 (0.0%) | 4 (9.1%) |
| $12,500 to $14,999 | 0 (0.0%) | 0 (0.0%) |
| $15,000 to $17,499 | 0 (0.0%) | 0 (0.0%) |
| $17,500 to $19,999 | 0 (0.0%) | 0 (0.0%) |
| $20,000 to $22,499 | 0 (0.0%) | 4 (9.1%) |
| $22,500 to $24,999 | 0 (0.0%) | 0 (0.0%) |
| $25,000 to $29,999 | 0 (0.0%) | 0 (0.0%) |
| $30,000 to $34,999 | 2 (16.7%) | 0 (0.0%) |
| $35,000 to $39,999 | 6 (50.0%) | 0 (0.0%) |
| $40,000 to $44,999 | 0 (0.0%) | 6 (13.6%) |
| $45,000 to $49,999 | 0 (0.0%) | 0 (0.0%) |
| $50,000 to $54,999 | 0 (0.0%) | 0 (0.0%) |
| $55,000 to $64,999 | 0 (0.0%) | 17 (38.6%) |
| $65,000 to $74,999 | 0 (0.0%) | 2 (4.5%) |
| $75,000 to $99,999 | 1 (8.3%) | 0 (0.0%) |
| $100,000+ | 0 (0.0%) | 0 (0.0%) |
| Total | 12 (100.0%) | 44 (100.0%) |
Earnings by Sex by Educational Attainment in Peaceful Village
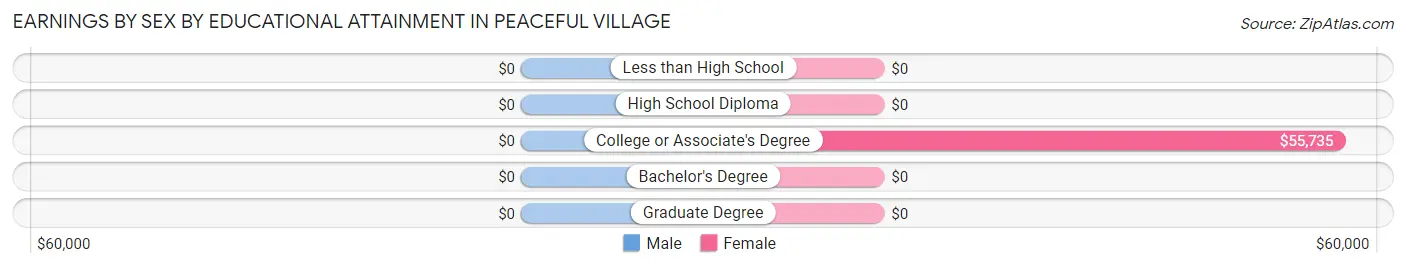
| Educational Attainment | Male Income | Female Income |
| Less than High School | - | - |
| High School Diploma | - | - |
| College or Associate's Degree | - | - |
| Bachelor's Degree | - | - |
| Graduate Degree | - | - |
| Total | $36,042 | $43,750 |
Family Income in Peaceful Village
Family Income Brackets in Peaceful Village
According to the Peaceful Village family income data, there are 17 families falling into the $50,000 to $74,999 income range, which is the most common income bracket and makes up 58.6% of all families.
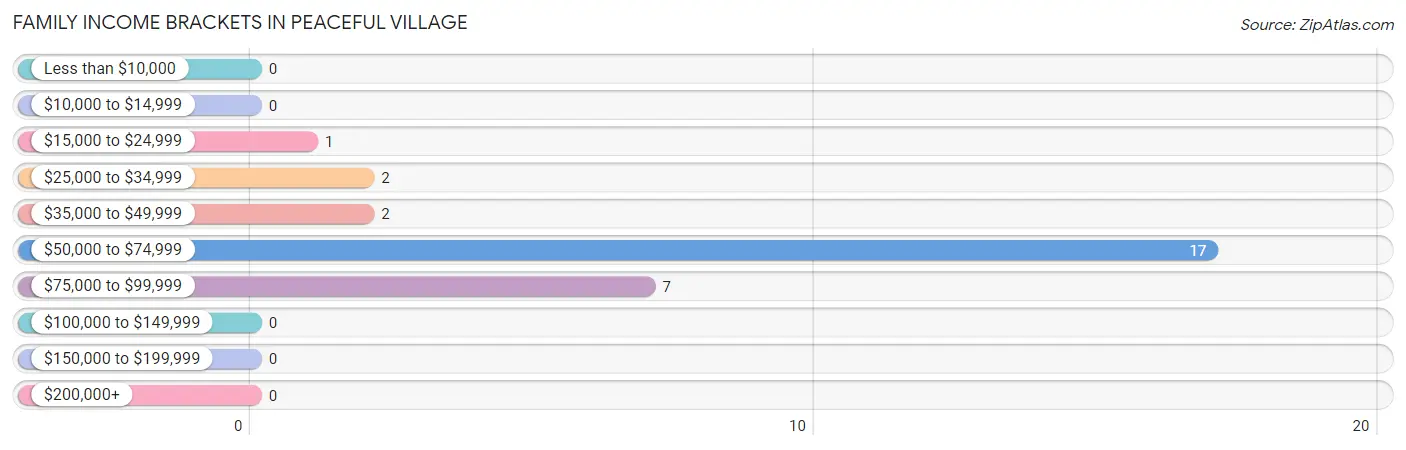
| Income Bracket | # Families | % Families |
| Less than $10,000 | 0 | 0.0% |
| $10,000 to $14,999 | 0 | 0.0% |
| $15,000 to $24,999 | 1 | 3.4% |
| $25,000 to $34,999 | 2 | 6.9% |
| $35,000 to $49,999 | 2 | 6.9% |
| $50,000 to $74,999 | 17 | 58.6% |
| $75,000 to $99,999 | 7 | 24.1% |
| $100,000 to $149,999 | 0 | 0.0% |
| $150,000 to $199,999 | 0 | 0.0% |
| $200,000+ | 0 | 0.0% |
Family Income by Famaliy Size in Peaceful Village
2-person families (24 | 82.8%) account for the highest median family income in Peaceful Village with $56,029 per family, while 2-person families (24 | 82.8%) have the highest median income of $28,014 per family member.
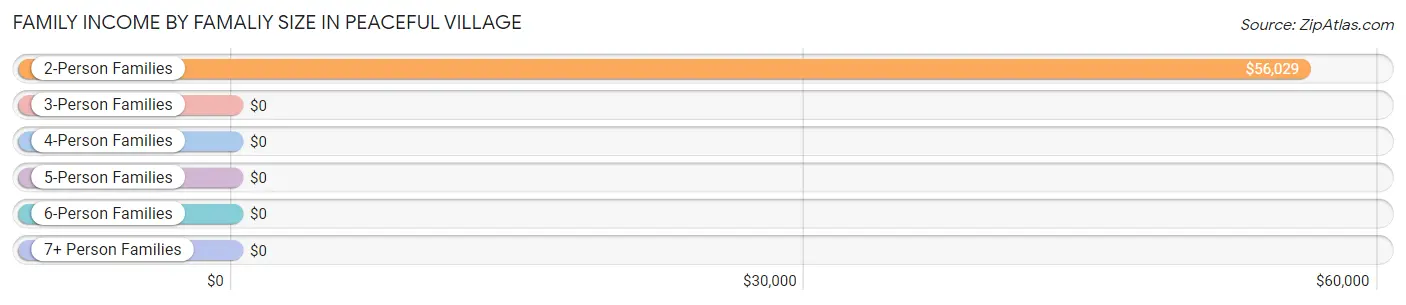
| Income Bracket | # Families | Median Income |
| 2-Person Families | 24 (82.8%) | $56,029 |
| 3-Person Families | 0 (0.0%) | $0 |
| 4-Person Families | 0 (0.0%) | $0 |
| 5-Person Families | 0 (0.0%) | $0 |
| 6-Person Families | 1 (3.5%) | $0 |
| 7+ Person Families | 4 (13.8%) | $0 |
| Total | 29 (100.0%) | $56,397 |
Family Income by Number of Earners in Peaceful Village
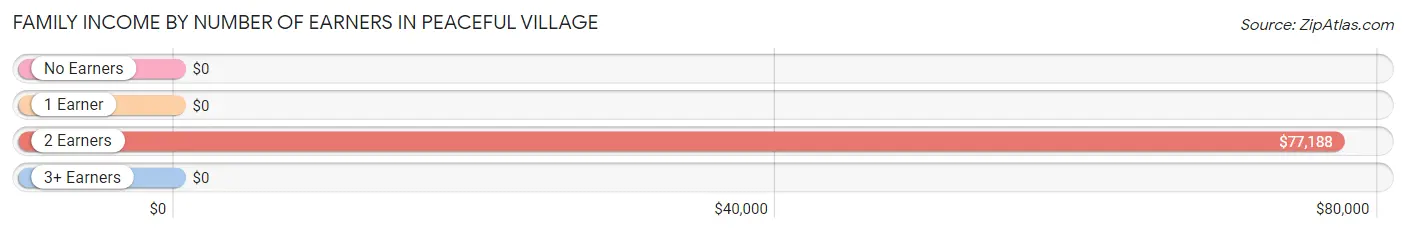
| Number of Earners | # Families | Median Income |
| No Earners | 3 (10.3%) | $0 |
| 1 Earner | 19 (65.5%) | $0 |
| 2 Earners | 7 (24.1%) | $77,188 |
| 3+ Earners | 0 (0.0%) | $0 |
| Total | 29 (100.0%) | $56,397 |
Household Income in Peaceful Village
Household Income Brackets in Peaceful Village
With 17 households falling in the category, the $50,000 to $74,999 income range is the most frequent in Peaceful Village, accounting for 47.2% of all households.
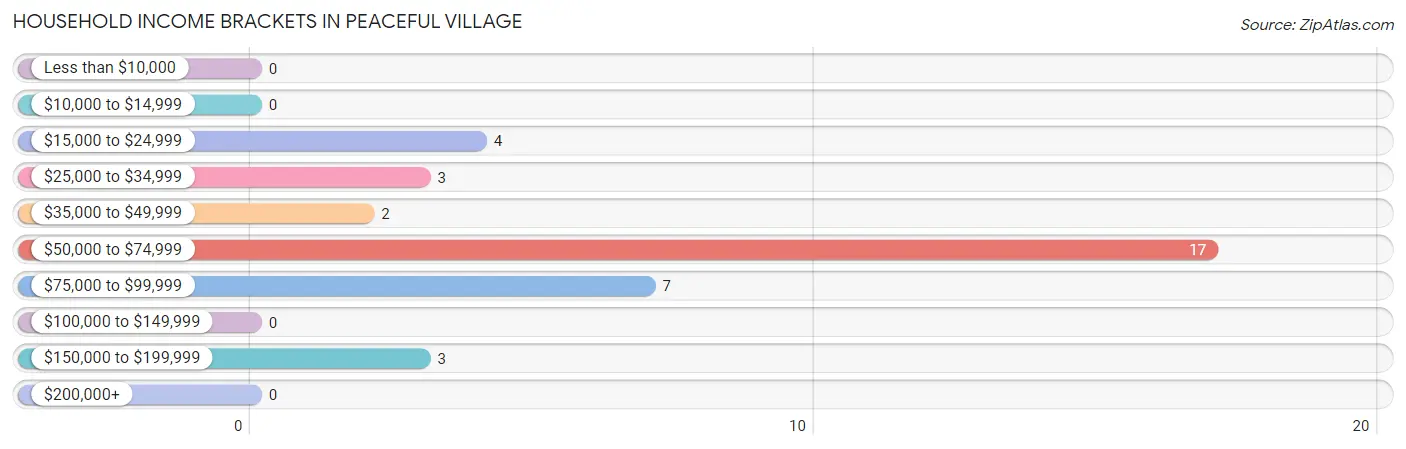
| Income Bracket | # Households | % Households |
| Less than $10,000 | 0 | 0.0% |
| $10,000 to $14,999 | 0 | 0.0% |
| $15,000 to $24,999 | 4 | 11.1% |
| $25,000 to $34,999 | 3 | 8.3% |
| $35,000 to $49,999 | 2 | 5.6% |
| $50,000 to $74,999 | 17 | 47.2% |
| $75,000 to $99,999 | 7 | 19.4% |
| $100,000 to $149,999 | 0 | 0.0% |
| $150,000 to $199,999 | 3 | 8.3% |
| $200,000+ | 0 | 0.0% |
Household Income by Householder Age in Peaceful Village
The median household income in Peaceful Village is $56,324, with the highest median household income of $76,563 found in the 25 to 44 years age bracket for the primary householder. A total of 9 households (25.0%) fall into this category.
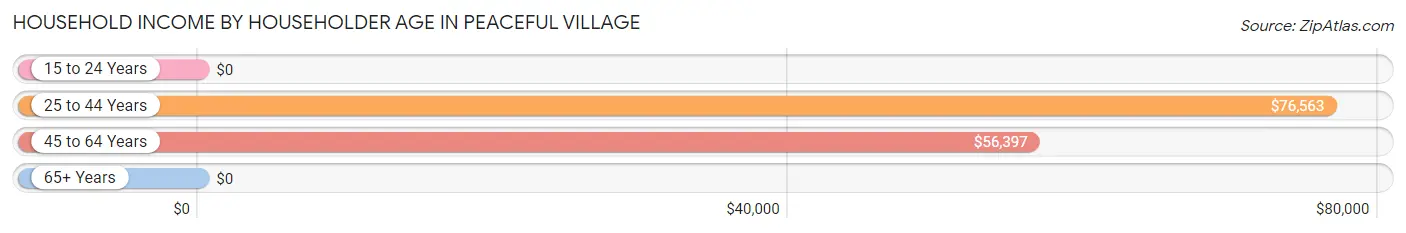
| Income Bracket | # Households | Median Income |
| 15 to 24 Years | 0 (0.0%) | $0 |
| 25 to 44 Years | 9 (25.0%) | $76,563 |
| 45 to 64 Years | 21 (58.3%) | $56,397 |
| 65+ Years | 6 (16.7%) | $0 |
| Total | 36 (100.0%) | $56,324 |
Poverty in Peaceful Village
Income Below Poverty by Sex and Age in Peaceful Village
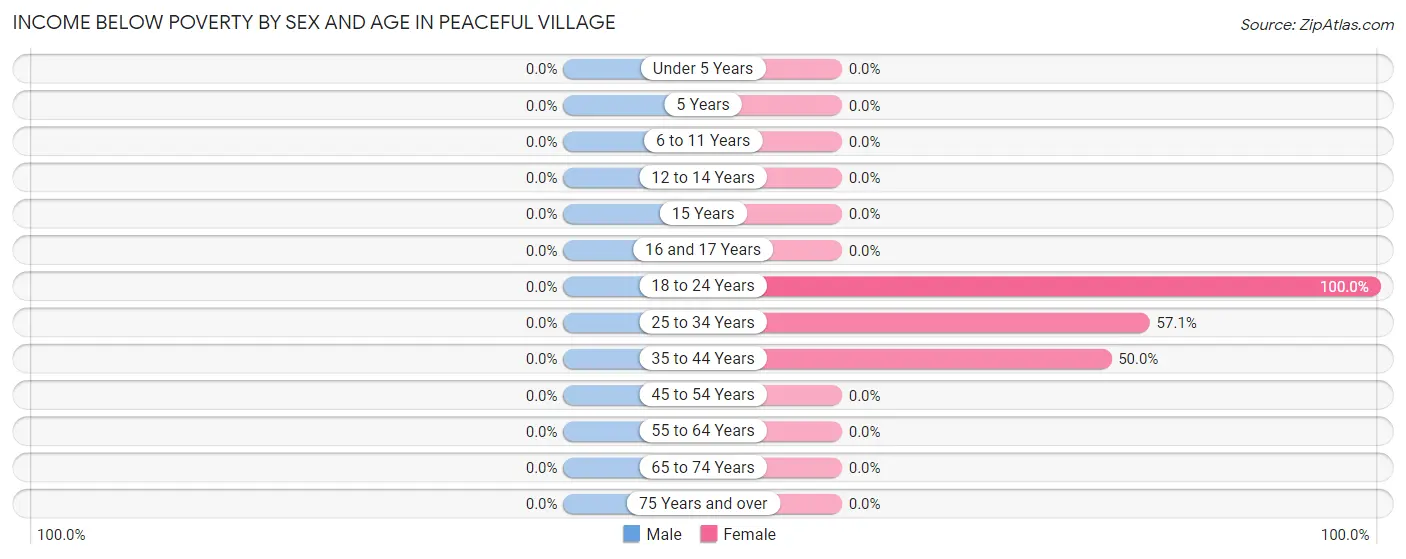
| Age Bracket | Male | Female |
| Under 5 Years | 0 (0.0%) | 0 (0.0%) |
| 5 Years | 0 (0.0%) | 0 (0.0%) |
| 6 to 11 Years | 0 (0.0%) | 0 (0.0%) |
| 12 to 14 Years | 0 (0.0%) | 0 (0.0%) |
| 15 Years | 0 (0.0%) | 0 (0.0%) |
| 16 and 17 Years | 0 (0.0%) | 0 (0.0%) |
| 18 to 24 Years | 0 (0.0%) | 3 (100.0%) |
| 25 to 34 Years | 0 (0.0%) | 8 (57.1%) |
| 35 to 44 Years | 0 (0.0%) | 10 (50.0%) |
| 45 to 54 Years | 0 (0.0%) | 0 (0.0%) |
| 55 to 64 Years | 0 (0.0%) | 0 (0.0%) |
| 65 to 74 Years | 0 (0.0%) | 0 (0.0%) |
| 75 Years and over | 0 (0.0%) | 0 (0.0%) |
| Total | 0 (0.0%) | 21 (24.1%) |
Income Above Poverty by Sex and Age in Peaceful Village
According to the poverty statistics in Peaceful Village, males aged 6 to 11 years and females aged 6 to 11 years are the age groups that are most secure financially, with 100.0% of males and 100.0% of females in these age groups living above the poverty line.
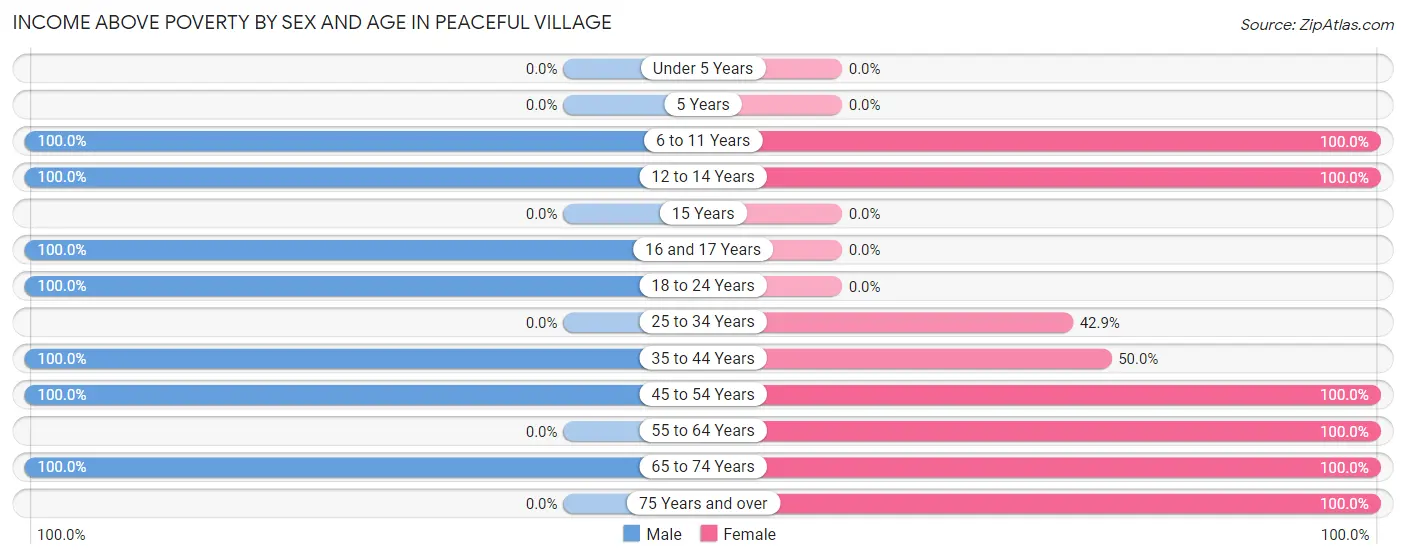
| Age Bracket | Male | Female |
| Under 5 Years | 0 (0.0%) | 0 (0.0%) |
| 5 Years | 0 (0.0%) | 0 (0.0%) |
| 6 to 11 Years | 1 (100.0%) | 5 (100.0%) |
| 12 to 14 Years | 4 (100.0%) | 9 (100.0%) |
| 15 Years | 0 (0.0%) | 0 (0.0%) |
| 16 and 17 Years | 17 (100.0%) | 0 (0.0%) |
| 18 to 24 Years | 5 (100.0%) | 0 (0.0%) |
| 25 to 34 Years | 0 (0.0%) | 6 (42.9%) |
| 35 to 44 Years | 8 (100.0%) | 10 (50.0%) |
| 45 to 54 Years | 1 (100.0%) | 23 (100.0%) |
| 55 to 64 Years | 0 (0.0%) | 8 (100.0%) |
| 65 to 74 Years | 4 (100.0%) | 2 (100.0%) |
| 75 Years and over | 0 (0.0%) | 3 (100.0%) |
| Total | 40 (100.0%) | 66 (75.9%) |
Income Below Poverty Among Married-Couple Families in Peaceful Village
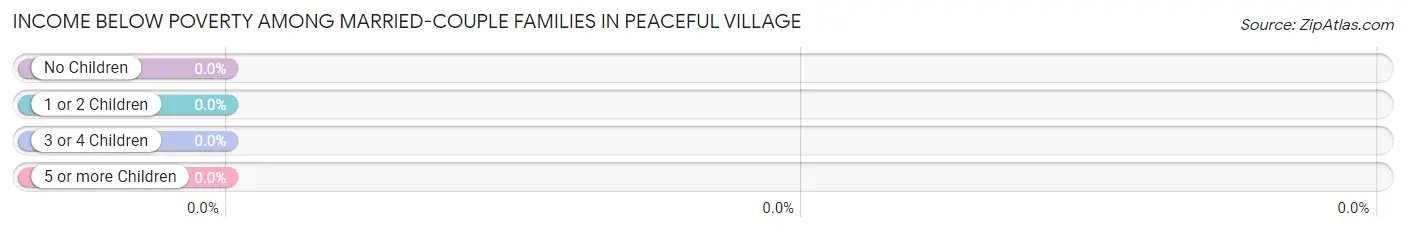
| Children | Above Poverty | Below Poverty |
| No Children | 3 (100.0%) | 0 (0.0%) |
| 1 or 2 Children | 0 (0.0%) | 0 (0.0%) |
| 3 or 4 Children | 5 (100.0%) | 0 (0.0%) |
| 5 or more Children | 0 (0.0%) | 0 (0.0%) |
| Total | 8 (100.0%) | 0 (0.0%) |
Income Below Poverty Among Single-Parent Households in Peaceful Village
| Children | Single Father | Single Mother |
| No Children | 0 (0.0%) | 0 (0.0%) |
| 1 or 2 Children | 0 (0.0%) | 0 (0.0%) |
| 3 or 4 Children | 0 (0.0%) | 0 (0.0%) |
| 5 or more Children | 0 (0.0%) | 0 (0.0%) |
| Total | 0 (0.0%) | 0 (0.0%) |
Income Below Poverty Among Married-Couple vs Single-Parent Households in Peaceful Village
| Children | Married-Couple Families | Single-Parent Households |
| No Children | 0 (0.0%) | 0 (0.0%) |
| 1 or 2 Children | 0 (0.0%) | 0 (0.0%) |
| 3 or 4 Children | 0 (0.0%) | 0 (0.0%) |
| 5 or more Children | 0 (0.0%) | 0 (0.0%) |
| Total | 0 (0.0%) | 0 (0.0%) |
Race in Peaceful Village
The most populous races in Peaceful Village are White / Caucasian (127 | 100.0%), and Hispanic or Latino (14 | 11.0%).
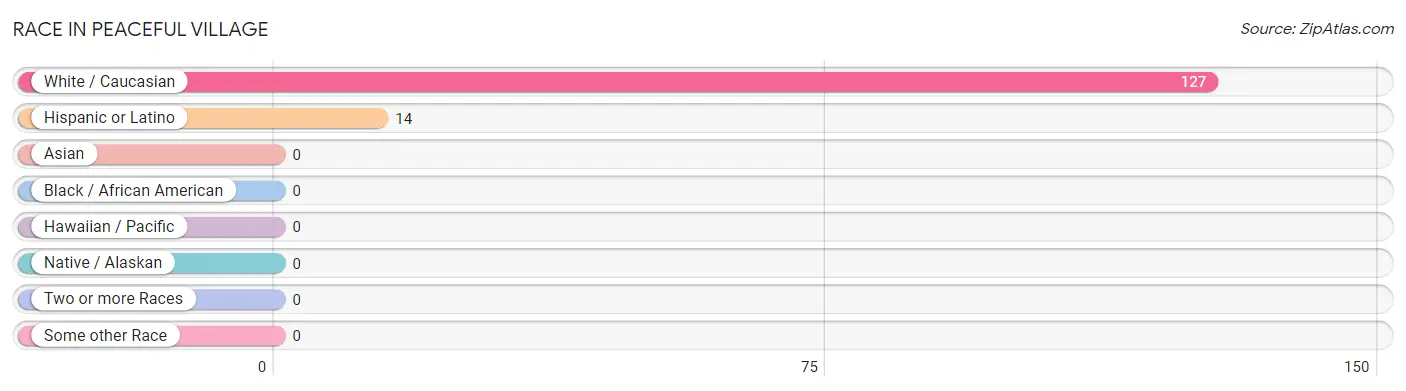
| Race | # Population | % Population |
| Asian | 0 | 0.0% |
| Black / African American | 0 | 0.0% |
| Hawaiian / Pacific | 0 | 0.0% |
| Hispanic or Latino | 14 | 11.0% |
| Native / Alaskan | 0 | 0.0% |
| White / Caucasian | 127 | 100.0% |
| Two or more Races | 0 | 0.0% |
| Some other Race | 0 | 0.0% |
| Total | 127 | 100.0% |
Ancestry in Peaceful Village
The most populous ancestries reported in Peaceful Village are German (52 | 40.9%), French (37 | 29.1%), Mexican (14 | 11.0%), Irish (10 | 7.9%), and American (8 | 6.3%), together accounting for 95.3% of all Peaceful Village residents.
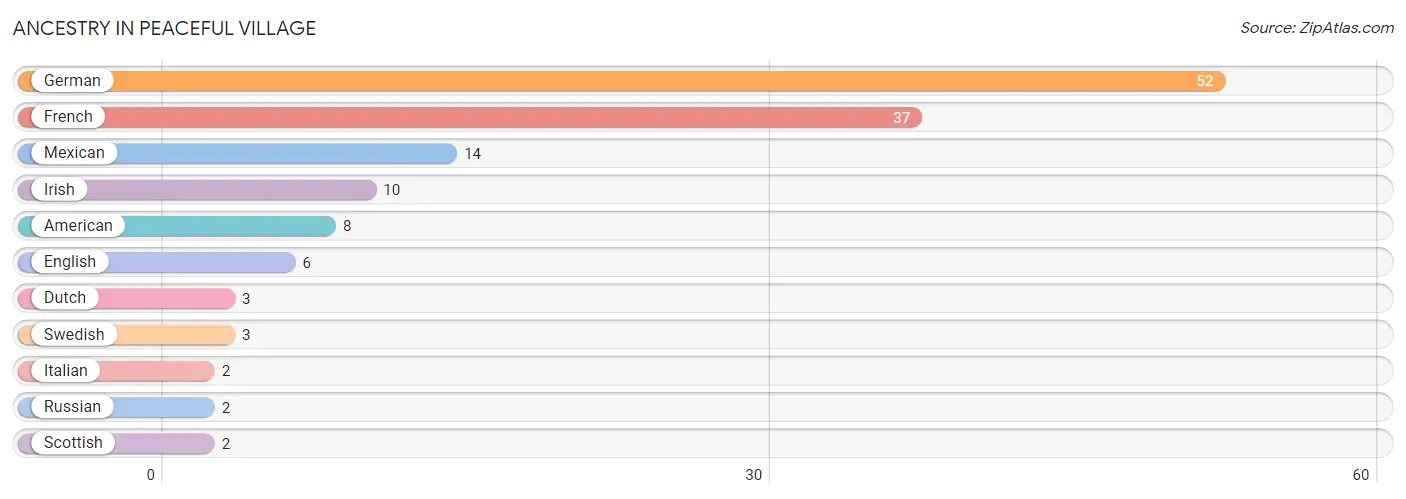
| Ancestry | # Population | % Population |
| American | 8 | 6.3% |
| Dutch | 3 | 2.4% |
| English | 6 | 4.7% |
| French | 37 | 29.1% |
| German | 52 | 40.9% |
| Irish | 10 | 7.9% |
| Italian | 2 | 1.6% |
| Mexican | 14 | 11.0% |
| Russian | 2 | 1.6% |
| Scottish | 2 | 1.6% |
| Swedish | 3 | 2.4% | View All 11 Rows |
Immigrants in Peaceful Village
The most numerous immigrant groups reported in Peaceful Village came from Bosnia and Herzegovina (2 | 1.6%), Eastern Europe (2 | 1.6%), and Europe (2 | 1.6%), together accounting for 4.7% of all Peaceful Village residents.
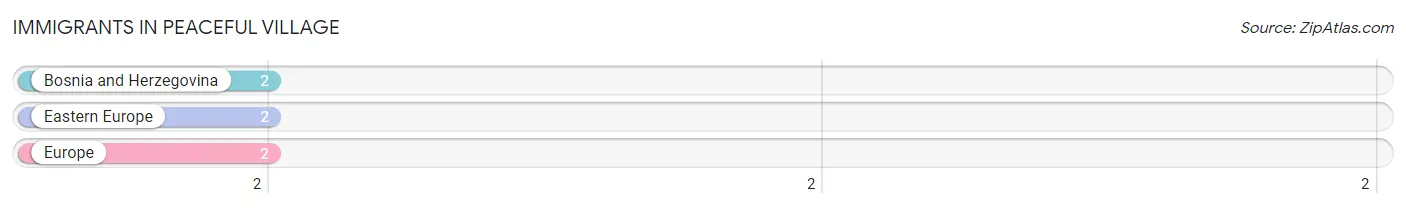
| Immigration Origin | # Population | % Population |
| Bosnia and Herzegovina | 2 | 1.6% |
| Eastern Europe | 2 | 1.6% |
| Europe | 2 | 1.6% | View All 3 Rows |
Sex and Age in Peaceful Village
Sex and Age in Peaceful Village
The most populous age groups in Peaceful Village are 15 to 19 Years (19 | 47.5%) for men and 50 to 54 Years (21 | 24.1%) for women.
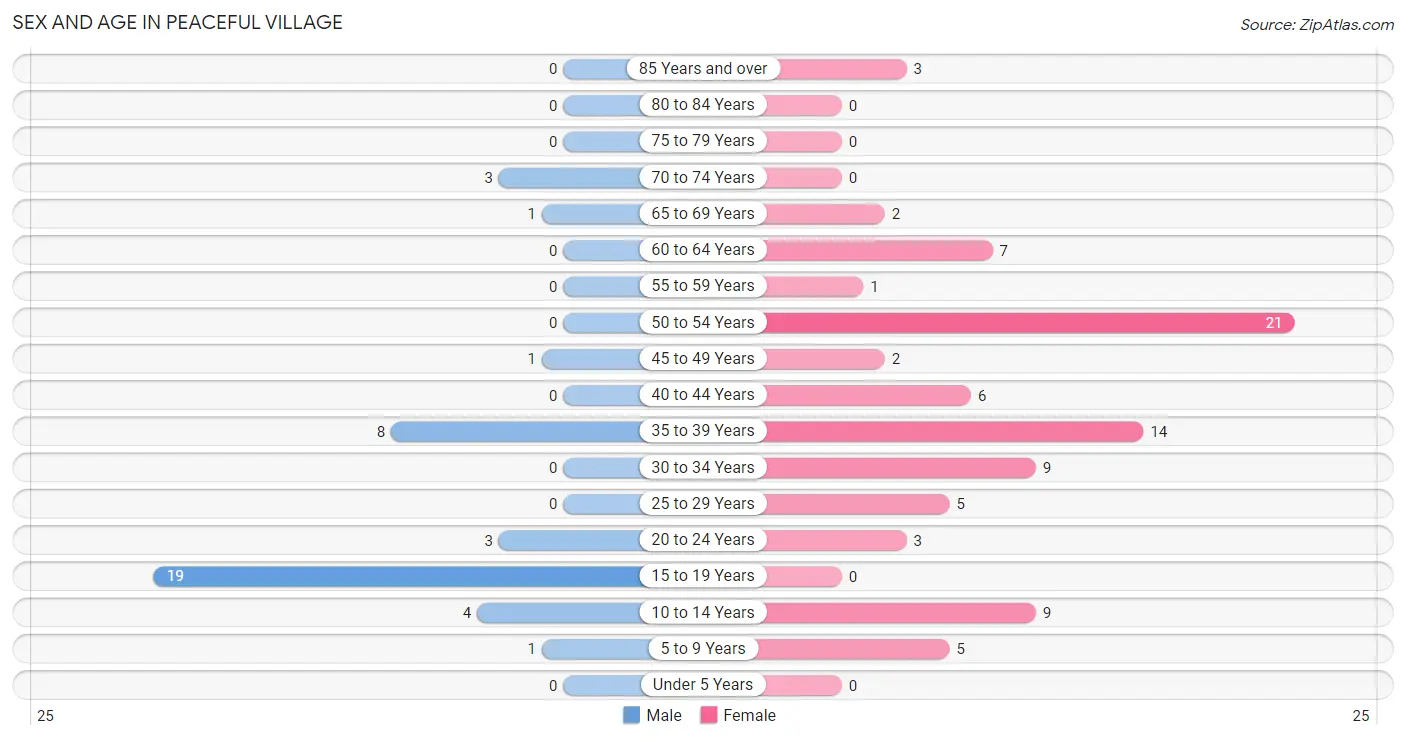
| Age Bracket | Male | Female |
| Under 5 Years | 0 (0.0%) | 0 (0.0%) |
| 5 to 9 Years | 1 (2.5%) | 5 (5.8%) |
| 10 to 14 Years | 4 (10.0%) | 9 (10.3%) |
| 15 to 19 Years | 19 (47.5%) | 0 (0.0%) |
| 20 to 24 Years | 3 (7.5%) | 3 (3.5%) |
| 25 to 29 Years | 0 (0.0%) | 5 (5.8%) |
| 30 to 34 Years | 0 (0.0%) | 9 (10.3%) |
| 35 to 39 Years | 8 (20.0%) | 14 (16.1%) |
| 40 to 44 Years | 0 (0.0%) | 6 (6.9%) |
| 45 to 49 Years | 1 (2.5%) | 2 (2.3%) |
| 50 to 54 Years | 0 (0.0%) | 21 (24.1%) |
| 55 to 59 Years | 0 (0.0%) | 1 (1.1%) |
| 60 to 64 Years | 0 (0.0%) | 7 (8.1%) |
| 65 to 69 Years | 1 (2.5%) | 2 (2.3%) |
| 70 to 74 Years | 3 (7.5%) | 0 (0.0%) |
| 75 to 79 Years | 0 (0.0%) | 0 (0.0%) |
| 80 to 84 Years | 0 (0.0%) | 0 (0.0%) |
| 85 Years and over | 0 (0.0%) | 3 (3.5%) |
| Total | 40 (100.0%) | 87 (100.0%) |
Families and Households in Peaceful Village
Median Family Size in Peaceful Village
The median family size in Peaceful Village is 2.97 persons per family, with married-couple families (8 | 27.6%) accounting for the largest median family size of 5.5 persons per family. On the other hand, single male/father families (2 | 6.9%) represent the smallest median family size with 1.50 persons per family.
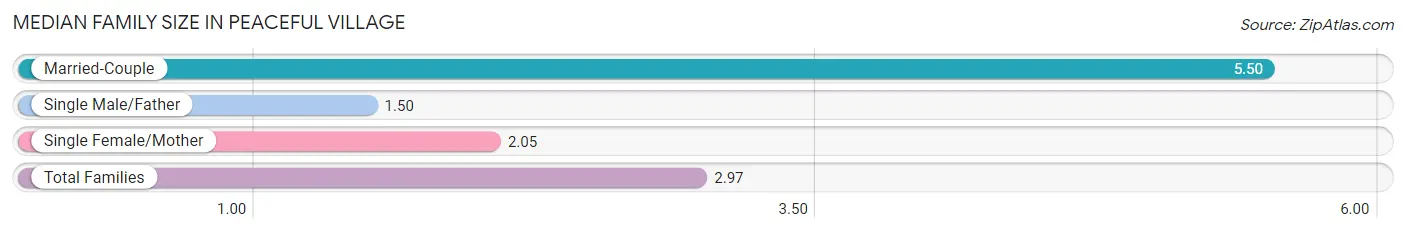
| Family Type | # Families | Family Size |
| Married-Couple | 8 (27.6%) | 5.50 |
| Single Male/Father | 2 (6.9%) | 1.50 |
| Single Female/Mother | 19 (65.5%) | 2.05 |
| Total Families | 29 (100.0%) | 2.97 |
Median Household Size in Peaceful Village
The median household size in Peaceful Village is 3.42 persons per household, with married-couple households (8 | 22.2%) accounting for the largest median household size of 5.5 persons per household. single male/father households (2 | 5.6%) represent the smallest median household size with 2.00 persons per household.
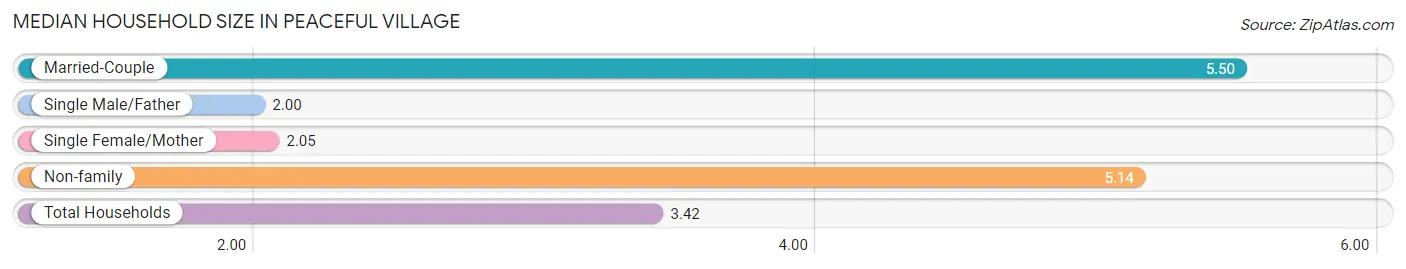
| Household Type | # Households | Household Size |
| Married-Couple | 8 (22.2%) | 5.50 |
| Single Male/Father | 2 (5.6%) | 2.00 |
| Single Female/Mother | 19 (52.8%) | 2.05 |
| Non-family | 7 (19.4%) | 5.14 |
| Total Households | 36 (100.0%) | 3.42 |
Household Size by Marriage Status in Peaceful Village
Out of a total of 36 households in Peaceful Village, 29 (80.6%) are family households, while 7 (19.4%) are nonfamily households. The most numerous type of family households are 2-person households, comprising 22, and the most common type of nonfamily households are 1-person households, comprising 4.
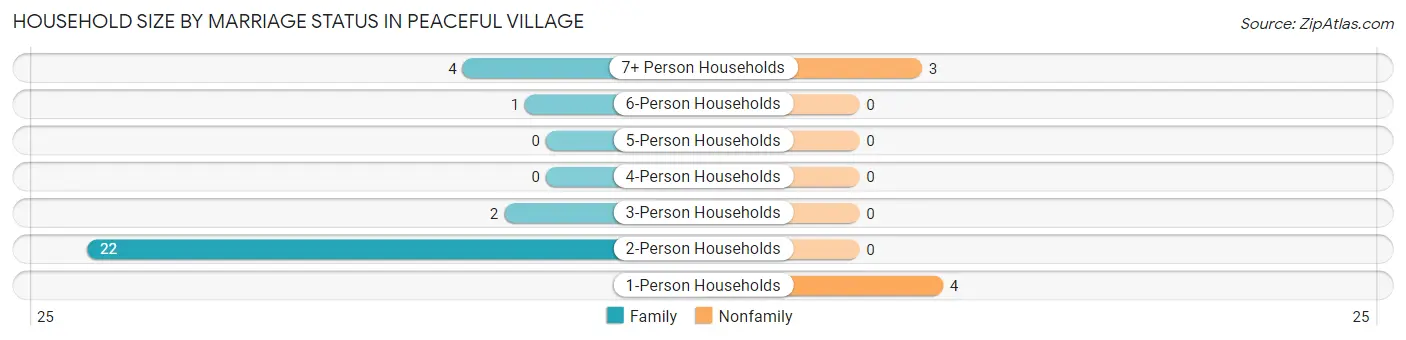
| Household Size | Family Households | Nonfamily Households |
| 1-Person Households | - | 4 (11.1%) |
| 2-Person Households | 22 (61.1%) | 0 (0.0%) |
| 3-Person Households | 2 (5.6%) | 0 (0.0%) |
| 4-Person Households | 0 (0.0%) | 0 (0.0%) |
| 5-Person Households | 0 (0.0%) | 0 (0.0%) |
| 6-Person Households | 1 (2.8%) | 0 (0.0%) |
| 7+ Person Households | 4 (11.1%) | 3 (8.3%) |
| Total | 29 (80.6%) | 7 (19.4%) |
Female Fertility in Peaceful Village
Fertility by Age in Peaceful Village
| Age Bracket | Women with Births | Births / 1,000 Women |
| 15 to 19 years | 0 (0.0%) | 0.0 |
| 20 to 34 years | 0 (0.0%) | 0.0 |
| 35 to 50 years | 0 (0.0%) | 0.0 |
| Total | 0 (0.0%) | 0.0 |
Fertility by Age by Marriage Status in Peaceful Village
| Age Bracket | Married | Unmarried |
| 15 to 19 years | 0 (0.0%) | 0 (0.0%) |
| 20 to 34 years | 0 (0.0%) | 0 (0.0%) |
| 35 to 50 years | 0 (0.0%) | 0 (0.0%) |
| Total | 0 (0.0%) | 0 (0.0%) |
Fertility by Education in Peaceful Village
| Educational Attainment | Women with Births | Births / 1,000 Women |
| Less than High School | 0 (0.0%) | 0.0 |
| High School Diploma | 0 (0.0%) | 0.0 |
| College or Associate's Degree | 0 (0.0%) | 0.0 |
| Bachelor's Degree | 0 (0.0%) | 0.0 |
| Graduate Degree | 0 (0.0%) | 0.0 |
| Total | 0 (0.0%) | 0.0 |
Fertility by Education by Marriage Status in Peaceful Village
| Educational Attainment | Married | Unmarried |
| Less than High School | 0 (0.0%) | 0 (0.0%) |
| High School Diploma | 0 (0.0%) | 0 (0.0%) |
| College or Associate's Degree | 0 (0.0%) | 0 (0.0%) |
| Bachelor's Degree | 0 (0.0%) | 0 (0.0%) |
| Graduate Degree | 0 (0.0%) | 0 (0.0%) |
| Total | 0 (0.0%) | 0 (0.0%) |
Employment Characteristics in Peaceful Village
Employment by Class of Employer in Peaceful Village
Among the 46 employed individuals in Peaceful Village, private company employees (23 | 50.0%), and not-for-profit organizations (23 | 50.0%) make up the most common classes of employment.
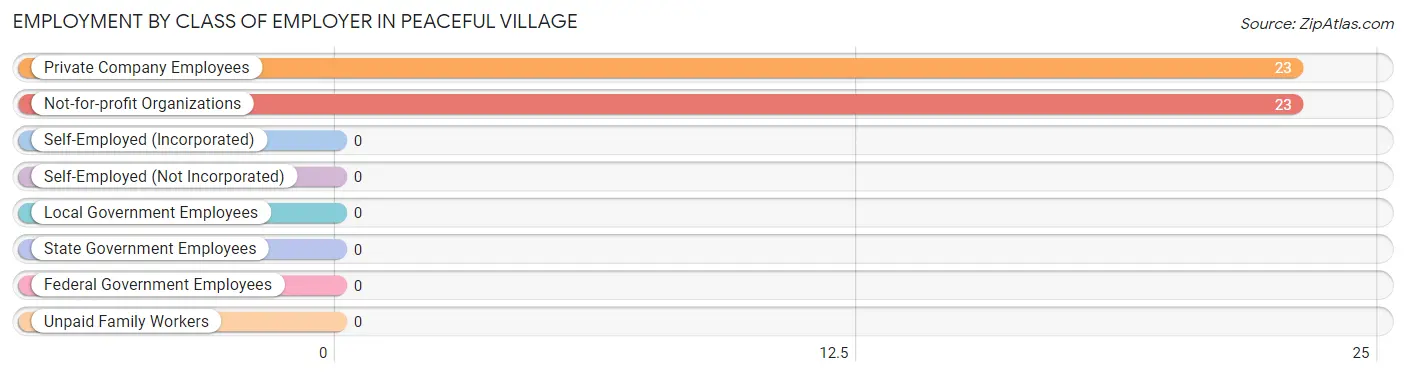
| Employer Class | # Employees | % Employees |
| Private Company Employees | 23 | 50.0% |
| Self-Employed (Incorporated) | 0 | 0.0% |
| Self-Employed (Not Incorporated) | 0 | 0.0% |
| Not-for-profit Organizations | 23 | 50.0% |
| Local Government Employees | 0 | 0.0% |
| State Government Employees | 0 | 0.0% |
| Federal Government Employees | 0 | 0.0% |
| Unpaid Family Workers | 0 | 0.0% |
| Total | 46 | 100.0% |
Employment Status by Age in Peaceful Village
According to the labor force statistics for Peaceful Village, out of the total population over 16 years of age (108), 47.2% or 51 individuals are in the labor force, with 5.9% or 3 of them unemployed. The age group with the highest labor force participation rate is 20 to 24 years, with 100.0% or 6 individuals in the labor force. Within the labor force, the 16 to 19 years age range has the highest percentage of unemployed individuals, with 100.0% or 2 of them being unemployed.
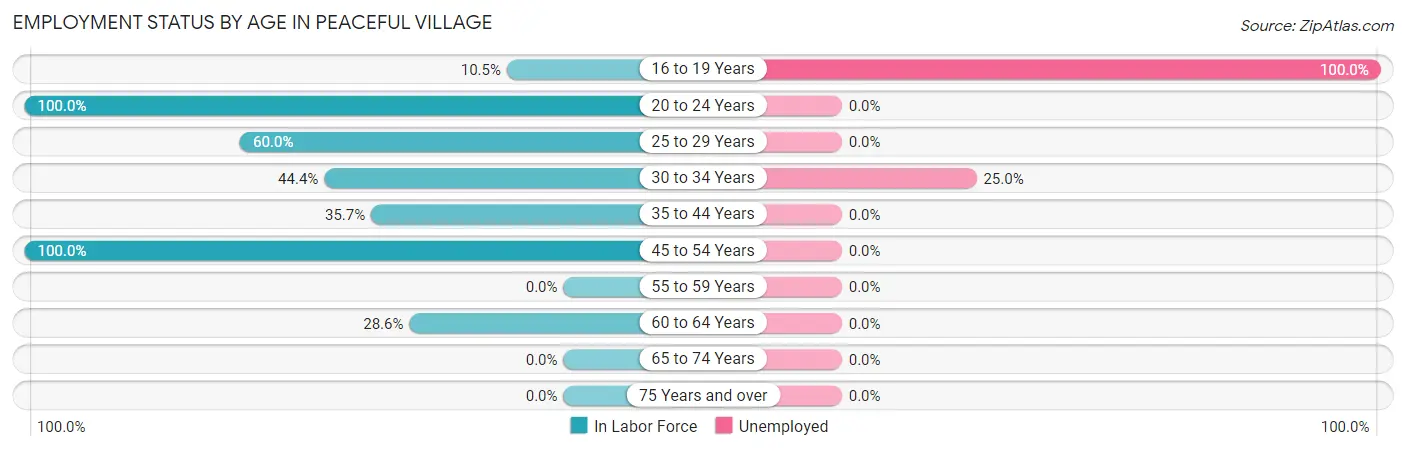
| Age Bracket | In Labor Force | Unemployed |
| 16 to 19 Years | 2 (10.5%) | 2 (100.0%) |
| 20 to 24 Years | 6 (100.0%) | 0 (0.0%) |
| 25 to 29 Years | 3 (60.0%) | 0 (0.0%) |
| 30 to 34 Years | 4 (44.4%) | 1 (25.0%) |
| 35 to 44 Years | 10 (35.7%) | 0 (0.0%) |
| 45 to 54 Years | 24 (100.0%) | 0 (0.0%) |
| 55 to 59 Years | 0 (0.0%) | 0 (0.0%) |
| 60 to 64 Years | 2 (28.6%) | 0 (0.0%) |
| 65 to 74 Years | 0 (0.0%) | 0 (0.0%) |
| 75 Years and over | 0 (0.0%) | 0 (0.0%) |
| Total | 51 (47.2%) | 3 (5.9%) |
Employment Status by Educational Attainment in Peaceful Village
According to labor force statistics for Peaceful Village, 58.1% of individuals (43) out of the total population between 25 and 64 years of age (74) are in the labor force, with 2.3% or 1 of them being unemployed. The group with the highest labor force participation rate are those with the educational attainment of college / associate degree, with 68.8% or 22 individuals in the labor force. Within the labor force, individuals with high school diploma education have the highest percentage of unemployment, with 7.1% or 1 of them being unemployed.
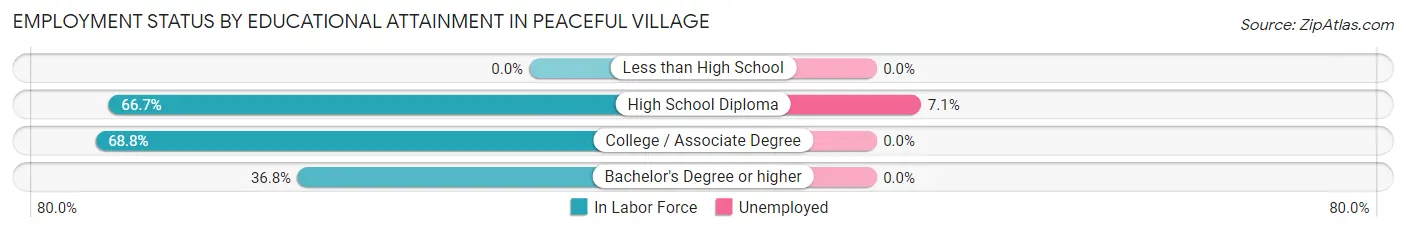
| Educational Attainment | In Labor Force | Unemployed |
| Less than High School | 0 (0.0%) | 0 (0.0%) |
| High School Diploma | 14 (66.7%) | 1 (7.1%) |
| College / Associate Degree | 22 (68.8%) | 0 (0.0%) |
| Bachelor's Degree or higher | 7 (36.8%) | 0 (0.0%) |
| Total | 43 (58.1%) | 2 (2.3%) |
Employment Occupations by Sex in Peaceful Village
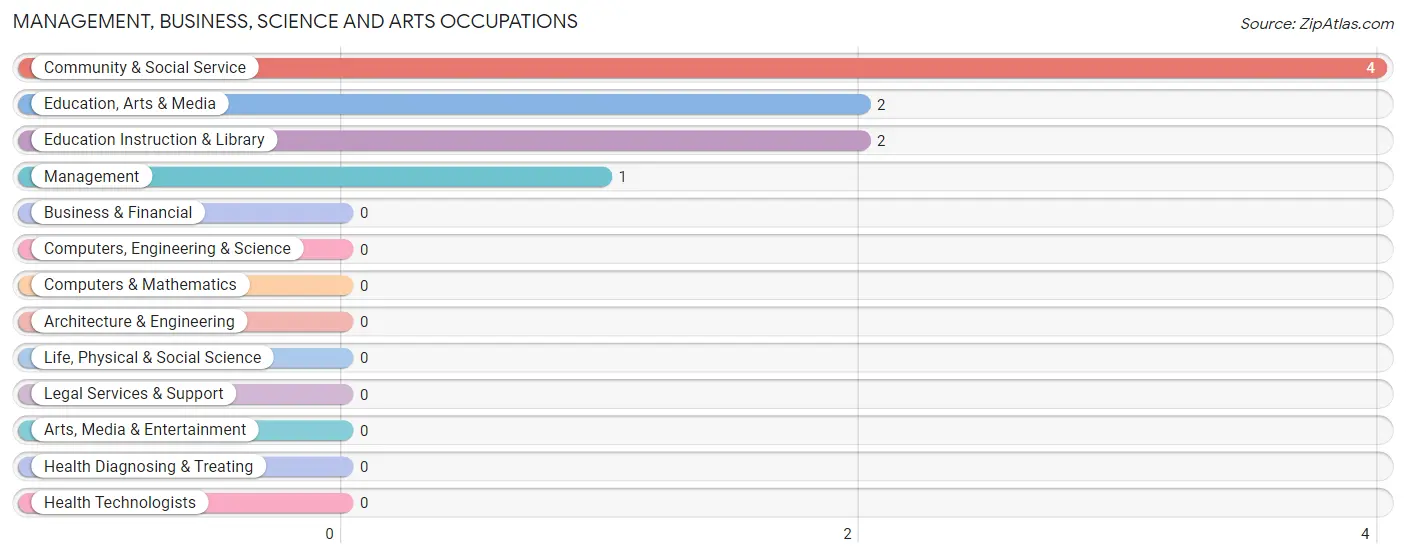
Management, Business, Science and Arts Occupations
The most common Management, Business, Science and Arts occupations in Peaceful Village are Community & Social Service (4 | 8.3%), Education, Arts & Media (2 | 4.2%), Education Instruction & Library (2 | 4.2%), and Management (1 | 2.1%).
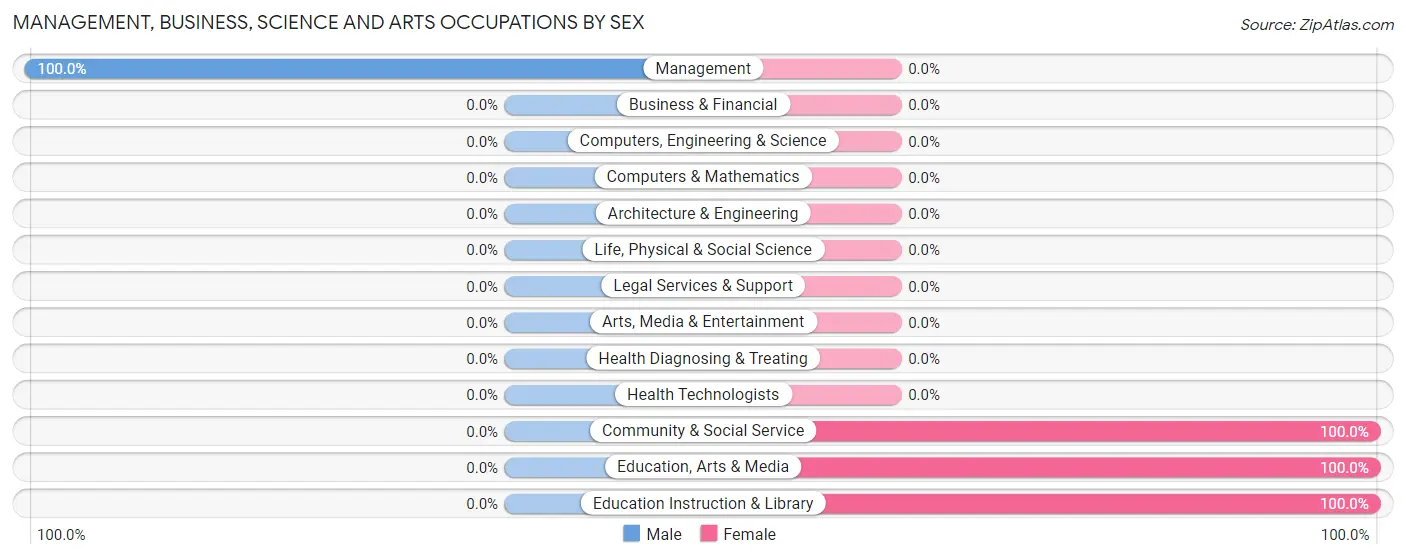
Management, Business, Science and Arts Occupations by Sex
| Occupation | Male | Female |
| Management | 1 (100.0%) | 0 (0.0%) |
| Business & Financial | 0 (0.0%) | 0 (0.0%) |
| Computers, Engineering & Science | 0 (0.0%) | 0 (0.0%) |
| Computers & Mathematics | 0 (0.0%) | 0 (0.0%) |
| Architecture & Engineering | 0 (0.0%) | 0 (0.0%) |
| Life, Physical & Social Science | 0 (0.0%) | 0 (0.0%) |
| Community & Social Service | 0 (0.0%) | 4 (100.0%) |
| Education, Arts & Media | 0 (0.0%) | 2 (100.0%) |
| Legal Services & Support | 0 (0.0%) | 0 (0.0%) |
| Education Instruction & Library | 0 (0.0%) | 2 (100.0%) |
| Arts, Media & Entertainment | 0 (0.0%) | 0 (0.0%) |
| Health Diagnosing & Treating | 0 (0.0%) | 0 (0.0%) |
| Health Technologists | 0 (0.0%) | 0 (0.0%) |
| Total (Category) | 1 (20.0%) | 4 (80.0%) |
| Total (Overall) | 10 (20.8%) | 38 (79.2%) |
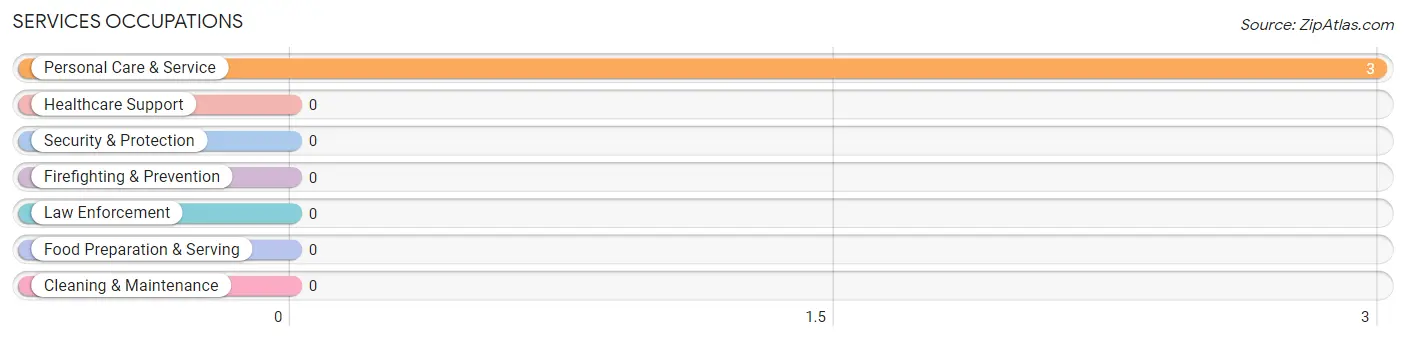
Services Occupations
The most common Services occupations in Peaceful Village are , and Personal Care & Service (3 | 6.2%).
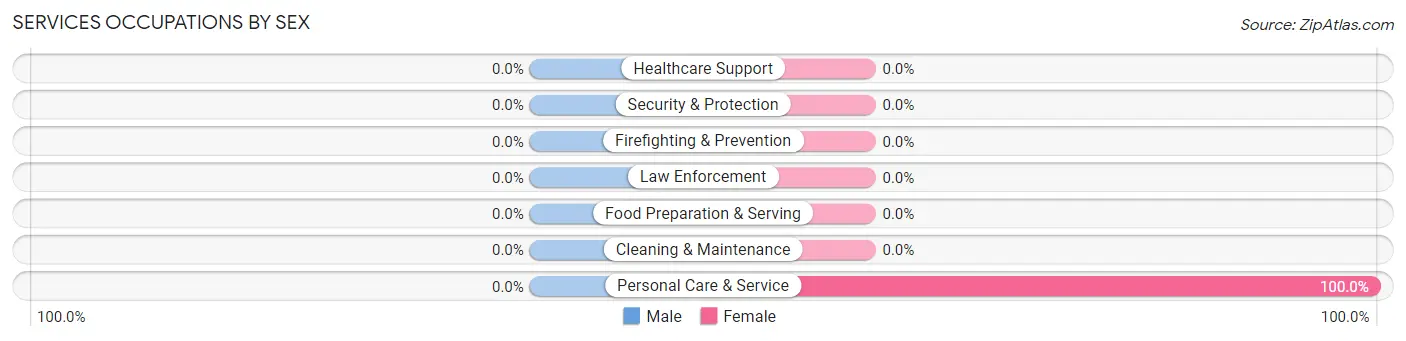
Services Occupations by Sex
| Occupation | Male | Female |
| Healthcare Support | 0 (0.0%) | 0 (0.0%) |
| Security & Protection | 0 (0.0%) | 0 (0.0%) |
| Firefighting & Prevention | 0 (0.0%) | 0 (0.0%) |
| Law Enforcement | 0 (0.0%) | 0 (0.0%) |
| Food Preparation & Serving | 0 (0.0%) | 0 (0.0%) |
| Cleaning & Maintenance | 0 (0.0%) | 0 (0.0%) |
| Personal Care & Service | 0 (0.0%) | 3 (100.0%) |
| Total (Category) | 0 (0.0%) | 3 (100.0%) |
| Total (Overall) | 10 (20.8%) | 38 (79.2%) |
Sales and Office Occupations
The most common Sales and Office occupations in Peaceful Village are , and Office & Administration (4 | 8.3%).
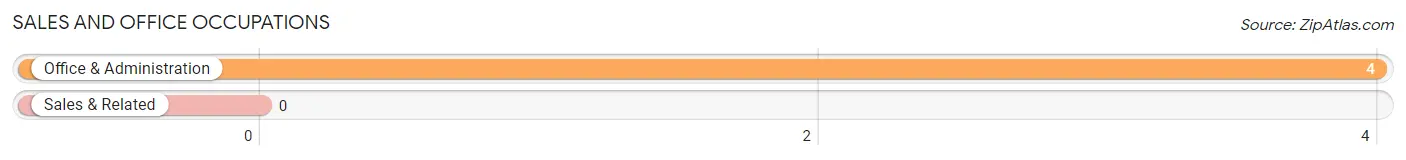
Sales and Office Occupations by Sex
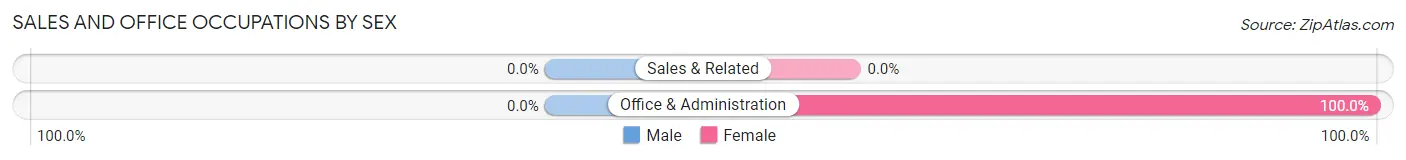
| Occupation | Male | Female |
| Sales & Related | 0 (0.0%) | 0 (0.0%) |
| Office & Administration | 0 (0.0%) | 4 (100.0%) |
| Total (Category) | 0 (0.0%) | 4 (100.0%) |
| Total (Overall) | 10 (20.8%) | 38 (79.2%) |
Natural Resources, Construction and Maintenance Occupations
The most common Natural Resources, Construction and Maintenance occupations in Peaceful Village are , and Installation, Maintenance & Repair (3 | 6.2%).
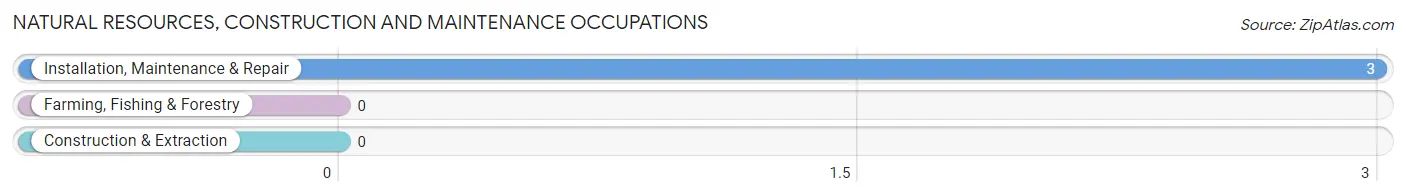
Natural Resources, Construction and Maintenance Occupations by Sex
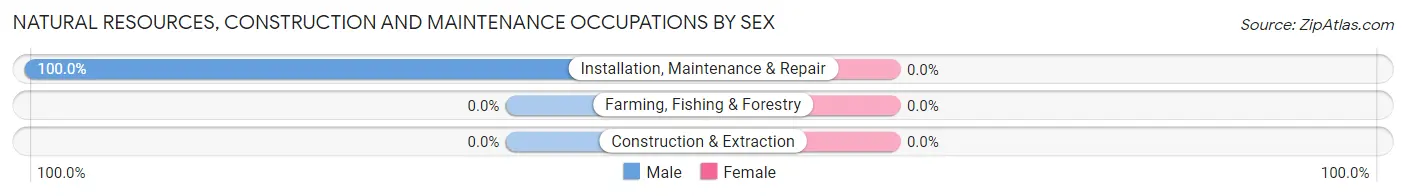
| Occupation | Male | Female |
| Farming, Fishing & Forestry | 0 (0.0%) | 0 (0.0%) |
| Construction & Extraction | 0 (0.0%) | 0 (0.0%) |
| Installation, Maintenance & Repair | 3 (100.0%) | 0 (0.0%) |
| Total (Category) | 3 (100.0%) | 0 (0.0%) |
| Total (Overall) | 10 (20.8%) | 38 (79.2%) |
Production, Transportation and Moving Occupations
The most common Production, Transportation and Moving occupations in Peaceful Village are Transportation (17 | 35.4%), and Production (16 | 33.3%).
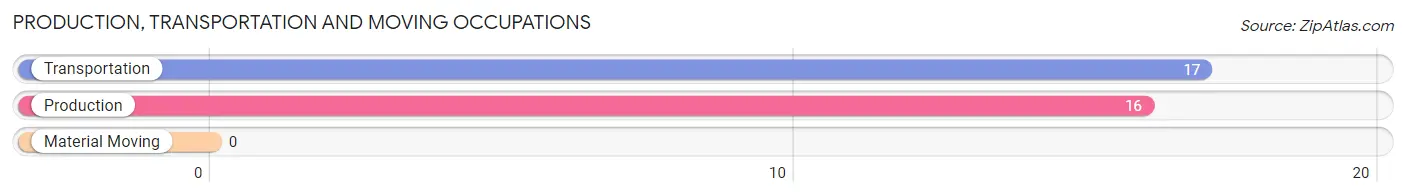
Production, Transportation and Moving Occupations by Sex
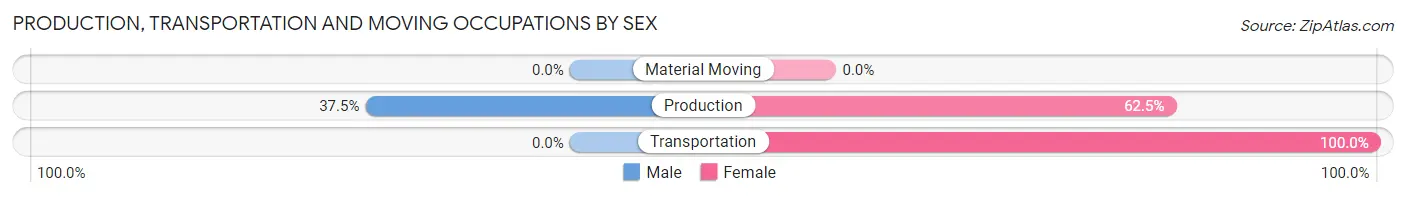
| Occupation | Male | Female |
| Production | 6 (37.5%) | 10 (62.5%) |
| Transportation | 0 (0.0%) | 17 (100.0%) |
| Material Moving | 0 (0.0%) | 0 (0.0%) |
| Total (Category) | 6 (18.2%) | 27 (81.8%) |
| Total (Overall) | 10 (20.8%) | 38 (79.2%) |
Employment Industries by Sex in Peaceful Village
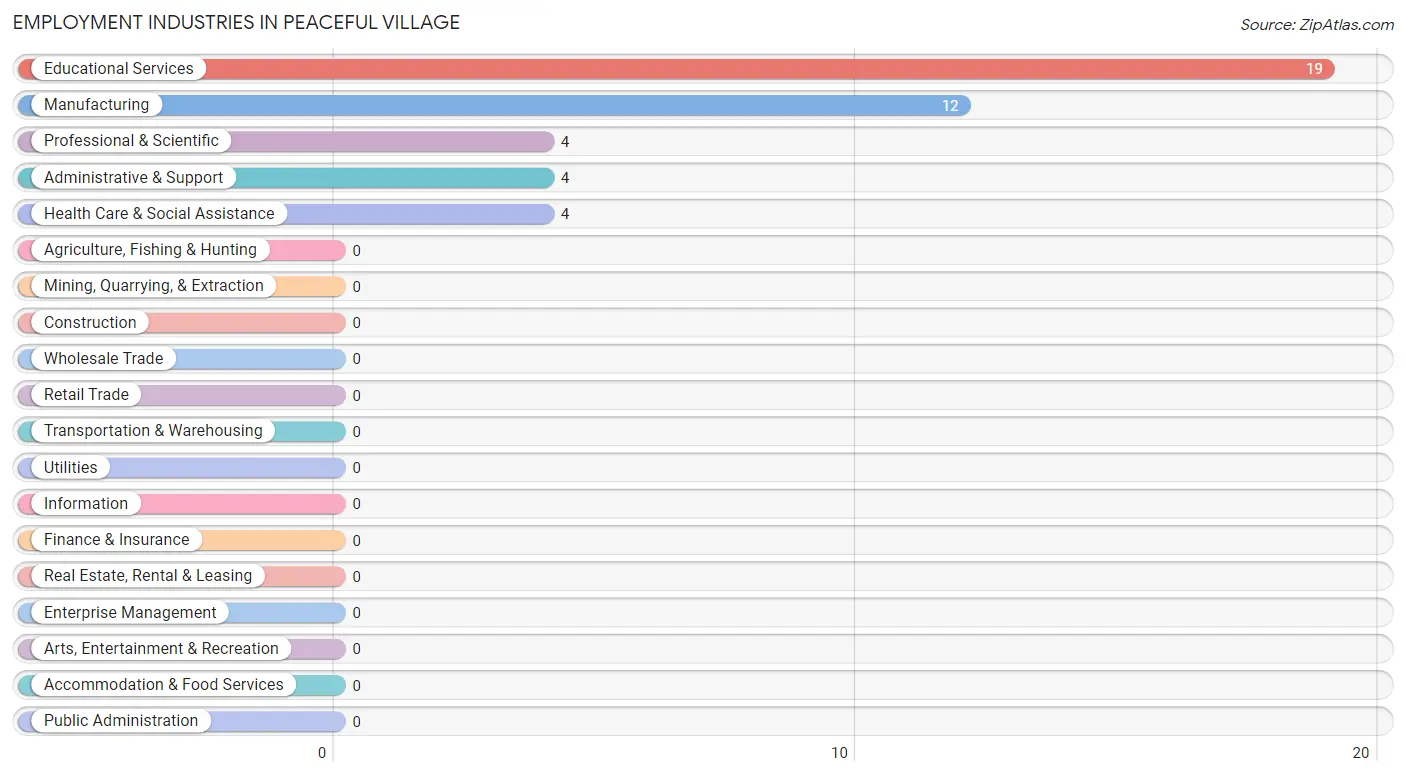
Employment Industries in Peaceful Village
The major employment industries in Peaceful Village include Educational Services (19 | 39.6%), Manufacturing (12 | 25.0%), Professional & Scientific (4 | 8.3%), Administrative & Support (4 | 8.3%), and Health Care & Social Assistance (4 | 8.3%).
Employment Industries by Sex in Peaceful Village
The Peaceful Village industries that see more men than women are Professional & Scientific (100.0%), and Manufacturing (50.0%), whereas the industries that tend to have a higher number of women are Administrative & Support (100.0%), Educational Services (100.0%), and Health Care & Social Assistance (100.0%).
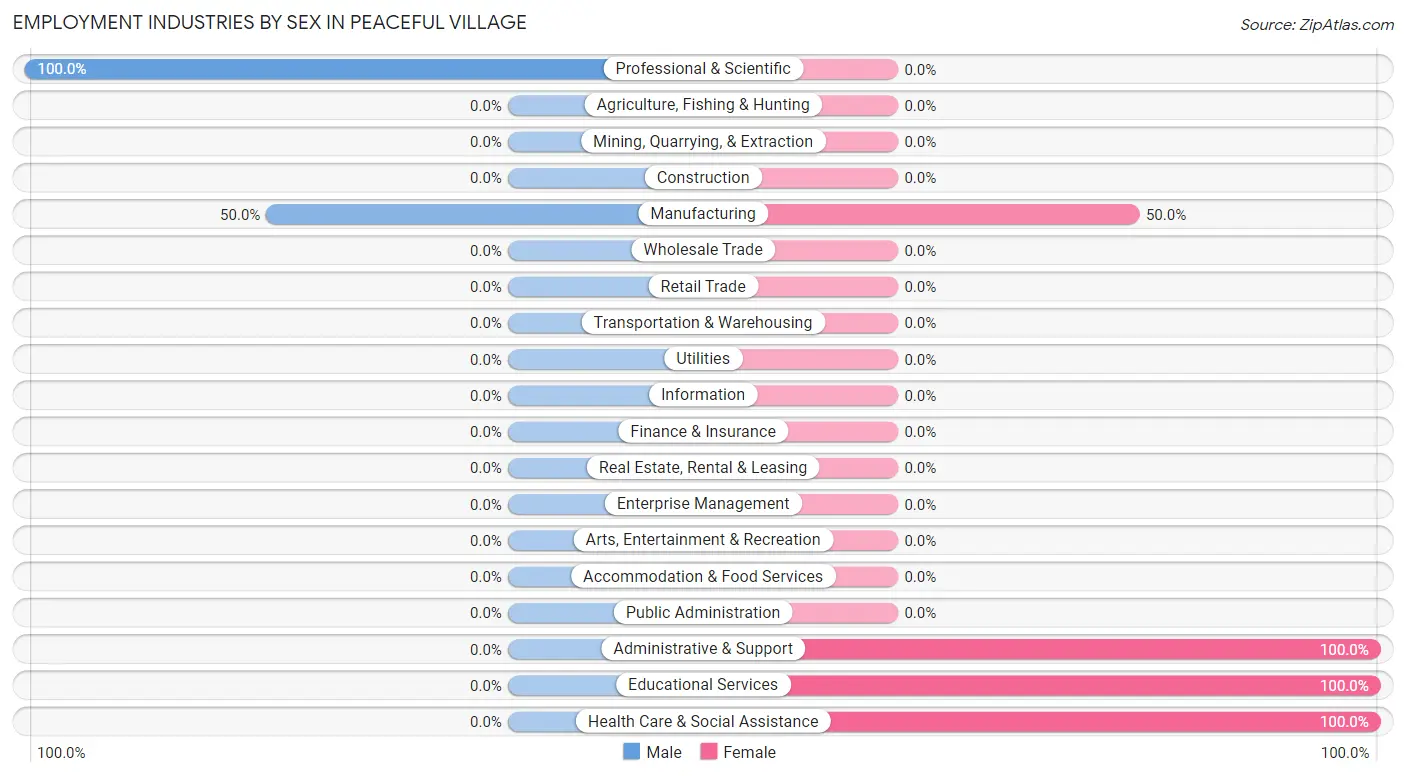
| Industry | Male | Female |
| Agriculture, Fishing & Hunting | 0 (0.0%) | 0 (0.0%) |
| Mining, Quarrying, & Extraction | 0 (0.0%) | 0 (0.0%) |
| Construction | 0 (0.0%) | 0 (0.0%) |
| Manufacturing | 6 (50.0%) | 6 (50.0%) |
| Wholesale Trade | 0 (0.0%) | 0 (0.0%) |
| Retail Trade | 0 (0.0%) | 0 (0.0%) |
| Transportation & Warehousing | 0 (0.0%) | 0 (0.0%) |
| Utilities | 0 (0.0%) | 0 (0.0%) |
| Information | 0 (0.0%) | 0 (0.0%) |
| Finance & Insurance | 0 (0.0%) | 0 (0.0%) |
| Real Estate, Rental & Leasing | 0 (0.0%) | 0 (0.0%) |
| Professional & Scientific | 4 (100.0%) | 0 (0.0%) |
| Enterprise Management | 0 (0.0%) | 0 (0.0%) |
| Administrative & Support | 0 (0.0%) | 4 (100.0%) |
| Educational Services | 0 (0.0%) | 19 (100.0%) |
| Health Care & Social Assistance | 0 (0.0%) | 4 (100.0%) |
| Arts, Entertainment & Recreation | 0 (0.0%) | 0 (0.0%) |
| Accommodation & Food Services | 0 (0.0%) | 0 (0.0%) |
| Public Administration | 0 (0.0%) | 0 (0.0%) |
| Total | 10 (20.8%) | 38 (79.2%) |
Education in Peaceful Village
School Enrollment in Peaceful Village
The most common levels of schooling among the 38 students in Peaceful Village are high school (19 | 50.0%), middle school (13 | 34.2%), and kindergarten (4 | 10.5%).
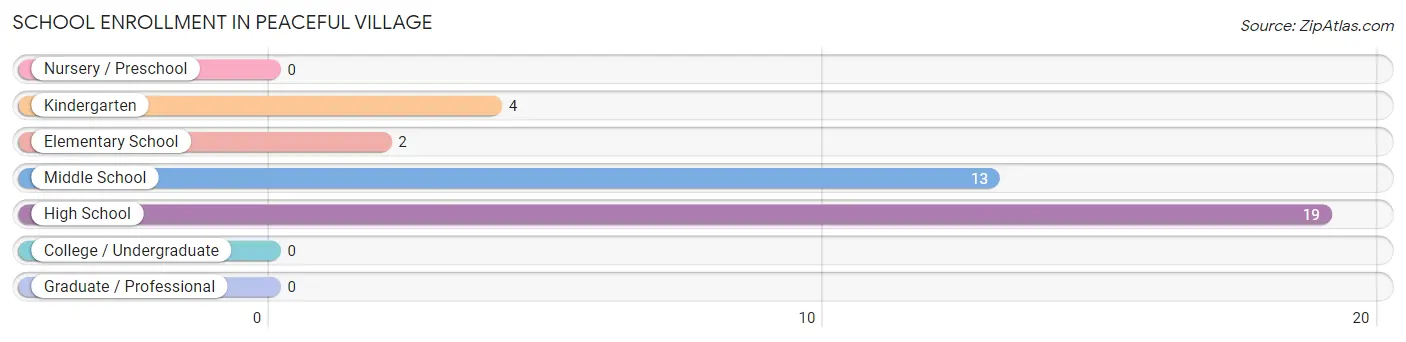
| School Level | # Students | % Students |
| Nursery / Preschool | 0 | 0.0% |
| Kindergarten | 4 | 10.5% |
| Elementary School | 2 | 5.3% |
| Middle School | 13 | 34.2% |
| High School | 19 | 50.0% |
| College / Undergraduate | 0 | 0.0% |
| Graduate / Professional | 0 | 0.0% |
| Total | 38 | 100.0% |
School Enrollment by Age by Funding Source in Peaceful Village
Out of a total of 38 students who are enrolled in schools in Peaceful Village, 10 (26.3%) attend a private institution, while the remaining 28 (73.7%) are enrolled in public schools. The age group of 18 to 19 year olds has the highest likelihood of being enrolled in private schools, with 2 (100.0% in the age bracket) enrolled. Conversely, the age group of 15 to 17 year olds has the lowest likelihood of being enrolled in a private school, with 17 (100.0% in the age bracket) attending a public institution.
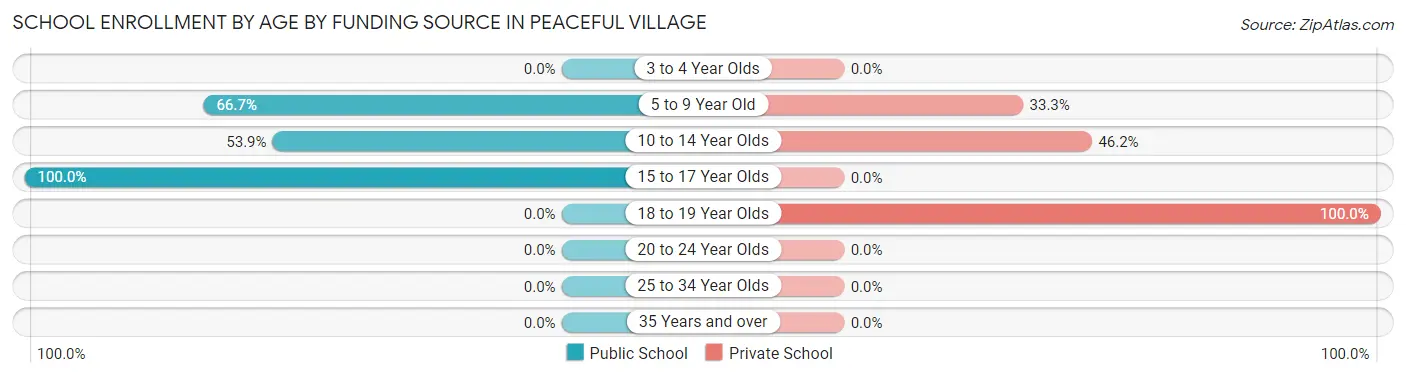
| Age Bracket | Public School | Private School |
| 3 to 4 Year Olds | 0 (0.0%) | 0 (0.0%) |
| 5 to 9 Year Old | 4 (66.7%) | 2 (33.3%) |
| 10 to 14 Year Olds | 7 (53.8%) | 6 (46.2%) |
| 15 to 17 Year Olds | 17 (100.0%) | 0 (0.0%) |
| 18 to 19 Year Olds | 0 (0.0%) | 2 (100.0%) |
| 20 to 24 Year Olds | 0 (0.0%) | 0 (0.0%) |
| 25 to 34 Year Olds | 0 (0.0%) | 0 (0.0%) |
| 35 Years and over | 0 (0.0%) | 0 (0.0%) |
| Total | 28 (73.7%) | 10 (26.3%) |
Educational Attainment by Field of Study in Peaceful Village
Business (11 | 52.4%), psychology (4 | 19.1%), multidisciplinary studies (2 | 9.5%), science & technology (2 | 9.5%), and arts & humanities (2 | 9.5%) are the most common fields of study among 21 individuals in Peaceful Village who have obtained a bachelor's degree or higher.
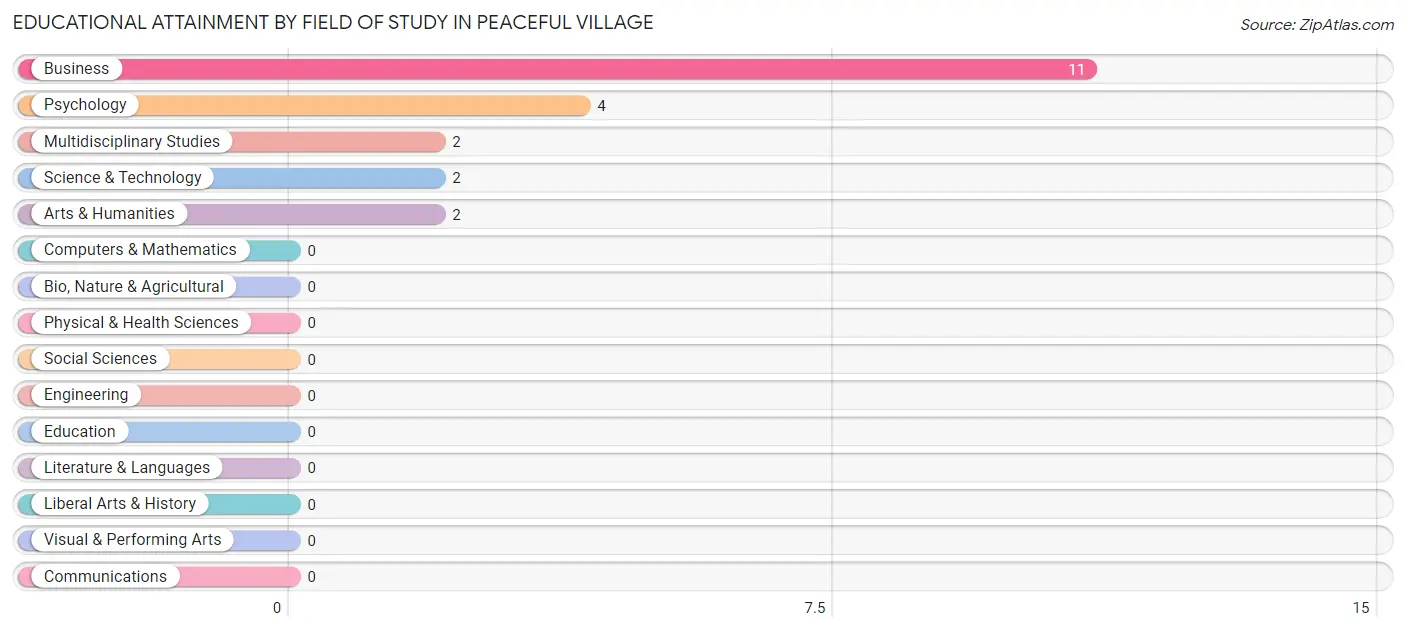
| Field of Study | # Graduates | % Graduates |
| Computers & Mathematics | 0 | 0.0% |
| Bio, Nature & Agricultural | 0 | 0.0% |
| Physical & Health Sciences | 0 | 0.0% |
| Psychology | 4 | 19.1% |
| Social Sciences | 0 | 0.0% |
| Engineering | 0 | 0.0% |
| Multidisciplinary Studies | 2 | 9.5% |
| Science & Technology | 2 | 9.5% |
| Business | 11 | 52.4% |
| Education | 0 | 0.0% |
| Literature & Languages | 0 | 0.0% |
| Liberal Arts & History | 0 | 0.0% |
| Visual & Performing Arts | 0 | 0.0% |
| Communications | 0 | 0.0% |
| Arts & Humanities | 2 | 9.5% |
| Total | 21 | 100.0% |
Transportation & Commute in Peaceful Village
Vehicle Availability by Sex in Peaceful Village
The most prevalent vehicle ownership categories in Peaceful Village are males with 3 vehicles (6, accounting for 60.0%) and females with 3 vehicles (4, making up 18.8%).
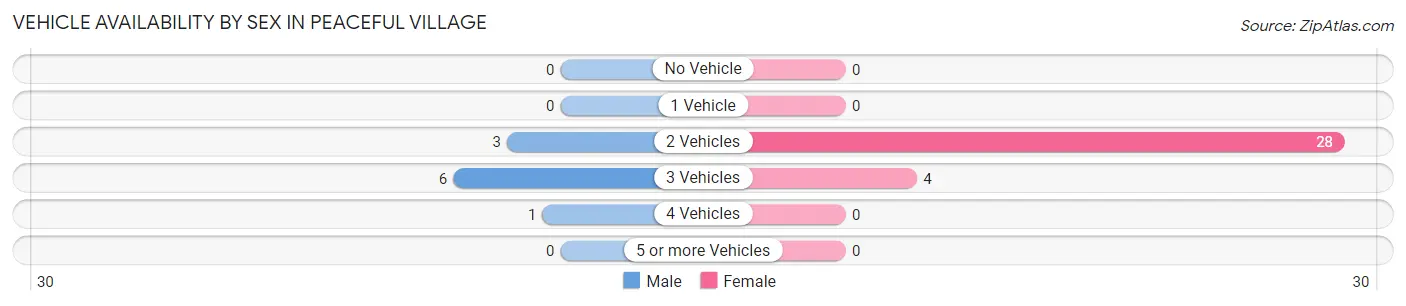
| Vehicles Available | Male | Female |
| No Vehicle | 0 (0.0%) | 0 (0.0%) |
| 1 Vehicle | 0 (0.0%) | 0 (0.0%) |
| 2 Vehicles | 3 (30.0%) | 28 (87.5%) |
| 3 Vehicles | 6 (60.0%) | 4 (12.5%) |
| 4 Vehicles | 1 (10.0%) | 0 (0.0%) |
| 5 or more Vehicles | 0 (0.0%) | 0 (0.0%) |
| Total | 10 (100.0%) | 32 (100.0%) |
Commute Time in Peaceful Village
The most frequently occuring commute durations in Peaceful Village are less than 5 minutes (17 commuters, 39.5%), 5 to 9 minutes (9 commuters, 20.9%), and 30 to 34 minutes (7 commuters, 16.3%).
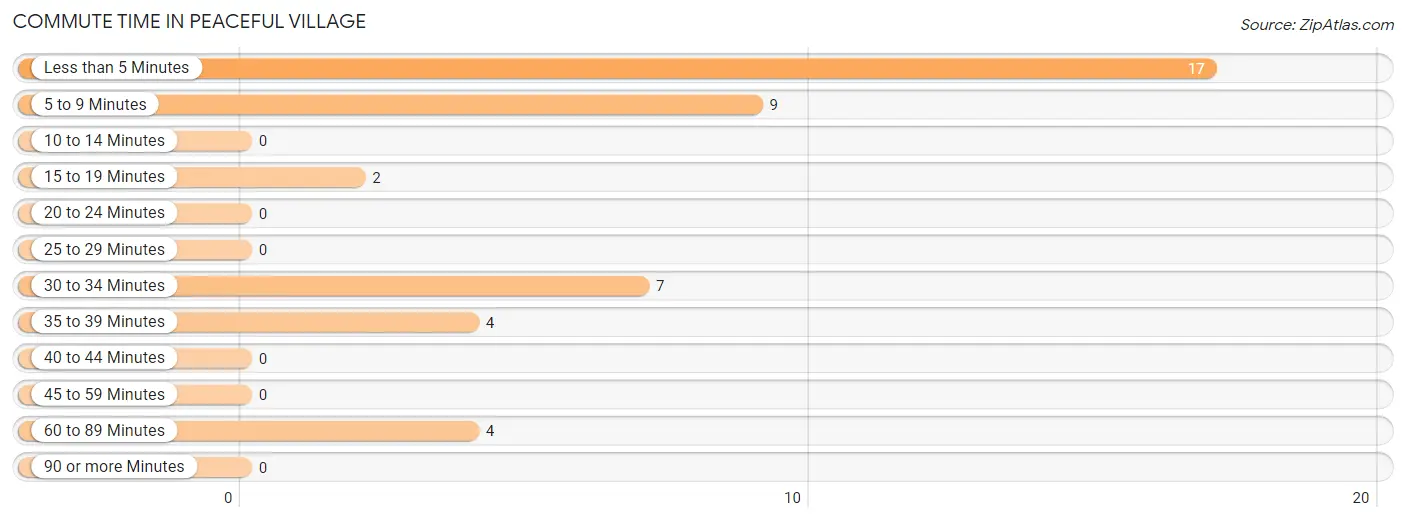
| Commute Time | # Commuters | % Commuters |
| Less than 5 Minutes | 17 | 39.5% |
| 5 to 9 Minutes | 9 | 20.9% |
| 10 to 14 Minutes | 0 | 0.0% |
| 15 to 19 Minutes | 2 | 4.6% |
| 20 to 24 Minutes | 0 | 0.0% |
| 25 to 29 Minutes | 0 | 0.0% |
| 30 to 34 Minutes | 7 | 16.3% |
| 35 to 39 Minutes | 4 | 9.3% |
| 40 to 44 Minutes | 0 | 0.0% |
| 45 to 59 Minutes | 0 | 0.0% |
| 60 to 89 Minutes | 4 | 9.3% |
| 90 or more Minutes | 0 | 0.0% |
Commute Time by Sex in Peaceful Village
The most common commute times in Peaceful Village are 30 to 34 minutes (7 commuters, 100.0%) for males and less than 5 minutes (17 commuters, 47.2%) for females.
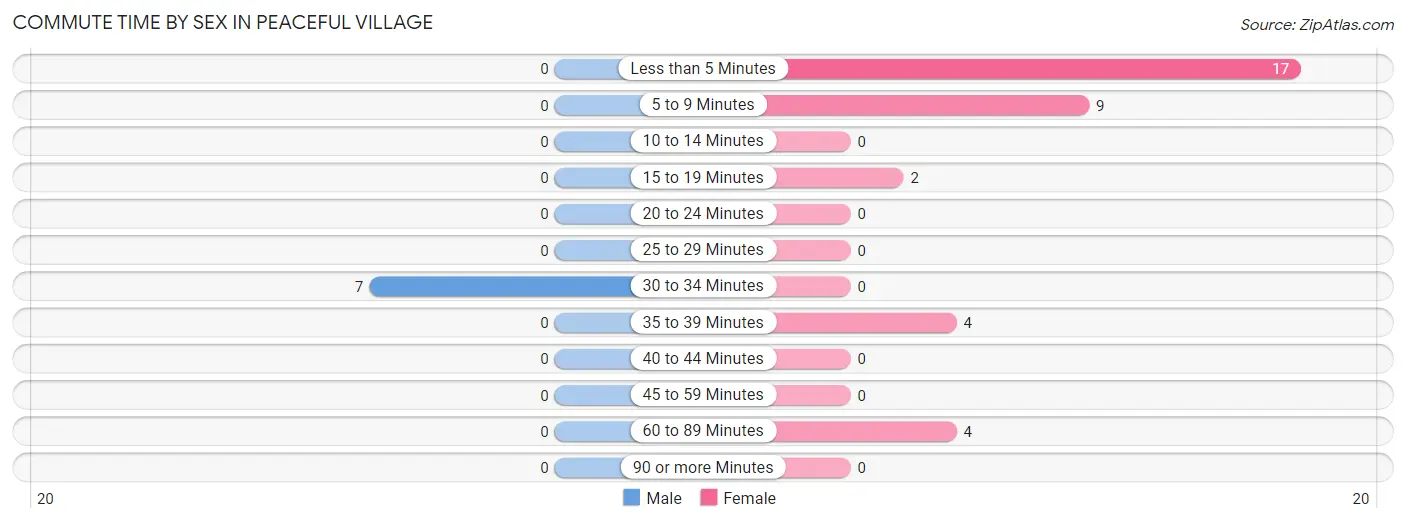
| Commute Time | Male | Female |
| Less than 5 Minutes | 0 (0.0%) | 17 (47.2%) |
| 5 to 9 Minutes | 0 (0.0%) | 9 (25.0%) |
| 10 to 14 Minutes | 0 (0.0%) | 0 (0.0%) |
| 15 to 19 Minutes | 0 (0.0%) | 2 (5.6%) |
| 20 to 24 Minutes | 0 (0.0%) | 0 (0.0%) |
| 25 to 29 Minutes | 0 (0.0%) | 0 (0.0%) |
| 30 to 34 Minutes | 7 (100.0%) | 0 (0.0%) |
| 35 to 39 Minutes | 0 (0.0%) | 4 (11.1%) |
| 40 to 44 Minutes | 0 (0.0%) | 0 (0.0%) |
| 45 to 59 Minutes | 0 (0.0%) | 0 (0.0%) |
| 60 to 89 Minutes | 0 (0.0%) | 4 (11.1%) |
| 90 or more Minutes | 0 (0.0%) | 0 (0.0%) |
Time of Departure to Work by Sex in Peaceful Village
The most frequent times of departure to work in Peaceful Village are 7:30 AM to 7:59 AM (7, 100.0%) for males and 7:30 AM to 7:59 AM (17, 47.2%) for females.
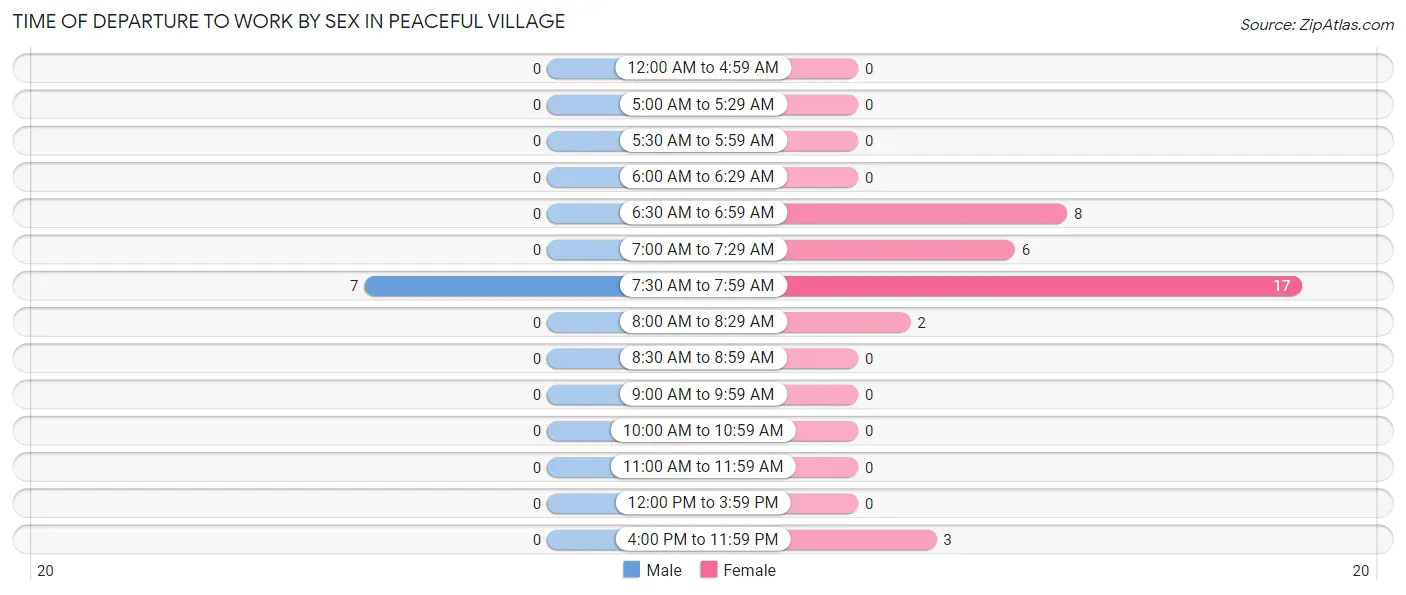
| Time of Departure | Male | Female |
| 12:00 AM to 4:59 AM | 0 (0.0%) | 0 (0.0%) |
| 5:00 AM to 5:29 AM | 0 (0.0%) | 0 (0.0%) |
| 5:30 AM to 5:59 AM | 0 (0.0%) | 0 (0.0%) |
| 6:00 AM to 6:29 AM | 0 (0.0%) | 0 (0.0%) |
| 6:30 AM to 6:59 AM | 0 (0.0%) | 8 (22.2%) |
| 7:00 AM to 7:29 AM | 0 (0.0%) | 6 (16.7%) |
| 7:30 AM to 7:59 AM | 7 (100.0%) | 17 (47.2%) |
| 8:00 AM to 8:29 AM | 0 (0.0%) | 2 (5.6%) |
| 8:30 AM to 8:59 AM | 0 (0.0%) | 0 (0.0%) |
| 9:00 AM to 9:59 AM | 0 (0.0%) | 0 (0.0%) |
| 10:00 AM to 10:59 AM | 0 (0.0%) | 0 (0.0%) |
| 11:00 AM to 11:59 AM | 0 (0.0%) | 0 (0.0%) |
| 12:00 PM to 3:59 PM | 0 (0.0%) | 0 (0.0%) |
| 4:00 PM to 11:59 PM | 0 (0.0%) | 3 (8.3%) |
| Total | 7 (100.0%) | 36 (100.0%) |
Housing Occupancy in Peaceful Village
Occupancy by Ownership in Peaceful Village
Of the total 36 dwellings in Peaceful Village, owner-occupied units account for 10 (27.8%), while renter-occupied units make up 26 (72.2%).
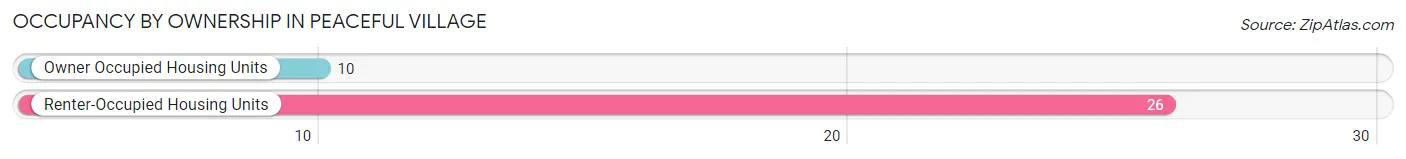
| Occupancy | # Housing Units | % Housing Units |
| Owner Occupied Housing Units | 10 | 27.8% |
| Renter-Occupied Housing Units | 26 | 72.2% |
| Total Occupied Housing Units | 36 | 100.0% |
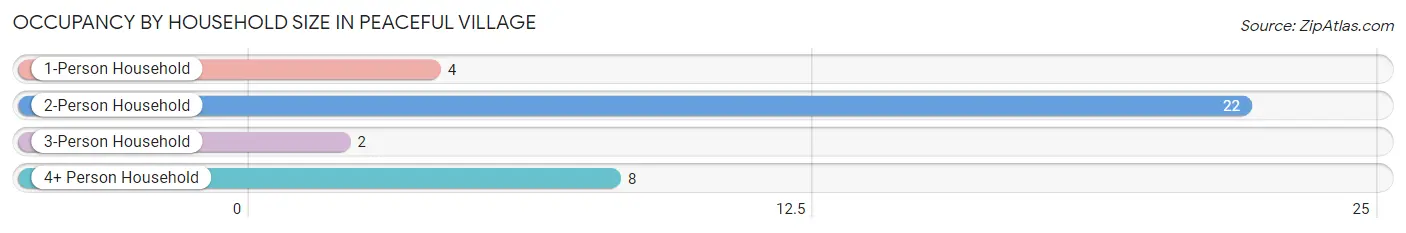
Occupancy by Household Size in Peaceful Village
| Household Size | # Housing Units | % Housing Units |
| 1-Person Household | 4 | 11.1% |
| 2-Person Household | 22 | 61.1% |
| 3-Person Household | 2 | 5.6% |
| 4+ Person Household | 8 | 22.2% |
| Total Housing Units | 36 | 100.0% |
Occupancy by Ownership by Household Size in Peaceful Village
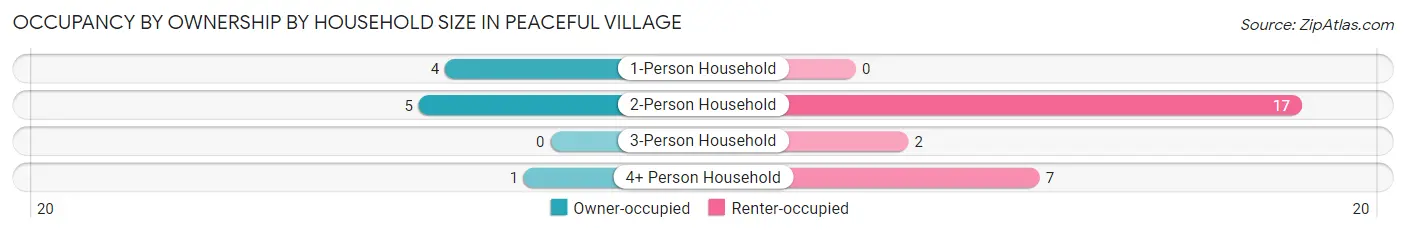
| Household Size | Owner-occupied | Renter-occupied |
| 1-Person Household | 4 (100.0%) | 0 (0.0%) |
| 2-Person Household | 5 (22.7%) | 17 (77.3%) |
| 3-Person Household | 0 (0.0%) | 2 (100.0%) |
| 4+ Person Household | 1 (12.5%) | 7 (87.5%) |
| Total Housing Units | 10 (27.8%) | 26 (72.2%) |
Occupancy by Educational Attainment in Peaceful Village
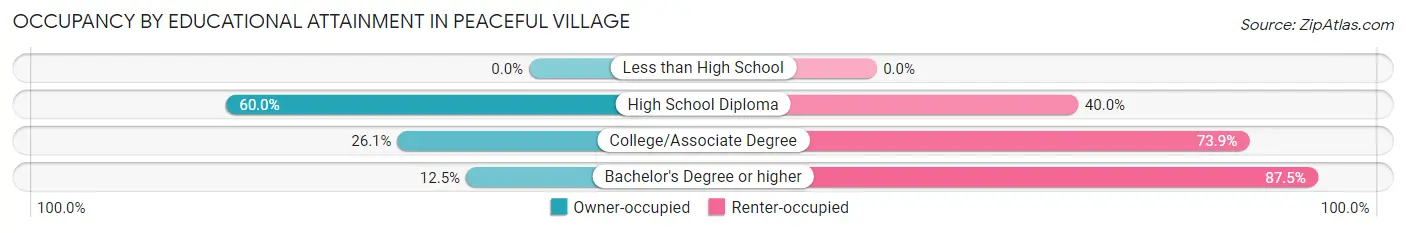
| Household Size | Owner-occupied | Renter-occupied |
| Less than High School | 0 (0.0%) | 0 (0.0%) |
| High School Diploma | 3 (60.0%) | 2 (40.0%) |
| College/Associate Degree | 6 (26.1%) | 17 (73.9%) |
| Bachelor's Degree or higher | 1 (12.5%) | 7 (87.5%) |
Occupancy by Age of Householder in Peaceful Village
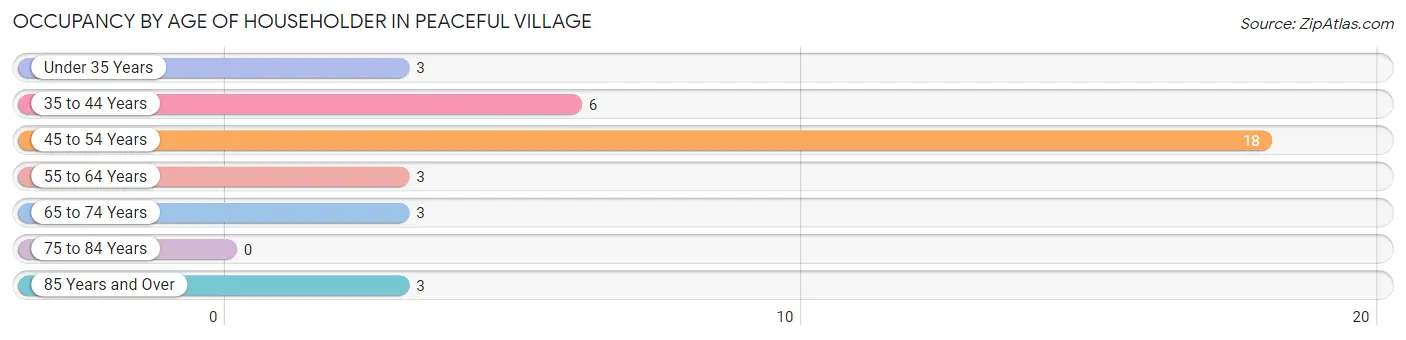
| Age Bracket | # Households | % Households |
| Under 35 Years | 3 | 8.3% |
| 35 to 44 Years | 6 | 16.7% |
| 45 to 54 Years | 18 | 50.0% |
| 55 to 64 Years | 3 | 8.3% |
| 65 to 74 Years | 3 | 8.3% |
| 75 to 84 Years | 0 | 0.0% |
| 85 Years and Over | 3 | 8.3% |
| Total | 36 | 100.0% |
Housing Finances in Peaceful Village
Median Income by Occupancy in Peaceful Village
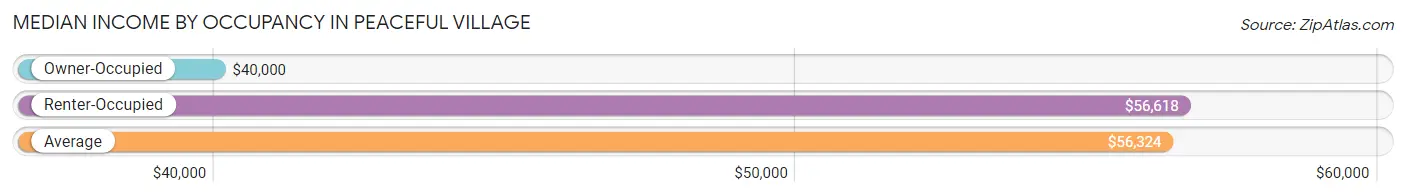
| Occupancy Type | # Households | Median Income |
| Owner-Occupied | 10 (27.8%) | $40,000 |
| Renter-Occupied | 26 (72.2%) | $56,618 |
| Average | 36 (100.0%) | $56,324 |
Occupancy by Householder Income Bracket in Peaceful Village
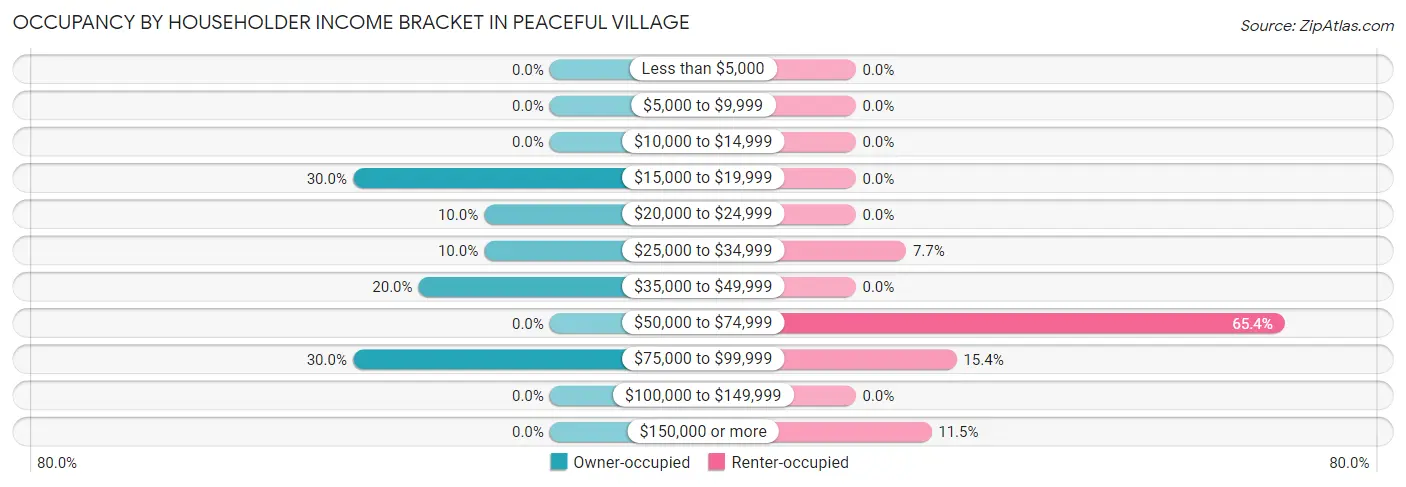
| Income Bracket | Owner-occupied | Renter-occupied |
| Less than $5,000 | 0 (0.0%) | 0 (0.0%) |
| $5,000 to $9,999 | 0 (0.0%) | 0 (0.0%) |
| $10,000 to $14,999 | 0 (0.0%) | 0 (0.0%) |
| $15,000 to $19,999 | 3 (30.0%) | 0 (0.0%) |
| $20,000 to $24,999 | 1 (10.0%) | 0 (0.0%) |
| $25,000 to $34,999 | 1 (10.0%) | 2 (7.7%) |
| $35,000 to $49,999 | 2 (20.0%) | 0 (0.0%) |
| $50,000 to $74,999 | 0 (0.0%) | 17 (65.4%) |
| $75,000 to $99,999 | 3 (30.0%) | 4 (15.4%) |
| $100,000 to $149,999 | 0 (0.0%) | 0 (0.0%) |
| $150,000 or more | 0 (0.0%) | 3 (11.5%) |
| Total | 10 (100.0%) | 26 (100.0%) |
Monthly Housing Cost Tiers in Peaceful Village
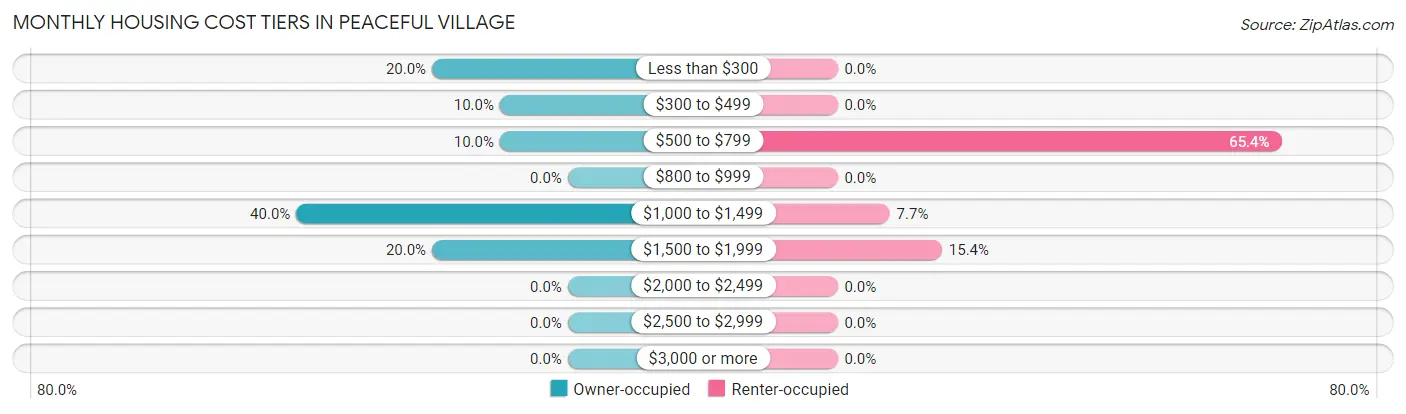
| Monthly Cost | Owner-occupied | Renter-occupied |
| Less than $300 | 2 (20.0%) | 0 (0.0%) |
| $300 to $499 | 1 (10.0%) | 0 (0.0%) |
| $500 to $799 | 1 (10.0%) | 17 (65.4%) |
| $800 to $999 | 0 (0.0%) | 0 (0.0%) |
| $1,000 to $1,499 | 4 (40.0%) | 2 (7.7%) |
| $1,500 to $1,999 | 2 (20.0%) | 4 (15.4%) |
| $2,000 to $2,499 | 0 (0.0%) | 0 (0.0%) |
| $2,500 to $2,999 | 0 (0.0%) | 0 (0.0%) |
| $3,000 or more | 0 (0.0%) | 0 (0.0%) |
| Total | 10 (100.0%) | 26 (100.0%) |
Physical Housing Characteristics in Peaceful Village
Housing Structures in Peaceful Village
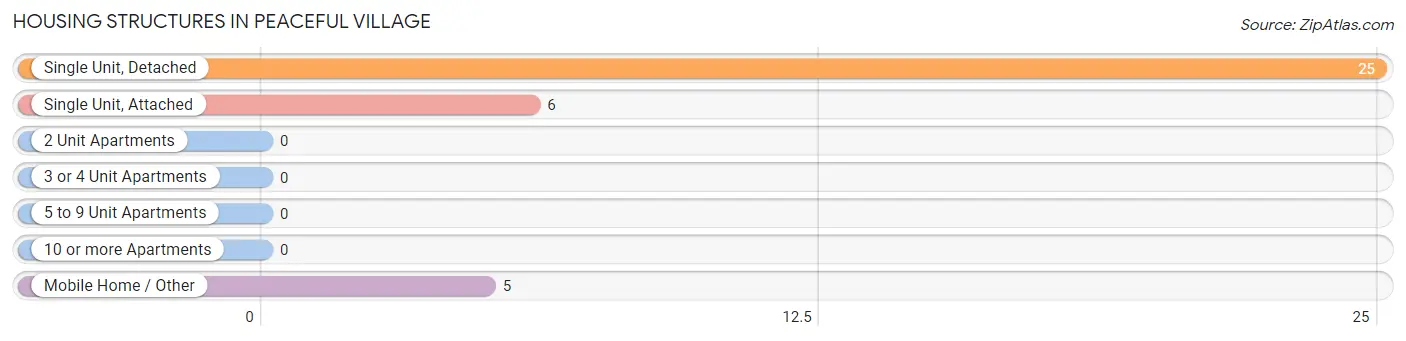
| Structure Type | # Housing Units | % Housing Units |
| Single Unit, Detached | 25 | 69.4% |
| Single Unit, Attached | 6 | 16.7% |
| 2 Unit Apartments | 0 | 0.0% |
| 3 or 4 Unit Apartments | 0 | 0.0% |
| 5 to 9 Unit Apartments | 0 | 0.0% |
| 10 or more Apartments | 0 | 0.0% |
| Mobile Home / Other | 5 | 13.9% |
| Total | 36 | 100.0% |
Housing Structures by Occupancy in Peaceful Village
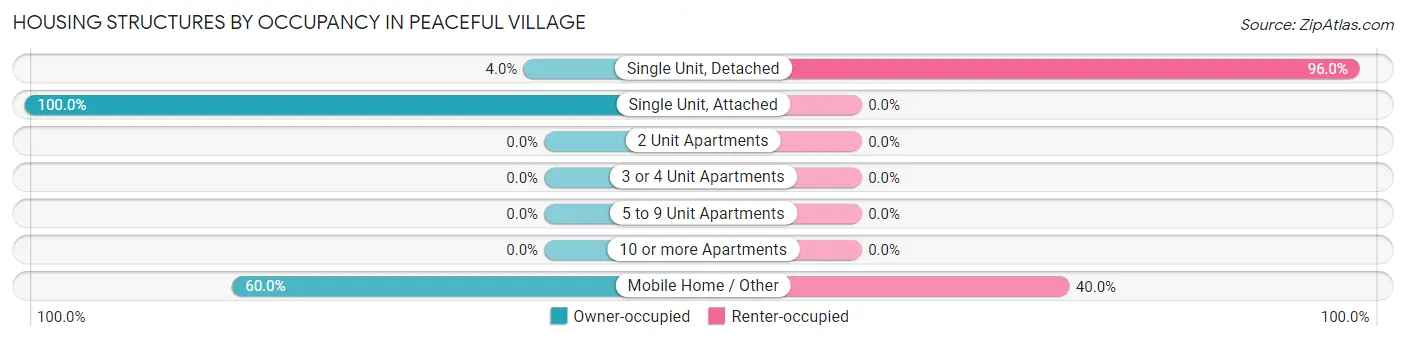
| Structure Type | Owner-occupied | Renter-occupied |
| Single Unit, Detached | 1 (4.0%) | 24 (96.0%) |
| Single Unit, Attached | 6 (100.0%) | 0 (0.0%) |
| 2 Unit Apartments | 0 (0.0%) | 0 (0.0%) |
| 3 or 4 Unit Apartments | 0 (0.0%) | 0 (0.0%) |
| 5 to 9 Unit Apartments | 0 (0.0%) | 0 (0.0%) |
| 10 or more Apartments | 0 (0.0%) | 0 (0.0%) |
| Mobile Home / Other | 3 (60.0%) | 2 (40.0%) |
| Total | 10 (27.8%) | 26 (72.2%) |
Housing Structures by Number of Rooms in Peaceful Village
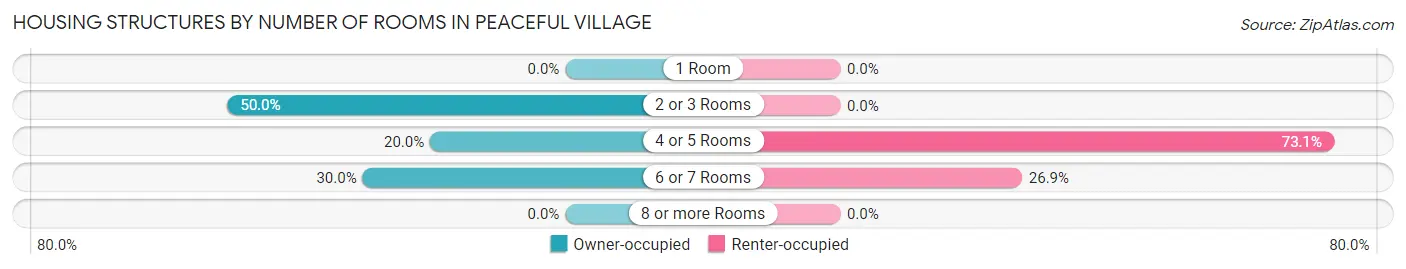
| Number of Rooms | Owner-occupied | Renter-occupied |
| 1 Room | 0 (0.0%) | 0 (0.0%) |
| 2 or 3 Rooms | 5 (50.0%) | 0 (0.0%) |
| 4 or 5 Rooms | 2 (20.0%) | 19 (73.1%) |
| 6 or 7 Rooms | 3 (30.0%) | 7 (26.9%) |
| 8 or more Rooms | 0 (0.0%) | 0 (0.0%) |
| Total | 10 (100.0%) | 26 (100.0%) |
Housing Structure by Heating Type in Peaceful Village
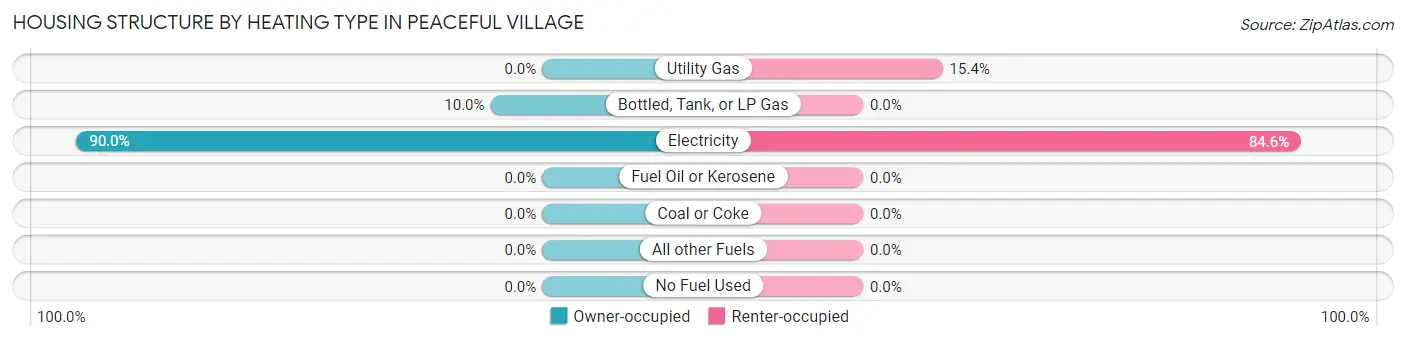
| Heating Type | Owner-occupied | Renter-occupied |
| Utility Gas | 0 (0.0%) | 4 (15.4%) |
| Bottled, Tank, or LP Gas | 1 (10.0%) | 0 (0.0%) |
| Electricity | 9 (90.0%) | 22 (84.6%) |
| Fuel Oil or Kerosene | 0 (0.0%) | 0 (0.0%) |
| Coal or Coke | 0 (0.0%) | 0 (0.0%) |
| All other Fuels | 0 (0.0%) | 0 (0.0%) |
| No Fuel Used | 0 (0.0%) | 0 (0.0%) |
| Total | 10 (100.0%) | 26 (100.0%) |
Household Vehicle Usage in Peaceful Village
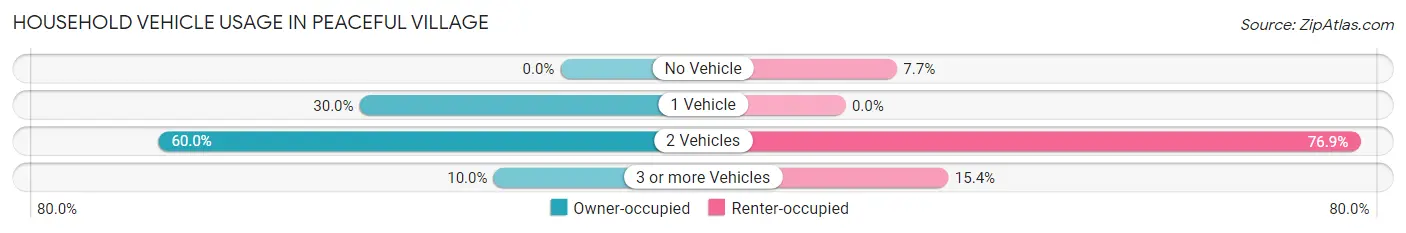
| Vehicles per Household | Owner-occupied | Renter-occupied |
| No Vehicle | 0 (0.0%) | 2 (7.7%) |
| 1 Vehicle | 3 (30.0%) | 0 (0.0%) |
| 2 Vehicles | 6 (60.0%) | 20 (76.9%) |
| 3 or more Vehicles | 1 (10.0%) | 4 (15.4%) |
| Total | 10 (100.0%) | 26 (100.0%) |
Real Estate & Mortgages in Peaceful Village
Real Estate and Mortgage Overview in Peaceful Village
| Characteristic | Without Mortgage | With Mortgage |
| Housing Units | 4 | 6 |
| Median Property Value | $9,999 | $233,300 |
| Median Household Income | $46,250 | $0 |
| Monthly Housing Costs | - | - |
| Real Estate Taxes | - | - |
Property Value by Mortgage Status in Peaceful Village
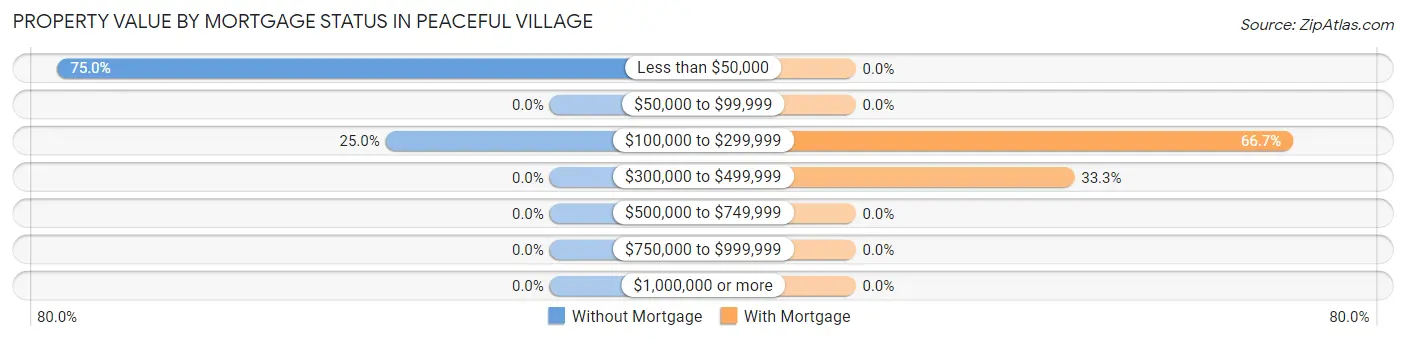
| Property Value | Without Mortgage | With Mortgage |
| Less than $50,000 | 3 (75.0%) | 0 (0.0%) |
| $50,000 to $99,999 | 0 (0.0%) | 0 (0.0%) |
| $100,000 to $299,999 | 1 (25.0%) | 4 (66.7%) |
| $300,000 to $499,999 | 0 (0.0%) | 2 (33.3%) |
| $500,000 to $749,999 | 0 (0.0%) | 0 (0.0%) |
| $750,000 to $999,999 | 0 (0.0%) | 0 (0.0%) |
| $1,000,000 or more | 0 (0.0%) | 0 (0.0%) |
| Total | 4 (100.0%) | 6 (100.0%) |
Household Income by Mortgage Status in Peaceful Village
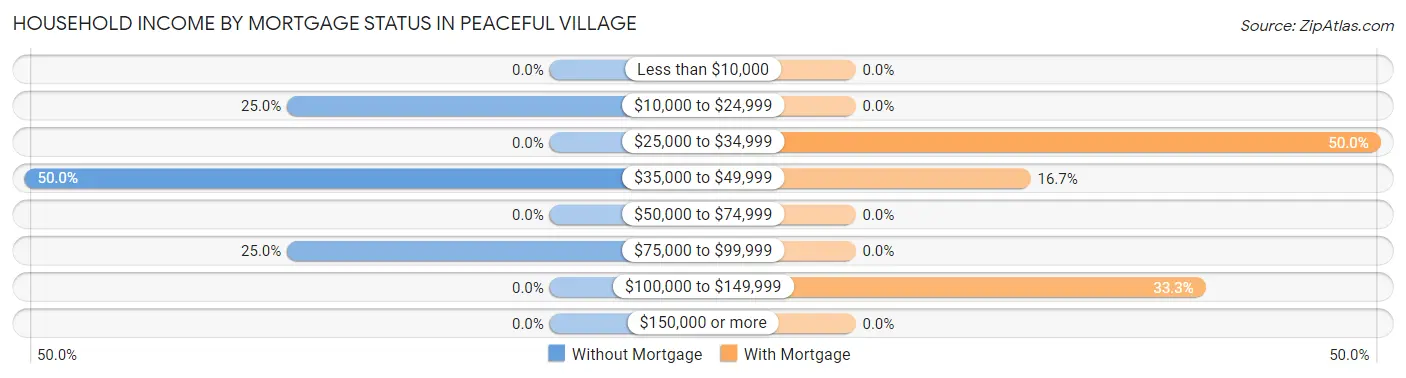
| Household Income | Without Mortgage | With Mortgage |
| Less than $10,000 | 0 (0.0%) | 0 (0.0%) |
| $10,000 to $24,999 | 1 (25.0%) | 0 (0.0%) |
| $25,000 to $34,999 | 0 (0.0%) | 3 (50.0%) |
| $35,000 to $49,999 | 2 (50.0%) | 1 (16.7%) |
| $50,000 to $74,999 | 0 (0.0%) | 0 (0.0%) |
| $75,000 to $99,999 | 1 (25.0%) | 0 (0.0%) |
| $100,000 to $149,999 | 0 (0.0%) | 2 (33.3%) |
| $150,000 or more | 0 (0.0%) | 0 (0.0%) |
| Total | 4 (100.0%) | 6 (100.0%) |
Property Value to Household Income Ratio in Peaceful Village
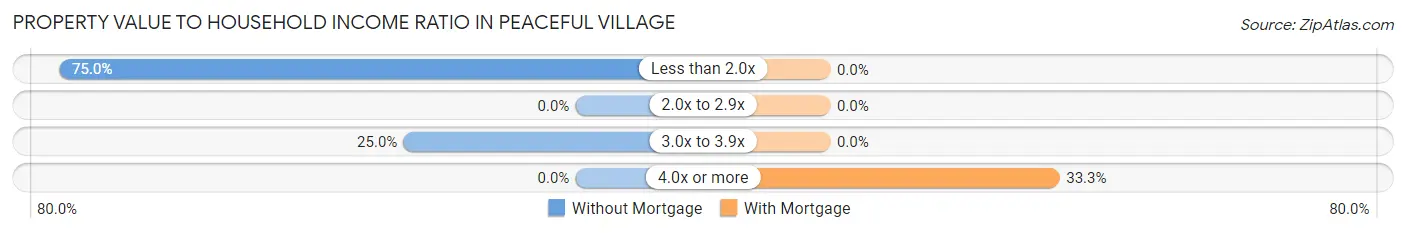
| Value-to-Income Ratio | Without Mortgage | With Mortgage |
| Less than 2.0x | 3 (75.0%) | 0 (0.0%) |
| 2.0x to 2.9x | 0 (0.0%) | 0 (0.0%) |
| 3.0x to 3.9x | 1 (25.0%) | 0 (0.0%) |
| 4.0x or more | 0 (0.0%) | 2 (33.3%) |
| Total | 4 (100.0%) | 6 (100.0%) |
Real Estate Taxes by Mortgage Status in Peaceful Village
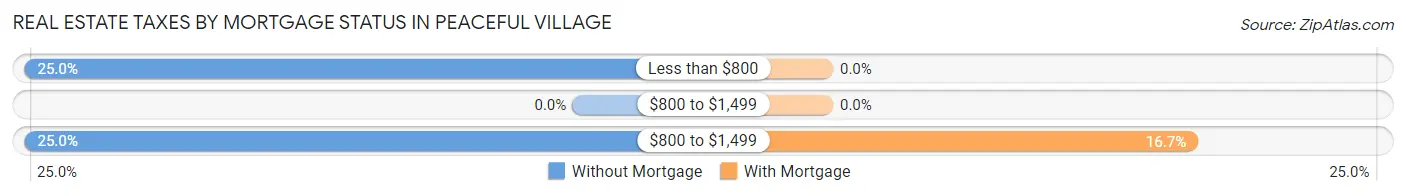
| Property Taxes | Without Mortgage | With Mortgage |
| Less than $800 | 1 (25.0%) | 0 (0.0%) |
| $800 to $1,499 | 0 (0.0%) | 0 (0.0%) |
| $800 to $1,499 | 1 (25.0%) | 1 (16.7%) |
| Total | 4 (100.0%) | 6 (100.0%) |
Health & Disability in Peaceful Village
Health Insurance Coverage by Age in Peaceful Village
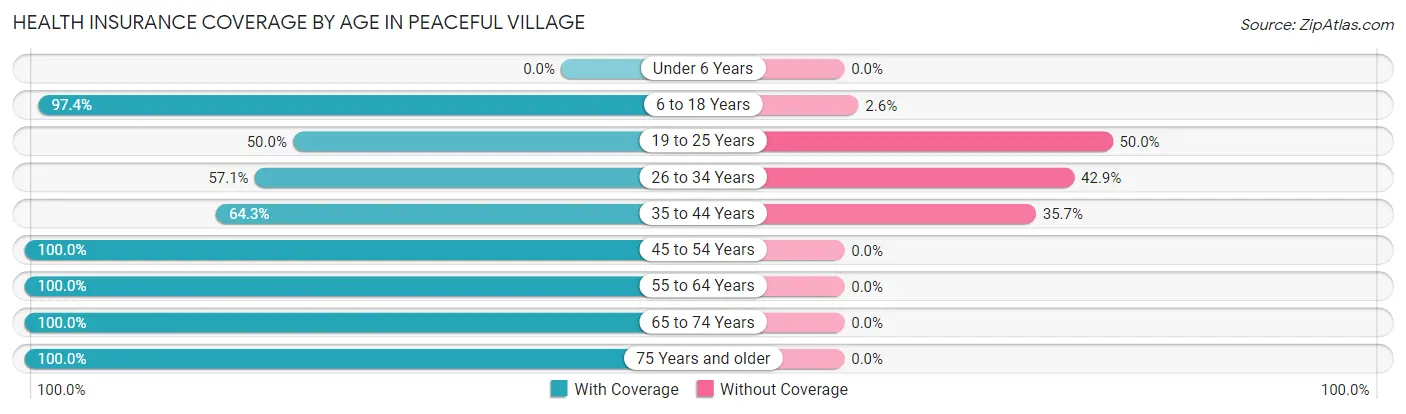
| Age Bracket | With Coverage | Without Coverage |
| Under 6 Years | 0 (0.0%) | 0 (0.0%) |
| 6 to 18 Years | 37 (97.4%) | 1 (2.6%) |
| 19 to 25 Years | 3 (50.0%) | 3 (50.0%) |
| 26 to 34 Years | 8 (57.1%) | 6 (42.9%) |
| 35 to 44 Years | 18 (64.3%) | 10 (35.7%) |
| 45 to 54 Years | 24 (100.0%) | 0 (0.0%) |
| 55 to 64 Years | 8 (100.0%) | 0 (0.0%) |
| 65 to 74 Years | 6 (100.0%) | 0 (0.0%) |
| 75 Years and older | 3 (100.0%) | 0 (0.0%) |
| Total | 107 (84.3%) | 20 (15.8%) |
Health Insurance Coverage by Citizenship Status in Peaceful Village
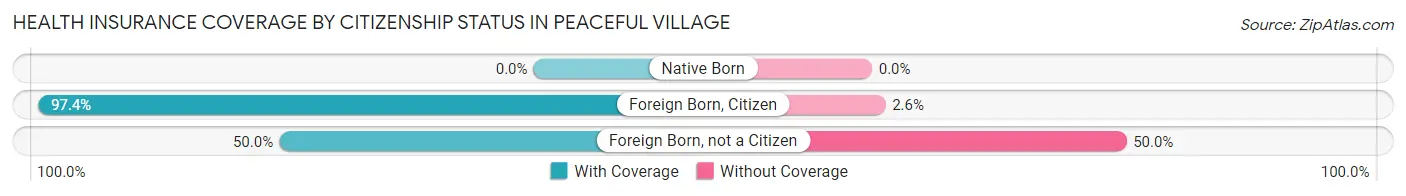
| Citizenship Status | With Coverage | Without Coverage |
| Native Born | 0 (0.0%) | 0 (0.0%) |
| Foreign Born, Citizen | 37 (97.4%) | 1 (2.6%) |
| Foreign Born, not a Citizen | 3 (50.0%) | 3 (50.0%) |
Health Insurance Coverage by Household Income in Peaceful Village
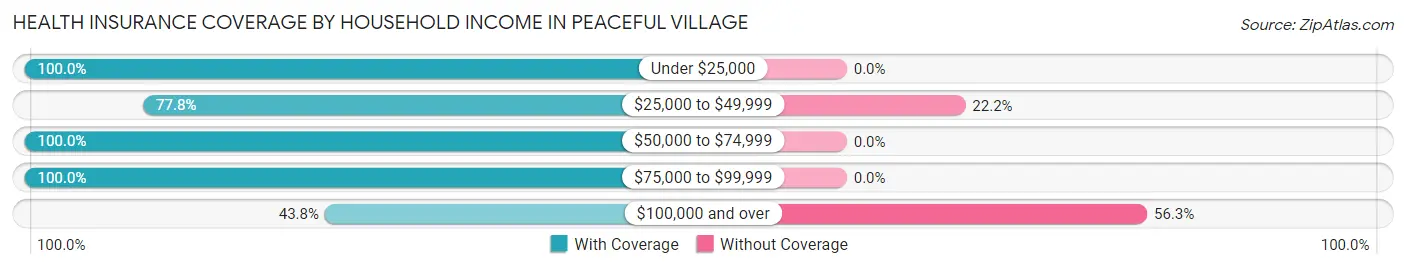
| Household Income | With Coverage | Without Coverage |
| Under $25,000 | 5 (100.0%) | 0 (0.0%) |
| $25,000 to $49,999 | 7 (77.8%) | 2 (22.2%) |
| $50,000 to $74,999 | 34 (100.0%) | 0 (0.0%) |
| $75,000 to $99,999 | 43 (100.0%) | 0 (0.0%) |
| $100,000 and over | 14 (43.8%) | 18 (56.2%) |
Public vs Private Health Insurance Coverage by Age in Peaceful Village
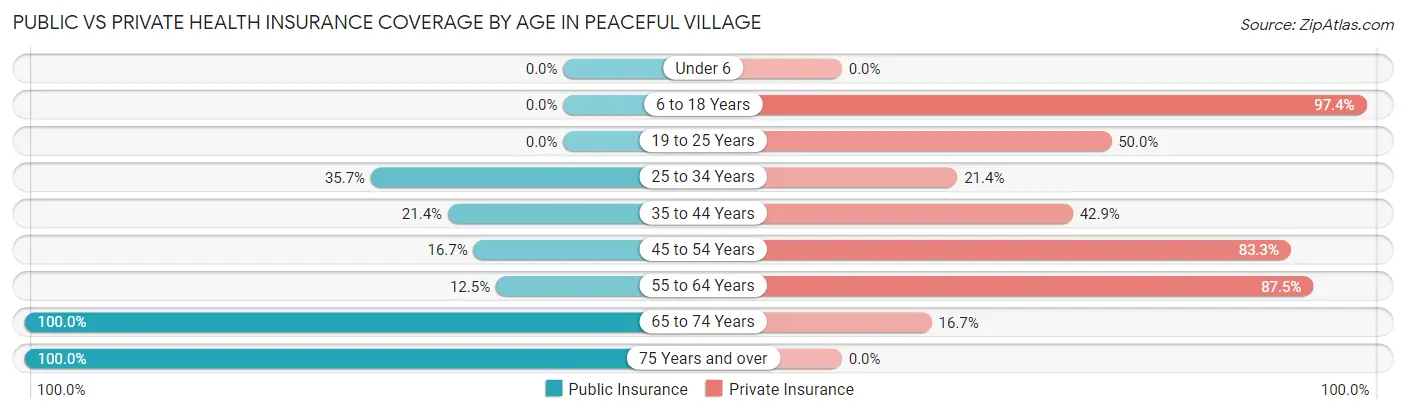
| Age Bracket | Public Insurance | Private Insurance |
| Under 6 | 0 (0.0%) | 0 (0.0%) |
| 6 to 18 Years | 0 (0.0%) | 37 (97.4%) |
| 19 to 25 Years | 0 (0.0%) | 3 (50.0%) |
| 25 to 34 Years | 5 (35.7%) | 3 (21.4%) |
| 35 to 44 Years | 6 (21.4%) | 12 (42.9%) |
| 45 to 54 Years | 4 (16.7%) | 20 (83.3%) |
| 55 to 64 Years | 1 (12.5%) | 7 (87.5%) |
| 65 to 74 Years | 6 (100.0%) | 1 (16.7%) |
| 75 Years and over | 3 (100.0%) | 0 (0.0%) |
| Total | 25 (19.7%) | 83 (65.3%) |
Disability Status by Sex by Age in Peaceful Village
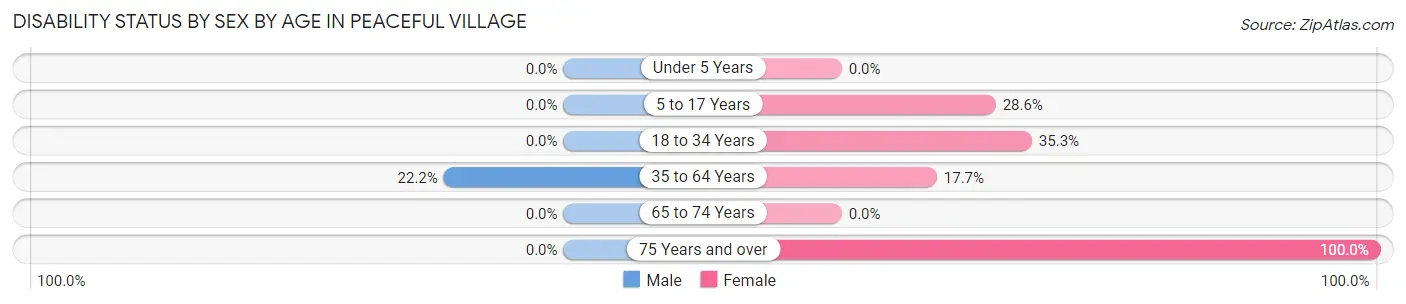
| Age Bracket | Male | Female |
| Under 5 Years | 0 (0.0%) | 0 (0.0%) |
| 5 to 17 Years | 0 (0.0%) | 4 (28.6%) |
| 18 to 34 Years | 0 (0.0%) | 6 (35.3%) |
| 35 to 64 Years | 2 (22.2%) | 9 (17.6%) |
| 65 to 74 Years | 0 (0.0%) | 0 (0.0%) |
| 75 Years and over | 0 (0.0%) | 3 (100.0%) |
Disability Class by Sex by Age in Peaceful Village
Disability Class: Hearing Difficulty
| Age Bracket | Male | Female |
| Under 5 Years | 0 (0.0%) | 0 (0.0%) |
| 5 to 17 Years | 0 (0.0%) | 0 (0.0%) |
| 18 to 34 Years | 0 (0.0%) | 0 (0.0%) |
| 35 to 64 Years | 0 (0.0%) | 0 (0.0%) |
| 65 to 74 Years | 0 (0.0%) | 0 (0.0%) |
| 75 Years and over | 0 (0.0%) | 0 (0.0%) |
Disability Class: Vision Difficulty
| Age Bracket | Male | Female |
| Under 5 Years | 0 (0.0%) | 0 (0.0%) |
| 5 to 17 Years | 0 (0.0%) | 0 (0.0%) |
| 18 to 34 Years | 0 (0.0%) | 0 (0.0%) |
| 35 to 64 Years | 0 (0.0%) | 0 (0.0%) |
| 65 to 74 Years | 0 (0.0%) | 0 (0.0%) |
| 75 Years and over | 0 (0.0%) | 0 (0.0%) |
Disability Class: Cognitive Difficulty
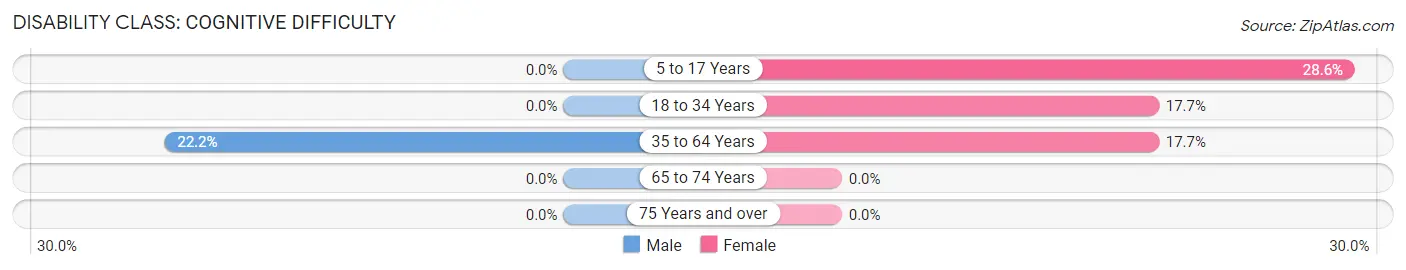
| Age Bracket | Male | Female |
| 5 to 17 Years | 0 (0.0%) | 4 (28.6%) |
| 18 to 34 Years | 0 (0.0%) | 3 (17.6%) |
| 35 to 64 Years | 2 (22.2%) | 9 (17.6%) |
| 65 to 74 Years | 0 (0.0%) | 0 (0.0%) |
| 75 Years and over | 0 (0.0%) | 0 (0.0%) |
Disability Class: Ambulatory Difficulty
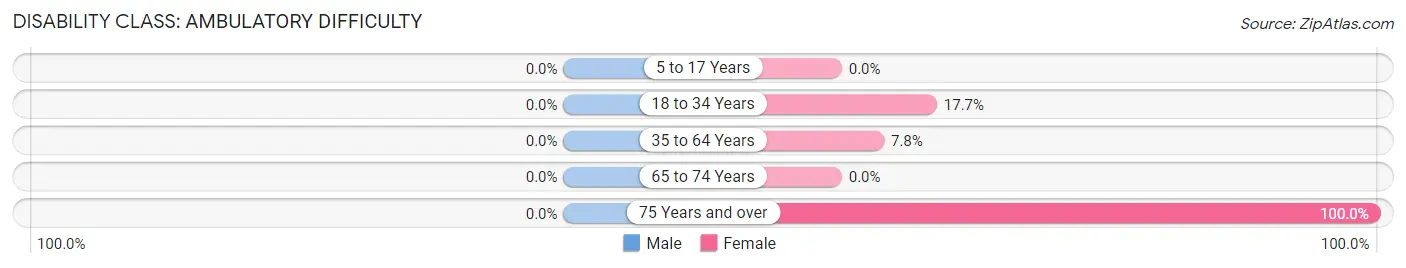
| Age Bracket | Male | Female |
| 5 to 17 Years | 0 (0.0%) | 0 (0.0%) |
| 18 to 34 Years | 0 (0.0%) | 3 (17.6%) |
| 35 to 64 Years | 0 (0.0%) | 4 (7.8%) |
| 65 to 74 Years | 0 (0.0%) | 0 (0.0%) |
| 75 Years and over | 0 (0.0%) | 3 (100.0%) |
Disability Class: Self-Care Difficulty
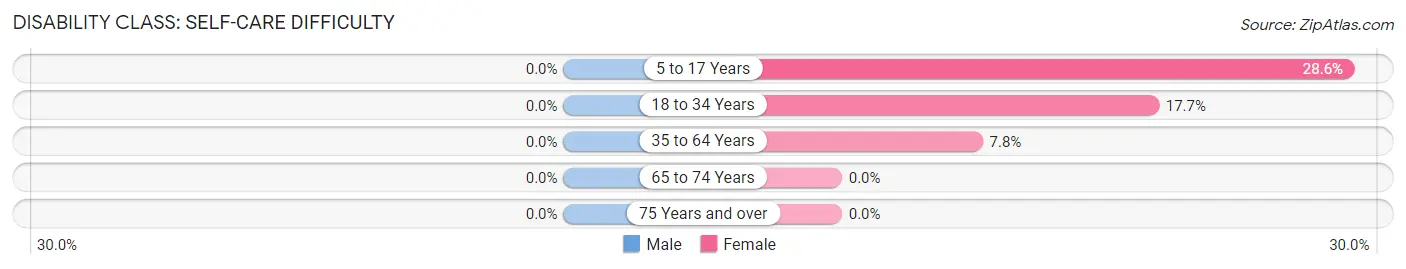
| Age Bracket | Male | Female |
| 5 to 17 Years | 0 (0.0%) | 4 (28.6%) |
| 18 to 34 Years | 0 (0.0%) | 3 (17.6%) |
| 35 to 64 Years | 0 (0.0%) | 4 (7.8%) |
| 65 to 74 Years | 0 (0.0%) | 0 (0.0%) |
| 75 Years and over | 0 (0.0%) | 0 (0.0%) |
Technology Access in Peaceful Village
Computing Device Access in Peaceful Village
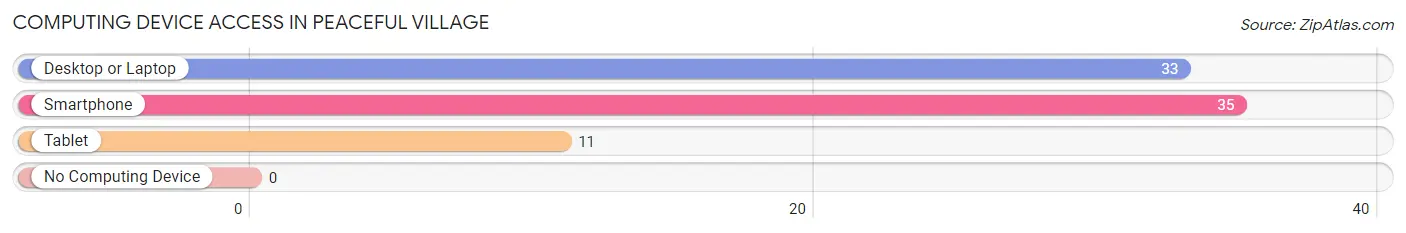
| Device Type | # Households | % Households |
| Desktop or Laptop | 33 | 91.7% |
| Smartphone | 35 | 97.2% |
| Tablet | 11 | 30.6% |
| No Computing Device | 0 | 0.0% |
| Total | 36 | 100.0% |
Internet Access in Peaceful Village
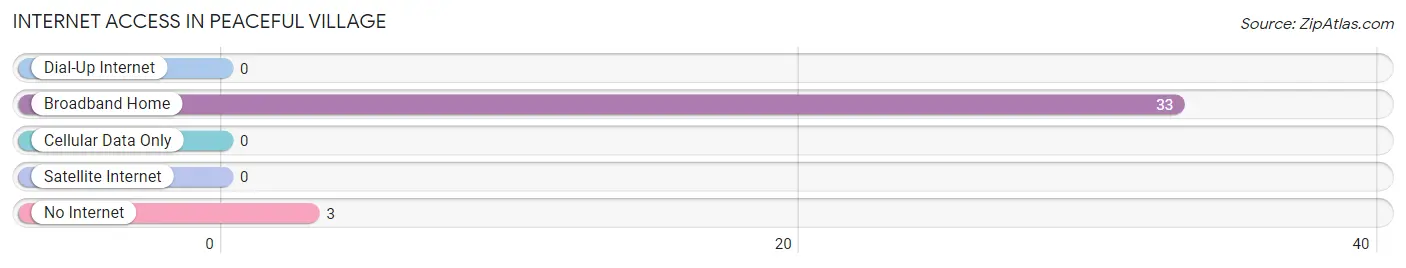
| Internet Type | # Households | % Households |
| Dial-Up Internet | 0 | 0.0% |
| Broadband Home | 33 | 91.7% |
| Cellular Data Only | 0 | 0.0% |
| Satellite Internet | 0 | 0.0% |
| No Internet | 3 | 8.3% |
| Total | 36 | 100.0% |
Peaceful Village Summary
Peaceful Village, MO is a small town located in the Ozark Mountains of Missouri. It is situated in the southeastern corner of the state, near the Arkansas border. The town has a population of approximately 1,500 people and is known for its rural charm and friendly atmosphere.
History
Peaceful Village was founded in 1845 by a group of settlers from Tennessee. The town was originally called “Peaceful Valley”, but the name was changed to “Peaceful Village” in 1851. The town was a popular stop for travelers on the Butterfield Overland Mail route, which ran from St. Louis to San Francisco.
The town was also a popular destination for settlers from the Ozark Mountains. Many of the original settlers were of German, Irish, and Scottish descent. The town was also home to a large number of African-American settlers, who were drawn to the area by the promise of land and freedom.
The town was an important stop on the Missouri-Pacific Railroad, which ran from St. Louis to Kansas City. The railroad brought new settlers to the area and helped to spur economic growth. The town was also home to a number of businesses, including a sawmill, a gristmill, and a blacksmith shop.
Geography
Peaceful Village is located in the Ozark Mountains of Missouri. The town is situated in the southeastern corner of the state, near the Arkansas border. The town is surrounded by rolling hills and lush forests. The town is located at the intersection of two major highways, US Route 65 and Missouri Route 76.
The town is located in the Ozark Plateau, which is characterized by steep hills and deep valleys. The town is located at an elevation of 1,000 feet above sea level. The climate in the area is temperate, with hot summers and cold winters.
Economy
The economy of Peaceful Village is largely based on agriculture and tourism. The town is home to a number of farms, which produce a variety of crops, including corn, soybeans, wheat, and hay. The town is also home to a number of small businesses, including restaurants, shops, and bed and breakfasts.
The town is also a popular destination for tourists, who come to enjoy the rural charm and natural beauty of the area. The town is home to a number of attractions, including a historic courthouse, a museum, and a number of parks and trails.
Demographics
As of the 2010 census, the population of Peaceful Village was 1,500. The town is predominantly white, with a small African-American population. The median household income in the town is $35,000, and the median age is 40. The town is home to a number of churches, including Baptist, Methodist, and Presbyterian.
Common Questions
What is Per Capita Income in Peaceful Village?
Per Capita income in Peaceful Village is $19,791.
What is the Median Family Income in Peaceful Village?
Median Family Income in Peaceful Village is $56,397.
What is the Median Household income in Peaceful Village?
Median Household Income in Peaceful Village is $56,324.
What is Inequality or Gini Index in Peaceful Village?
Inequality or Gini Index in Peaceful Village is 0.27.
What is the Total Population of Peaceful Village?
Total Population of Peaceful Village is 127.
What is the Total Male Population of Peaceful Village?
Total Male Population of Peaceful Village is 40.
What is the Total Female Population of Peaceful Village?
Total Female Population of Peaceful Village is 87.
What is the Ratio of Males per 100 Females in Peaceful Village?
There are 45.98 Males per 100 Females in Peaceful Village.
What is the Ratio of Females per 100 Males in Peaceful Village?
There are 217.50 Females per 100 Males in Peaceful Village.
What is the Median Population Age in Peaceful Village?
Median Population Age in Peaceful Village is 35.6 Years.
What is the Average Family Size in Peaceful Village
Average Family Size in Peaceful Village is 3.0 People.
What is the Average Household Size in Peaceful Village
Average Household Size in Peaceful Village is 3.4 People.
How Large is the Labor Force in Peaceful Village?
There are 51 People in the Labor Forcein in Peaceful Village.
What is the Percentage of People in the Labor Force in Peaceful Village?
47.2% of People are in the Labor Force in Peaceful Village.
What is the Unemployment Rate in Peaceful Village?
Unemployment Rate in Peaceful Village is 5.9%.