Taos, MO Map & Demographics
Taos Map
Taos Overview
$41,253
PER CAPITA INCOME
$119,712
AVG FAMILY INCOME
$101,354
AVG HOUSEHOLD INCOME
31.0%
WAGE / INCOME GAP [ % ]
69.0¢/ $1
WAGE / INCOME GAP [ $ ]
0.38
INEQUALITY / GINI INDEX
1,275
TOTAL POPULATION
664
MALE POPULATION
611
FEMALE POPULATION
108.67
MALES / 100 FEMALES
92.02
FEMALES / 100 MALES
46.1
MEDIAN AGE
3.4
AVG FAMILY SIZE
2.8
AVG HOUSEHOLD SIZE
623
LABOR FORCE [ PEOPLE ]
64.2%
PERCENT IN LABOR FORCE
1.3%
UNEMPLOYMENT RATE
Income in Taos
Income Overview in Taos
Per Capita Income in Taos is $41,253, while median incomes of families and households are $119,712 and $101,354 respectively.
| Characteristic | Number | Measure |
| Per Capita Income | 1,275 | $41,253 |
| Median Family Income | 334 | $119,712 |
| Mean Family Income | 334 | $123,465 |
| Median Household Income | 457 | $101,354 |
| Mean Household Income | 457 | $113,685 |
| Income Deficit | 334 | $0 |
| Wage / Income Gap (%) | 1,275 | 30.97% |
| Wage / Income Gap ($) | 1,275 | 69.03¢ per $1 |
| Gini / Inequality Index | 1,275 | 0.38 |
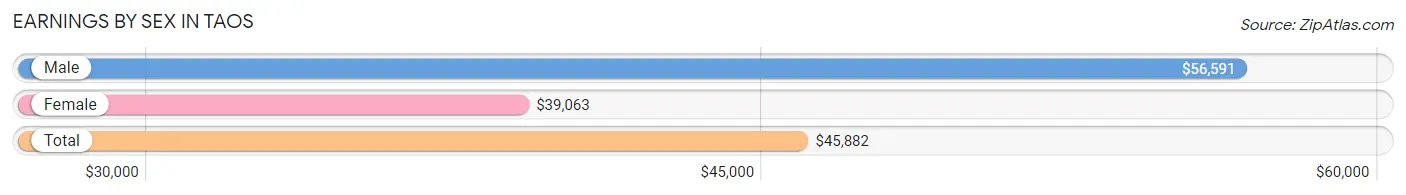
Earnings by Sex in Taos
Average Earnings in Taos are $45,882, $56,591 for men and $39,063 for women, a difference of 31.0%.
| Sex | Number | Average Earnings |
| Male | 316 (49.5%) | $56,591 |
| Female | 322 (50.5%) | $39,063 |
| Total | 638 (100.0%) | $45,882 |
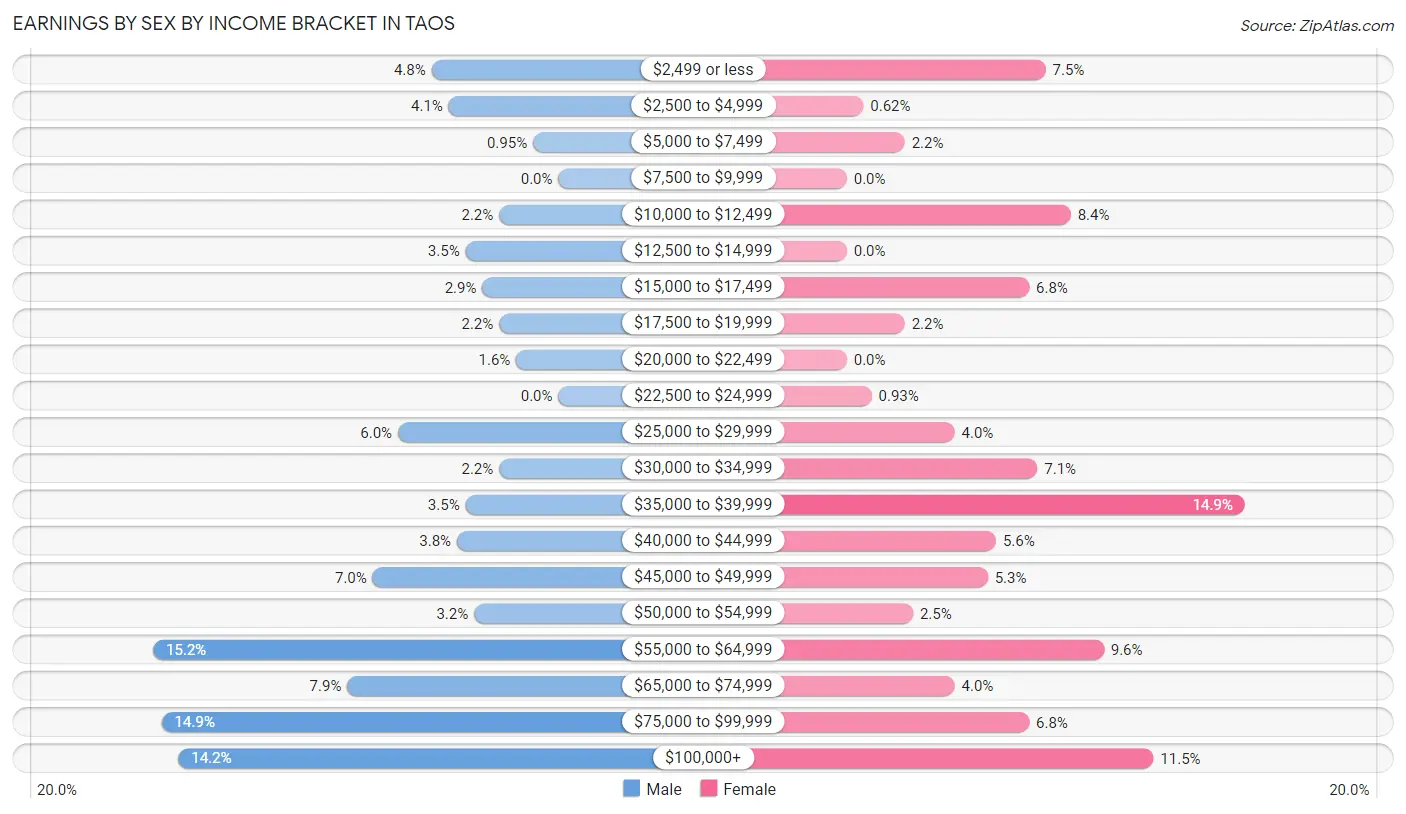
Earnings by Sex by Income Bracket in Taos
The most common earnings brackets in Taos are $55,000 to $64,999 for men (48 | 15.2%) and $35,000 to $39,999 for women (48 | 14.9%).
| Income | Male | Female |
| $2,499 or less | 15 (4.8%) | 24 (7.4%) |
| $2,500 to $4,999 | 13 (4.1%) | 2 (0.6%) |
| $5,000 to $7,499 | 3 (0.9%) | 7 (2.2%) |
| $7,500 to $9,999 | 0 (0.0%) | 0 (0.0%) |
| $10,000 to $12,499 | 7 (2.2%) | 27 (8.4%) |
| $12,500 to $14,999 | 11 (3.5%) | 0 (0.0%) |
| $15,000 to $17,499 | 9 (2.9%) | 22 (6.8%) |
| $17,500 to $19,999 | 7 (2.2%) | 7 (2.2%) |
| $20,000 to $22,499 | 5 (1.6%) | 0 (0.0%) |
| $22,500 to $24,999 | 0 (0.0%) | 3 (0.9%) |
| $25,000 to $29,999 | 19 (6.0%) | 13 (4.0%) |
| $30,000 to $34,999 | 7 (2.2%) | 23 (7.1%) |
| $35,000 to $39,999 | 11 (3.5%) | 48 (14.9%) |
| $40,000 to $44,999 | 12 (3.8%) | 18 (5.6%) |
| $45,000 to $49,999 | 22 (7.0%) | 17 (5.3%) |
| $50,000 to $54,999 | 10 (3.2%) | 8 (2.5%) |
| $55,000 to $64,999 | 48 (15.2%) | 31 (9.6%) |
| $65,000 to $74,999 | 25 (7.9%) | 13 (4.0%) |
| $75,000 to $99,999 | 47 (14.9%) | 22 (6.8%) |
| $100,000+ | 45 (14.2%) | 37 (11.5%) |
| Total | 316 (100.0%) | 322 (100.0%) |
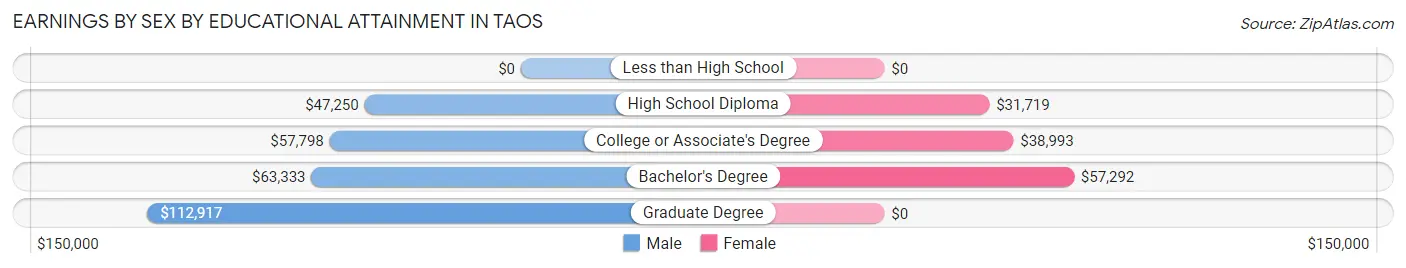
Earnings by Sex by Educational Attainment in Taos
Average earnings in Taos are $58,894 for men and $43,194 for women, a difference of 26.7%. Men with an educational attainment of graduate degree enjoy the highest average annual earnings of $112,917, while those with high school diploma education earn the least with $47,250. Women with an educational attainment of bachelor's degree earn the most with the average annual earnings of $57,292, while those with high school diploma education have the smallest earnings of $31,719.
| Educational Attainment | Male Income | Female Income |
| Less than High School | - | - |
| High School Diploma | $47,250 | $31,719 |
| College or Associate's Degree | $57,798 | $38,993 |
| Bachelor's Degree | $63,333 | $57,292 |
| Graduate Degree | $112,917 | $0 |
| Total | $58,894 | $43,194 |
Family Income in Taos
Family Income Brackets in Taos
According to the Taos family income data, there are 144 families falling into the $100,000 to $149,999 income range, which is the most common income bracket and makes up 43.1% of all families.
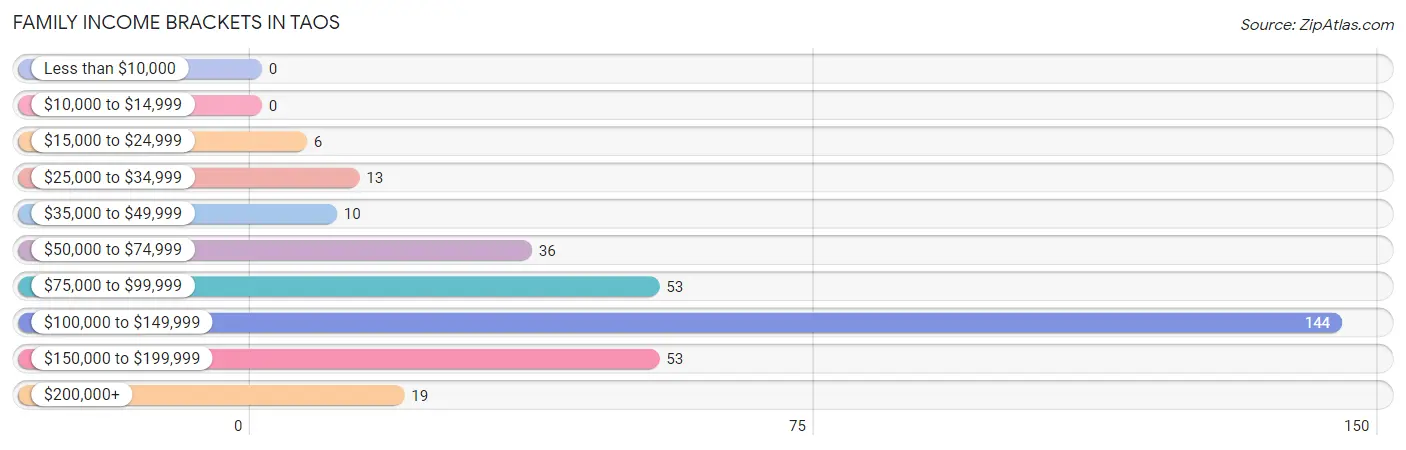
| Income Bracket | # Families | % Families |
| Less than $10,000 | 0 | 0.0% |
| $10,000 to $14,999 | 0 | 0.0% |
| $15,000 to $24,999 | 6 | 1.8% |
| $25,000 to $34,999 | 13 | 3.9% |
| $35,000 to $49,999 | 10 | 3.0% |
| $50,000 to $74,999 | 36 | 10.8% |
| $75,000 to $99,999 | 53 | 15.9% |
| $100,000 to $149,999 | 144 | 43.1% |
| $150,000 to $199,999 | 53 | 15.9% |
| $200,000+ | 19 | 5.7% |
Family Income by Famaliy Size in Taos
6-person families (19 | 5.7%) account for the highest median family income in Taos with $182,841 per family, while 2-person families (167 | 50.0%) have the highest median income of $55,938 per family member.
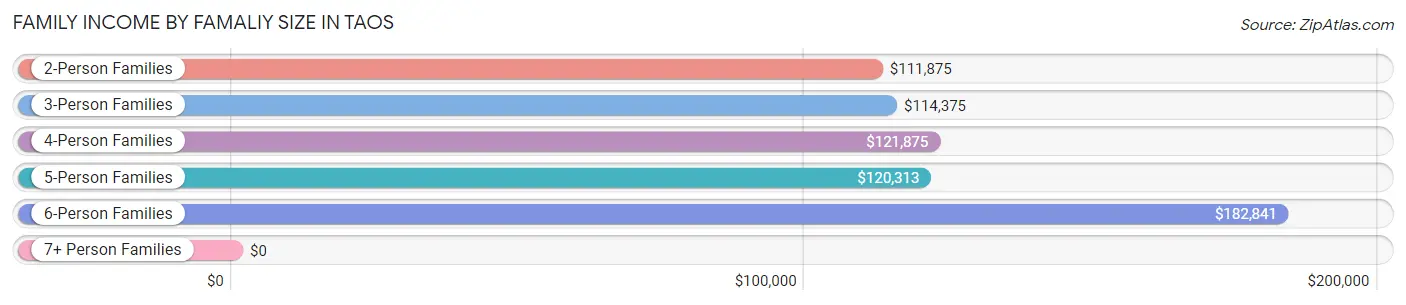
| Income Bracket | # Families | Median Income |
| 2-Person Families | 167 (50.0%) | $111,875 |
| 3-Person Families | 39 (11.7%) | $114,375 |
| 4-Person Families | 78 (23.4%) | $121,875 |
| 5-Person Families | 31 (9.3%) | $120,313 |
| 6-Person Families | 19 (5.7%) | $182,841 |
| 7+ Person Families | 0 (0.0%) | $0 |
| Total | 334 (100.0%) | $119,712 |
Family Income by Number of Earners in Taos
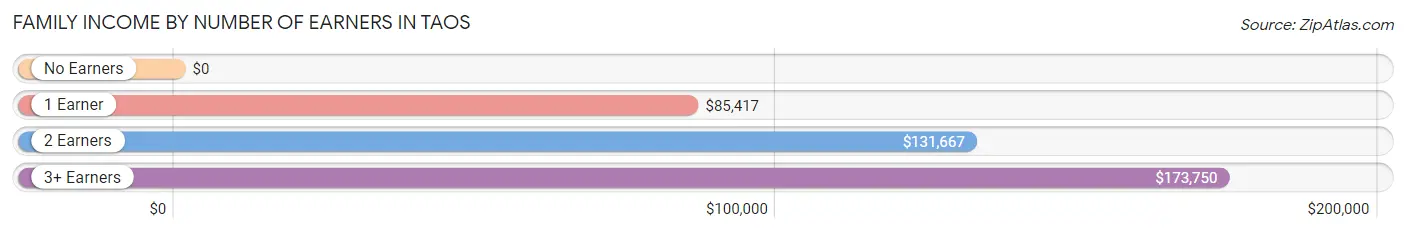
| Number of Earners | # Families | Median Income |
| No Earners | 44 (13.2%) | $0 |
| 1 Earner | 108 (32.3%) | $85,417 |
| 2 Earners | 130 (38.9%) | $131,667 |
| 3+ Earners | 52 (15.6%) | $173,750 |
| Total | 334 (100.0%) | $119,712 |
Household Income in Taos
Household Income Brackets in Taos
With 157 households falling in the category, the $100,000 to $149,999 income range is the most frequent in Taos, accounting for 34.4% of all households. In contrast, only 3 households (0.7%) fall into the less than $10,000 income bracket, making it the least populous group.
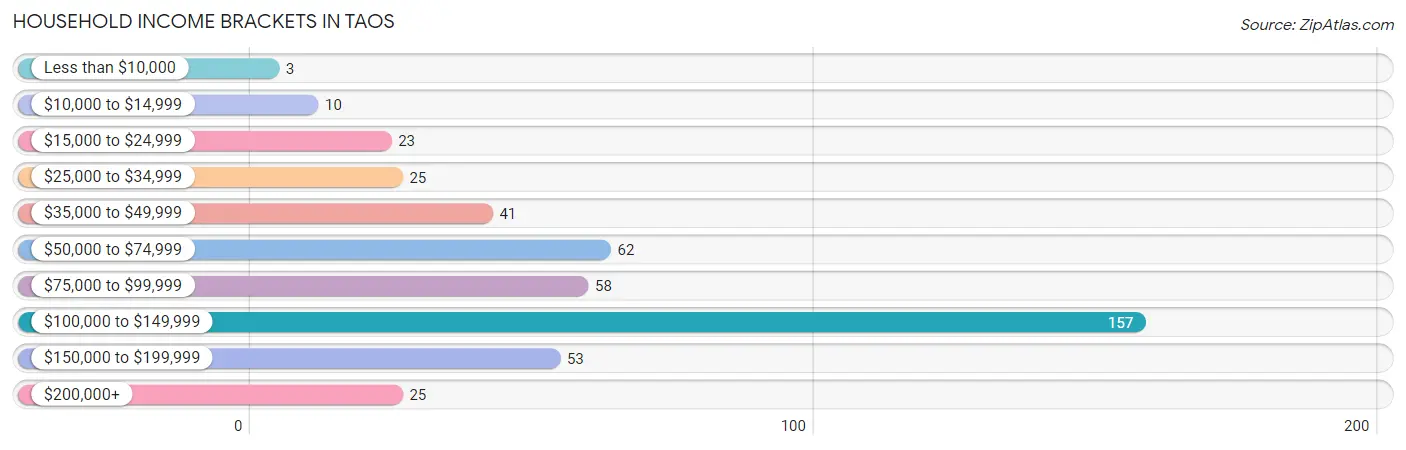
| Income Bracket | # Households | % Households |
| Less than $10,000 | 3 | 0.7% |
| $10,000 to $14,999 | 10 | 2.2% |
| $15,000 to $24,999 | 23 | 5.0% |
| $25,000 to $34,999 | 25 | 5.5% |
| $35,000 to $49,999 | 41 | 9.0% |
| $50,000 to $74,999 | 62 | 13.6% |
| $75,000 to $99,999 | 58 | 12.7% |
| $100,000 to $149,999 | 157 | 34.4% |
| $150,000 to $199,999 | 53 | 11.6% |
| $200,000+ | 25 | 5.5% |
Household Income by Householder Age in Taos
The median household income in Taos is $101,354, with the highest median household income of $120,909 found in the 25 to 44 years age bracket for the primary householder. A total of 86 households (18.8%) fall into this category.
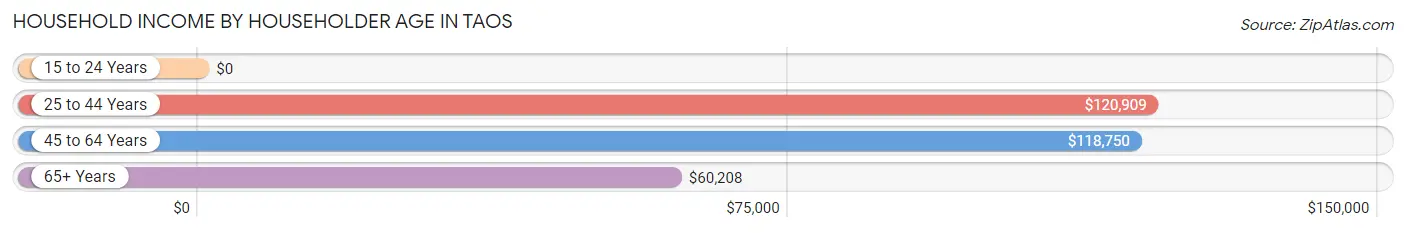
| Income Bracket | # Households | Median Income |
| 15 to 24 Years | 0 (0.0%) | $0 |
| 25 to 44 Years | 86 (18.8%) | $120,909 |
| 45 to 64 Years | 218 (47.7%) | $118,750 |
| 65+ Years | 153 (33.5%) | $60,208 |
| Total | 457 (100.0%) | $101,354 |
Poverty in Taos
Income Below Poverty by Sex and Age in Taos
With 4.2% poverty level for males and 3.4% for females among the residents of Taos, 15 year old males and 75 year old and over females are the most vulnerable to poverty, with 3 males (100.0%) and 7 females (14.3%) in their respective age groups living below the poverty level.
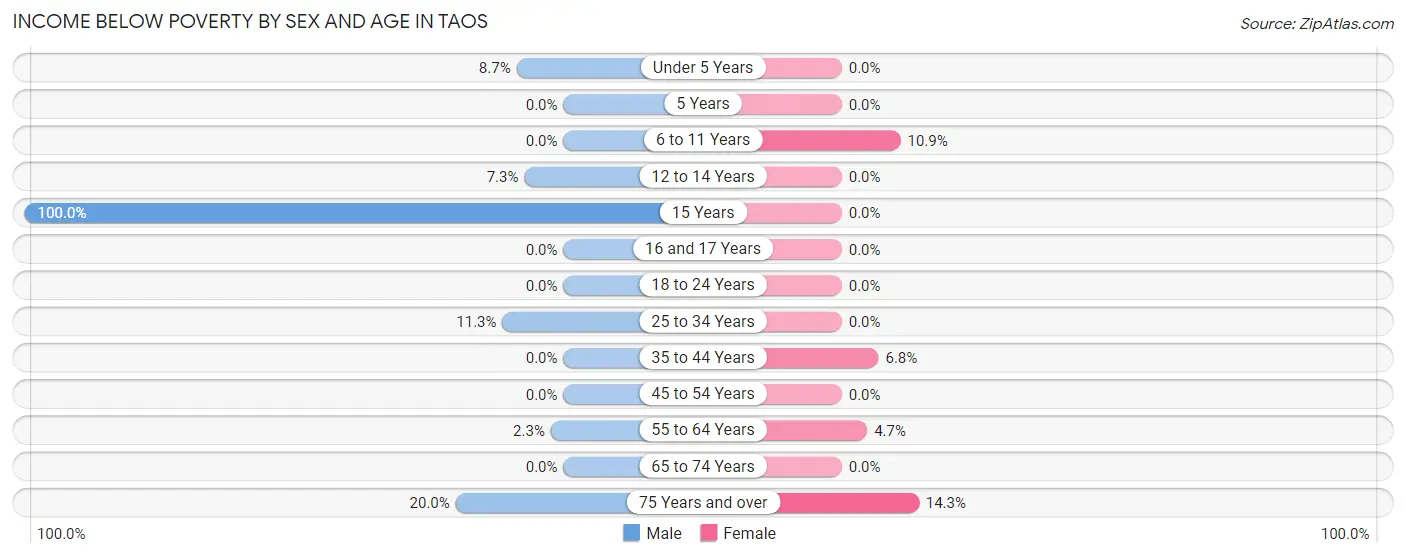
| Age Bracket | Male | Female |
| Under 5 Years | 4 (8.7%) | 0 (0.0%) |
| 5 Years | 0 (0.0%) | 0 (0.0%) |
| 6 to 11 Years | 0 (0.0%) | 6 (10.9%) |
| 12 to 14 Years | 5 (7.2%) | 0 (0.0%) |
| 15 Years | 3 (100.0%) | 0 (0.0%) |
| 16 and 17 Years | 0 (0.0%) | 0 (0.0%) |
| 18 to 24 Years | 0 (0.0%) | 0 (0.0%) |
| 25 to 34 Years | 6 (11.3%) | 0 (0.0%) |
| 35 to 44 Years | 0 (0.0%) | 3 (6.8%) |
| 45 to 54 Years | 0 (0.0%) | 0 (0.0%) |
| 55 to 64 Years | 3 (2.3%) | 5 (4.7%) |
| 65 to 74 Years | 0 (0.0%) | 0 (0.0%) |
| 75 Years and over | 7 (20.0%) | 7 (14.3%) |
| Total | 28 (4.2%) | 21 (3.4%) |
Income Above Poverty by Sex and Age in Taos
According to the poverty statistics in Taos, males aged 5 years and females aged under 5 years are the age groups that are most secure financially, with 100.0% of males and 100.0% of females in these age groups living above the poverty line.
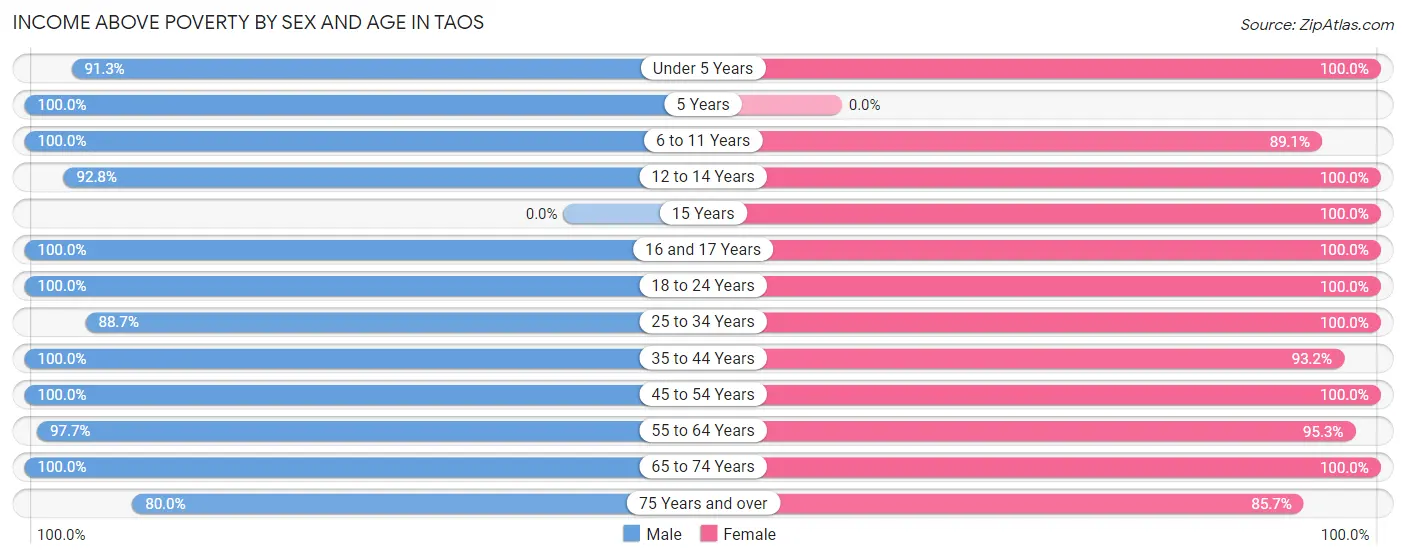
| Age Bracket | Male | Female |
| Under 5 Years | 42 (91.3%) | 36 (100.0%) |
| 5 Years | 6 (100.0%) | 0 (0.0%) |
| 6 to 11 Years | 63 (100.0%) | 49 (89.1%) |
| 12 to 14 Years | 64 (92.7%) | 14 (100.0%) |
| 15 Years | 0 (0.0%) | 13 (100.0%) |
| 16 and 17 Years | 28 (100.0%) | 11 (100.0%) |
| 18 to 24 Years | 42 (100.0%) | 45 (100.0%) |
| 25 to 34 Years | 47 (88.7%) | 70 (100.0%) |
| 35 to 44 Years | 28 (100.0%) | 41 (93.2%) |
| 45 to 54 Years | 83 (100.0%) | 100 (100.0%) |
| 55 to 64 Years | 125 (97.7%) | 101 (95.3%) |
| 65 to 74 Years | 80 (100.0%) | 68 (100.0%) |
| 75 Years and over | 28 (80.0%) | 42 (85.7%) |
| Total | 636 (95.8%) | 590 (96.6%) |
Income Below Poverty Among Married-Couple Families in Taos
The poverty statistics for married-couple families in Taos show that 1.0% or 3 of the total 300 families live below the poverty line. Families with no children have the highest poverty rate of 1.7%, comprising of 3 families. On the other hand, families with 1 or 2 children have the lowest poverty rate of 0.0%, which includes 0 families.
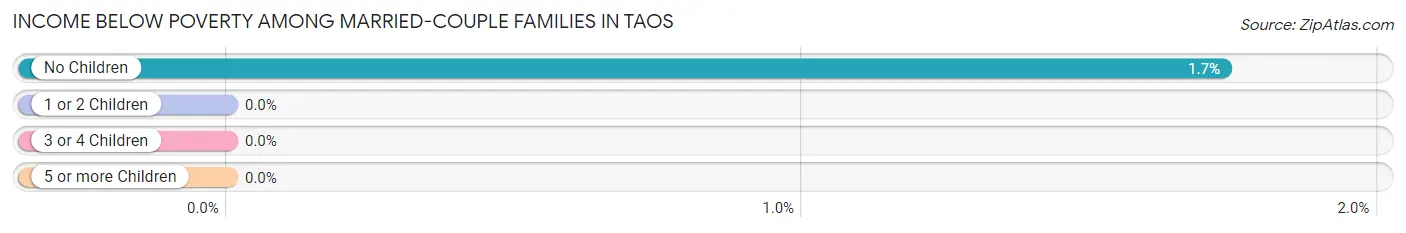
| Children | Above Poverty | Below Poverty |
| No Children | 170 (98.3%) | 3 (1.7%) |
| 1 or 2 Children | 102 (100.0%) | 0 (0.0%) |
| 3 or 4 Children | 25 (100.0%) | 0 (0.0%) |
| 5 or more Children | 0 (0.0%) | 0 (0.0%) |
| Total | 297 (99.0%) | 3 (1.0%) |
Income Below Poverty Among Single-Parent Households in Taos
According to the poverty data in Taos, 20.0% or 3 single-father households and 15.8% or 3 single-mother households are living below the poverty line. Among single-father households, those with 1 or 2 children have the highest poverty rate, with 3 households (30.0%) experiencing poverty. Likewise, among single-mother households, those with 3 or 4 children have the highest poverty rate, with 3 households (50.0%) falling below the poverty line.
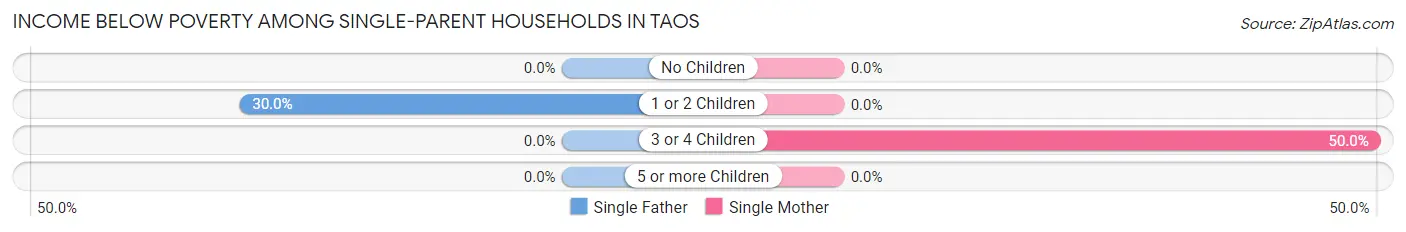
| Children | Single Father | Single Mother |
| No Children | 0 (0.0%) | 0 (0.0%) |
| 1 or 2 Children | 3 (30.0%) | 0 (0.0%) |
| 3 or 4 Children | 0 (0.0%) | 3 (50.0%) |
| 5 or more Children | 0 (0.0%) | 0 (0.0%) |
| Total | 3 (20.0%) | 3 (15.8%) |
Income Below Poverty Among Married-Couple vs Single-Parent Households in Taos
The poverty data for Taos shows that 3 of the married-couple family households (1.0%) and 6 of the single-parent households (17.6%) are living below the poverty level. Within the married-couple family households, those with no children have the highest poverty rate, with 3 households (1.7%) falling below the poverty line. Among the single-parent households, those with 3 or 4 children have the highest poverty rate, with 3 household (27.3%) living below poverty.
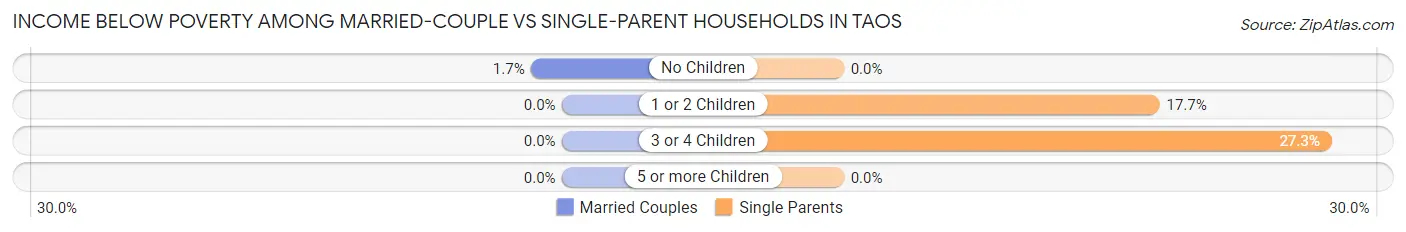
| Children | Married-Couple Families | Single-Parent Households |
| No Children | 3 (1.7%) | 0 (0.0%) |
| 1 or 2 Children | 0 (0.0%) | 3 (17.6%) |
| 3 or 4 Children | 0 (0.0%) | 3 (27.3%) |
| 5 or more Children | 0 (0.0%) | 0 (0.0%) |
| Total | 3 (1.0%) | 6 (17.6%) |
Race in Taos
The most populous races in Taos are White / Caucasian (1,221 | 95.8%), Two or more Races (54 | 4.2%), and Hispanic or Latino (39 | 3.1%).
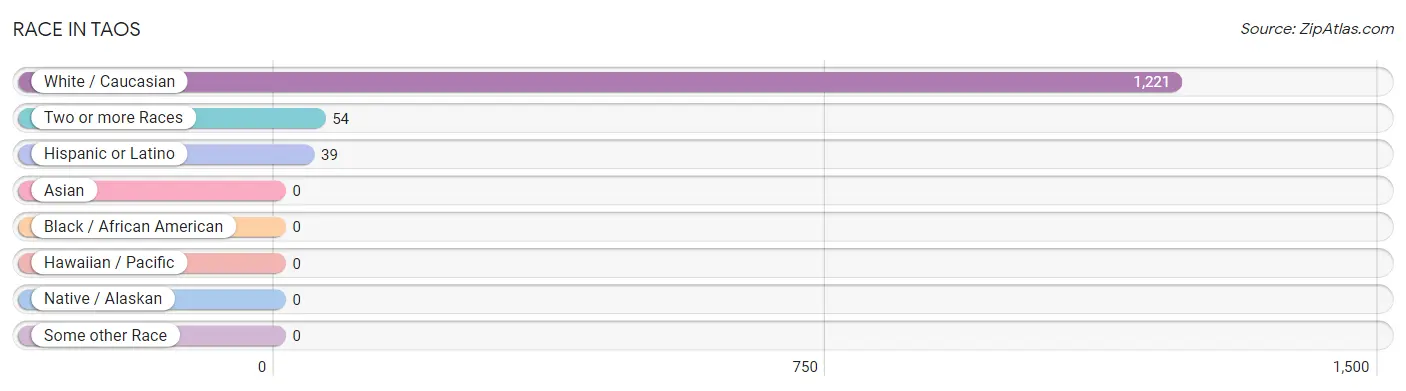
| Race | # Population | % Population |
| Asian | 0 | 0.0% |
| Black / African American | 0 | 0.0% |
| Hawaiian / Pacific | 0 | 0.0% |
| Hispanic or Latino | 39 | 3.1% |
| Native / Alaskan | 0 | 0.0% |
| White / Caucasian | 1,221 | 95.8% |
| Two or more Races | 54 | 4.2% |
| Some other Race | 0 | 0.0% |
| Total | 1,275 | 100.0% |
Ancestry in Taos
The most populous ancestries reported in Taos are German (555 | 43.5%), American (164 | 12.9%), Irish (45 | 3.5%), European (44 | 3.5%), and English (37 | 2.9%), together accounting for 66.3% of all Taos residents.
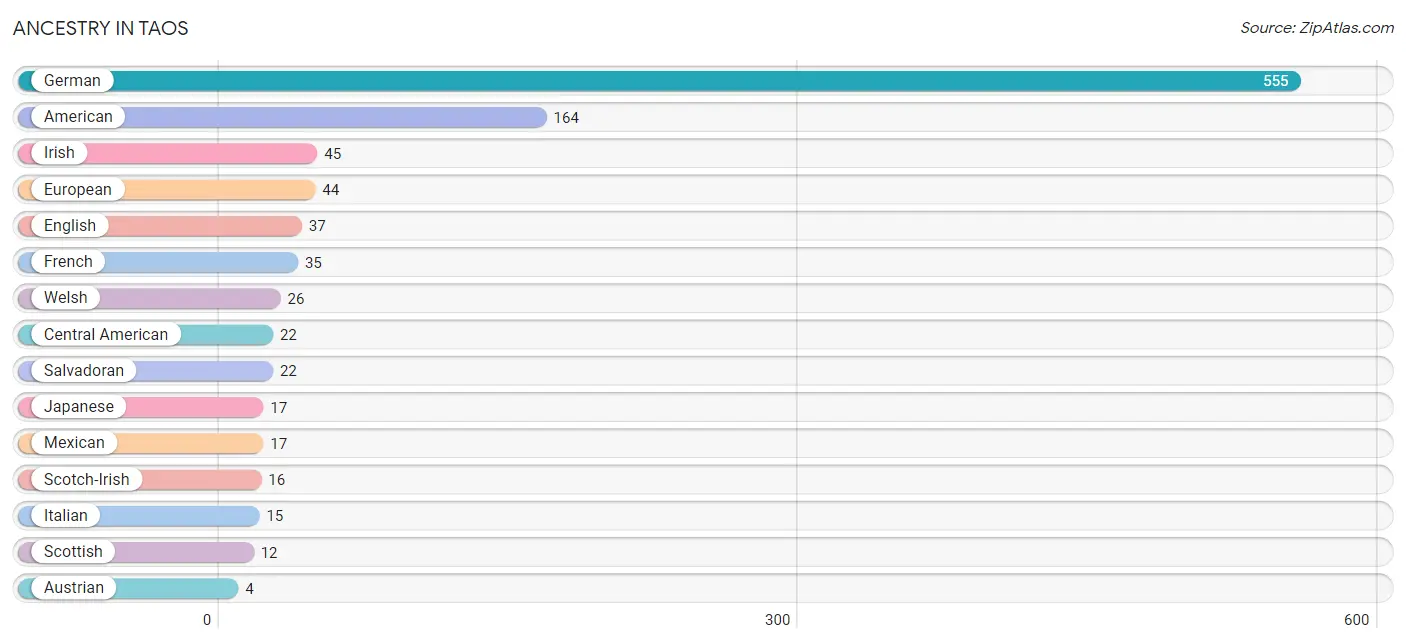
| Ancestry | # Population | % Population |
| American | 164 | 12.9% |
| Austrian | 4 | 0.3% |
| Central American | 22 | 1.7% |
| Dutch | 3 | 0.2% |
| English | 37 | 2.9% |
| European | 44 | 3.5% |
| Finnish | 3 | 0.2% |
| French | 35 | 2.8% |
| German | 555 | 43.5% |
| Irish | 45 | 3.5% |
| Italian | 15 | 1.2% |
| Japanese | 17 | 1.3% |
| Lithuanian | 3 | 0.2% |
| Mexican | 17 | 1.3% |
| Polish | 4 | 0.3% |
| Russian | 3 | 0.2% |
| Salvadoran | 22 | 1.7% |
| Scotch-Irish | 16 | 1.3% |
| Scottish | 12 | 0.9% |
| Swiss | 4 | 0.3% |
| Welsh | 26 | 2.0% | View All 21 Rows |
Immigrants in Taos
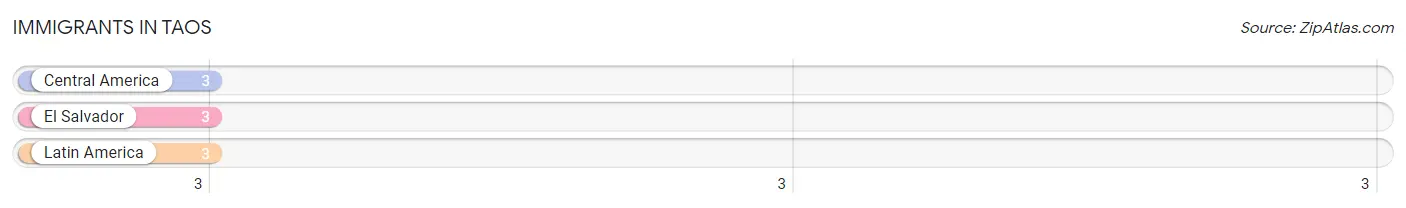
The most numerous immigrant groups reported in Taos came from Central America (3 | 0.2%), El Salvador (3 | 0.2%), and Latin America (3 | 0.2%), together accounting for 0.7% of all Taos residents.
| Immigration Origin | # Population | % Population |
| Central America | 3 | 0.2% |
| El Salvador | 3 | 0.2% |
| Latin America | 3 | 0.2% | View All 3 Rows |
Sex and Age in Taos
Sex and Age in Taos
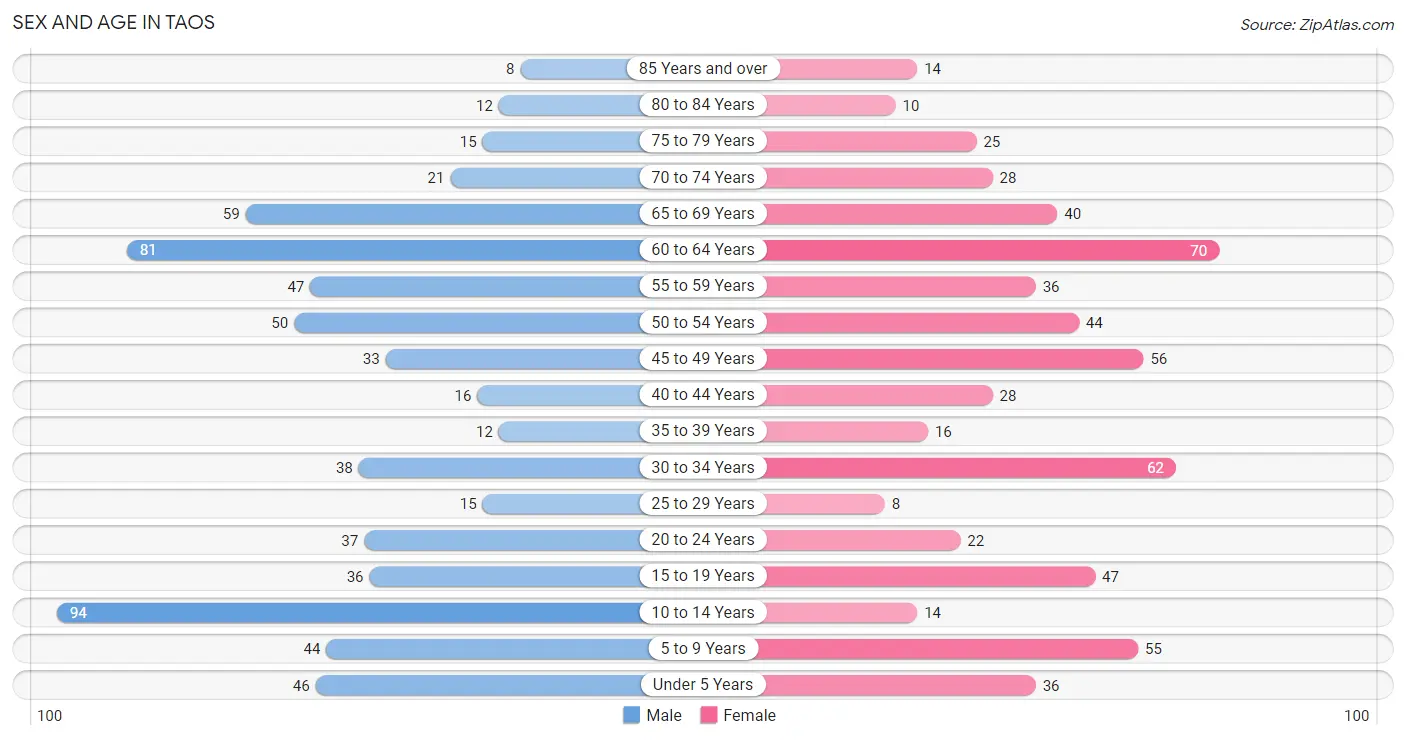
The most populous age groups in Taos are 10 to 14 Years (94 | 14.2%) for men and 60 to 64 Years (70 | 11.5%) for women.
| Age Bracket | Male | Female |
| Under 5 Years | 46 (6.9%) | 36 (5.9%) |
| 5 to 9 Years | 44 (6.6%) | 55 (9.0%) |
| 10 to 14 Years | 94 (14.2%) | 14 (2.3%) |
| 15 to 19 Years | 36 (5.4%) | 47 (7.7%) |
| 20 to 24 Years | 37 (5.6%) | 22 (3.6%) |
| 25 to 29 Years | 15 (2.3%) | 8 (1.3%) |
| 30 to 34 Years | 38 (5.7%) | 62 (10.2%) |
| 35 to 39 Years | 12 (1.8%) | 16 (2.6%) |
| 40 to 44 Years | 16 (2.4%) | 28 (4.6%) |
| 45 to 49 Years | 33 (5.0%) | 56 (9.2%) |
| 50 to 54 Years | 50 (7.5%) | 44 (7.2%) |
| 55 to 59 Years | 47 (7.1%) | 36 (5.9%) |
| 60 to 64 Years | 81 (12.2%) | 70 (11.5%) |
| 65 to 69 Years | 59 (8.9%) | 40 (6.6%) |
| 70 to 74 Years | 21 (3.2%) | 28 (4.6%) |
| 75 to 79 Years | 15 (2.3%) | 25 (4.1%) |
| 80 to 84 Years | 12 (1.8%) | 10 (1.6%) |
| 85 Years and over | 8 (1.2%) | 14 (2.3%) |
| Total | 664 (100.0%) | 611 (100.0%) |
Families and Households in Taos
Median Family Size in Taos
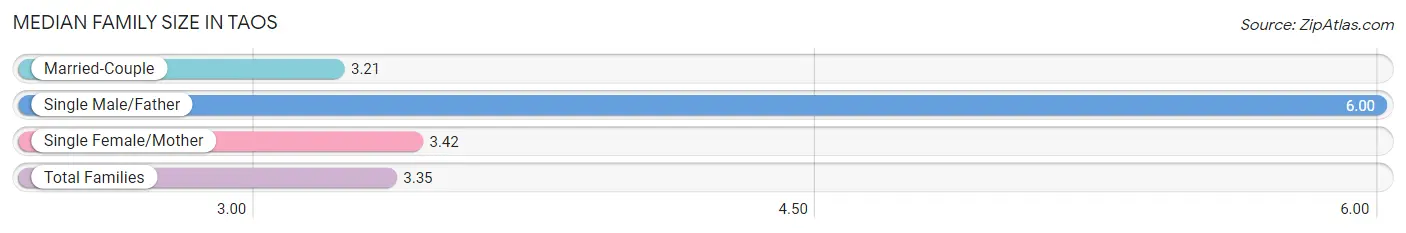
The median family size in Taos is 3.35 persons per family, with single male/father families (15 | 4.5%) accounting for the largest median family size of 6 persons per family. On the other hand, married-couple families (300 | 89.8%) represent the smallest median family size with 3.21 persons per family.
| Family Type | # Families | Family Size |
| Married-Couple | 300 (89.8%) | 3.21 |
| Single Male/Father | 15 (4.5%) | 6.00 |
| Single Female/Mother | 19 (5.7%) | 3.42 |
| Total Families | 334 (100.0%) | 3.35 |
Median Household Size in Taos
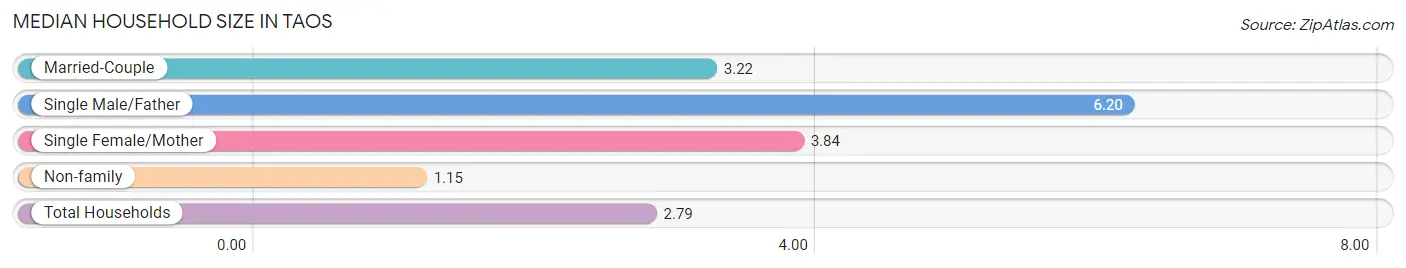
The median household size in Taos is 2.79 persons per household, with single male/father households (15 | 3.3%) accounting for the largest median household size of 6.2 persons per household. non-family households (123 | 26.9%) represent the smallest median household size with 1.15 persons per household.
| Household Type | # Households | Household Size |
| Married-Couple | 300 (65.6%) | 3.22 |
| Single Male/Father | 15 (3.3%) | 6.20 |
| Single Female/Mother | 19 (4.2%) | 3.84 |
| Non-family | 123 (26.9%) | 1.15 |
| Total Households | 457 (100.0%) | 2.79 |
Household Size by Marriage Status in Taos
Out of a total of 457 households in Taos, 334 (73.1%) are family households, while 123 (26.9%) are nonfamily households. The most numerous type of family households are 2-person households, comprising 159, and the most common type of nonfamily households are 1-person households, comprising 103.
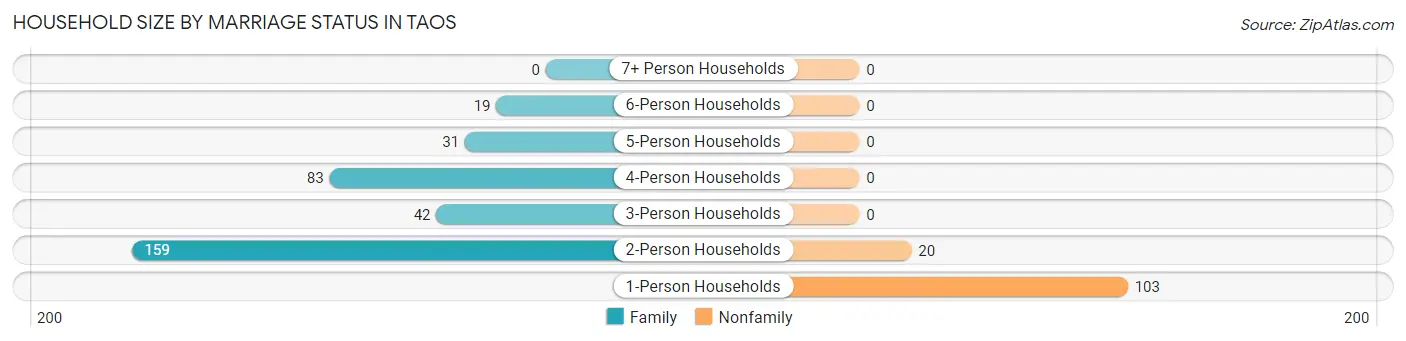
| Household Size | Family Households | Nonfamily Households |
| 1-Person Households | - | 103 (22.5%) |
| 2-Person Households | 159 (34.8%) | 20 (4.4%) |
| 3-Person Households | 42 (9.2%) | 0 (0.0%) |
| 4-Person Households | 83 (18.2%) | 0 (0.0%) |
| 5-Person Households | 31 (6.8%) | 0 (0.0%) |
| 6-Person Households | 19 (4.2%) | 0 (0.0%) |
| 7+ Person Households | 0 (0.0%) | 0 (0.0%) |
| Total | 334 (73.1%) | 123 (26.9%) |
Female Fertility in Taos
Fertility by Age in Taos
Average fertility rate in Taos is 16.0 births per 1,000 women. Women in the age bracket of 35 to 50 years have the highest fertility rate with 38.0 births per 1,000 women. Women in the age bracket of 35 to 50 years acount for 100.0% of all women with births.
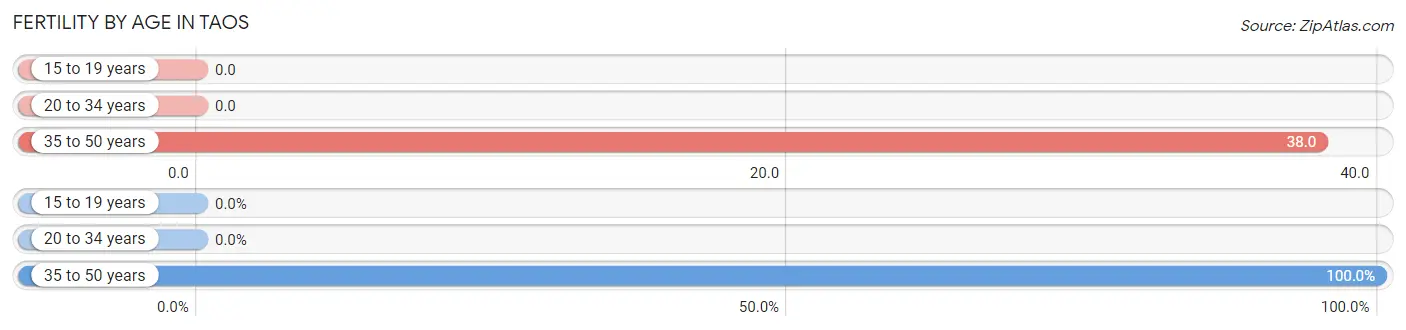
| Age Bracket | Women with Births | Births / 1,000 Women |
| 15 to 19 years | 0 (0.0%) | 0.0 |
| 20 to 34 years | 0 (0.0%) | 0.0 |
| 35 to 50 years | 4 (100.0%) | 38.0 |
| Total | 4 (100.0%) | 16.0 |
Fertility by Age by Marriage Status in Taos
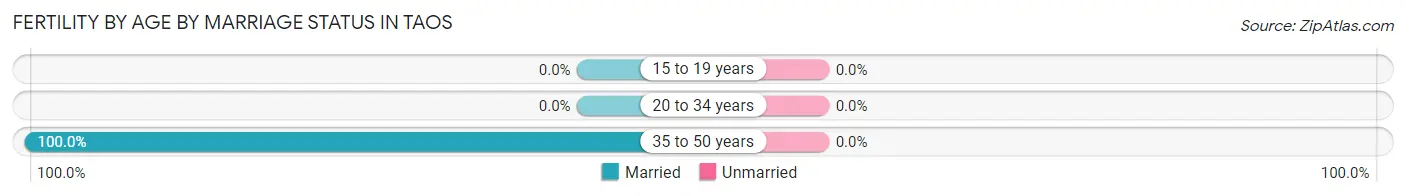
| Age Bracket | Married | Unmarried |
| 15 to 19 years | 0 (0.0%) | 0 (0.0%) |
| 20 to 34 years | 0 (0.0%) | 0 (0.0%) |
| 35 to 50 years | 4 (100.0%) | 0 (0.0%) |
| Total | 4 (100.0%) | 0 (0.0%) |
Fertility by Education in Taos
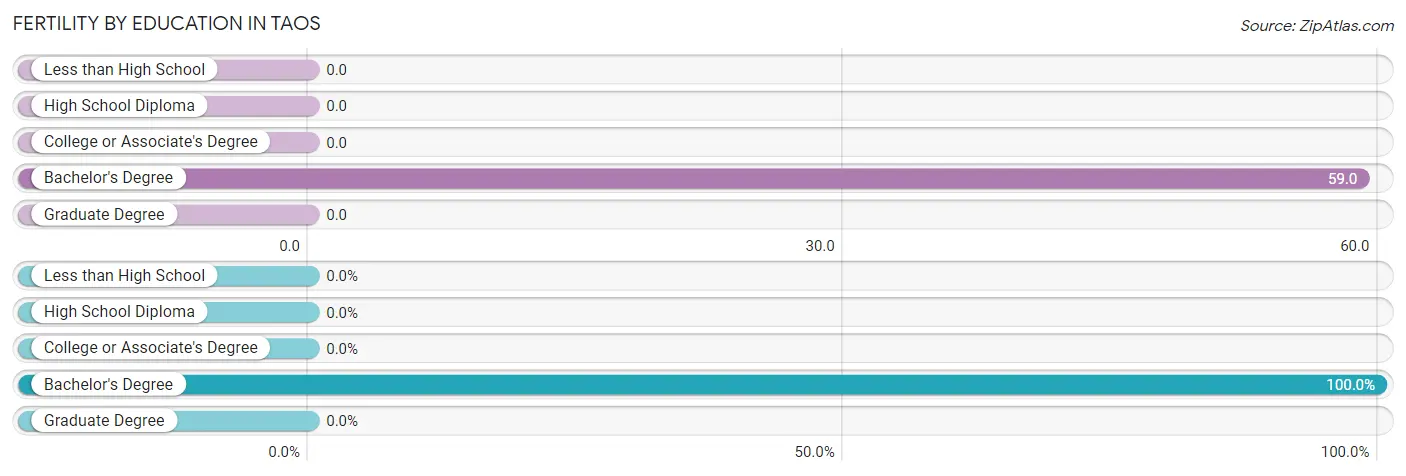
| Educational Attainment | Women with Births | Births / 1,000 Women |
| Less than High School | 0 (0.0%) | 0.0 |
| High School Diploma | 0 (0.0%) | 0.0 |
| College or Associate's Degree | 0 (0.0%) | 0.0 |
| Bachelor's Degree | 4 (100.0%) | 59.0 |
| Graduate Degree | 0 (0.0%) | 0.0 |
| Total | 4 (100.0%) | 16.0 |
Fertility by Education by Marriage Status in Taos
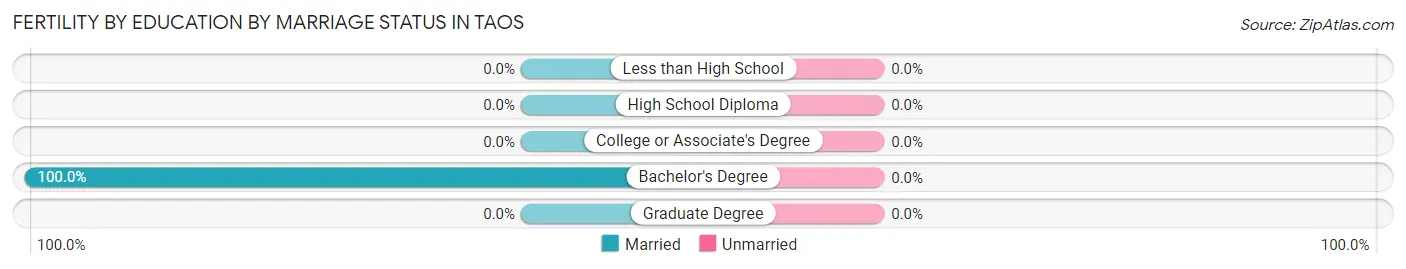
| Educational Attainment | Married | Unmarried |
| Less than High School | 0 (0.0%) | 0 (0.0%) |
| High School Diploma | 0 (0.0%) | 0 (0.0%) |
| College or Associate's Degree | 0 (0.0%) | 0 (0.0%) |
| Bachelor's Degree | 4 (100.0%) | 0 (0.0%) |
| Graduate Degree | 0 (0.0%) | 0 (0.0%) |
| Total | 4 (100.0%) | 0 (0.0%) |
Employment Characteristics in Taos
Employment by Class of Employer in Taos
Among the 598 employed individuals in Taos, private company employees (329 | 55.0%), state government employees (141 | 23.6%), and not-for-profit organizations (46 | 7.7%) make up the most common classes of employment.
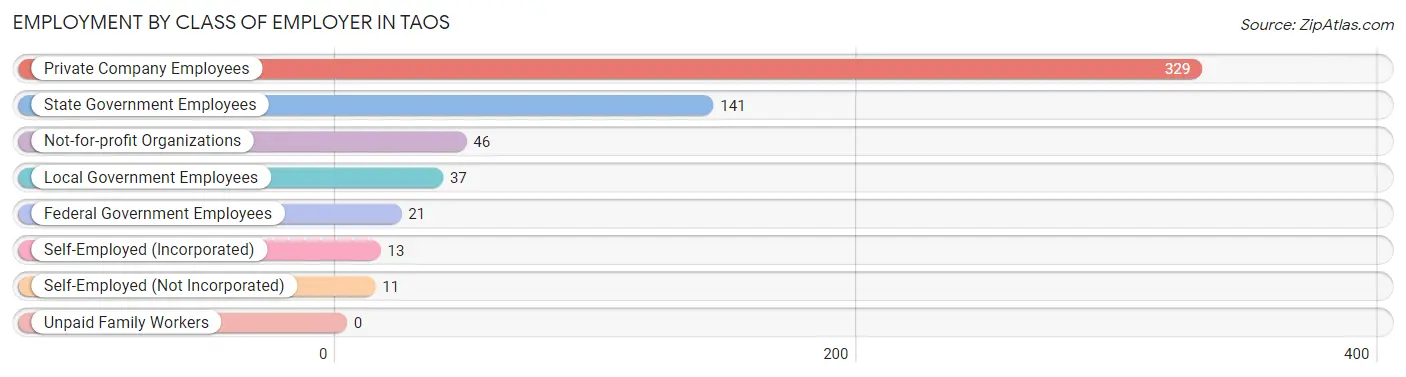
| Employer Class | # Employees | % Employees |
| Private Company Employees | 329 | 55.0% |
| Self-Employed (Incorporated) | 13 | 2.2% |
| Self-Employed (Not Incorporated) | 11 | 1.8% |
| Not-for-profit Organizations | 46 | 7.7% |
| Local Government Employees | 37 | 6.2% |
| State Government Employees | 141 | 23.6% |
| Federal Government Employees | 21 | 3.5% |
| Unpaid Family Workers | 0 | 0.0% |
| Total | 598 | 100.0% |
Employment Status by Age in Taos
According to the labor force statistics for Taos, out of the total population over 16 years of age (970), 64.2% or 623 individuals are in the labor force, with 1.3% or 8 of them unemployed. The age group with the highest labor force participation rate is 25 to 29 years, with 100.0% or 23 individuals in the labor force. Within the labor force, the 20 to 24 years age range has the highest percentage of unemployed individuals, with 8.7% or 4 of them being unemployed.
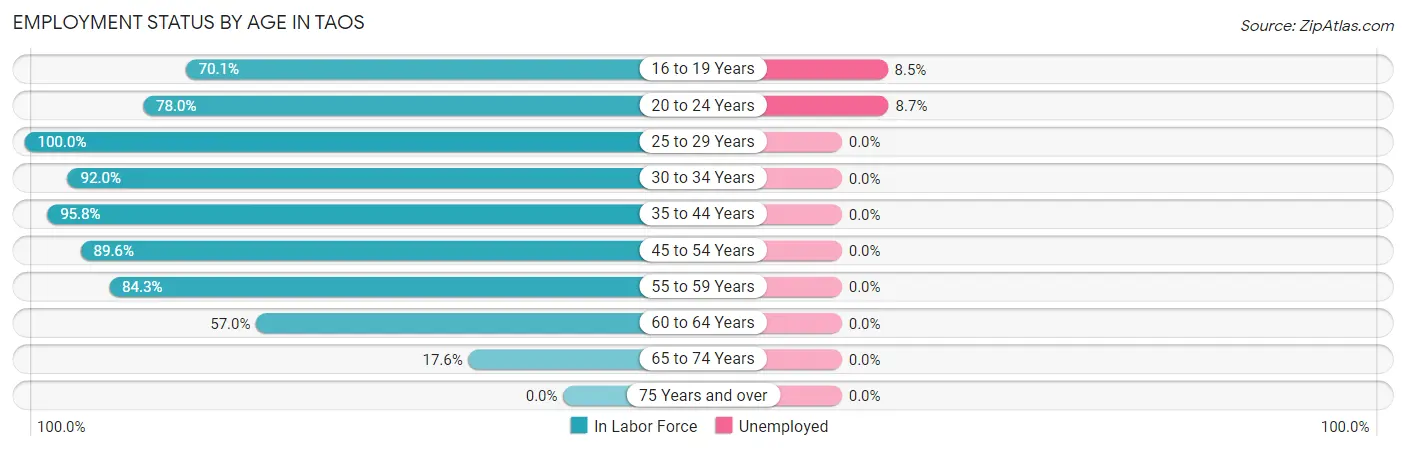
| Age Bracket | In Labor Force | Unemployed |
| 16 to 19 Years | 47 (70.1%) | 4 (8.5%) |
| 20 to 24 Years | 46 (78.0%) | 4 (8.7%) |
| 25 to 29 Years | 23 (100.0%) | 0 (0.0%) |
| 30 to 34 Years | 92 (92.0%) | 0 (0.0%) |
| 35 to 44 Years | 69 (95.8%) | 0 (0.0%) |
| 45 to 54 Years | 164 (89.6%) | 0 (0.0%) |
| 55 to 59 Years | 70 (84.3%) | 0 (0.0%) |
| 60 to 64 Years | 86 (57.0%) | 0 (0.0%) |
| 65 to 74 Years | 26 (17.6%) | 0 (0.0%) |
| 75 Years and over | 0 (0.0%) | 0 (0.0%) |
| Total | 623 (64.2%) | 8 (1.3%) |
Employment Status by Educational Attainment in Taos
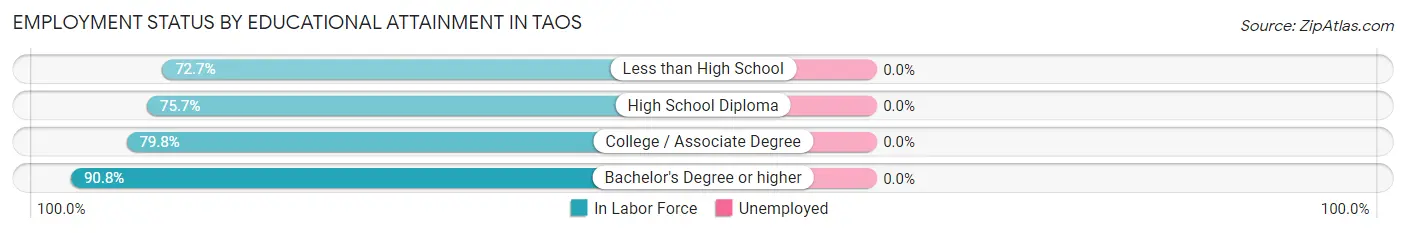
| Educational Attainment | In Labor Force | Unemployed |
| Less than High School | 16 (72.7%) | 0 (0.0%) |
| High School Diploma | 128 (75.7%) | 0 (0.0%) |
| College / Associate Degree | 162 (79.8%) | 0 (0.0%) |
| Bachelor's Degree or higher | 198 (90.8%) | 0 (0.0%) |
| Total | 504 (82.4%) | 0 (0.0%) |
Employment Occupations by Sex in Taos
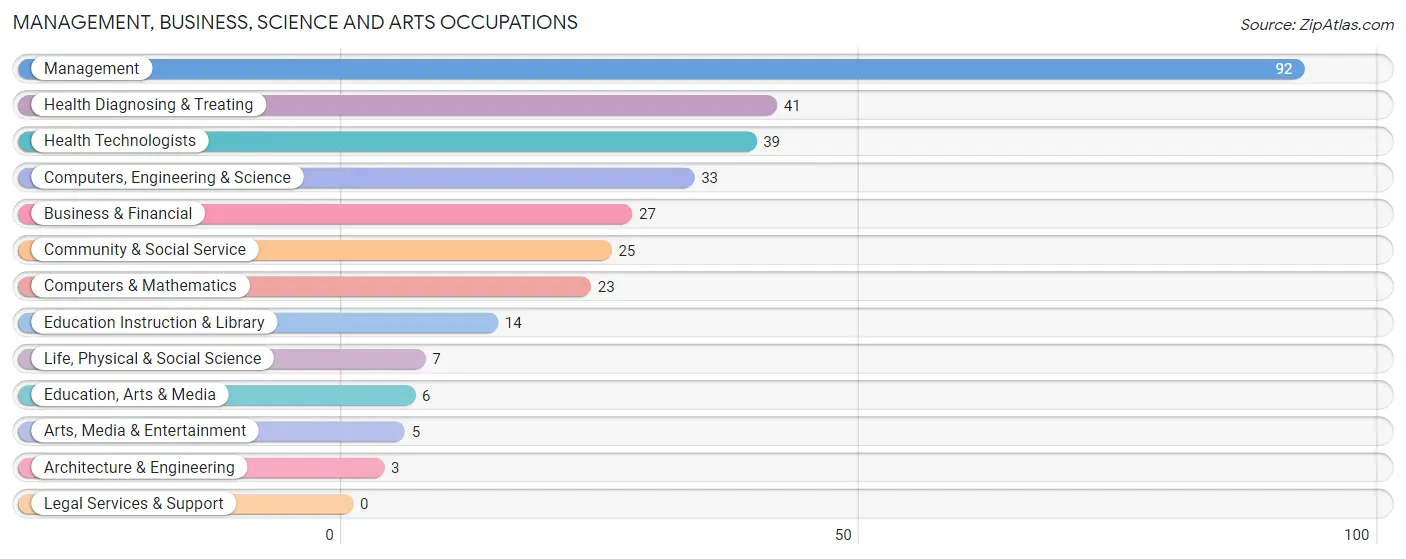
Management, Business, Science and Arts Occupations
The most common Management, Business, Science and Arts occupations in Taos are Management (92 | 15.0%), Health Diagnosing & Treating (41 | 6.7%), Health Technologists (39 | 6.3%), Computers, Engineering & Science (33 | 5.4%), and Business & Financial (27 | 4.4%).
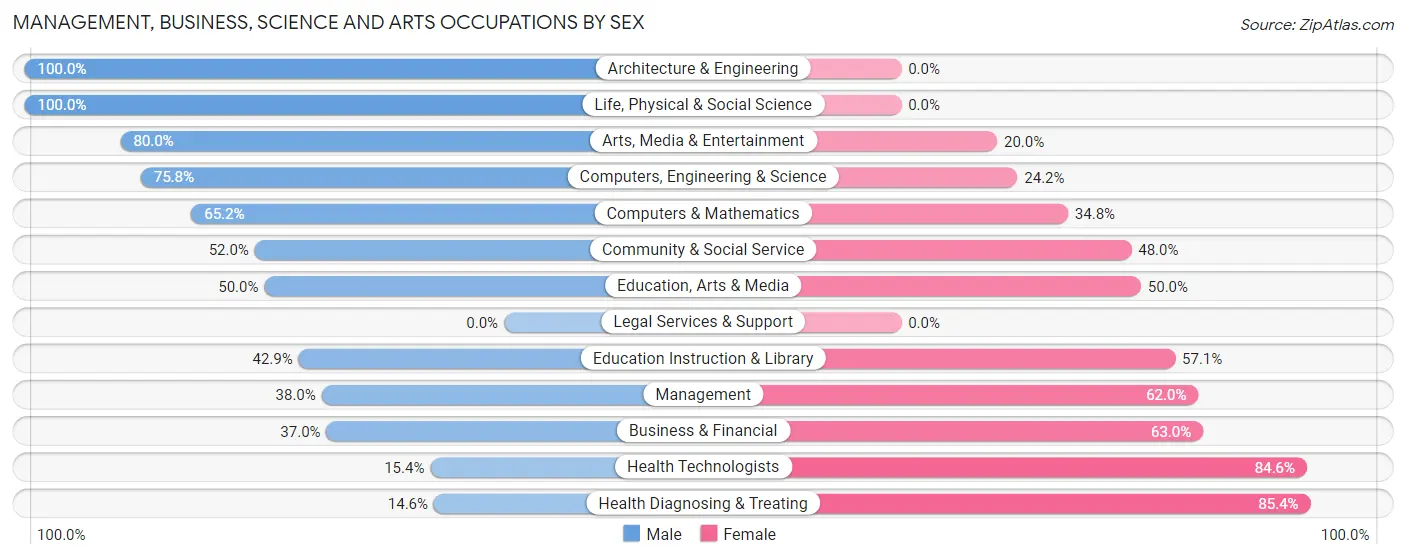
Management, Business, Science and Arts Occupations by Sex
Within the Management, Business, Science and Arts occupations in Taos, the most male-oriented occupations are Architecture & Engineering (100.0%), Life, Physical & Social Science (100.0%), and Arts, Media & Entertainment (80.0%), while the most female-oriented occupations are Health Diagnosing & Treating (85.4%), Health Technologists (84.6%), and Business & Financial (63.0%).
| Occupation | Male | Female |
| Management | 35 (38.0%) | 57 (62.0%) |
| Business & Financial | 10 (37.0%) | 17 (63.0%) |
| Computers, Engineering & Science | 25 (75.8%) | 8 (24.2%) |
| Computers & Mathematics | 15 (65.2%) | 8 (34.8%) |
| Architecture & Engineering | 3 (100.0%) | 0 (0.0%) |
| Life, Physical & Social Science | 7 (100.0%) | 0 (0.0%) |
| Community & Social Service | 13 (52.0%) | 12 (48.0%) |
| Education, Arts & Media | 3 (50.0%) | 3 (50.0%) |
| Legal Services & Support | 0 (0.0%) | 0 (0.0%) |
| Education Instruction & Library | 6 (42.9%) | 8 (57.1%) |
| Arts, Media & Entertainment | 4 (80.0%) | 1 (20.0%) |
| Health Diagnosing & Treating | 6 (14.6%) | 35 (85.4%) |
| Health Technologists | 6 (15.4%) | 33 (84.6%) |
| Total (Category) | 89 (40.8%) | 129 (59.2%) |
| Total (Overall) | 302 (49.1%) | 313 (50.9%) |
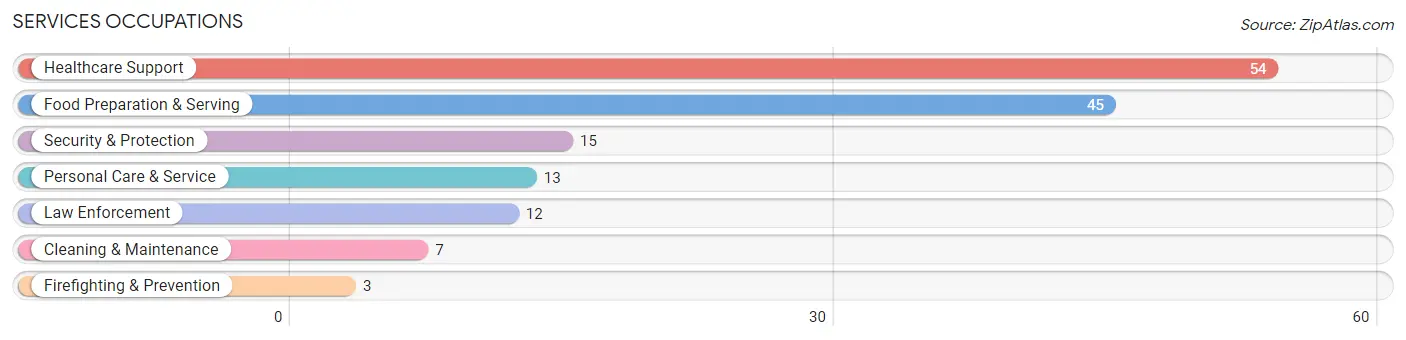
Services Occupations
The most common Services occupations in Taos are Healthcare Support (54 | 8.8%), Food Preparation & Serving (45 | 7.3%), Security & Protection (15 | 2.4%), Personal Care & Service (13 | 2.1%), and Law Enforcement (12 | 1.9%).
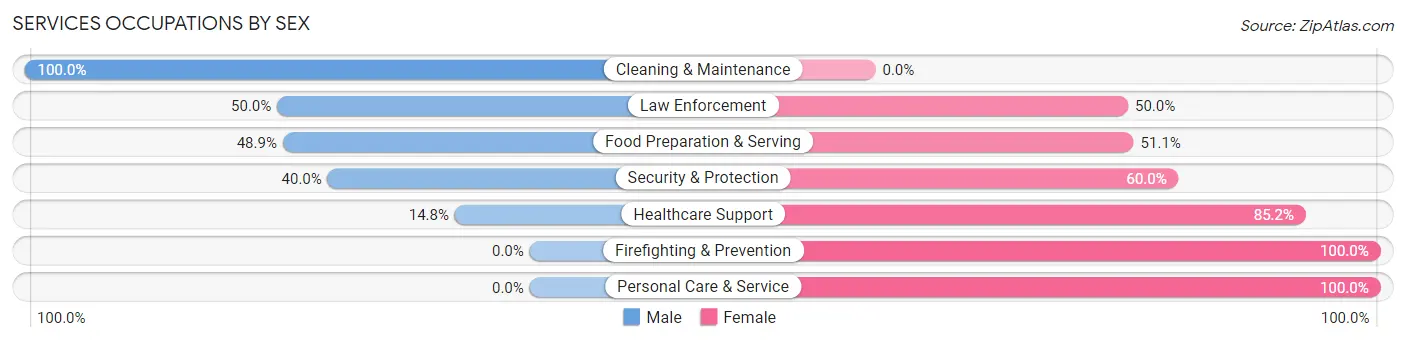
Services Occupations by Sex
Within the Services occupations in Taos, the most male-oriented occupations are Cleaning & Maintenance (100.0%), Law Enforcement (50.0%), and Food Preparation & Serving (48.9%), while the most female-oriented occupations are Firefighting & Prevention (100.0%), Personal Care & Service (100.0%), and Healthcare Support (85.2%).
| Occupation | Male | Female |
| Healthcare Support | 8 (14.8%) | 46 (85.2%) |
| Security & Protection | 6 (40.0%) | 9 (60.0%) |
| Firefighting & Prevention | 0 (0.0%) | 3 (100.0%) |
| Law Enforcement | 6 (50.0%) | 6 (50.0%) |
| Food Preparation & Serving | 22 (48.9%) | 23 (51.1%) |
| Cleaning & Maintenance | 7 (100.0%) | 0 (0.0%) |
| Personal Care & Service | 0 (0.0%) | 13 (100.0%) |
| Total (Category) | 43 (32.1%) | 91 (67.9%) |
| Total (Overall) | 302 (49.1%) | 313 (50.9%) |
Sales and Office Occupations
The most common Sales and Office occupations in Taos are Office & Administration (85 | 13.8%), and Sales & Related (65 | 10.6%).

Sales and Office Occupations by Sex
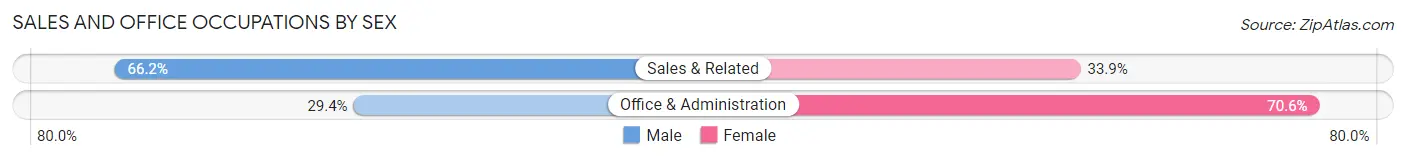
| Occupation | Male | Female |
| Sales & Related | 43 (66.1%) | 22 (33.9%) |
| Office & Administration | 25 (29.4%) | 60 (70.6%) |
| Total (Category) | 68 (45.3%) | 82 (54.7%) |
| Total (Overall) | 302 (49.1%) | 313 (50.9%) |
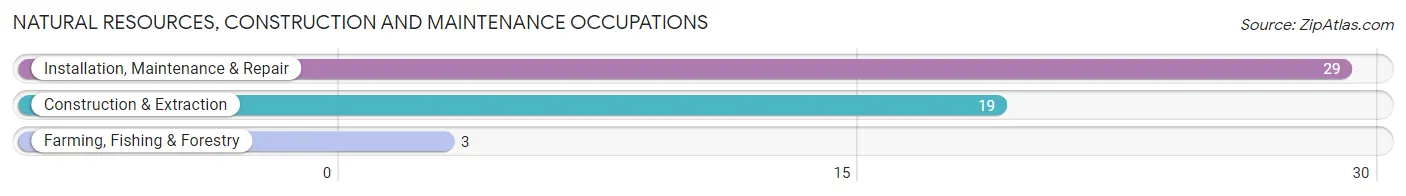
Natural Resources, Construction and Maintenance Occupations
The most common Natural Resources, Construction and Maintenance occupations in Taos are Installation, Maintenance & Repair (29 | 4.7%), Construction & Extraction (19 | 3.1%), and Farming, Fishing & Forestry (3 | 0.5%).
Natural Resources, Construction and Maintenance Occupations by Sex
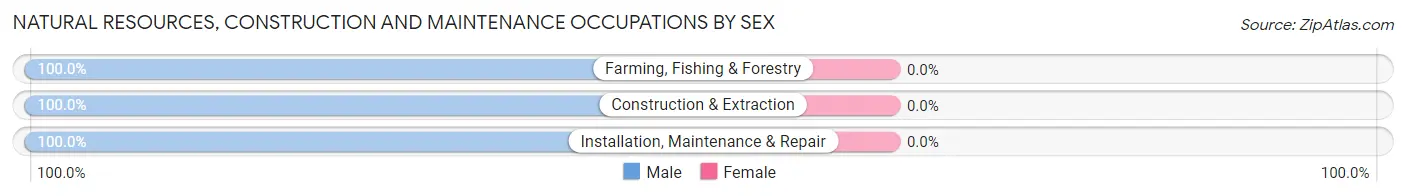
| Occupation | Male | Female |
| Farming, Fishing & Forestry | 3 (100.0%) | 0 (0.0%) |
| Construction & Extraction | 19 (100.0%) | 0 (0.0%) |
| Installation, Maintenance & Repair | 29 (100.0%) | 0 (0.0%) |
| Total (Category) | 51 (100.0%) | 0 (0.0%) |
| Total (Overall) | 302 (49.1%) | 313 (50.9%) |
Production, Transportation and Moving Occupations
The most common Production, Transportation and Moving occupations in Taos are Transportation (33 | 5.4%), Production (23 | 3.7%), and Material Moving (6 | 1.0%).
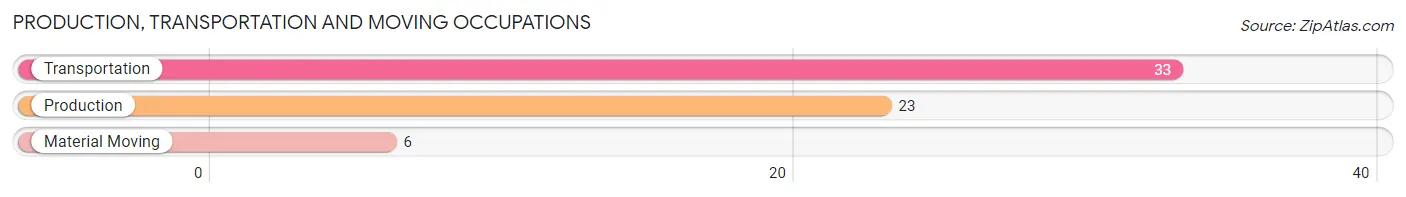
Production, Transportation and Moving Occupations by Sex
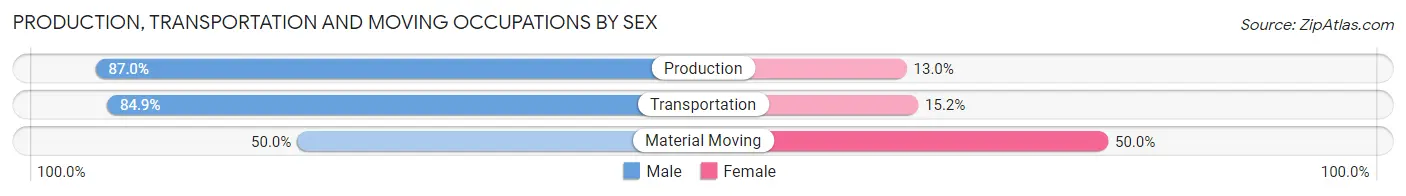
| Occupation | Male | Female |
| Production | 20 (87.0%) | 3 (13.0%) |
| Transportation | 28 (84.9%) | 5 (15.1%) |
| Material Moving | 3 (50.0%) | 3 (50.0%) |
| Total (Category) | 51 (82.3%) | 11 (17.7%) |
| Total (Overall) | 302 (49.1%) | 313 (50.9%) |
Employment Industries by Sex in Taos
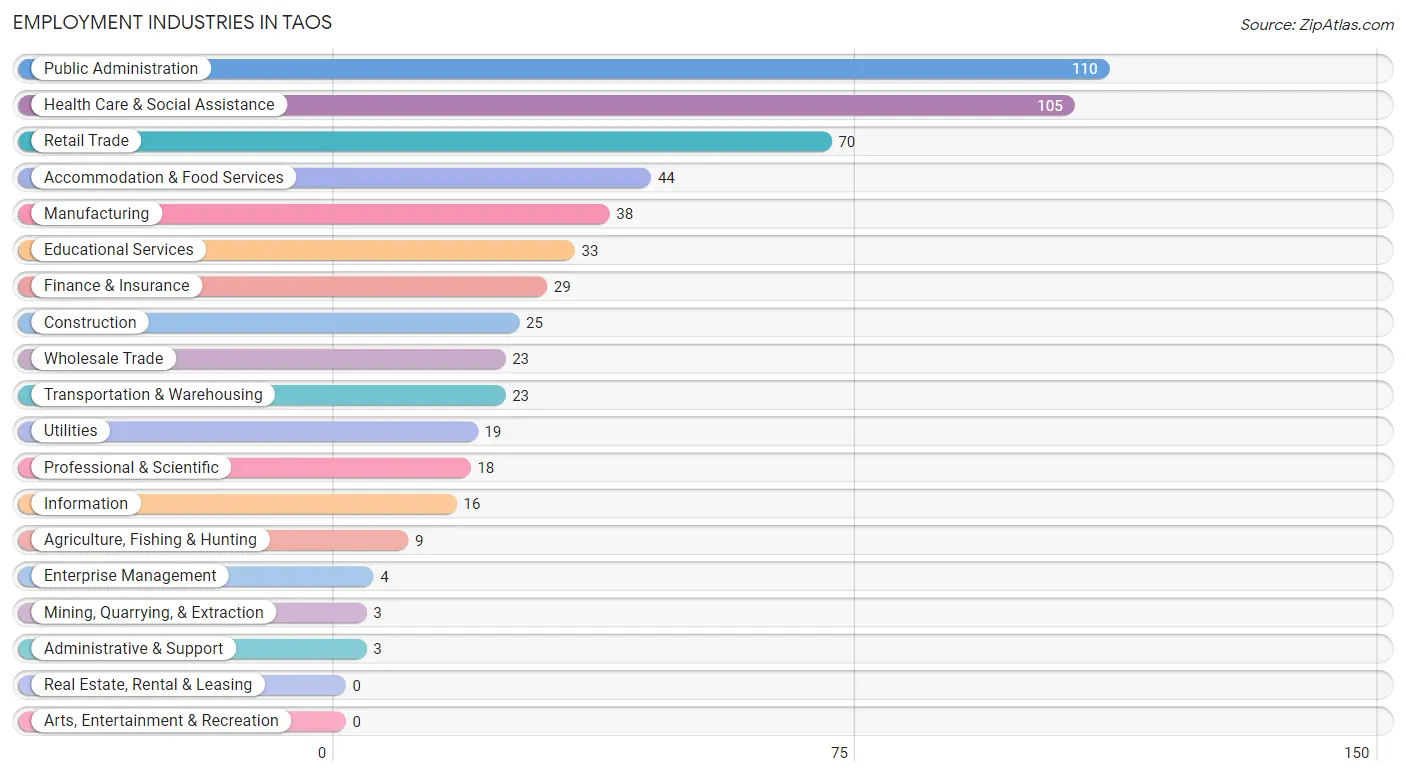
Employment Industries in Taos
The major employment industries in Taos include Public Administration (110 | 17.9%), Health Care & Social Assistance (105 | 17.1%), Retail Trade (70 | 11.4%), Accommodation & Food Services (44 | 7.1%), and Manufacturing (38 | 6.2%).
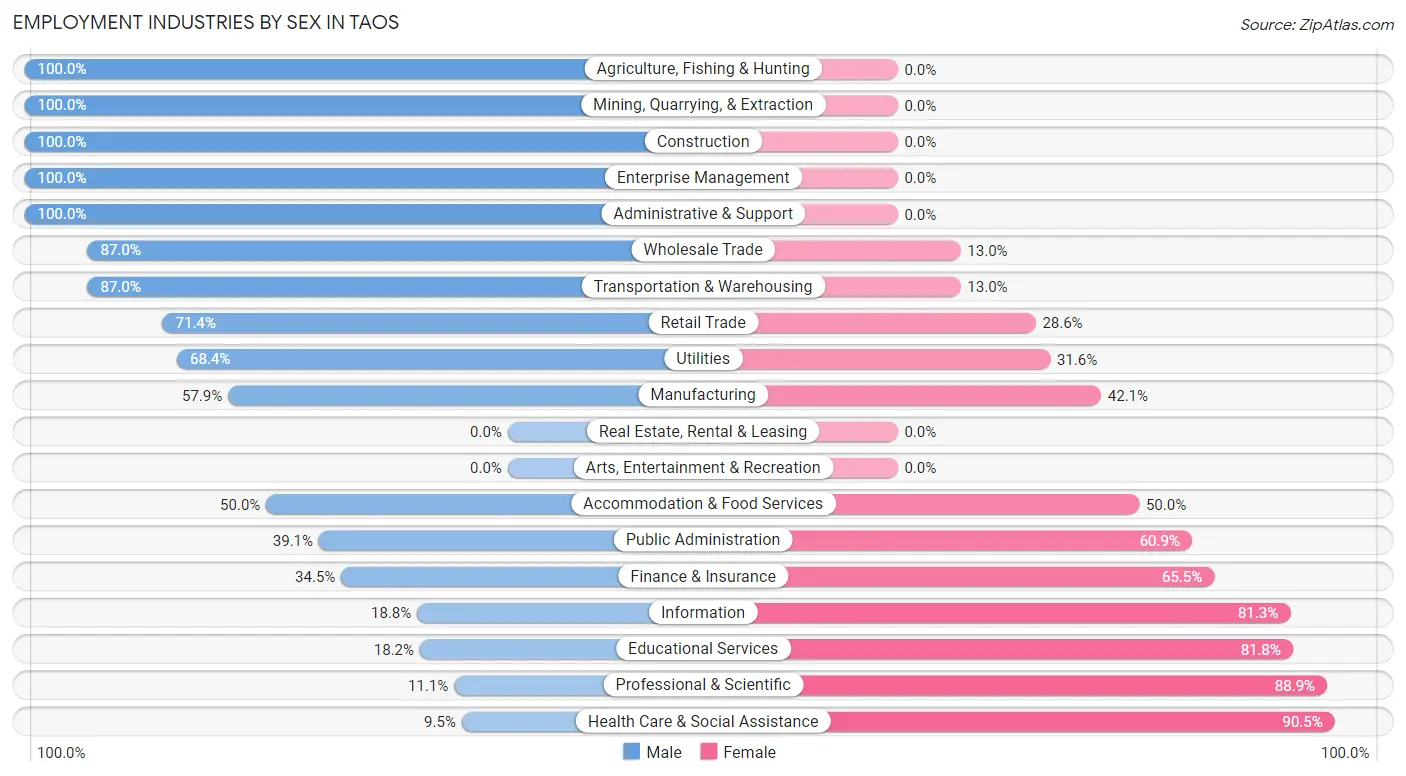
Employment Industries by Sex in Taos
The Taos industries that see more men than women are Agriculture, Fishing & Hunting (100.0%), Mining, Quarrying, & Extraction (100.0%), and Construction (100.0%), whereas the industries that tend to have a higher number of women are Health Care & Social Assistance (90.5%), Professional & Scientific (88.9%), and Educational Services (81.8%).
| Industry | Male | Female |
| Agriculture, Fishing & Hunting | 9 (100.0%) | 0 (0.0%) |
| Mining, Quarrying, & Extraction | 3 (100.0%) | 0 (0.0%) |
| Construction | 25 (100.0%) | 0 (0.0%) |
| Manufacturing | 22 (57.9%) | 16 (42.1%) |
| Wholesale Trade | 20 (87.0%) | 3 (13.0%) |
| Retail Trade | 50 (71.4%) | 20 (28.6%) |
| Transportation & Warehousing | 20 (87.0%) | 3 (13.0%) |
| Utilities | 13 (68.4%) | 6 (31.6%) |
| Information | 3 (18.8%) | 13 (81.2%) |
| Finance & Insurance | 10 (34.5%) | 19 (65.5%) |
| Real Estate, Rental & Leasing | 0 (0.0%) | 0 (0.0%) |
| Professional & Scientific | 2 (11.1%) | 16 (88.9%) |
| Enterprise Management | 4 (100.0%) | 0 (0.0%) |
| Administrative & Support | 3 (100.0%) | 0 (0.0%) |
| Educational Services | 6 (18.2%) | 27 (81.8%) |
| Health Care & Social Assistance | 10 (9.5%) | 95 (90.5%) |
| Arts, Entertainment & Recreation | 0 (0.0%) | 0 (0.0%) |
| Accommodation & Food Services | 22 (50.0%) | 22 (50.0%) |
| Public Administration | 43 (39.1%) | 67 (60.9%) |
| Total | 302 (49.1%) | 313 (50.9%) |
Education in Taos
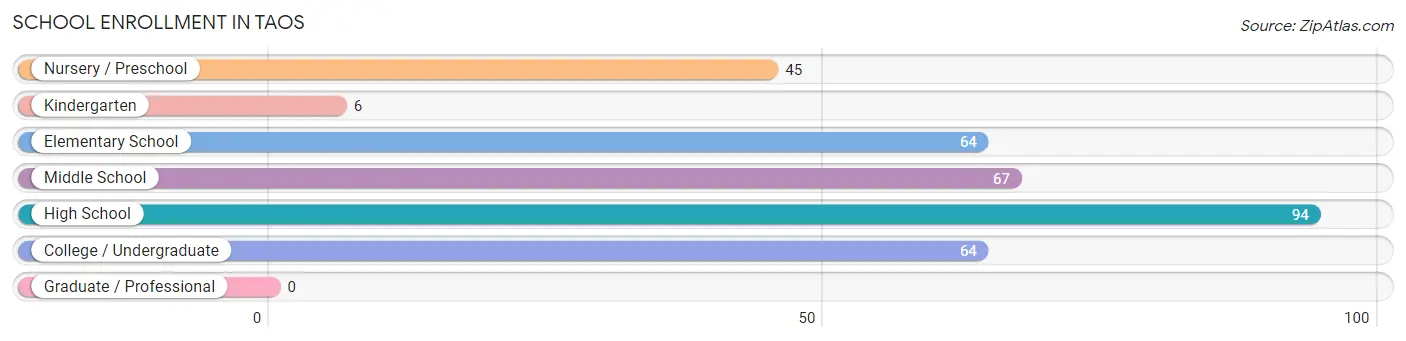
School Enrollment in Taos
The most common levels of schooling among the 340 students in Taos are high school (94 | 27.7%), middle school (67 | 19.7%), and elementary school (64 | 18.8%).
| School Level | # Students | % Students |
| Nursery / Preschool | 45 | 13.2% |
| Kindergarten | 6 | 1.8% |
| Elementary School | 64 | 18.8% |
| Middle School | 67 | 19.7% |
| High School | 94 | 27.7% |
| College / Undergraduate | 64 | 18.8% |
| Graduate / Professional | 0 | 0.0% |
| Total | 340 | 100.0% |
School Enrollment by Age by Funding Source in Taos
Out of a total of 340 students who are enrolled in schools in Taos, 72 (21.2%) attend a private institution, while the remaining 268 (78.8%) are enrolled in public schools. The age group of 10 to 14 year olds has the highest likelihood of being enrolled in private schools, with 33 (37.5% in the age bracket) enrolled. Conversely, the age group of 18 to 19 year olds has the lowest likelihood of being enrolled in a private school, with 28 (100.0% in the age bracket) attending a public institution.
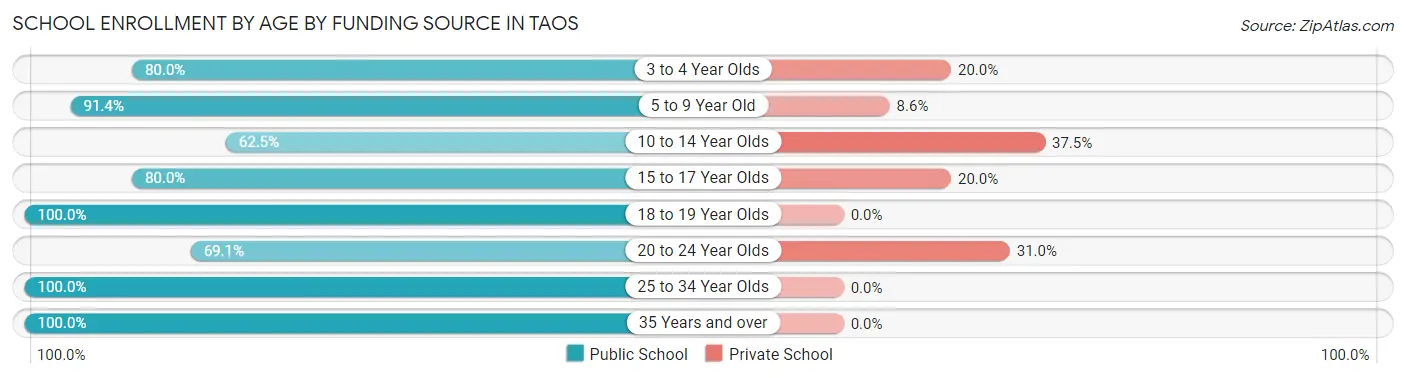
| Age Bracket | Public School | Private School |
| 3 to 4 Year Olds | 36 (80.0%) | 9 (20.0%) |
| 5 to 9 Year Old | 64 (91.4%) | 6 (8.6%) |
| 10 to 14 Year Olds | 55 (62.5%) | 33 (37.5%) |
| 15 to 17 Year Olds | 44 (80.0%) | 11 (20.0%) |
| 18 to 19 Year Olds | 28 (100.0%) | 0 (0.0%) |
| 20 to 24 Year Olds | 29 (69.1%) | 13 (30.9%) |
| 25 to 34 Year Olds | 3 (100.0%) | 0 (0.0%) |
| 35 Years and over | 9 (100.0%) | 0 (0.0%) |
| Total | 268 (78.8%) | 72 (21.2%) |
Educational Attainment by Field of Study in Taos
Business (100 | 35.8%), arts & humanities (57 | 20.4%), bio, nature & agricultural (21 | 7.5%), science & technology (21 | 7.5%), and education (21 | 7.5%) are the most common fields of study among 279 individuals in Taos who have obtained a bachelor's degree or higher.

| Field of Study | # Graduates | % Graduates |
| Computers & Mathematics | 18 | 6.5% |
| Bio, Nature & Agricultural | 21 | 7.5% |
| Physical & Health Sciences | 0 | 0.0% |
| Psychology | 9 | 3.2% |
| Social Sciences | 7 | 2.5% |
| Engineering | 6 | 2.1% |
| Multidisciplinary Studies | 0 | 0.0% |
| Science & Technology | 21 | 7.5% |
| Business | 100 | 35.8% |
| Education | 21 | 7.5% |
| Literature & Languages | 0 | 0.0% |
| Liberal Arts & History | 16 | 5.7% |
| Visual & Performing Arts | 0 | 0.0% |
| Communications | 3 | 1.1% |
| Arts & Humanities | 57 | 20.4% |
| Total | 279 | 100.0% |
Transportation & Commute in Taos
Vehicle Availability by Sex in Taos
The most prevalent vehicle ownership categories in Taos are males with 2 vehicles (90, accounting for 30.5%) and females with 2 vehicles (94, making up 29.7%).
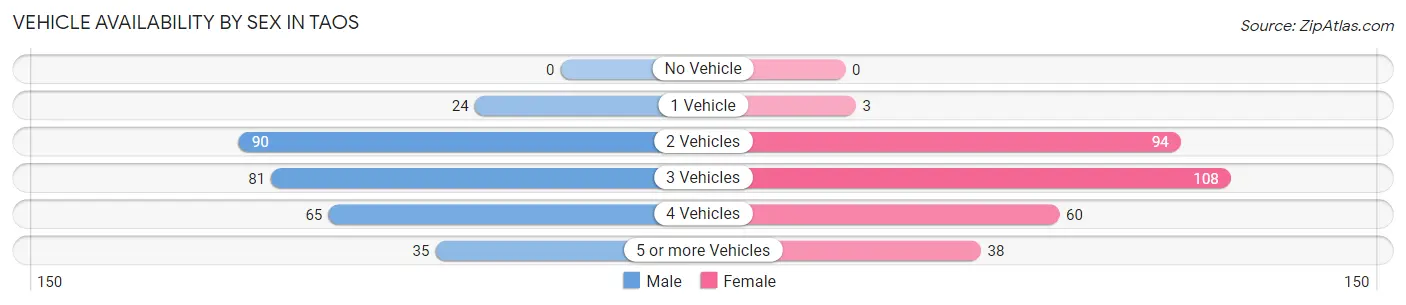
| Vehicles Available | Male | Female |
| No Vehicle | 0 (0.0%) | 0 (0.0%) |
| 1 Vehicle | 24 (8.1%) | 3 (1.0%) |
| 2 Vehicles | 90 (30.5%) | 94 (31.0%) |
| 3 Vehicles | 81 (27.5%) | 108 (35.6%) |
| 4 Vehicles | 65 (22.0%) | 60 (19.8%) |
| 5 or more Vehicles | 35 (11.9%) | 38 (12.5%) |
| Total | 295 (100.0%) | 303 (100.0%) |
Commute Time in Taos
The most frequently occuring commute durations in Taos are 20 to 24 minutes (160 commuters, 27.8%), 15 to 19 minutes (150 commuters, 26.0%), and 10 to 14 minutes (58 commuters, 10.1%).
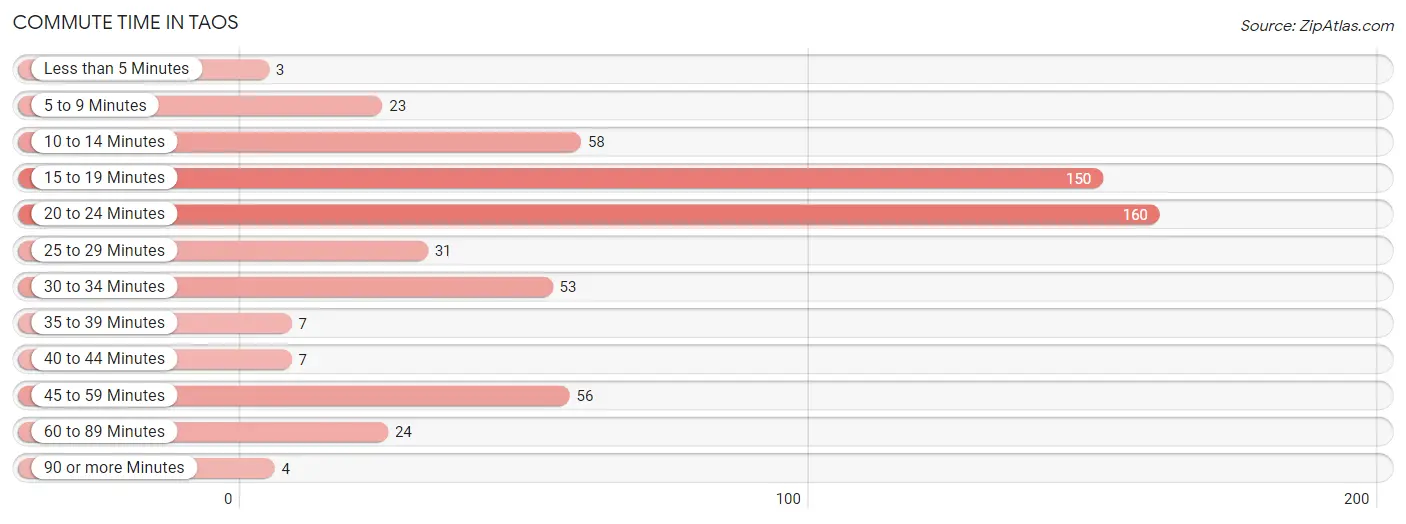
| Commute Time | # Commuters | % Commuters |
| Less than 5 Minutes | 3 | 0.5% |
| 5 to 9 Minutes | 23 | 4.0% |
| 10 to 14 Minutes | 58 | 10.1% |
| 15 to 19 Minutes | 150 | 26.0% |
| 20 to 24 Minutes | 160 | 27.8% |
| 25 to 29 Minutes | 31 | 5.4% |
| 30 to 34 Minutes | 53 | 9.2% |
| 35 to 39 Minutes | 7 | 1.2% |
| 40 to 44 Minutes | 7 | 1.2% |
| 45 to 59 Minutes | 56 | 9.7% |
| 60 to 89 Minutes | 24 | 4.2% |
| 90 or more Minutes | 4 | 0.7% |
Commute Time by Sex in Taos
The most common commute times in Taos are 20 to 24 minutes (84 commuters, 29.0%) for males and 20 to 24 minutes (76 commuters, 26.6%) for females.
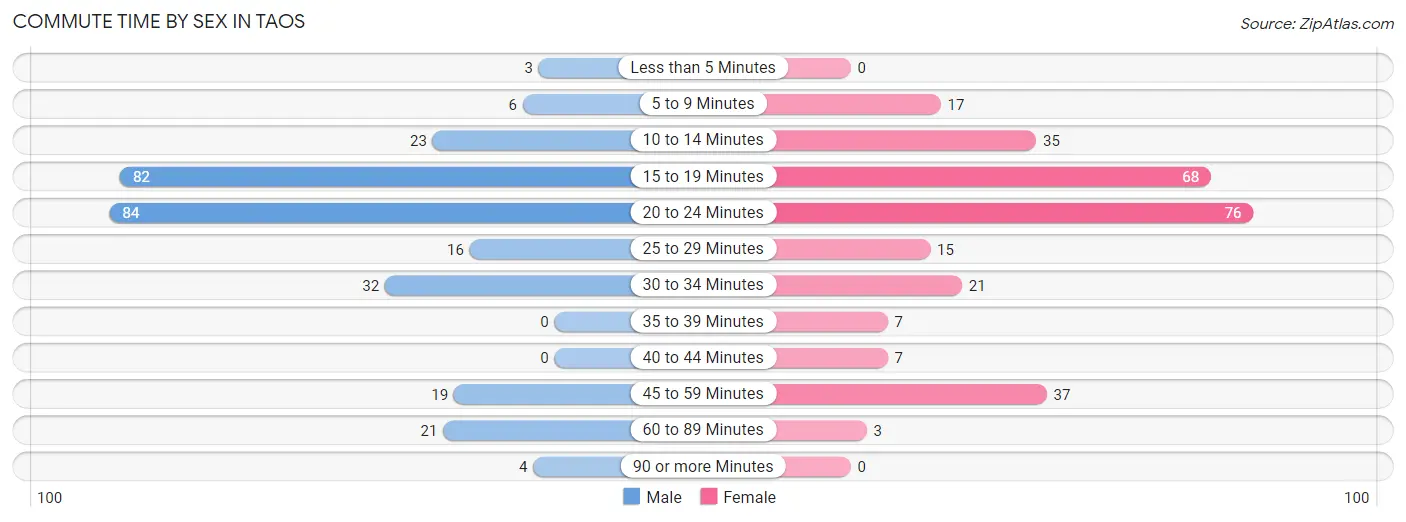
| Commute Time | Male | Female |
| Less than 5 Minutes | 3 (1.0%) | 0 (0.0%) |
| 5 to 9 Minutes | 6 (2.1%) | 17 (5.9%) |
| 10 to 14 Minutes | 23 (7.9%) | 35 (12.2%) |
| 15 to 19 Minutes | 82 (28.3%) | 68 (23.8%) |
| 20 to 24 Minutes | 84 (29.0%) | 76 (26.6%) |
| 25 to 29 Minutes | 16 (5.5%) | 15 (5.2%) |
| 30 to 34 Minutes | 32 (11.0%) | 21 (7.3%) |
| 35 to 39 Minutes | 0 (0.0%) | 7 (2.5%) |
| 40 to 44 Minutes | 0 (0.0%) | 7 (2.5%) |
| 45 to 59 Minutes | 19 (6.6%) | 37 (12.9%) |
| 60 to 89 Minutes | 21 (7.2%) | 3 (1.1%) |
| 90 or more Minutes | 4 (1.4%) | 0 (0.0%) |
Time of Departure to Work by Sex in Taos
The most frequent times of departure to work in Taos are 7:30 AM to 7:59 AM (65, 22.4%) for males and 7:30 AM to 7:59 AM (80, 28.0%) for females.
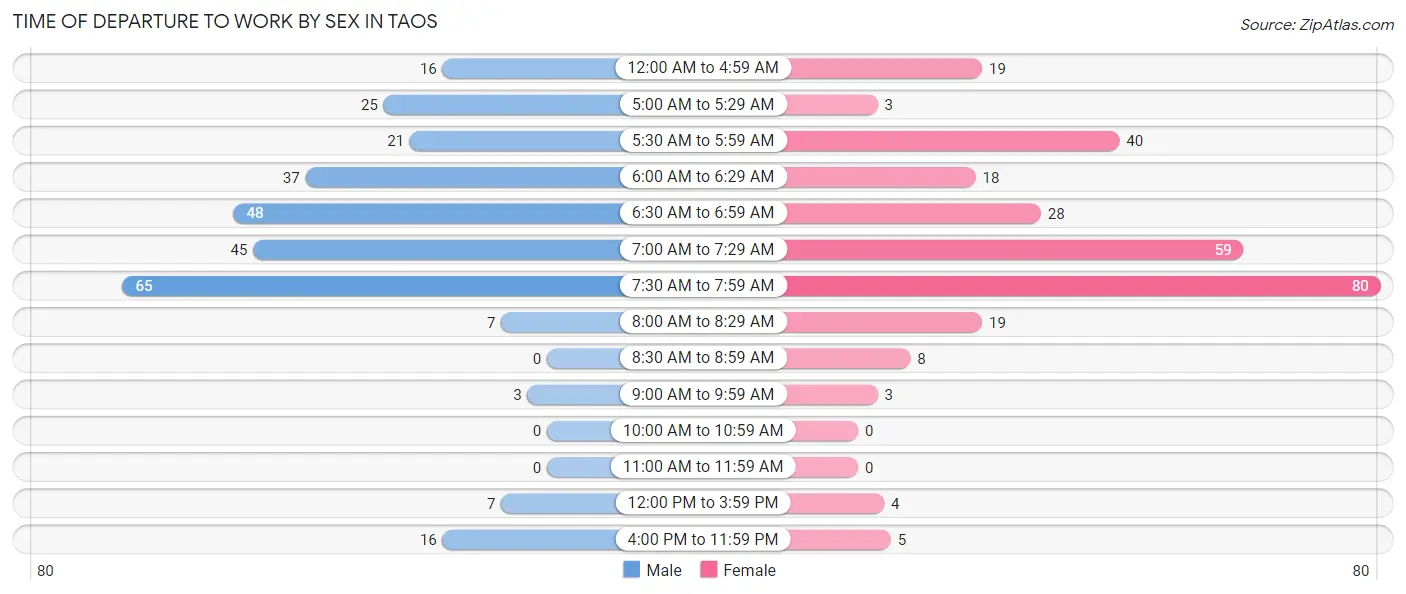
| Time of Departure | Male | Female |
| 12:00 AM to 4:59 AM | 16 (5.5%) | 19 (6.6%) |
| 5:00 AM to 5:29 AM | 25 (8.6%) | 3 (1.1%) |
| 5:30 AM to 5:59 AM | 21 (7.2%) | 40 (14.0%) |
| 6:00 AM to 6:29 AM | 37 (12.8%) | 18 (6.3%) |
| 6:30 AM to 6:59 AM | 48 (16.6%) | 28 (9.8%) |
| 7:00 AM to 7:29 AM | 45 (15.5%) | 59 (20.6%) |
| 7:30 AM to 7:59 AM | 65 (22.4%) | 80 (28.0%) |
| 8:00 AM to 8:29 AM | 7 (2.4%) | 19 (6.6%) |
| 8:30 AM to 8:59 AM | 0 (0.0%) | 8 (2.8%) |
| 9:00 AM to 9:59 AM | 3 (1.0%) | 3 (1.1%) |
| 10:00 AM to 10:59 AM | 0 (0.0%) | 0 (0.0%) |
| 11:00 AM to 11:59 AM | 0 (0.0%) | 0 (0.0%) |
| 12:00 PM to 3:59 PM | 7 (2.4%) | 4 (1.4%) |
| 4:00 PM to 11:59 PM | 16 (5.5%) | 5 (1.8%) |
| Total | 290 (100.0%) | 286 (100.0%) |
Housing Occupancy in Taos
Occupancy by Ownership in Taos
Of the total 457 dwellings in Taos, owner-occupied units account for 420 (91.9%), while renter-occupied units make up 37 (8.1%).
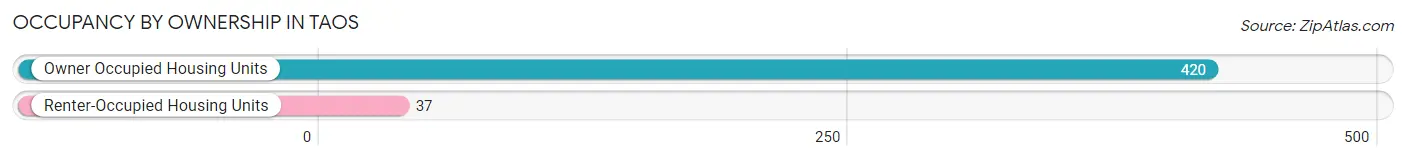
| Occupancy | # Housing Units | % Housing Units |
| Owner Occupied Housing Units | 420 | 91.9% |
| Renter-Occupied Housing Units | 37 | 8.1% |
| Total Occupied Housing Units | 457 | 100.0% |
Occupancy by Household Size in Taos
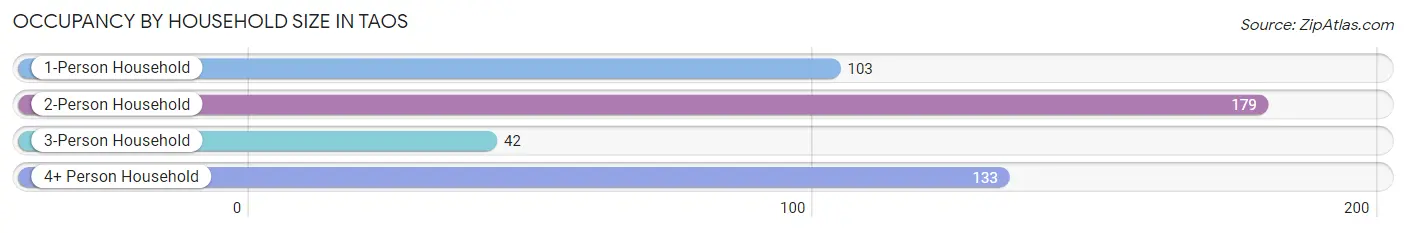
| Household Size | # Housing Units | % Housing Units |
| 1-Person Household | 103 | 22.5% |
| 2-Person Household | 179 | 39.2% |
| 3-Person Household | 42 | 9.2% |
| 4+ Person Household | 133 | 29.1% |
| Total Housing Units | 457 | 100.0% |
Occupancy by Ownership by Household Size in Taos
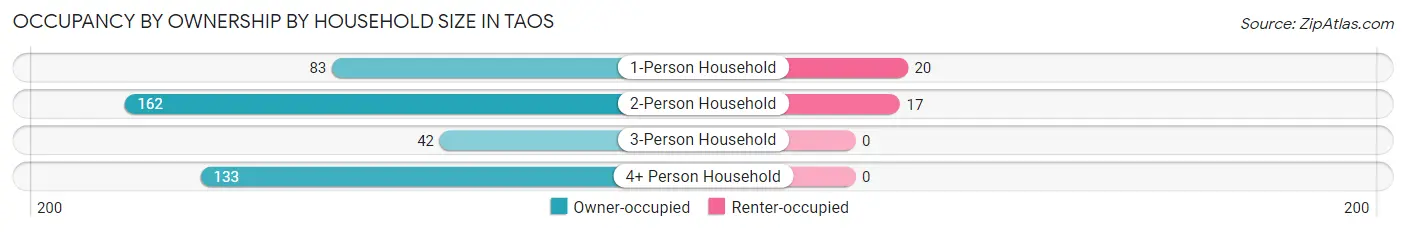
| Household Size | Owner-occupied | Renter-occupied |
| 1-Person Household | 83 (80.6%) | 20 (19.4%) |
| 2-Person Household | 162 (90.5%) | 17 (9.5%) |
| 3-Person Household | 42 (100.0%) | 0 (0.0%) |
| 4+ Person Household | 133 (100.0%) | 0 (0.0%) |
| Total Housing Units | 420 (91.9%) | 37 (8.1%) |
Occupancy by Educational Attainment in Taos
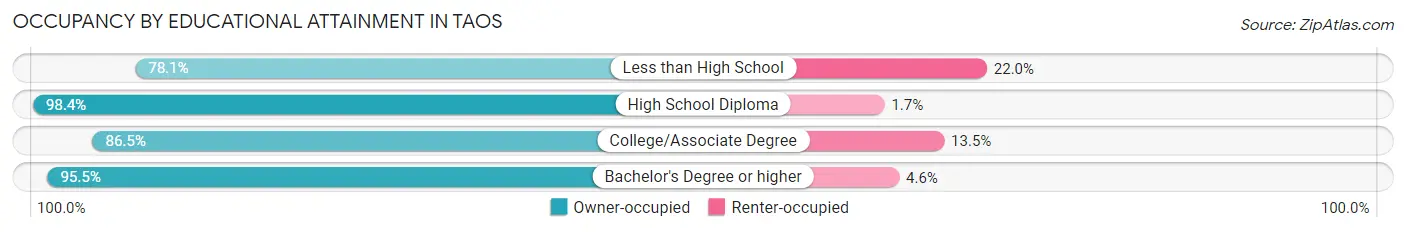
| Household Size | Owner-occupied | Renter-occupied |
| Less than High School | 32 (78.0%) | 9 (22.0%) |
| High School Diploma | 119 (98.4%) | 2 (1.7%) |
| College/Associate Degree | 122 (86.5%) | 19 (13.5%) |
| Bachelor's Degree or higher | 147 (95.5%) | 7 (4.5%) |
Occupancy by Age of Householder in Taos
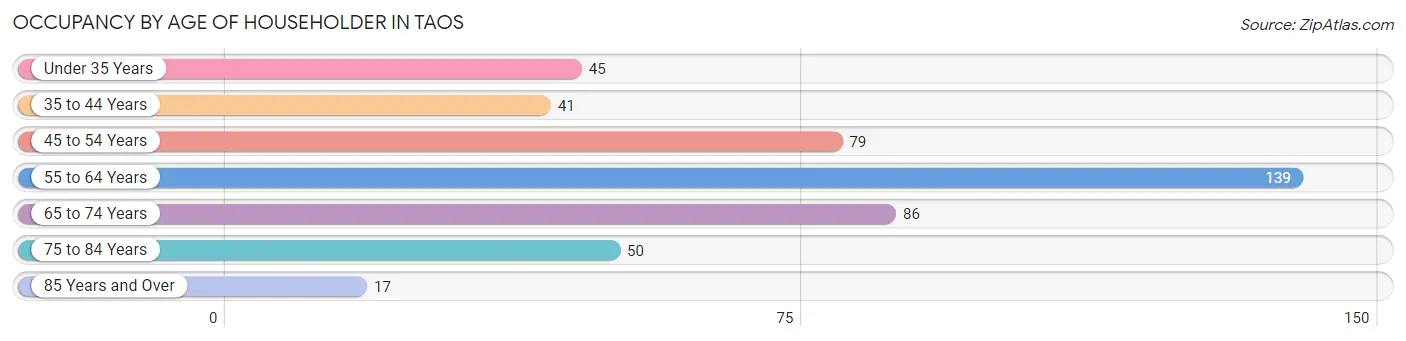
| Age Bracket | # Households | % Households |
| Under 35 Years | 45 | 9.9% |
| 35 to 44 Years | 41 | 9.0% |
| 45 to 54 Years | 79 | 17.3% |
| 55 to 64 Years | 139 | 30.4% |
| 65 to 74 Years | 86 | 18.8% |
| 75 to 84 Years | 50 | 10.9% |
| 85 Years and Over | 17 | 3.7% |
| Total | 457 | 100.0% |
Housing Finances in Taos
Median Income by Occupancy in Taos
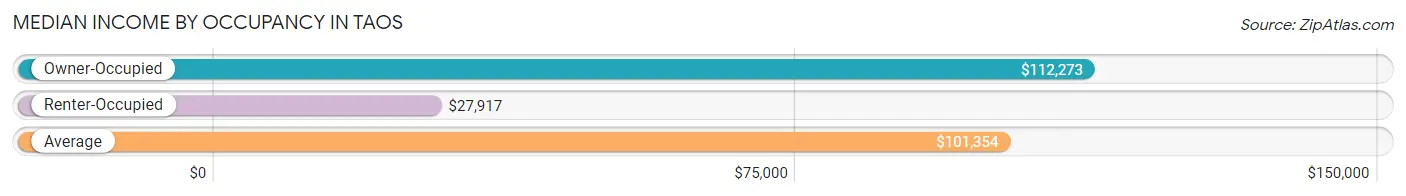
| Occupancy Type | # Households | Median Income |
| Owner-Occupied | 420 (91.9%) | $112,273 |
| Renter-Occupied | 37 (8.1%) | $27,917 |
| Average | 457 (100.0%) | $101,354 |
Occupancy by Householder Income Bracket in Taos
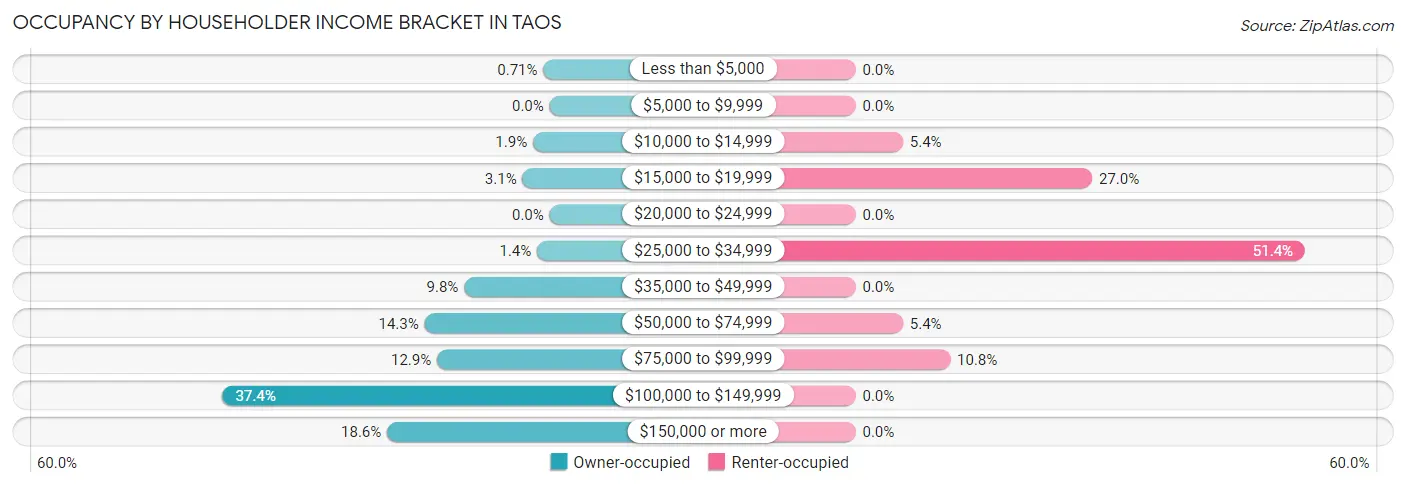
| Income Bracket | Owner-occupied | Renter-occupied |
| Less than $5,000 | 3 (0.7%) | 0 (0.0%) |
| $5,000 to $9,999 | 0 (0.0%) | 0 (0.0%) |
| $10,000 to $14,999 | 8 (1.9%) | 2 (5.4%) |
| $15,000 to $19,999 | 13 (3.1%) | 10 (27.0%) |
| $20,000 to $24,999 | 0 (0.0%) | 0 (0.0%) |
| $25,000 to $34,999 | 6 (1.4%) | 19 (51.3%) |
| $35,000 to $49,999 | 41 (9.8%) | 0 (0.0%) |
| $50,000 to $74,999 | 60 (14.3%) | 2 (5.4%) |
| $75,000 to $99,999 | 54 (12.9%) | 4 (10.8%) |
| $100,000 to $149,999 | 157 (37.4%) | 0 (0.0%) |
| $150,000 or more | 78 (18.6%) | 0 (0.0%) |
| Total | 420 (100.0%) | 37 (100.0%) |
Monthly Housing Cost Tiers in Taos
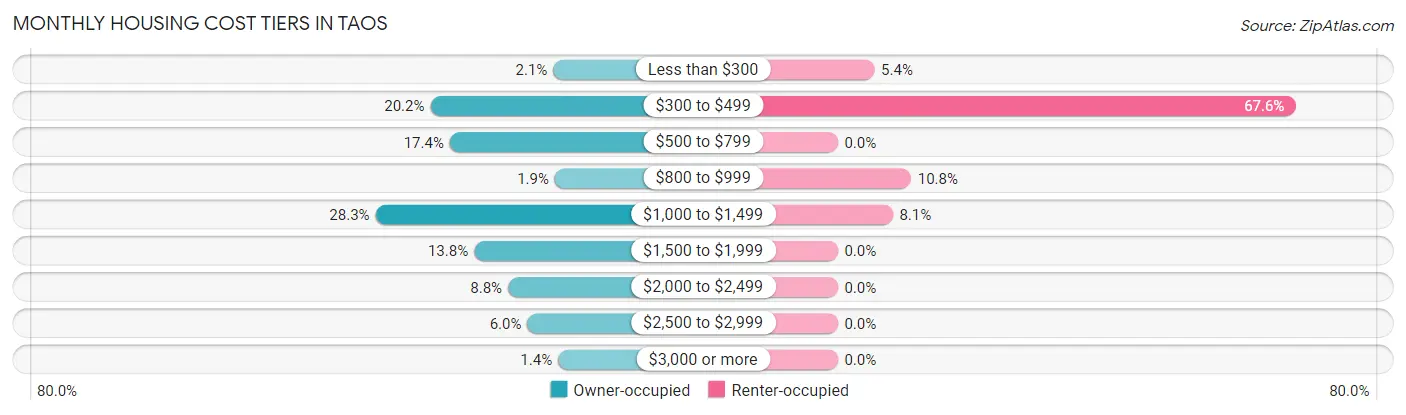
| Monthly Cost | Owner-occupied | Renter-occupied |
| Less than $300 | 9 (2.1%) | 2 (5.4%) |
| $300 to $499 | 85 (20.2%) | 25 (67.6%) |
| $500 to $799 | 73 (17.4%) | 0 (0.0%) |
| $800 to $999 | 8 (1.9%) | 4 (10.8%) |
| $1,000 to $1,499 | 119 (28.3%) | 3 (8.1%) |
| $1,500 to $1,999 | 58 (13.8%) | 0 (0.0%) |
| $2,000 to $2,499 | 37 (8.8%) | 0 (0.0%) |
| $2,500 to $2,999 | 25 (5.9%) | 0 (0.0%) |
| $3,000 or more | 6 (1.4%) | 0 (0.0%) |
| Total | 420 (100.0%) | 37 (100.0%) |
Physical Housing Characteristics in Taos
Housing Structures in Taos
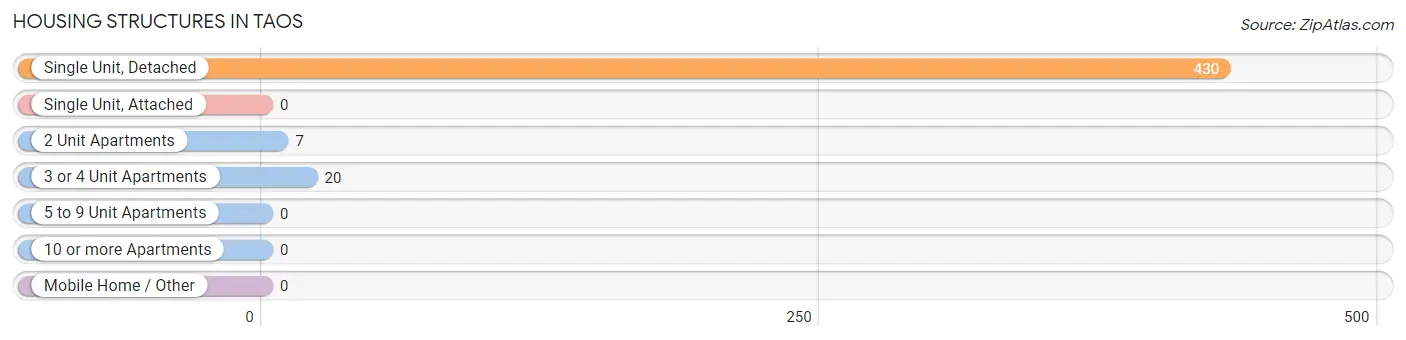
| Structure Type | # Housing Units | % Housing Units |
| Single Unit, Detached | 430 | 94.1% |
| Single Unit, Attached | 0 | 0.0% |
| 2 Unit Apartments | 7 | 1.5% |
| 3 or 4 Unit Apartments | 20 | 4.4% |
| 5 to 9 Unit Apartments | 0 | 0.0% |
| 10 or more Apartments | 0 | 0.0% |
| Mobile Home / Other | 0 | 0.0% |
| Total | 457 | 100.0% |
Housing Structures by Occupancy in Taos
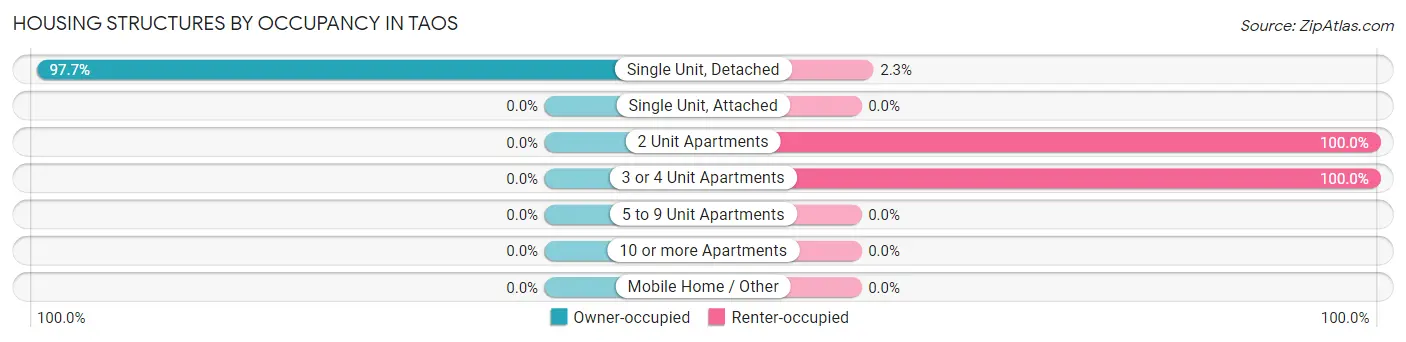
| Structure Type | Owner-occupied | Renter-occupied |
| Single Unit, Detached | 420 (97.7%) | 10 (2.3%) |
| Single Unit, Attached | 0 (0.0%) | 0 (0.0%) |
| 2 Unit Apartments | 0 (0.0%) | 7 (100.0%) |
| 3 or 4 Unit Apartments | 0 (0.0%) | 20 (100.0%) |
| 5 to 9 Unit Apartments | 0 (0.0%) | 0 (0.0%) |
| 10 or more Apartments | 0 (0.0%) | 0 (0.0%) |
| Mobile Home / Other | 0 (0.0%) | 0 (0.0%) |
| Total | 420 (91.9%) | 37 (8.1%) |
Housing Structures by Number of Rooms in Taos
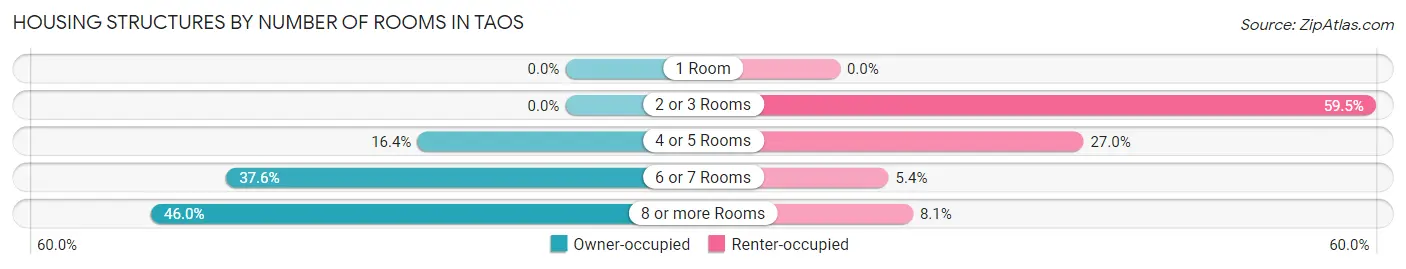
| Number of Rooms | Owner-occupied | Renter-occupied |
| 1 Room | 0 (0.0%) | 0 (0.0%) |
| 2 or 3 Rooms | 0 (0.0%) | 22 (59.5%) |
| 4 or 5 Rooms | 69 (16.4%) | 10 (27.0%) |
| 6 or 7 Rooms | 158 (37.6%) | 2 (5.4%) |
| 8 or more Rooms | 193 (46.0%) | 3 (8.1%) |
| Total | 420 (100.0%) | 37 (100.0%) |
Housing Structure by Heating Type in Taos
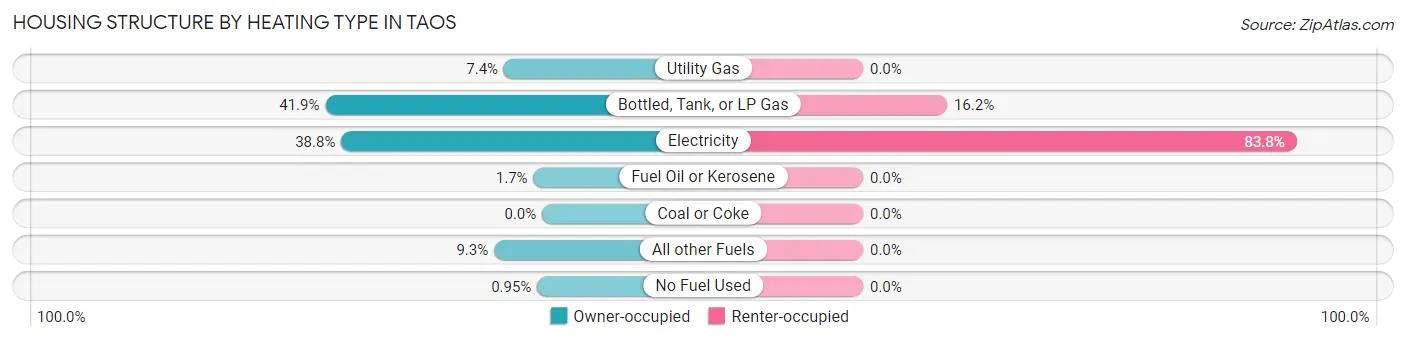
| Heating Type | Owner-occupied | Renter-occupied |
| Utility Gas | 31 (7.4%) | 0 (0.0%) |
| Bottled, Tank, or LP Gas | 176 (41.9%) | 6 (16.2%) |
| Electricity | 163 (38.8%) | 31 (83.8%) |
| Fuel Oil or Kerosene | 7 (1.7%) | 0 (0.0%) |
| Coal or Coke | 0 (0.0%) | 0 (0.0%) |
| All other Fuels | 39 (9.3%) | 0 (0.0%) |
| No Fuel Used | 4 (0.9%) | 0 (0.0%) |
| Total | 420 (100.0%) | 37 (100.0%) |
Household Vehicle Usage in Taos
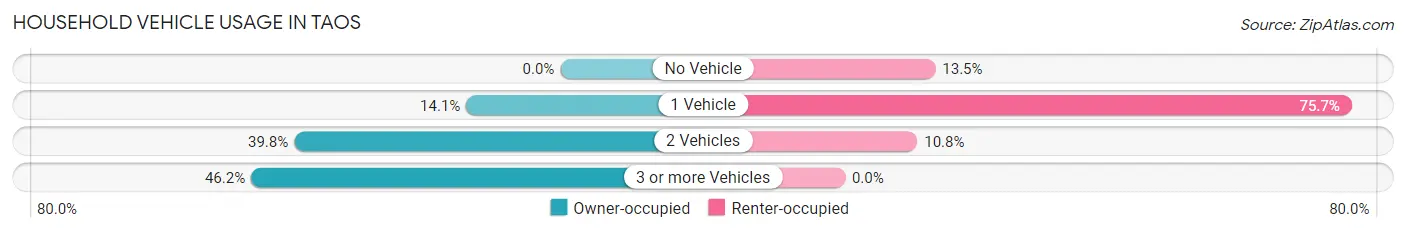
| Vehicles per Household | Owner-occupied | Renter-occupied |
| No Vehicle | 0 (0.0%) | 5 (13.5%) |
| 1 Vehicle | 59 (14.1%) | 28 (75.7%) |
| 2 Vehicles | 167 (39.8%) | 4 (10.8%) |
| 3 or more Vehicles | 194 (46.2%) | 0 (0.0%) |
| Total | 420 (100.0%) | 37 (100.0%) |
Real Estate & Mortgages in Taos
Real Estate and Mortgage Overview in Taos
| Characteristic | Without Mortgage | With Mortgage |
| Housing Units | 158 | 262 |
| Median Property Value | $216,700 | $262,700 |
| Median Household Income | $67,917 | $66 |
| Monthly Housing Costs | $482 | $6 |
| Real Estate Taxes | $1,397 | $0 |
Property Value by Mortgage Status in Taos
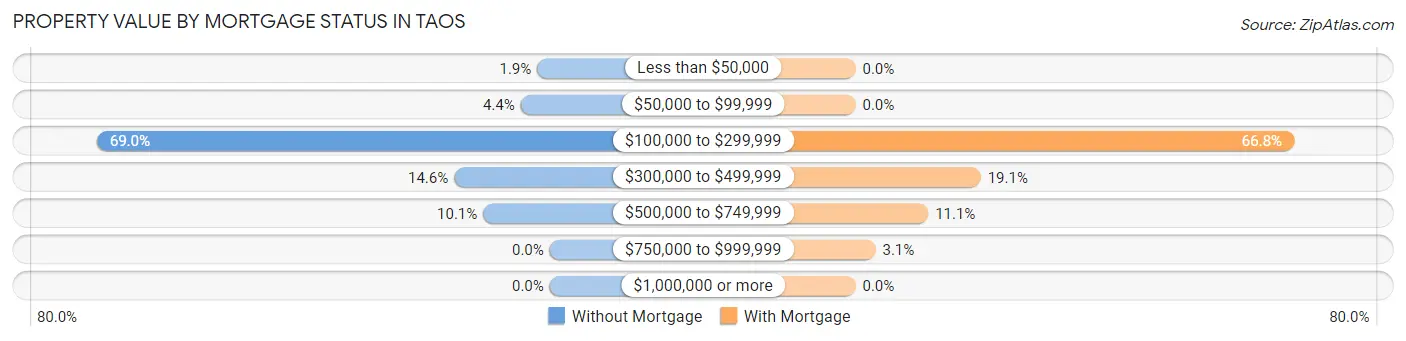
| Property Value | Without Mortgage | With Mortgage |
| Less than $50,000 | 3 (1.9%) | 0 (0.0%) |
| $50,000 to $99,999 | 7 (4.4%) | 0 (0.0%) |
| $100,000 to $299,999 | 109 (69.0%) | 175 (66.8%) |
| $300,000 to $499,999 | 23 (14.6%) | 50 (19.1%) |
| $500,000 to $749,999 | 16 (10.1%) | 29 (11.1%) |
| $750,000 to $999,999 | 0 (0.0%) | 8 (3.0%) |
| $1,000,000 or more | 0 (0.0%) | 0 (0.0%) |
| Total | 158 (100.0%) | 262 (100.0%) |
Household Income by Mortgage Status in Taos
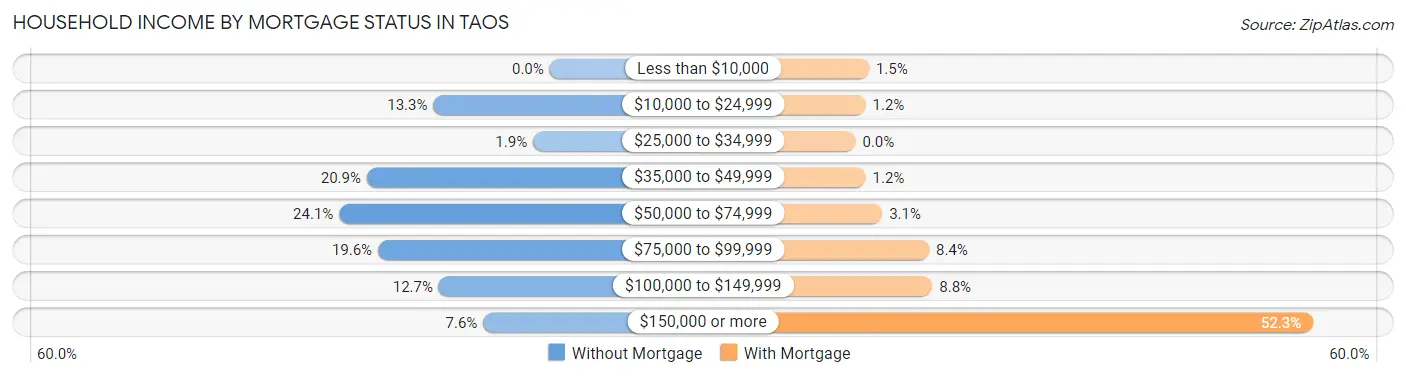
| Household Income | Without Mortgage | With Mortgage |
| Less than $10,000 | 0 (0.0%) | 4 (1.5%) |
| $10,000 to $24,999 | 21 (13.3%) | 3 (1.1%) |
| $25,000 to $34,999 | 3 (1.9%) | 0 (0.0%) |
| $35,000 to $49,999 | 33 (20.9%) | 3 (1.1%) |
| $50,000 to $74,999 | 38 (24.0%) | 8 (3.0%) |
| $75,000 to $99,999 | 31 (19.6%) | 22 (8.4%) |
| $100,000 to $149,999 | 20 (12.7%) | 23 (8.8%) |
| $150,000 or more | 12 (7.6%) | 137 (52.3%) |
| Total | 158 (100.0%) | 262 (100.0%) |
Property Value to Household Income Ratio in Taos
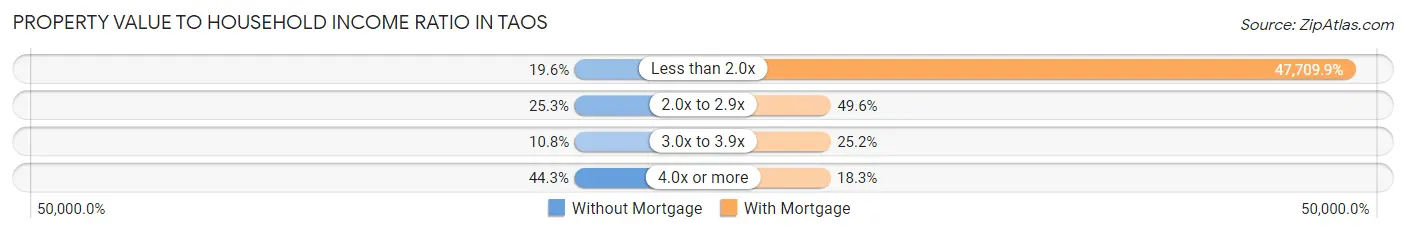
| Value-to-Income Ratio | Without Mortgage | With Mortgage |
| Less than 2.0x | 31 (19.6%) | 125,000 (47,709.9%) |
| 2.0x to 2.9x | 40 (25.3%) | 130 (49.6%) |
| 3.0x to 3.9x | 17 (10.8%) | 66 (25.2%) |
| 4.0x or more | 70 (44.3%) | 48 (18.3%) |
| Total | 158 (100.0%) | 262 (100.0%) |
Real Estate Taxes by Mortgage Status in Taos
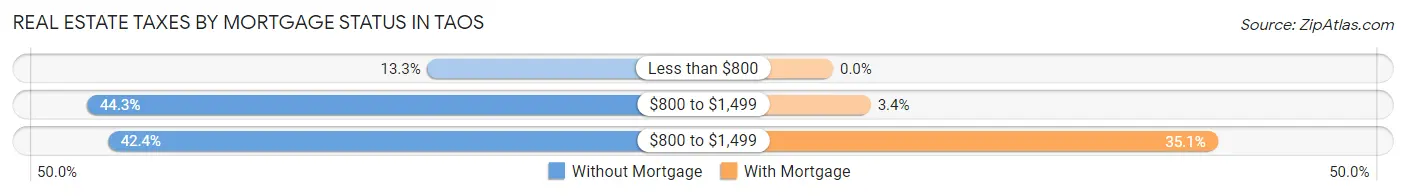
| Property Taxes | Without Mortgage | With Mortgage |
| Less than $800 | 21 (13.3%) | 0 (0.0%) |
| $800 to $1,499 | 70 (44.3%) | 9 (3.4%) |
| $800 to $1,499 | 67 (42.4%) | 92 (35.1%) |
| Total | 158 (100.0%) | 262 (100.0%) |
Health & Disability in Taos
Health Insurance Coverage by Age in Taos
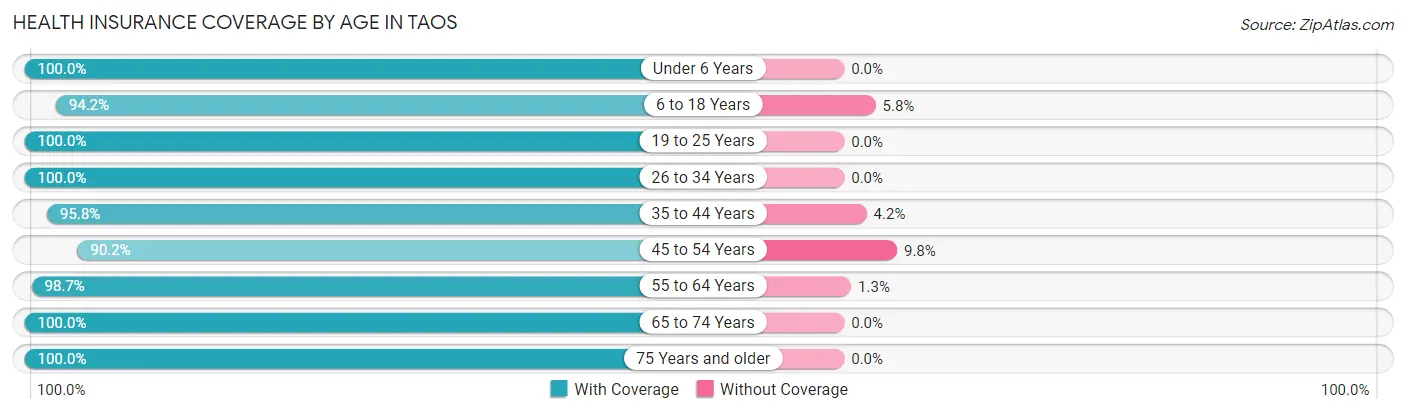
| Age Bracket | With Coverage | Without Coverage |
| Under 6 Years | 88 (100.0%) | 0 (0.0%) |
| 6 to 18 Years | 258 (94.2%) | 16 (5.8%) |
| 19 to 25 Years | 78 (100.0%) | 0 (0.0%) |
| 26 to 34 Years | 114 (100.0%) | 0 (0.0%) |
| 35 to 44 Years | 69 (95.8%) | 3 (4.2%) |
| 45 to 54 Years | 165 (90.2%) | 18 (9.8%) |
| 55 to 64 Years | 231 (98.7%) | 3 (1.3%) |
| 65 to 74 Years | 148 (100.0%) | 0 (0.0%) |
| 75 Years and older | 84 (100.0%) | 0 (0.0%) |
| Total | 1,235 (96.9%) | 40 (3.1%) |
Health Insurance Coverage by Citizenship Status in Taos
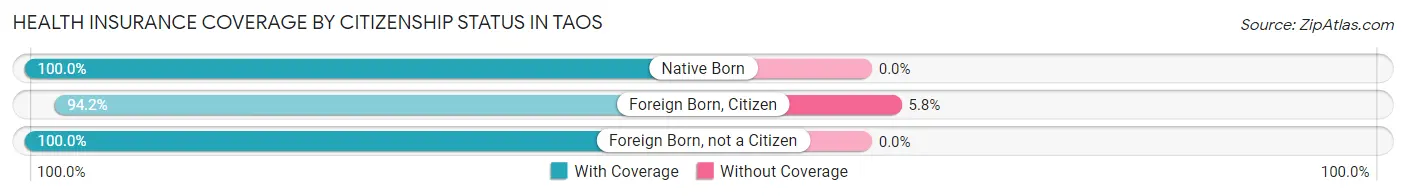
| Citizenship Status | With Coverage | Without Coverage |
| Native Born | 88 (100.0%) | 0 (0.0%) |
| Foreign Born, Citizen | 258 (94.2%) | 16 (5.8%) |
| Foreign Born, not a Citizen | 78 (100.0%) | 0 (0.0%) |
Health Insurance Coverage by Household Income in Taos
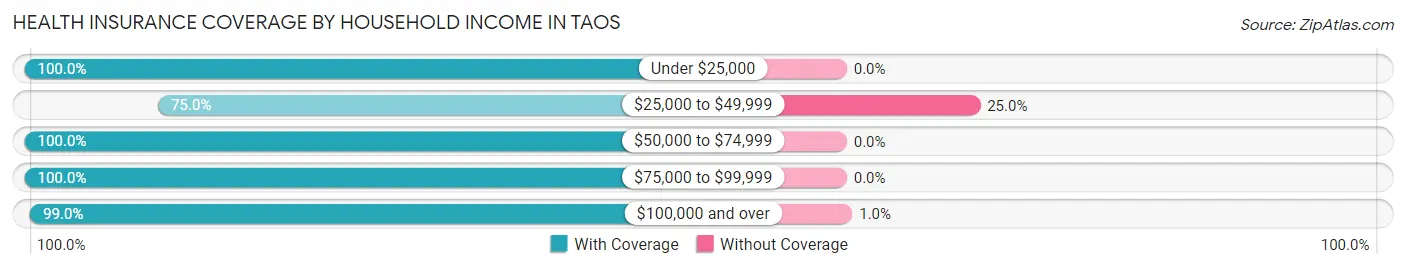
| Household Income | With Coverage | Without Coverage |
| Under $25,000 | 39 (100.0%) | 0 (0.0%) |
| $25,000 to $49,999 | 96 (75.0%) | 32 (25.0%) |
| $50,000 to $74,999 | 114 (100.0%) | 0 (0.0%) |
| $75,000 to $99,999 | 215 (100.0%) | 0 (0.0%) |
| $100,000 and over | 771 (99.0%) | 8 (1.0%) |
Public vs Private Health Insurance Coverage by Age in Taos
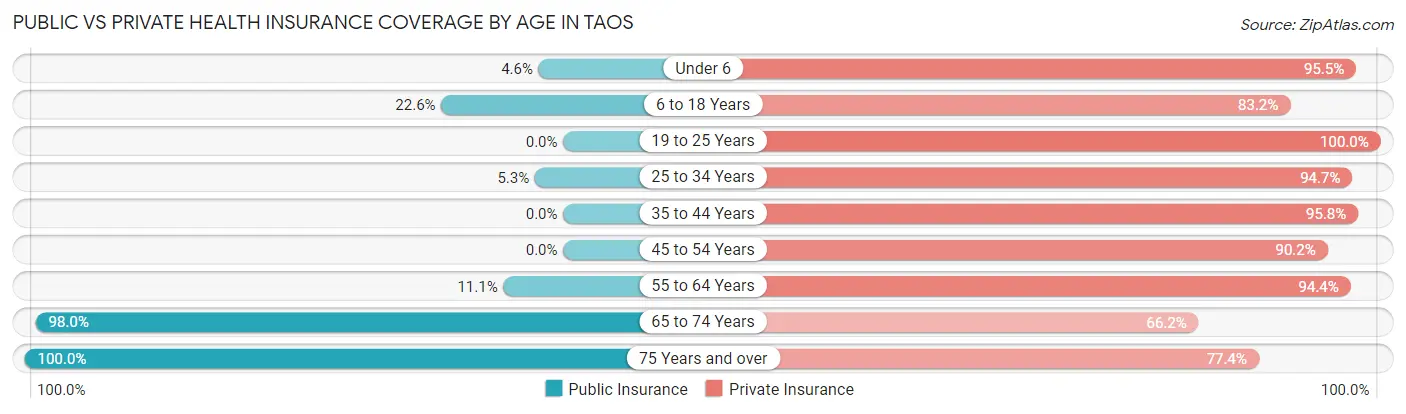
| Age Bracket | Public Insurance | Private Insurance |
| Under 6 | 4 (4.5%) | 84 (95.5%) |
| 6 to 18 Years | 62 (22.6%) | 228 (83.2%) |
| 19 to 25 Years | 0 (0.0%) | 78 (100.0%) |
| 25 to 34 Years | 6 (5.3%) | 108 (94.7%) |
| 35 to 44 Years | 0 (0.0%) | 69 (95.8%) |
| 45 to 54 Years | 0 (0.0%) | 165 (90.2%) |
| 55 to 64 Years | 26 (11.1%) | 221 (94.4%) |
| 65 to 74 Years | 145 (98.0%) | 98 (66.2%) |
| 75 Years and over | 84 (100.0%) | 65 (77.4%) |
| Total | 327 (25.7%) | 1,116 (87.5%) |
Disability Status by Sex by Age in Taos
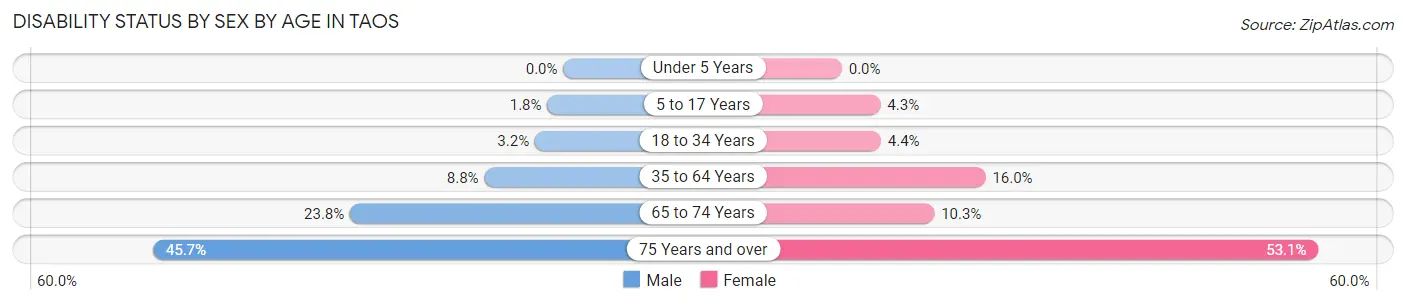
| Age Bracket | Male | Female |
| Under 5 Years | 0 (0.0%) | 0 (0.0%) |
| 5 to 17 Years | 3 (1.8%) | 4 (4.3%) |
| 18 to 34 Years | 3 (3.2%) | 5 (4.3%) |
| 35 to 64 Years | 21 (8.8%) | 40 (16.0%) |
| 65 to 74 Years | 19 (23.7%) | 7 (10.3%) |
| 75 Years and over | 16 (45.7%) | 26 (53.1%) |
Disability Class by Sex by Age in Taos
Disability Class: Hearing Difficulty
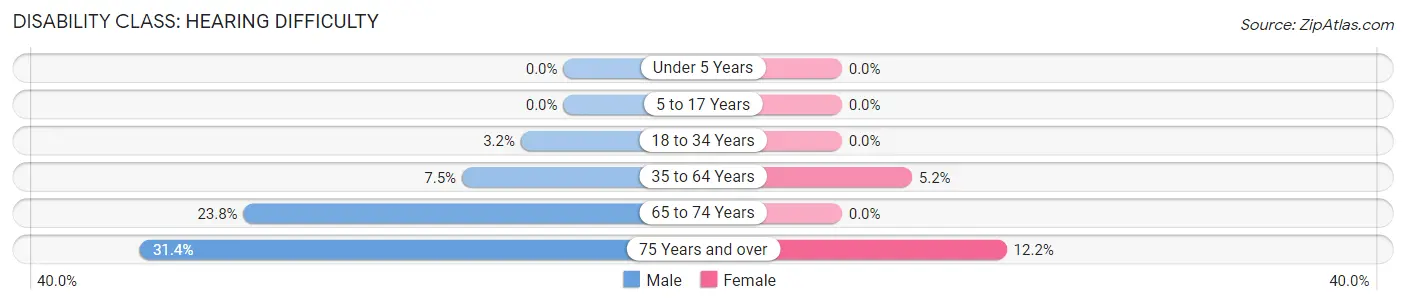
| Age Bracket | Male | Female |
| Under 5 Years | 0 (0.0%) | 0 (0.0%) |
| 5 to 17 Years | 0 (0.0%) | 0 (0.0%) |
| 18 to 34 Years | 3 (3.2%) | 0 (0.0%) |
| 35 to 64 Years | 18 (7.5%) | 13 (5.2%) |
| 65 to 74 Years | 19 (23.7%) | 0 (0.0%) |
| 75 Years and over | 11 (31.4%) | 6 (12.2%) |
Disability Class: Vision Difficulty
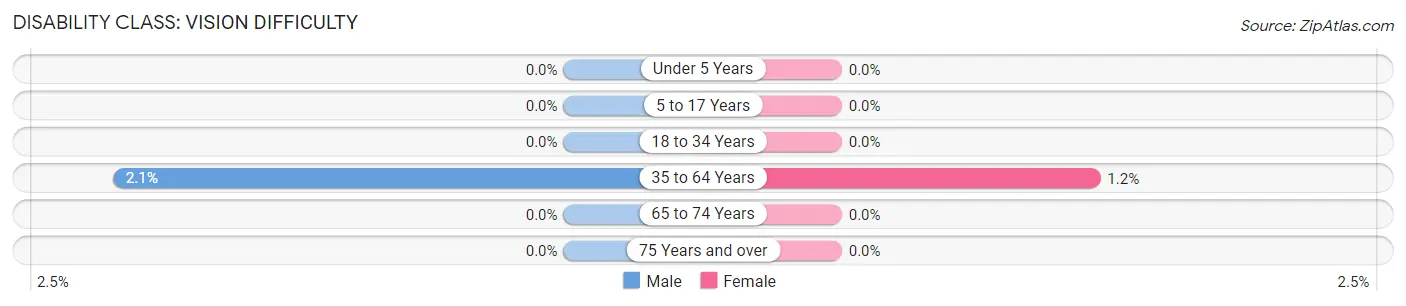
| Age Bracket | Male | Female |
| Under 5 Years | 0 (0.0%) | 0 (0.0%) |
| 5 to 17 Years | 0 (0.0%) | 0 (0.0%) |
| 18 to 34 Years | 0 (0.0%) | 0 (0.0%) |
| 35 to 64 Years | 5 (2.1%) | 3 (1.2%) |
| 65 to 74 Years | 0 (0.0%) | 0 (0.0%) |
| 75 Years and over | 0 (0.0%) | 0 (0.0%) |
Disability Class: Cognitive Difficulty
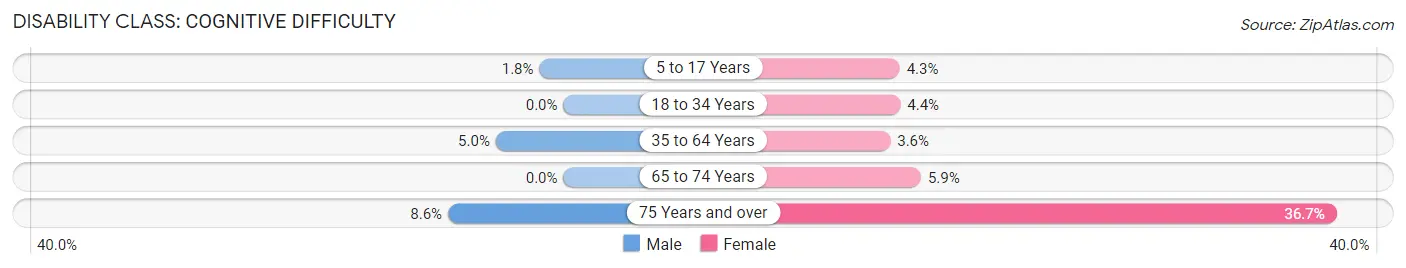
| Age Bracket | Male | Female |
| 5 to 17 Years | 3 (1.8%) | 4 (4.3%) |
| 18 to 34 Years | 0 (0.0%) | 5 (4.3%) |
| 35 to 64 Years | 12 (5.0%) | 9 (3.6%) |
| 65 to 74 Years | 0 (0.0%) | 4 (5.9%) |
| 75 Years and over | 3 (8.6%) | 18 (36.7%) |
Disability Class: Ambulatory Difficulty
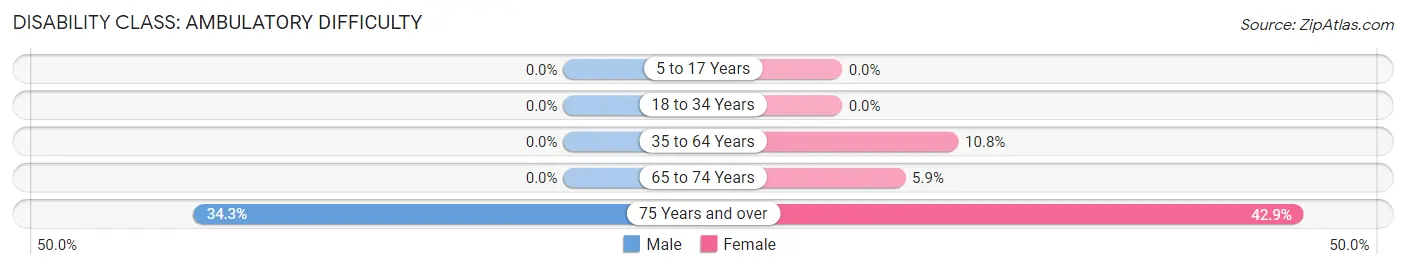
| Age Bracket | Male | Female |
| 5 to 17 Years | 0 (0.0%) | 0 (0.0%) |
| 18 to 34 Years | 0 (0.0%) | 0 (0.0%) |
| 35 to 64 Years | 0 (0.0%) | 27 (10.8%) |
| 65 to 74 Years | 0 (0.0%) | 4 (5.9%) |
| 75 Years and over | 12 (34.3%) | 21 (42.9%) |
Disability Class: Self-Care Difficulty
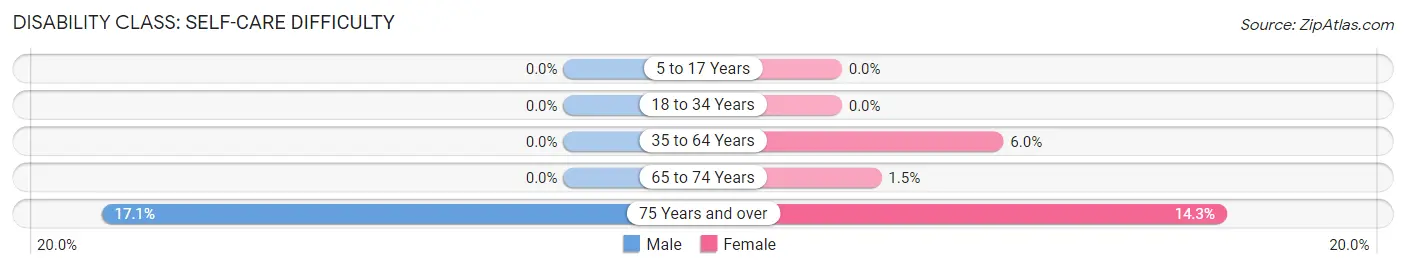
| Age Bracket | Male | Female |
| 5 to 17 Years | 0 (0.0%) | 0 (0.0%) |
| 18 to 34 Years | 0 (0.0%) | 0 (0.0%) |
| 35 to 64 Years | 0 (0.0%) | 15 (6.0%) |
| 65 to 74 Years | 0 (0.0%) | 1 (1.5%) |
| 75 Years and over | 6 (17.1%) | 7 (14.3%) |
Technology Access in Taos
Computing Device Access in Taos
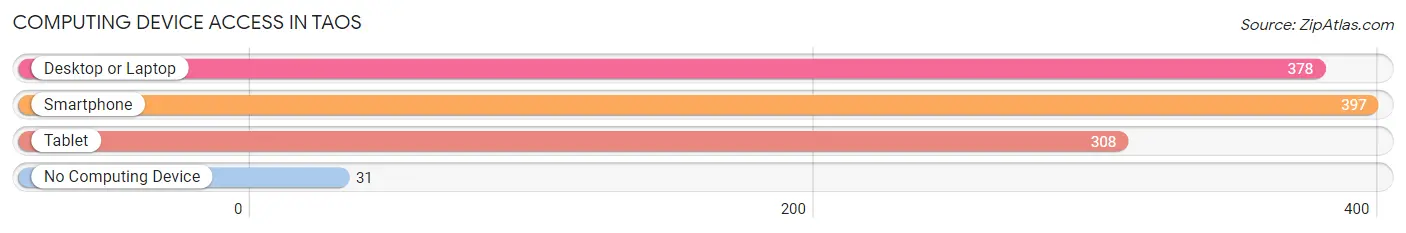
| Device Type | # Households | % Households |
| Desktop or Laptop | 378 | 82.7% |
| Smartphone | 397 | 86.9% |
| Tablet | 308 | 67.4% |
| No Computing Device | 31 | 6.8% |
| Total | 457 | 100.0% |
Internet Access in Taos
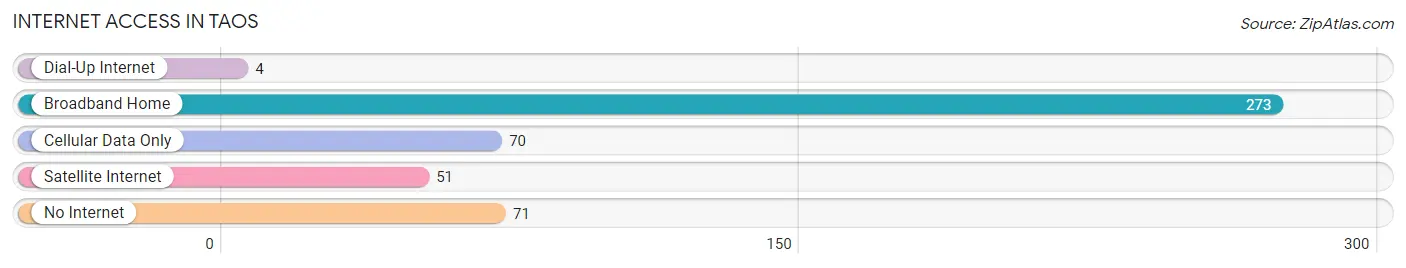
| Internet Type | # Households | % Households |
| Dial-Up Internet | 4 | 0.9% |
| Broadband Home | 273 | 59.7% |
| Cellular Data Only | 70 | 15.3% |
| Satellite Internet | 51 | 11.2% |
| No Internet | 71 | 15.5% |
| Total | 457 | 100.0% |
Taos Summary
Taos is a small town located in the Ozark Mountains of Missouri. It is situated in the southeastern corner of the state, near the Arkansas border. The town has a population of just over 1,000 people and is the county seat of Taney County.
History
Taos was founded in 1837 by a group of settlers from Tennessee. The town was named after the nearby Taos Indian tribe, who had lived in the area for centuries. The town was originally a trading post for the local Native American tribes, and it quickly grew into a small farming community.
In the late 1800s, Taos became a popular tourist destination due to its proximity to the Ozark Mountains. The town was also known for its mineral springs, which were believed to have healing properties.
In the early 1900s, Taos was a popular destination for wealthy tourists from St. Louis and other cities. The town was home to several resorts, including the Taos Hotel and the Taos Inn.
Geography
Taos is located in the Ozark Mountains of Missouri. The town is situated in the southeastern corner of the state, near the Arkansas border. The town is surrounded by rolling hills and forests, and is located near several rivers and streams.
The climate in Taos is humid subtropical, with hot summers and mild winters. The average annual temperature is around 60 degrees Fahrenheit.
Economy
The economy of Taos is largely based on tourism and agriculture. The town is home to several resorts and restaurants, as well as several farms and ranches. The town is also home to several small businesses, including a grocery store, a hardware store, and a gas station.
Demographics
As of the 2010 census, the population of Taos was 1,072. The racial makeup of the town was 97.2% White, 0.7% African American, 0.3% Native American, 0.2% Asian, 0.1% Pacific Islander, and 1.5% from other races. The median household income was $31,250, and the median family income was $37,500.
Conclusion
Taos is a small town located in the Ozark Mountains of Missouri. It is situated in the southeastern corner of the state, near the Arkansas border. The town has a population of just over 1,000 people and is the county seat of Taney County. The economy of Taos is largely based on tourism and agriculture, and the town is home to several resorts and restaurants, as well as several farms and ranches. The racial makeup of the town is predominantly White, with a small percentage of African American, Native American, Asian, and Pacific Islander residents.
Common Questions
What is Per Capita Income in Taos?
Per Capita income in Taos is $41,253.
What is the Median Family Income in Taos?
Median Family Income in Taos is $119,712.
What is the Median Household income in Taos?
Median Household Income in Taos is $101,354.
What is Income or Wage Gap in Taos?
Income or Wage Gap in Taos is 31.0%.
Women in Taos earn 69.0 cents for every dollar earned by a man.
What is Inequality or Gini Index in Taos?
Inequality or Gini Index in Taos is 0.38.
What is the Total Population of Taos?
Total Population of Taos is 1,275.
What is the Total Male Population of Taos?
Total Male Population of Taos is 664.
What is the Total Female Population of Taos?
Total Female Population of Taos is 611.
What is the Ratio of Males per 100 Females in Taos?
There are 108.67 Males per 100 Females in Taos.
What is the Ratio of Females per 100 Males in Taos?
There are 92.02 Females per 100 Males in Taos.
What is the Median Population Age in Taos?
Median Population Age in Taos is 46.1 Years.
What is the Average Family Size in Taos
Average Family Size in Taos is 3.4 People.
What is the Average Household Size in Taos
Average Household Size in Taos is 2.8 People.
How Large is the Labor Force in Taos?
There are 623 People in the Labor Forcein in Taos.
What is the Percentage of People in the Labor Force in Taos?
64.2% of People are in the Labor Force in Taos.
What is the Unemployment Rate in Taos?
Unemployment Rate in Taos is 1.3%.