Zip Codes with the Lowest Poverty Level Among Children Under the Age of 5 in Kansas City, MO

RELATED REPORTS & OPTIONS

Lowest Poverty | Child 0-5
Population
Families and Households
Female Fertility
Female Fertility (Unmarried)
Race (Community Size)
Race (Percentage)
Ancestry (Community Size)
AfghanAfricanAlaska NativeAlbanianAmericanApacheArabArgentineanArmenianAustralianAustrianBahamianBangladeshiBelgianBelizeanBhutaneseBlackfeetBolivianBrazilianBritishBulgarianBurmeseCanadianCelticCentral AmericanCentral American IndianCherokeeChickasawChileanChippewaChoctawColombianComancheCosta RicanCreeCreekCroatianCrowCubanCzechCzechoslovakianDanishDominicanDutchDutch West IndianEastern EuropeanEcuadorianEgyptianEnglishEthiopianEuropeanFijianFilipinoFinnishFrenchFrench American IndianFrench CanadianGermanGerman RussianGhanaianGreekGuamanian / ChamorroGuatemalanGuyaneseHaitianHonduranHungarianIcelanderIndian (Asian)IndonesianIranianIraqiIrishIroquoisIsraeliItalianJamaicanJapaneseJordanianKenyanKoreanLaotianLatvianLebaneseLiberianLithuanianLuxembourgerMalaysianMexicanMexican American IndianMongolianMoroccanNative HawaiianNavajoNew ZealanderNicaraguanNigerianNorthern EuropeanNorwegianOsageOttawaPakistaniPalestinianPanamanianPennsylvania GermanPeruvianPolishPortuguesePotawatomiPuebloPuerto RicanRomanianRussianSalvadoranSamoanScandinavianScotch-IrishScottishSeminoleSerbianShoshoneSierra LeoneanSiouxSlavicSlovakSloveneSomaliSouth AfricanSouth AmericanSouth American IndianSpaniardSpanishSri LankanSubsaharan AfricanSudaneseSwedishSwissSyrianThaiTrinidadian and TobagonianTurkishUgandanUkrainianUruguayanVenezuelanVietnameseWelshWest IndianYugoslavian
Ancestry (Percentage)
AfghanAfricanAlaska NativeAlbanianAmericanApacheArabArgentineanArmenianAustralianAustrianBahamianBangladeshiBelgianBelizeanBhutaneseBlackfeetBolivianBrazilianBritishBulgarianBurmeseCanadianCelticCentral AmericanCentral American IndianCherokeeChickasawChileanChippewaChoctawColombianComancheCosta RicanCreeCreekCroatianCrowCubanCzechCzechoslovakianDanishDominicanDutchDutch West IndianEastern EuropeanEcuadorianEgyptianEnglishEthiopianEuropeanFijianFilipinoFinnishFrenchFrench American IndianFrench CanadianGermanGerman RussianGhanaianGreekGuamanian / ChamorroGuatemalanGuyaneseHaitianHonduranHungarianIcelanderIndian (Asian)IndonesianIranianIraqiIrishIroquoisIsraeliItalianJamaicanJapaneseJordanianKenyanKoreanLaotianLatvianLebaneseLiberianLithuanianLuxembourgerMalaysianMexicanMexican American IndianMongolianMoroccanNative HawaiianNavajoNew ZealanderNicaraguanNigerianNorthern EuropeanNorwegianOsageOttawaPakistaniPalestinianPanamanianPennsylvania GermanPeruvianPolishPortuguesePotawatomiPuebloPuerto RicanRomanianRussianSalvadoranSamoanScandinavianScotch-IrishScottishSeminoleSerbianShoshoneSierra LeoneanSiouxSlavicSlovakSloveneSomaliSouth AfricanSouth AmericanSouth American IndianSpaniardSpanishSri LankanSubsaharan AfricanSudaneseSwedishSwissSyrianThaiTrinidadian and TobagonianTurkishUgandanUkrainianUruguayanVenezuelanVietnameseWelshWest IndianYugoslavian
Immigrant Origin (Total)
AfghanistanAfricaArgentinaAsiaAustraliaBahamasBangladeshBelarusBelgiumBelizeBoliviaBosnia and HerzegovinaBrazilBulgariaBurma / MyanmarCambodiaCameroonCanadaCaribbeanCentral AmericaChileChinaColombiaCongoCosta RicaCubaCzechoslovakiaDenmarkDominican RepublicEastern AfricaEastern AsiaEastern EuropeEcuadorEgyptEl SalvadorEnglandEritreaEthiopiaEuropeFijiFranceGermanyGhanaGreeceGuatemalaGuyanaHaitiHondurasHong KongHungaryIndiaIndonesiaIranIraqIrelandIsraelItalyJamaicaJapanJordanKazakhstanKenyaKoreaKuwaitLaosLatin AmericaLebanonLiberiaMalaysiaMexicoMicronesiaMiddle AfricaMoroccoNepalNetherlandsNicaraguaNigeriaNorthern AfricaNorthern EuropeOceaniaPakistanPeruPhilippinesPolandPortugalRomaniaRussiaSaudi ArabiaScotlandSierra LeoneSomaliaSouth AfricaSouth AmericaSouth Central AsiaSouth Eastern AsiaSouthern EuropeSpainSri LankaSudanSwedenSwitzerlandSyriaTaiwanThailandTrinidad and TobagoTurkeyUgandaUkraineUruguayVenezuelaVietnamWestern AfricaWestern AsiaWestern EuropeZaireZimbabwe
Immigrant Origin (Percentage)
AfghanistanAfricaArgentinaAsiaAustraliaBahamasBangladeshBelarusBelgiumBelizeBoliviaBosnia and HerzegovinaBrazilBulgariaBurma / MyanmarCambodiaCameroonCanadaCaribbeanCentral AmericaChileChinaColombiaCongoCosta RicaCubaCzechoslovakiaDenmarkDominican RepublicEastern AfricaEastern AsiaEastern EuropeEcuadorEgyptEl SalvadorEnglandEritreaEthiopiaEuropeFijiFranceGermanyGhanaGreeceGuatemalaGuyanaHaitiHondurasHong KongHungaryIndiaIndonesiaIranIraqIrelandIsraelItalyJamaicaJapanJordanKazakhstanKenyaKoreaKuwaitLaosLatin AmericaLebanonLiberiaMalaysiaMexicoMicronesiaMiddle AfricaMoroccoNepalNetherlandsNicaraguaNigeriaNorthern AfricaNorthern EuropeOceaniaPakistanPeruPhilippinesPolandPortugalRomaniaRussiaSaudi ArabiaScotlandSierra LeoneSomaliaSouth AfricaSouth AmericaSouth Central AsiaSouth Eastern AsiaSouthern EuropeSpainSri LankaSudanSwedenSwitzerlandSyriaTaiwanThailandTrinidad and TobagoTurkeyUgandaUkraineUruguayVenezuelaVietnamWestern AfricaWestern AsiaWestern EuropeZaireZimbabwe
Income
Income (Families)
Income (Households)
Poverty
Poverty (Families)
Unemployment
Employment Occupations
Employment Industries
Employer Class
Commute Time
Commute Means
School Enrollment
Education by Degree Field
Occupancy
Finances
Physical Characteristics
Kansas City
Compare Zip Codes
Comparison Subject

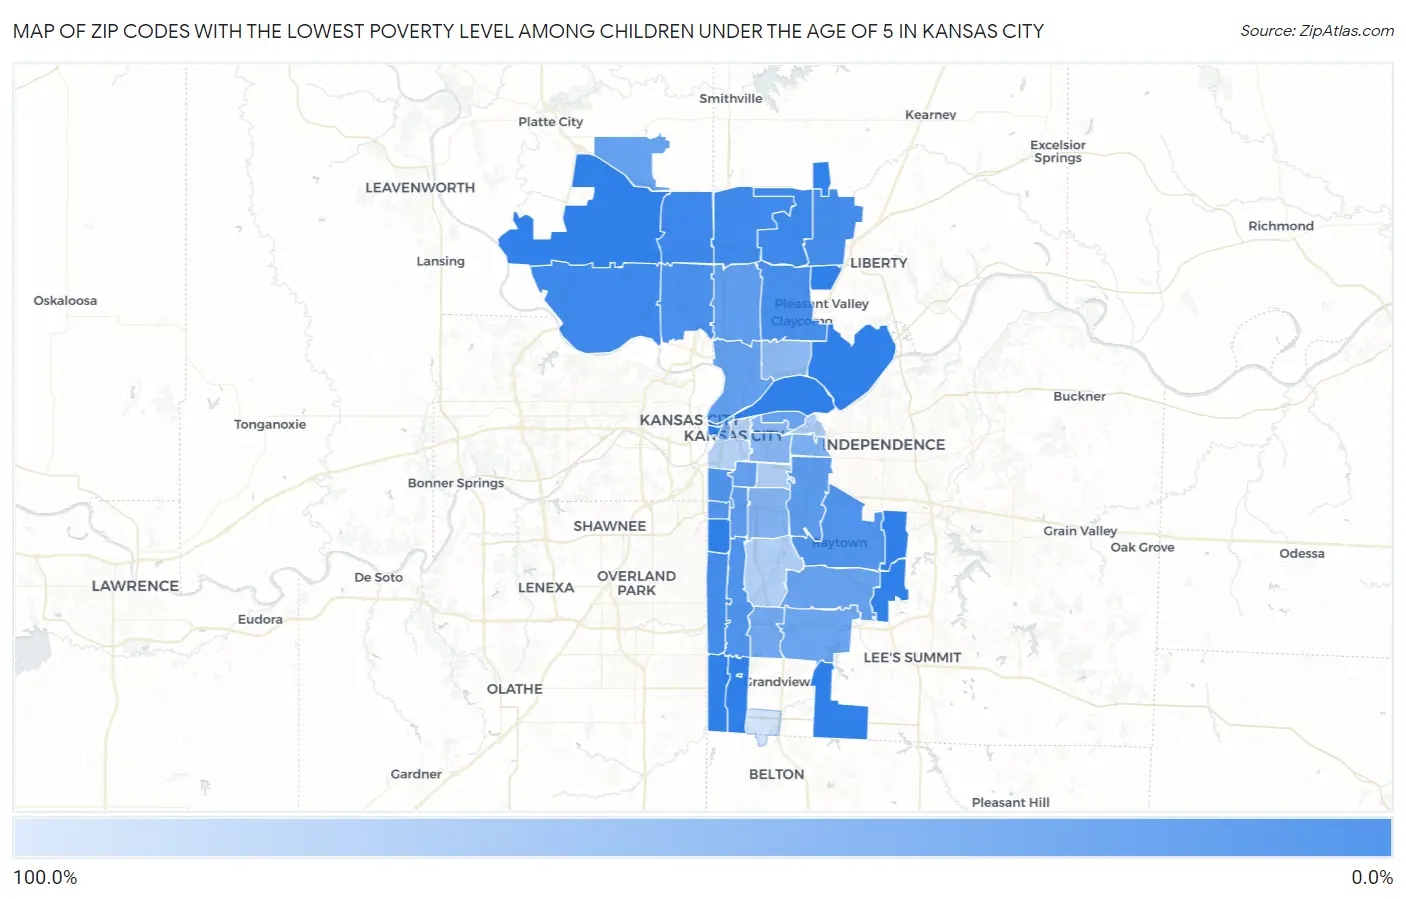
Map of Zip Codes with the Lowest Poverty Level Among Children Under the Age of 5 in Kansas City

100.0%
0.0%
Zip Codes with the Lowest Poverty Level Among Children Under the Age of 5 in Kansas City Map

Zip Codes with the Lowest Poverty Level Among Children Under the Age of 5 in Kansas City, MO

Zip Code Child Poverty vs State vs National
1.641540.94%18.4%(-17.5)#818.1%(-17.1)#250
2.641562.2%18.4%(-16.2)#3418.1%(-15.8)#990
3.641522.5%18.4%(-15.9)#4018.1%(-15.5)#1,180
4.641553.6%18.4%(-14.8)#5618.1%(-14.5)#1,861
5.641145.0%18.4%(-13.4)#8418.1%(-13.1)#2,883
6.641575.2%18.4%(-13.2)#8918.1%(-12.9)#3,028
7.641196.6%18.4%(-11.8)#11918.1%(-11.5)#4,002
8.641517.6%18.4%(-10.8)#13318.1%(-10.5)#4,650
9.6411110.3%18.4%(-8.09)#17618.1%(-7.74)#6,460
10.6413110.4%18.4%(-8.00)#17918.1%(-7.65)#6,508
11.6413311.2%18.4%(-7.23)#19118.1%(-6.88)#6,974
12.6411212.1%18.4%(-6.35)#21118.1%(-5.99)#7,505
13.6412917.4%18.4%(-0.967)#30018.1%(-0.615)#10,457
14.6411018.8%18.4%(+0.358)#31318.1%(+0.710)#11,071
15.6411819.2%18.4%(+0.765)#31818.1%(+1.12)#11,249
16.6410920.9%18.4%(+2.45)#34018.1%(+2.80)#12,023
17.6411621.0%18.4%(+2.56)#34218.1%(+2.91)#12,061
18.6416322.4%18.4%(+3.94)#36218.1%(+4.29)#12,652
19.6413823.0%18.4%(+4.62)#36818.1%(+4.97)#12,915
20.6412324.0%18.4%(+5.62)#38218.1%(+5.97)#13,335
21.6413426.3%18.4%(+7.87)#41218.1%(+8.22)#14,119
22.6413728.0%18.4%(+9.56)#43518.1%(+9.91)#14,700
23.6410533.3%18.4%(+14.9)#49118.1%(+15.3)#16,143
24.6412636.2%18.4%(+17.8)#52318.1%(+18.2)#16,903
25.6413039.1%18.4%(+20.7)#53918.1%(+21.1)#17,492
26.6412742.4%18.4%(+24.0)#56518.1%(+24.4)#18,090
27.6412442.7%18.4%(+24.3)#56718.1%(+24.7)#18,139
28.6411747.1%18.4%(+28.7)#58318.1%(+29.1)#18,763
29.6412567.7%18.4%(+49.3)#64718.1%(+49.6)#20,428
30.6412872.0%18.4%(+53.6)#65618.1%(+54.0)#20,592
31.6413274.5%18.4%(+56.1)#65718.1%(+56.4)#20,684
32.6410877.1%18.4%(+58.7)#66018.1%(+59.0)#20,777
33.6410679.8%18.4%(+61.4)#66218.1%(+61.8)#20,845
34.64147100.0%18.4%(+81.6)#67618.1%(+81.9)#21,316

Common Questions

What are the Top 10 Zip Codes with the Lowest Poverty Level Among Children Under the Age of 5 in Kansas City, MO?
Top 10 Zip Codes with the Lowest Poverty Level Among Children Under the Age of 5 in Kansas City, MO are:
#1
0.0%
#2
0.0%
#3
0.0%
#4
0.0%
#5
0.0%
#6
0.0%
#7
0.0%
#8
0.0%
#9
0.0%
#10
0.0%
What zip code has the Lowest Poverty Level Among Children Under the Age of 5 in Kansas City, MO?
64154 has the Lowest Poverty Level Among Children Under the Age of 5 in Kansas City, MO with 0.94%.
What is the Poverty Level Among Children Under the Age of 5 in Kansas City, MO?
Poverty Level Among Children Under the Age of 5 in Kansas City is 23.3%.
What is the Poverty Level Among Children Under the Age of 5 in Missouri?
Poverty Level Among Children Under the Age of 5 in Missouri is 18.4%.
What is the Poverty Level Among Children Under the Age of 5 in the United States?
Poverty Level Among Children Under the Age of 5 in the United States is 18.1%.