Smithton, MO Map & Demographics
Smithton Map
Smithton Overview
$28,031
PER CAPITA INCOME
$59,063
AVG FAMILY INCOME
$50,156
AVG HOUSEHOLD INCOME
24.7%
WAGE / INCOME GAP [ % ]
75.3¢/ $1
WAGE / INCOME GAP [ $ ]
0.39
INEQUALITY / GINI INDEX
514
TOTAL POPULATION
265
MALE POPULATION
249
FEMALE POPULATION
106.43
MALES / 100 FEMALES
93.96
FEMALES / 100 MALES
39.1
MEDIAN AGE
2.8
AVG FAMILY SIZE
2.3
AVG HOUSEHOLD SIZE
284
LABOR FORCE [ PEOPLE ]
69.4%
PERCENT IN LABOR FORCE
6.0%
UNEMPLOYMENT RATE
Smithton Zip Codes
Smithton Area Codes
Income in Smithton
Income Overview in Smithton
Per Capita Income in Smithton is $28,031, while median incomes of families and households are $59,063 and $50,156 respectively.
| Characteristic | Number | Measure |
| Per Capita Income | 514 | $28,031 |
| Median Family Income | 147 | $59,063 |
| Mean Family Income | 147 | $81,170 |
| Median Household Income | 221 | $50,156 |
| Mean Household Income | 221 | $65,402 |
| Income Deficit | 147 | $0 |
| Wage / Income Gap (%) | 514 | 24.74% |
| Wage / Income Gap ($) | 514 | 75.26¢ per $1 |
| Gini / Inequality Index | 514 | 0.39 |
Earnings by Sex in Smithton
Average Earnings in Smithton are $34,954, $44,063 for men and $33,162 for women, a difference of 24.7%.
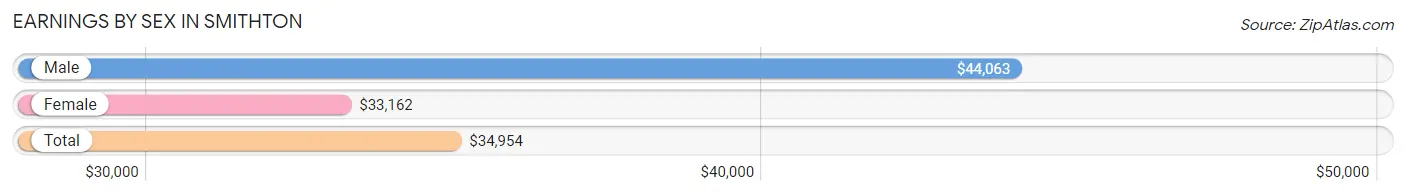
| Sex | Number | Average Earnings |
| Male | 142 (47.5%) | $44,063 |
| Female | 157 (52.5%) | $33,162 |
| Total | 299 (100.0%) | $34,954 |
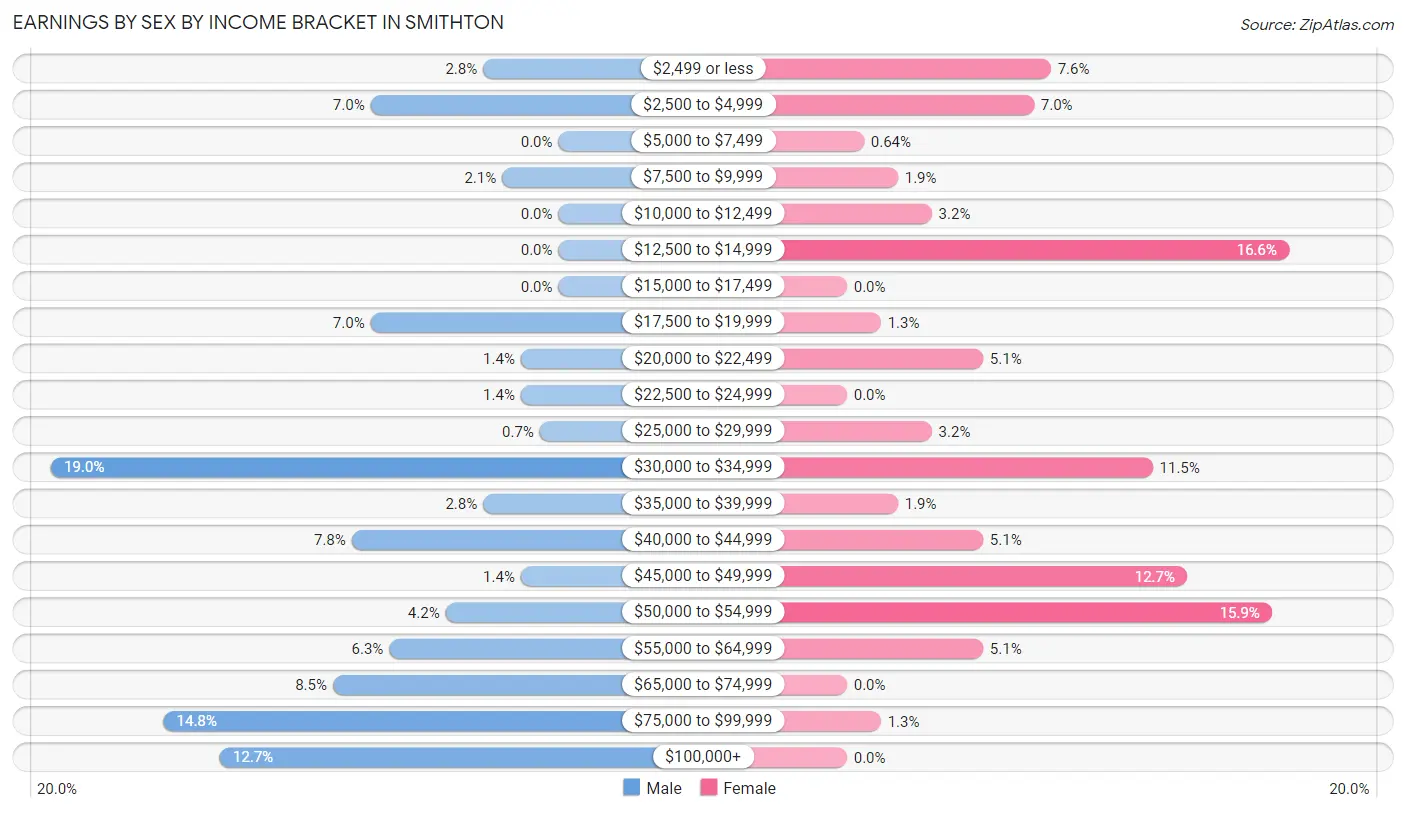
Earnings by Sex by Income Bracket in Smithton
The most common earnings brackets in Smithton are $30,000 to $34,999 for men (27 | 19.0%) and $12,500 to $14,999 for women (26 | 16.6%).
| Income | Male | Female |
| $2,499 or less | 4 (2.8%) | 12 (7.6%) |
| $2,500 to $4,999 | 10 (7.0%) | 11 (7.0%) |
| $5,000 to $7,499 | 0 (0.0%) | 1 (0.6%) |
| $7,500 to $9,999 | 3 (2.1%) | 3 (1.9%) |
| $10,000 to $12,499 | 0 (0.0%) | 5 (3.2%) |
| $12,500 to $14,999 | 0 (0.0%) | 26 (16.6%) |
| $15,000 to $17,499 | 0 (0.0%) | 0 (0.0%) |
| $17,500 to $19,999 | 10 (7.0%) | 2 (1.3%) |
| $20,000 to $22,499 | 2 (1.4%) | 8 (5.1%) |
| $22,500 to $24,999 | 2 (1.4%) | 0 (0.0%) |
| $25,000 to $29,999 | 1 (0.7%) | 5 (3.2%) |
| $30,000 to $34,999 | 27 (19.0%) | 18 (11.5%) |
| $35,000 to $39,999 | 4 (2.8%) | 3 (1.9%) |
| $40,000 to $44,999 | 11 (7.7%) | 8 (5.1%) |
| $45,000 to $49,999 | 2 (1.4%) | 20 (12.7%) |
| $50,000 to $54,999 | 6 (4.2%) | 25 (15.9%) |
| $55,000 to $64,999 | 9 (6.3%) | 8 (5.1%) |
| $65,000 to $74,999 | 12 (8.5%) | 0 (0.0%) |
| $75,000 to $99,999 | 21 (14.8%) | 2 (1.3%) |
| $100,000+ | 18 (12.7%) | 0 (0.0%) |
| Total | 142 (100.0%) | 157 (100.0%) |
Earnings by Sex by Educational Attainment in Smithton
Average earnings in Smithton are $46,250 for men and $36,250 for women, a difference of 21.6%. Men with an educational attainment of high school diploma enjoy the highest average annual earnings of $75,156, while those with college or associate's degree education earn the least with $33,875. Women with an educational attainment of graduate degree earn the most with the average annual earnings of $52,500, while those with high school diploma education have the smallest earnings of $20,625.
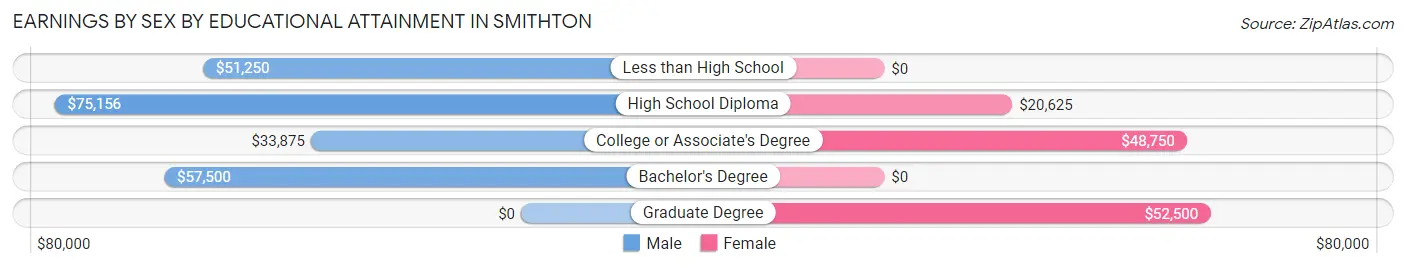
| Educational Attainment | Male Income | Female Income |
| Less than High School | $51,250 | $0 |
| High School Diploma | $75,156 | $20,625 |
| College or Associate's Degree | $33,875 | $48,750 |
| Bachelor's Degree | $57,500 | $0 |
| Graduate Degree | - | - |
| Total | $46,250 | $36,250 |
Family Income in Smithton
Family Income Brackets in Smithton
According to the Smithton family income data, there are 42 families falling into the $35,000 to $49,999 income range, which is the most common income bracket and makes up 28.6% of all families.
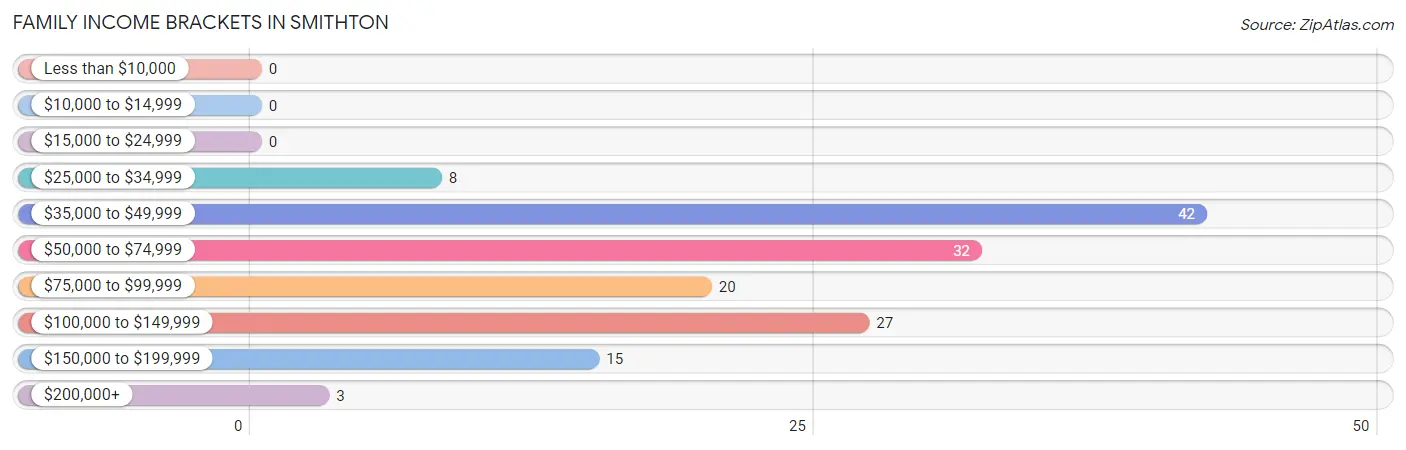
| Income Bracket | # Families | % Families |
| Less than $10,000 | 0 | 0.0% |
| $10,000 to $14,999 | 0 | 0.0% |
| $15,000 to $24,999 | 0 | 0.0% |
| $25,000 to $34,999 | 8 | 5.4% |
| $35,000 to $49,999 | 42 | 28.6% |
| $50,000 to $74,999 | 32 | 21.8% |
| $75,000 to $99,999 | 20 | 13.6% |
| $100,000 to $149,999 | 27 | 18.4% |
| $150,000 to $199,999 | 15 | 10.2% |
| $200,000+ | 3 | 2.0% |
Family Income by Famaliy Size in Smithton
6-person families (7 | 4.8%) account for the highest median family income in Smithton with $135,625 per family, while 3-person families (44 | 29.9%) have the highest median income of $29,722 per family member.
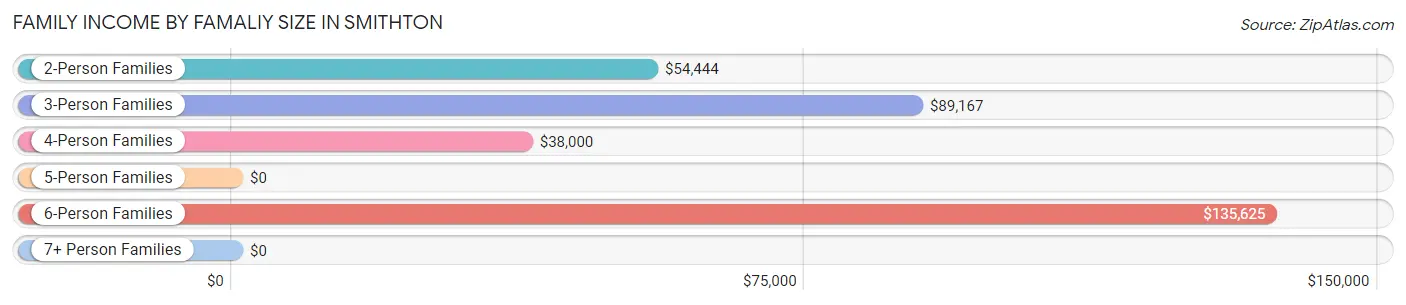
| Income Bracket | # Families | Median Income |
| 2-Person Families | 66 (44.9%) | $54,444 |
| 3-Person Families | 44 (29.9%) | $89,167 |
| 4-Person Families | 26 (17.7%) | $38,000 |
| 5-Person Families | 4 (2.7%) | $0 |
| 6-Person Families | 7 (4.8%) | $135,625 |
| 7+ Person Families | 0 (0.0%) | $0 |
| Total | 147 (100.0%) | $59,063 |
Family Income by Number of Earners in Smithton
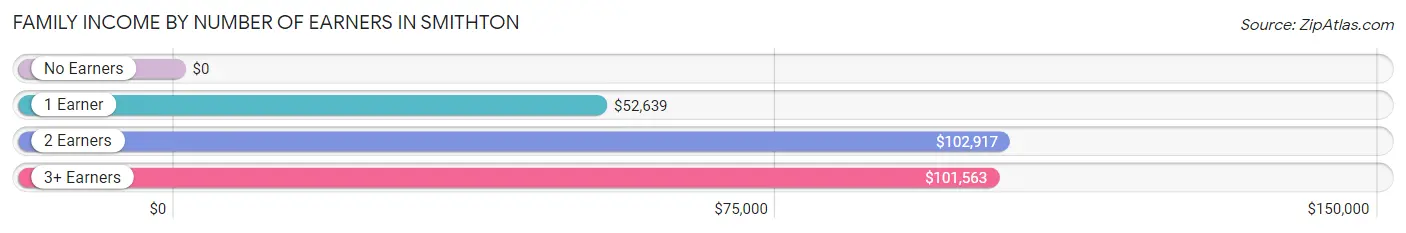
| Number of Earners | # Families | Median Income |
| No Earners | 11 (7.5%) | $0 |
| 1 Earner | 61 (41.5%) | $52,639 |
| 2 Earners | 45 (30.6%) | $102,917 |
| 3+ Earners | 30 (20.4%) | $101,563 |
| Total | 147 (100.0%) | $59,063 |
Household Income in Smithton
Household Income Brackets in Smithton
With 47 households falling in the category, the $35,000 to $49,999 income range is the most frequent in Smithton, accounting for 21.3% of all households. In contrast, only 3 households (1.4%) fall into the $200,000+ income bracket, making it the least populous group.
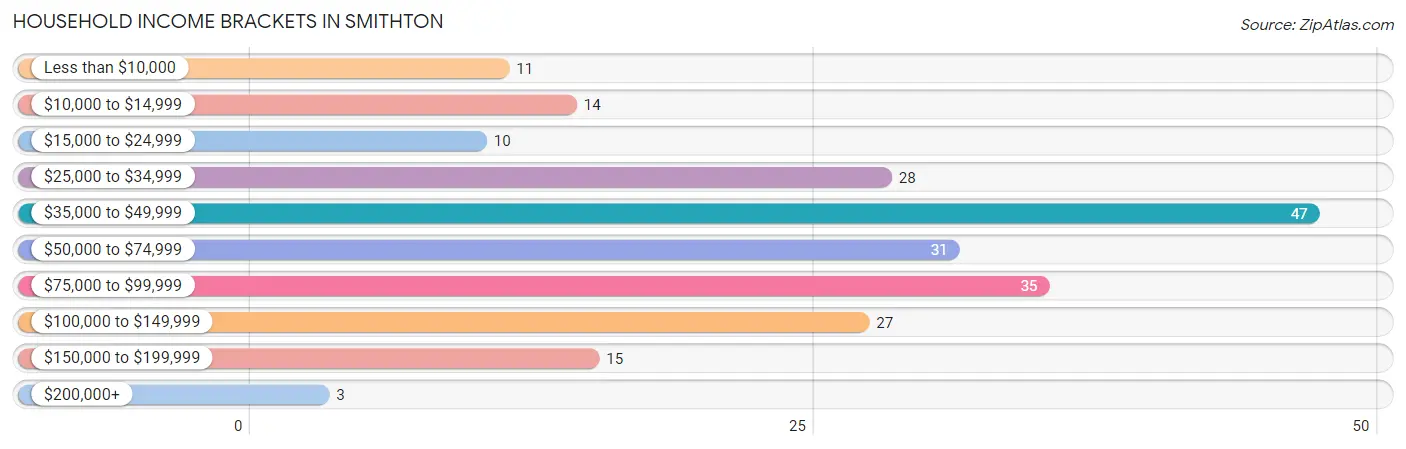
| Income Bracket | # Households | % Households |
| Less than $10,000 | 11 | 5.0% |
| $10,000 to $14,999 | 14 | 6.3% |
| $15,000 to $24,999 | 10 | 4.5% |
| $25,000 to $34,999 | 28 | 12.7% |
| $35,000 to $49,999 | 47 | 21.3% |
| $50,000 to $74,999 | 31 | 14.0% |
| $75,000 to $99,999 | 35 | 15.8% |
| $100,000 to $149,999 | 27 | 12.2% |
| $150,000 to $199,999 | 15 | 6.8% |
| $200,000+ | 3 | 1.4% |
Household Income by Householder Age in Smithton
The median household income in Smithton is $50,156, with the highest median household income of $79,792 found in the 45 to 64 years age bracket for the primary householder. A total of 93 households (42.1%) fall into this category. Meanwhile, the 15 to 24 years age bracket for the primary householder has the lowest median household income of $0, with 9 households (4.1%) in this group.
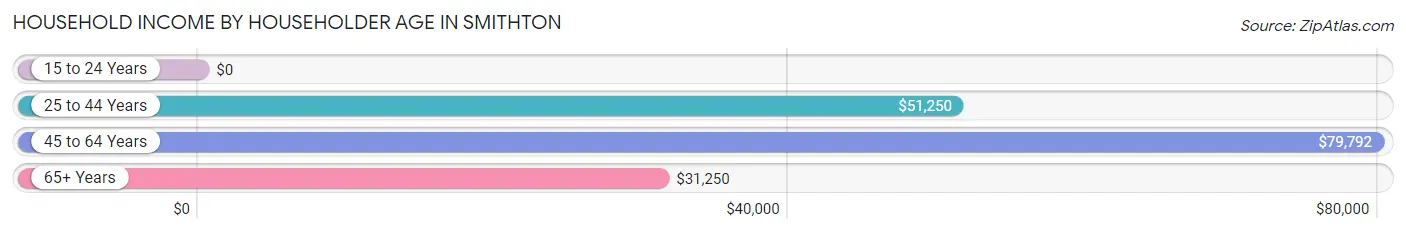
| Income Bracket | # Households | Median Income |
| 15 to 24 Years | 9 (4.1%) | $0 |
| 25 to 44 Years | 86 (38.9%) | $51,250 |
| 45 to 64 Years | 93 (42.1%) | $79,792 |
| 65+ Years | 33 (14.9%) | $31,250 |
| Total | 221 (100.0%) | $50,156 |
Poverty in Smithton
Income Below Poverty by Sex and Age in Smithton
With 9.6% poverty level for males and 8.4% for females among the residents of Smithton, 18 to 24 year old males and 75 year old and over females are the most vulnerable to poverty, with 5 males (100.0%) and 2 females (50.0%) in their respective age groups living below the poverty level.
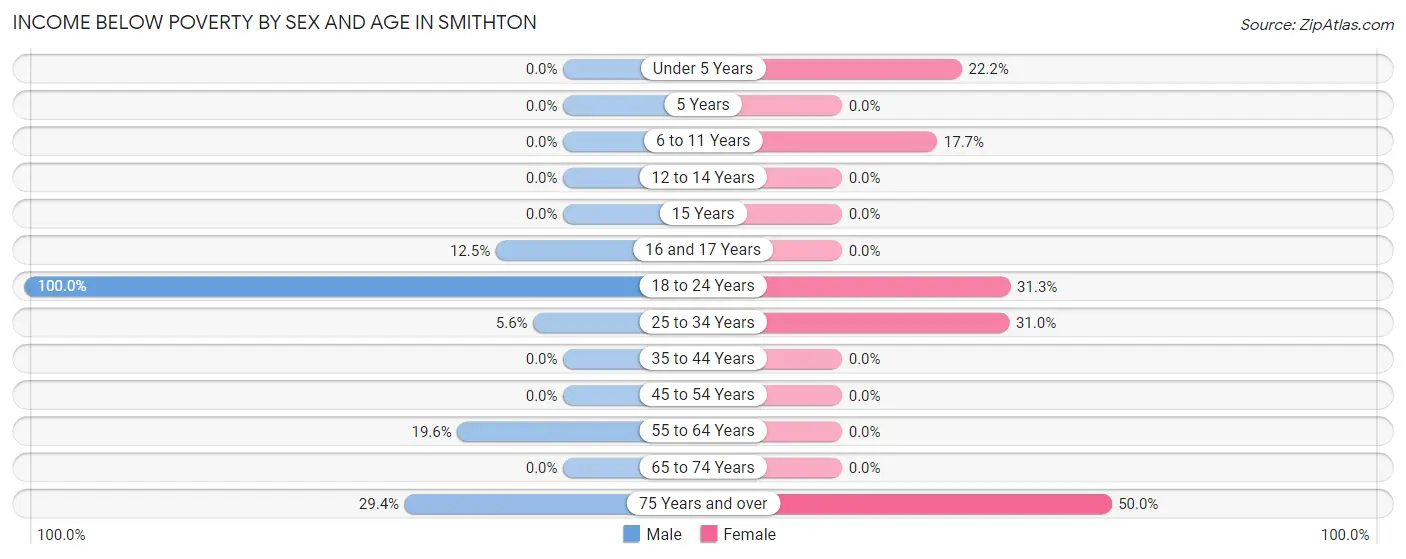
| Age Bracket | Male | Female |
| Under 5 Years | 0 (0.0%) | 2 (22.2%) |
| 5 Years | 0 (0.0%) | 0 (0.0%) |
| 6 to 11 Years | 0 (0.0%) | 3 (17.6%) |
| 12 to 14 Years | 0 (0.0%) | 0 (0.0%) |
| 15 Years | 0 (0.0%) | 0 (0.0%) |
| 16 and 17 Years | 2 (12.5%) | 0 (0.0%) |
| 18 to 24 Years | 5 (100.0%) | 5 (31.2%) |
| 25 to 34 Years | 2 (5.6%) | 9 (31.0%) |
| 35 to 44 Years | 0 (0.0%) | 0 (0.0%) |
| 45 to 54 Years | 0 (0.0%) | 0 (0.0%) |
| 55 to 64 Years | 11 (19.6%) | 0 (0.0%) |
| 65 to 74 Years | 0 (0.0%) | 0 (0.0%) |
| 75 Years and over | 5 (29.4%) | 2 (50.0%) |
| Total | 25 (9.6%) | 21 (8.4%) |
Income Above Poverty by Sex and Age in Smithton
According to the poverty statistics in Smithton, males aged under 5 years and females aged 5 years are the age groups that are most secure financially, with 100.0% of males and 100.0% of females in these age groups living above the poverty line.
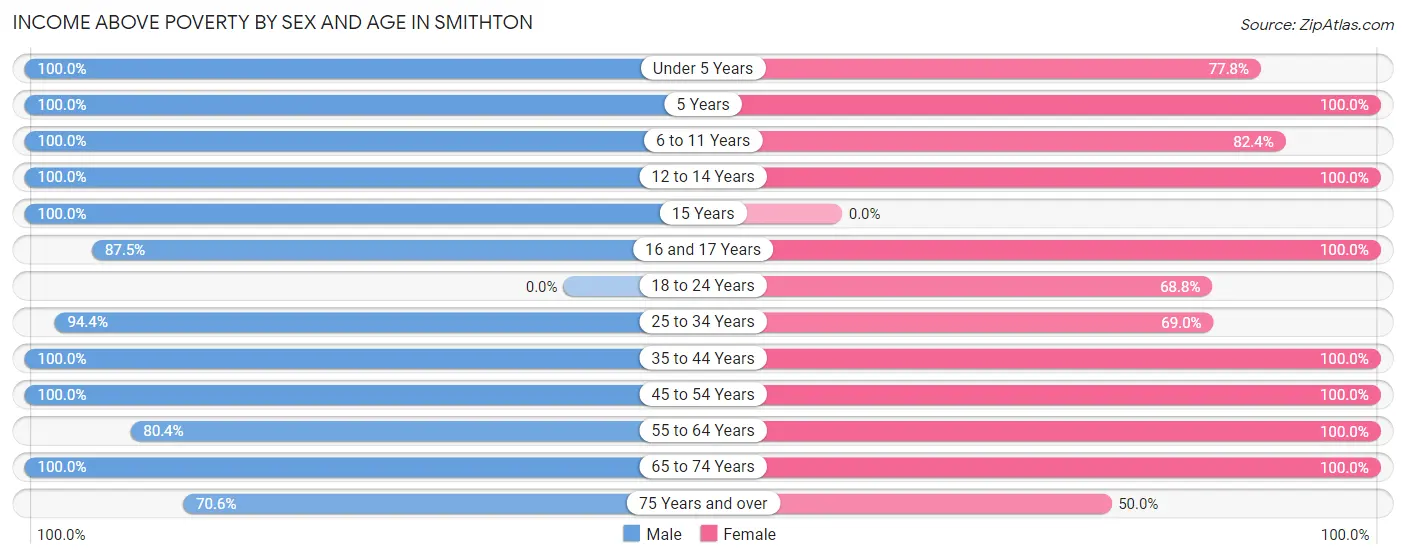
| Age Bracket | Male | Female |
| Under 5 Years | 27 (100.0%) | 7 (77.8%) |
| 5 Years | 18 (100.0%) | 3 (100.0%) |
| 6 to 11 Years | 6 (100.0%) | 14 (82.4%) |
| 12 to 14 Years | 2 (100.0%) | 6 (100.0%) |
| 15 Years | 15 (100.0%) | 0 (0.0%) |
| 16 and 17 Years | 14 (87.5%) | 22 (100.0%) |
| 18 to 24 Years | 0 (0.0%) | 11 (68.8%) |
| 25 to 34 Years | 34 (94.4%) | 20 (69.0%) |
| 35 to 44 Years | 29 (100.0%) | 56 (100.0%) |
| 45 to 54 Years | 29 (100.0%) | 61 (100.0%) |
| 55 to 64 Years | 45 (80.4%) | 9 (100.0%) |
| 65 to 74 Years | 5 (100.0%) | 17 (100.0%) |
| 75 Years and over | 12 (70.6%) | 2 (50.0%) |
| Total | 236 (90.4%) | 228 (91.6%) |
Income Below Poverty Among Married-Couple Families in Smithton
The poverty statistics for married-couple families in Smithton show that 1.9% or 2 of the total 106 families live below the poverty line. Families with 1 or 2 children have the highest poverty rate of 4.4%, comprising of 2 families. On the other hand, families with no children have the lowest poverty rate of 0.0%, which includes 0 families.
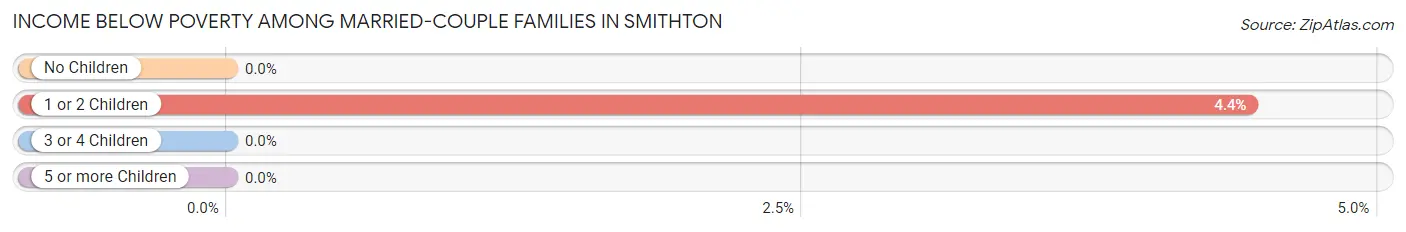
| Children | Above Poverty | Below Poverty |
| No Children | 54 (100.0%) | 0 (0.0%) |
| 1 or 2 Children | 43 (95.6%) | 2 (4.4%) |
| 3 or 4 Children | 7 (100.0%) | 0 (0.0%) |
| 5 or more Children | 0 (0.0%) | 0 (0.0%) |
| Total | 104 (98.1%) | 2 (1.9%) |
Income Below Poverty Among Single-Parent Households in Smithton
| Children | Single Father | Single Mother |
| No Children | 0 (0.0%) | 0 (0.0%) |
| 1 or 2 Children | 0 (0.0%) | 0 (0.0%) |
| 3 or 4 Children | 0 (0.0%) | 0 (0.0%) |
| 5 or more Children | 0 (0.0%) | 0 (0.0%) |
| Total | 0 (0.0%) | 0 (0.0%) |
Income Below Poverty Among Married-Couple vs Single-Parent Households in Smithton
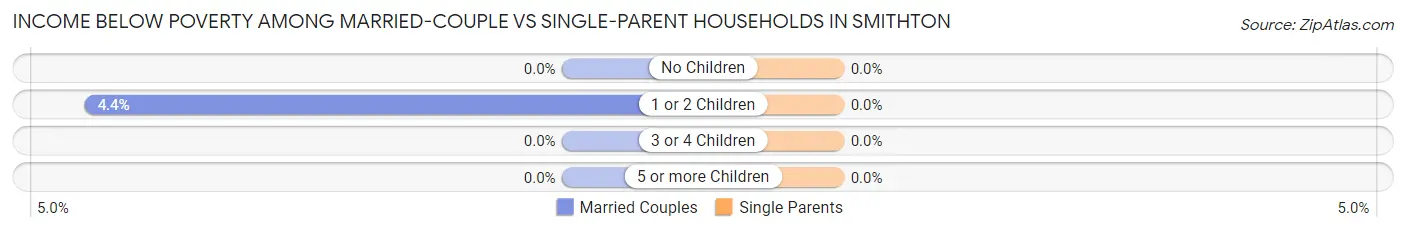
| Children | Married-Couple Families | Single-Parent Households |
| No Children | 0 (0.0%) | 0 (0.0%) |
| 1 or 2 Children | 2 (4.4%) | 0 (0.0%) |
| 3 or 4 Children | 0 (0.0%) | 0 (0.0%) |
| 5 or more Children | 0 (0.0%) | 0 (0.0%) |
| Total | 2 (1.9%) | 0 (0.0%) |
Race in Smithton
The most populous races in Smithton are White / Caucasian (487 | 94.8%), Black / African American (18 | 3.5%), and Hispanic or Latino (16 | 3.1%).
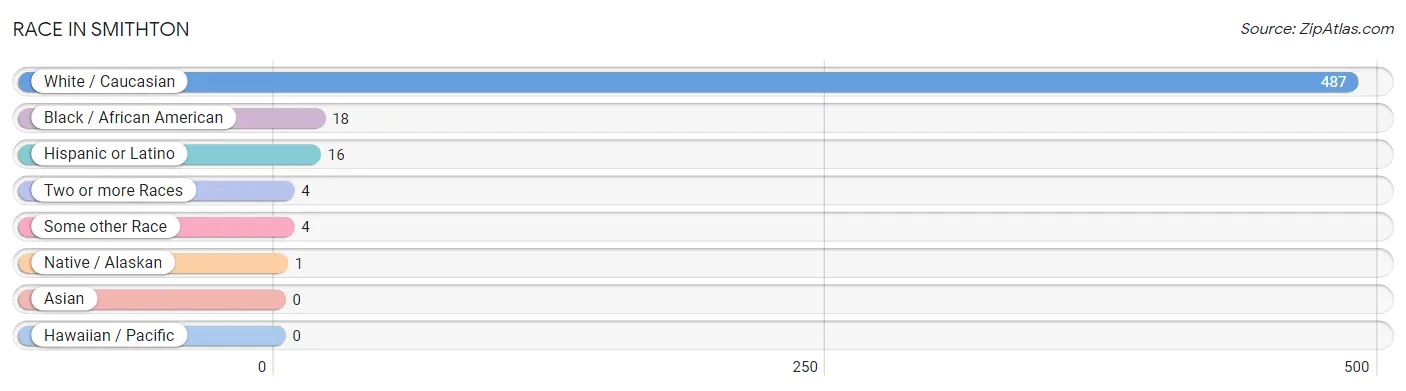
| Race | # Population | % Population |
| Asian | 0 | 0.0% |
| Black / African American | 18 | 3.5% |
| Hawaiian / Pacific | 0 | 0.0% |
| Hispanic or Latino | 16 | 3.1% |
| Native / Alaskan | 1 | 0.2% |
| White / Caucasian | 487 | 94.8% |
| Two or more Races | 4 | 0.8% |
| Some other Race | 4 | 0.8% |
| Total | 514 | 100.0% |
Ancestry in Smithton
The most populous ancestries reported in Smithton are German (97 | 18.9%), English (93 | 18.1%), Irish (27 | 5.2%), American (22 | 4.3%), and Mexican (14 | 2.7%), together accounting for 49.2% of all Smithton residents.
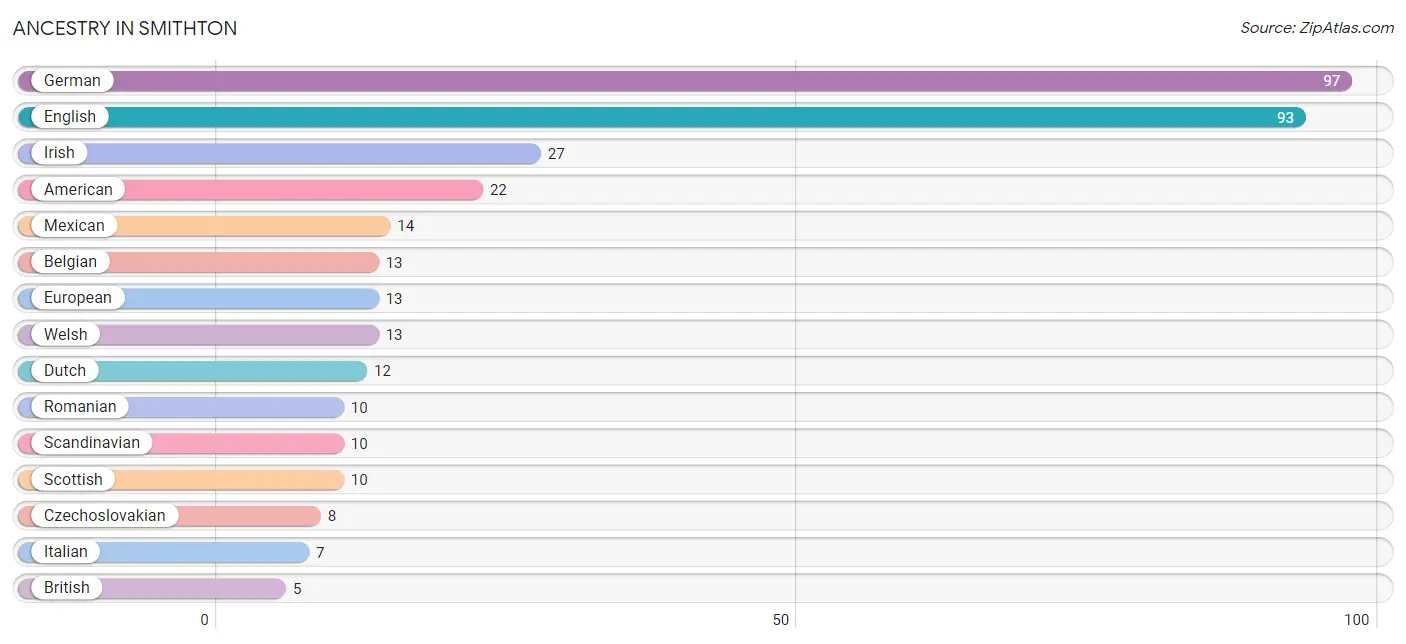
| Ancestry | # Population | % Population |
| American | 22 | 4.3% |
| Belgian | 13 | 2.5% |
| Bhutanese | 1 | 0.2% |
| British | 5 | 1.0% |
| Central American | 2 | 0.4% |
| Czechoslovakian | 8 | 1.6% |
| Dutch | 12 | 2.3% |
| English | 93 | 18.1% |
| European | 13 | 2.5% |
| German | 97 | 18.9% |
| Irish | 27 | 5.2% |
| Italian | 7 | 1.4% |
| Mexican | 14 | 2.7% |
| Romanian | 10 | 1.9% |
| Salvadoran | 2 | 0.4% |
| Scandinavian | 10 | 1.9% |
| Scottish | 10 | 1.9% |
| Swedish | 2 | 0.4% |
| Ukrainian | 2 | 0.4% |
| Welsh | 13 | 2.5% | View All 20 Rows |
Immigrants in Smithton
The most numerous immigrant groups reported in Smithton came from Eastern Europe (10 | 1.9%), Europe (10 | 1.9%), Moldova (8 | 1.6%), Central America (2 | 0.4%), and El Salvador (2 | 0.4%), together accounting for 6.2% of all Smithton residents.
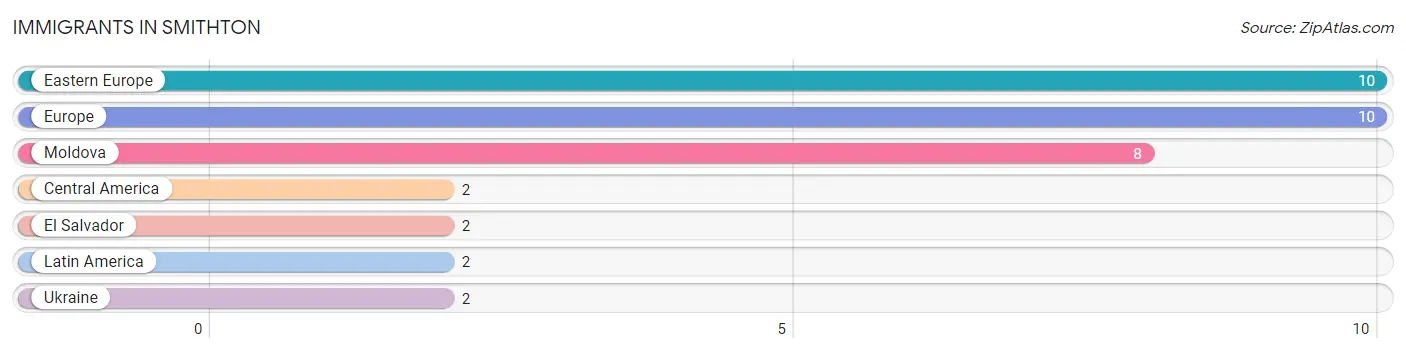
| Immigration Origin | # Population | % Population |
| Central America | 2 | 0.4% |
| Eastern Europe | 10 | 1.9% |
| El Salvador | 2 | 0.4% |
| Europe | 10 | 1.9% |
| Latin America | 2 | 0.4% |
| Moldova | 8 | 1.6% |
| Ukraine | 2 | 0.4% | View All 7 Rows |
Sex and Age in Smithton
Sex and Age in Smithton
The most populous age groups in Smithton are 55 to 59 Years (38 | 14.3%) for men and 50 to 54 Years (54 | 21.7%) for women.
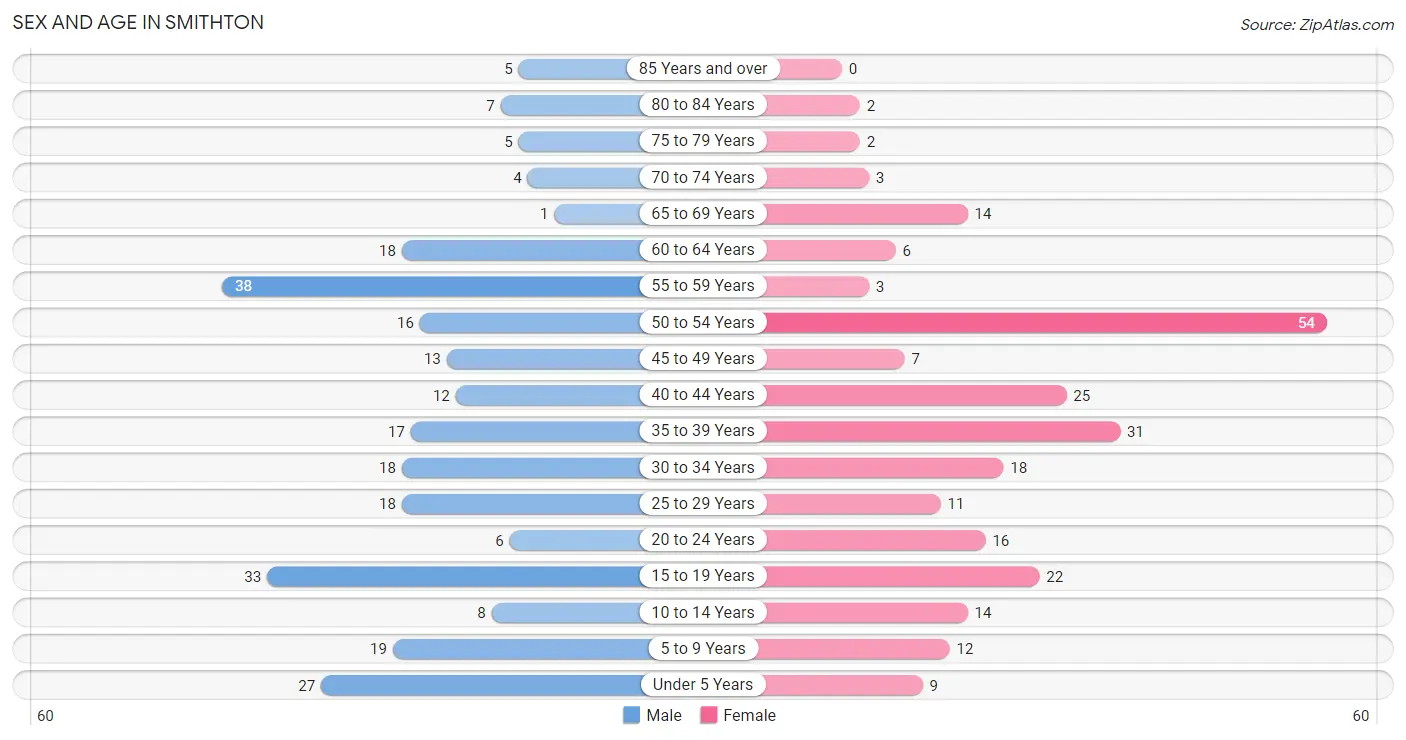
| Age Bracket | Male | Female |
| Under 5 Years | 27 (10.2%) | 9 (3.6%) |
| 5 to 9 Years | 19 (7.2%) | 12 (4.8%) |
| 10 to 14 Years | 8 (3.0%) | 14 (5.6%) |
| 15 to 19 Years | 33 (12.4%) | 22 (8.8%) |
| 20 to 24 Years | 6 (2.3%) | 16 (6.4%) |
| 25 to 29 Years | 18 (6.8%) | 11 (4.4%) |
| 30 to 34 Years | 18 (6.8%) | 18 (7.2%) |
| 35 to 39 Years | 17 (6.4%) | 31 (12.4%) |
| 40 to 44 Years | 12 (4.5%) | 25 (10.0%) |
| 45 to 49 Years | 13 (4.9%) | 7 (2.8%) |
| 50 to 54 Years | 16 (6.0%) | 54 (21.7%) |
| 55 to 59 Years | 38 (14.3%) | 3 (1.2%) |
| 60 to 64 Years | 18 (6.8%) | 6 (2.4%) |
| 65 to 69 Years | 1 (0.4%) | 14 (5.6%) |
| 70 to 74 Years | 4 (1.5%) | 3 (1.2%) |
| 75 to 79 Years | 5 (1.9%) | 2 (0.8%) |
| 80 to 84 Years | 7 (2.6%) | 2 (0.8%) |
| 85 Years and over | 5 (1.9%) | 0 (0.0%) |
| Total | 265 (100.0%) | 249 (100.0%) |
Families and Households in Smithton
Median Family Size in Smithton
The median family size in Smithton is 2.76 persons per family, with married-couple families (106 | 72.1%) accounting for the largest median family size of 2.83 persons per family. On the other hand, single male/father families (7 | 4.8%) represent the smallest median family size with 1.43 persons per family.
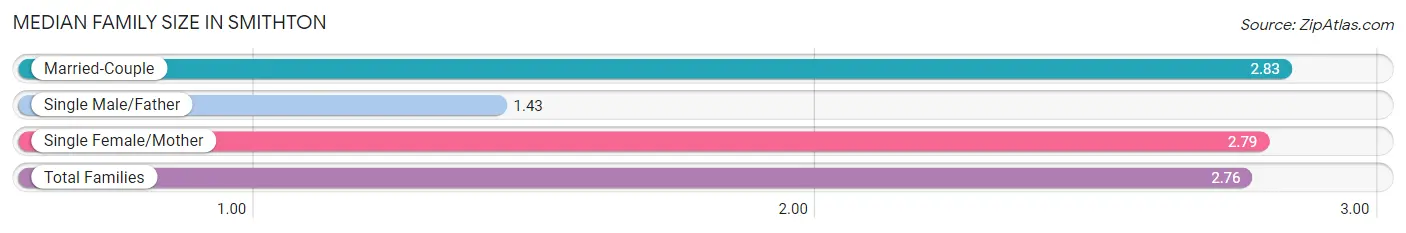
| Family Type | # Families | Family Size |
| Married-Couple | 106 (72.1%) | 2.83 |
| Single Male/Father | 7 (4.8%) | 1.43 |
| Single Female/Mother | 34 (23.1%) | 2.79 |
| Total Families | 147 (100.0%) | 2.76 |
Median Household Size in Smithton
The median household size in Smithton is 2.31 persons per household, with single female/mother households (34 | 15.4%) accounting for the largest median household size of 3.56 persons per household. non-family households (74 | 33.5%) represent the smallest median household size with 1.07 persons per household.
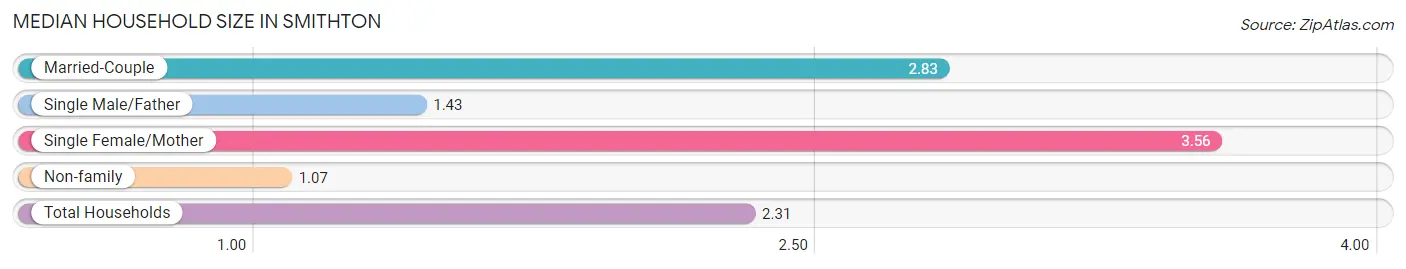
| Household Type | # Households | Household Size |
| Married-Couple | 106 (48.0%) | 2.83 |
| Single Male/Father | 7 (3.2%) | 1.43 |
| Single Female/Mother | 34 (15.4%) | 3.56 |
| Non-family | 74 (33.5%) | 1.07 |
| Total Households | 221 (100.0%) | 2.31 |
Household Size by Marriage Status in Smithton
Out of a total of 221 households in Smithton, 147 (66.5%) are family households, while 74 (33.5%) are nonfamily households. The most numerous type of family households are 2-person households, comprising 57, and the most common type of nonfamily households are 1-person households, comprising 70.
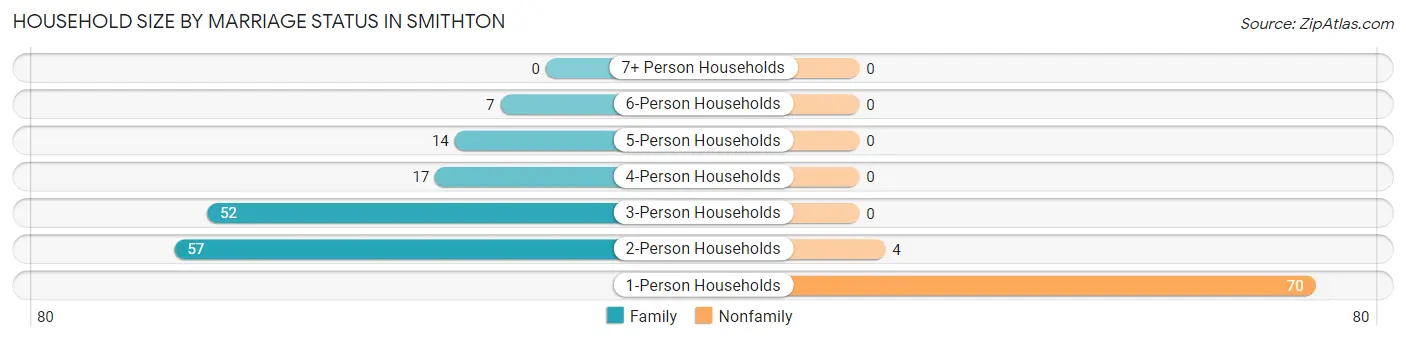
| Household Size | Family Households | Nonfamily Households |
| 1-Person Households | - | 70 (31.7%) |
| 2-Person Households | 57 (25.8%) | 4 (1.8%) |
| 3-Person Households | 52 (23.5%) | 0 (0.0%) |
| 4-Person Households | 17 (7.7%) | 0 (0.0%) |
| 5-Person Households | 14 (6.3%) | 0 (0.0%) |
| 6-Person Households | 7 (3.2%) | 0 (0.0%) |
| 7+ Person Households | 0 (0.0%) | 0 (0.0%) |
| Total | 147 (66.5%) | 74 (33.5%) |
Female Fertility in Smithton
Fertility by Age in Smithton
Average fertility rate in Smithton is 46.0 births per 1,000 women. Women in the age bracket of 20 to 34 years have the highest fertility rate with 133.0 births per 1,000 women. Women in the age bracket of 20 to 34 years acount for 100.0% of all women with births.
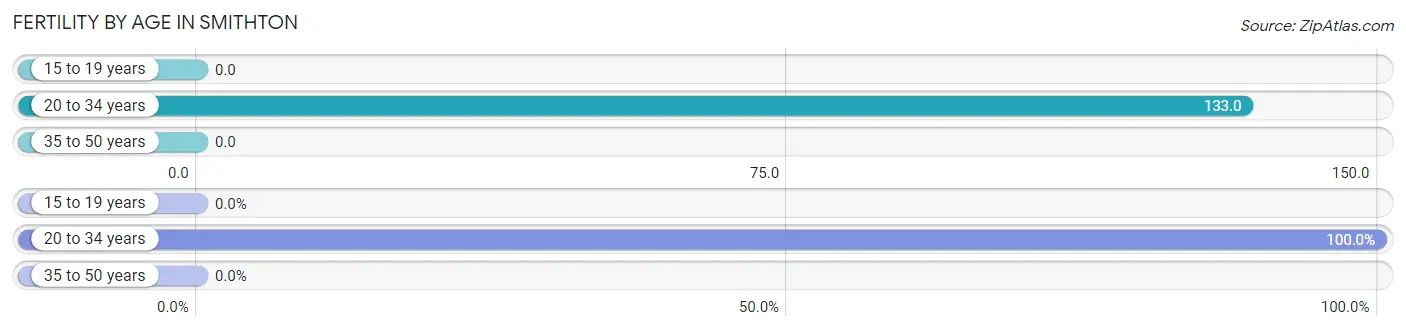
| Age Bracket | Women with Births | Births / 1,000 Women |
| 15 to 19 years | 0 (0.0%) | 0.0 |
| 20 to 34 years | 6 (100.0%) | 133.0 |
| 35 to 50 years | 0 (0.0%) | 0.0 |
| Total | 6 (100.0%) | 46.0 |
Fertility by Age by Marriage Status in Smithton
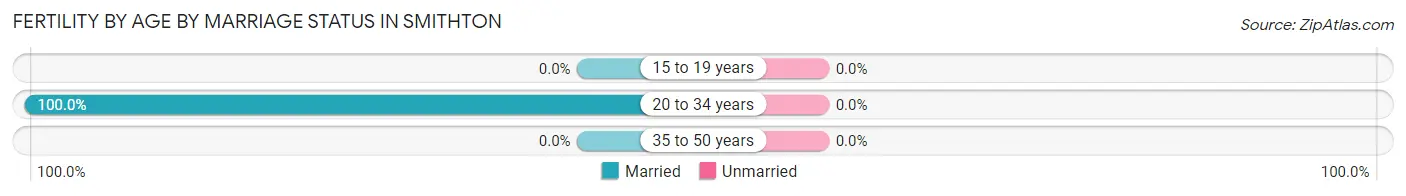
| Age Bracket | Married | Unmarried |
| 15 to 19 years | 0 (0.0%) | 0 (0.0%) |
| 20 to 34 years | 6 (100.0%) | 0 (0.0%) |
| 35 to 50 years | 0 (0.0%) | 0 (0.0%) |
| Total | 6 (100.0%) | 0 (0.0%) |
Fertility by Education in Smithton
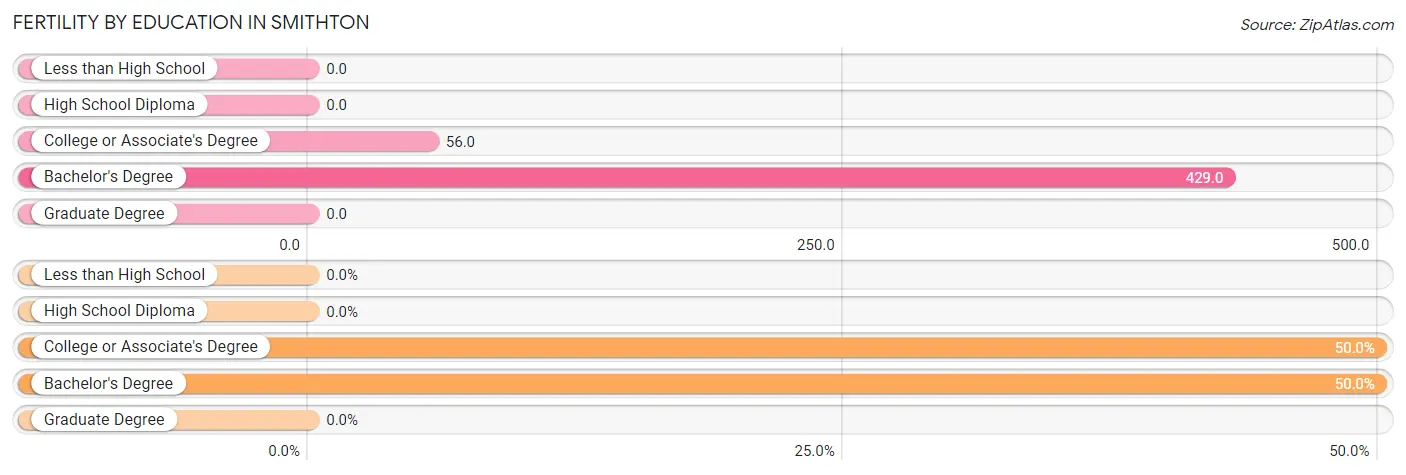
| Educational Attainment | Women with Births | Births / 1,000 Women |
| Less than High School | 0 (0.0%) | 0.0 |
| High School Diploma | 0 (0.0%) | 0.0 |
| College or Associate's Degree | 3 (50.0%) | 56.0 |
| Bachelor's Degree | 3 (50.0%) | 429.0 |
| Graduate Degree | 0 (0.0%) | 0.0 |
| Total | 6 (100.0%) | 46.0 |
Fertility by Education by Marriage Status in Smithton
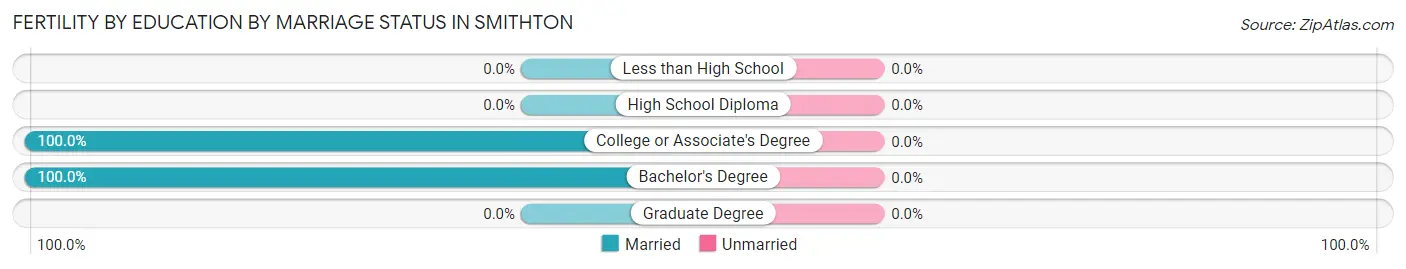
| Educational Attainment | Married | Unmarried |
| Less than High School | 0 (0.0%) | 0 (0.0%) |
| High School Diploma | 0 (0.0%) | 0 (0.0%) |
| College or Associate's Degree | 3 (100.0%) | 0 (0.0%) |
| Bachelor's Degree | 3 (100.0%) | 0 (0.0%) |
| Graduate Degree | 0 (0.0%) | 0 (0.0%) |
| Total | 6 (100.0%) | 0 (0.0%) |
Employment Characteristics in Smithton
Employment by Class of Employer in Smithton
Among the 267 employed individuals in Smithton, private company employees (206 | 77.1%), local government employees (21 | 7.9%), and not-for-profit organizations (19 | 7.1%) make up the most common classes of employment.
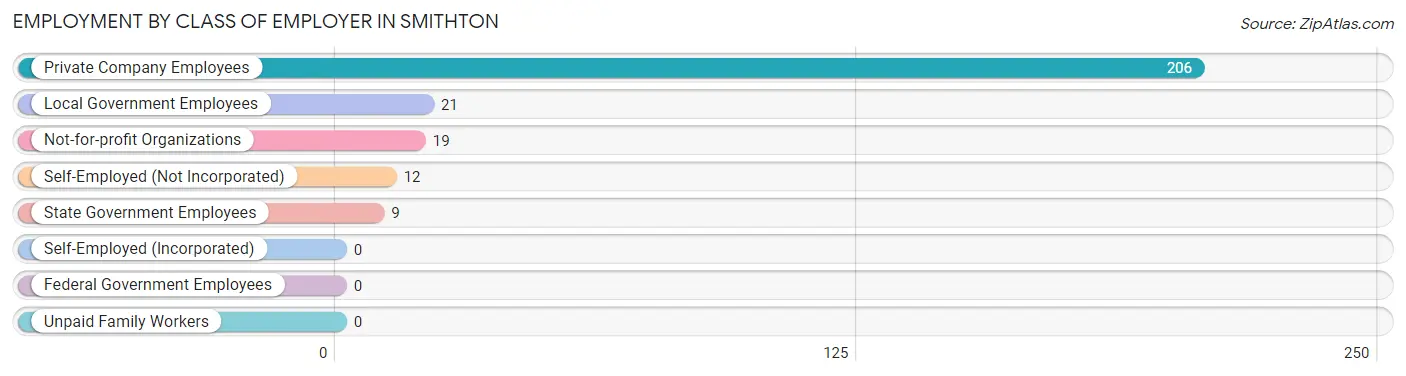
| Employer Class | # Employees | % Employees |
| Private Company Employees | 206 | 77.1% |
| Self-Employed (Incorporated) | 0 | 0.0% |
| Self-Employed (Not Incorporated) | 12 | 4.5% |
| Not-for-profit Organizations | 19 | 7.1% |
| Local Government Employees | 21 | 7.9% |
| State Government Employees | 9 | 3.4% |
| Federal Government Employees | 0 | 0.0% |
| Unpaid Family Workers | 0 | 0.0% |
| Total | 267 | 100.0% |
Employment Status by Age in Smithton
According to the labor force statistics for Smithton, out of the total population over 16 years of age (409), 69.4% or 284 individuals are in the labor force, with 6.0% or 17 of them unemployed. The age group with the highest labor force participation rate is 25 to 29 years, with 93.1% or 27 individuals in the labor force. Within the labor force, the 35 to 44 years age range has the highest percentage of unemployed individuals, with 19.5% or 15 of them being unemployed.
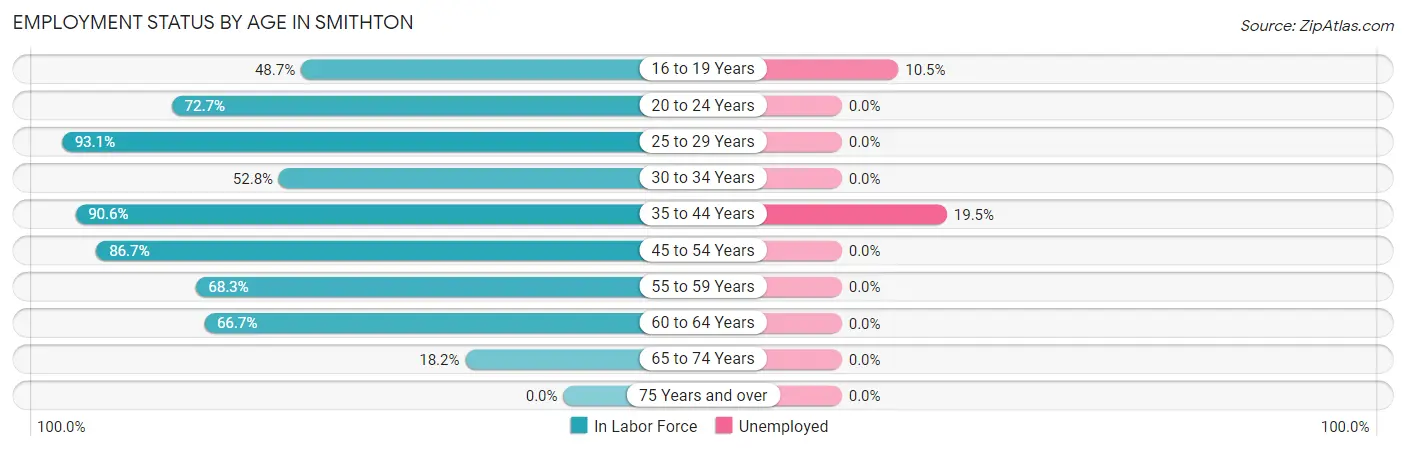
| Age Bracket | In Labor Force | Unemployed |
| 16 to 19 Years | 19 (48.7%) | 2 (10.5%) |
| 20 to 24 Years | 16 (72.7%) | 0 (0.0%) |
| 25 to 29 Years | 27 (93.1%) | 0 (0.0%) |
| 30 to 34 Years | 19 (52.8%) | 0 (0.0%) |
| 35 to 44 Years | 77 (90.6%) | 15 (19.5%) |
| 45 to 54 Years | 78 (86.7%) | 0 (0.0%) |
| 55 to 59 Years | 28 (68.3%) | 0 (0.0%) |
| 60 to 64 Years | 16 (66.7%) | 0 (0.0%) |
| 65 to 74 Years | 4 (18.2%) | 0 (0.0%) |
| 75 Years and over | 0 (0.0%) | 0 (0.0%) |
| Total | 284 (69.4%) | 17 (6.0%) |
Employment Status by Educational Attainment in Smithton
According to labor force statistics for Smithton, 80.3% of individuals (245) out of the total population between 25 and 64 years of age (305) are in the labor force, with 6.1% or 15 of them being unemployed. The group with the highest labor force participation rate are those with the educational attainment of bachelor's degree or higher, with 90.3% or 28 individuals in the labor force. Within the labor force, individuals with college / associate degree education have the highest percentage of unemployment, with 12.4% or 15 of them being unemployed.
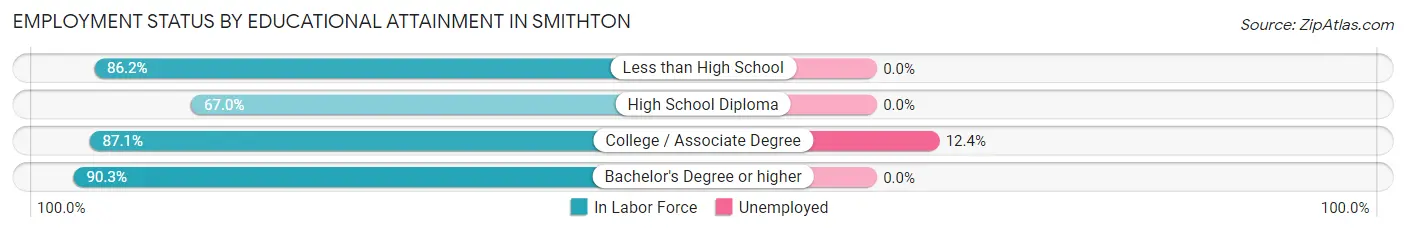
| Educational Attainment | In Labor Force | Unemployed |
| Less than High School | 25 (86.2%) | 0 (0.0%) |
| High School Diploma | 71 (67.0%) | 0 (0.0%) |
| College / Associate Degree | 121 (87.1%) | 17 (12.4%) |
| Bachelor's Degree or higher | 28 (90.3%) | 0 (0.0%) |
| Total | 245 (80.3%) | 19 (6.1%) |
Employment Occupations by Sex in Smithton
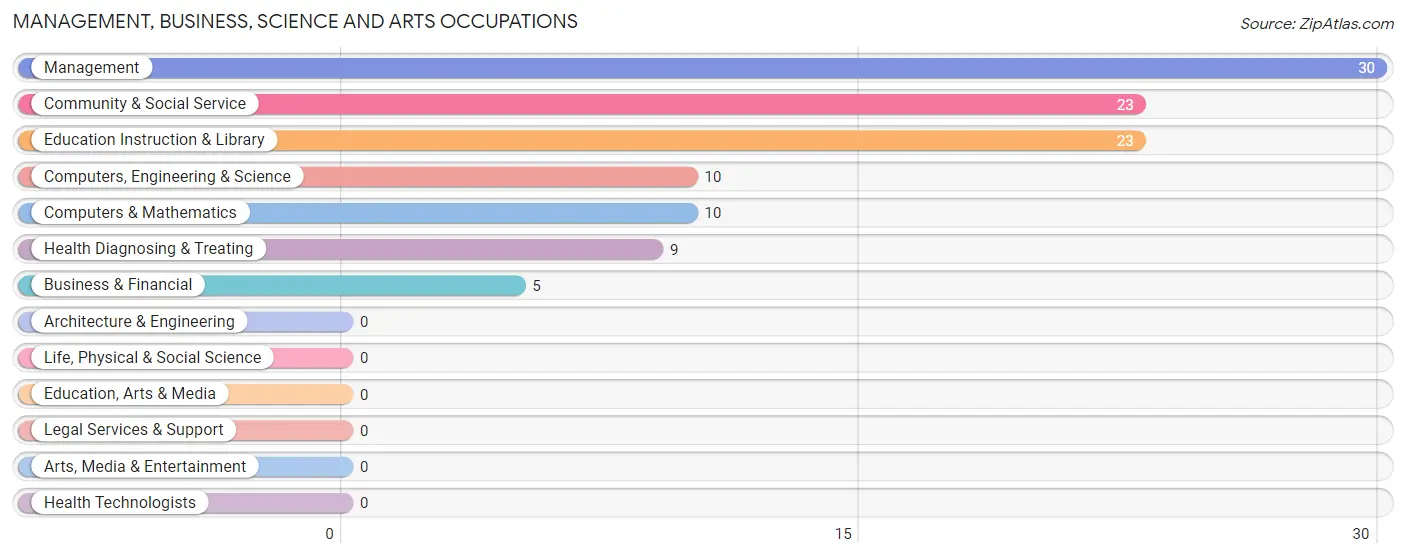
Management, Business, Science and Arts Occupations
The most common Management, Business, Science and Arts occupations in Smithton are Management (30 | 11.2%), Community & Social Service (23 | 8.6%), Education Instruction & Library (23 | 8.6%), Computers, Engineering & Science (10 | 3.7%), and Computers & Mathematics (10 | 3.7%).
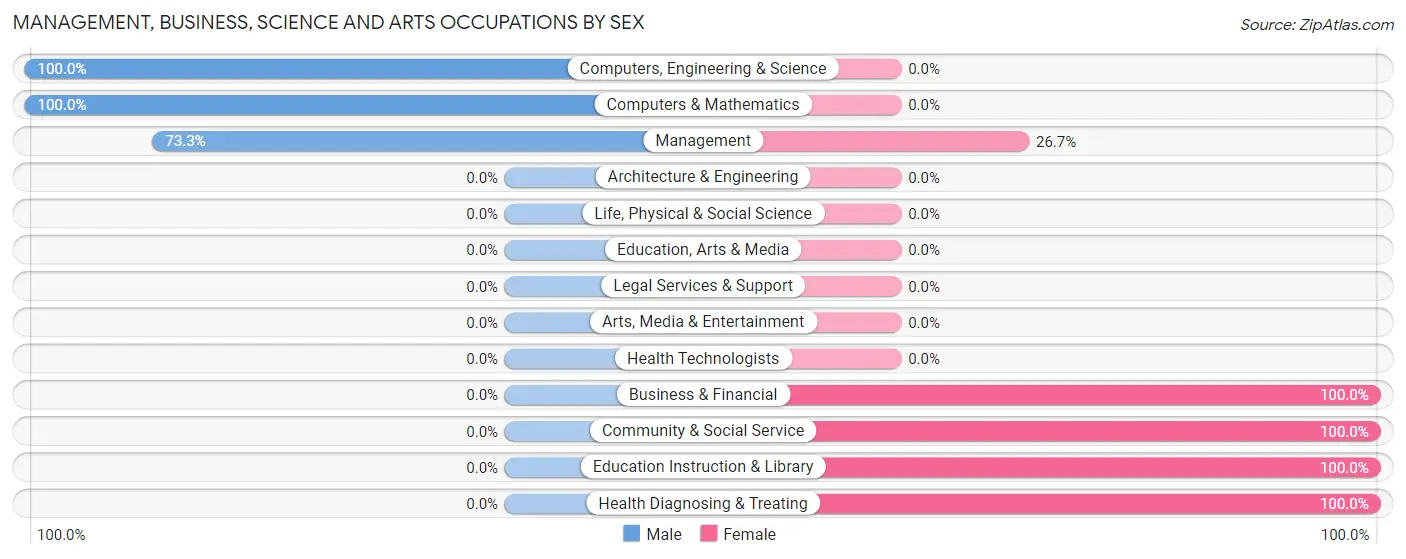
Management, Business, Science and Arts Occupations by Sex
Within the Management, Business, Science and Arts occupations in Smithton, the most male-oriented occupations are Computers, Engineering & Science (100.0%), Computers & Mathematics (100.0%), and Management (73.3%), while the most female-oriented occupations are Business & Financial (100.0%), Community & Social Service (100.0%), and Education Instruction & Library (100.0%).
| Occupation | Male | Female |
| Management | 22 (73.3%) | 8 (26.7%) |
| Business & Financial | 0 (0.0%) | 5 (100.0%) |
| Computers, Engineering & Science | 10 (100.0%) | 0 (0.0%) |
| Computers & Mathematics | 10 (100.0%) | 0 (0.0%) |
| Architecture & Engineering | 0 (0.0%) | 0 (0.0%) |
| Life, Physical & Social Science | 0 (0.0%) | 0 (0.0%) |
| Community & Social Service | 0 (0.0%) | 23 (100.0%) |
| Education, Arts & Media | 0 (0.0%) | 0 (0.0%) |
| Legal Services & Support | 0 (0.0%) | 0 (0.0%) |
| Education Instruction & Library | 0 (0.0%) | 23 (100.0%) |
| Arts, Media & Entertainment | 0 (0.0%) | 0 (0.0%) |
| Health Diagnosing & Treating | 0 (0.0%) | 9 (100.0%) |
| Health Technologists | 0 (0.0%) | 0 (0.0%) |
| Total (Category) | 32 (41.6%) | 45 (58.4%) |
| Total (Overall) | 122 (45.7%) | 145 (54.3%) |
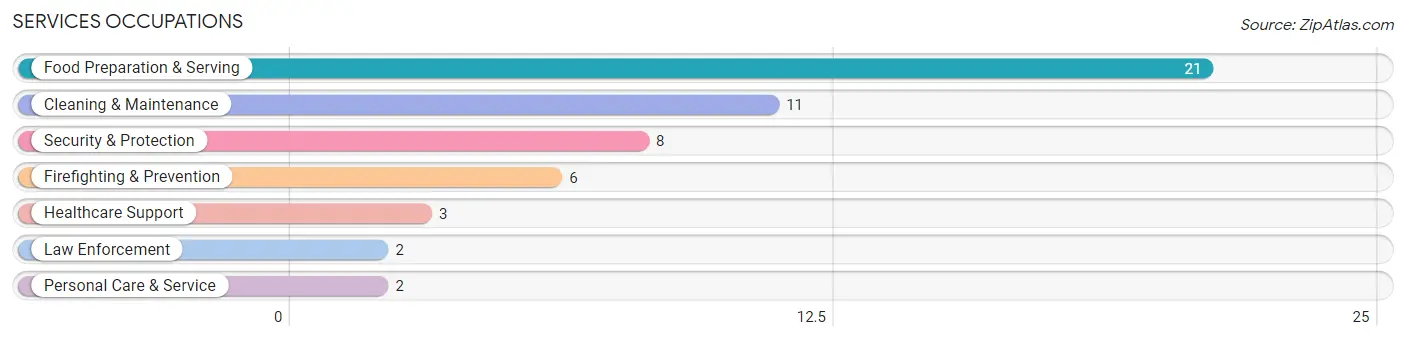
Services Occupations
The most common Services occupations in Smithton are Food Preparation & Serving (21 | 7.9%), Cleaning & Maintenance (11 | 4.1%), Security & Protection (8 | 3.0%), Firefighting & Prevention (6 | 2.2%), and Healthcare Support (3 | 1.1%).
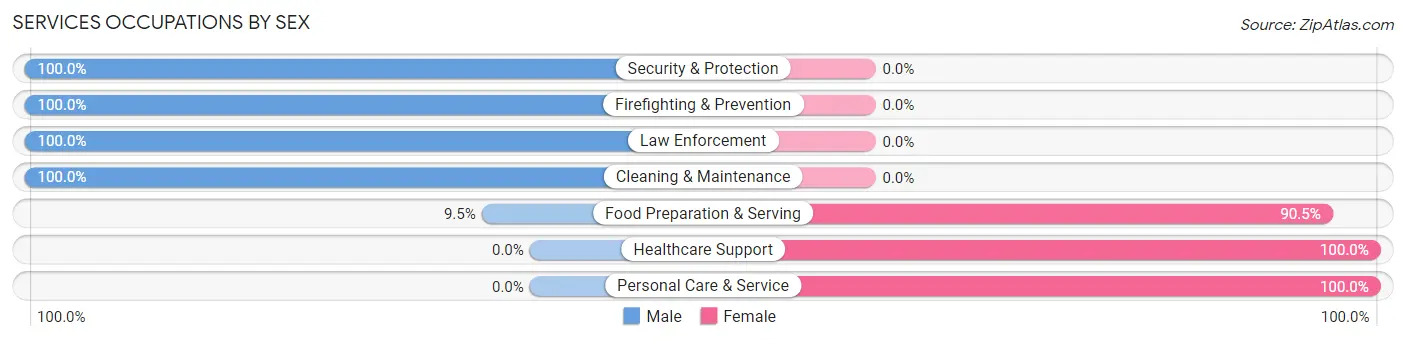
Services Occupations by Sex
Within the Services occupations in Smithton, the most male-oriented occupations are Security & Protection (100.0%), Firefighting & Prevention (100.0%), and Law Enforcement (100.0%), while the most female-oriented occupations are Healthcare Support (100.0%), Personal Care & Service (100.0%), and Food Preparation & Serving (90.5%).
| Occupation | Male | Female |
| Healthcare Support | 0 (0.0%) | 3 (100.0%) |
| Security & Protection | 8 (100.0%) | 0 (0.0%) |
| Firefighting & Prevention | 6 (100.0%) | 0 (0.0%) |
| Law Enforcement | 2 (100.0%) | 0 (0.0%) |
| Food Preparation & Serving | 2 (9.5%) | 19 (90.5%) |
| Cleaning & Maintenance | 11 (100.0%) | 0 (0.0%) |
| Personal Care & Service | 0 (0.0%) | 2 (100.0%) |
| Total (Category) | 21 (46.7%) | 24 (53.3%) |
| Total (Overall) | 122 (45.7%) | 145 (54.3%) |
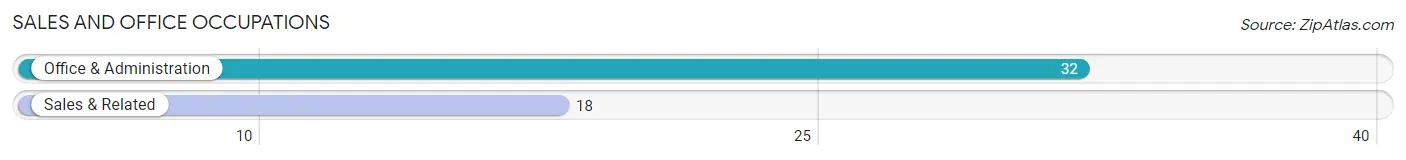
Sales and Office Occupations
The most common Sales and Office occupations in Smithton are Office & Administration (32 | 12.0%), and Sales & Related (18 | 6.7%).
Sales and Office Occupations by Sex
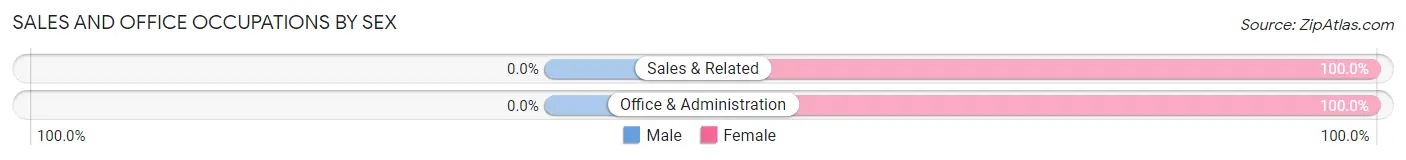
| Occupation | Male | Female |
| Sales & Related | 0 (0.0%) | 18 (100.0%) |
| Office & Administration | 0 (0.0%) | 32 (100.0%) |
| Total (Category) | 0 (0.0%) | 50 (100.0%) |
| Total (Overall) | 122 (45.7%) | 145 (54.3%) |
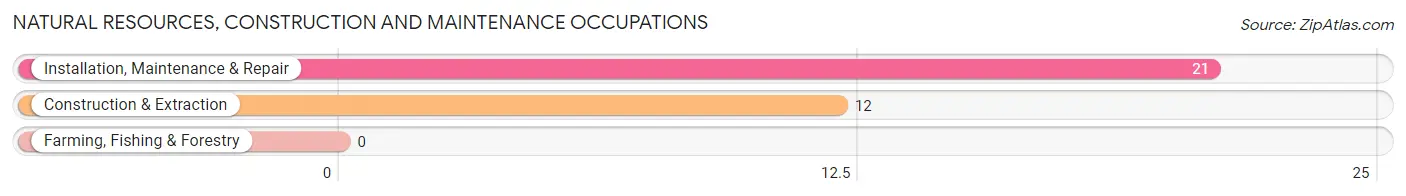
Natural Resources, Construction and Maintenance Occupations
The most common Natural Resources, Construction and Maintenance occupations in Smithton are Installation, Maintenance & Repair (21 | 7.9%), and Construction & Extraction (12 | 4.5%).
Natural Resources, Construction and Maintenance Occupations by Sex
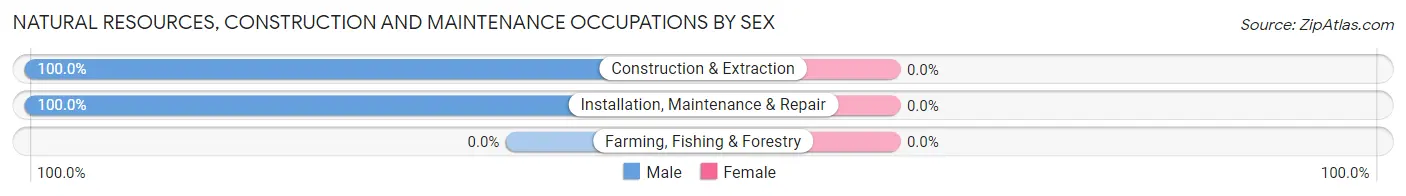
| Occupation | Male | Female |
| Farming, Fishing & Forestry | 0 (0.0%) | 0 (0.0%) |
| Construction & Extraction | 12 (100.0%) | 0 (0.0%) |
| Installation, Maintenance & Repair | 21 (100.0%) | 0 (0.0%) |
| Total (Category) | 33 (100.0%) | 0 (0.0%) |
| Total (Overall) | 122 (45.7%) | 145 (54.3%) |
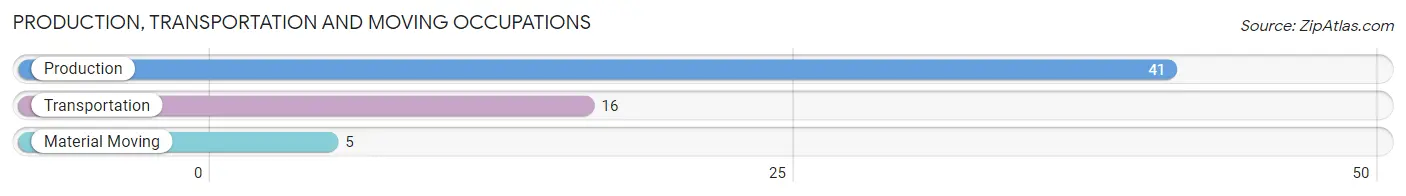
Production, Transportation and Moving Occupations
The most common Production, Transportation and Moving occupations in Smithton are Production (41 | 15.4%), Transportation (16 | 6.0%), and Material Moving (5 | 1.9%).
Production, Transportation and Moving Occupations by Sex
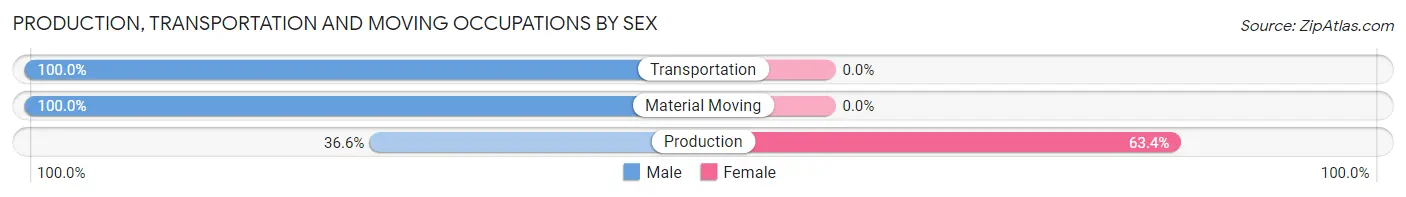
| Occupation | Male | Female |
| Production | 15 (36.6%) | 26 (63.4%) |
| Transportation | 16 (100.0%) | 0 (0.0%) |
| Material Moving | 5 (100.0%) | 0 (0.0%) |
| Total (Category) | 36 (58.1%) | 26 (41.9%) |
| Total (Overall) | 122 (45.7%) | 145 (54.3%) |
Employment Industries by Sex in Smithton
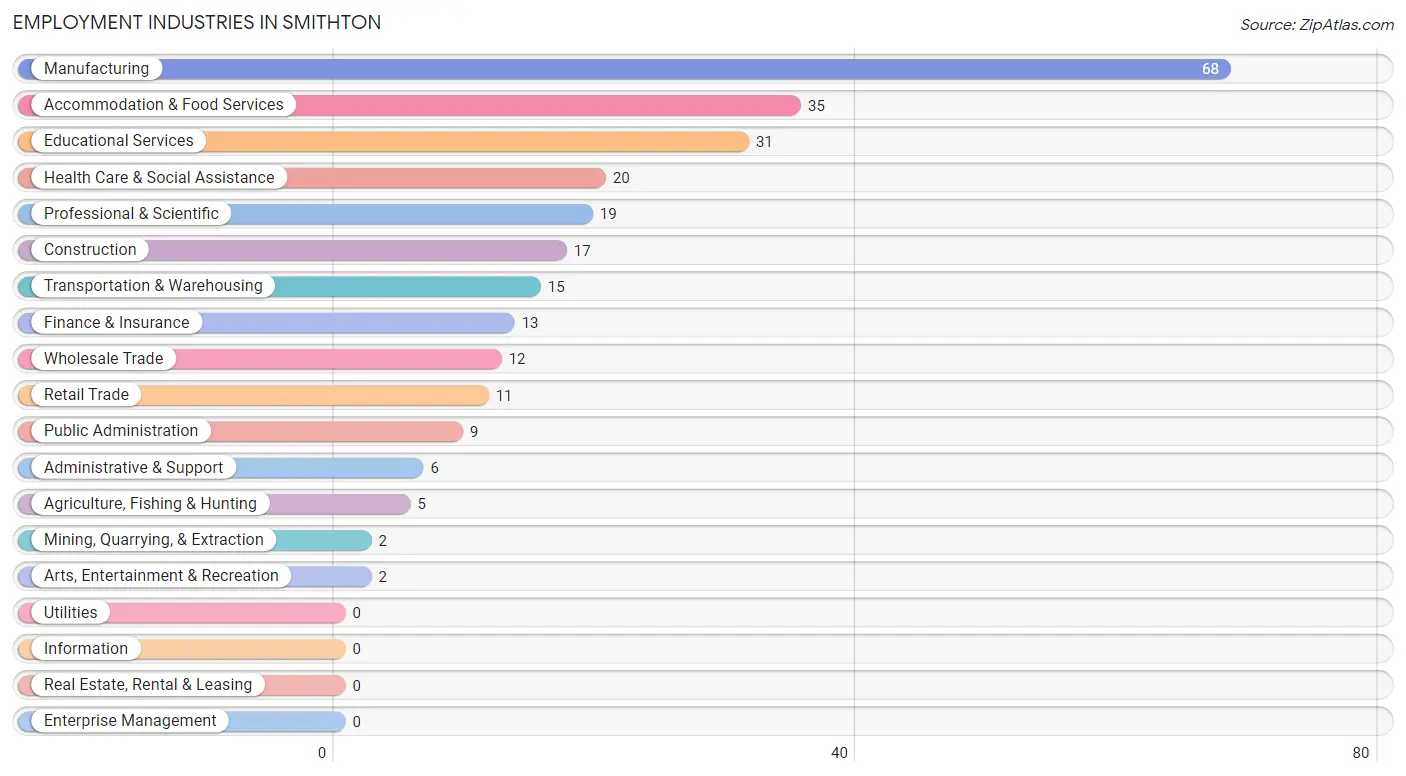
Employment Industries in Smithton
The major employment industries in Smithton include Manufacturing (68 | 25.5%), Accommodation & Food Services (35 | 13.1%), Educational Services (31 | 11.6%), Health Care & Social Assistance (20 | 7.5%), and Professional & Scientific (19 | 7.1%).
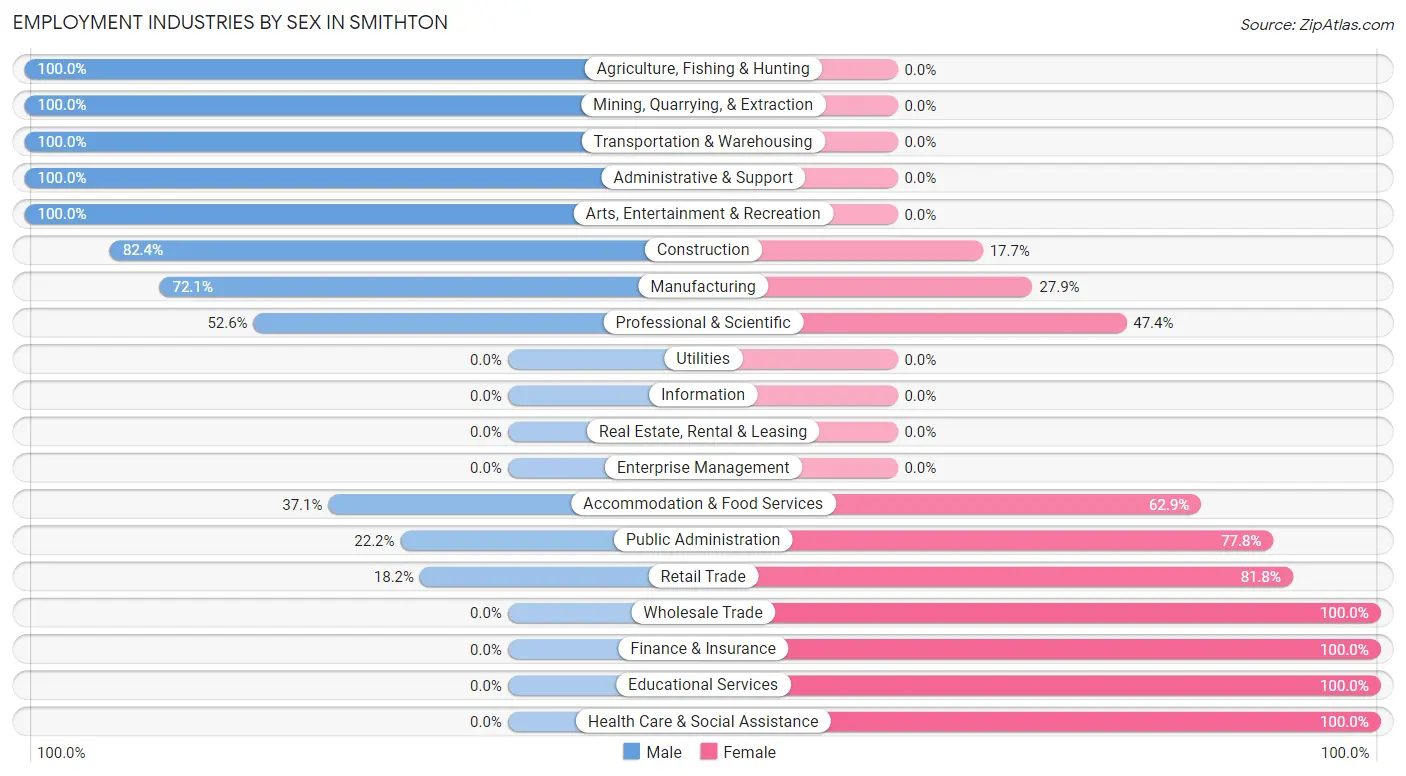
Employment Industries by Sex in Smithton
The Smithton industries that see more men than women are Agriculture, Fishing & Hunting (100.0%), Mining, Quarrying, & Extraction (100.0%), and Transportation & Warehousing (100.0%), whereas the industries that tend to have a higher number of women are Wholesale Trade (100.0%), Finance & Insurance (100.0%), and Educational Services (100.0%).
| Industry | Male | Female |
| Agriculture, Fishing & Hunting | 5 (100.0%) | 0 (0.0%) |
| Mining, Quarrying, & Extraction | 2 (100.0%) | 0 (0.0%) |
| Construction | 14 (82.4%) | 3 (17.6%) |
| Manufacturing | 49 (72.1%) | 19 (27.9%) |
| Wholesale Trade | 0 (0.0%) | 12 (100.0%) |
| Retail Trade | 2 (18.2%) | 9 (81.8%) |
| Transportation & Warehousing | 15 (100.0%) | 0 (0.0%) |
| Utilities | 0 (0.0%) | 0 (0.0%) |
| Information | 0 (0.0%) | 0 (0.0%) |
| Finance & Insurance | 0 (0.0%) | 13 (100.0%) |
| Real Estate, Rental & Leasing | 0 (0.0%) | 0 (0.0%) |
| Professional & Scientific | 10 (52.6%) | 9 (47.4%) |
| Enterprise Management | 0 (0.0%) | 0 (0.0%) |
| Administrative & Support | 6 (100.0%) | 0 (0.0%) |
| Educational Services | 0 (0.0%) | 31 (100.0%) |
| Health Care & Social Assistance | 0 (0.0%) | 20 (100.0%) |
| Arts, Entertainment & Recreation | 2 (100.0%) | 0 (0.0%) |
| Accommodation & Food Services | 13 (37.1%) | 22 (62.9%) |
| Public Administration | 2 (22.2%) | 7 (77.8%) |
| Total | 122 (45.7%) | 145 (54.3%) |
Education in Smithton
School Enrollment in Smithton
The most common levels of schooling among the 159 students in Smithton are high school (46 | 28.9%), college / undergraduate (43 | 27.0%), and nursery / preschool (34 | 21.4%).
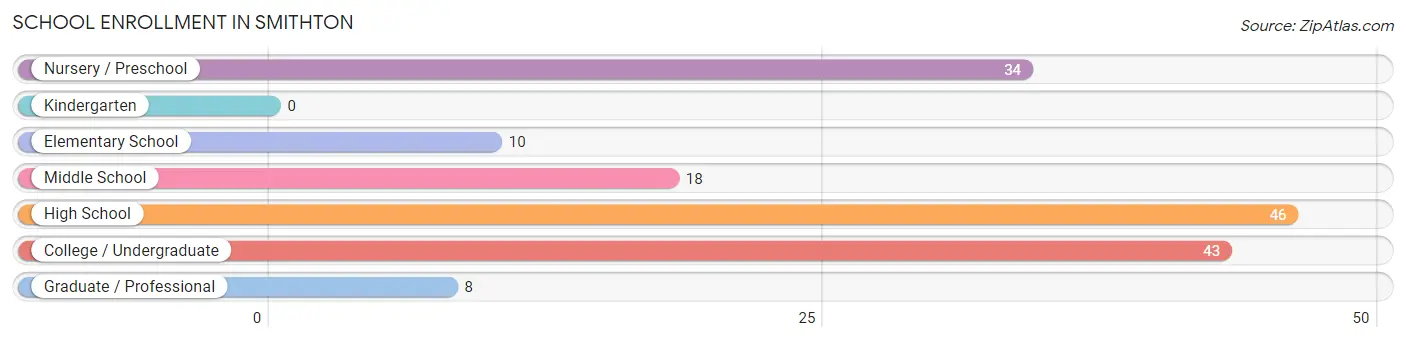
| School Level | # Students | % Students |
| Nursery / Preschool | 34 | 21.4% |
| Kindergarten | 0 | 0.0% |
| Elementary School | 10 | 6.3% |
| Middle School | 18 | 11.3% |
| High School | 46 | 28.9% |
| College / Undergraduate | 43 | 27.0% |
| Graduate / Professional | 8 | 5.0% |
| Total | 159 | 100.0% |
School Enrollment by Age by Funding Source in Smithton
Out of a total of 159 students who are enrolled in schools in Smithton, 1 (0.6%) attend a private institution, while the remaining 158 (99.4%) are enrolled in public schools. The age group of 15 to 17 year olds has the highest likelihood of being enrolled in private schools, with 1 (2.2% in the age bracket) enrolled. Conversely, the age group of 3 to 4 year olds has the lowest likelihood of being enrolled in a private school, with 15 (100.0% in the age bracket) attending a public institution.
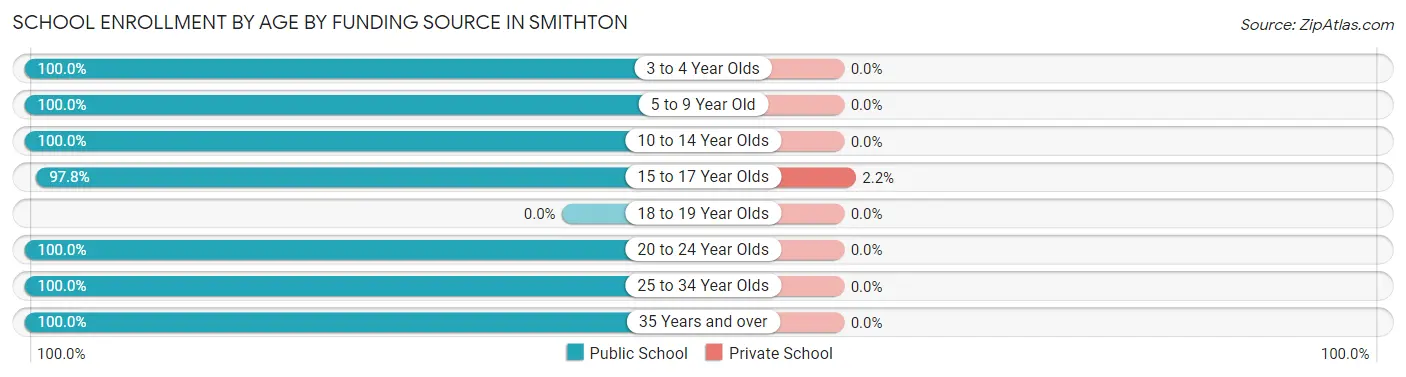
| Age Bracket | Public School | Private School |
| 3 to 4 Year Olds | 15 (100.0%) | 0 (0.0%) |
| 5 to 9 Year Old | 29 (100.0%) | 0 (0.0%) |
| 10 to 14 Year Olds | 18 (100.0%) | 0 (0.0%) |
| 15 to 17 Year Olds | 45 (97.8%) | 1 (2.2%) |
| 18 to 19 Year Olds | 0 (0.0%) | 0 (0.0%) |
| 20 to 24 Year Olds | 13 (100.0%) | 0 (0.0%) |
| 25 to 34 Year Olds | 22 (100.0%) | 0 (0.0%) |
| 35 Years and over | 16 (100.0%) | 0 (0.0%) |
| Total | 158 (99.4%) | 1 (0.6%) |
Educational Attainment by Field of Study in Smithton
Education (16 | 41.0%), literature & languages (6 | 15.4%), psychology (5 | 12.8%), bio, nature & agricultural (3 | 7.7%), and arts & humanities (3 | 7.7%) are the most common fields of study among 39 individuals in Smithton who have obtained a bachelor's degree or higher.
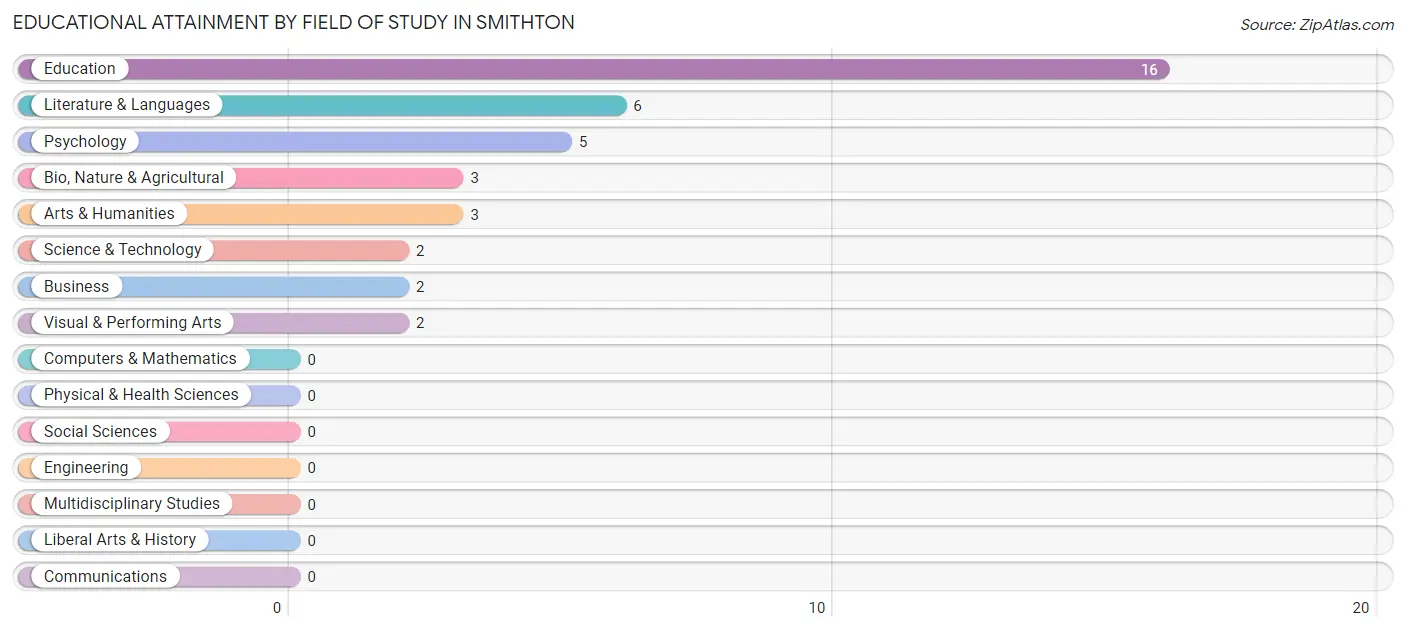
| Field of Study | # Graduates | % Graduates |
| Computers & Mathematics | 0 | 0.0% |
| Bio, Nature & Agricultural | 3 | 7.7% |
| Physical & Health Sciences | 0 | 0.0% |
| Psychology | 5 | 12.8% |
| Social Sciences | 0 | 0.0% |
| Engineering | 0 | 0.0% |
| Multidisciplinary Studies | 0 | 0.0% |
| Science & Technology | 2 | 5.1% |
| Business | 2 | 5.1% |
| Education | 16 | 41.0% |
| Literature & Languages | 6 | 15.4% |
| Liberal Arts & History | 0 | 0.0% |
| Visual & Performing Arts | 2 | 5.1% |
| Communications | 0 | 0.0% |
| Arts & Humanities | 3 | 7.7% |
| Total | 39 | 100.0% |
Transportation & Commute in Smithton
Vehicle Availability by Sex in Smithton
The most prevalent vehicle ownership categories in Smithton are males with 2 vehicles (43, accounting for 35.2%) and females with 2 vehicles (39, making up 29.7%).
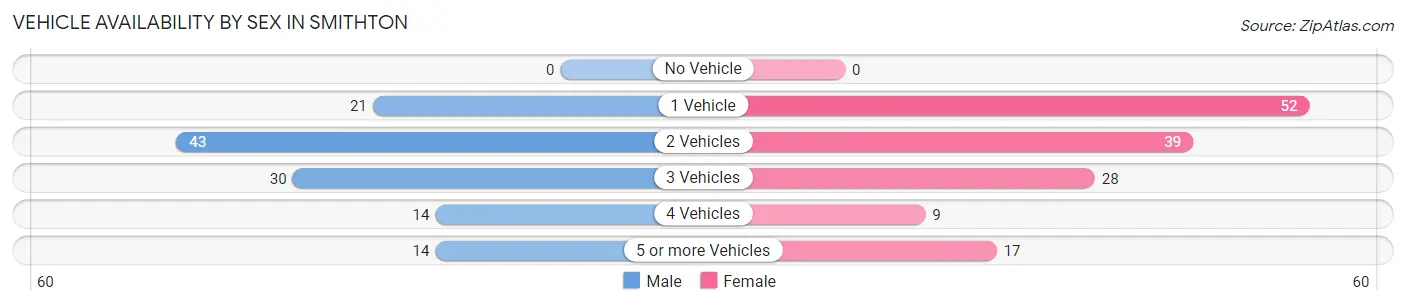
| Vehicles Available | Male | Female |
| No Vehicle | 0 (0.0%) | 0 (0.0%) |
| 1 Vehicle | 21 (17.2%) | 52 (35.9%) |
| 2 Vehicles | 43 (35.2%) | 39 (26.9%) |
| 3 Vehicles | 30 (24.6%) | 28 (19.3%) |
| 4 Vehicles | 14 (11.5%) | 9 (6.2%) |
| 5 or more Vehicles | 14 (11.5%) | 17 (11.7%) |
| Total | 122 (100.0%) | 145 (100.0%) |
Commute Time in Smithton
The most frequently occuring commute durations in Smithton are 20 to 24 minutes (102 commuters, 38.5%), 15 to 19 minutes (56 commuters, 21.1%), and 25 to 29 minutes (24 commuters, 9.1%).
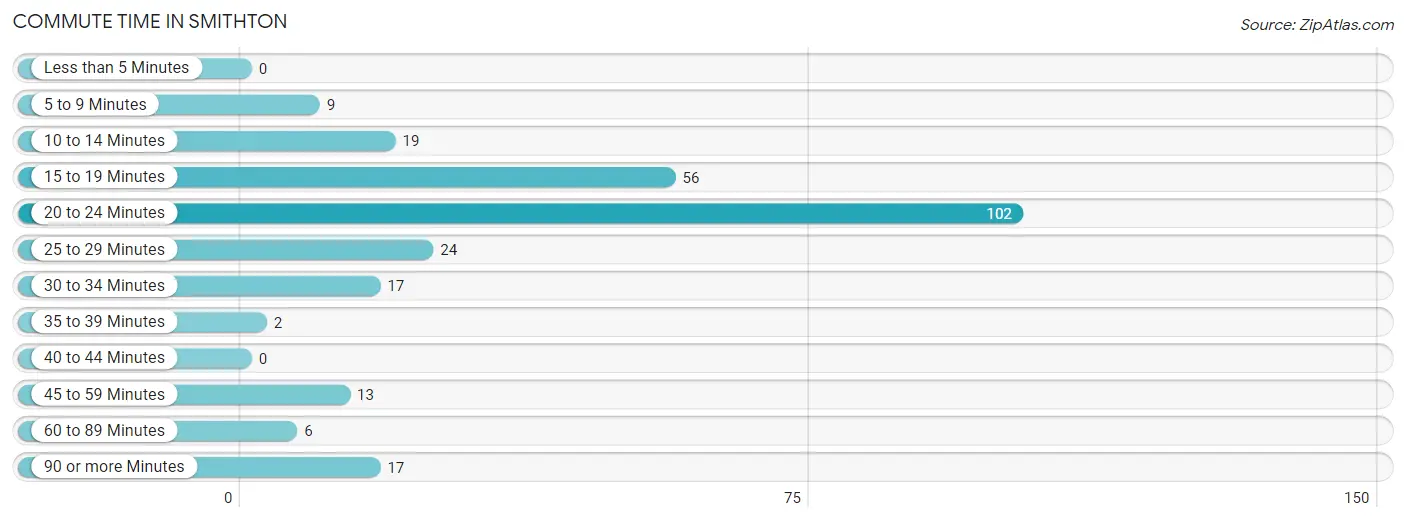
| Commute Time | # Commuters | % Commuters |
| Less than 5 Minutes | 0 | 0.0% |
| 5 to 9 Minutes | 9 | 3.4% |
| 10 to 14 Minutes | 19 | 7.2% |
| 15 to 19 Minutes | 56 | 21.1% |
| 20 to 24 Minutes | 102 | 38.5% |
| 25 to 29 Minutes | 24 | 9.1% |
| 30 to 34 Minutes | 17 | 6.4% |
| 35 to 39 Minutes | 2 | 0.7% |
| 40 to 44 Minutes | 0 | 0.0% |
| 45 to 59 Minutes | 13 | 4.9% |
| 60 to 89 Minutes | 6 | 2.3% |
| 90 or more Minutes | 17 | 6.4% |
Commute Time by Sex in Smithton
The most common commute times in Smithton are 20 to 24 minutes (40 commuters, 32.8%) for males and 20 to 24 minutes (62 commuters, 43.4%) for females.
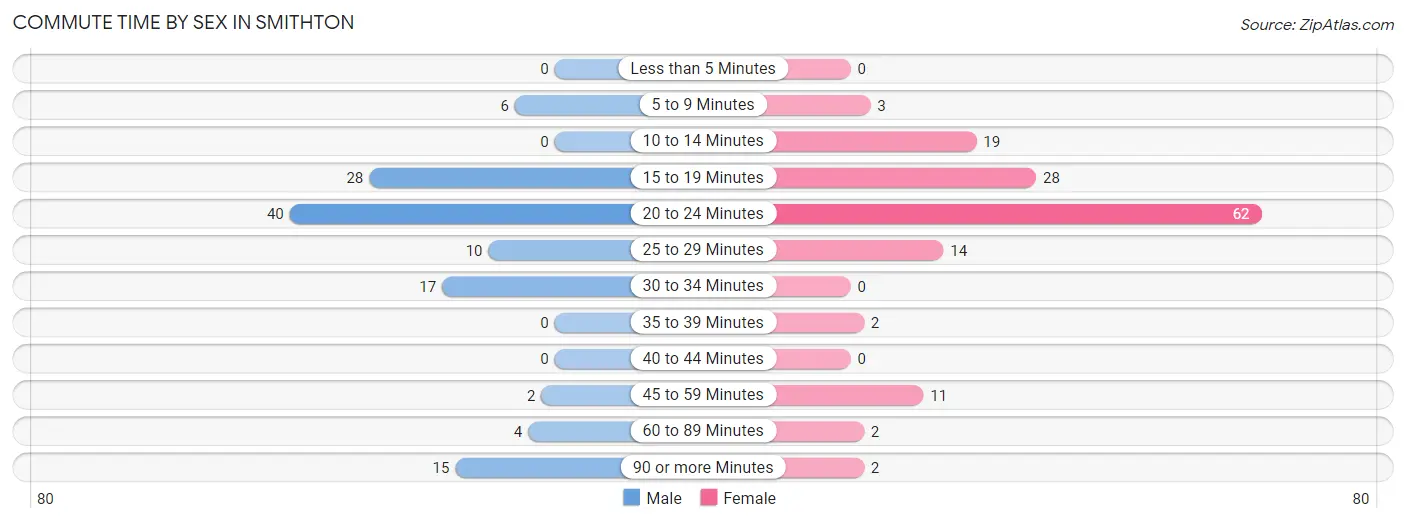
| Commute Time | Male | Female |
| Less than 5 Minutes | 0 (0.0%) | 0 (0.0%) |
| 5 to 9 Minutes | 6 (4.9%) | 3 (2.1%) |
| 10 to 14 Minutes | 0 (0.0%) | 19 (13.3%) |
| 15 to 19 Minutes | 28 (23.0%) | 28 (19.6%) |
| 20 to 24 Minutes | 40 (32.8%) | 62 (43.4%) |
| 25 to 29 Minutes | 10 (8.2%) | 14 (9.8%) |
| 30 to 34 Minutes | 17 (13.9%) | 0 (0.0%) |
| 35 to 39 Minutes | 0 (0.0%) | 2 (1.4%) |
| 40 to 44 Minutes | 0 (0.0%) | 0 (0.0%) |
| 45 to 59 Minutes | 2 (1.6%) | 11 (7.7%) |
| 60 to 89 Minutes | 4 (3.3%) | 2 (1.4%) |
| 90 or more Minutes | 15 (12.3%) | 2 (1.4%) |
Time of Departure to Work by Sex in Smithton
The most frequent times of departure to work in Smithton are 12:00 AM to 4:59 AM (33, 27.1%) for males and 6:30 AM to 6:59 AM (28, 19.6%) for females.
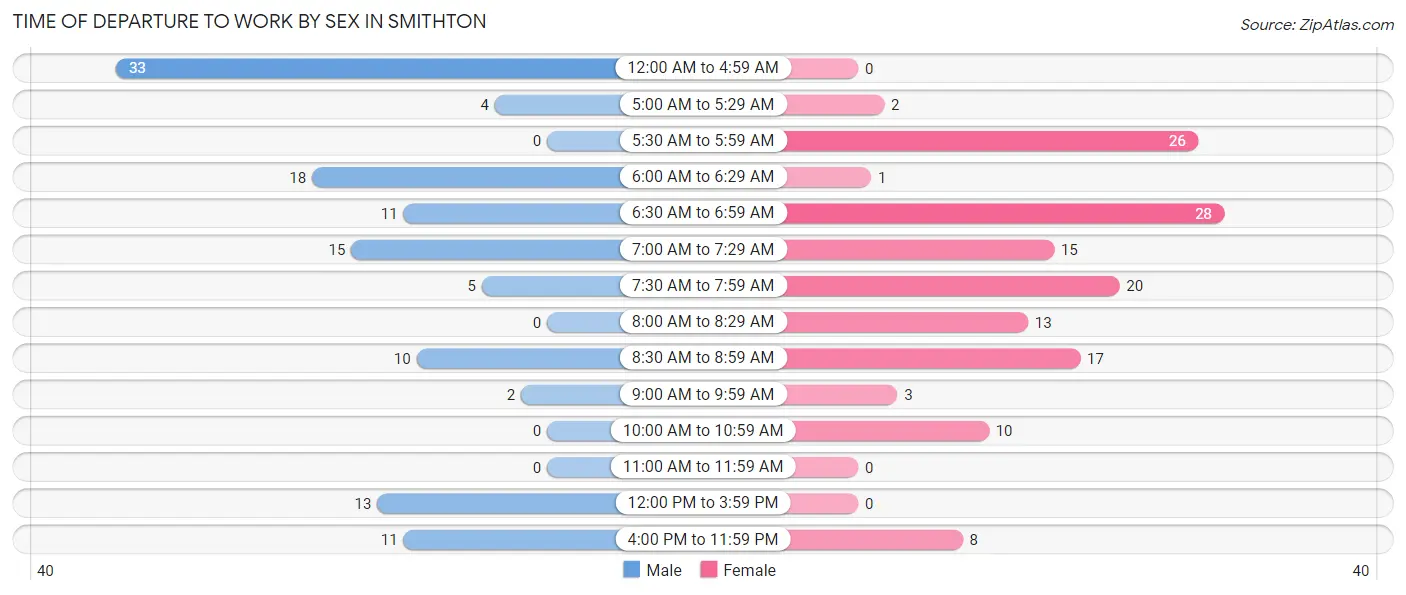
| Time of Departure | Male | Female |
| 12:00 AM to 4:59 AM | 33 (27.1%) | 0 (0.0%) |
| 5:00 AM to 5:29 AM | 4 (3.3%) | 2 (1.4%) |
| 5:30 AM to 5:59 AM | 0 (0.0%) | 26 (18.2%) |
| 6:00 AM to 6:29 AM | 18 (14.7%) | 1 (0.7%) |
| 6:30 AM to 6:59 AM | 11 (9.0%) | 28 (19.6%) |
| 7:00 AM to 7:29 AM | 15 (12.3%) | 15 (10.5%) |
| 7:30 AM to 7:59 AM | 5 (4.1%) | 20 (14.0%) |
| 8:00 AM to 8:29 AM | 0 (0.0%) | 13 (9.1%) |
| 8:30 AM to 8:59 AM | 10 (8.2%) | 17 (11.9%) |
| 9:00 AM to 9:59 AM | 2 (1.6%) | 3 (2.1%) |
| 10:00 AM to 10:59 AM | 0 (0.0%) | 10 (7.0%) |
| 11:00 AM to 11:59 AM | 0 (0.0%) | 0 (0.0%) |
| 12:00 PM to 3:59 PM | 13 (10.7%) | 0 (0.0%) |
| 4:00 PM to 11:59 PM | 11 (9.0%) | 8 (5.6%) |
| Total | 122 (100.0%) | 143 (100.0%) |
Housing Occupancy in Smithton
Occupancy by Ownership in Smithton
Of the total 221 dwellings in Smithton, owner-occupied units account for 177 (80.1%), while renter-occupied units make up 44 (19.9%).
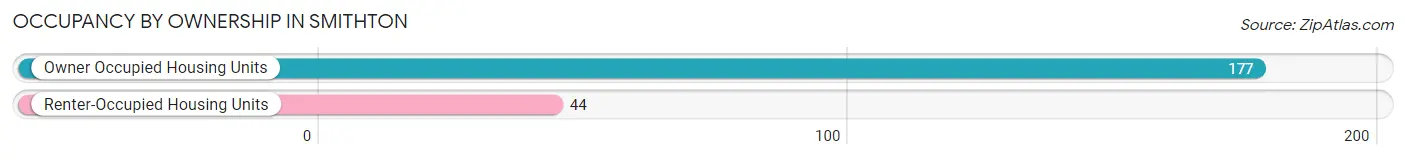
| Occupancy | # Housing Units | % Housing Units |
| Owner Occupied Housing Units | 177 | 80.1% |
| Renter-Occupied Housing Units | 44 | 19.9% |
| Total Occupied Housing Units | 221 | 100.0% |
Occupancy by Household Size in Smithton
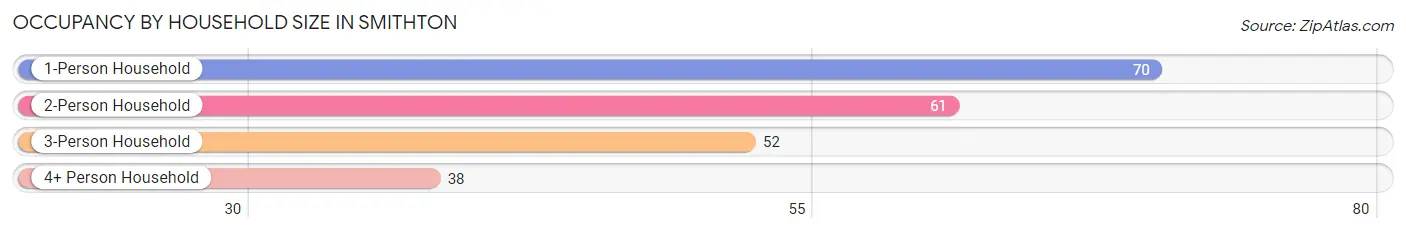
| Household Size | # Housing Units | % Housing Units |
| 1-Person Household | 70 | 31.7% |
| 2-Person Household | 61 | 27.6% |
| 3-Person Household | 52 | 23.5% |
| 4+ Person Household | 38 | 17.2% |
| Total Housing Units | 221 | 100.0% |
Occupancy by Ownership by Household Size in Smithton
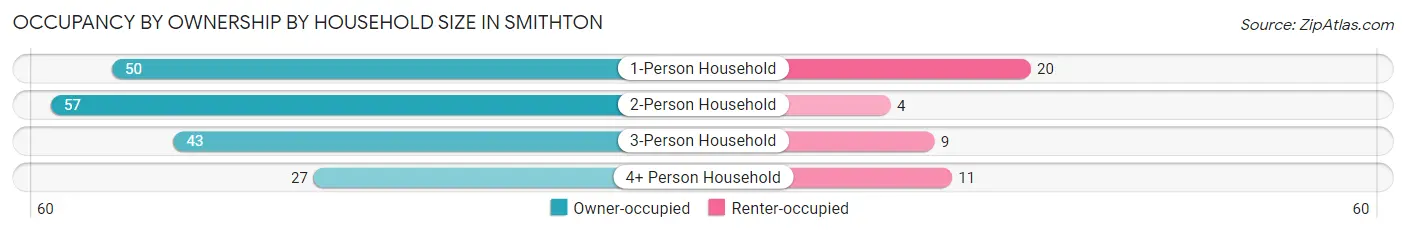
| Household Size | Owner-occupied | Renter-occupied |
| 1-Person Household | 50 (71.4%) | 20 (28.6%) |
| 2-Person Household | 57 (93.4%) | 4 (6.6%) |
| 3-Person Household | 43 (82.7%) | 9 (17.3%) |
| 4+ Person Household | 27 (71.1%) | 11 (28.9%) |
| Total Housing Units | 177 (80.1%) | 44 (19.9%) |
Occupancy by Educational Attainment in Smithton
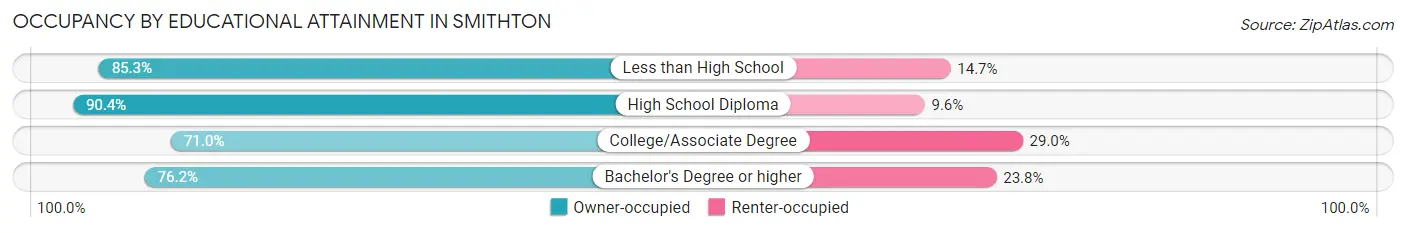
| Household Size | Owner-occupied | Renter-occupied |
| Less than High School | 29 (85.3%) | 5 (14.7%) |
| High School Diploma | 66 (90.4%) | 7 (9.6%) |
| College/Associate Degree | 66 (71.0%) | 27 (29.0%) |
| Bachelor's Degree or higher | 16 (76.2%) | 5 (23.8%) |
Occupancy by Age of Householder in Smithton
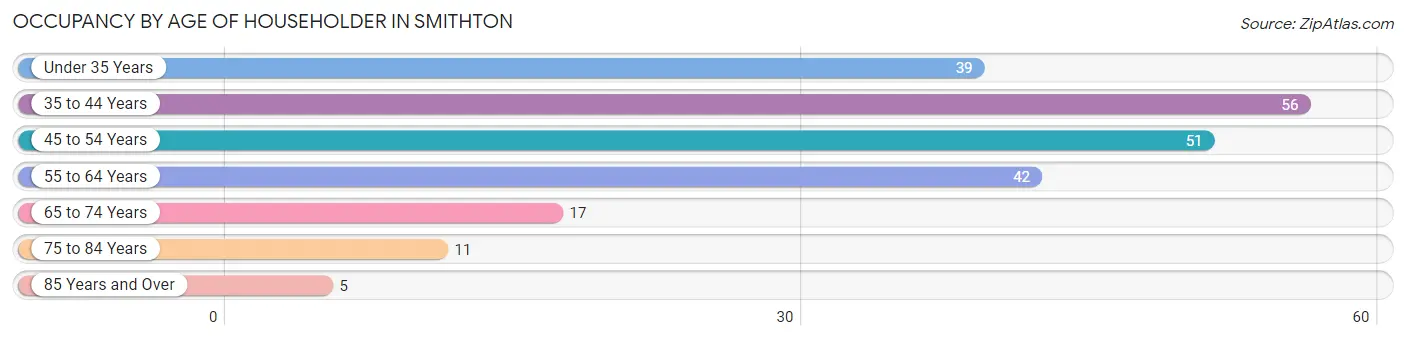
| Age Bracket | # Households | % Households |
| Under 35 Years | 39 | 17.6% |
| 35 to 44 Years | 56 | 25.3% |
| 45 to 54 Years | 51 | 23.1% |
| 55 to 64 Years | 42 | 19.0% |
| 65 to 74 Years | 17 | 7.7% |
| 75 to 84 Years | 11 | 5.0% |
| 85 Years and Over | 5 | 2.3% |
| Total | 221 | 100.0% |
Housing Finances in Smithton
Median Income by Occupancy in Smithton
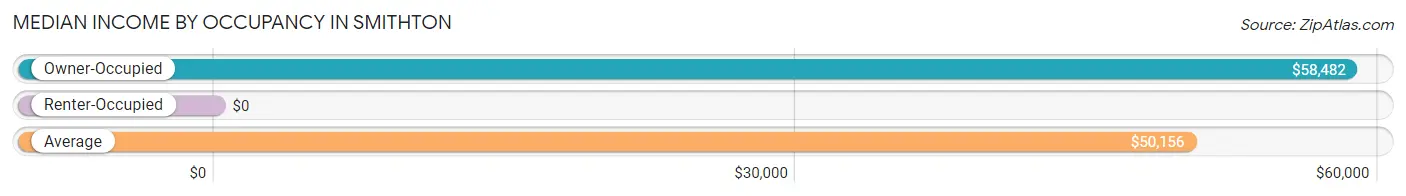
| Occupancy Type | # Households | Median Income |
| Owner-Occupied | 177 (80.1%) | $58,482 |
| Renter-Occupied | 44 (19.9%) | $0 |
| Average | 221 (100.0%) | $50,156 |
Occupancy by Householder Income Bracket in Smithton
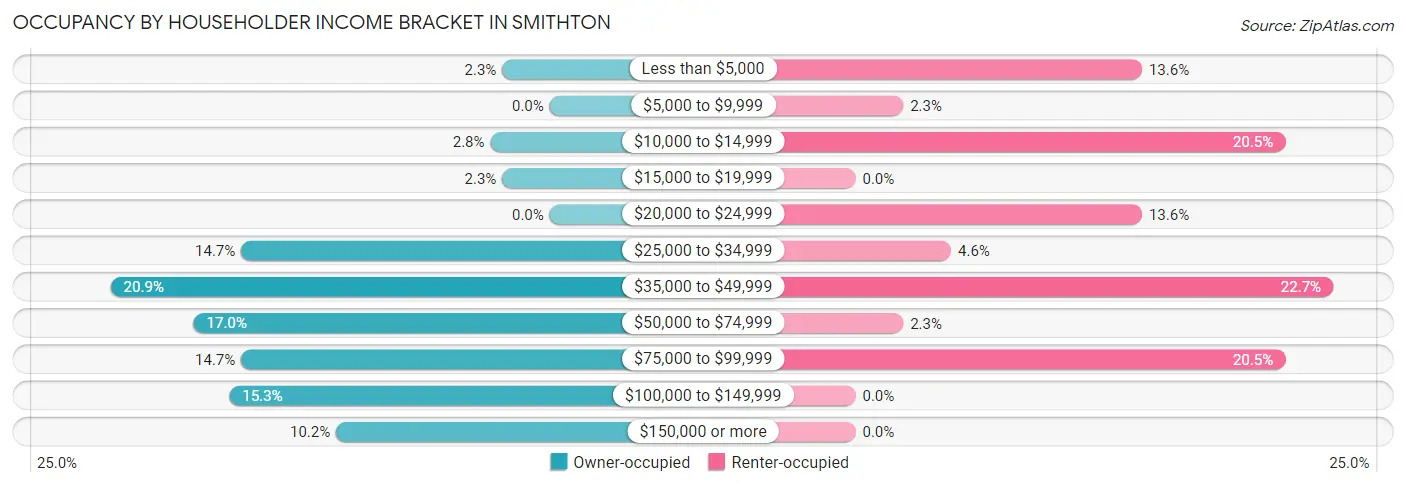
| Income Bracket | Owner-occupied | Renter-occupied |
| Less than $5,000 | 4 (2.3%) | 6 (13.6%) |
| $5,000 to $9,999 | 0 (0.0%) | 1 (2.3%) |
| $10,000 to $14,999 | 5 (2.8%) | 9 (20.4%) |
| $15,000 to $19,999 | 4 (2.3%) | 0 (0.0%) |
| $20,000 to $24,999 | 0 (0.0%) | 6 (13.6%) |
| $25,000 to $34,999 | 26 (14.7%) | 2 (4.5%) |
| $35,000 to $49,999 | 37 (20.9%) | 10 (22.7%) |
| $50,000 to $74,999 | 30 (17.0%) | 1 (2.3%) |
| $75,000 to $99,999 | 26 (14.7%) | 9 (20.4%) |
| $100,000 to $149,999 | 27 (15.2%) | 0 (0.0%) |
| $150,000 or more | 18 (10.2%) | 0 (0.0%) |
| Total | 177 (100.0%) | 44 (100.0%) |
Monthly Housing Cost Tiers in Smithton
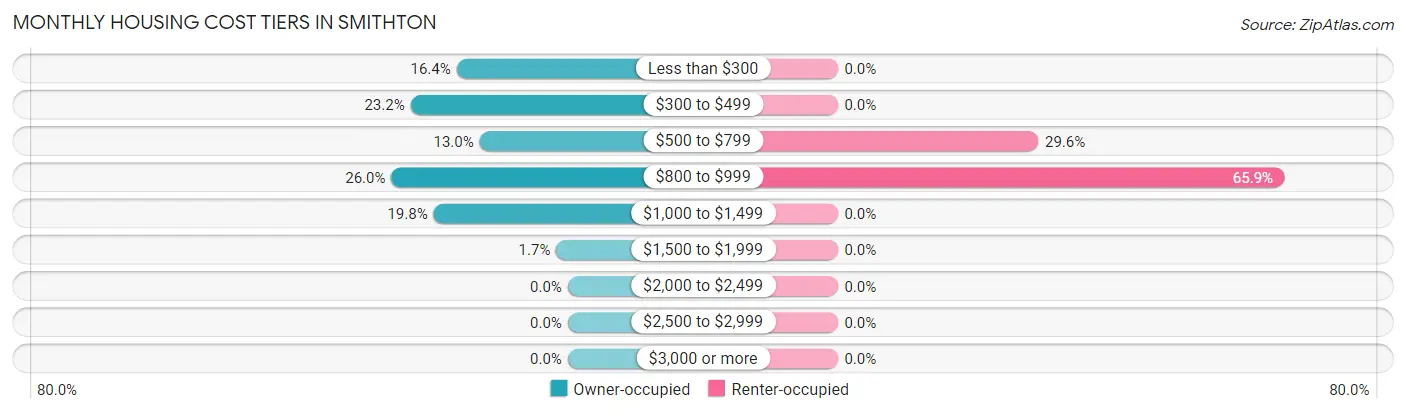
| Monthly Cost | Owner-occupied | Renter-occupied |
| Less than $300 | 29 (16.4%) | 0 (0.0%) |
| $300 to $499 | 41 (23.2%) | 0 (0.0%) |
| $500 to $799 | 23 (13.0%) | 13 (29.5%) |
| $800 to $999 | 46 (26.0%) | 29 (65.9%) |
| $1,000 to $1,499 | 35 (19.8%) | 0 (0.0%) |
| $1,500 to $1,999 | 3 (1.7%) | 0 (0.0%) |
| $2,000 to $2,499 | 0 (0.0%) | 0 (0.0%) |
| $2,500 to $2,999 | 0 (0.0%) | 0 (0.0%) |
| $3,000 or more | 0 (0.0%) | 0 (0.0%) |
| Total | 177 (100.0%) | 44 (100.0%) |
Physical Housing Characteristics in Smithton
Housing Structures in Smithton
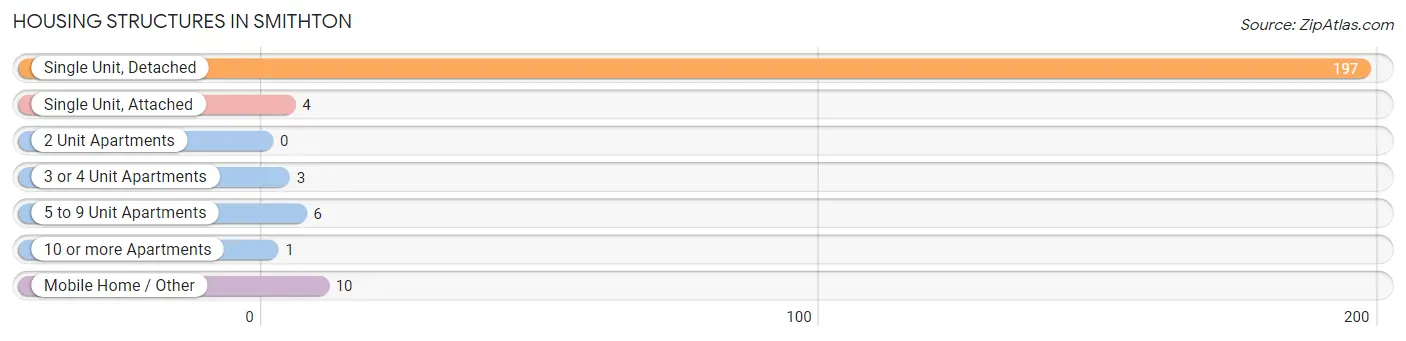
| Structure Type | # Housing Units | % Housing Units |
| Single Unit, Detached | 197 | 89.1% |
| Single Unit, Attached | 4 | 1.8% |
| 2 Unit Apartments | 0 | 0.0% |
| 3 or 4 Unit Apartments | 3 | 1.4% |
| 5 to 9 Unit Apartments | 6 | 2.7% |
| 10 or more Apartments | 1 | 0.4% |
| Mobile Home / Other | 10 | 4.5% |
| Total | 221 | 100.0% |
Housing Structures by Occupancy in Smithton
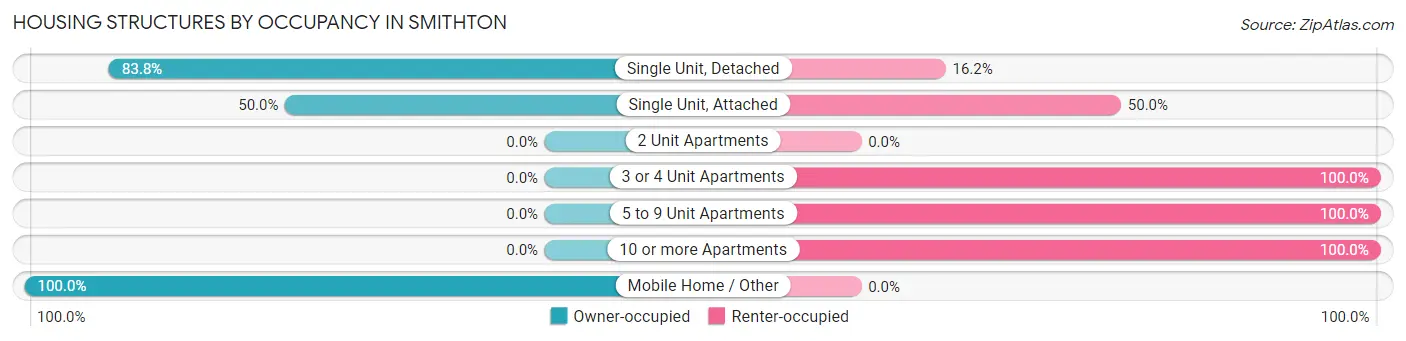
| Structure Type | Owner-occupied | Renter-occupied |
| Single Unit, Detached | 165 (83.8%) | 32 (16.2%) |
| Single Unit, Attached | 2 (50.0%) | 2 (50.0%) |
| 2 Unit Apartments | 0 (0.0%) | 0 (0.0%) |
| 3 or 4 Unit Apartments | 0 (0.0%) | 3 (100.0%) |
| 5 to 9 Unit Apartments | 0 (0.0%) | 6 (100.0%) |
| 10 or more Apartments | 0 (0.0%) | 1 (100.0%) |
| Mobile Home / Other | 10 (100.0%) | 0 (0.0%) |
| Total | 177 (80.1%) | 44 (19.9%) |
Housing Structures by Number of Rooms in Smithton
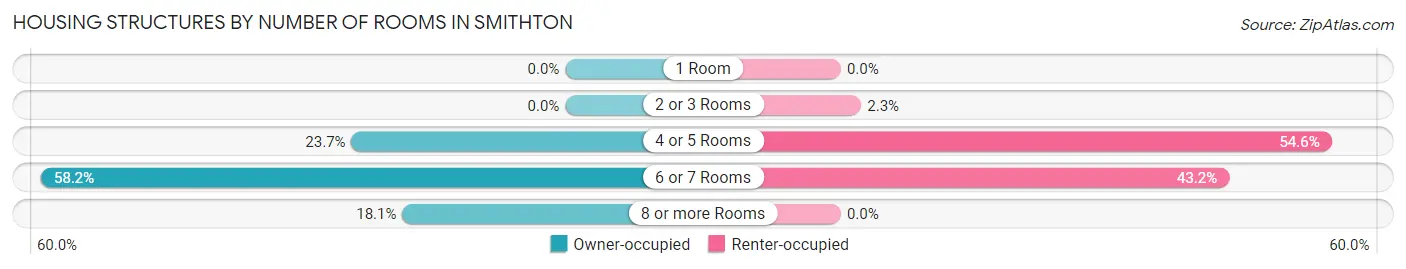
| Number of Rooms | Owner-occupied | Renter-occupied |
| 1 Room | 0 (0.0%) | 0 (0.0%) |
| 2 or 3 Rooms | 0 (0.0%) | 1 (2.3%) |
| 4 or 5 Rooms | 42 (23.7%) | 24 (54.5%) |
| 6 or 7 Rooms | 103 (58.2%) | 19 (43.2%) |
| 8 or more Rooms | 32 (18.1%) | 0 (0.0%) |
| Total | 177 (100.0%) | 44 (100.0%) |
Housing Structure by Heating Type in Smithton
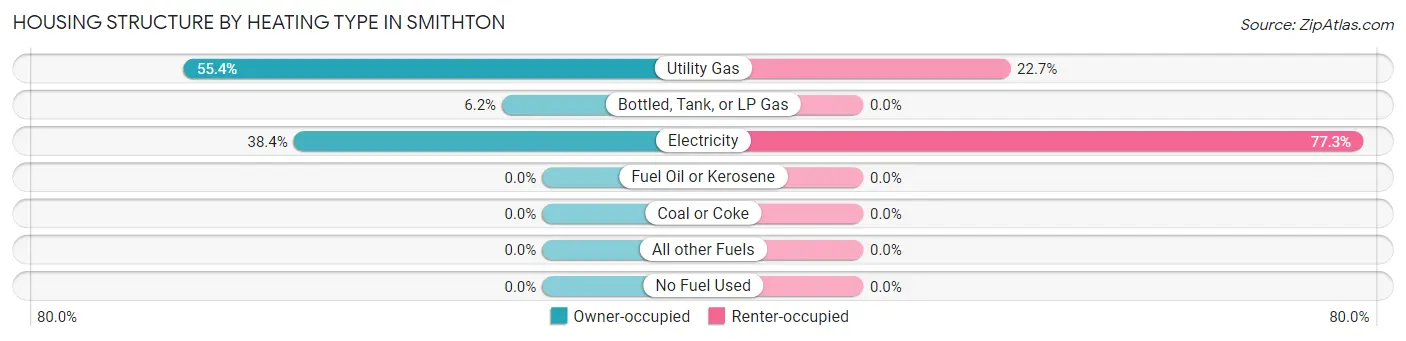
| Heating Type | Owner-occupied | Renter-occupied |
| Utility Gas | 98 (55.4%) | 10 (22.7%) |
| Bottled, Tank, or LP Gas | 11 (6.2%) | 0 (0.0%) |
| Electricity | 68 (38.4%) | 34 (77.3%) |
| Fuel Oil or Kerosene | 0 (0.0%) | 0 (0.0%) |
| Coal or Coke | 0 (0.0%) | 0 (0.0%) |
| All other Fuels | 0 (0.0%) | 0 (0.0%) |
| No Fuel Used | 0 (0.0%) | 0 (0.0%) |
| Total | 177 (100.0%) | 44 (100.0%) |
Household Vehicle Usage in Smithton
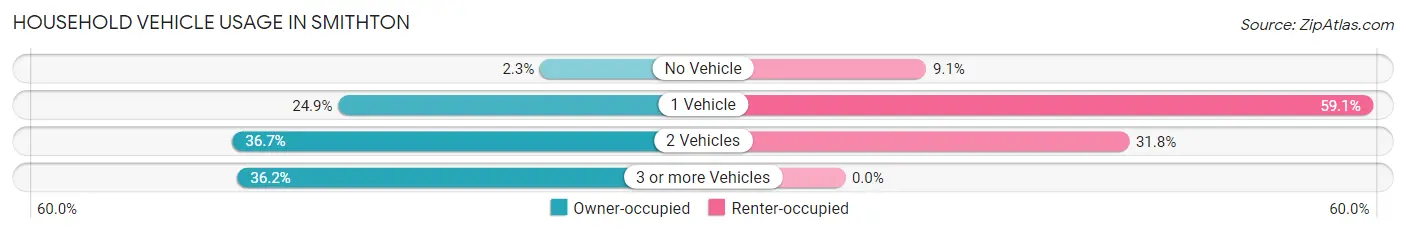
| Vehicles per Household | Owner-occupied | Renter-occupied |
| No Vehicle | 4 (2.3%) | 4 (9.1%) |
| 1 Vehicle | 44 (24.9%) | 26 (59.1%) |
| 2 Vehicles | 65 (36.7%) | 14 (31.8%) |
| 3 or more Vehicles | 64 (36.2%) | 0 (0.0%) |
| Total | 177 (100.0%) | 44 (100.0%) |
Real Estate & Mortgages in Smithton
Real Estate and Mortgage Overview in Smithton
| Characteristic | Without Mortgage | With Mortgage |
| Housing Units | 70 | 107 |
| Median Property Value | $73,100 | $95,000 |
| Median Household Income | $43,750 | $18 |
| Monthly Housing Costs | $330 | $0 |
| Real Estate Taxes | $600 | $7 |
Property Value by Mortgage Status in Smithton
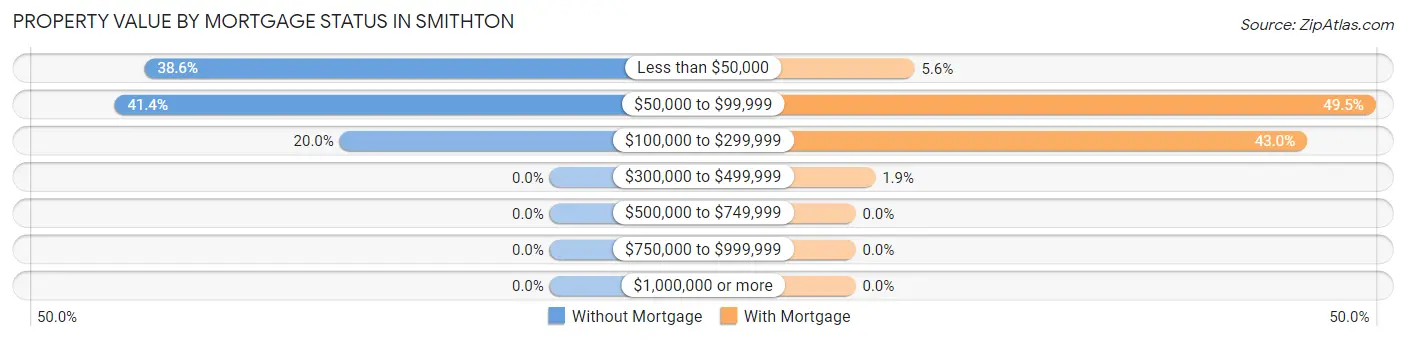
| Property Value | Without Mortgage | With Mortgage |
| Less than $50,000 | 27 (38.6%) | 6 (5.6%) |
| $50,000 to $99,999 | 29 (41.4%) | 53 (49.5%) |
| $100,000 to $299,999 | 14 (20.0%) | 46 (43.0%) |
| $300,000 to $499,999 | 0 (0.0%) | 2 (1.9%) |
| $500,000 to $749,999 | 0 (0.0%) | 0 (0.0%) |
| $750,000 to $999,999 | 0 (0.0%) | 0 (0.0%) |
| $1,000,000 or more | 0 (0.0%) | 0 (0.0%) |
| Total | 70 (100.0%) | 107 (100.0%) |
Household Income by Mortgage Status in Smithton
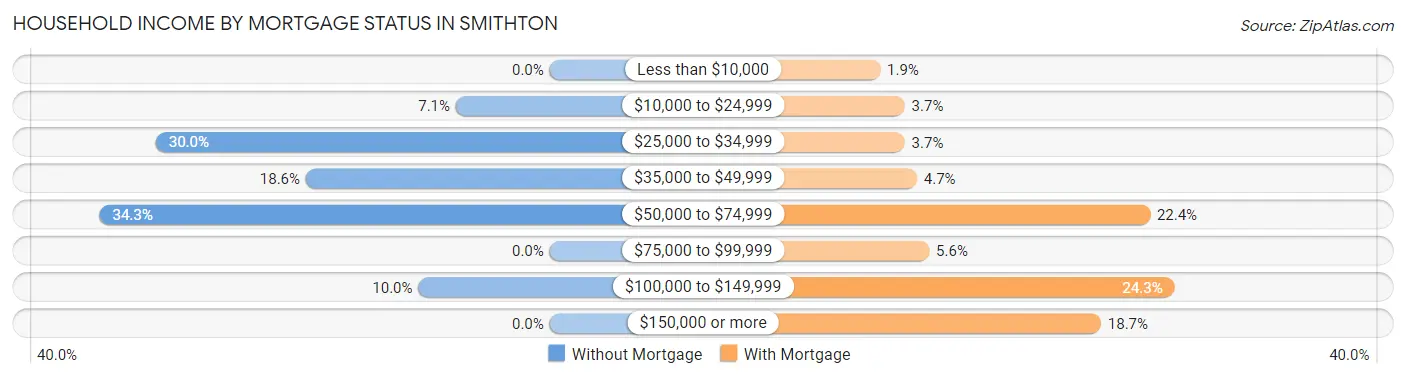
| Household Income | Without Mortgage | With Mortgage |
| Less than $10,000 | 0 (0.0%) | 2 (1.9%) |
| $10,000 to $24,999 | 5 (7.1%) | 4 (3.7%) |
| $25,000 to $34,999 | 21 (30.0%) | 4 (3.7%) |
| $35,000 to $49,999 | 13 (18.6%) | 5 (4.7%) |
| $50,000 to $74,999 | 24 (34.3%) | 24 (22.4%) |
| $75,000 to $99,999 | 0 (0.0%) | 6 (5.6%) |
| $100,000 to $149,999 | 7 (10.0%) | 26 (24.3%) |
| $150,000 or more | 0 (0.0%) | 20 (18.7%) |
| Total | 70 (100.0%) | 107 (100.0%) |
Property Value to Household Income Ratio in Smithton
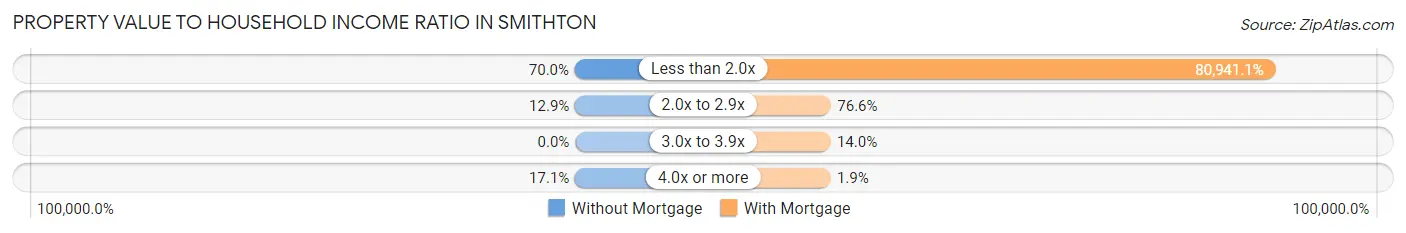
| Value-to-Income Ratio | Without Mortgage | With Mortgage |
| Less than 2.0x | 49 (70.0%) | 86,607 (80,941.1%) |
| 2.0x to 2.9x | 9 (12.9%) | 82 (76.6%) |
| 3.0x to 3.9x | 0 (0.0%) | 15 (14.0%) |
| 4.0x or more | 12 (17.1%) | 2 (1.9%) |
| Total | 70 (100.0%) | 107 (100.0%) |
Real Estate Taxes by Mortgage Status in Smithton
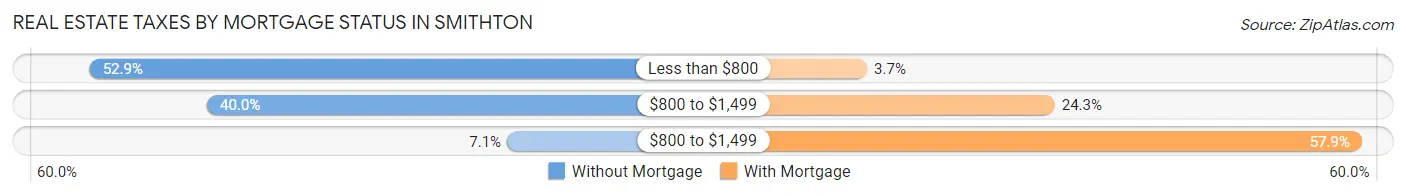
| Property Taxes | Without Mortgage | With Mortgage |
| Less than $800 | 37 (52.9%) | 4 (3.7%) |
| $800 to $1,499 | 28 (40.0%) | 26 (24.3%) |
| $800 to $1,499 | 5 (7.1%) | 62 (57.9%) |
| Total | 70 (100.0%) | 107 (100.0%) |
Health & Disability in Smithton
Health Insurance Coverage by Age in Smithton
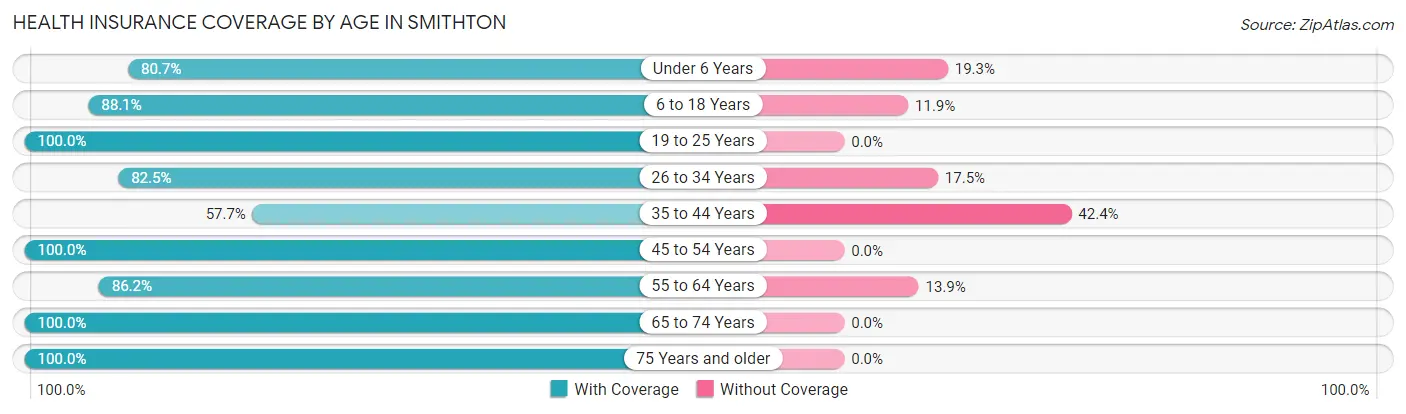
| Age Bracket | With Coverage | Without Coverage |
| Under 6 Years | 46 (80.7%) | 11 (19.3%) |
| 6 to 18 Years | 74 (88.1%) | 10 (11.9%) |
| 19 to 25 Years | 23 (100.0%) | 0 (0.0%) |
| 26 to 34 Years | 52 (82.5%) | 11 (17.5%) |
| 35 to 44 Years | 49 (57.7%) | 36 (42.3%) |
| 45 to 54 Years | 90 (100.0%) | 0 (0.0%) |
| 55 to 64 Years | 56 (86.2%) | 9 (13.9%) |
| 65 to 74 Years | 22 (100.0%) | 0 (0.0%) |
| 75 Years and older | 21 (100.0%) | 0 (0.0%) |
| Total | 433 (84.9%) | 77 (15.1%) |
Health Insurance Coverage by Citizenship Status in Smithton
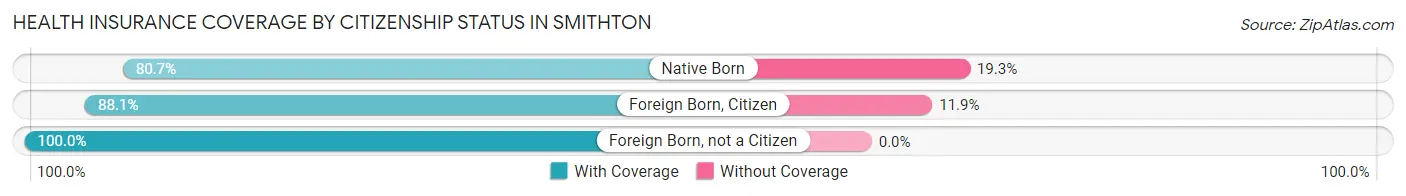
| Citizenship Status | With Coverage | Without Coverage |
| Native Born | 46 (80.7%) | 11 (19.3%) |
| Foreign Born, Citizen | 74 (88.1%) | 10 (11.9%) |
| Foreign Born, not a Citizen | 23 (100.0%) | 0 (0.0%) |
Health Insurance Coverage by Household Income in Smithton
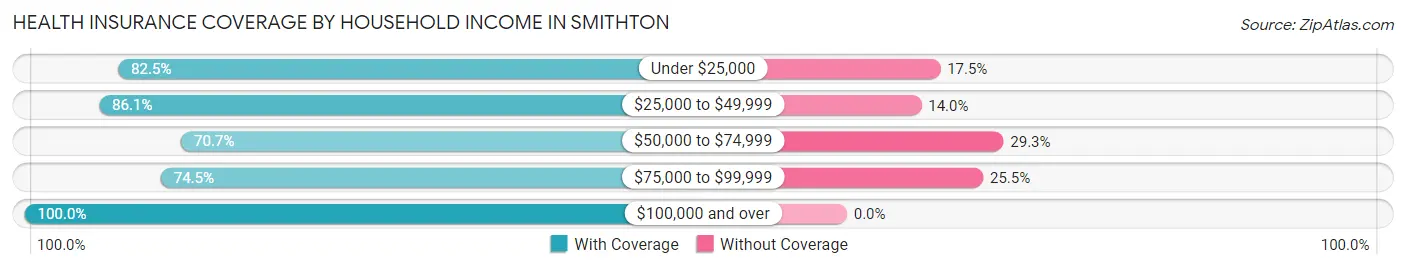
| Household Income | With Coverage | Without Coverage |
| Under $25,000 | 33 (82.5%) | 7 (17.5%) |
| $25,000 to $49,999 | 148 (86.1%) | 24 (14.0%) |
| $50,000 to $74,999 | 53 (70.7%) | 22 (29.3%) |
| $75,000 to $99,999 | 70 (74.5%) | 24 (25.5%) |
| $100,000 and over | 129 (100.0%) | 0 (0.0%) |
Public vs Private Health Insurance Coverage by Age in Smithton
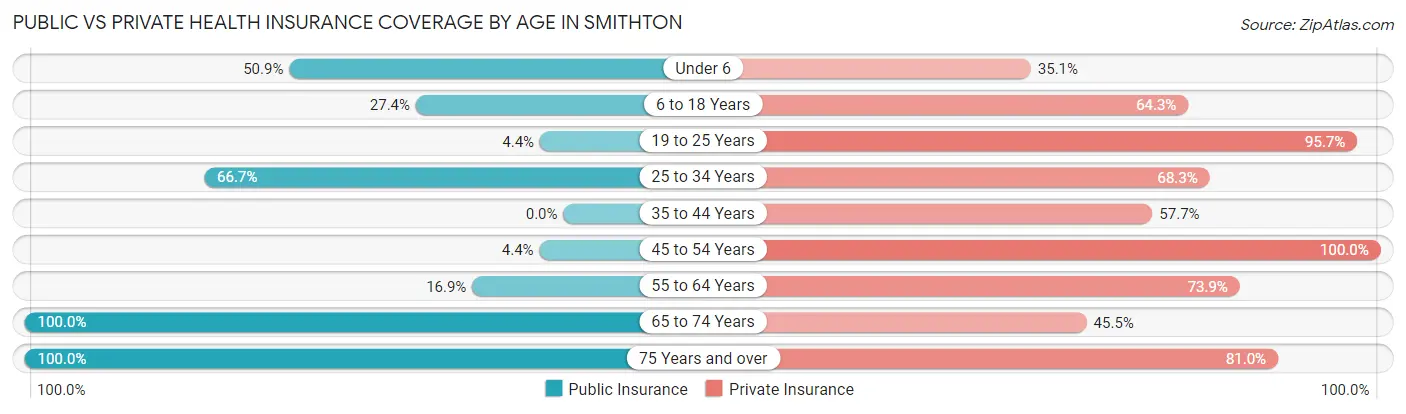
| Age Bracket | Public Insurance | Private Insurance |
| Under 6 | 29 (50.9%) | 20 (35.1%) |
| 6 to 18 Years | 23 (27.4%) | 54 (64.3%) |
| 19 to 25 Years | 1 (4.3%) | 22 (95.7%) |
| 25 to 34 Years | 42 (66.7%) | 43 (68.2%) |
| 35 to 44 Years | 0 (0.0%) | 49 (57.7%) |
| 45 to 54 Years | 4 (4.4%) | 90 (100.0%) |
| 55 to 64 Years | 11 (16.9%) | 48 (73.9%) |
| 65 to 74 Years | 22 (100.0%) | 10 (45.5%) |
| 75 Years and over | 21 (100.0%) | 17 (80.9%) |
| Total | 153 (30.0%) | 353 (69.2%) |
Disability Status by Sex by Age in Smithton
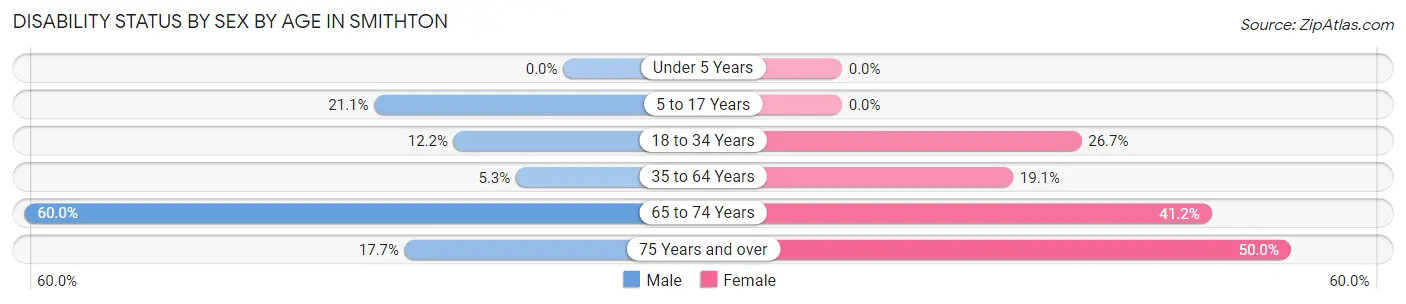
| Age Bracket | Male | Female |
| Under 5 Years | 0 (0.0%) | 0 (0.0%) |
| 5 to 17 Years | 12 (21.0%) | 0 (0.0%) |
| 18 to 34 Years | 5 (12.2%) | 12 (26.7%) |
| 35 to 64 Years | 6 (5.3%) | 24 (19.1%) |
| 65 to 74 Years | 3 (60.0%) | 7 (41.2%) |
| 75 Years and over | 3 (17.6%) | 2 (50.0%) |
Disability Class by Sex by Age in Smithton
Disability Class: Hearing Difficulty
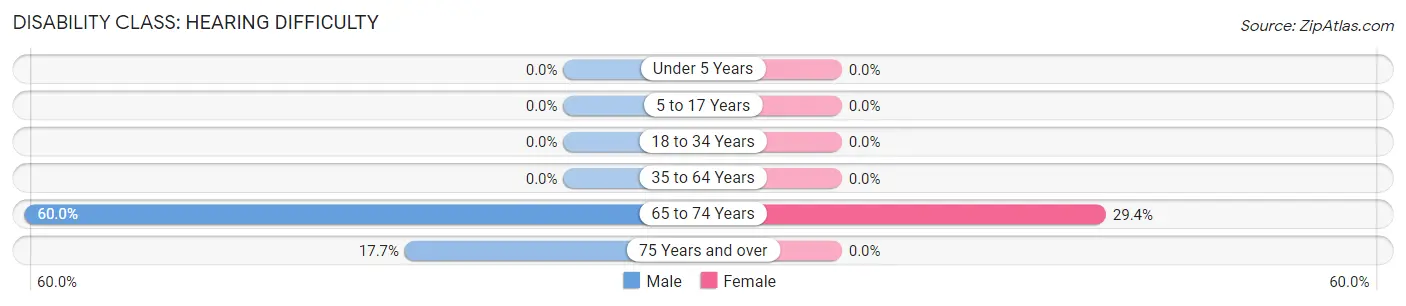
| Age Bracket | Male | Female |
| Under 5 Years | 0 (0.0%) | 0 (0.0%) |
| 5 to 17 Years | 0 (0.0%) | 0 (0.0%) |
| 18 to 34 Years | 0 (0.0%) | 0 (0.0%) |
| 35 to 64 Years | 0 (0.0%) | 0 (0.0%) |
| 65 to 74 Years | 3 (60.0%) | 5 (29.4%) |
| 75 Years and over | 3 (17.6%) | 0 (0.0%) |
Disability Class: Vision Difficulty
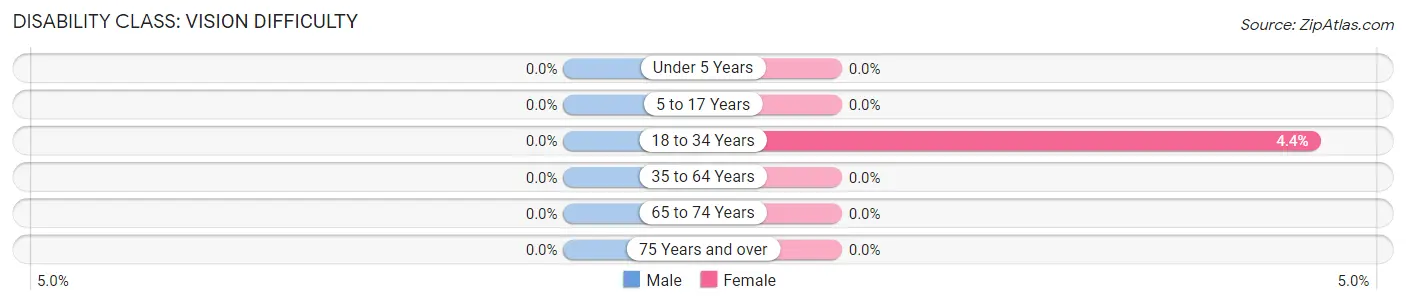
| Age Bracket | Male | Female |
| Under 5 Years | 0 (0.0%) | 0 (0.0%) |
| 5 to 17 Years | 0 (0.0%) | 0 (0.0%) |
| 18 to 34 Years | 0 (0.0%) | 2 (4.4%) |
| 35 to 64 Years | 0 (0.0%) | 0 (0.0%) |
| 65 to 74 Years | 0 (0.0%) | 0 (0.0%) |
| 75 Years and over | 0 (0.0%) | 0 (0.0%) |
Disability Class: Cognitive Difficulty
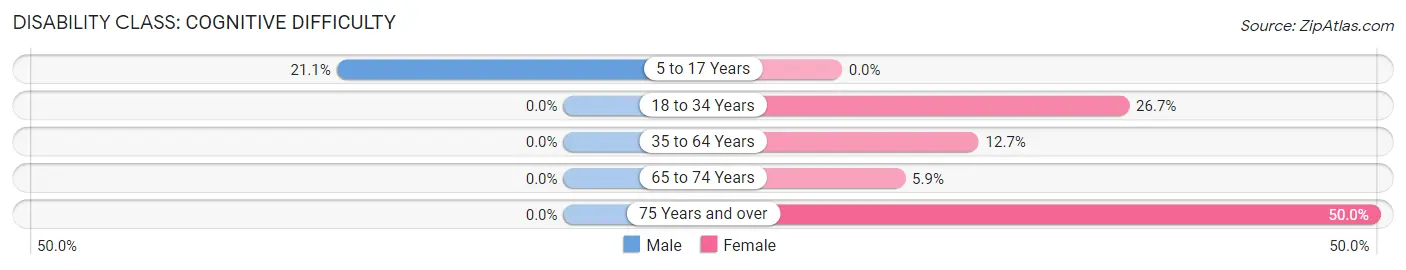
| Age Bracket | Male | Female |
| 5 to 17 Years | 12 (21.0%) | 0 (0.0%) |
| 18 to 34 Years | 0 (0.0%) | 12 (26.7%) |
| 35 to 64 Years | 0 (0.0%) | 16 (12.7%) |
| 65 to 74 Years | 0 (0.0%) | 1 (5.9%) |
| 75 Years and over | 0 (0.0%) | 2 (50.0%) |
Disability Class: Ambulatory Difficulty
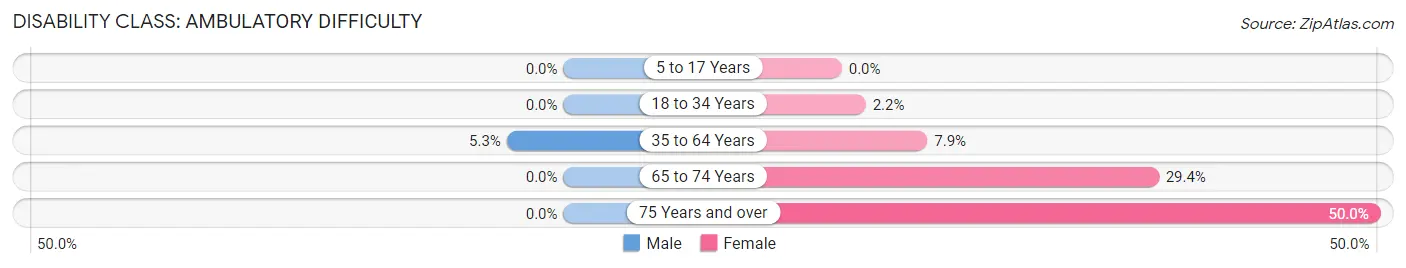
| Age Bracket | Male | Female |
| 5 to 17 Years | 0 (0.0%) | 0 (0.0%) |
| 18 to 34 Years | 0 (0.0%) | 1 (2.2%) |
| 35 to 64 Years | 6 (5.3%) | 10 (7.9%) |
| 65 to 74 Years | 0 (0.0%) | 5 (29.4%) |
| 75 Years and over | 0 (0.0%) | 2 (50.0%) |
Disability Class: Self-Care Difficulty
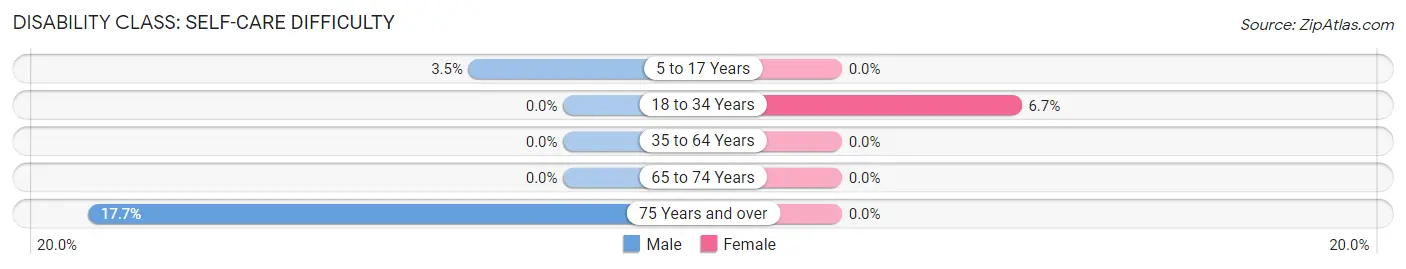
| Age Bracket | Male | Female |
| 5 to 17 Years | 2 (3.5%) | 0 (0.0%) |
| 18 to 34 Years | 0 (0.0%) | 3 (6.7%) |
| 35 to 64 Years | 0 (0.0%) | 0 (0.0%) |
| 65 to 74 Years | 0 (0.0%) | 0 (0.0%) |
| 75 Years and over | 3 (17.6%) | 0 (0.0%) |
Technology Access in Smithton
Computing Device Access in Smithton
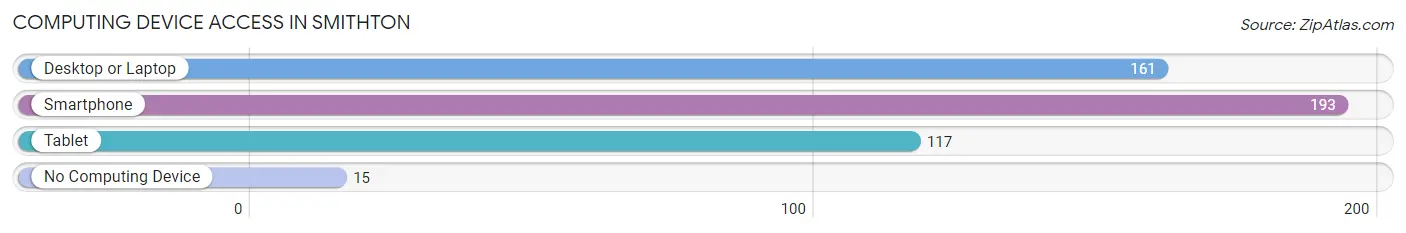
| Device Type | # Households | % Households |
| Desktop or Laptop | 161 | 72.9% |
| Smartphone | 193 | 87.3% |
| Tablet | 117 | 52.9% |
| No Computing Device | 15 | 6.8% |
| Total | 221 | 100.0% |
Internet Access in Smithton
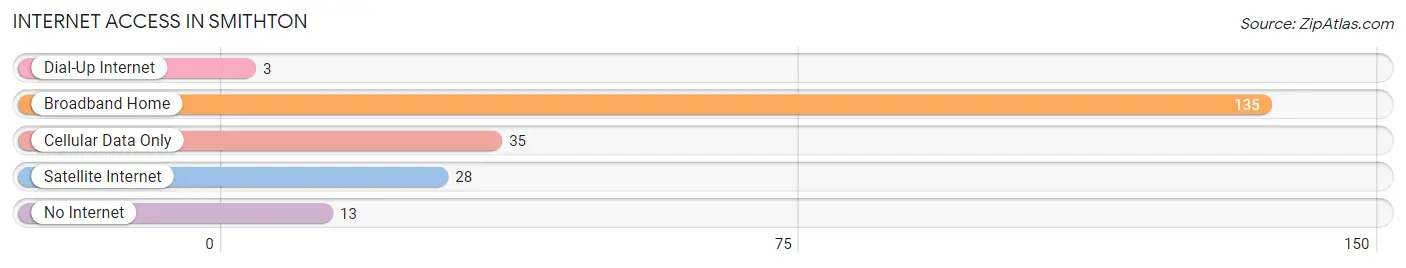
| Internet Type | # Households | % Households |
| Dial-Up Internet | 3 | 1.4% |
| Broadband Home | 135 | 61.1% |
| Cellular Data Only | 35 | 15.8% |
| Satellite Internet | 28 | 12.7% |
| No Internet | 13 | 5.9% |
| Total | 221 | 100.0% |
Smithton Summary
Smithton, Missouri is a small town located in Pettis County, Missouri. It is situated on the banks of the Missouri River, approximately 30 miles east of Sedalia. The town was founded in 1871 and has a population of approximately 1,000 people.
History
Smithton was founded in 1871 by William Smith, a former Union soldier who had served in the Civil War. Smith had been a farmer in the area and decided to build a town on the banks of the Missouri River. He named the town after himself and it quickly grew to become a thriving community.
The town was incorporated in 1876 and soon became a hub for the surrounding agricultural communities. Smithton was home to a number of businesses, including a general store, a blacksmith shop, a hotel, and a post office.
In the late 19th century, Smithton was a popular stop for steamboats traveling up and down the Missouri River. The town was also home to a number of churches, including the Methodist Episcopal Church, the Baptist Church, and the Presbyterian Church.
In the early 20th century, Smithton was a popular destination for tourists. The town was home to a number of attractions, including a zoo, a swimming pool, and a movie theater.
Geography
Smithton is located in Pettis County, Missouri. It is situated on the banks of the Missouri River, approximately 30 miles east of Sedalia. The town is surrounded by rolling hills and farmland.
The climate in Smithton is typical of the Midwest, with hot summers and cold winters. The average temperature in the summer is around 80 degrees Fahrenheit, while the average temperature in the winter is around 30 degrees Fahrenheit.
Economy
The economy of Smithton is largely based on agriculture. The town is home to a number of farms, which produce a variety of crops, including corn, soybeans, and wheat.
Smithton is also home to a number of small businesses, including restaurants, retail stores, and service providers. The town is also home to a number of manufacturing companies, which produce a variety of products, including furniture, clothing, and automotive parts.
Demographics
As of the 2010 census, the population of Smithton was 1,000 people. The racial makeup of the town was 97.2% White, 0.7% African American, 0.2% Native American, 0.2% Asian, and 1.7% from other races.
The median household income in Smithton was $37,500, and the median family income was $45,000. The per capita income in Smithton was $18,000. The poverty rate in Smithton was 11.2%.
Conclusion
Smithton, Missouri is a small town located in Pettis County, Missouri. It is situated on the banks of the Missouri River, approximately 30 miles east of Sedalia. The town was founded in 1871 and has a population of approximately 1,000 people. The economy of Smithton is largely based on agriculture, and the town is home to a number of small businesses. The racial makeup of the town is 97.2% White, 0.7% African American, 0.2% Native American, 0.2% Asian, and 1.7% from other races. The median household income in Smithton was $37,500, and the poverty rate was 11.2%. Smithton is a small town with a rich history and a bright future.
Common Questions
What is Per Capita Income in Smithton?
Per Capita income in Smithton is $28,031.
What is the Median Family Income in Smithton?
Median Family Income in Smithton is $59,063.
What is the Median Household income in Smithton?
Median Household Income in Smithton is $50,156.
What is Income or Wage Gap in Smithton?
Income or Wage Gap in Smithton is 24.7%.
Women in Smithton earn 75.3 cents for every dollar earned by a man.
What is Inequality or Gini Index in Smithton?
Inequality or Gini Index in Smithton is 0.39.
What is the Total Population of Smithton?
Total Population of Smithton is 514.
What is the Total Male Population of Smithton?
Total Male Population of Smithton is 265.
What is the Total Female Population of Smithton?
Total Female Population of Smithton is 249.
What is the Ratio of Males per 100 Females in Smithton?
There are 106.43 Males per 100 Females in Smithton.
What is the Ratio of Females per 100 Males in Smithton?
There are 93.96 Females per 100 Males in Smithton.
What is the Median Population Age in Smithton?
Median Population Age in Smithton is 39.1 Years.
What is the Average Family Size in Smithton
Average Family Size in Smithton is 2.8 People.
What is the Average Household Size in Smithton
Average Household Size in Smithton is 2.3 People.
How Large is the Labor Force in Smithton?
There are 284 People in the Labor Forcein in Smithton.
What is the Percentage of People in the Labor Force in Smithton?
69.4% of People are in the Labor Force in Smithton.
What is the Unemployment Rate in Smithton?
Unemployment Rate in Smithton is 6.0%.