Wadena, MN Map & Demographics
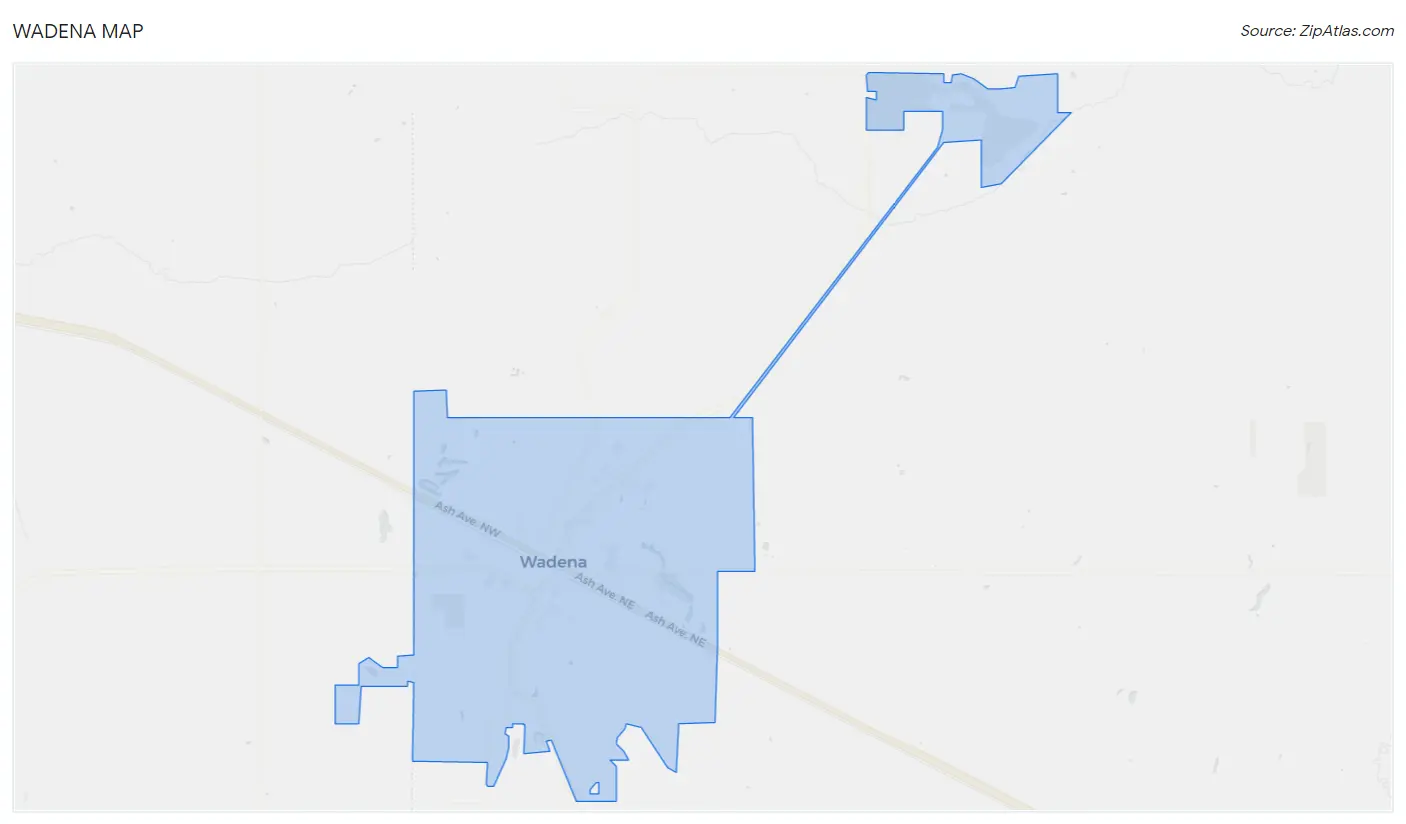
Wadena Map
Wadena Overview
$25,001
PER CAPITA INCOME
$60,278
AVG FAMILY INCOME
$44,450
AVG HOUSEHOLD INCOME
13.8%
WAGE / INCOME GAP [ % ]
86.2¢/ $1
WAGE / INCOME GAP [ $ ]
0.42
INEQUALITY / GINI INDEX
4,328
TOTAL POPULATION
2,070
MALE POPULATION
2,258
FEMALE POPULATION
91.67
MALES / 100 FEMALES
109.08
FEMALES / 100 MALES
37.4
MEDIAN AGE
2.8
AVG FAMILY SIZE
2.1
AVG HOUSEHOLD SIZE
2,133
LABOR FORCE [ PEOPLE ]
65.2%
PERCENT IN LABOR FORCE
10.7%
UNEMPLOYMENT RATE
Wadena Zip Codes
Wadena Area Codes
Income in Wadena
Income Overview in Wadena
Per Capita Income in Wadena is $25,001, while median incomes of families and households are $60,278 and $44,450 respectively.
| Characteristic | Number | Measure |
| Per Capita Income | 4,328 | $25,001 |
| Median Family Income | 1,122 | $60,278 |
| Mean Family Income | 1,122 | $70,974 |
| Median Household Income | 1,948 | $44,450 |
| Mean Household Income | 1,948 | $54,588 |
| Income Deficit | 1,122 | $0 |
| Wage / Income Gap (%) | 4,328 | 13.83% |
| Wage / Income Gap ($) | 4,328 | 86.17¢ per $1 |
| Gini / Inequality Index | 4,328 | 0.42 |
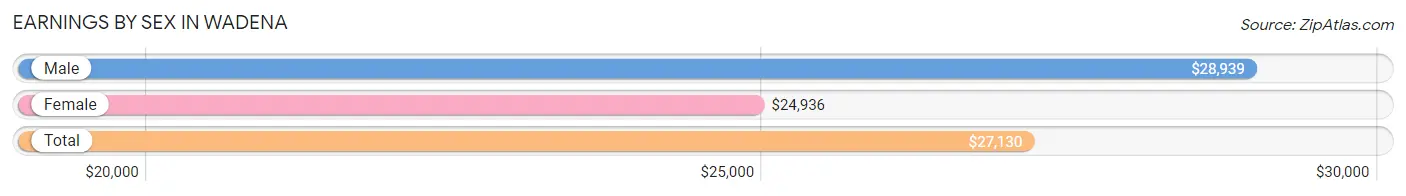
Earnings by Sex in Wadena
Average Earnings in Wadena are $27,130, $28,939 for men and $24,936 for women, a difference of 13.8%.
| Sex | Number | Average Earnings |
| Male | 1,005 (48.1%) | $28,939 |
| Female | 1,085 (51.9%) | $24,936 |
| Total | 2,090 (100.0%) | $27,130 |
Earnings by Sex by Income Bracket in Wadena
The most common earnings brackets in Wadena are $20,000 to $22,499 for men (191 | 19.0%) and $55,000 to $64,999 for women (150 | 13.8%).
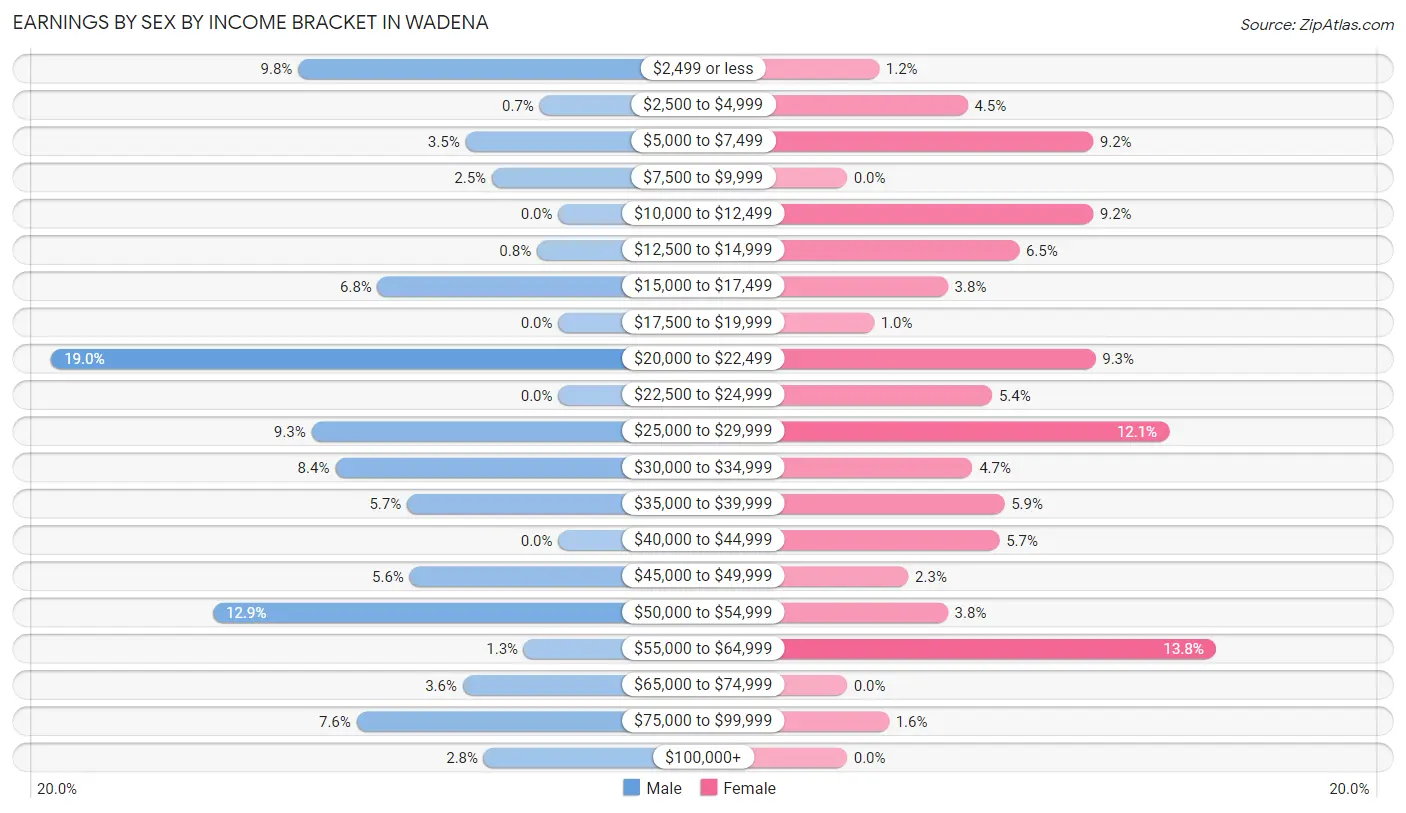
| Income | Male | Female |
| $2,499 or less | 98 (9.8%) | 13 (1.2%) |
| $2,500 to $4,999 | 7 (0.7%) | 49 (4.5%) |
| $5,000 to $7,499 | 35 (3.5%) | 100 (9.2%) |
| $7,500 to $9,999 | 25 (2.5%) | 0 (0.0%) |
| $10,000 to $12,499 | 0 (0.0%) | 100 (9.2%) |
| $12,500 to $14,999 | 8 (0.8%) | 70 (6.5%) |
| $15,000 to $17,499 | 68 (6.8%) | 41 (3.8%) |
| $17,500 to $19,999 | 0 (0.0%) | 11 (1.0%) |
| $20,000 to $22,499 | 191 (19.0%) | 101 (9.3%) |
| $22,500 to $24,999 | 0 (0.0%) | 59 (5.4%) |
| $25,000 to $29,999 | 93 (9.2%) | 131 (12.1%) |
| $30,000 to $34,999 | 84 (8.4%) | 51 (4.7%) |
| $35,000 to $39,999 | 57 (5.7%) | 64 (5.9%) |
| $40,000 to $44,999 | 0 (0.0%) | 62 (5.7%) |
| $45,000 to $49,999 | 56 (5.6%) | 25 (2.3%) |
| $50,000 to $54,999 | 130 (12.9%) | 41 (3.8%) |
| $55,000 to $64,999 | 13 (1.3%) | 150 (13.8%) |
| $65,000 to $74,999 | 36 (3.6%) | 0 (0.0%) |
| $75,000 to $99,999 | 76 (7.6%) | 17 (1.6%) |
| $100,000+ | 28 (2.8%) | 0 (0.0%) |
| Total | 1,005 (100.0%) | 1,085 (100.0%) |
Earnings by Sex by Educational Attainment in Wadena
Average earnings in Wadena are $34,734 for men and $24,343 for women, a difference of 29.9%. Men with an educational attainment of college or associate's degree enjoy the highest average annual earnings of $45,807, while those with less than high school education earn the least with $5,750. Women with an educational attainment of high school diploma earn the most with the average annual earnings of $26,691, while those with less than high school education have the smallest earnings of $21,402.
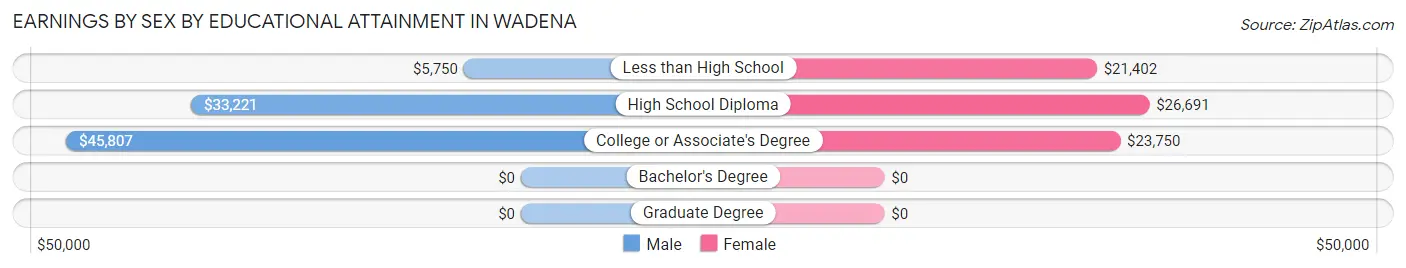
| Educational Attainment | Male Income | Female Income |
| Less than High School | $5,750 | $21,402 |
| High School Diploma | $33,221 | $26,691 |
| College or Associate's Degree | $45,807 | $23,750 |
| Bachelor's Degree | - | - |
| Graduate Degree | - | - |
| Total | $34,734 | $24,343 |
Family Income in Wadena
Family Income Brackets in Wadena
According to the Wadena family income data, there are 265 families falling into the $50,000 to $74,999 income range, which is the most common income bracket and makes up 23.6% of all families. Conversely, the $10,000 to $14,999 income bracket is the least frequent group with only 13 families (1.2%) belonging to this category.
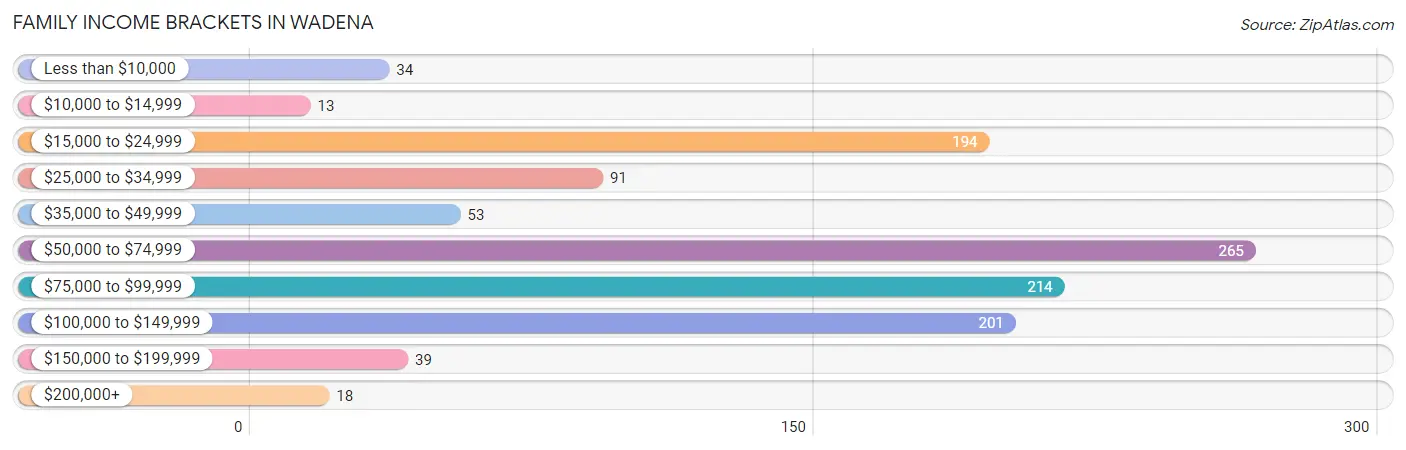
| Income Bracket | # Families | % Families |
| Less than $10,000 | 34 | 3.0% |
| $10,000 to $14,999 | 13 | 1.2% |
| $15,000 to $24,999 | 194 | 17.3% |
| $25,000 to $34,999 | 91 | 8.1% |
| $35,000 to $49,999 | 53 | 4.7% |
| $50,000 to $74,999 | 265 | 23.6% |
| $75,000 to $99,999 | 214 | 19.1% |
| $100,000 to $149,999 | 201 | 17.9% |
| $150,000 to $199,999 | 39 | 3.5% |
| $200,000+ | 18 | 1.6% |
Family Income by Famaliy Size in Wadena
3-person families (298 | 26.6%) account for the highest median family income in Wadena with $82,262 per family, while 3-person families (298 | 26.6%) have the highest median income of $27,421 per family member.
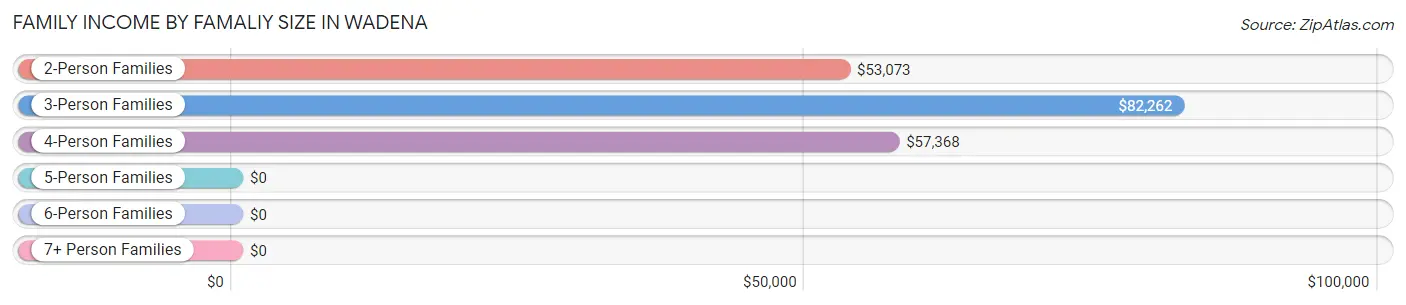
| Income Bracket | # Families | Median Income |
| 2-Person Families | 597 (53.2%) | $53,073 |
| 3-Person Families | 298 (26.6%) | $82,262 |
| 4-Person Families | 120 (10.7%) | $57,368 |
| 5-Person Families | 75 (6.7%) | $0 |
| 6-Person Families | 17 (1.5%) | $0 |
| 7+ Person Families | 15 (1.3%) | $0 |
| Total | 1,122 (100.0%) | $60,278 |
Family Income by Number of Earners in Wadena
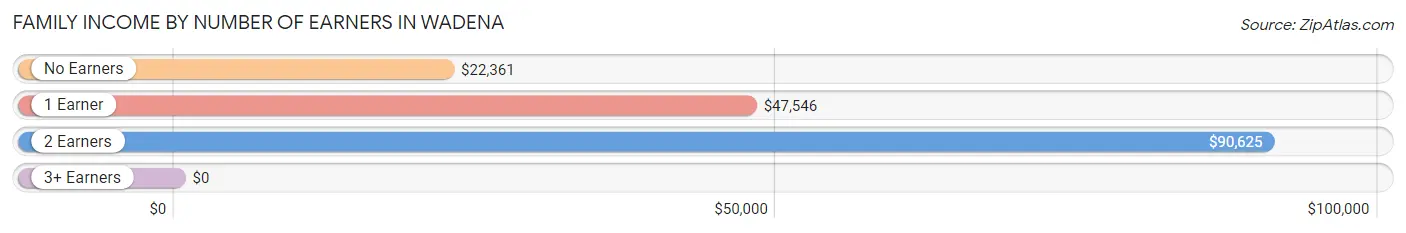
| Number of Earners | # Families | Median Income |
| No Earners | 158 (14.1%) | $22,361 |
| 1 Earner | 487 (43.4%) | $47,546 |
| 2 Earners | 400 (35.6%) | $90,625 |
| 3+ Earners | 77 (6.9%) | $0 |
| Total | 1,122 (100.0%) | $60,278 |
Household Income in Wadena
Household Income Brackets in Wadena
With 506 households falling in the category, the $15,000 to $24,999 income range is the most frequent in Wadena, accounting for 26.0% of all households. In contrast, only 18 households (0.9%) fall into the $200,000+ income bracket, making it the least populous group.
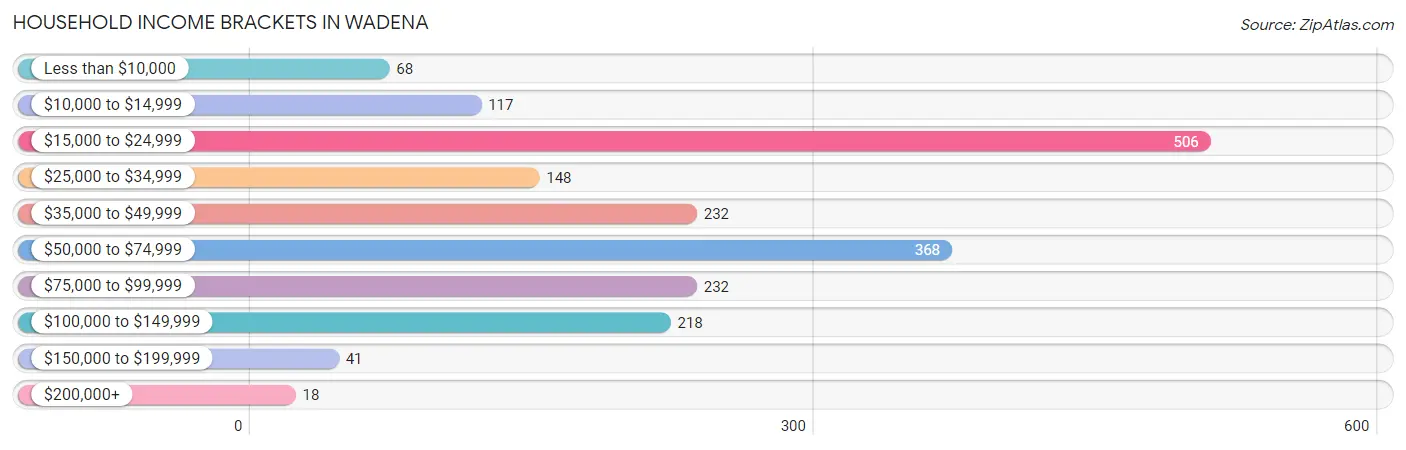
| Income Bracket | # Households | % Households |
| Less than $10,000 | 68 | 3.5% |
| $10,000 to $14,999 | 117 | 6.0% |
| $15,000 to $24,999 | 506 | 26.0% |
| $25,000 to $34,999 | 148 | 7.6% |
| $35,000 to $49,999 | 232 | 11.9% |
| $50,000 to $74,999 | 368 | 18.9% |
| $75,000 to $99,999 | 232 | 11.9% |
| $100,000 to $149,999 | 218 | 11.2% |
| $150,000 to $199,999 | 41 | 2.1% |
| $200,000+ | 18 | 0.9% |
Household Income by Householder Age in Wadena
The median household income in Wadena is $44,450, with the highest median household income of $53,222 found in the 25 to 44 years age bracket for the primary householder. A total of 574 households (29.5%) fall into this category. Meanwhile, the 45 to 64 years age bracket for the primary householder has the lowest median household income of $25,197, with 609 households (31.3%) in this group.
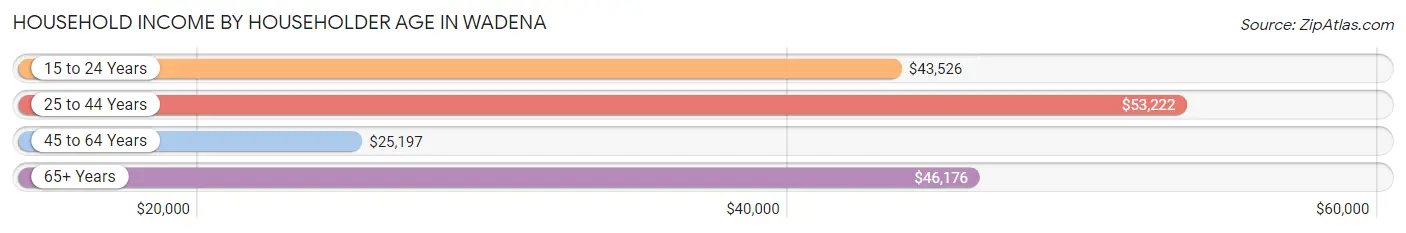
| Income Bracket | # Households | Median Income |
| 15 to 24 Years | 205 (10.5%) | $43,526 |
| 25 to 44 Years | 574 (29.5%) | $53,222 |
| 45 to 64 Years | 609 (31.3%) | $25,197 |
| 65+ Years | 560 (28.7%) | $46,176 |
| Total | 1,948 (100.0%) | $44,450 |
Poverty in Wadena
Income Below Poverty by Sex and Age in Wadena
With 18.0% poverty level for males and 15.1% for females among the residents of Wadena, 16 and 17 year old males and under 5 year old females are the most vulnerable to poverty, with 26 males (100.0%) and 48 females (32.2%) in their respective age groups living below the poverty level.
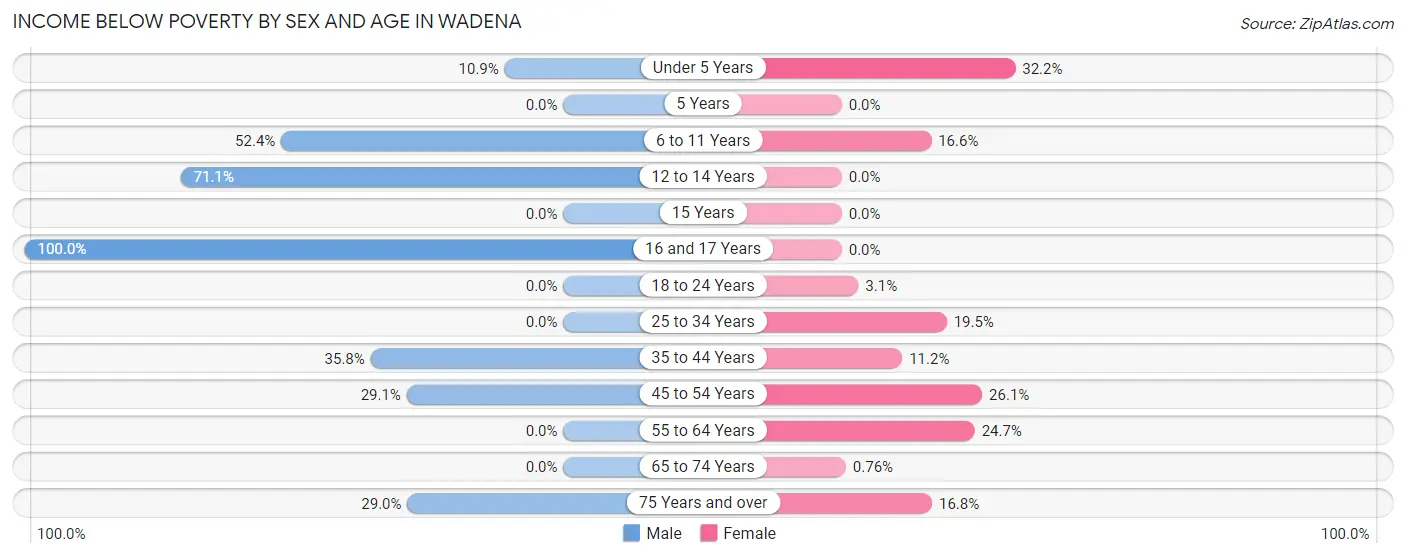
| Age Bracket | Male | Female |
| Under 5 Years | 17 (10.9%) | 48 (32.2%) |
| 5 Years | 0 (0.0%) | 0 (0.0%) |
| 6 to 11 Years | 88 (52.4%) | 41 (16.6%) |
| 12 to 14 Years | 27 (71.1%) | 0 (0.0%) |
| 15 Years | 0 (0.0%) | 0 (0.0%) |
| 16 and 17 Years | 26 (100.0%) | 0 (0.0%) |
| 18 to 24 Years | 0 (0.0%) | 7 (3.1%) |
| 25 to 34 Years | 0 (0.0%) | 74 (19.5%) |
| 35 to 44 Years | 83 (35.8%) | 11 (11.2%) |
| 45 to 54 Years | 82 (29.1%) | 56 (26.1%) |
| 55 to 64 Years | 0 (0.0%) | 56 (24.7%) |
| 65 to 74 Years | 0 (0.0%) | 2 (0.8%) |
| 75 Years and over | 44 (28.9%) | 32 (16.8%) |
| Total | 367 (18.0%) | 327 (15.1%) |
Income Above Poverty by Sex and Age in Wadena
According to the poverty statistics in Wadena, males aged 5 years and females aged 5 years are the age groups that are most secure financially, with 100.0% of males and 100.0% of females in these age groups living above the poverty line.
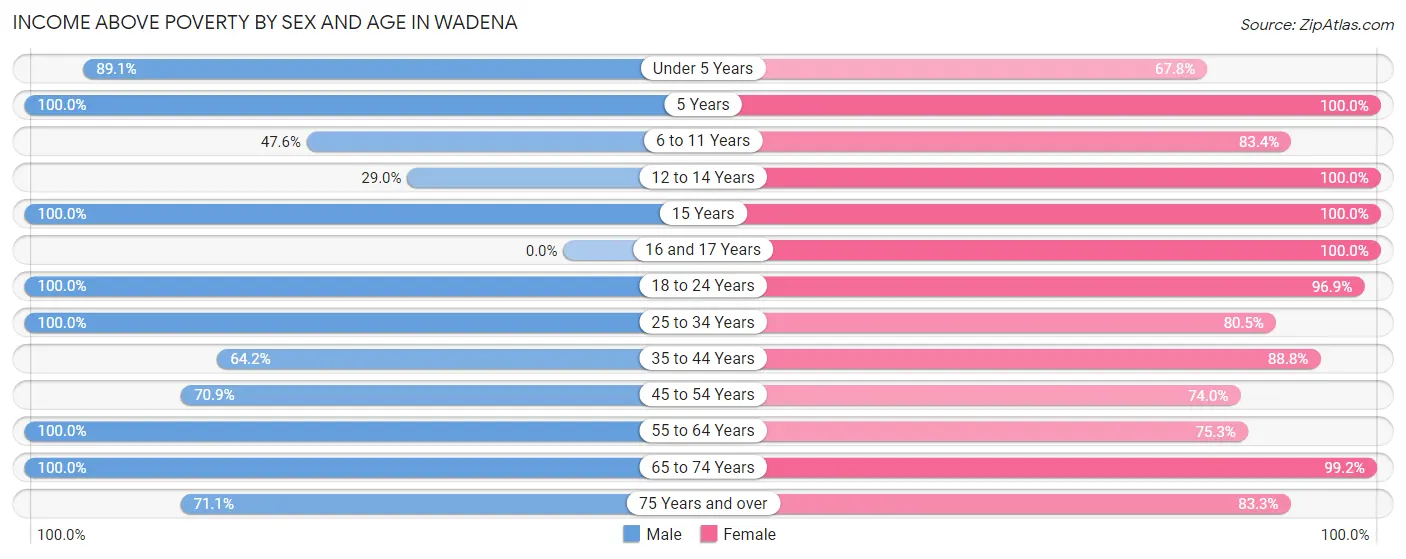
| Age Bracket | Male | Female |
| Under 5 Years | 139 (89.1%) | 101 (67.8%) |
| 5 Years | 52 (100.0%) | 59 (100.0%) |
| 6 to 11 Years | 80 (47.6%) | 206 (83.4%) |
| 12 to 14 Years | 11 (28.9%) | 75 (100.0%) |
| 15 Years | 83 (100.0%) | 29 (100.0%) |
| 16 and 17 Years | 0 (0.0%) | 11 (100.0%) |
| 18 to 24 Years | 195 (100.0%) | 220 (96.9%) |
| 25 to 34 Years | 213 (100.0%) | 306 (80.5%) |
| 35 to 44 Years | 149 (64.2%) | 87 (88.8%) |
| 45 to 54 Years | 200 (70.9%) | 159 (74.0%) |
| 55 to 64 Years | 261 (100.0%) | 171 (75.3%) |
| 65 to 74 Years | 177 (100.0%) | 261 (99.2%) |
| 75 Years and over | 108 (71.1%) | 159 (83.3%) |
| Total | 1,668 (82.0%) | 1,844 (84.9%) |
Income Below Poverty Among Married-Couple Families in Wadena
The poverty statistics for married-couple families in Wadena show that 4.4% or 33 of the total 744 families live below the poverty line. Families with 5 or more children have the highest poverty rate of 100.0%, comprising of 15 families. On the other hand, families with 1 or 2 children have the lowest poverty rate of 0.0%, which includes 0 families.
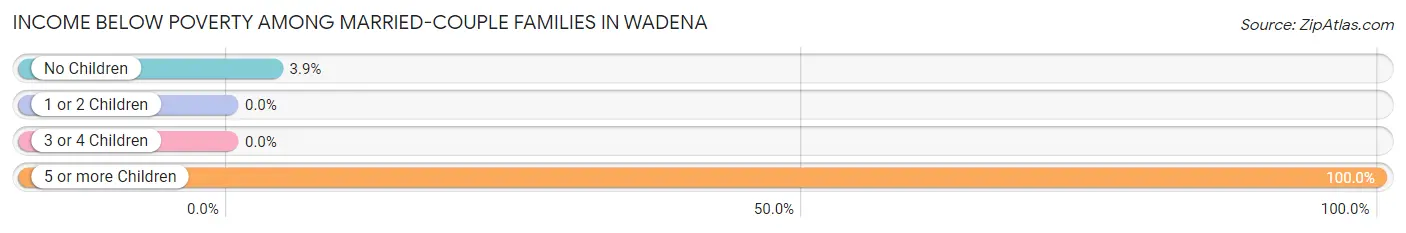
| Children | Above Poverty | Below Poverty |
| No Children | 446 (96.1%) | 18 (3.9%) |
| 1 or 2 Children | 180 (100.0%) | 0 (0.0%) |
| 3 or 4 Children | 85 (100.0%) | 0 (0.0%) |
| 5 or more Children | 0 (0.0%) | 15 (100.0%) |
| Total | 711 (95.6%) | 33 (4.4%) |
Income Below Poverty Among Single-Parent Households in Wadena
According to the poverty data in Wadena, 39.3% or 68 single-father households and 19.5% or 40 single-mother households are living below the poverty line. Among single-father households, those with 1 or 2 children have the highest poverty rate, with 68 households (60.7%) experiencing poverty. Likewise, among single-mother households, those with 1 or 2 children have the highest poverty rate, with 40 households (21.9%) falling below the poverty line.
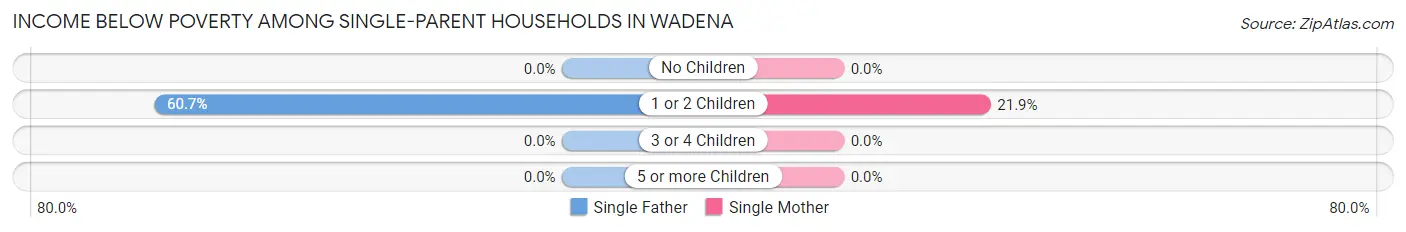
| Children | Single Father | Single Mother |
| No Children | 0 (0.0%) | 0 (0.0%) |
| 1 or 2 Children | 68 (60.7%) | 40 (21.9%) |
| 3 or 4 Children | 0 (0.0%) | 0 (0.0%) |
| 5 or more Children | 0 (0.0%) | 0 (0.0%) |
| Total | 68 (39.3%) | 40 (19.5%) |
Income Below Poverty Among Married-Couple vs Single-Parent Households in Wadena
The poverty data for Wadena shows that 33 of the married-couple family households (4.4%) and 108 of the single-parent households (28.6%) are living below the poverty level. Within the married-couple family households, those with 5 or more children have the highest poverty rate, with 15 households (100.0%) falling below the poverty line. Among the single-parent households, those with 1 or 2 children have the highest poverty rate, with 108 household (36.6%) living below poverty.
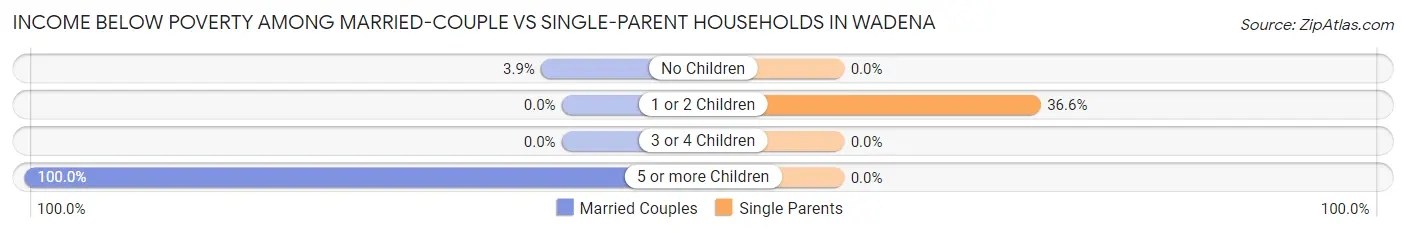
| Children | Married-Couple Families | Single-Parent Households |
| No Children | 18 (3.9%) | 0 (0.0%) |
| 1 or 2 Children | 0 (0.0%) | 108 (36.6%) |
| 3 or 4 Children | 0 (0.0%) | 0 (0.0%) |
| 5 or more Children | 15 (100.0%) | 0 (0.0%) |
| Total | 33 (4.4%) | 108 (28.6%) |
Race in Wadena
The most populous races in Wadena are White / Caucasian (4,036 | 93.2%), Two or more Races (265 | 6.1%), and Hispanic or Latino (112 | 2.6%).
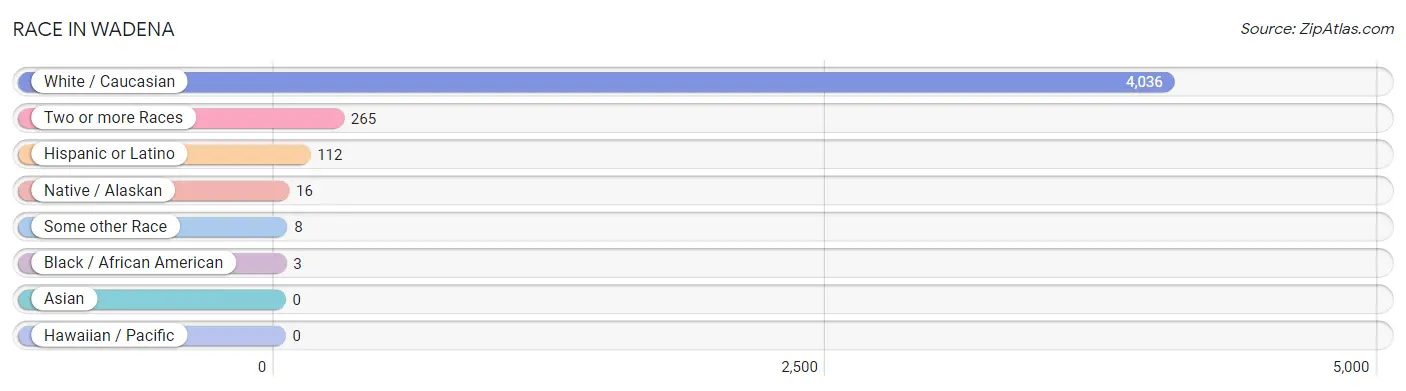
| Race | # Population | % Population |
| Asian | 0 | 0.0% |
| Black / African American | 3 | 0.1% |
| Hawaiian / Pacific | 0 | 0.0% |
| Hispanic or Latino | 112 | 2.6% |
| Native / Alaskan | 16 | 0.4% |
| White / Caucasian | 4,036 | 93.2% |
| Two or more Races | 265 | 6.1% |
| Some other Race | 8 | 0.2% |
| Total | 4,328 | 100.0% |
Ancestry in Wadena
The most populous ancestries reported in Wadena are German (1,586 | 36.6%), Norwegian (655 | 15.1%), Finnish (371 | 8.6%), Swedish (247 | 5.7%), and English (245 | 5.7%), together accounting for 71.7% of all Wadena residents.
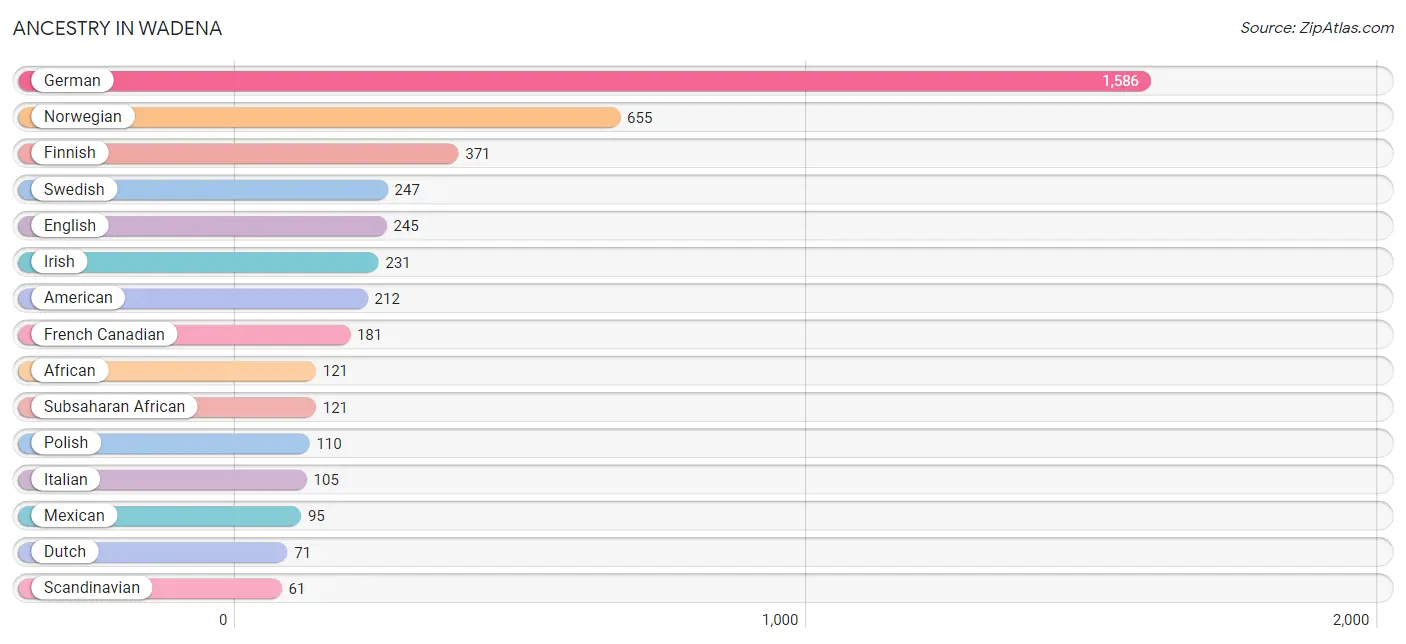
| Ancestry | # Population | % Population |
| African | 121 | 2.8% |
| American | 212 | 4.9% |
| Brazilian | 20 | 0.5% |
| Central American | 9 | 0.2% |
| Central American Indian | 9 | 0.2% |
| Chippewa | 53 | 1.2% |
| Choctaw | 26 | 0.6% |
| Czech | 9 | 0.2% |
| Danish | 20 | 0.5% |
| Dutch | 71 | 1.6% |
| English | 245 | 5.7% |
| Finnish | 371 | 8.6% |
| French | 49 | 1.1% |
| French Canadian | 181 | 4.2% |
| German | 1,586 | 36.6% |
| Greek | 2 | 0.1% |
| Guatemalan | 9 | 0.2% |
| Icelander | 34 | 0.8% |
| Irish | 231 | 5.3% |
| Italian | 105 | 2.4% |
| Mexican | 95 | 2.2% |
| Norwegian | 655 | 15.1% |
| Polish | 110 | 2.5% |
| Scandinavian | 61 | 1.4% |
| Scotch-Irish | 61 | 1.4% |
| Subsaharan African | 121 | 2.8% |
| Swedish | 247 | 5.7% |
| Swiss | 13 | 0.3% |
| Welsh | 41 | 0.9% | View All 29 Rows |
Immigrants in Wadena
The most numerous immigrant groups reported in Wadena came from Africa (121 | 2.8%), Latin America (37 | 0.9%), Brazil (20 | 0.5%), South America (20 | 0.5%), and Central America (17 | 0.4%), together accounting for 5.0% of all Wadena residents.
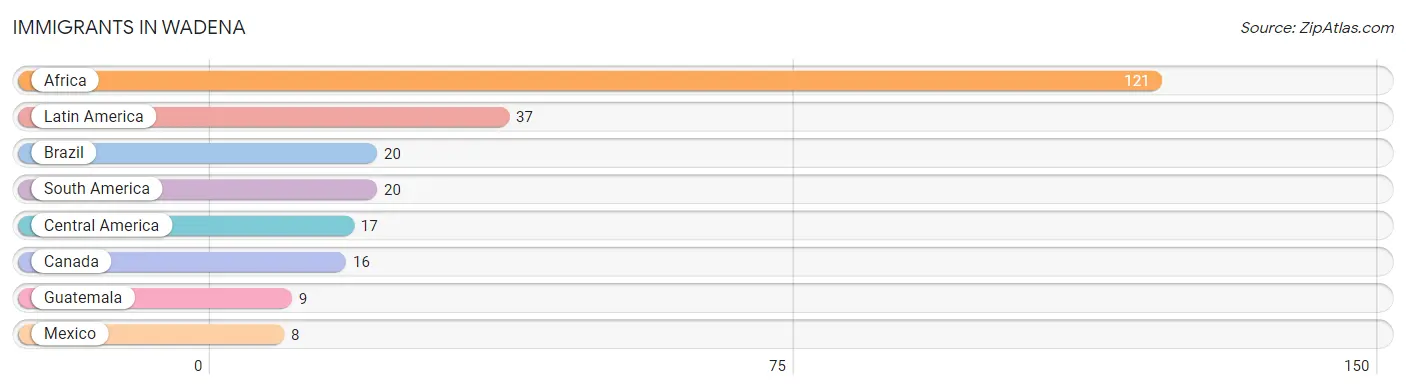
| Immigration Origin | # Population | % Population |
| Africa | 121 | 2.8% |
| Brazil | 20 | 0.5% |
| Canada | 16 | 0.4% |
| Central America | 17 | 0.4% |
| Guatemala | 9 | 0.2% |
| Latin America | 37 | 0.9% |
| Mexico | 8 | 0.2% |
| South America | 20 | 0.5% | View All 8 Rows |
Sex and Age in Wadena
Sex and Age in Wadena
The most populous age groups in Wadena are 60 to 64 Years (243 | 11.7%) for men and 5 to 9 Years (306 | 13.6%) for women.
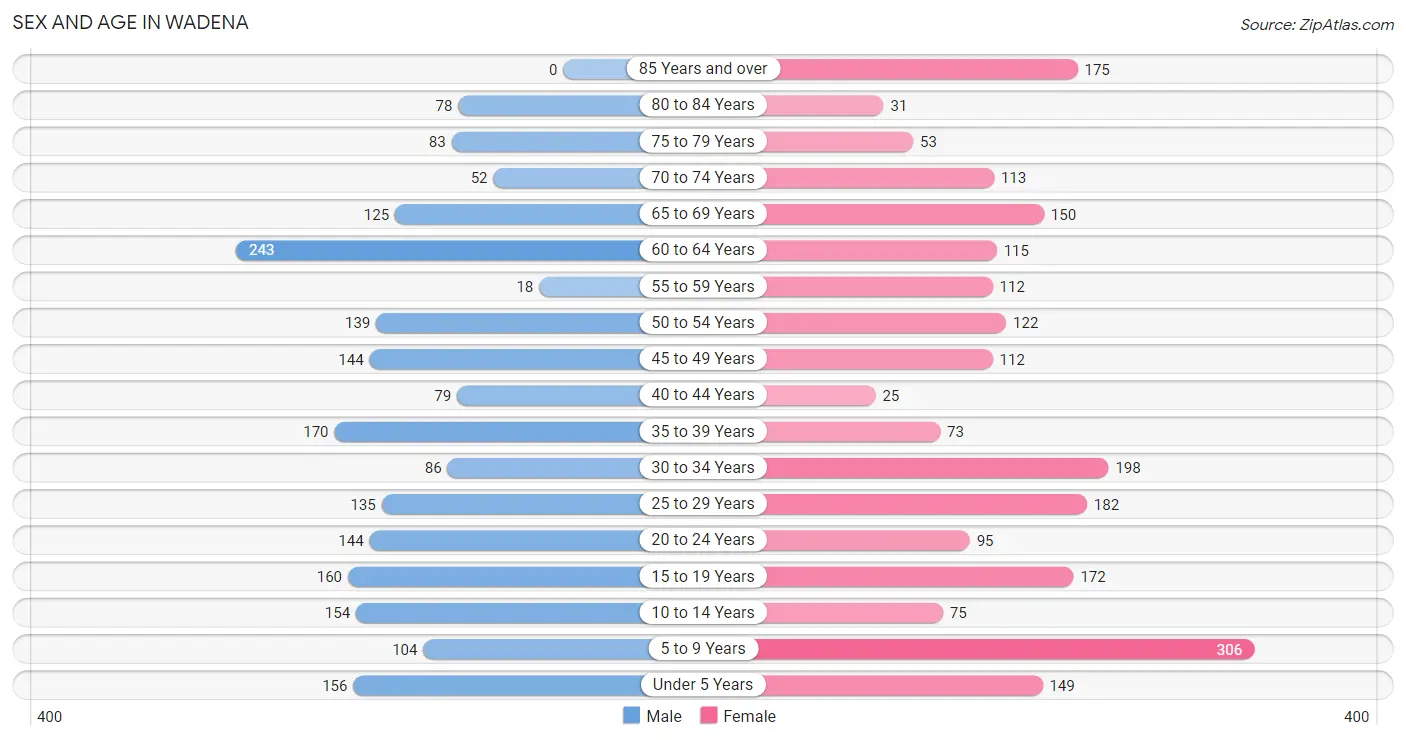
| Age Bracket | Male | Female |
| Under 5 Years | 156 (7.5%) | 149 (6.6%) |
| 5 to 9 Years | 104 (5.0%) | 306 (13.6%) |
| 10 to 14 Years | 154 (7.4%) | 75 (3.3%) |
| 15 to 19 Years | 160 (7.7%) | 172 (7.6%) |
| 20 to 24 Years | 144 (7.0%) | 95 (4.2%) |
| 25 to 29 Years | 135 (6.5%) | 182 (8.1%) |
| 30 to 34 Years | 86 (4.2%) | 198 (8.8%) |
| 35 to 39 Years | 170 (8.2%) | 73 (3.2%) |
| 40 to 44 Years | 79 (3.8%) | 25 (1.1%) |
| 45 to 49 Years | 144 (7.0%) | 112 (5.0%) |
| 50 to 54 Years | 139 (6.7%) | 122 (5.4%) |
| 55 to 59 Years | 18 (0.9%) | 112 (5.0%) |
| 60 to 64 Years | 243 (11.7%) | 115 (5.1%) |
| 65 to 69 Years | 125 (6.0%) | 150 (6.6%) |
| 70 to 74 Years | 52 (2.5%) | 113 (5.0%) |
| 75 to 79 Years | 83 (4.0%) | 53 (2.4%) |
| 80 to 84 Years | 78 (3.8%) | 31 (1.4%) |
| 85 Years and over | 0 (0.0%) | 175 (7.7%) |
| Total | 2,070 (100.0%) | 2,258 (100.0%) |
Families and Households in Wadena
Median Family Size in Wadena
The median family size in Wadena is 2.78 persons per family, with married-couple families (744 | 66.3%) accounting for the largest median family size of 3.02 persons per family. On the other hand, single male/father families (173 | 15.4%) represent the smallest median family size with 2.32 persons per family.
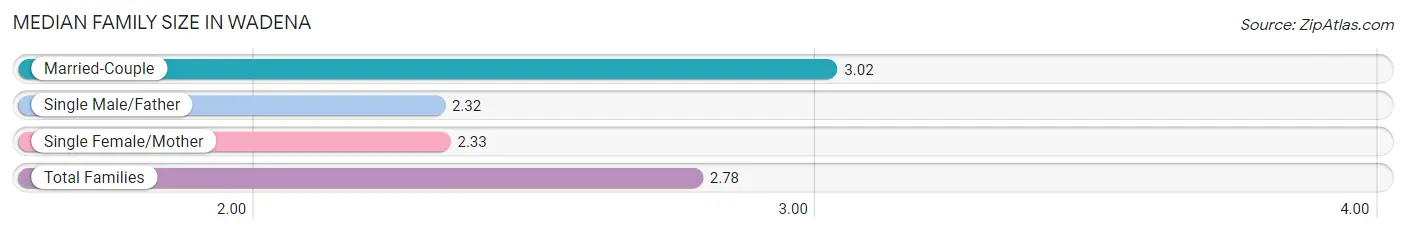
| Family Type | # Families | Family Size |
| Married-Couple | 744 (66.3%) | 3.02 |
| Single Male/Father | 173 (15.4%) | 2.32 |
| Single Female/Mother | 205 (18.3%) | 2.33 |
| Total Families | 1,122 (100.0%) | 2.78 |
Median Household Size in Wadena
The median household size in Wadena is 2.14 persons per household, with married-couple households (744 | 38.2%) accounting for the largest median household size of 3.02 persons per household. non-family households (826 | 42.4%) represent the smallest median household size with 1.26 persons per household.
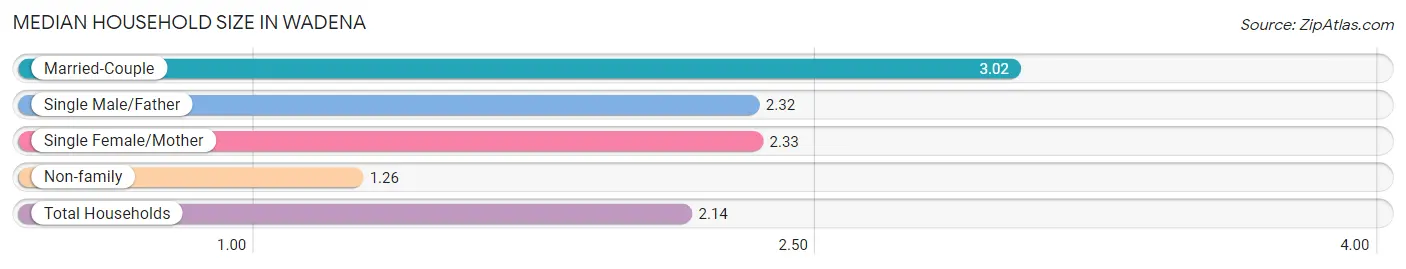
| Household Type | # Households | Household Size |
| Married-Couple | 744 (38.2%) | 3.02 |
| Single Male/Father | 173 (8.9%) | 2.32 |
| Single Female/Mother | 205 (10.5%) | 2.33 |
| Non-family | 826 (42.4%) | 1.26 |
| Total Households | 1,948 (100.0%) | 2.14 |
Household Size by Marriage Status in Wadena
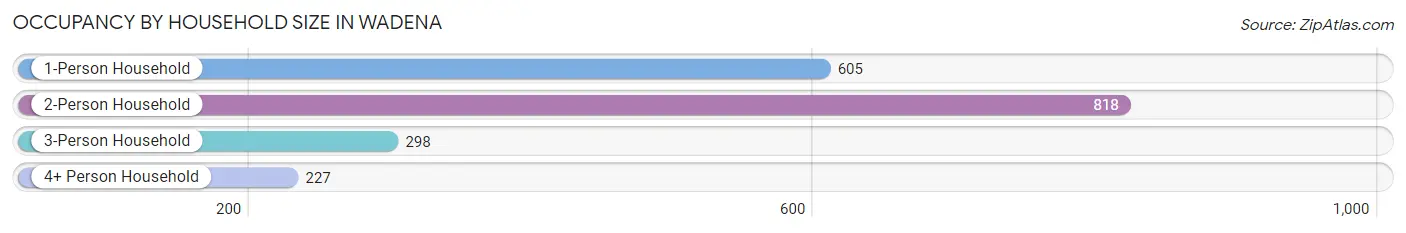
Out of a total of 1,948 households in Wadena, 1,122 (57.6%) are family households, while 826 (42.4%) are nonfamily households. The most numerous type of family households are 2-person households, comprising 597, and the most common type of nonfamily households are 1-person households, comprising 605.
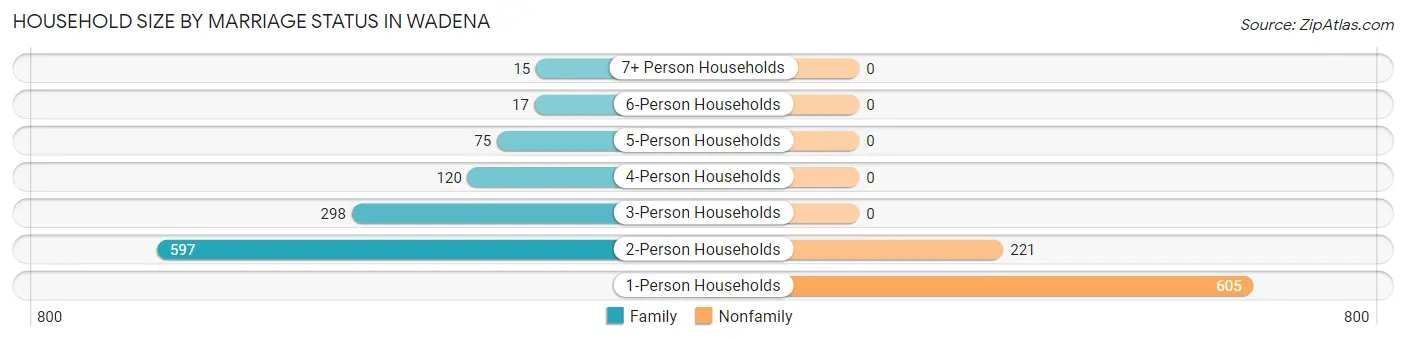
| Household Size | Family Households | Nonfamily Households |
| 1-Person Households | - | 605 (31.1%) |
| 2-Person Households | 597 (30.6%) | 221 (11.3%) |
| 3-Person Households | 298 (15.3%) | 0 (0.0%) |
| 4-Person Households | 120 (6.2%) | 0 (0.0%) |
| 5-Person Households | 75 (3.8%) | 0 (0.0%) |
| 6-Person Households | 17 (0.9%) | 0 (0.0%) |
| 7+ Person Households | 15 (0.8%) | 0 (0.0%) |
| Total | 1,122 (57.6%) | 826 (42.4%) |
Female Fertility in Wadena
Fertility by Age in Wadena
Average fertility rate in Wadena is 15.0 births per 1,000 women. Women in the age bracket of 20 to 34 years have the highest fertility rate with 27.0 births per 1,000 women. Women in the age bracket of 20 to 34 years acount for 100.0% of all women with births.
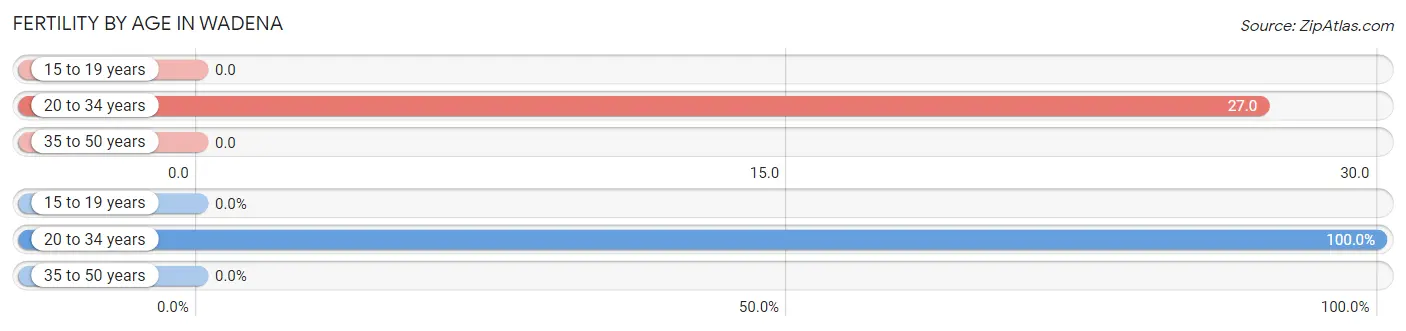
| Age Bracket | Women with Births | Births / 1,000 Women |
| 15 to 19 years | 0 (0.0%) | 0.0 |
| 20 to 34 years | 13 (100.0%) | 27.0 |
| 35 to 50 years | 0 (0.0%) | 0.0 |
| Total | 13 (100.0%) | 15.0 |
Fertility by Age by Marriage Status in Wadena
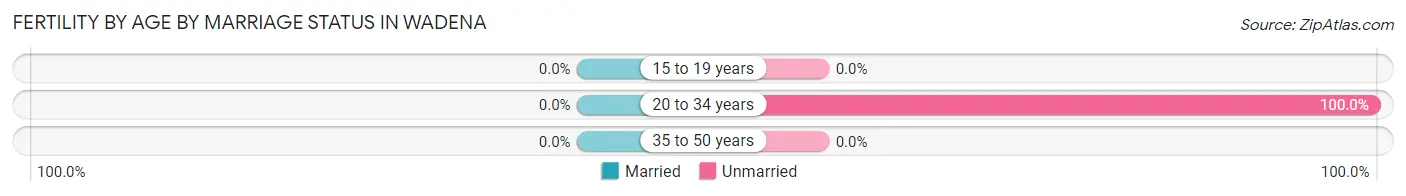
| Age Bracket | Married | Unmarried |
| 15 to 19 years | 0 (0.0%) | 0 (0.0%) |
| 20 to 34 years | 0 (0.0%) | 13 (100.0%) |
| 35 to 50 years | 0 (0.0%) | 0 (0.0%) |
| Total | 0 (0.0%) | 13 (100.0%) |
Fertility by Education in Wadena
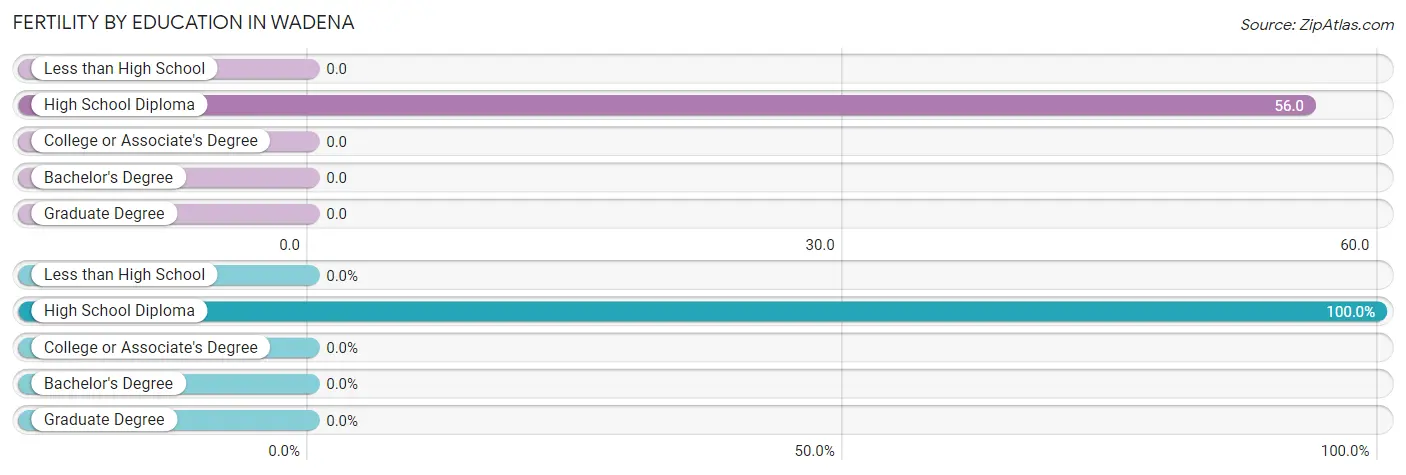
| Educational Attainment | Women with Births | Births / 1,000 Women |
| Less than High School | 0 (0.0%) | 0.0 |
| High School Diploma | 13 (100.0%) | 56.0 |
| College or Associate's Degree | 0 (0.0%) | 0.0 |
| Bachelor's Degree | 0 (0.0%) | 0.0 |
| Graduate Degree | 0 (0.0%) | 0.0 |
| Total | 13 (100.0%) | 15.0 |
Fertility by Education by Marriage Status in Wadena
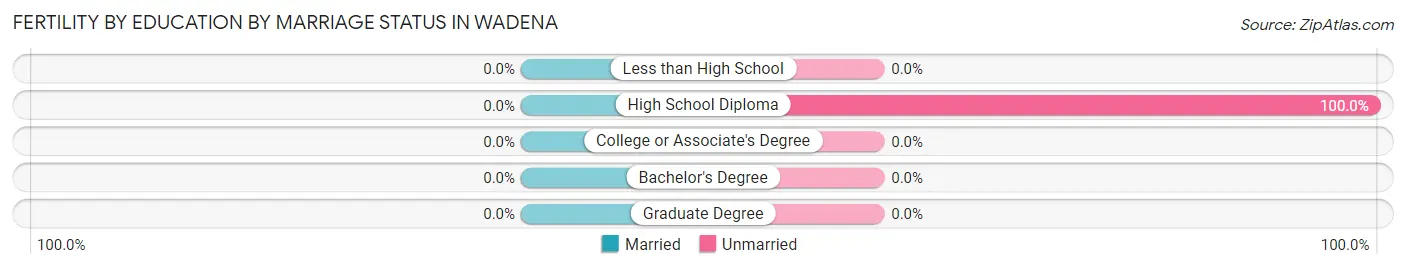
| Educational Attainment | Married | Unmarried |
| Less than High School | 0 (0.0%) | 0 (0.0%) |
| High School Diploma | 0 (0.0%) | 13 (100.0%) |
| College or Associate's Degree | 0 (0.0%) | 0 (0.0%) |
| Bachelor's Degree | 0 (0.0%) | 0 (0.0%) |
| Graduate Degree | 0 (0.0%) | 0 (0.0%) |
| Total | 0 (0.0%) | 13 (100.0%) |
Employment Characteristics in Wadena
Employment by Class of Employer in Wadena
Among the 1,810 employed individuals in Wadena, private company employees (1,203 | 66.5%), self-employed (not incorporated) (252 | 13.9%), and not-for-profit organizations (184 | 10.2%) make up the most common classes of employment.
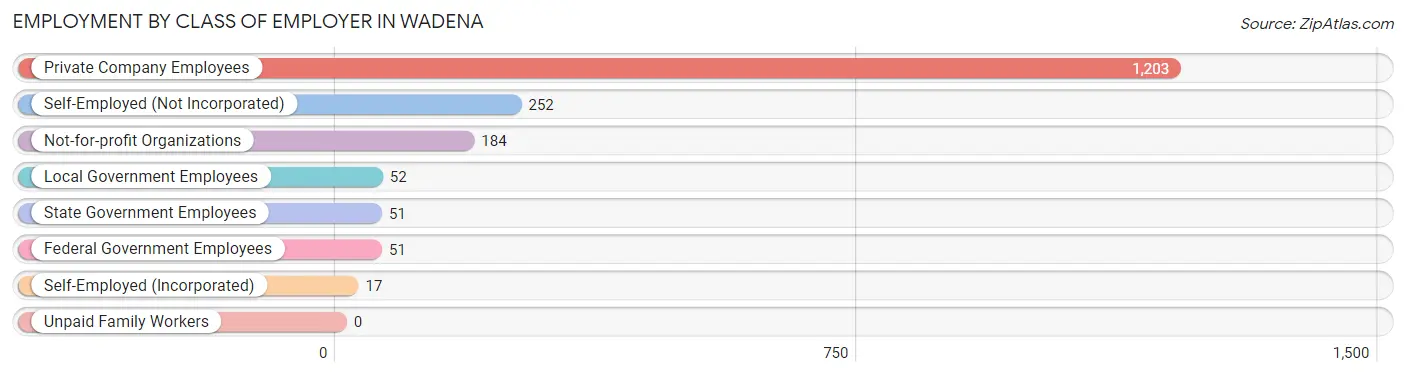
| Employer Class | # Employees | % Employees |
| Private Company Employees | 1,203 | 66.5% |
| Self-Employed (Incorporated) | 17 | 0.9% |
| Self-Employed (Not Incorporated) | 252 | 13.9% |
| Not-for-profit Organizations | 184 | 10.2% |
| Local Government Employees | 52 | 2.9% |
| State Government Employees | 51 | 2.8% |
| Federal Government Employees | 51 | 2.8% |
| Unpaid Family Workers | 0 | 0.0% |
| Total | 1,810 | 100.0% |
Employment Status by Age in Wadena
According to the labor force statistics for Wadena, out of the total population over 16 years of age (3,272), 65.2% or 2,133 individuals are in the labor force, with 10.7% or 228 of them unemployed. The age group with the highest labor force participation rate is 20 to 24 years, with 100.0% or 239 individuals in the labor force. Within the labor force, the 60 to 64 years age range has the highest percentage of unemployed individuals, with 51.4% or 75 of them being unemployed.
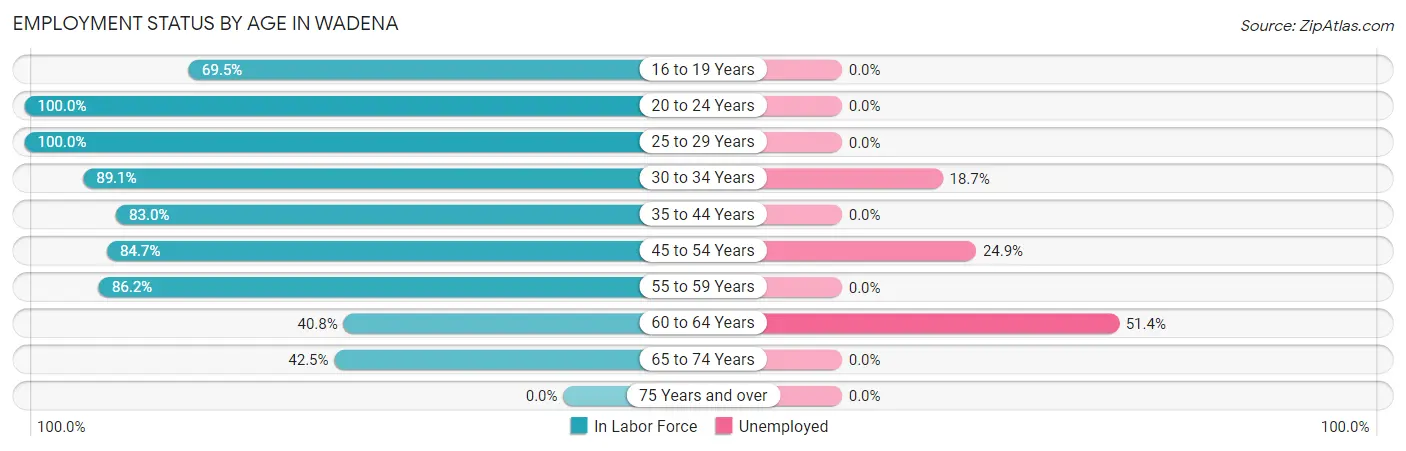
| Age Bracket | In Labor Force | Unemployed |
| 16 to 19 Years | 153 (69.5%) | 0 (0.0%) |
| 20 to 24 Years | 239 (100.0%) | 0 (0.0%) |
| 25 to 29 Years | 317 (100.0%) | 0 (0.0%) |
| 30 to 34 Years | 253 (89.1%) | 47 (18.7%) |
| 35 to 44 Years | 288 (83.0%) | 0 (0.0%) |
| 45 to 54 Years | 438 (84.7%) | 109 (24.9%) |
| 55 to 59 Years | 112 (86.2%) | 0 (0.0%) |
| 60 to 64 Years | 146 (40.8%) | 75 (51.4%) |
| 65 to 74 Years | 187 (42.5%) | 0 (0.0%) |
| 75 Years and over | 0 (0.0%) | 0 (0.0%) |
| Total | 2,133 (65.2%) | 228 (10.7%) |
Employment Status by Educational Attainment in Wadena
According to labor force statistics for Wadena, 79.6% of individuals (1,555) out of the total population between 25 and 64 years of age (1,953) are in the labor force, with 14.8% or 230 of them being unemployed. The group with the highest labor force participation rate are those with the educational attainment of less than high school, with 98.9% or 93 individuals in the labor force. Within the labor force, individuals with less than high school education have the highest percentage of unemployment, with 80.6% or 75 of them being unemployed.
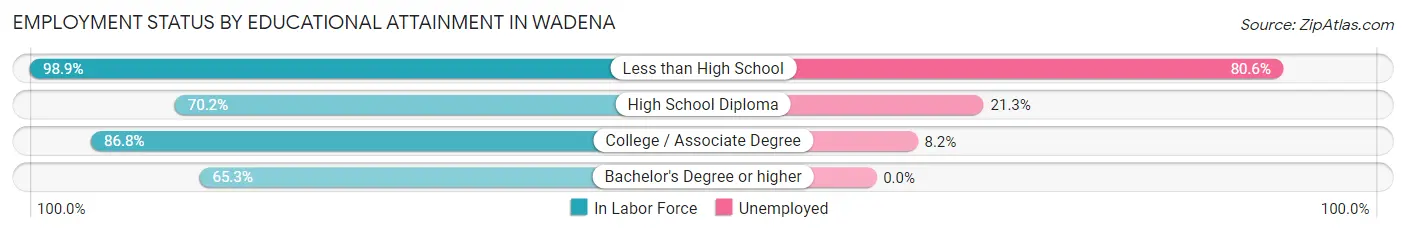
| Educational Attainment | In Labor Force | Unemployed |
| Less than High School | 93 (98.9%) | 76 (80.6%) |
| High School Diploma | 395 (70.2%) | 120 (21.3%) |
| College / Associate Degree | 884 (86.8%) | 84 (8.2%) |
| Bachelor's Degree or higher | 181 (65.3%) | 0 (0.0%) |
| Total | 1,555 (79.6%) | 289 (14.8%) |
Employment Occupations by Sex in Wadena
Management, Business, Science and Arts Occupations
The most common Management, Business, Science and Arts occupations in Wadena are Community & Social Service (173 | 9.2%), Education Instruction & Library (146 | 7.8%), Management (141 | 7.5%), Health Diagnosing & Treating (62 | 3.3%), and Business & Financial (28 | 1.5%).
Management, Business, Science and Arts Occupations by Sex
Within the Management, Business, Science and Arts occupations in Wadena, the most male-oriented occupations are Business & Financial (100.0%), Arts, Media & Entertainment (100.0%), and Management (45.4%), while the most female-oriented occupations are Education, Arts & Media (100.0%), Health Technologists (100.0%), and Health Diagnosing & Treating (96.8%).
| Occupation | Male | Female |
| Management | 64 (45.4%) | 77 (54.6%) |
| Business & Financial | 28 (100.0%) | 0 (0.0%) |
| Computers, Engineering & Science | 0 (0.0%) | 0 (0.0%) |
| Computers & Mathematics | 0 (0.0%) | 0 (0.0%) |
| Architecture & Engineering | 0 (0.0%) | 0 (0.0%) |
| Life, Physical & Social Science | 0 (0.0%) | 0 (0.0%) |
| Community & Social Service | 38 (22.0%) | 135 (78.0%) |
| Education, Arts & Media | 0 (0.0%) | 19 (100.0%) |
| Legal Services & Support | 0 (0.0%) | 0 (0.0%) |
| Education Instruction & Library | 30 (20.5%) | 116 (79.4%) |
| Arts, Media & Entertainment | 8 (100.0%) | 0 (0.0%) |
| Health Diagnosing & Treating | 2 (3.2%) | 60 (96.8%) |
| Health Technologists | 0 (0.0%) | 19 (100.0%) |
| Total (Category) | 132 (32.7%) | 272 (67.3%) |
| Total (Overall) | 889 (47.4%) | 985 (52.6%) |
Services Occupations
The most common Services occupations in Wadena are Healthcare Support (241 | 12.9%), Food Preparation & Serving (70 | 3.7%), Cleaning & Maintenance (33 | 1.8%), Security & Protection (26 | 1.4%), and Firefighting & Prevention (26 | 1.4%).
Services Occupations by Sex
Within the Services occupations in Wadena, the most male-oriented occupations are Security & Protection (100.0%), Firefighting & Prevention (100.0%), and Food Preparation & Serving (32.9%), while the most female-oriented occupations are Healthcare Support (100.0%), Cleaning & Maintenance (100.0%), and Personal Care & Service (100.0%).
| Occupation | Male | Female |
| Healthcare Support | 0 (0.0%) | 241 (100.0%) |
| Security & Protection | 26 (100.0%) | 0 (0.0%) |
| Firefighting & Prevention | 26 (100.0%) | 0 (0.0%) |
| Law Enforcement | 0 (0.0%) | 0 (0.0%) |
| Food Preparation & Serving | 23 (32.9%) | 47 (67.1%) |
| Cleaning & Maintenance | 0 (0.0%) | 33 (100.0%) |
| Personal Care & Service | 0 (0.0%) | 23 (100.0%) |
| Total (Category) | 49 (12.5%) | 344 (87.5%) |
| Total (Overall) | 889 (47.4%) | 985 (52.6%) |
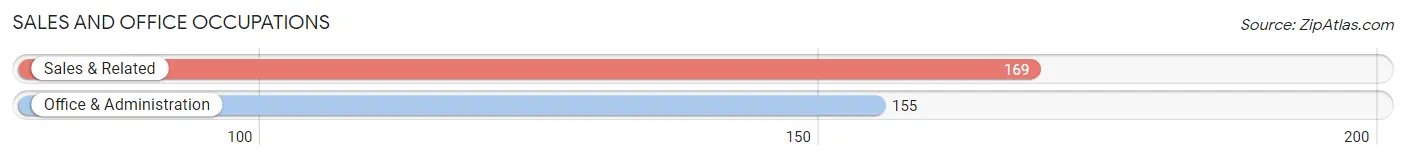
Sales and Office Occupations
The most common Sales and Office occupations in Wadena are Sales & Related (169 | 9.0%), and Office & Administration (155 | 8.3%).
Sales and Office Occupations by Sex
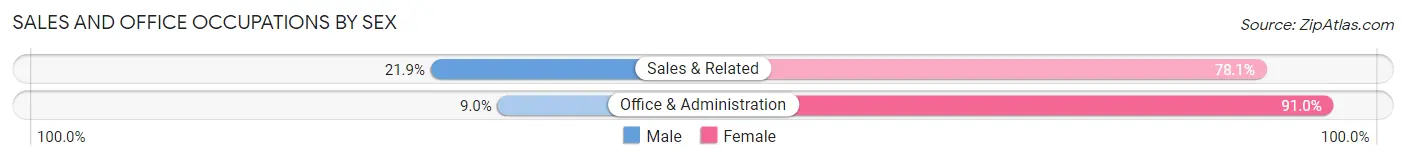
| Occupation | Male | Female |
| Sales & Related | 37 (21.9%) | 132 (78.1%) |
| Office & Administration | 14 (9.0%) | 141 (91.0%) |
| Total (Category) | 51 (15.7%) | 273 (84.3%) |
| Total (Overall) | 889 (47.4%) | 985 (52.6%) |
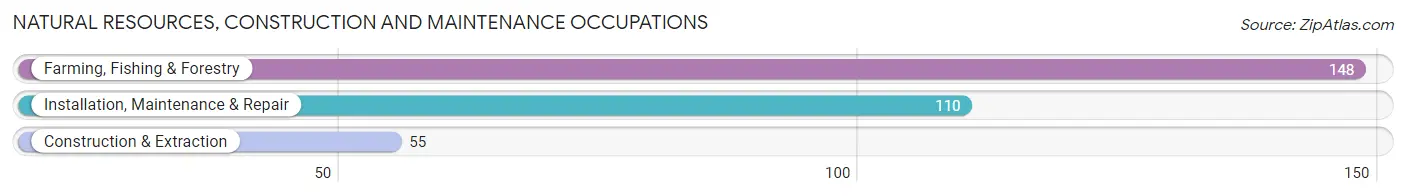
Natural Resources, Construction and Maintenance Occupations
The most common Natural Resources, Construction and Maintenance occupations in Wadena are Farming, Fishing & Forestry (148 | 7.9%), Installation, Maintenance & Repair (110 | 5.9%), and Construction & Extraction (55 | 2.9%).
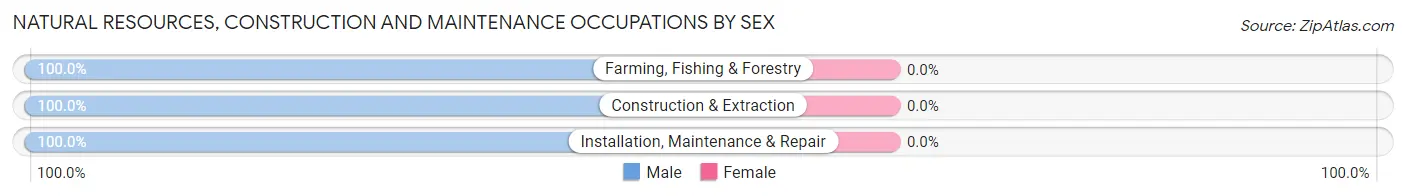
Natural Resources, Construction and Maintenance Occupations by Sex
| Occupation | Male | Female |
| Farming, Fishing & Forestry | 148 (100.0%) | 0 (0.0%) |
| Construction & Extraction | 55 (100.0%) | 0 (0.0%) |
| Installation, Maintenance & Repair | 110 (100.0%) | 0 (0.0%) |
| Total (Category) | 313 (100.0%) | 0 (0.0%) |
| Total (Overall) | 889 (47.4%) | 985 (52.6%) |
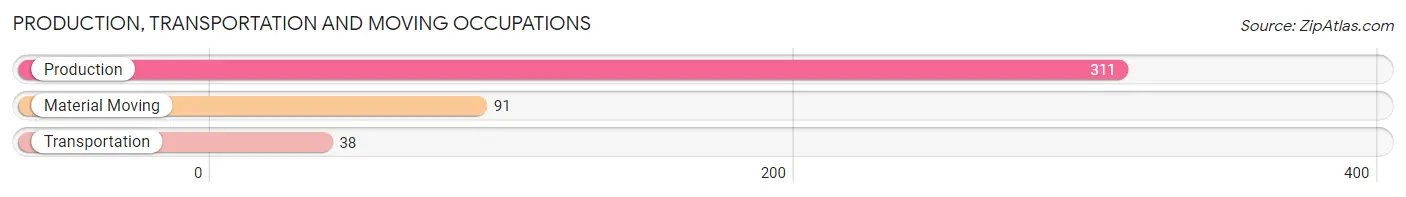
Production, Transportation and Moving Occupations
The most common Production, Transportation and Moving occupations in Wadena are Production (311 | 16.6%), Material Moving (91 | 4.9%), and Transportation (38 | 2.0%).
Production, Transportation and Moving Occupations by Sex
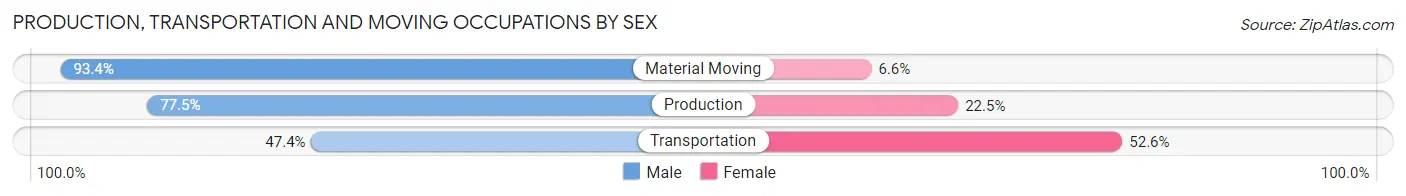
| Occupation | Male | Female |
| Production | 241 (77.5%) | 70 (22.5%) |
| Transportation | 18 (47.4%) | 20 (52.6%) |
| Material Moving | 85 (93.4%) | 6 (6.6%) |
| Total (Category) | 344 (78.2%) | 96 (21.8%) |
| Total (Overall) | 889 (47.4%) | 985 (52.6%) |
Employment Industries by Sex in Wadena
Employment Industries in Wadena
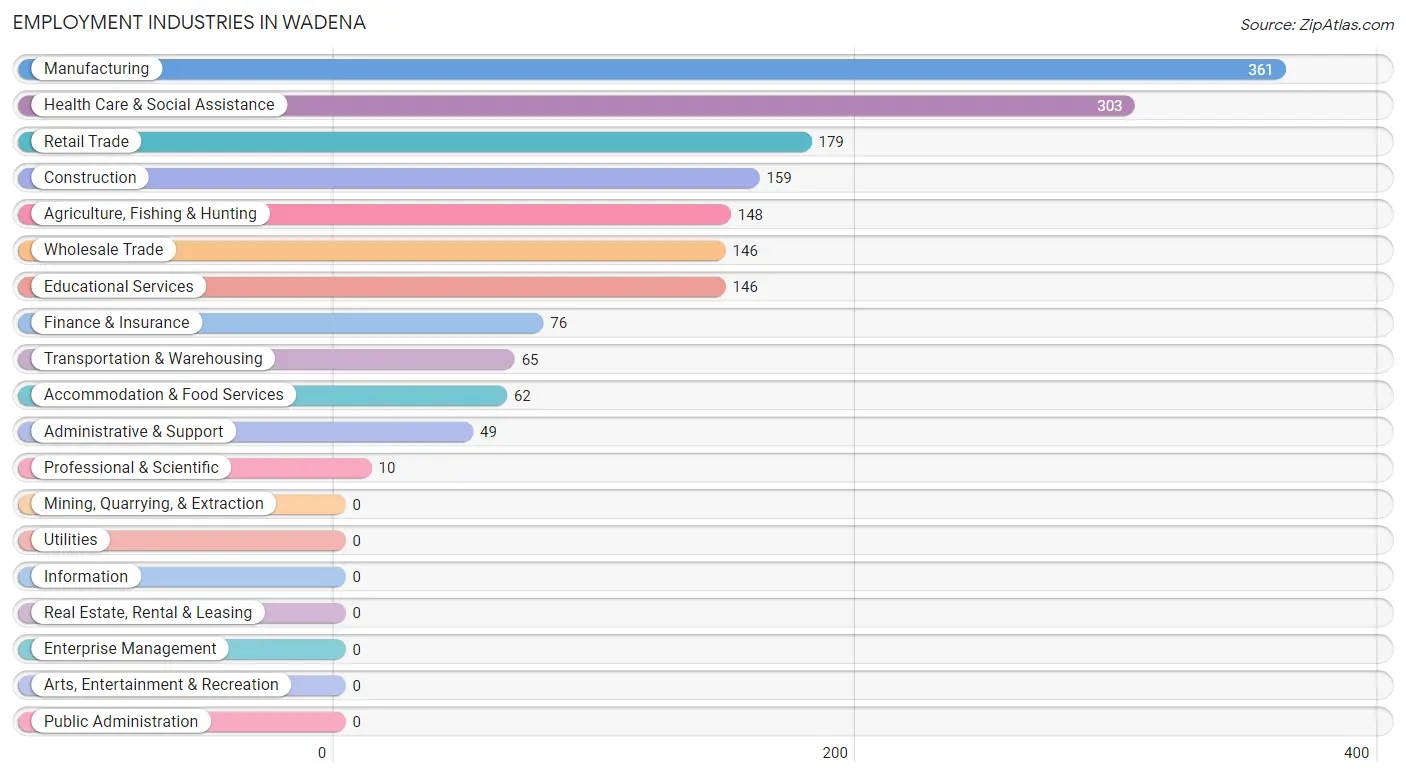
The major employment industries in Wadena include Manufacturing (361 | 19.3%), Health Care & Social Assistance (303 | 16.2%), Retail Trade (179 | 9.6%), Construction (159 | 8.5%), and Agriculture, Fishing & Hunting (148 | 7.9%).
Employment Industries by Sex in Wadena
The Wadena industries that see more men than women are Agriculture, Fishing & Hunting (100.0%), Professional & Scientific (100.0%), and Construction (89.9%), whereas the industries that tend to have a higher number of women are Accommodation & Food Services (96.8%), Health Care & Social Assistance (85.2%), and Educational Services (79.4%).
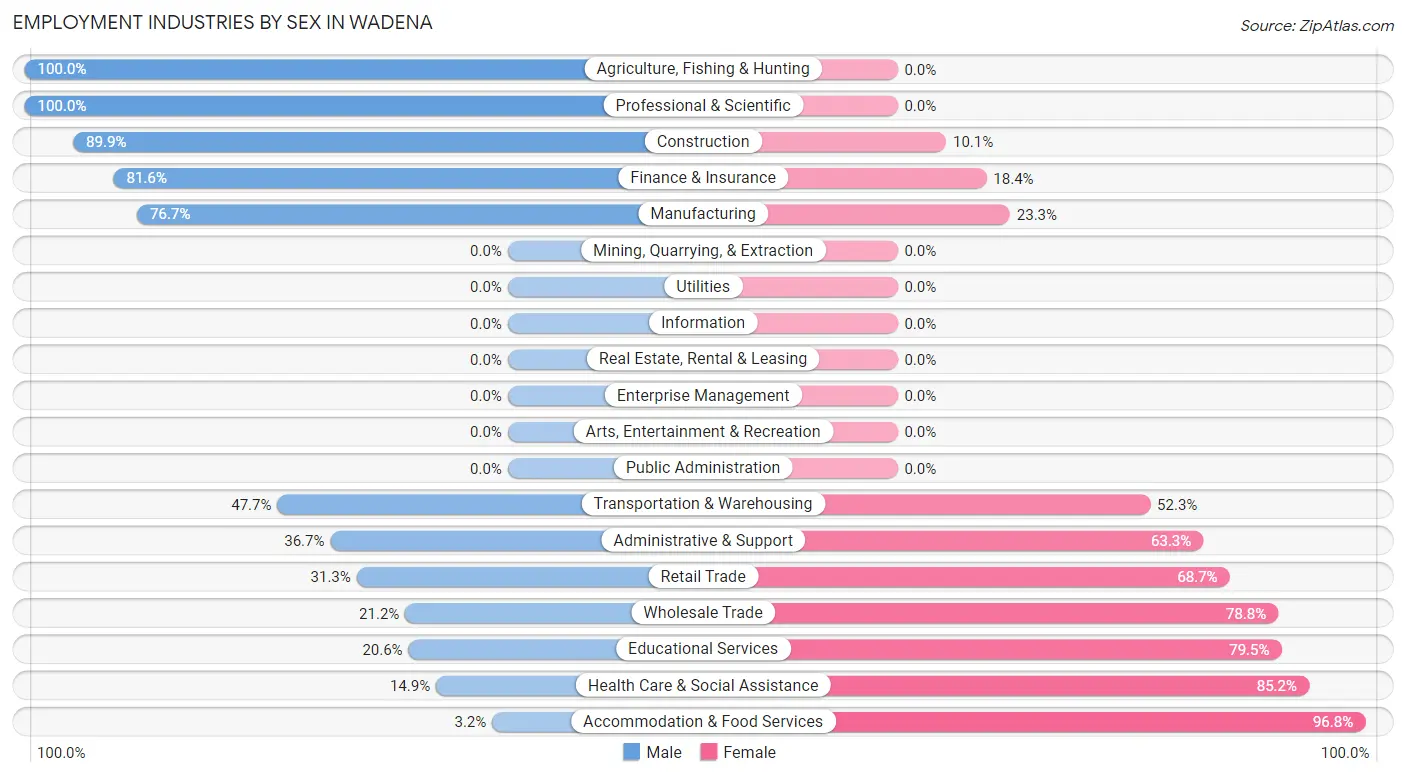
| Industry | Male | Female |
| Agriculture, Fishing & Hunting | 148 (100.0%) | 0 (0.0%) |
| Mining, Quarrying, & Extraction | 0 (0.0%) | 0 (0.0%) |
| Construction | 143 (89.9%) | 16 (10.1%) |
| Manufacturing | 277 (76.7%) | 84 (23.3%) |
| Wholesale Trade | 31 (21.2%) | 115 (78.8%) |
| Retail Trade | 56 (31.3%) | 123 (68.7%) |
| Transportation & Warehousing | 31 (47.7%) | 34 (52.3%) |
| Utilities | 0 (0.0%) | 0 (0.0%) |
| Information | 0 (0.0%) | 0 (0.0%) |
| Finance & Insurance | 62 (81.6%) | 14 (18.4%) |
| Real Estate, Rental & Leasing | 0 (0.0%) | 0 (0.0%) |
| Professional & Scientific | 10 (100.0%) | 0 (0.0%) |
| Enterprise Management | 0 (0.0%) | 0 (0.0%) |
| Administrative & Support | 18 (36.7%) | 31 (63.3%) |
| Educational Services | 30 (20.5%) | 116 (79.4%) |
| Health Care & Social Assistance | 45 (14.8%) | 258 (85.2%) |
| Arts, Entertainment & Recreation | 0 (0.0%) | 0 (0.0%) |
| Accommodation & Food Services | 2 (3.2%) | 60 (96.8%) |
| Public Administration | 0 (0.0%) | 0 (0.0%) |
| Total | 889 (47.4%) | 985 (52.6%) |
Education in Wadena
School Enrollment in Wadena
The most common levels of schooling among the 1,163 students in Wadena are elementary school (349 | 30.0%), college / undergraduate (275 | 23.6%), and high school (175 | 15.0%).
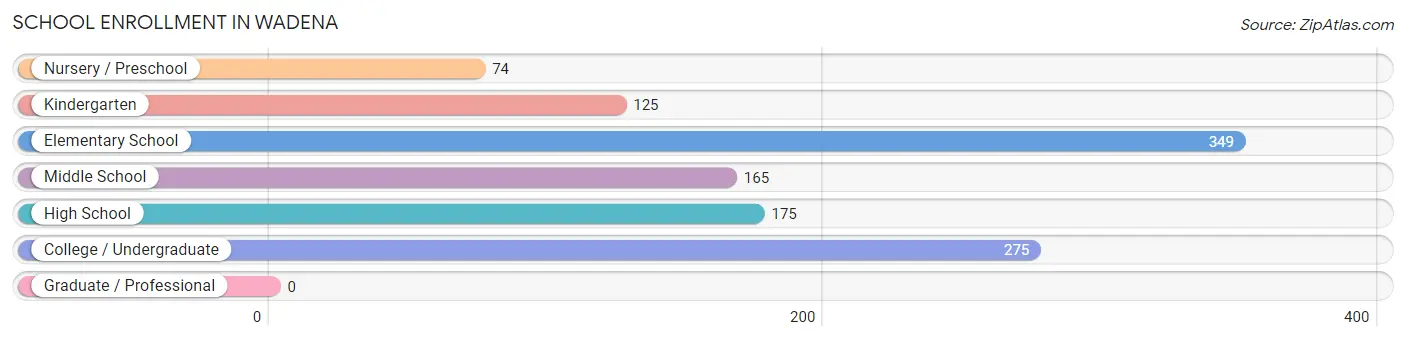
| School Level | # Students | % Students |
| Nursery / Preschool | 74 | 6.4% |
| Kindergarten | 125 | 10.7% |
| Elementary School | 349 | 30.0% |
| Middle School | 165 | 14.2% |
| High School | 175 | 15.0% |
| College / Undergraduate | 275 | 23.6% |
| Graduate / Professional | 0 | 0.0% |
| Total | 1,163 | 100.0% |
School Enrollment by Age by Funding Source in Wadena
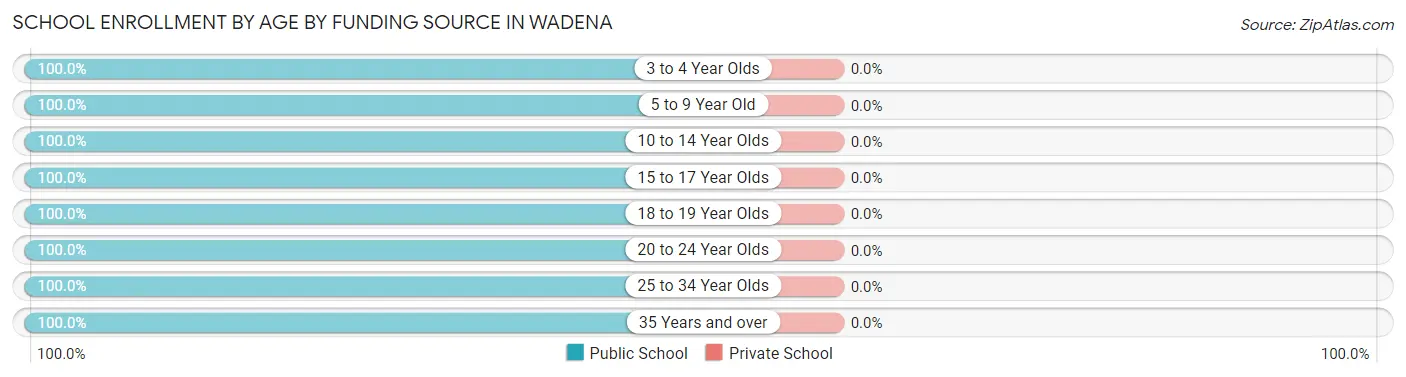
| Age Bracket | Public School | Private School |
| 3 to 4 Year Olds | 74 (100.0%) | 0 (0.0%) |
| 5 to 9 Year Old | 410 (100.0%) | 0 (0.0%) |
| 10 to 14 Year Olds | 229 (100.0%) | 0 (0.0%) |
| 15 to 17 Year Olds | 149 (100.0%) | 0 (0.0%) |
| 18 to 19 Year Olds | 21 (100.0%) | 0 (0.0%) |
| 20 to 24 Year Olds | 55 (100.0%) | 0 (0.0%) |
| 25 to 34 Year Olds | 82 (100.0%) | 0 (0.0%) |
| 35 Years and over | 143 (100.0%) | 0 (0.0%) |
| Total | 1,163 (100.0%) | 0 (0.0%) |
Educational Attainment by Field of Study in Wadena
Education (292 | 58.2%), bio, nature & agricultural (65 | 13.0%), arts & humanities (39 | 7.8%), psychology (24 | 4.8%), and liberal arts & history (24 | 4.8%) are the most common fields of study among 502 individuals in Wadena who have obtained a bachelor's degree or higher.
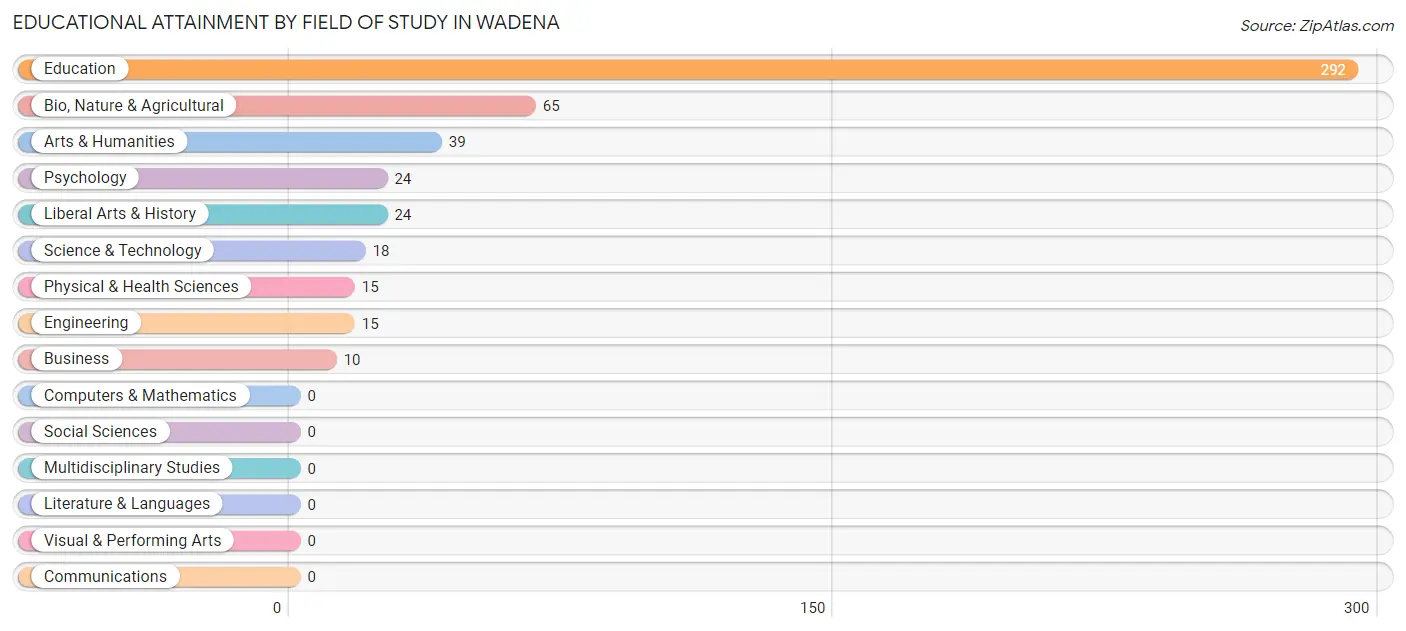
| Field of Study | # Graduates | % Graduates |
| Computers & Mathematics | 0 | 0.0% |
| Bio, Nature & Agricultural | 65 | 13.0% |
| Physical & Health Sciences | 15 | 3.0% |
| Psychology | 24 | 4.8% |
| Social Sciences | 0 | 0.0% |
| Engineering | 15 | 3.0% |
| Multidisciplinary Studies | 0 | 0.0% |
| Science & Technology | 18 | 3.6% |
| Business | 10 | 2.0% |
| Education | 292 | 58.2% |
| Literature & Languages | 0 | 0.0% |
| Liberal Arts & History | 24 | 4.8% |
| Visual & Performing Arts | 0 | 0.0% |
| Communications | 0 | 0.0% |
| Arts & Humanities | 39 | 7.8% |
| Total | 502 | 100.0% |
Transportation & Commute in Wadena
Vehicle Availability by Sex in Wadena
The most prevalent vehicle ownership categories in Wadena are males with 2 vehicles (364, accounting for 44.0%) and females with 2 vehicles (180, making up 38.6%).
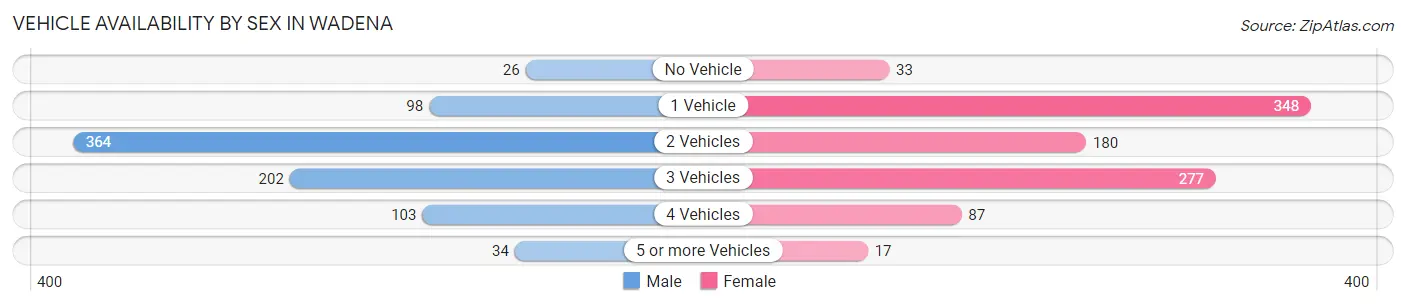
| Vehicles Available | Male | Female |
| No Vehicle | 26 (3.1%) | 33 (3.5%) |
| 1 Vehicle | 98 (11.8%) | 348 (36.9%) |
| 2 Vehicles | 364 (44.0%) | 180 (19.1%) |
| 3 Vehicles | 202 (24.4%) | 277 (29.4%) |
| 4 Vehicles | 103 (12.4%) | 87 (9.2%) |
| 5 or more Vehicles | 34 (4.1%) | 17 (1.8%) |
| Total | 827 (100.0%) | 942 (100.0%) |
Commute Time in Wadena
The most frequently occuring commute durations in Wadena are 5 to 9 minutes (581 commuters, 34.1%), 10 to 14 minutes (359 commuters, 21.1%), and 20 to 24 minutes (272 commuters, 16.0%).
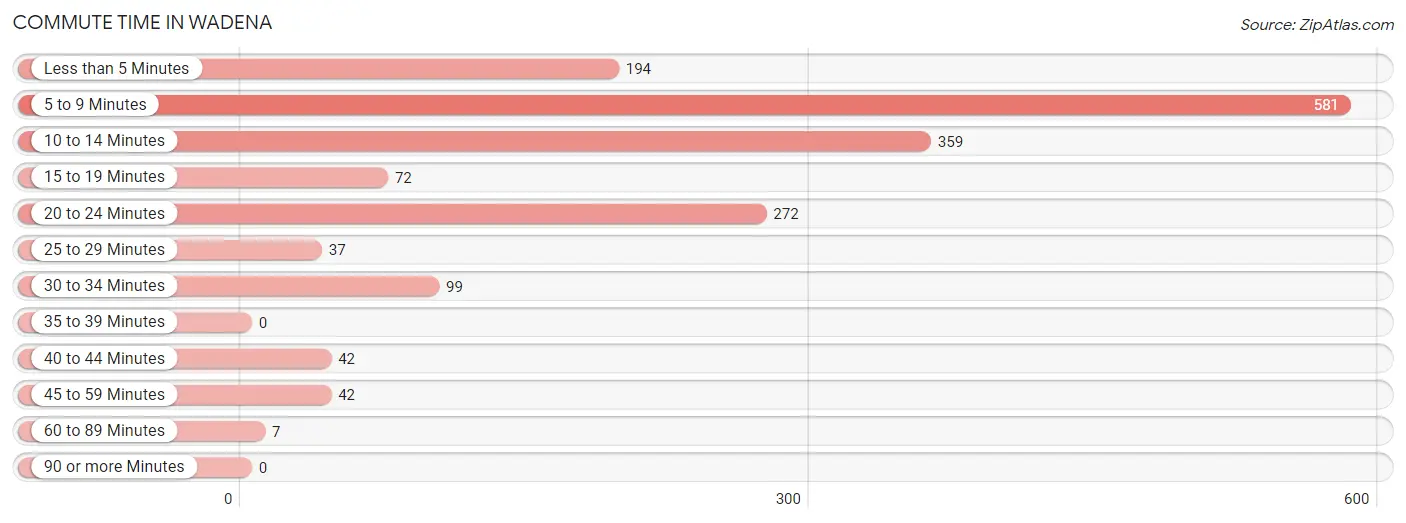
| Commute Time | # Commuters | % Commuters |
| Less than 5 Minutes | 194 | 11.4% |
| 5 to 9 Minutes | 581 | 34.1% |
| 10 to 14 Minutes | 359 | 21.1% |
| 15 to 19 Minutes | 72 | 4.2% |
| 20 to 24 Minutes | 272 | 16.0% |
| 25 to 29 Minutes | 37 | 2.2% |
| 30 to 34 Minutes | 99 | 5.8% |
| 35 to 39 Minutes | 0 | 0.0% |
| 40 to 44 Minutes | 42 | 2.5% |
| 45 to 59 Minutes | 42 | 2.5% |
| 60 to 89 Minutes | 7 | 0.4% |
| 90 or more Minutes | 0 | 0.0% |
Commute Time by Sex in Wadena
The most common commute times in Wadena are 5 to 9 minutes (205 commuters, 24.8%) for males and 5 to 9 minutes (376 commuters, 42.7%) for females.
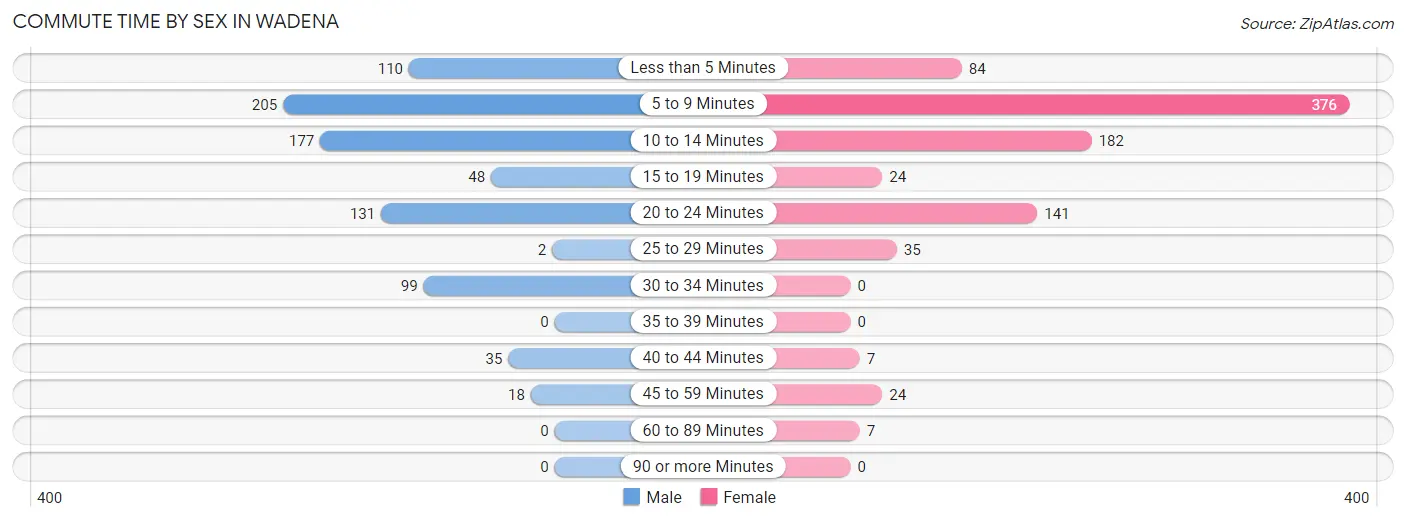
| Commute Time | Male | Female |
| Less than 5 Minutes | 110 (13.3%) | 84 (9.6%) |
| 5 to 9 Minutes | 205 (24.8%) | 376 (42.7%) |
| 10 to 14 Minutes | 177 (21.4%) | 182 (20.7%) |
| 15 to 19 Minutes | 48 (5.8%) | 24 (2.7%) |
| 20 to 24 Minutes | 131 (15.9%) | 141 (16.0%) |
| 25 to 29 Minutes | 2 (0.2%) | 35 (4.0%) |
| 30 to 34 Minutes | 99 (12.0%) | 0 (0.0%) |
| 35 to 39 Minutes | 0 (0.0%) | 0 (0.0%) |
| 40 to 44 Minutes | 35 (4.2%) | 7 (0.8%) |
| 45 to 59 Minutes | 18 (2.2%) | 24 (2.7%) |
| 60 to 89 Minutes | 0 (0.0%) | 7 (0.8%) |
| 90 or more Minutes | 0 (0.0%) | 0 (0.0%) |
Time of Departure to Work by Sex in Wadena
The most frequent times of departure to work in Wadena are 12:00 AM to 4:59 AM (225, 27.3%) for males and 8:00 AM to 8:29 AM (162, 18.4%) for females.
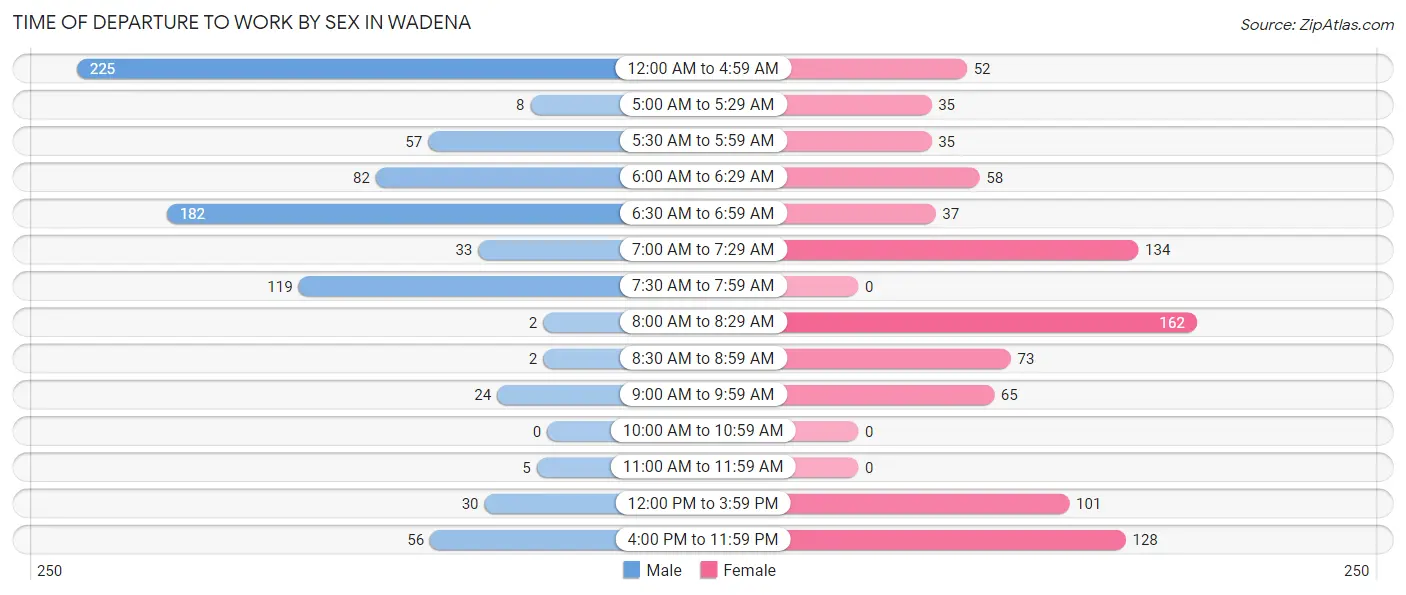
| Time of Departure | Male | Female |
| 12:00 AM to 4:59 AM | 225 (27.3%) | 52 (5.9%) |
| 5:00 AM to 5:29 AM | 8 (1.0%) | 35 (4.0%) |
| 5:30 AM to 5:59 AM | 57 (6.9%) | 35 (4.0%) |
| 6:00 AM to 6:29 AM | 82 (9.9%) | 58 (6.6%) |
| 6:30 AM to 6:59 AM | 182 (22.1%) | 37 (4.2%) |
| 7:00 AM to 7:29 AM | 33 (4.0%) | 134 (15.2%) |
| 7:30 AM to 7:59 AM | 119 (14.4%) | 0 (0.0%) |
| 8:00 AM to 8:29 AM | 2 (0.2%) | 162 (18.4%) |
| 8:30 AM to 8:59 AM | 2 (0.2%) | 73 (8.3%) |
| 9:00 AM to 9:59 AM | 24 (2.9%) | 65 (7.4%) |
| 10:00 AM to 10:59 AM | 0 (0.0%) | 0 (0.0%) |
| 11:00 AM to 11:59 AM | 5 (0.6%) | 0 (0.0%) |
| 12:00 PM to 3:59 PM | 30 (3.6%) | 101 (11.5%) |
| 4:00 PM to 11:59 PM | 56 (6.8%) | 128 (14.5%) |
| Total | 825 (100.0%) | 880 (100.0%) |
Housing Occupancy in Wadena
Occupancy by Ownership in Wadena
Of the total 1,948 dwellings in Wadena, owner-occupied units account for 1,002 (51.4%), while renter-occupied units make up 946 (48.6%).
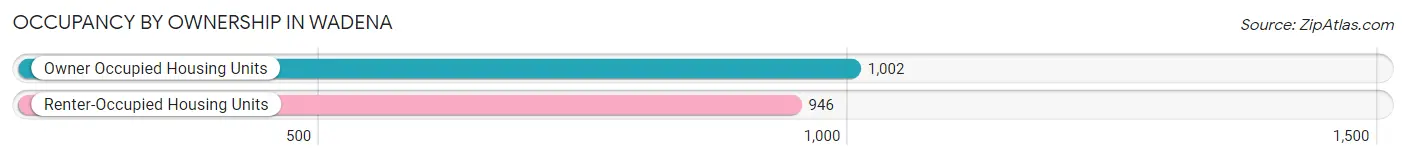
| Occupancy | # Housing Units | % Housing Units |
| Owner Occupied Housing Units | 1,002 | 51.4% |
| Renter-Occupied Housing Units | 946 | 48.6% |
| Total Occupied Housing Units | 1,948 | 100.0% |
Occupancy by Household Size in Wadena
| Household Size | # Housing Units | % Housing Units |
| 1-Person Household | 605 | 31.1% |
| 2-Person Household | 818 | 42.0% |
| 3-Person Household | 298 | 15.3% |
| 4+ Person Household | 227 | 11.7% |
| Total Housing Units | 1,948 | 100.0% |
Occupancy by Ownership by Household Size in Wadena
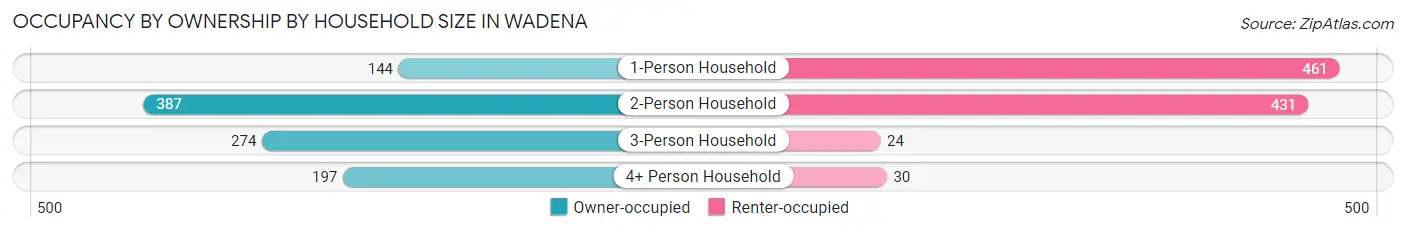
| Household Size | Owner-occupied | Renter-occupied |
| 1-Person Household | 144 (23.8%) | 461 (76.2%) |
| 2-Person Household | 387 (47.3%) | 431 (52.7%) |
| 3-Person Household | 274 (91.9%) | 24 (8.1%) |
| 4+ Person Household | 197 (86.8%) | 30 (13.2%) |
| Total Housing Units | 1,002 (51.4%) | 946 (48.6%) |
Occupancy by Educational Attainment in Wadena
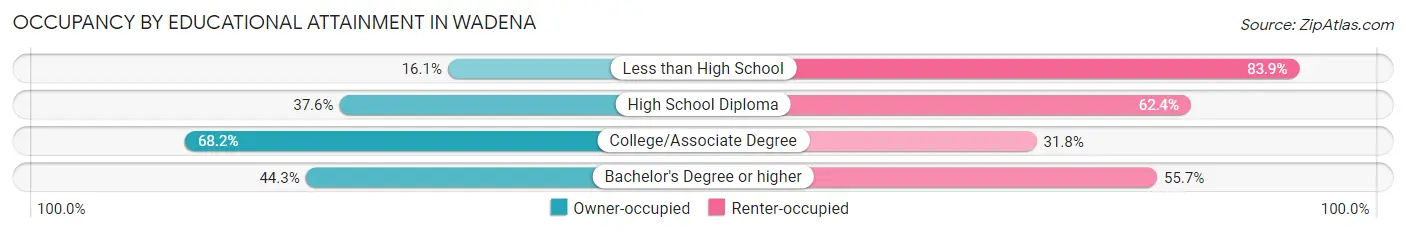
| Household Size | Owner-occupied | Renter-occupied |
| Less than High School | 24 (16.1%) | 125 (83.9%) |
| High School Diploma | 208 (37.6%) | 345 (62.4%) |
| College/Associate Degree | 622 (68.2%) | 290 (31.8%) |
| Bachelor's Degree or higher | 148 (44.3%) | 186 (55.7%) |
Occupancy by Age of Householder in Wadena
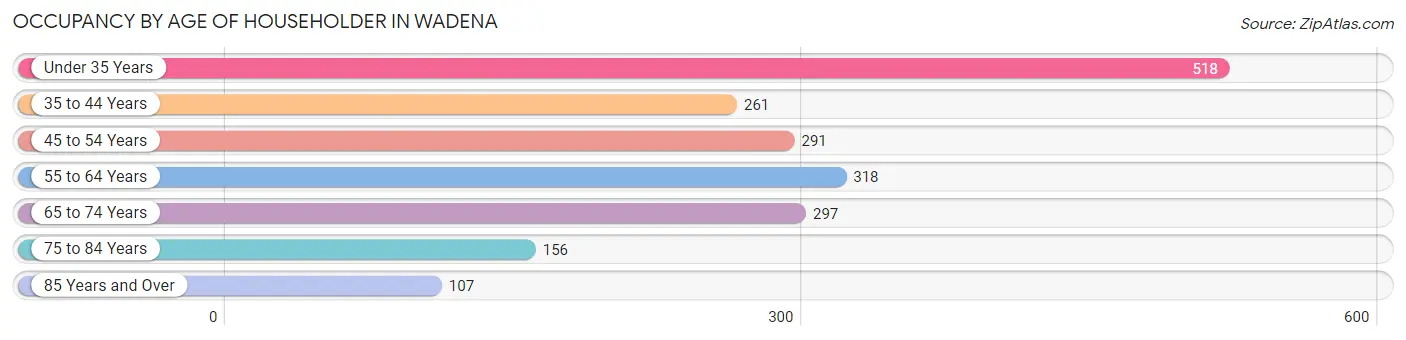
| Age Bracket | # Households | % Households |
| Under 35 Years | 518 | 26.6% |
| 35 to 44 Years | 261 | 13.4% |
| 45 to 54 Years | 291 | 14.9% |
| 55 to 64 Years | 318 | 16.3% |
| 65 to 74 Years | 297 | 15.2% |
| 75 to 84 Years | 156 | 8.0% |
| 85 Years and Over | 107 | 5.5% |
| Total | 1,948 | 100.0% |
Housing Finances in Wadena
Median Income by Occupancy in Wadena
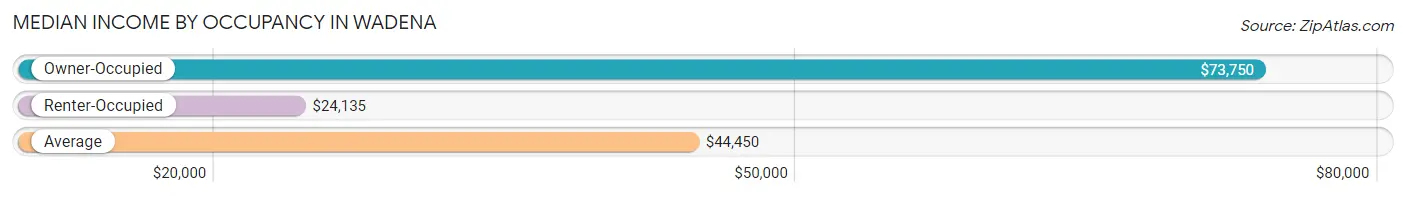
| Occupancy Type | # Households | Median Income |
| Owner-Occupied | 1,002 (51.4%) | $73,750 |
| Renter-Occupied | 946 (48.6%) | $24,135 |
| Average | 1,948 (100.0%) | $44,450 |
Occupancy by Householder Income Bracket in Wadena
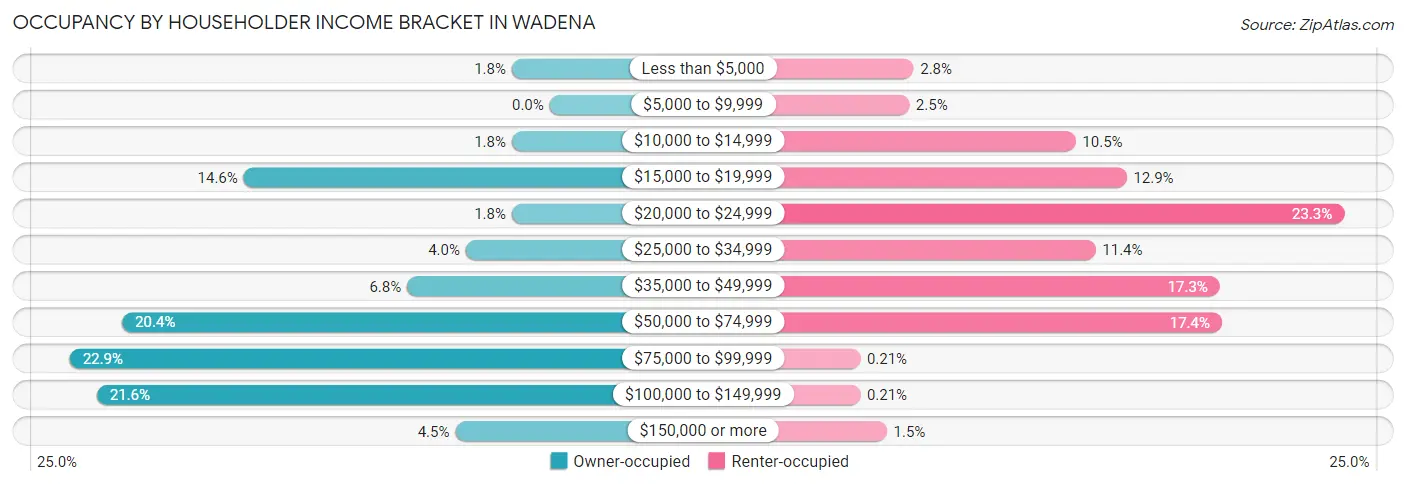
| Income Bracket | Owner-occupied | Renter-occupied |
| Less than $5,000 | 18 (1.8%) | 26 (2.8%) |
| $5,000 to $9,999 | 0 (0.0%) | 24 (2.5%) |
| $10,000 to $14,999 | 18 (1.8%) | 99 (10.5%) |
| $15,000 to $19,999 | 146 (14.6%) | 122 (12.9%) |
| $20,000 to $24,999 | 18 (1.8%) | 220 (23.3%) |
| $25,000 to $34,999 | 40 (4.0%) | 108 (11.4%) |
| $35,000 to $49,999 | 68 (6.8%) | 164 (17.3%) |
| $50,000 to $74,999 | 204 (20.4%) | 165 (17.4%) |
| $75,000 to $99,999 | 229 (22.9%) | 2 (0.2%) |
| $100,000 to $149,999 | 216 (21.6%) | 2 (0.2%) |
| $150,000 or more | 45 (4.5%) | 14 (1.5%) |
| Total | 1,002 (100.0%) | 946 (100.0%) |
Monthly Housing Cost Tiers in Wadena
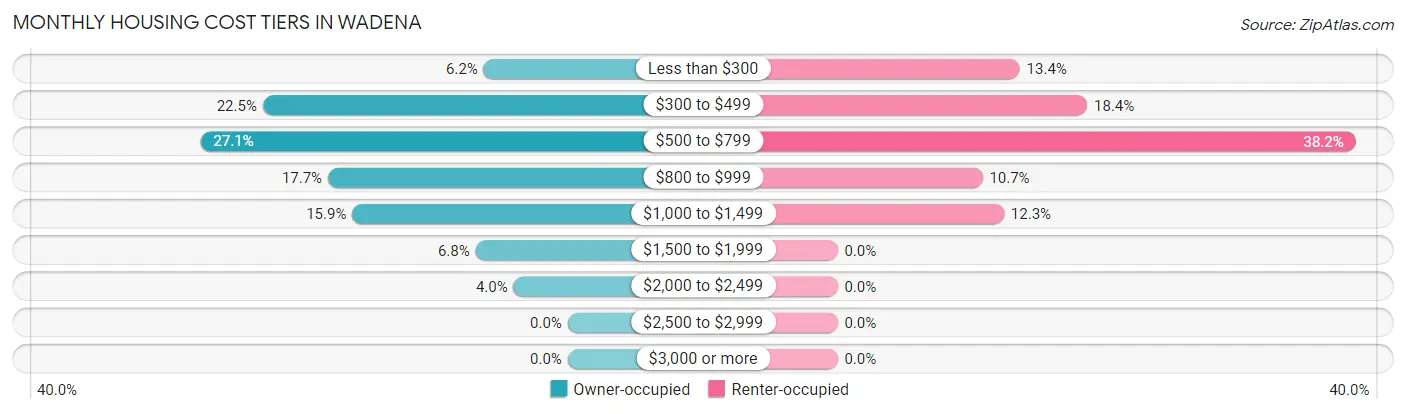
| Monthly Cost | Owner-occupied | Renter-occupied |
| Less than $300 | 62 (6.2%) | 127 (13.4%) |
| $300 to $499 | 225 (22.5%) | 174 (18.4%) |
| $500 to $799 | 271 (27.1%) | 361 (38.2%) |
| $800 to $999 | 177 (17.7%) | 101 (10.7%) |
| $1,000 to $1,499 | 159 (15.9%) | 116 (12.3%) |
| $1,500 to $1,999 | 68 (6.8%) | 0 (0.0%) |
| $2,000 to $2,499 | 40 (4.0%) | 0 (0.0%) |
| $2,500 to $2,999 | 0 (0.0%) | 0 (0.0%) |
| $3,000 or more | 0 (0.0%) | 0 (0.0%) |
| Total | 1,002 (100.0%) | 946 (100.0%) |
Physical Housing Characteristics in Wadena
Housing Structures in Wadena
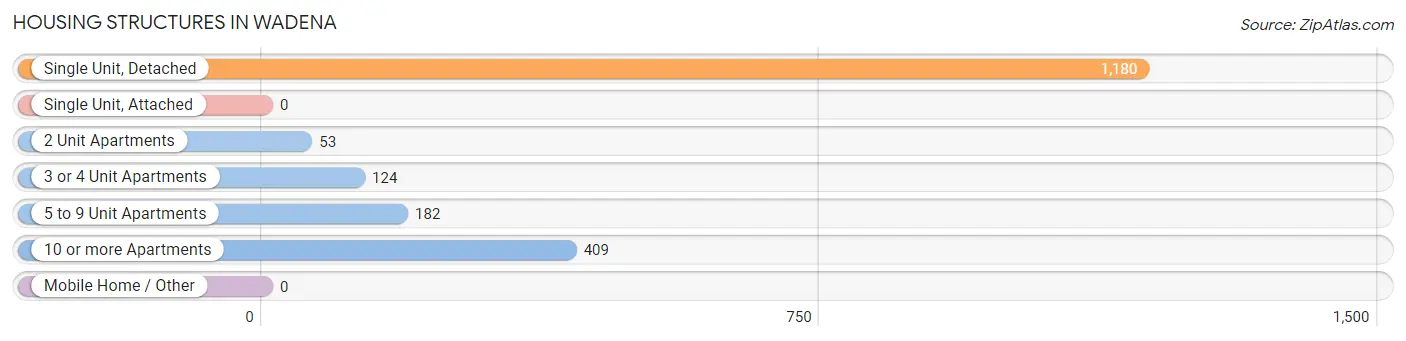
| Structure Type | # Housing Units | % Housing Units |
| Single Unit, Detached | 1,180 | 60.6% |
| Single Unit, Attached | 0 | 0.0% |
| 2 Unit Apartments | 53 | 2.7% |
| 3 or 4 Unit Apartments | 124 | 6.4% |
| 5 to 9 Unit Apartments | 182 | 9.3% |
| 10 or more Apartments | 409 | 21.0% |
| Mobile Home / Other | 0 | 0.0% |
| Total | 1,948 | 100.0% |
Housing Structures by Occupancy in Wadena
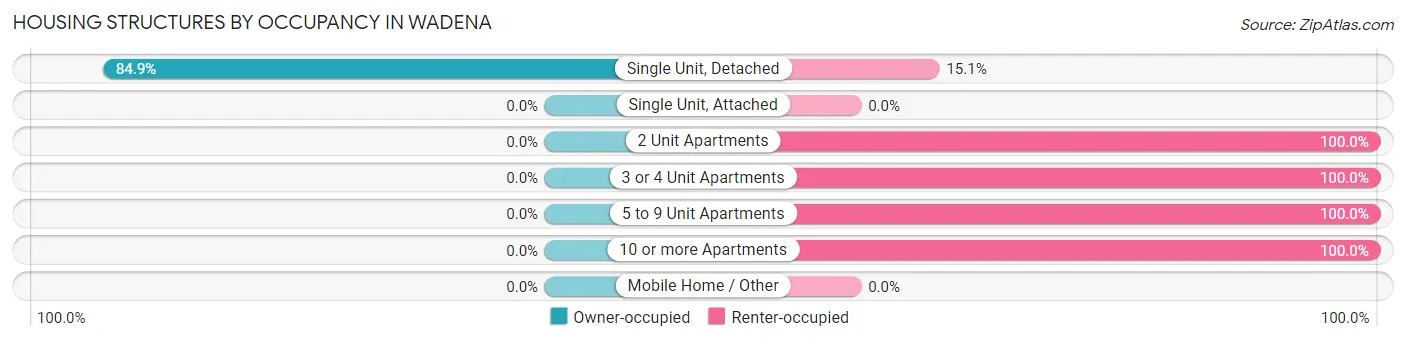
| Structure Type | Owner-occupied | Renter-occupied |
| Single Unit, Detached | 1,002 (84.9%) | 178 (15.1%) |
| Single Unit, Attached | 0 (0.0%) | 0 (0.0%) |
| 2 Unit Apartments | 0 (0.0%) | 53 (100.0%) |
| 3 or 4 Unit Apartments | 0 (0.0%) | 124 (100.0%) |
| 5 to 9 Unit Apartments | 0 (0.0%) | 182 (100.0%) |
| 10 or more Apartments | 0 (0.0%) | 409 (100.0%) |
| Mobile Home / Other | 0 (0.0%) | 0 (0.0%) |
| Total | 1,002 (51.4%) | 946 (48.6%) |
Housing Structures by Number of Rooms in Wadena
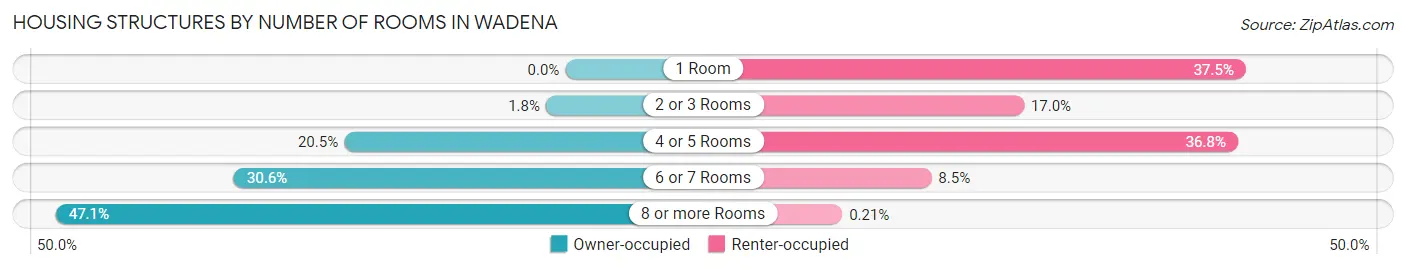
| Number of Rooms | Owner-occupied | Renter-occupied |
| 1 Room | 0 (0.0%) | 355 (37.5%) |
| 2 or 3 Rooms | 18 (1.8%) | 161 (17.0%) |
| 4 or 5 Rooms | 205 (20.5%) | 348 (36.8%) |
| 6 or 7 Rooms | 307 (30.6%) | 80 (8.5%) |
| 8 or more Rooms | 472 (47.1%) | 2 (0.2%) |
| Total | 1,002 (100.0%) | 946 (100.0%) |
Housing Structure by Heating Type in Wadena
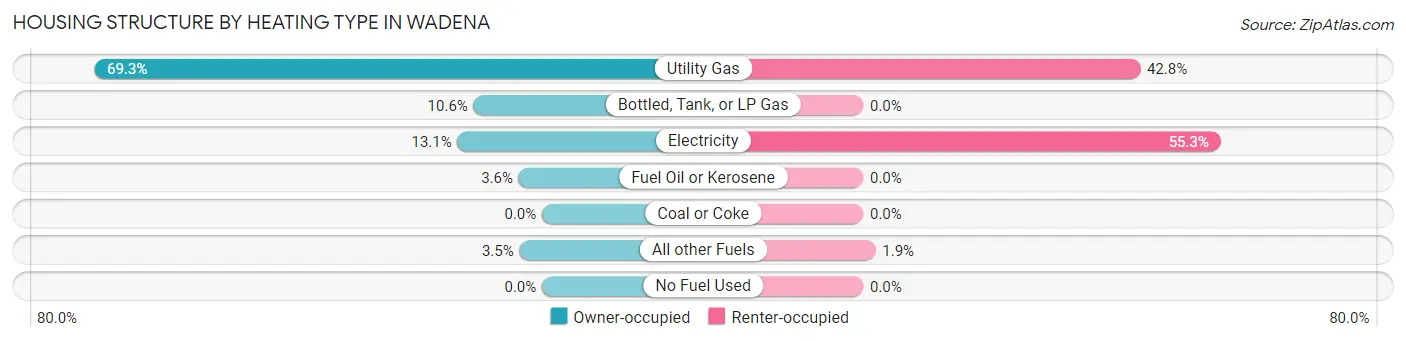
| Heating Type | Owner-occupied | Renter-occupied |
| Utility Gas | 694 (69.3%) | 405 (42.8%) |
| Bottled, Tank, or LP Gas | 106 (10.6%) | 0 (0.0%) |
| Electricity | 131 (13.1%) | 523 (55.3%) |
| Fuel Oil or Kerosene | 36 (3.6%) | 0 (0.0%) |
| Coal or Coke | 0 (0.0%) | 0 (0.0%) |
| All other Fuels | 35 (3.5%) | 18 (1.9%) |
| No Fuel Used | 0 (0.0%) | 0 (0.0%) |
| Total | 1,002 (100.0%) | 946 (100.0%) |
Household Vehicle Usage in Wadena
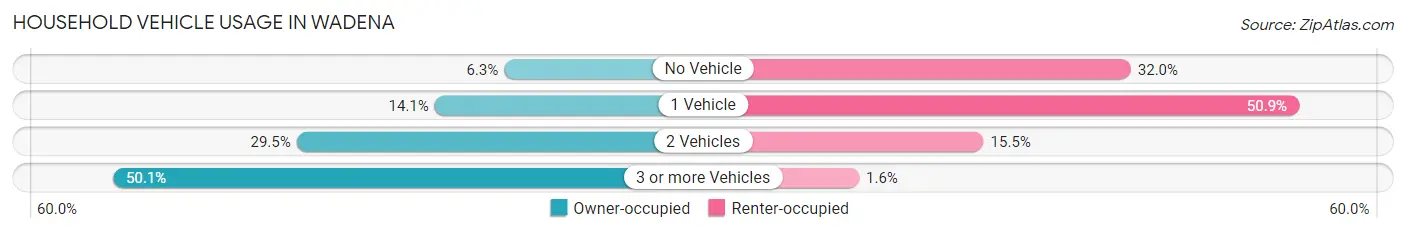
| Vehicles per Household | Owner-occupied | Renter-occupied |
| No Vehicle | 63 (6.3%) | 303 (32.0%) |
| 1 Vehicle | 141 (14.1%) | 481 (50.8%) |
| 2 Vehicles | 296 (29.5%) | 147 (15.5%) |
| 3 or more Vehicles | 502 (50.1%) | 15 (1.6%) |
| Total | 1,002 (100.0%) | 946 (100.0%) |
Real Estate & Mortgages in Wadena
Real Estate and Mortgage Overview in Wadena
| Characteristic | Without Mortgage | With Mortgage |
| Housing Units | 391 | 611 |
| Median Property Value | $135,700 | $157,600 |
| Median Household Income | $54,148 | $45 |
| Monthly Housing Costs | $469 | $0 |
| Real Estate Taxes | $1,739 | $23 |
Property Value by Mortgage Status in Wadena
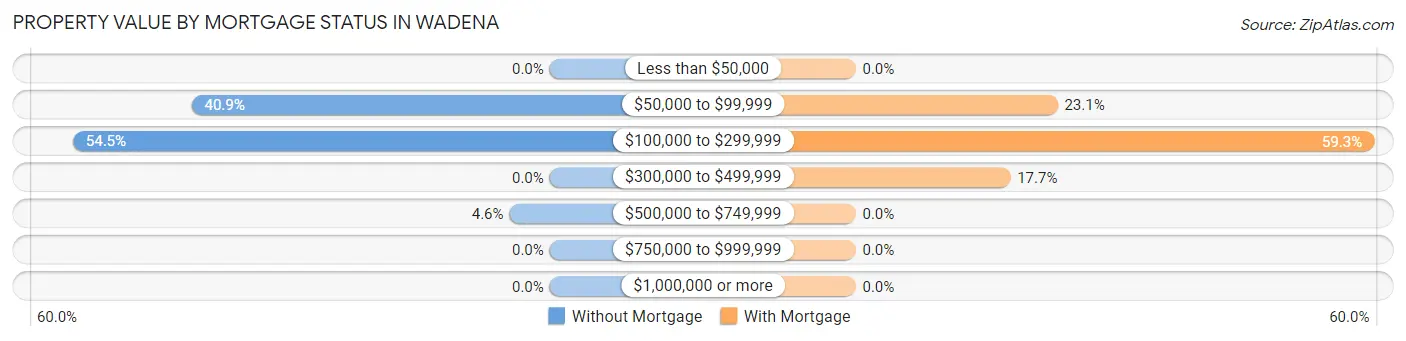
| Property Value | Without Mortgage | With Mortgage |
| Less than $50,000 | 0 (0.0%) | 0 (0.0%) |
| $50,000 to $99,999 | 160 (40.9%) | 141 (23.1%) |
| $100,000 to $299,999 | 213 (54.5%) | 362 (59.3%) |
| $300,000 to $499,999 | 0 (0.0%) | 108 (17.7%) |
| $500,000 to $749,999 | 18 (4.6%) | 0 (0.0%) |
| $750,000 to $999,999 | 0 (0.0%) | 0 (0.0%) |
| $1,000,000 or more | 0 (0.0%) | 0 (0.0%) |
| Total | 391 (100.0%) | 611 (100.0%) |
Household Income by Mortgage Status in Wadena
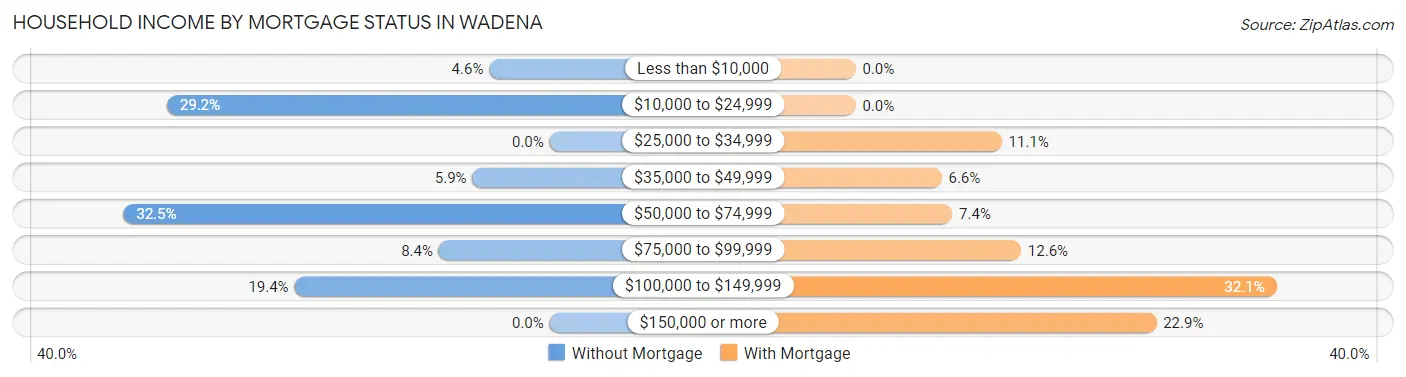
| Household Income | Without Mortgage | With Mortgage |
| Less than $10,000 | 18 (4.6%) | 0 (0.0%) |
| $10,000 to $24,999 | 114 (29.2%) | 0 (0.0%) |
| $25,000 to $34,999 | 0 (0.0%) | 68 (11.1%) |
| $35,000 to $49,999 | 23 (5.9%) | 40 (6.6%) |
| $50,000 to $74,999 | 127 (32.5%) | 45 (7.4%) |
| $75,000 to $99,999 | 33 (8.4%) | 77 (12.6%) |
| $100,000 to $149,999 | 76 (19.4%) | 196 (32.1%) |
| $150,000 or more | 0 (0.0%) | 140 (22.9%) |
| Total | 391 (100.0%) | 611 (100.0%) |
Property Value to Household Income Ratio in Wadena
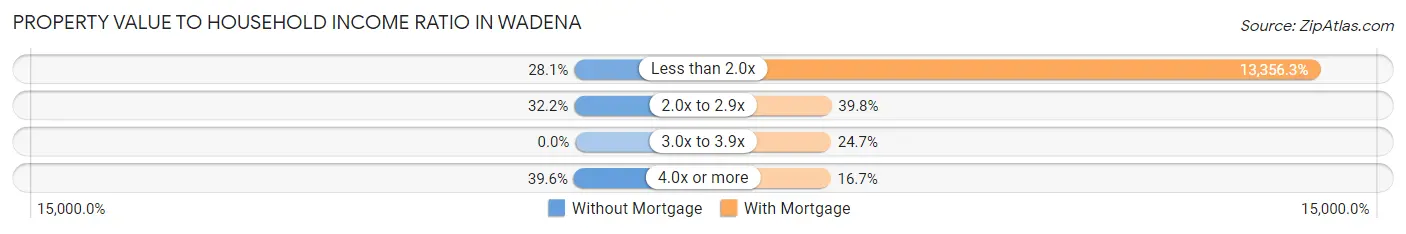
| Value-to-Income Ratio | Without Mortgage | With Mortgage |
| Less than 2.0x | 110 (28.1%) | 81,607 (13,356.3%) |
| 2.0x to 2.9x | 126 (32.2%) | 243 (39.8%) |
| 3.0x to 3.9x | 0 (0.0%) | 151 (24.7%) |
| 4.0x or more | 155 (39.6%) | 102 (16.7%) |
| Total | 391 (100.0%) | 611 (100.0%) |
Real Estate Taxes by Mortgage Status in Wadena
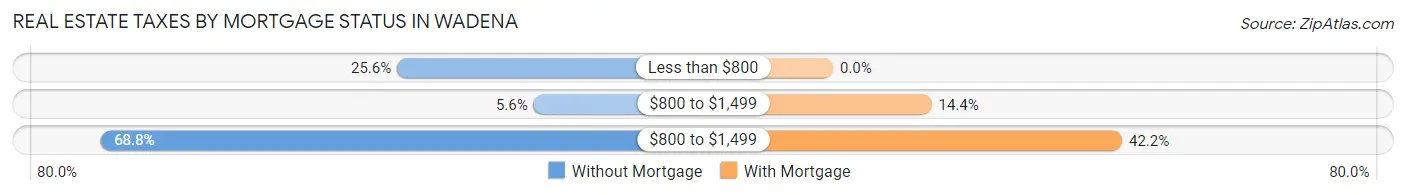
| Property Taxes | Without Mortgage | With Mortgage |
| Less than $800 | 100 (25.6%) | 0 (0.0%) |
| $800 to $1,499 | 22 (5.6%) | 88 (14.4%) |
| $800 to $1,499 | 269 (68.8%) | 258 (42.2%) |
| Total | 391 (100.0%) | 611 (100.0%) |
Health & Disability in Wadena
Health Insurance Coverage by Age in Wadena
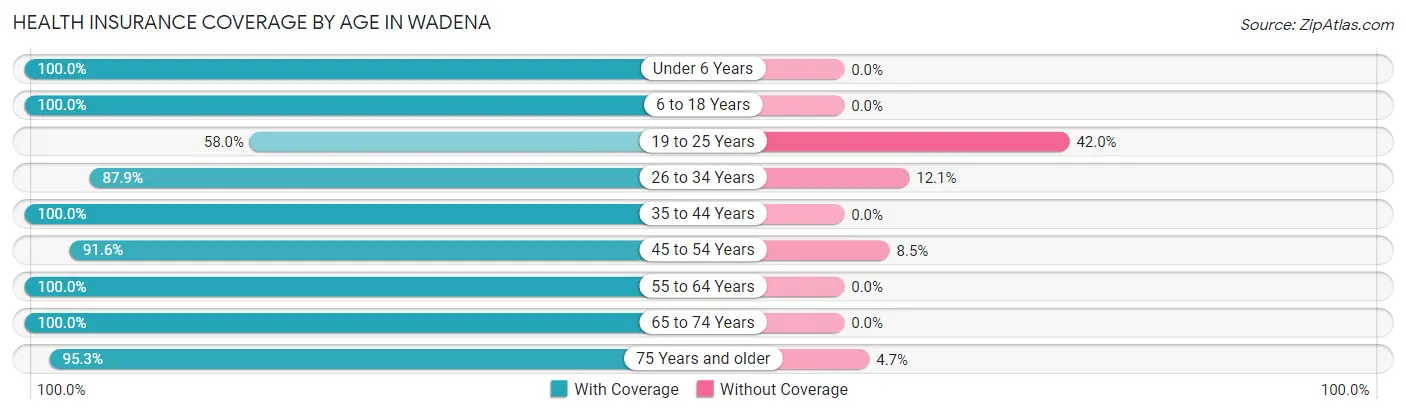
| Age Bracket | With Coverage | Without Coverage |
| Under 6 Years | 416 (100.0%) | 0 (0.0%) |
| 6 to 18 Years | 718 (100.0%) | 0 (0.0%) |
| 19 to 25 Years | 239 (58.0%) | 173 (42.0%) |
| 26 to 34 Years | 464 (87.9%) | 64 (12.1%) |
| 35 to 44 Years | 330 (100.0%) | 0 (0.0%) |
| 45 to 54 Years | 455 (91.5%) | 42 (8.5%) |
| 55 to 64 Years | 488 (100.0%) | 0 (0.0%) |
| 65 to 74 Years | 440 (100.0%) | 0 (0.0%) |
| 75 Years and older | 327 (95.3%) | 16 (4.7%) |
| Total | 3,877 (92.9%) | 295 (7.1%) |
Health Insurance Coverage by Citizenship Status in Wadena
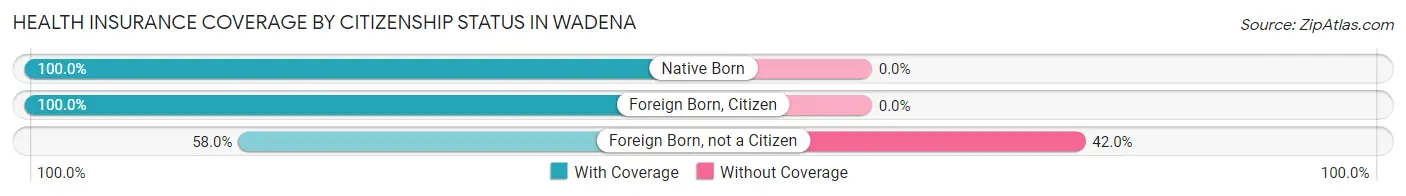
| Citizenship Status | With Coverage | Without Coverage |
| Native Born | 416 (100.0%) | 0 (0.0%) |
| Foreign Born, Citizen | 718 (100.0%) | 0 (0.0%) |
| Foreign Born, not a Citizen | 239 (58.0%) | 173 (42.0%) |
Health Insurance Coverage by Household Income in Wadena
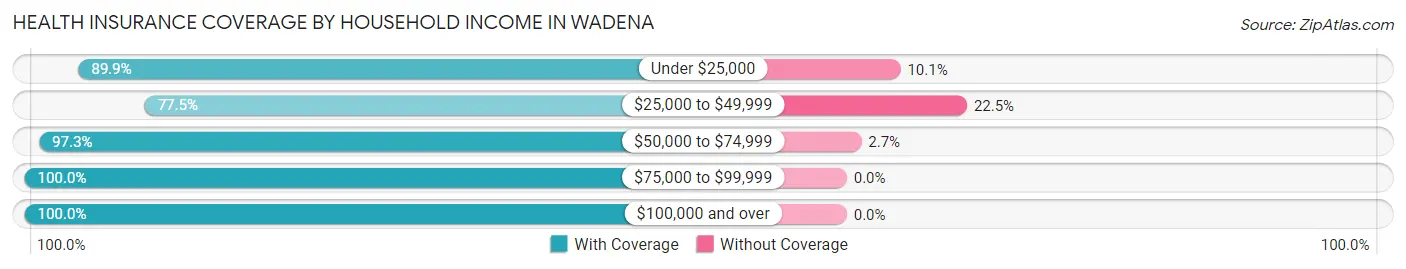
| Household Income | With Coverage | Without Coverage |
| Under $25,000 | 975 (89.9%) | 109 (10.1%) |
| $25,000 to $49,999 | 561 (77.5%) | 163 (22.5%) |
| $50,000 to $74,999 | 821 (97.3%) | 23 (2.7%) |
| $75,000 to $99,999 | 779 (100.0%) | 0 (0.0%) |
| $100,000 and over | 697 (100.0%) | 0 (0.0%) |
Public vs Private Health Insurance Coverage by Age in Wadena
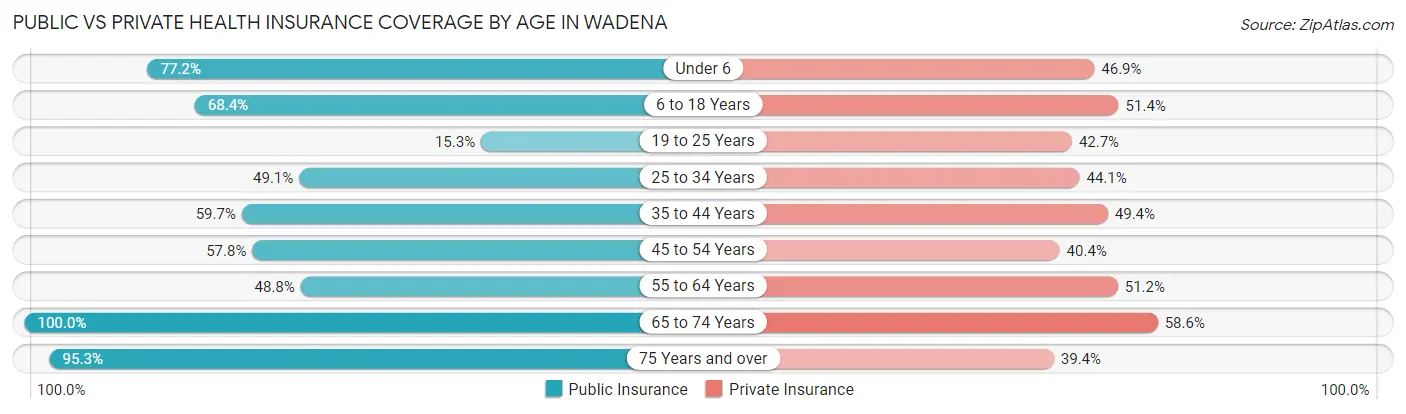
| Age Bracket | Public Insurance | Private Insurance |
| Under 6 | 321 (77.2%) | 195 (46.9%) |
| 6 to 18 Years | 491 (68.4%) | 369 (51.4%) |
| 19 to 25 Years | 63 (15.3%) | 176 (42.7%) |
| 25 to 34 Years | 259 (49.0%) | 233 (44.1%) |
| 35 to 44 Years | 197 (59.7%) | 163 (49.4%) |
| 45 to 54 Years | 287 (57.8%) | 201 (40.4%) |
| 55 to 64 Years | 238 (48.8%) | 250 (51.2%) |
| 65 to 74 Years | 440 (100.0%) | 258 (58.6%) |
| 75 Years and over | 327 (95.3%) | 135 (39.4%) |
| Total | 2,623 (62.9%) | 1,980 (47.5%) |
Disability Status by Sex by Age in Wadena
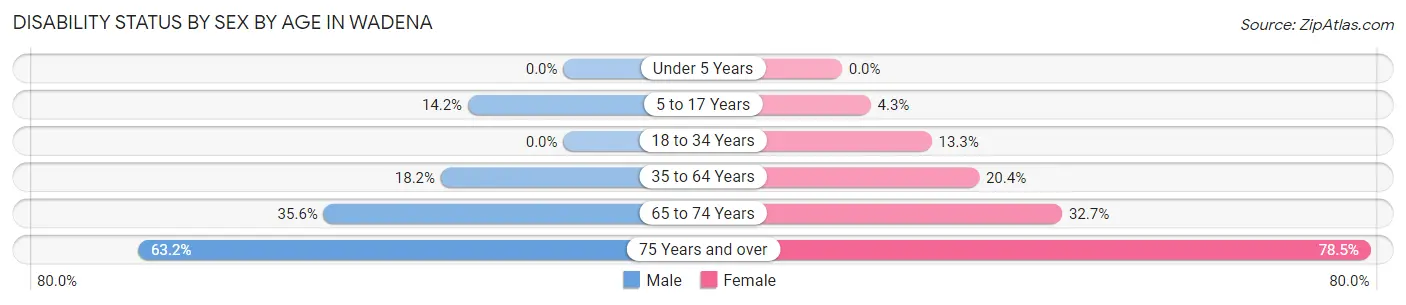
| Age Bracket | Male | Female |
| Under 5 Years | 0 (0.0%) | 0 (0.0%) |
| 5 to 17 Years | 52 (14.2%) | 18 (4.3%) |
| 18 to 34 Years | 0 (0.0%) | 81 (13.3%) |
| 35 to 64 Years | 141 (18.2%) | 110 (20.4%) |
| 65 to 74 Years | 63 (35.6%) | 86 (32.7%) |
| 75 Years and over | 96 (63.2%) | 150 (78.5%) |
Disability Class by Sex by Age in Wadena
Disability Class: Hearing Difficulty
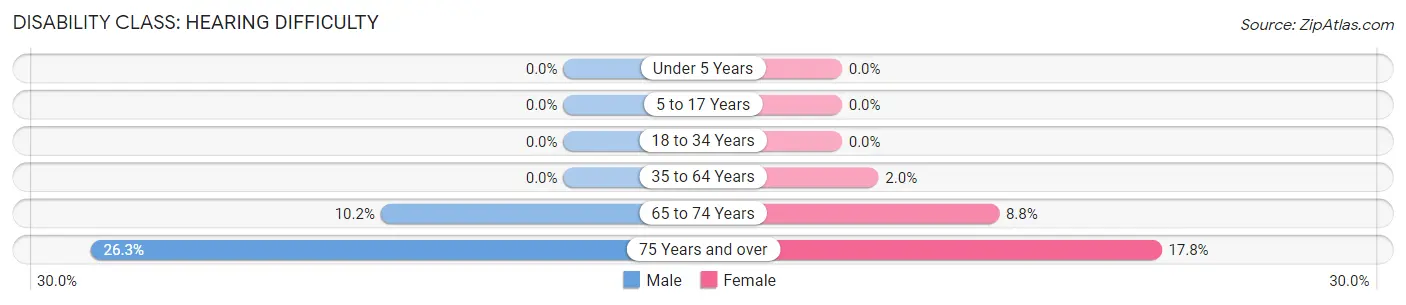
| Age Bracket | Male | Female |
| Under 5 Years | 0 (0.0%) | 0 (0.0%) |
| 5 to 17 Years | 0 (0.0%) | 0 (0.0%) |
| 18 to 34 Years | 0 (0.0%) | 0 (0.0%) |
| 35 to 64 Years | 0 (0.0%) | 11 (2.0%) |
| 65 to 74 Years | 18 (10.2%) | 23 (8.7%) |
| 75 Years and over | 40 (26.3%) | 34 (17.8%) |
Disability Class: Vision Difficulty
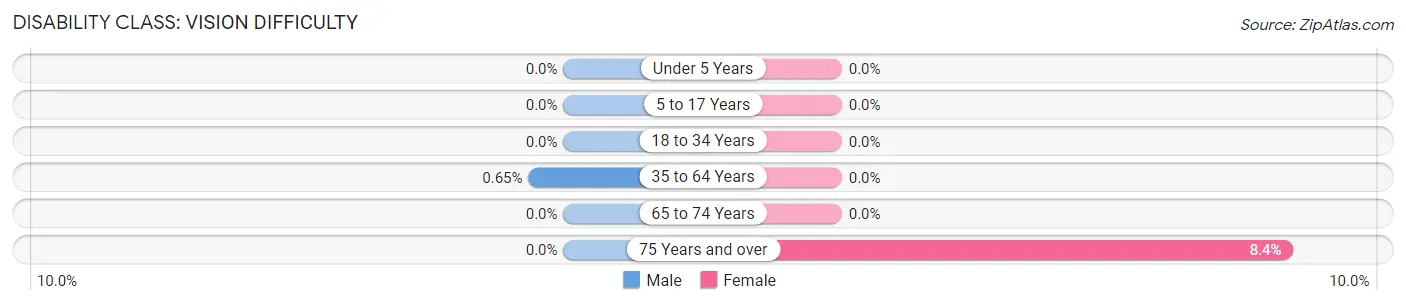
| Age Bracket | Male | Female |
| Under 5 Years | 0 (0.0%) | 0 (0.0%) |
| 5 to 17 Years | 0 (0.0%) | 0 (0.0%) |
| 18 to 34 Years | 0 (0.0%) | 0 (0.0%) |
| 35 to 64 Years | 5 (0.6%) | 0 (0.0%) |
| 65 to 74 Years | 0 (0.0%) | 0 (0.0%) |
| 75 Years and over | 0 (0.0%) | 16 (8.4%) |
Disability Class: Cognitive Difficulty
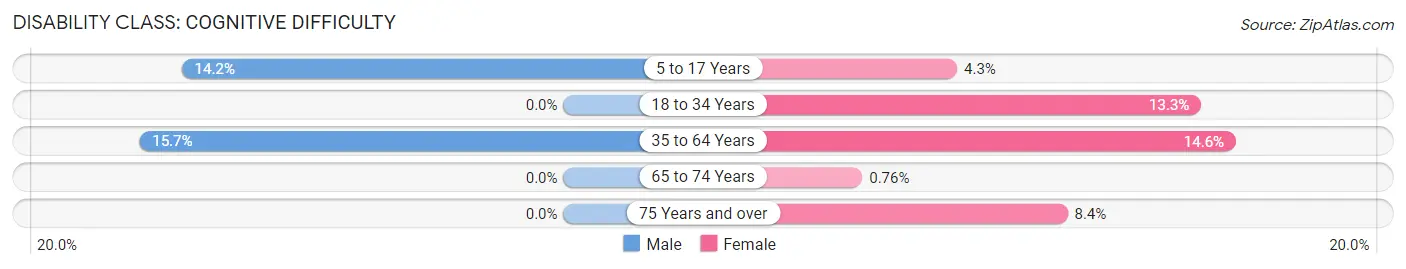
| Age Bracket | Male | Female |
| 5 to 17 Years | 52 (14.2%) | 18 (4.3%) |
| 18 to 34 Years | 0 (0.0%) | 81 (13.3%) |
| 35 to 64 Years | 122 (15.7%) | 79 (14.6%) |
| 65 to 74 Years | 0 (0.0%) | 2 (0.8%) |
| 75 Years and over | 0 (0.0%) | 16 (8.4%) |
Disability Class: Ambulatory Difficulty
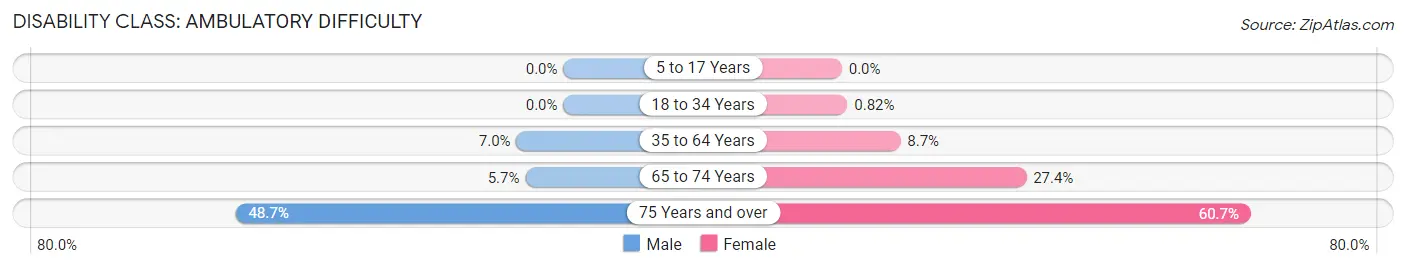
| Age Bracket | Male | Female |
| 5 to 17 Years | 0 (0.0%) | 0 (0.0%) |
| 18 to 34 Years | 0 (0.0%) | 5 (0.8%) |
| 35 to 64 Years | 54 (7.0%) | 47 (8.7%) |
| 65 to 74 Years | 10 (5.7%) | 72 (27.4%) |
| 75 Years and over | 74 (48.7%) | 116 (60.7%) |
Disability Class: Self-Care Difficulty
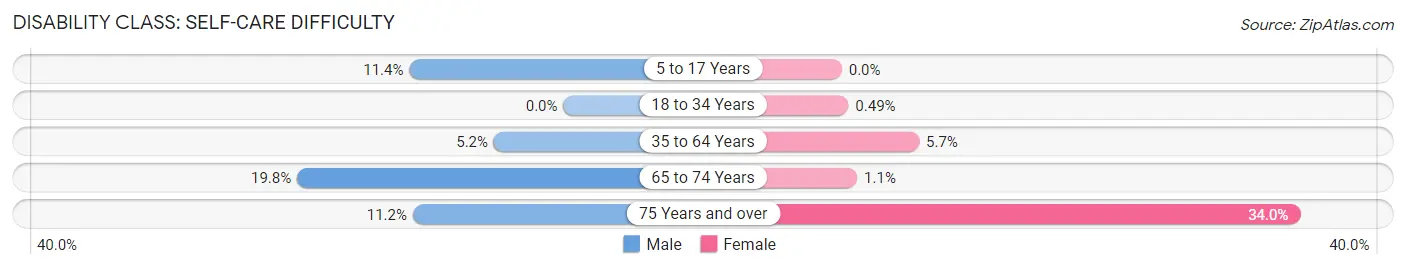
| Age Bracket | Male | Female |
| 5 to 17 Years | 42 (11.4%) | 0 (0.0%) |
| 18 to 34 Years | 0 (0.0%) | 3 (0.5%) |
| 35 to 64 Years | 40 (5.2%) | 31 (5.7%) |
| 65 to 74 Years | 35 (19.8%) | 3 (1.1%) |
| 75 Years and over | 17 (11.2%) | 65 (34.0%) |
Technology Access in Wadena
Computing Device Access in Wadena
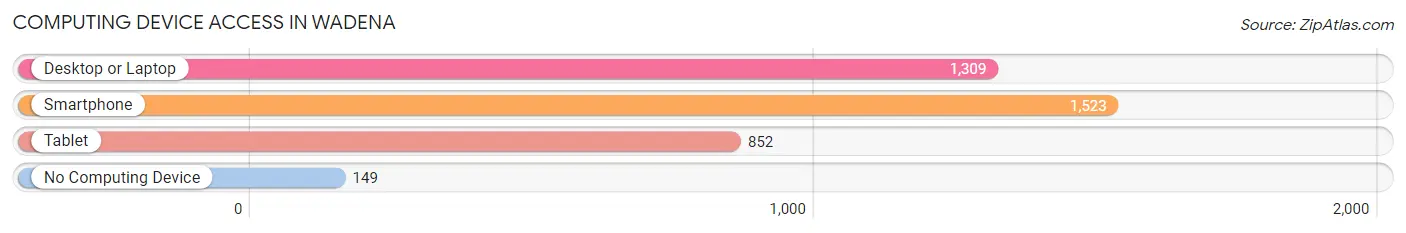
| Device Type | # Households | % Households |
| Desktop or Laptop | 1,309 | 67.2% |
| Smartphone | 1,523 | 78.2% |
| Tablet | 852 | 43.7% |
| No Computing Device | 149 | 7.6% |
| Total | 1,948 | 100.0% |
Internet Access in Wadena
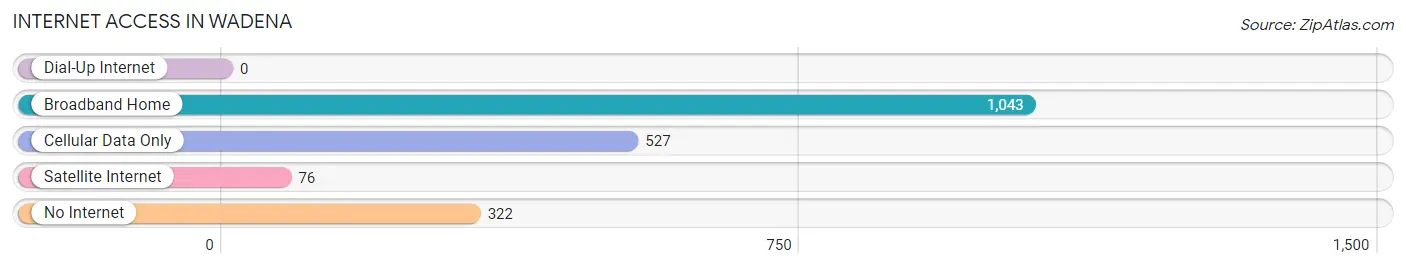
| Internet Type | # Households | % Households |
| Dial-Up Internet | 0 | 0.0% |
| Broadband Home | 1,043 | 53.5% |
| Cellular Data Only | 527 | 27.1% |
| Satellite Internet | 76 | 3.9% |
| No Internet | 322 | 16.5% |
| Total | 1,948 | 100.0% |
Wadena Summary
Wadena is a city located in the state of Minnesota, United States. It is the county seat of Wadena County and is located in the north-central part of the state. The population of Wadena was 4,086 at the 2010 census.
History
The area that is now Wadena was first settled in 1872 by a group of settlers from Wisconsin. The town was originally named Wadena City, but the name was changed to Wadena in 1881. The city was incorporated in 1883.
The city was named after Chief Wadena, a leader of the Ojibwe people who lived in the area. The city was a major trading center for the Ojibwe people and was a major stop on the Red River Trail, a major trading route between the Great Lakes and the Red River Valley.
The city was also a major stop on the Great Northern Railway, which was built in the late 19th century. The railway brought new settlers to the area and helped to spur the growth of the city.
Geography
Wadena is located at 46°27'N 95°7'W (46.45, -95.12). According to the United States Census Bureau, the city has a total area of 4.2 square miles (10.8 km2), all of it land.
The city is located in the Red River Valley, a flat, fertile region of the state. The city is located on the banks of the Otter Tail River, which flows through the city.
Economy
The economy of Wadena is largely based on agriculture and manufacturing. The city is home to several large agricultural businesses, including a large dairy farm and a large hog farm. The city is also home to several manufacturing businesses, including a large furniture factory and a large printing company.
The city is also home to several retail businesses, including several restaurants, a grocery store, and several clothing stores.
Demographics
As of the 2010 census, there were 4,086 people, 1,717 households, and 1,068 families residing in the city. The population density was 976.2 people per square mile (377.3/km2). There were 1,890 housing units at an average density of 449.7 per square mile (173.9/km2). The racial makeup of the city was 97.2% White, 0.3% African American, 0.4% Native American, 0.3% Asian, 0.2% from other races, and 1.6% from two or more races. Hispanic or Latino of any race were 1.2% of the population.
There were 1,717 households, out of which 28.2% had children under the age of 18 living with them, 46.2% were married couples living together, 11.2% had a female householder with no husband present, and 38.2% were non-families. 33.2% of all households were made up of individuals, and 16.2% had someone living alone who was 65 years of age or older. The average household size was 2.30 and the average family size was 2.93.
In the city, the population was spread out, with 24.2% under the age of 18, 8.2% from 18 to 24, 25.2% from 25 to 44, 22.2% from 45 to 64, and 20.2% who were 65 years of age or older. The median age was 39 years. For every 100 females, there were 91.2 males. For every 100 females age 18 and over, there were 87.2 males.
The median income for a household in the city was $31,944, and the median income for a family was $41,250. Males had a median income of $30,938 versus $20,938 for females. The per capita income for the city was $17,845. About 8.2% of families and 11.2% of the population were below the poverty line, including 14.2% of those under age 18 and 8.2% of those age 65 or over.
Common Questions
What is Per Capita Income in Wadena?
Per Capita income in Wadena is $25,001.
What is the Median Family Income in Wadena?
Median Family Income in Wadena is $60,278.
What is the Median Household income in Wadena?
Median Household Income in Wadena is $44,450.
What is Income or Wage Gap in Wadena?
Income or Wage Gap in Wadena is 13.8%.
Women in Wadena earn 86.2 cents for every dollar earned by a man.
What is Inequality or Gini Index in Wadena?
Inequality or Gini Index in Wadena is 0.42.
What is the Total Population of Wadena?
Total Population of Wadena is 4,328.
What is the Total Male Population of Wadena?
Total Male Population of Wadena is 2,070.
What is the Total Female Population of Wadena?
Total Female Population of Wadena is 2,258.
What is the Ratio of Males per 100 Females in Wadena?
There are 91.67 Males per 100 Females in Wadena.
What is the Ratio of Females per 100 Males in Wadena?
There are 109.08 Females per 100 Males in Wadena.
What is the Median Population Age in Wadena?
Median Population Age in Wadena is 37.4 Years.
What is the Average Family Size in Wadena
Average Family Size in Wadena is 2.8 People.
What is the Average Household Size in Wadena
Average Household Size in Wadena is 2.1 People.
How Large is the Labor Force in Wadena?
There are 2,133 People in the Labor Forcein in Wadena.
What is the Percentage of People in the Labor Force in Wadena?
65.2% of People are in the Labor Force in Wadena.
What is the Unemployment Rate in Wadena?
Unemployment Rate in Wadena is 10.7%.