Zumbrota, MN Map & Demographics
Zumbrota Map
Zumbrota Overview
$38,938
PER CAPITA INCOME
$104,393
AVG FAMILY INCOME
$72,061
AVG HOUSEHOLD INCOME
18.7%
WAGE / INCOME GAP [ % ]
81.3¢/ $1
WAGE / INCOME GAP [ $ ]
0.39
INEQUALITY / GINI INDEX
3,777
TOTAL POPULATION
1,835
MALE POPULATION
1,942
FEMALE POPULATION
94.49
MALES / 100 FEMALES
105.83
FEMALES / 100 MALES
43.5
MEDIAN AGE
2.8
AVG FAMILY SIZE
2.2
AVG HOUSEHOLD SIZE
2,072
LABOR FORCE [ PEOPLE ]
67.7%
PERCENT IN LABOR FORCE
2.8%
UNEMPLOYMENT RATE
Zumbrota Zip Codes
Zumbrota Area Codes
Income in Zumbrota
Income Overview in Zumbrota
Per Capita Income in Zumbrota is $38,938, while median incomes of families and households are $104,393 and $72,061 respectively.
| Characteristic | Number | Measure |
| Per Capita Income | 3,777 | $38,938 |
| Median Family Income | 1,059 | $104,393 |
| Mean Family Income | 1,059 | $107,702 |
| Median Household Income | 1,690 | $72,061 |
| Mean Household Income | 1,690 | $86,856 |
| Income Deficit | 1,059 | $0 |
| Wage / Income Gap (%) | 3,777 | 18.73% |
| Wage / Income Gap ($) | 3,777 | 81.27¢ per $1 |
| Gini / Inequality Index | 3,777 | 0.39 |
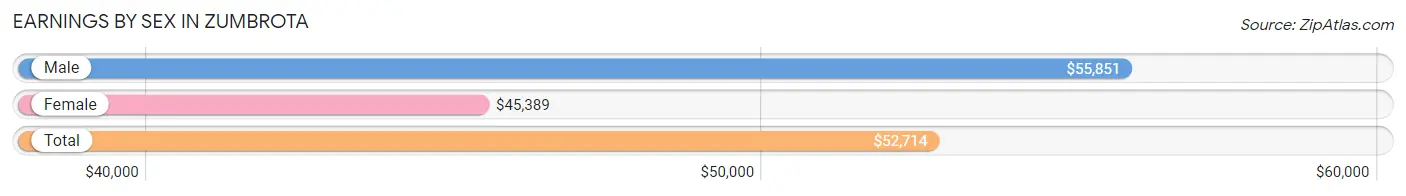
Earnings by Sex in Zumbrota
Average Earnings in Zumbrota are $52,714, $55,851 for men and $45,389 for women, a difference of 18.7%.
| Sex | Number | Average Earnings |
| Male | 1,133 (50.6%) | $55,851 |
| Female | 1,108 (49.4%) | $45,389 |
| Total | 2,241 (100.0%) | $52,714 |
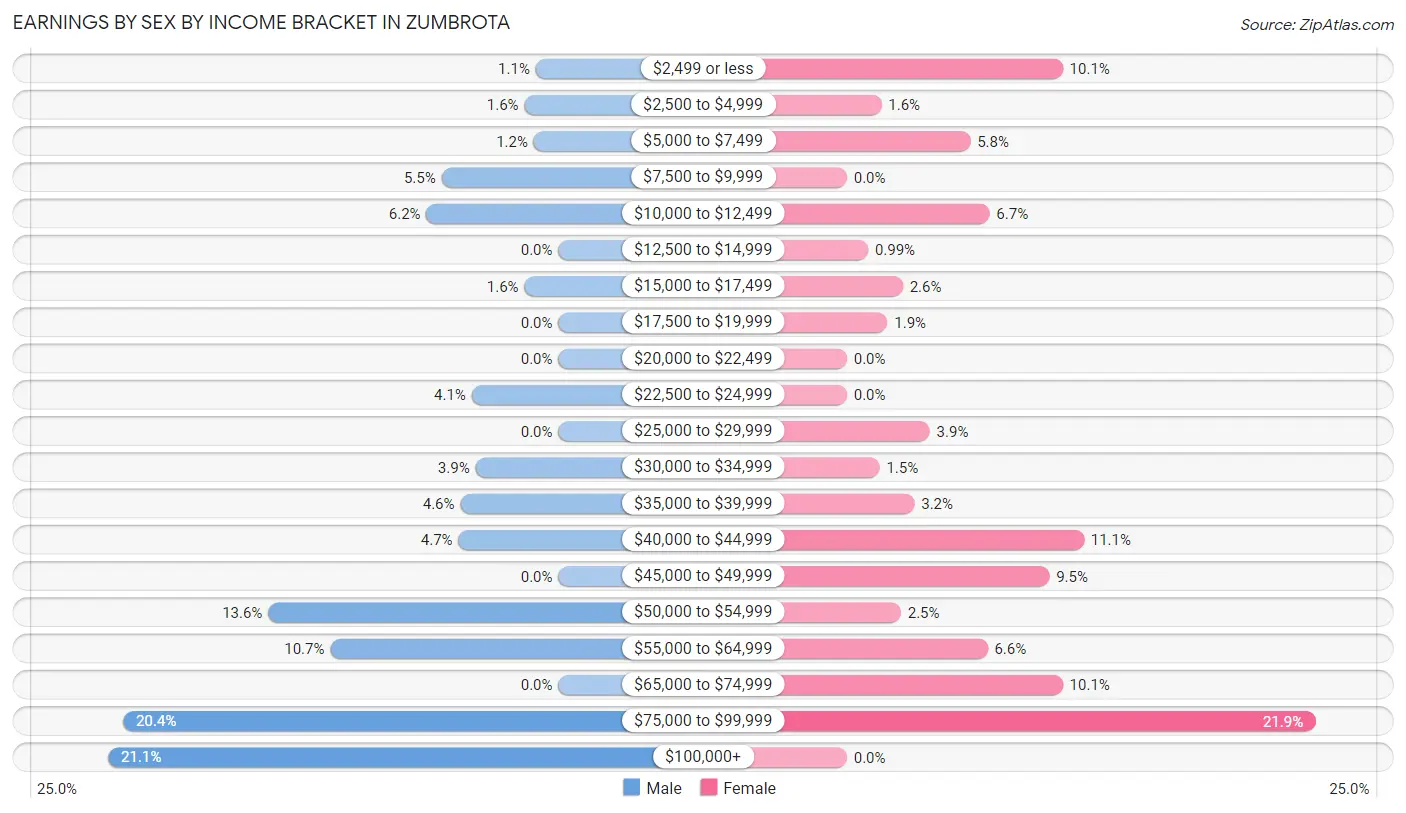
Earnings by Sex by Income Bracket in Zumbrota
The most common earnings brackets in Zumbrota are $100,000+ for men (239 | 21.1%) and $75,000 to $99,999 for women (243 | 21.9%).
| Income | Male | Female |
| $2,499 or less | 12 (1.1%) | 112 (10.1%) |
| $2,500 to $4,999 | 18 (1.6%) | 18 (1.6%) |
| $5,000 to $7,499 | 13 (1.1%) | 64 (5.8%) |
| $7,500 to $9,999 | 62 (5.5%) | 0 (0.0%) |
| $10,000 to $12,499 | 70 (6.2%) | 74 (6.7%) |
| $12,500 to $14,999 | 0 (0.0%) | 11 (1.0%) |
| $15,000 to $17,499 | 18 (1.6%) | 29 (2.6%) |
| $17,500 to $19,999 | 0 (0.0%) | 21 (1.9%) |
| $20,000 to $22,499 | 0 (0.0%) | 0 (0.0%) |
| $22,500 to $24,999 | 46 (4.1%) | 0 (0.0%) |
| $25,000 to $29,999 | 0 (0.0%) | 43 (3.9%) |
| $30,000 to $34,999 | 44 (3.9%) | 17 (1.5%) |
| $35,000 to $39,999 | 52 (4.6%) | 35 (3.2%) |
| $40,000 to $44,999 | 53 (4.7%) | 123 (11.1%) |
| $45,000 to $49,999 | 0 (0.0%) | 105 (9.5%) |
| $50,000 to $54,999 | 154 (13.6%) | 28 (2.5%) |
| $55,000 to $64,999 | 121 (10.7%) | 73 (6.6%) |
| $65,000 to $74,999 | 0 (0.0%) | 112 (10.1%) |
| $75,000 to $99,999 | 231 (20.4%) | 243 (21.9%) |
| $100,000+ | 239 (21.1%) | 0 (0.0%) |
| Total | 1,133 (100.0%) | 1,108 (100.0%) |
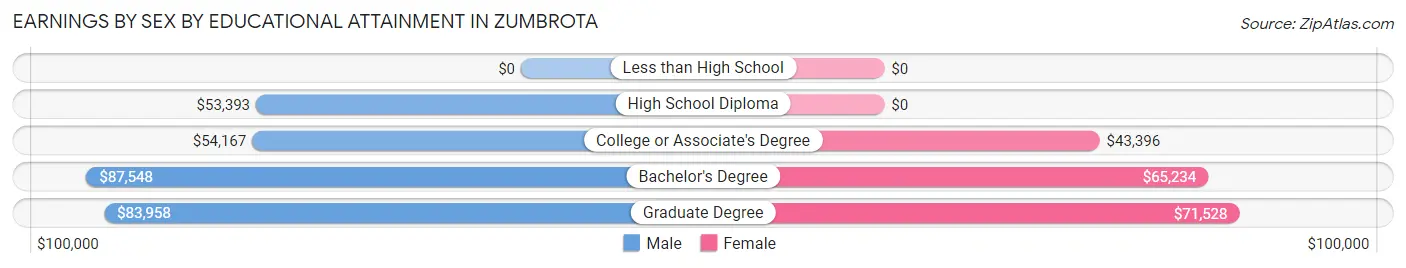
Earnings by Sex by Educational Attainment in Zumbrota
Average earnings in Zumbrota are $57,222 for men and $46,722 for women, a difference of 18.3%. Men with an educational attainment of bachelor's degree enjoy the highest average annual earnings of $87,548, while those with high school diploma education earn the least with $53,393. Women with an educational attainment of graduate degree earn the most with the average annual earnings of $71,528, while those with college or associate's degree education have the smallest earnings of $43,396.
| Educational Attainment | Male Income | Female Income |
| Less than High School | - | - |
| High School Diploma | $53,393 | $0 |
| College or Associate's Degree | $54,167 | $43,396 |
| Bachelor's Degree | $87,548 | $65,234 |
| Graduate Degree | $83,958 | $71,528 |
| Total | $57,222 | $46,722 |
Family Income in Zumbrota
Family Income Brackets in Zumbrota
According to the Zumbrota family income data, there are 399 families falling into the $100,000 to $149,999 income range, which is the most common income bracket and makes up 37.7% of all families.
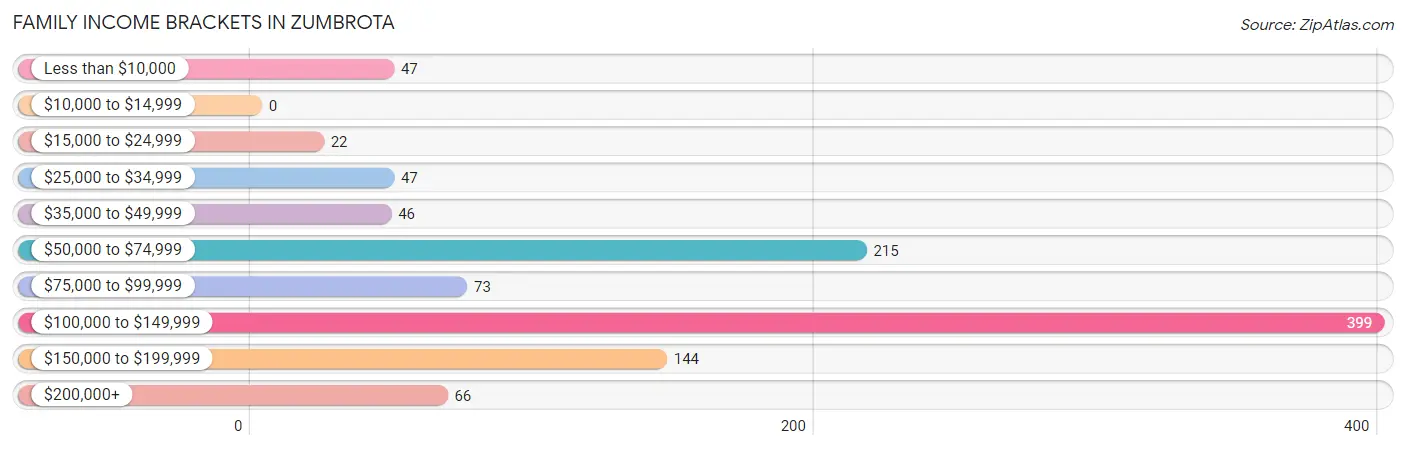
| Income Bracket | # Families | % Families |
| Less than $10,000 | 47 | 4.4% |
| $10,000 to $14,999 | 0 | 0.0% |
| $15,000 to $24,999 | 22 | 2.1% |
| $25,000 to $34,999 | 47 | 4.4% |
| $35,000 to $49,999 | 46 | 4.3% |
| $50,000 to $74,999 | 215 | 20.3% |
| $75,000 to $99,999 | 73 | 6.9% |
| $100,000 to $149,999 | 399 | 37.7% |
| $150,000 to $199,999 | 144 | 13.6% |
| $200,000+ | 66 | 6.2% |
Family Income by Famaliy Size in Zumbrota
4-person families (70 | 6.6%) account for the highest median family income in Zumbrota with $199,091 per family, while 2-person families (628 | 59.3%) have the highest median income of $51,334 per family member.
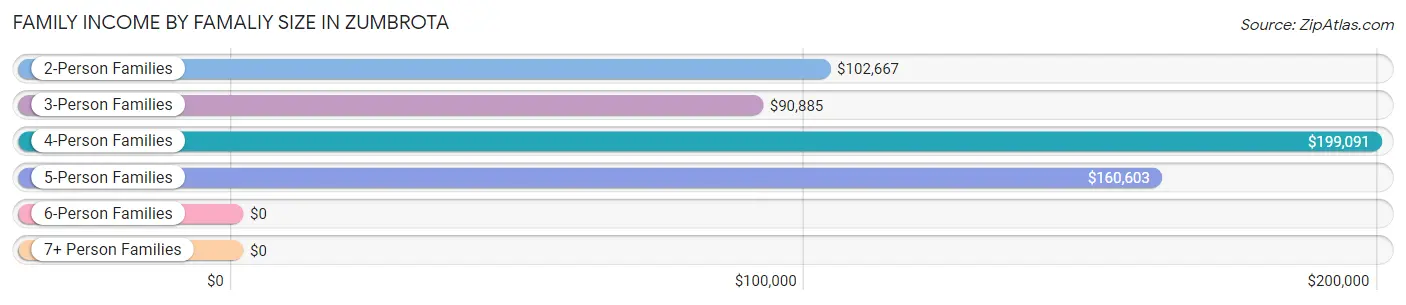
| Income Bracket | # Families | Median Income |
| 2-Person Families | 628 (59.3%) | $102,667 |
| 3-Person Families | 255 (24.1%) | $90,885 |
| 4-Person Families | 70 (6.6%) | $199,091 |
| 5-Person Families | 106 (10.0%) | $160,603 |
| 6-Person Families | 0 (0.0%) | $0 |
| 7+ Person Families | 0 (0.0%) | $0 |
| Total | 1,059 (100.0%) | $104,393 |
Family Income by Number of Earners in Zumbrota
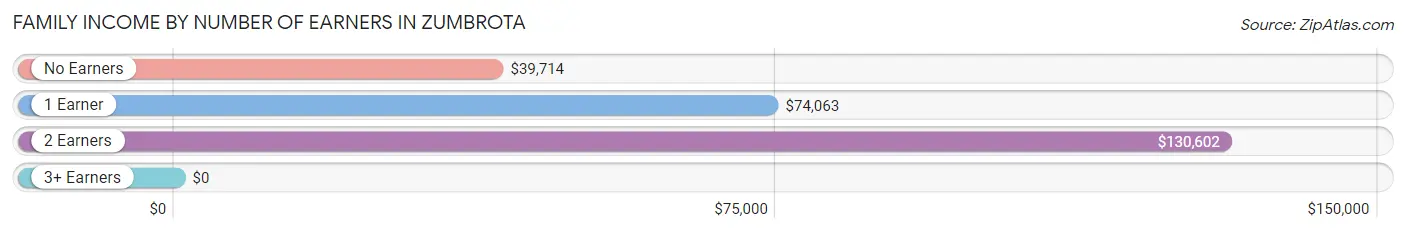
| Number of Earners | # Families | Median Income |
| No Earners | 176 (16.6%) | $39,714 |
| 1 Earner | 219 (20.7%) | $74,063 |
| 2 Earners | 571 (53.9%) | $130,602 |
| 3+ Earners | 93 (8.8%) | $0 |
| Total | 1,059 (100.0%) | $104,393 |
Household Income in Zumbrota
Household Income Brackets in Zumbrota
With 485 households falling in the category, the $100,000 to $149,999 income range is the most frequent in Zumbrota, accounting for 28.7% of all households. In contrast, only 47 households (2.8%) fall into the $25,000 to $34,999 income bracket, making it the least populous group.
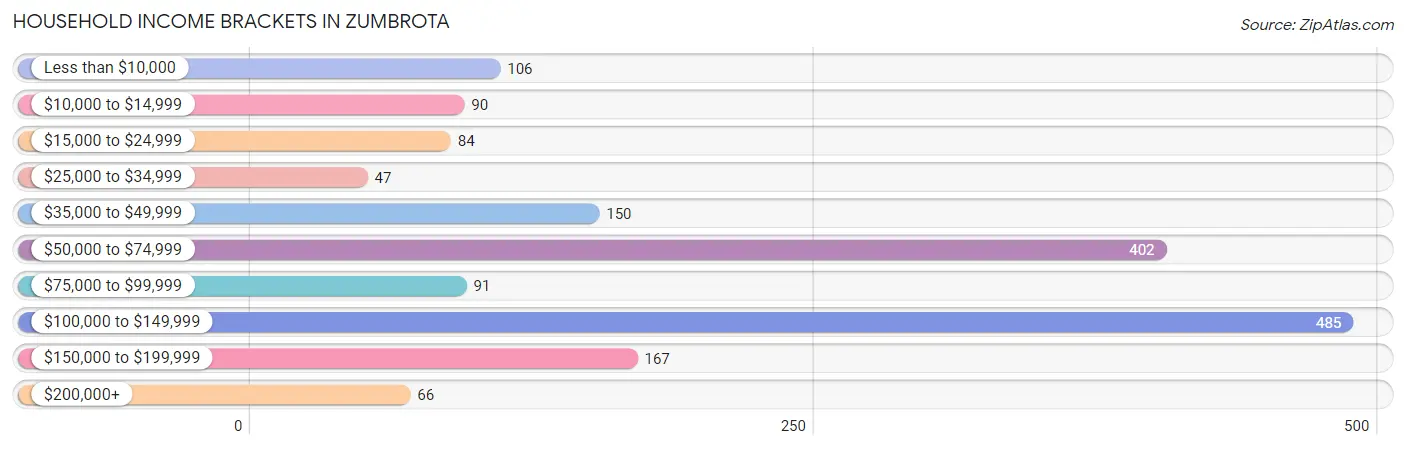
| Income Bracket | # Households | % Households |
| Less than $10,000 | 106 | 6.3% |
| $10,000 to $14,999 | 90 | 5.3% |
| $15,000 to $24,999 | 84 | 5.0% |
| $25,000 to $34,999 | 47 | 2.8% |
| $35,000 to $49,999 | 150 | 8.9% |
| $50,000 to $74,999 | 402 | 23.8% |
| $75,000 to $99,999 | 91 | 5.4% |
| $100,000 to $149,999 | 485 | 28.7% |
| $150,000 to $199,999 | 167 | 9.9% |
| $200,000+ | 66 | 3.9% |
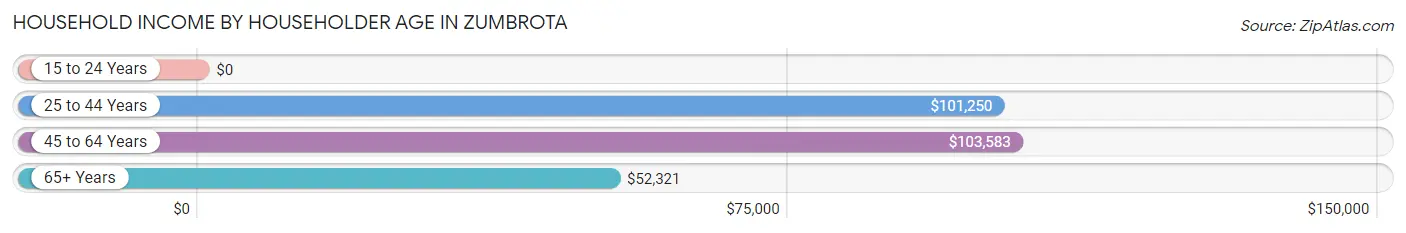
Household Income by Householder Age in Zumbrota
The median household income in Zumbrota is $72,061, with the highest median household income of $103,583 found in the 45 to 64 years age bracket for the primary householder. A total of 649 households (38.4%) fall into this category. Meanwhile, the 15 to 24 years age bracket for the primary householder has the lowest median household income of $0, with 75 households (4.4%) in this group.
| Income Bracket | # Households | Median Income |
| 15 to 24 Years | 75 (4.4%) | $0 |
| 25 to 44 Years | 455 (26.9%) | $101,250 |
| 45 to 64 Years | 649 (38.4%) | $103,583 |
| 65+ Years | 511 (30.2%) | $52,321 |
| Total | 1,690 (100.0%) | $72,061 |
Poverty in Zumbrota
Income Below Poverty by Sex and Age in Zumbrota
With 10.2% poverty level for males and 10.2% for females among the residents of Zumbrota, 16 and 17 year old males and 6 to 11 year old females are the most vulnerable to poverty, with 19 males (100.0%) and 33 females (24.6%) in their respective age groups living below the poverty level.
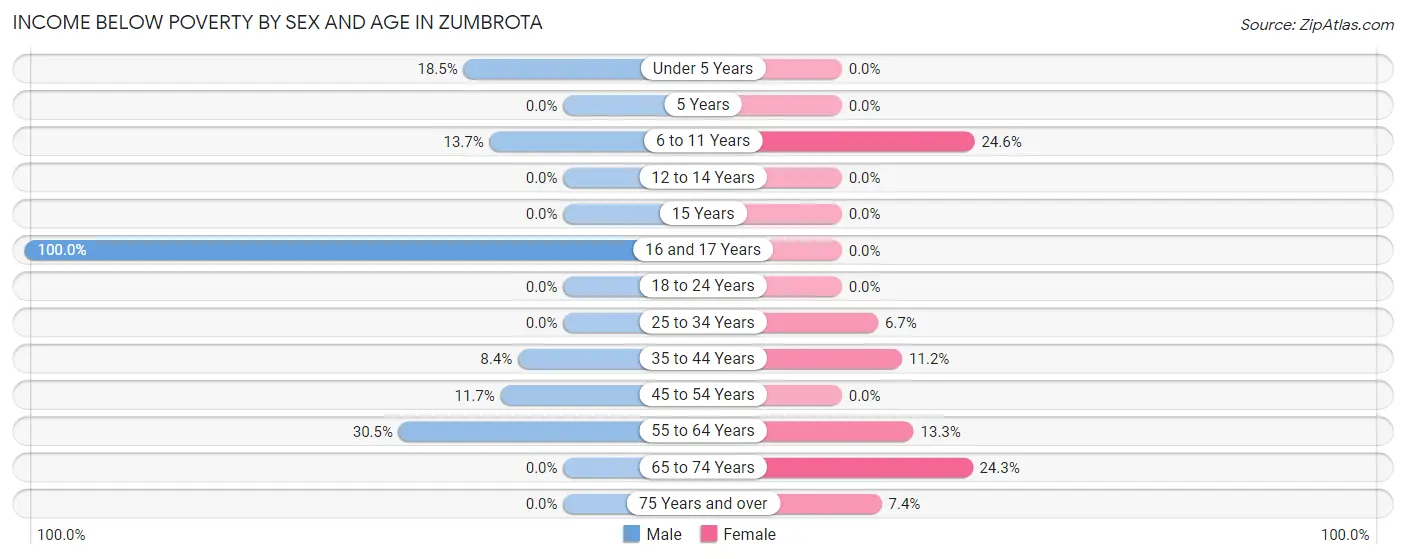
| Age Bracket | Male | Female |
| Under 5 Years | 20 (18.5%) | 0 (0.0%) |
| 5 Years | 0 (0.0%) | 0 (0.0%) |
| 6 to 11 Years | 20 (13.7%) | 33 (24.6%) |
| 12 to 14 Years | 0 (0.0%) | 0 (0.0%) |
| 15 Years | 0 (0.0%) | 0 (0.0%) |
| 16 and 17 Years | 19 (100.0%) | 0 (0.0%) |
| 18 to 24 Years | 0 (0.0%) | 0 (0.0%) |
| 25 to 34 Years | 0 (0.0%) | 18 (6.7%) |
| 35 to 44 Years | 25 (8.4%) | 29 (11.2%) |
| 45 to 54 Years | 29 (11.7%) | 0 (0.0%) |
| 55 to 64 Years | 73 (30.5%) | 42 (13.3%) |
| 65 to 74 Years | 0 (0.0%) | 57 (24.3%) |
| 75 Years and over | 0 (0.0%) | 15 (7.4%) |
| Total | 186 (10.2%) | 194 (10.2%) |
Income Above Poverty by Sex and Age in Zumbrota
According to the poverty statistics in Zumbrota, males aged 12 to 14 years and females aged under 5 years are the age groups that are most secure financially, with 100.0% of males and 100.0% of females in these age groups living above the poverty line.
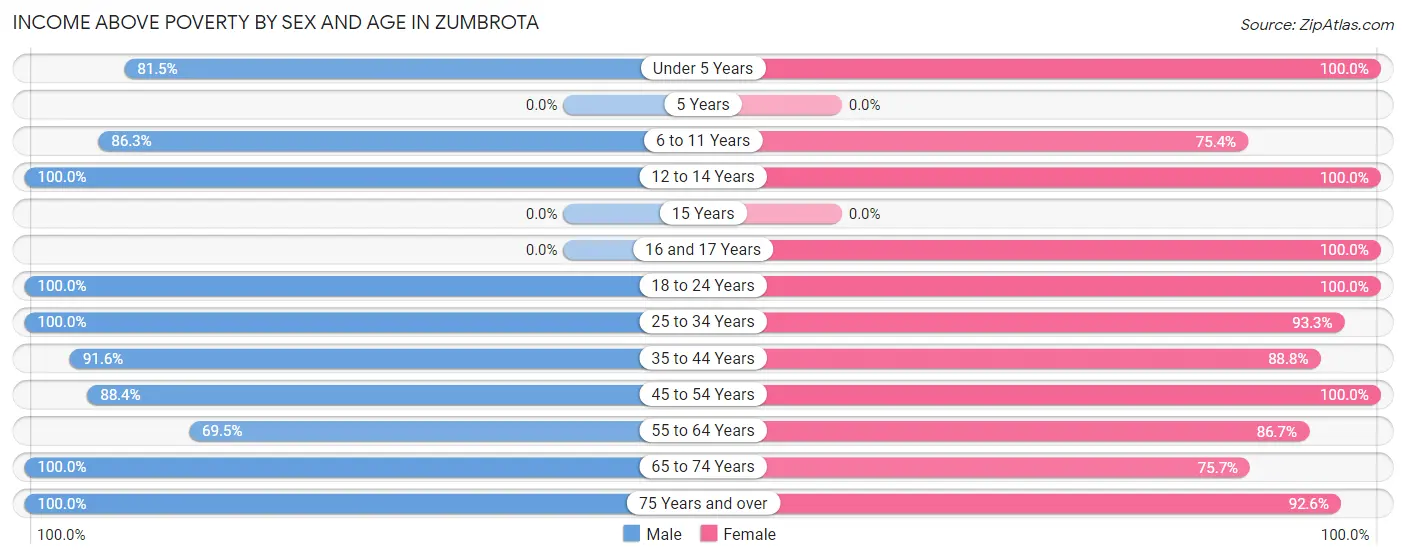
| Age Bracket | Male | Female |
| Under 5 Years | 88 (81.5%) | 132 (100.0%) |
| 5 Years | 0 (0.0%) | 0 (0.0%) |
| 6 to 11 Years | 126 (86.3%) | 101 (75.4%) |
| 12 to 14 Years | 144 (100.0%) | 53 (100.0%) |
| 15 Years | 0 (0.0%) | 0 (0.0%) |
| 16 and 17 Years | 0 (0.0%) | 34 (100.0%) |
| 18 to 24 Years | 79 (100.0%) | 72 (100.0%) |
| 25 to 34 Years | 227 (100.0%) | 250 (93.3%) |
| 35 to 44 Years | 272 (91.6%) | 230 (88.8%) |
| 45 to 54 Years | 220 (88.3%) | 199 (100.0%) |
| 55 to 64 Years | 166 (69.5%) | 273 (86.7%) |
| 65 to 74 Years | 153 (100.0%) | 178 (75.7%) |
| 75 Years and over | 164 (100.0%) | 188 (92.6%) |
| Total | 1,639 (89.8%) | 1,710 (89.8%) |
Income Below Poverty Among Married-Couple Families in Zumbrota
The poverty statistics for married-couple families in Zumbrota show that 2.4% or 22 of the total 909 families live below the poverty line. Families with no children have the highest poverty rate of 3.3%, comprising of 22 families. On the other hand, families with 1 or 2 children have the lowest poverty rate of 0.0%, which includes 0 families.
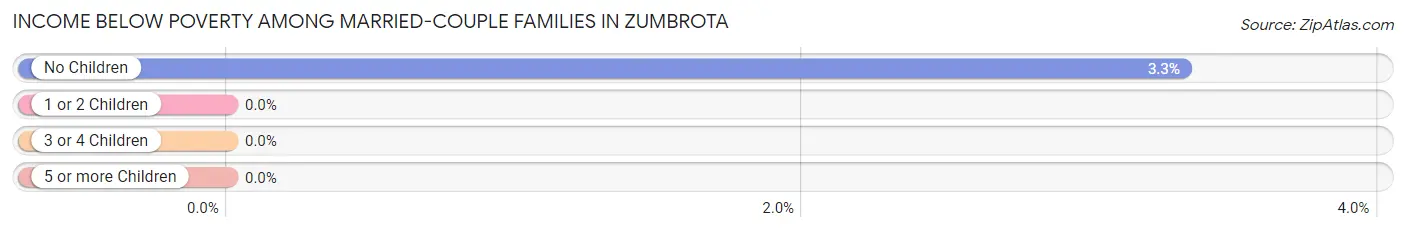
| Children | Above Poverty | Below Poverty |
| No Children | 640 (96.7%) | 22 (3.3%) |
| 1 or 2 Children | 141 (100.0%) | 0 (0.0%) |
| 3 or 4 Children | 106 (100.0%) | 0 (0.0%) |
| 5 or more Children | 0 (0.0%) | 0 (0.0%) |
| Total | 887 (97.6%) | 22 (2.4%) |
Income Below Poverty Among Single-Parent Households in Zumbrota
According to the poverty data in Zumbrota, 100.0% or 29 single-father households and 14.9% or 18 single-mother households are living below the poverty line. Among single-father households, those with 1 or 2 children have the highest poverty rate, with 29 households (100.0%) experiencing poverty. Likewise, among single-mother households, those with 1 or 2 children have the highest poverty rate, with 18 households (21.7%) falling below the poverty line.
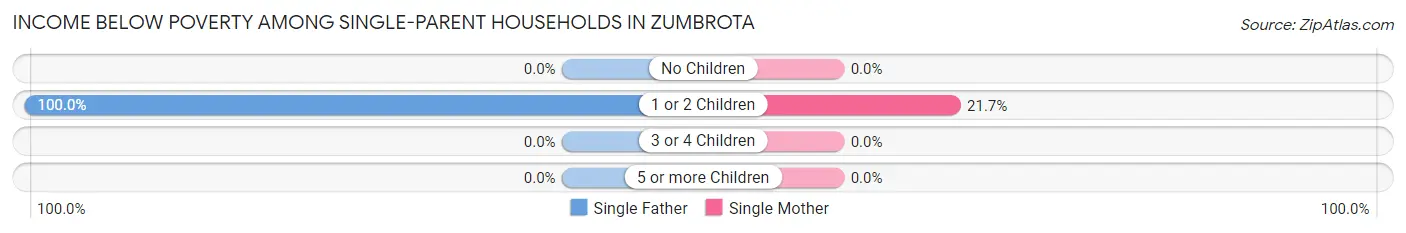
| Children | Single Father | Single Mother |
| No Children | 0 (0.0%) | 0 (0.0%) |
| 1 or 2 Children | 29 (100.0%) | 18 (21.7%) |
| 3 or 4 Children | 0 (0.0%) | 0 (0.0%) |
| 5 or more Children | 0 (0.0%) | 0 (0.0%) |
| Total | 29 (100.0%) | 18 (14.9%) |
Income Below Poverty Among Married-Couple vs Single-Parent Households in Zumbrota
The poverty data for Zumbrota shows that 22 of the married-couple family households (2.4%) and 47 of the single-parent households (31.3%) are living below the poverty level. Within the married-couple family households, those with no children have the highest poverty rate, with 22 households (3.3%) falling below the poverty line. Among the single-parent households, those with 1 or 2 children have the highest poverty rate, with 47 household (42.0%) living below poverty.
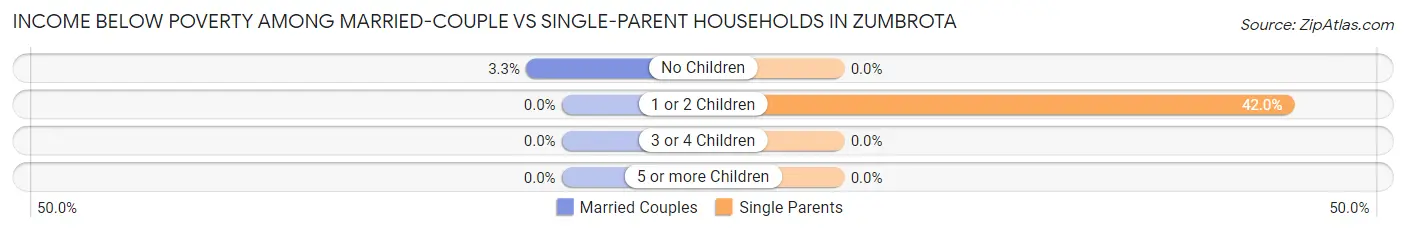
| Children | Married-Couple Families | Single-Parent Households |
| No Children | 22 (3.3%) | 0 (0.0%) |
| 1 or 2 Children | 0 (0.0%) | 47 (42.0%) |
| 3 or 4 Children | 0 (0.0%) | 0 (0.0%) |
| 5 or more Children | 0 (0.0%) | 0 (0.0%) |
| Total | 22 (2.4%) | 47 (31.3%) |
Race in Zumbrota
The most populous races in Zumbrota are White / Caucasian (3,586 | 94.9%), Asian (87 | 2.3%), and Hispanic or Latino (71 | 1.9%).
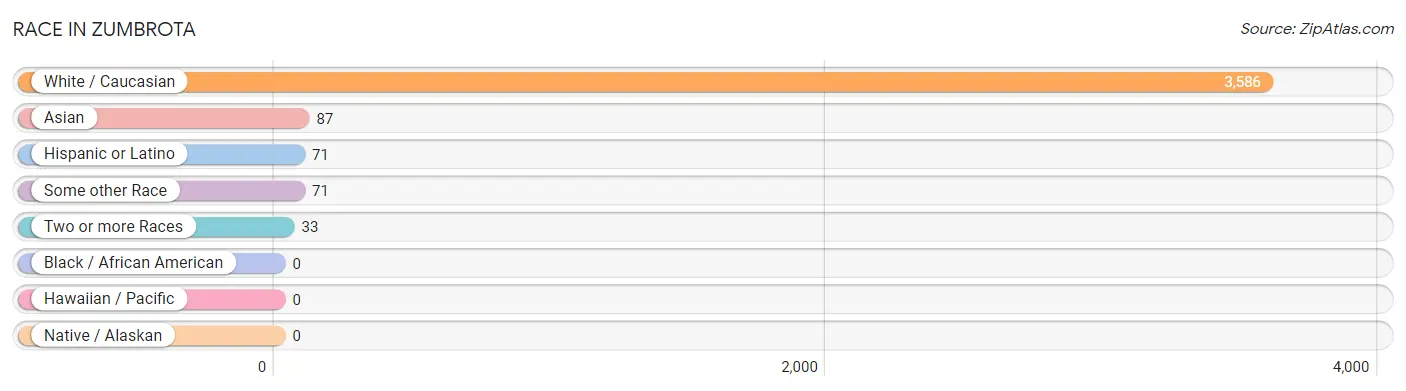
| Race | # Population | % Population |
| Asian | 87 | 2.3% |
| Black / African American | 0 | 0.0% |
| Hawaiian / Pacific | 0 | 0.0% |
| Hispanic or Latino | 71 | 1.9% |
| Native / Alaskan | 0 | 0.0% |
| White / Caucasian | 3,586 | 94.9% |
| Two or more Races | 33 | 0.9% |
| Some other Race | 71 | 1.9% |
| Total | 3,777 | 100.0% |
Ancestry in Zumbrota
The most populous ancestries reported in Zumbrota are Norwegian (1,343 | 35.6%), German (1,273 | 33.7%), Irish (349 | 9.2%), English (178 | 4.7%), and American (125 | 3.3%), together accounting for 86.5% of all Zumbrota residents.
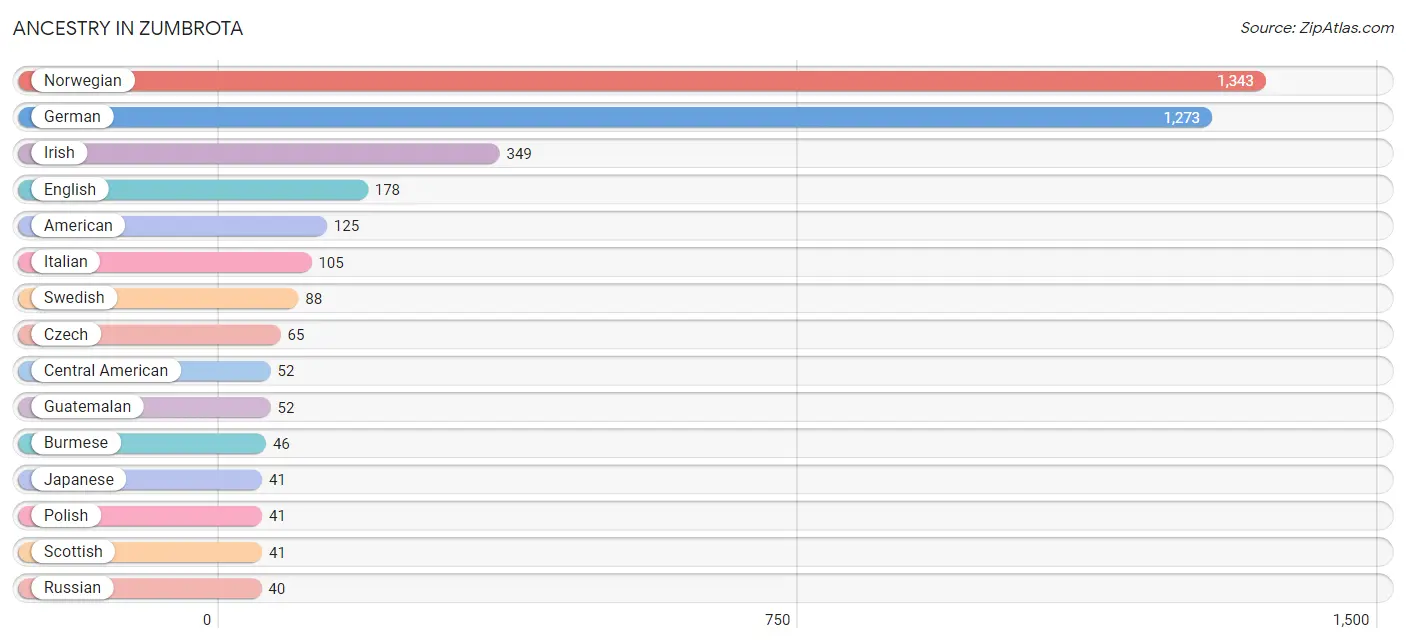
| Ancestry | # Population | % Population |
| American | 125 | 3.3% |
| Burmese | 46 | 1.2% |
| Central American | 52 | 1.4% |
| Czech | 65 | 1.7% |
| Danish | 36 | 0.9% |
| Dutch | 10 | 0.3% |
| English | 178 | 4.7% |
| Finnish | 38 | 1.0% |
| French | 23 | 0.6% |
| German | 1,273 | 33.7% |
| Guatemalan | 52 | 1.4% |
| Hungarian | 31 | 0.8% |
| Irish | 349 | 9.2% |
| Italian | 105 | 2.8% |
| Japanese | 41 | 1.1% |
| Luxembourger | 13 | 0.3% |
| Mexican | 19 | 0.5% |
| Norwegian | 1,343 | 35.6% |
| Polish | 41 | 1.1% |
| Romanian | 24 | 0.6% |
| Russian | 40 | 1.1% |
| Scandinavian | 16 | 0.4% |
| Scottish | 41 | 1.1% |
| Swedish | 88 | 2.3% | View All 24 Rows |
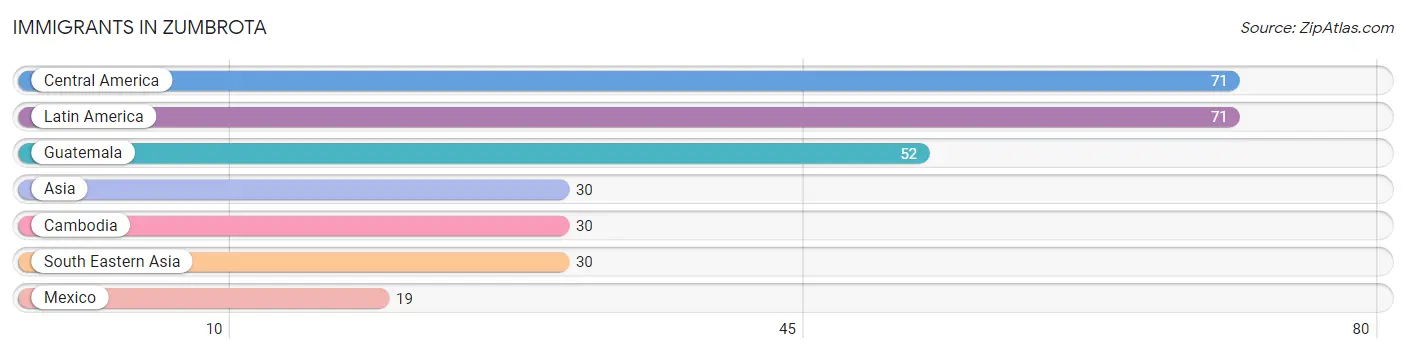
Immigrants in Zumbrota
The most numerous immigrant groups reported in Zumbrota came from Central America (71 | 1.9%), Latin America (71 | 1.9%), Guatemala (52 | 1.4%), Asia (30 | 0.8%), and Cambodia (30 | 0.8%), together accounting for 6.7% of all Zumbrota residents.
| Immigration Origin | # Population | % Population |
| Asia | 30 | 0.8% |
| Cambodia | 30 | 0.8% |
| Central America | 71 | 1.9% |
| Guatemala | 52 | 1.4% |
| Latin America | 71 | 1.9% |
| Mexico | 19 | 0.5% |
| South Eastern Asia | 30 | 0.8% | View All 7 Rows |
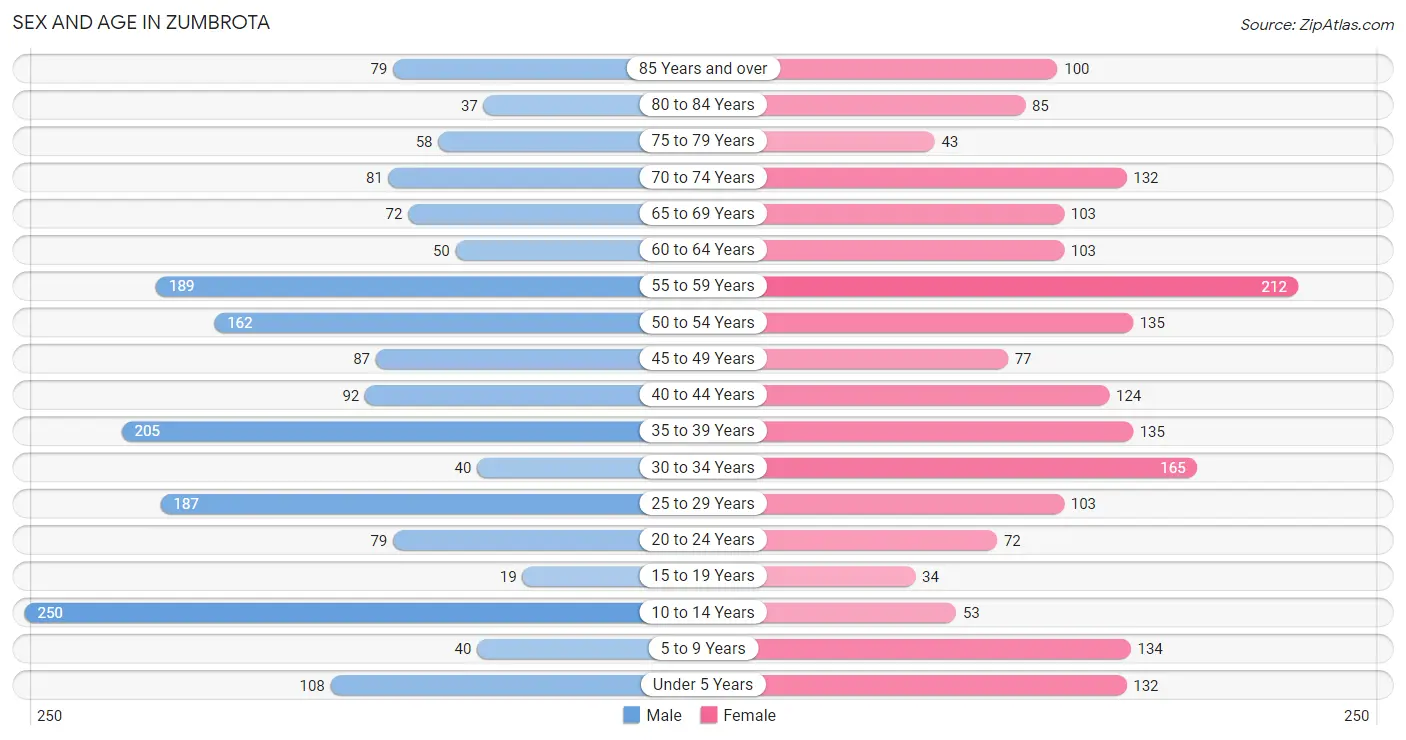
Sex and Age in Zumbrota
Sex and Age in Zumbrota
The most populous age groups in Zumbrota are 10 to 14 Years (250 | 13.6%) for men and 55 to 59 Years (212 | 10.9%) for women.
| Age Bracket | Male | Female |
| Under 5 Years | 108 (5.9%) | 132 (6.8%) |
| 5 to 9 Years | 40 (2.2%) | 134 (6.9%) |
| 10 to 14 Years | 250 (13.6%) | 53 (2.7%) |
| 15 to 19 Years | 19 (1.0%) | 34 (1.8%) |
| 20 to 24 Years | 79 (4.3%) | 72 (3.7%) |
| 25 to 29 Years | 187 (10.2%) | 103 (5.3%) |
| 30 to 34 Years | 40 (2.2%) | 165 (8.5%) |
| 35 to 39 Years | 205 (11.2%) | 135 (7.0%) |
| 40 to 44 Years | 92 (5.0%) | 124 (6.4%) |
| 45 to 49 Years | 87 (4.7%) | 77 (4.0%) |
| 50 to 54 Years | 162 (8.8%) | 135 (7.0%) |
| 55 to 59 Years | 189 (10.3%) | 212 (10.9%) |
| 60 to 64 Years | 50 (2.7%) | 103 (5.3%) |
| 65 to 69 Years | 72 (3.9%) | 103 (5.3%) |
| 70 to 74 Years | 81 (4.4%) | 132 (6.8%) |
| 75 to 79 Years | 58 (3.2%) | 43 (2.2%) |
| 80 to 84 Years | 37 (2.0%) | 85 (4.4%) |
| 85 Years and over | 79 (4.3%) | 100 (5.1%) |
| Total | 1,835 (100.0%) | 1,942 (100.0%) |
Families and Households in Zumbrota
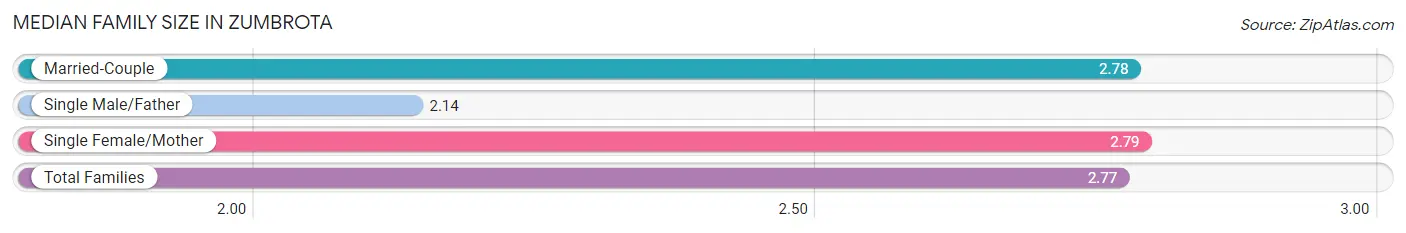
Median Family Size in Zumbrota
The median family size in Zumbrota is 2.77 persons per family, with single female/mother families (121 | 11.4%) accounting for the largest median family size of 2.79 persons per family. On the other hand, single male/father families (29 | 2.7%) represent the smallest median family size with 2.14 persons per family.
| Family Type | # Families | Family Size |
| Married-Couple | 909 (85.8%) | 2.78 |
| Single Male/Father | 29 (2.7%) | 2.14 |
| Single Female/Mother | 121 (11.4%) | 2.79 |
| Total Families | 1,059 (100.0%) | 2.77 |
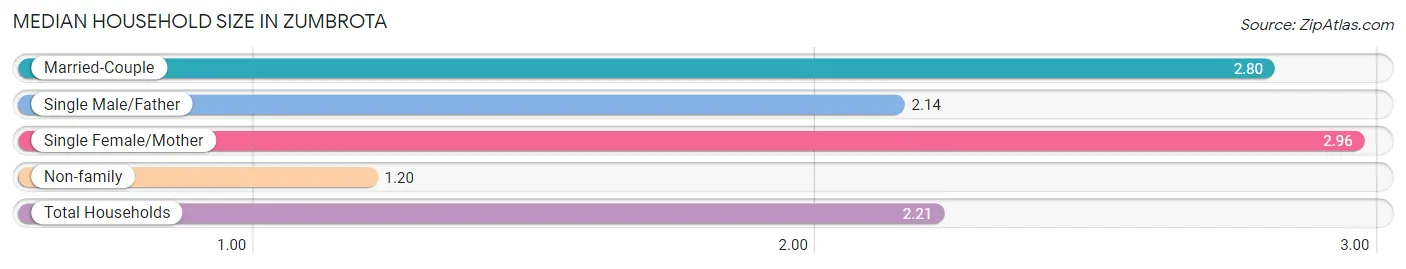
Median Household Size in Zumbrota
The median household size in Zumbrota is 2.21 persons per household, with single female/mother households (121 | 7.2%) accounting for the largest median household size of 2.96 persons per household. non-family households (631 | 37.3%) represent the smallest median household size with 1.20 persons per household.
| Household Type | # Households | Household Size |
| Married-Couple | 909 (53.8%) | 2.80 |
| Single Male/Father | 29 (1.7%) | 2.14 |
| Single Female/Mother | 121 (7.2%) | 2.96 |
| Non-family | 631 (37.3%) | 1.20 |
| Total Households | 1,690 (100.0%) | 2.21 |
Household Size by Marriage Status in Zumbrota
Out of a total of 1,690 households in Zumbrota, 1,059 (62.7%) are family households, while 631 (37.3%) are nonfamily households. The most numerous type of family households are 2-person households, comprising 628, and the most common type of nonfamily households are 1-person households, comprising 547.
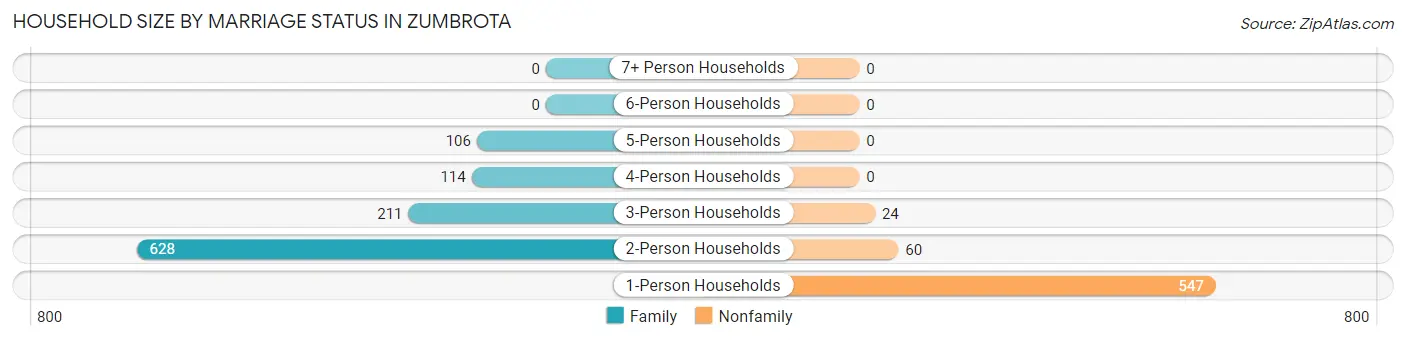
| Household Size | Family Households | Nonfamily Households |
| 1-Person Households | - | 547 (32.4%) |
| 2-Person Households | 628 (37.2%) | 60 (3.5%) |
| 3-Person Households | 211 (12.5%) | 24 (1.4%) |
| 4-Person Households | 114 (6.8%) | 0 (0.0%) |
| 5-Person Households | 106 (6.3%) | 0 (0.0%) |
| 6-Person Households | 0 (0.0%) | 0 (0.0%) |
| 7+ Person Households | 0 (0.0%) | 0 (0.0%) |
| Total | 1,059 (62.7%) | 631 (37.3%) |
Female Fertility in Zumbrota
Fertility by Age in Zumbrota
Average fertility rate in Zumbrota is 96.0 births per 1,000 women. Women in the age bracket of 20 to 34 years have the highest fertility rate with 209.0 births per 1,000 women. Women in the age bracket of 20 to 34 years acount for 100.0% of all women with births.
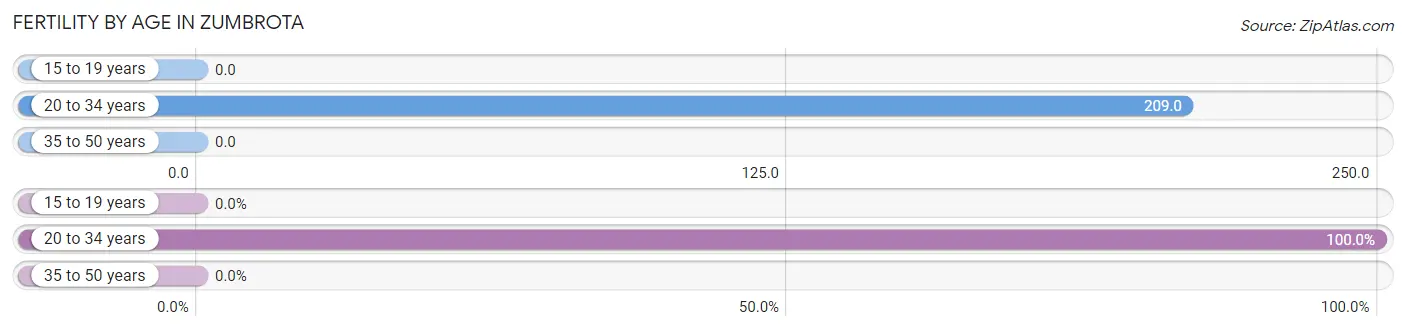
| Age Bracket | Women with Births | Births / 1,000 Women |
| 15 to 19 years | 0 (0.0%) | 0.0 |
| 20 to 34 years | 71 (100.0%) | 209.0 |
| 35 to 50 years | 0 (0.0%) | 0.0 |
| Total | 71 (100.0%) | 96.0 |
Fertility by Age by Marriage Status in Zumbrota
63.4% of women with births (71) in Zumbrota are married. The highest percentage of unmarried women with births falls into 20 to 34 years age bracket with 36.6% of them unmarried at the time of birth, while the lowest percentage of unmarried women with births belong to 20 to 34 years age bracket with 36.6% of them unmarried.
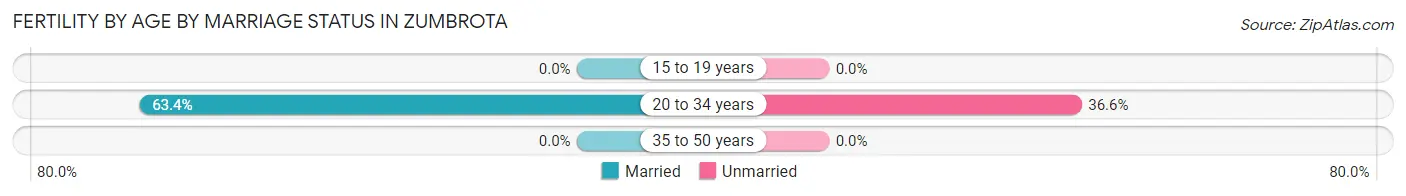
| Age Bracket | Married | Unmarried |
| 15 to 19 years | 0 (0.0%) | 0 (0.0%) |
| 20 to 34 years | 45 (63.4%) | 26 (36.6%) |
| 35 to 50 years | 0 (0.0%) | 0 (0.0%) |
| Total | 45 (63.4%) | 26 (36.6%) |
Fertility by Education in Zumbrota
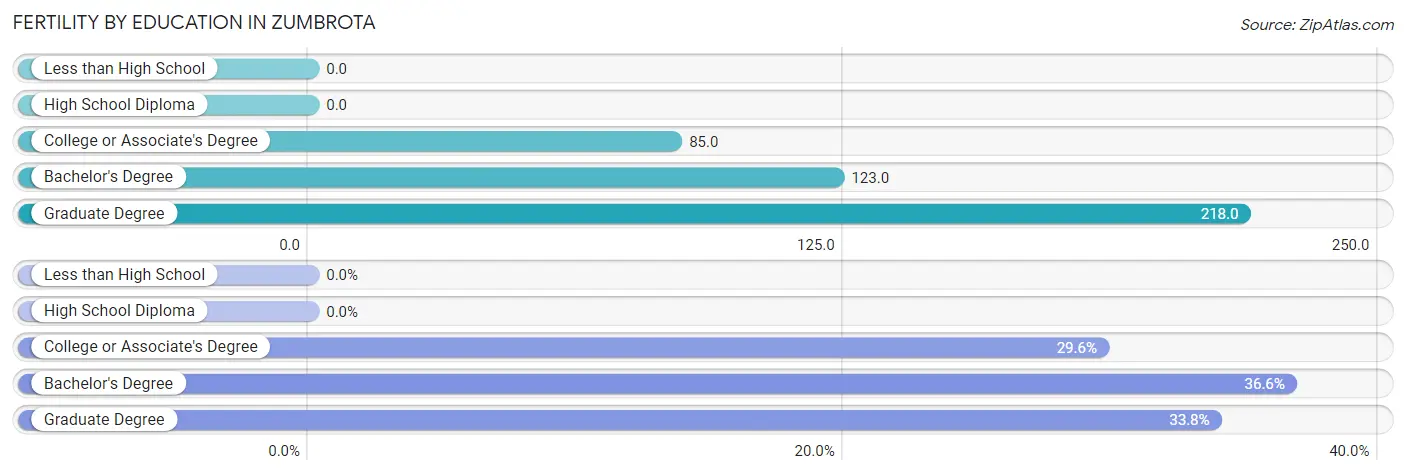
| Educational Attainment | Women with Births | Births / 1,000 Women |
| Less than High School | 0 (0.0%) | 0.0 |
| High School Diploma | 0 (0.0%) | 0.0 |
| College or Associate's Degree | 21 (29.6%) | 85.0 |
| Bachelor's Degree | 26 (36.6%) | 123.0 |
| Graduate Degree | 24 (33.8%) | 218.0 |
| Total | 71 (100.0%) | 96.0 |
Fertility by Education by Marriage Status in Zumbrota
36.6% of women with births in Zumbrota are unmarried. Women with the educational attainment of college or associate's degree are most likely to be married with 100.0% of them married at childbirth, while women with the educational attainment of bachelor's degree are least likely to be married with 100.0% of them unmarried at childbirth.
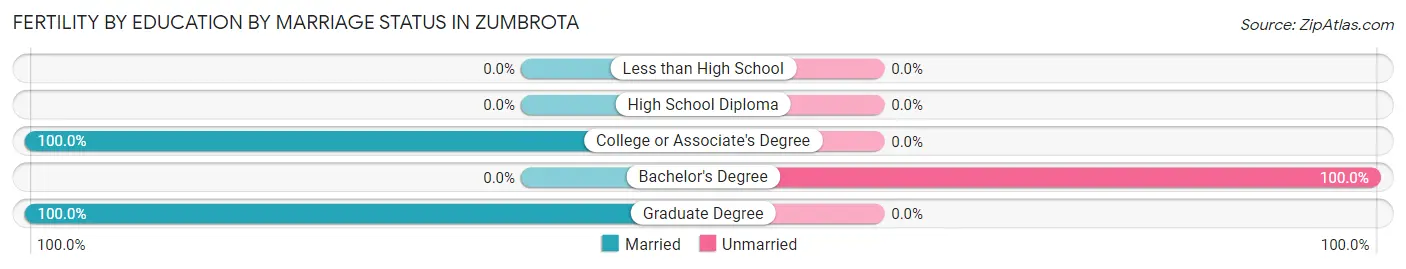
| Educational Attainment | Married | Unmarried |
| Less than High School | 0 (0.0%) | 0 (0.0%) |
| High School Diploma | 0 (0.0%) | 0 (0.0%) |
| College or Associate's Degree | 21 (100.0%) | 0 (0.0%) |
| Bachelor's Degree | 0 (0.0%) | 26 (100.0%) |
| Graduate Degree | 24 (100.0%) | 0 (0.0%) |
| Total | 45 (63.4%) | 26 (36.6%) |
Employment Characteristics in Zumbrota
Employment by Class of Employer in Zumbrota
Among the 2,015 employed individuals in Zumbrota, private company employees (1,046 | 51.9%), not-for-profit organizations (322 | 16.0%), and local government employees (321 | 15.9%) make up the most common classes of employment.
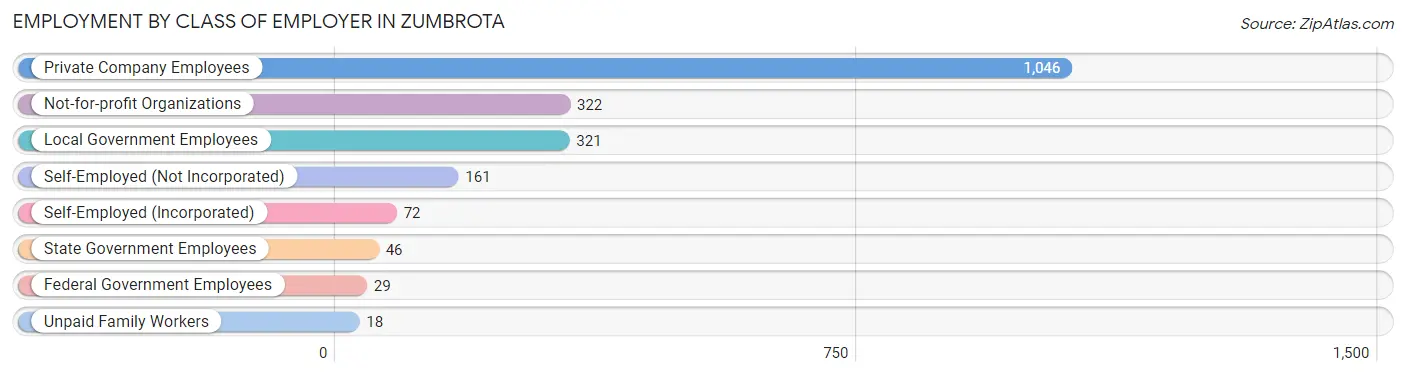
| Employer Class | # Employees | % Employees |
| Private Company Employees | 1,046 | 51.9% |
| Self-Employed (Incorporated) | 72 | 3.6% |
| Self-Employed (Not Incorporated) | 161 | 8.0% |
| Not-for-profit Organizations | 322 | 16.0% |
| Local Government Employees | 321 | 15.9% |
| State Government Employees | 46 | 2.3% |
| Federal Government Employees | 29 | 1.4% |
| Unpaid Family Workers | 18 | 0.9% |
| Total | 2,015 | 100.0% |
Employment Status by Age in Zumbrota
According to the labor force statistics for Zumbrota, out of the total population over 16 years of age (3,060), 67.7% or 2,072 individuals are in the labor force, with 2.8% or 58 of them unemployed. The age group with the highest labor force participation rate is 20 to 24 years, with 100.0% or 151 individuals in the labor force. Within the labor force, the 45 to 54 years age range has the highest percentage of unemployed individuals, with 7.2% or 29 of them being unemployed.
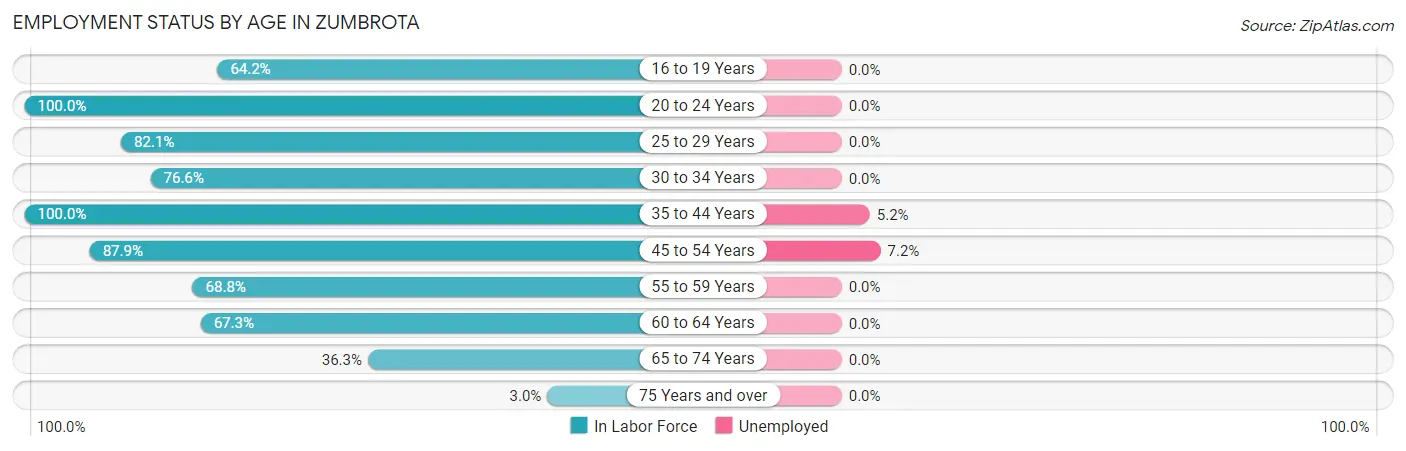
| Age Bracket | In Labor Force | Unemployed |
| 16 to 19 Years | 34 (64.2%) | 0 (0.0%) |
| 20 to 24 Years | 151 (100.0%) | 0 (0.0%) |
| 25 to 29 Years | 238 (82.1%) | 0 (0.0%) |
| 30 to 34 Years | 157 (76.6%) | 0 (0.0%) |
| 35 to 44 Years | 556 (100.0%) | 29 (5.2%) |
| 45 to 54 Years | 405 (87.9%) | 29 (7.2%) |
| 55 to 59 Years | 276 (68.8%) | 0 (0.0%) |
| 60 to 64 Years | 103 (67.3%) | 0 (0.0%) |
| 65 to 74 Years | 141 (36.3%) | 0 (0.0%) |
| 75 Years and over | 12 (3.0%) | 0 (0.0%) |
| Total | 2,072 (67.7%) | 58 (2.8%) |
Employment Status by Educational Attainment in Zumbrota
According to labor force statistics for Zumbrota, 84.0% of individuals (1,735) out of the total population between 25 and 64 years of age (2,066) are in the labor force, with 3.3% or 57 of them being unemployed. The group with the highest labor force participation rate are those with the educational attainment of bachelor's degree or higher, with 96.9% or 836 individuals in the labor force. Within the labor force, individuals with high school diploma education have the highest percentage of unemployment, with 16.1% or 58 of them being unemployed.
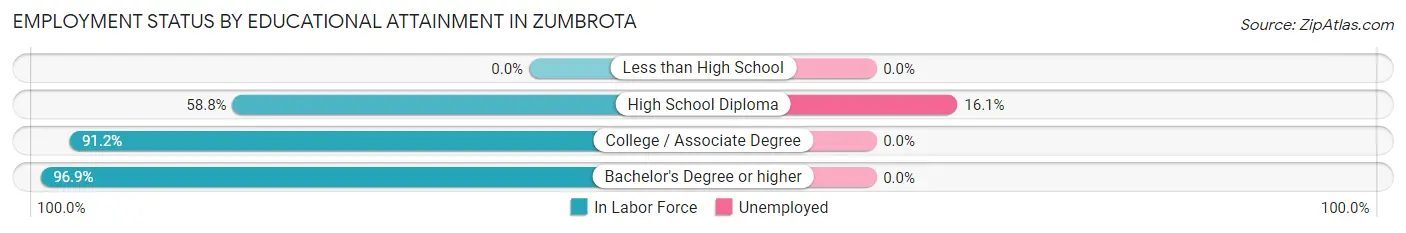
| Educational Attainment | In Labor Force | Unemployed |
| Less than High School | 0 (0.0%) | 0 (0.0%) |
| High School Diploma | 360 (58.8%) | 99 (16.1%) |
| College / Associate Degree | 539 (91.2%) | 0 (0.0%) |
| Bachelor's Degree or higher | 836 (96.9%) | 0 (0.0%) |
| Total | 1,735 (84.0%) | 68 (3.3%) |
Employment Occupations by Sex in Zumbrota
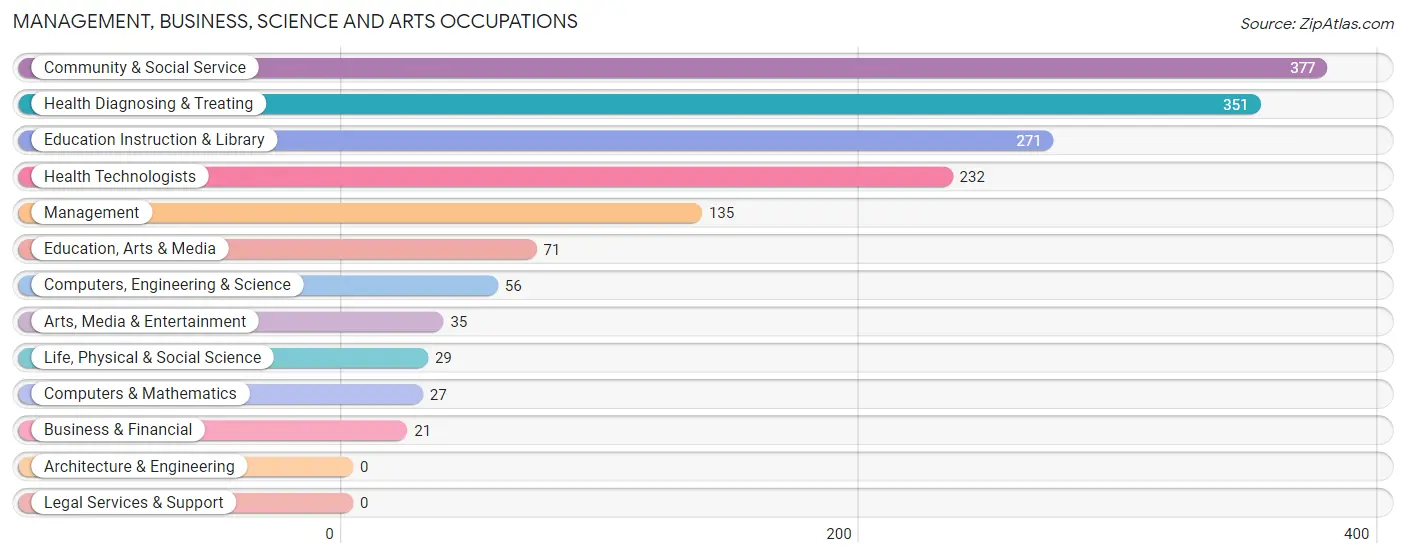
Management, Business, Science and Arts Occupations
The most common Management, Business, Science and Arts occupations in Zumbrota are Community & Social Service (377 | 18.7%), Health Diagnosing & Treating (351 | 17.4%), Education Instruction & Library (271 | 13.5%), Health Technologists (232 | 11.5%), and Management (135 | 6.7%).
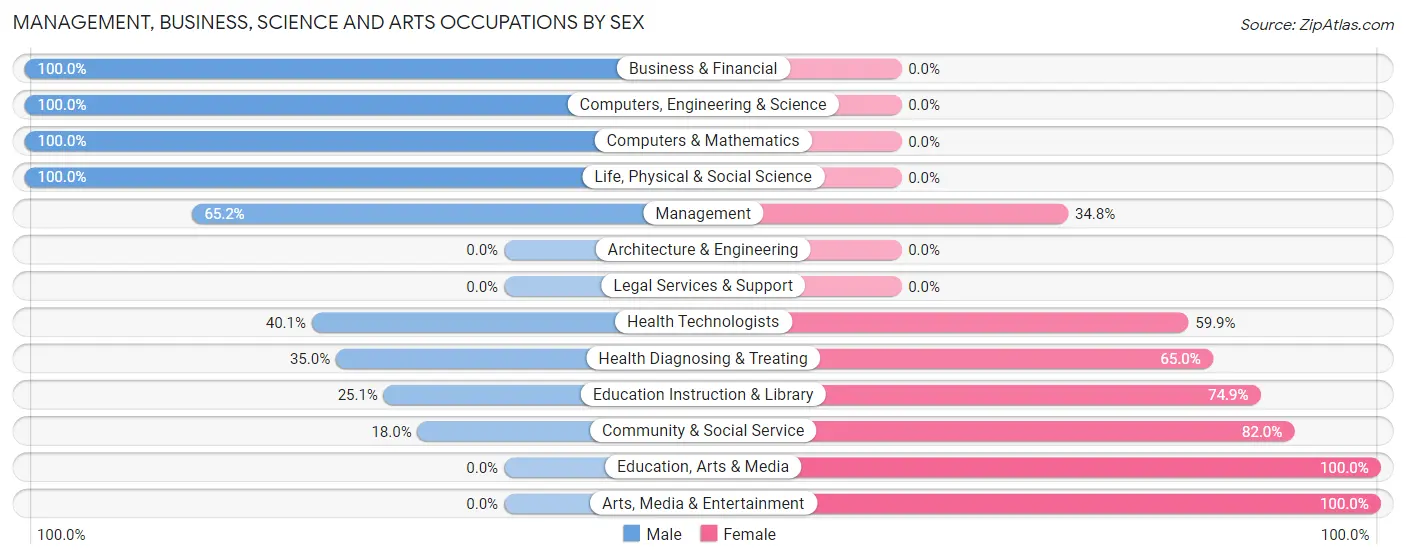
Management, Business, Science and Arts Occupations by Sex
Within the Management, Business, Science and Arts occupations in Zumbrota, the most male-oriented occupations are Business & Financial (100.0%), Computers, Engineering & Science (100.0%), and Computers & Mathematics (100.0%), while the most female-oriented occupations are Education, Arts & Media (100.0%), Arts, Media & Entertainment (100.0%), and Community & Social Service (82.0%).
| Occupation | Male | Female |
| Management | 88 (65.2%) | 47 (34.8%) |
| Business & Financial | 21 (100.0%) | 0 (0.0%) |
| Computers, Engineering & Science | 56 (100.0%) | 0 (0.0%) |
| Computers & Mathematics | 27 (100.0%) | 0 (0.0%) |
| Architecture & Engineering | 0 (0.0%) | 0 (0.0%) |
| Life, Physical & Social Science | 29 (100.0%) | 0 (0.0%) |
| Community & Social Service | 68 (18.0%) | 309 (82.0%) |
| Education, Arts & Media | 0 (0.0%) | 71 (100.0%) |
| Legal Services & Support | 0 (0.0%) | 0 (0.0%) |
| Education Instruction & Library | 68 (25.1%) | 203 (74.9%) |
| Arts, Media & Entertainment | 0 (0.0%) | 35 (100.0%) |
| Health Diagnosing & Treating | 123 (35.0%) | 228 (65.0%) |
| Health Technologists | 93 (40.1%) | 139 (59.9%) |
| Total (Category) | 356 (37.9%) | 584 (62.1%) |
| Total (Overall) | 1,034 (51.3%) | 981 (48.7%) |
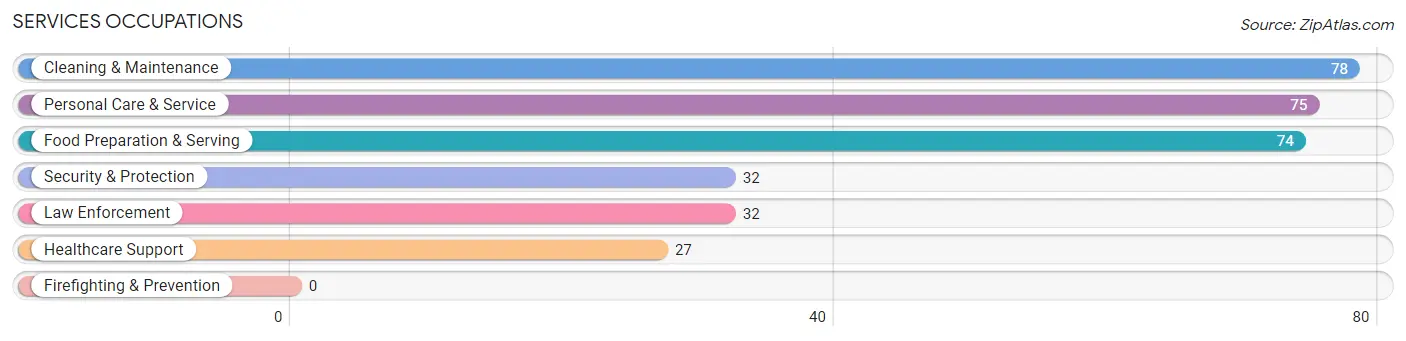
Services Occupations
The most common Services occupations in Zumbrota are Cleaning & Maintenance (78 | 3.9%), Personal Care & Service (75 | 3.7%), Food Preparation & Serving (74 | 3.7%), Security & Protection (32 | 1.6%), and Law Enforcement (32 | 1.6%).
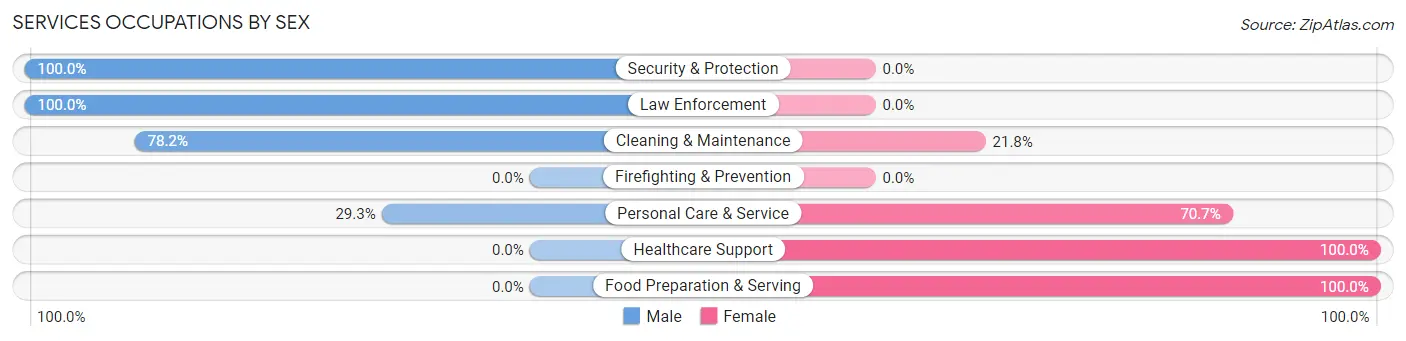
Services Occupations by Sex
Within the Services occupations in Zumbrota, the most male-oriented occupations are Security & Protection (100.0%), Law Enforcement (100.0%), and Cleaning & Maintenance (78.2%), while the most female-oriented occupations are Healthcare Support (100.0%), Food Preparation & Serving (100.0%), and Personal Care & Service (70.7%).
| Occupation | Male | Female |
| Healthcare Support | 0 (0.0%) | 27 (100.0%) |
| Security & Protection | 32 (100.0%) | 0 (0.0%) |
| Firefighting & Prevention | 0 (0.0%) | 0 (0.0%) |
| Law Enforcement | 32 (100.0%) | 0 (0.0%) |
| Food Preparation & Serving | 0 (0.0%) | 74 (100.0%) |
| Cleaning & Maintenance | 61 (78.2%) | 17 (21.8%) |
| Personal Care & Service | 22 (29.3%) | 53 (70.7%) |
| Total (Category) | 115 (40.2%) | 171 (59.8%) |
| Total (Overall) | 1,034 (51.3%) | 981 (48.7%) |
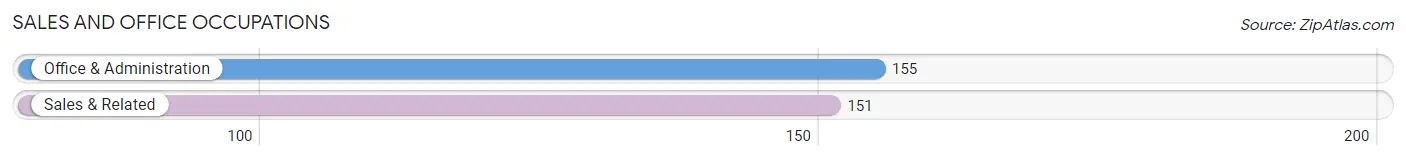
Sales and Office Occupations
The most common Sales and Office occupations in Zumbrota are Office & Administration (155 | 7.7%), and Sales & Related (151 | 7.5%).
Sales and Office Occupations by Sex
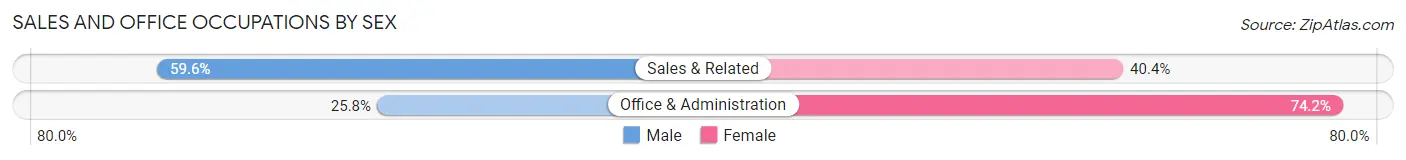
| Occupation | Male | Female |
| Sales & Related | 90 (59.6%) | 61 (40.4%) |
| Office & Administration | 40 (25.8%) | 115 (74.2%) |
| Total (Category) | 130 (42.5%) | 176 (57.5%) |
| Total (Overall) | 1,034 (51.3%) | 981 (48.7%) |
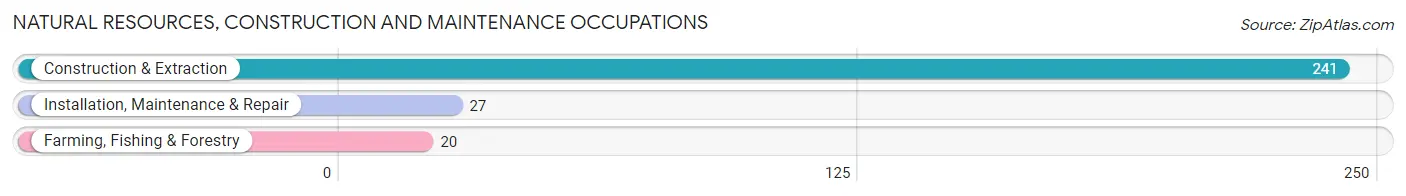
Natural Resources, Construction and Maintenance Occupations
The most common Natural Resources, Construction and Maintenance occupations in Zumbrota are Construction & Extraction (241 | 12.0%), Installation, Maintenance & Repair (27 | 1.3%), and Farming, Fishing & Forestry (20 | 1.0%).
Natural Resources, Construction and Maintenance Occupations by Sex
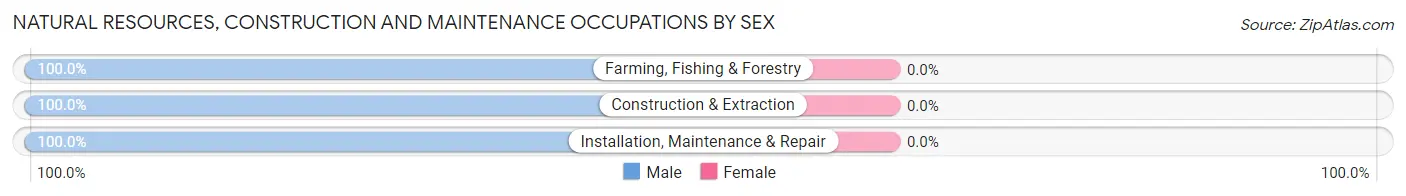
| Occupation | Male | Female |
| Farming, Fishing & Forestry | 20 (100.0%) | 0 (0.0%) |
| Construction & Extraction | 241 (100.0%) | 0 (0.0%) |
| Installation, Maintenance & Repair | 27 (100.0%) | 0 (0.0%) |
| Total (Category) | 288 (100.0%) | 0 (0.0%) |
| Total (Overall) | 1,034 (51.3%) | 981 (48.7%) |
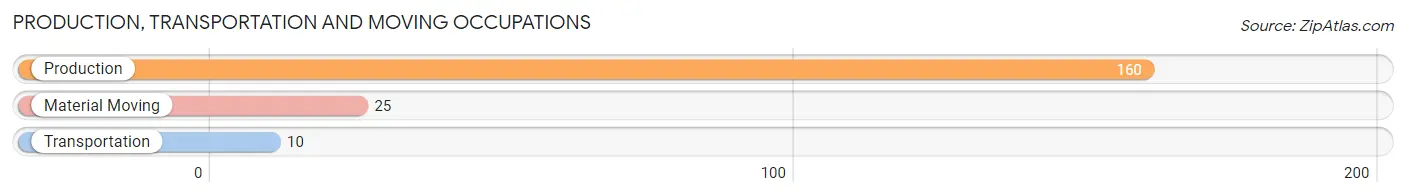
Production, Transportation and Moving Occupations
The most common Production, Transportation and Moving occupations in Zumbrota are Production (160 | 7.9%), Material Moving (25 | 1.2%), and Transportation (10 | 0.5%).
Production, Transportation and Moving Occupations by Sex
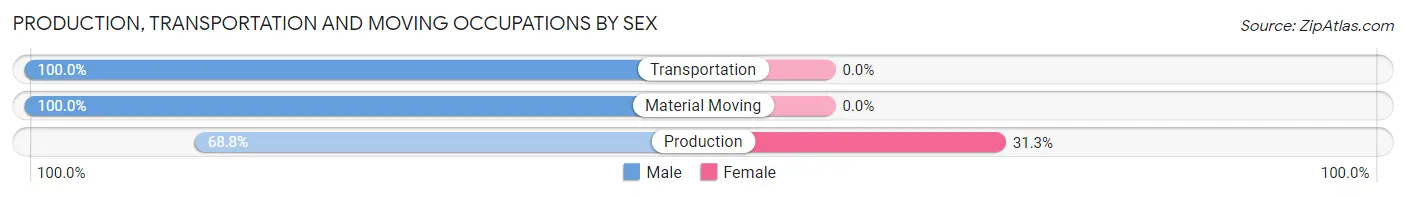
| Occupation | Male | Female |
| Production | 110 (68.8%) | 50 (31.2%) |
| Transportation | 10 (100.0%) | 0 (0.0%) |
| Material Moving | 25 (100.0%) | 0 (0.0%) |
| Total (Category) | 145 (74.4%) | 50 (25.6%) |
| Total (Overall) | 1,034 (51.3%) | 981 (48.7%) |
Employment Industries by Sex in Zumbrota
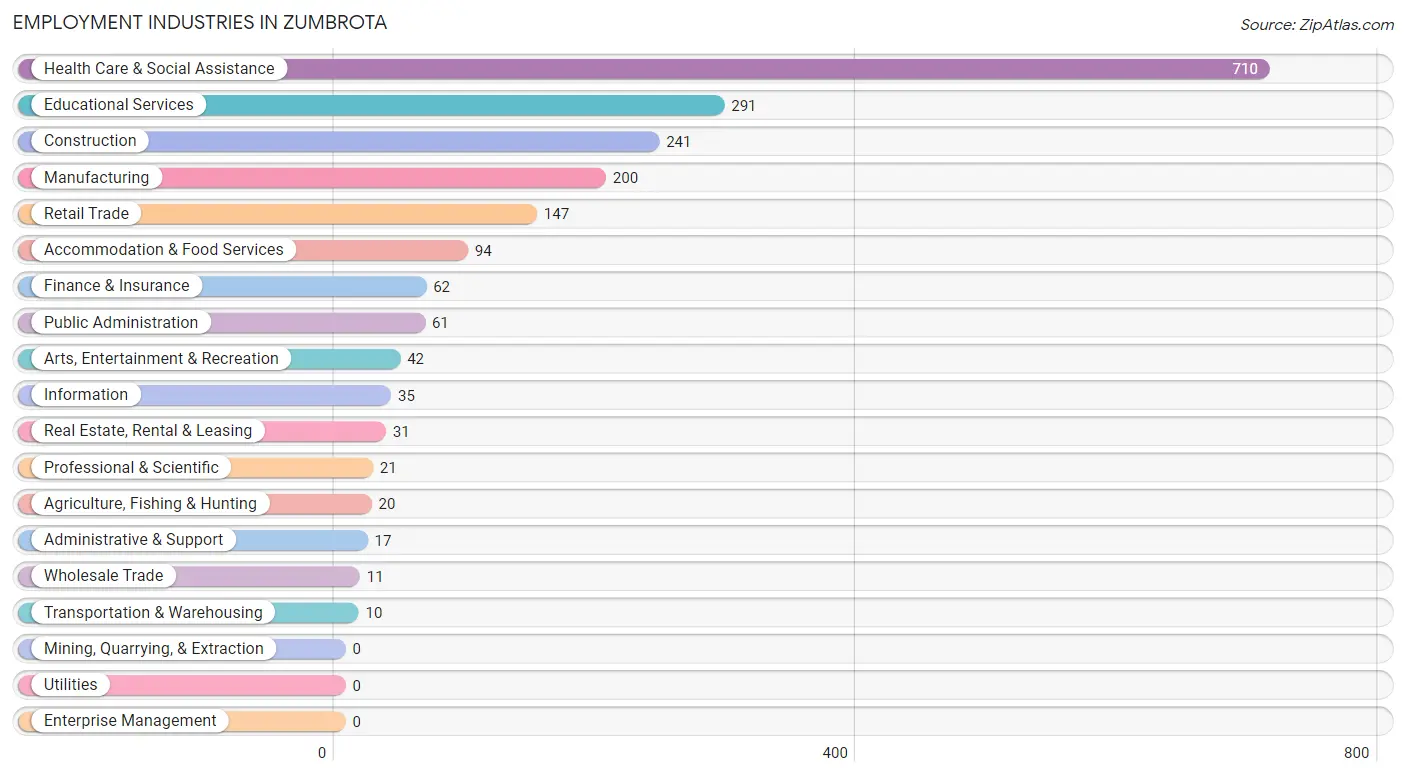
Employment Industries in Zumbrota
The major employment industries in Zumbrota include Health Care & Social Assistance (710 | 35.2%), Educational Services (291 | 14.4%), Construction (241 | 12.0%), Manufacturing (200 | 9.9%), and Retail Trade (147 | 7.3%).
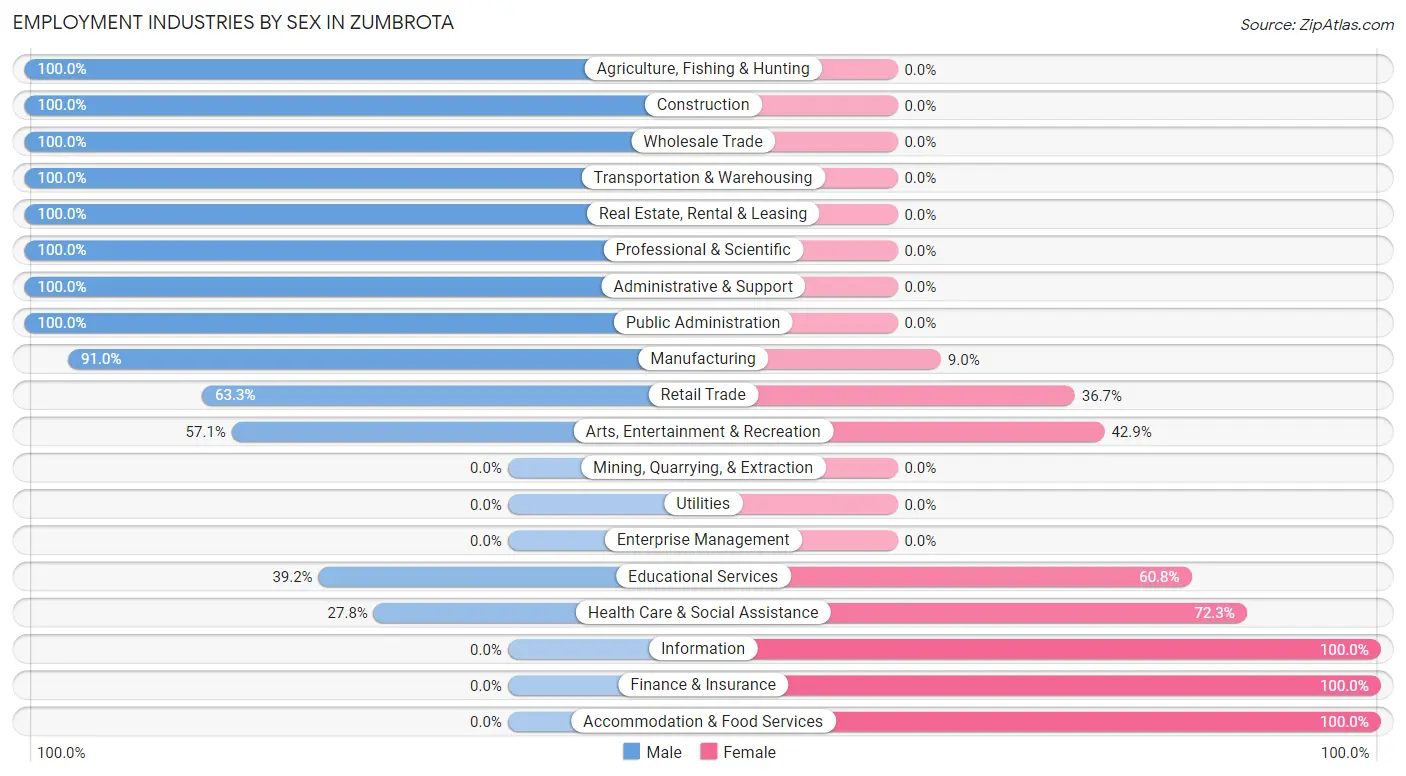
Employment Industries by Sex in Zumbrota
The Zumbrota industries that see more men than women are Agriculture, Fishing & Hunting (100.0%), Construction (100.0%), and Wholesale Trade (100.0%), whereas the industries that tend to have a higher number of women are Information (100.0%), Finance & Insurance (100.0%), and Accommodation & Food Services (100.0%).
| Industry | Male | Female |
| Agriculture, Fishing & Hunting | 20 (100.0%) | 0 (0.0%) |
| Mining, Quarrying, & Extraction | 0 (0.0%) | 0 (0.0%) |
| Construction | 241 (100.0%) | 0 (0.0%) |
| Manufacturing | 182 (91.0%) | 18 (9.0%) |
| Wholesale Trade | 11 (100.0%) | 0 (0.0%) |
| Retail Trade | 93 (63.3%) | 54 (36.7%) |
| Transportation & Warehousing | 10 (100.0%) | 0 (0.0%) |
| Utilities | 0 (0.0%) | 0 (0.0%) |
| Information | 0 (0.0%) | 35 (100.0%) |
| Finance & Insurance | 0 (0.0%) | 62 (100.0%) |
| Real Estate, Rental & Leasing | 31 (100.0%) | 0 (0.0%) |
| Professional & Scientific | 21 (100.0%) | 0 (0.0%) |
| Enterprise Management | 0 (0.0%) | 0 (0.0%) |
| Administrative & Support | 17 (100.0%) | 0 (0.0%) |
| Educational Services | 114 (39.2%) | 177 (60.8%) |
| Health Care & Social Assistance | 197 (27.8%) | 513 (72.3%) |
| Arts, Entertainment & Recreation | 24 (57.1%) | 18 (42.9%) |
| Accommodation & Food Services | 0 (0.0%) | 94 (100.0%) |
| Public Administration | 61 (100.0%) | 0 (0.0%) |
| Total | 1,034 (51.3%) | 981 (48.7%) |
Education in Zumbrota
School Enrollment in Zumbrota
The most common levels of schooling among the 647 students in Zumbrota are middle school (274 | 42.3%), elementary school (191 | 29.5%), and high school (96 | 14.8%).
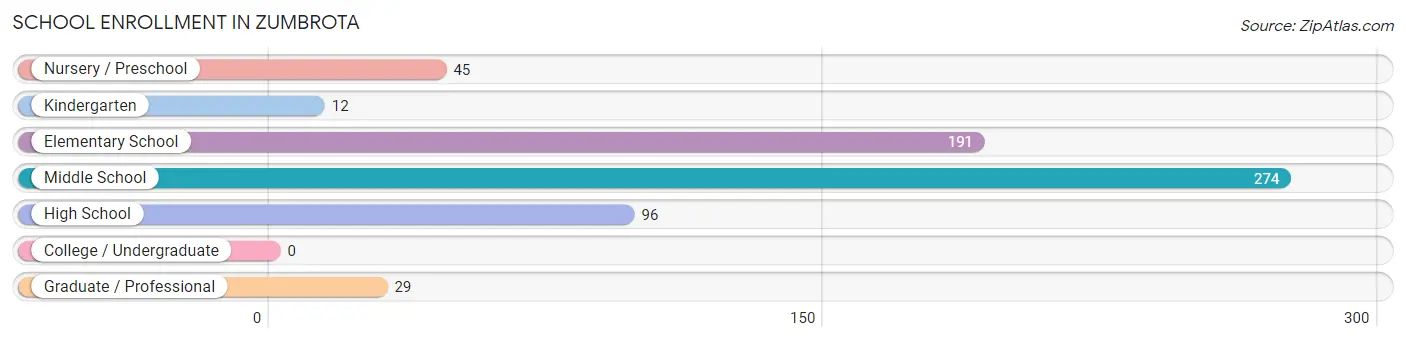
| School Level | # Students | % Students |
| Nursery / Preschool | 45 | 7.0% |
| Kindergarten | 12 | 1.8% |
| Elementary School | 191 | 29.5% |
| Middle School | 274 | 42.3% |
| High School | 96 | 14.8% |
| College / Undergraduate | 0 | 0.0% |
| Graduate / Professional | 29 | 4.5% |
| Total | 647 | 100.0% |
School Enrollment by Age by Funding Source in Zumbrota
Out of a total of 647 students who are enrolled in schools in Zumbrota, 49 (7.6%) attend a private institution, while the remaining 598 (92.4%) are enrolled in public schools. The age group of 20 to 24 year olds has the highest likelihood of being enrolled in private schools, with 29 (40.3% in the age bracket) enrolled. Conversely, the age group of 3 to 4 year olds has the lowest likelihood of being enrolled in a private school, with 45 (100.0% in the age bracket) attending a public institution.
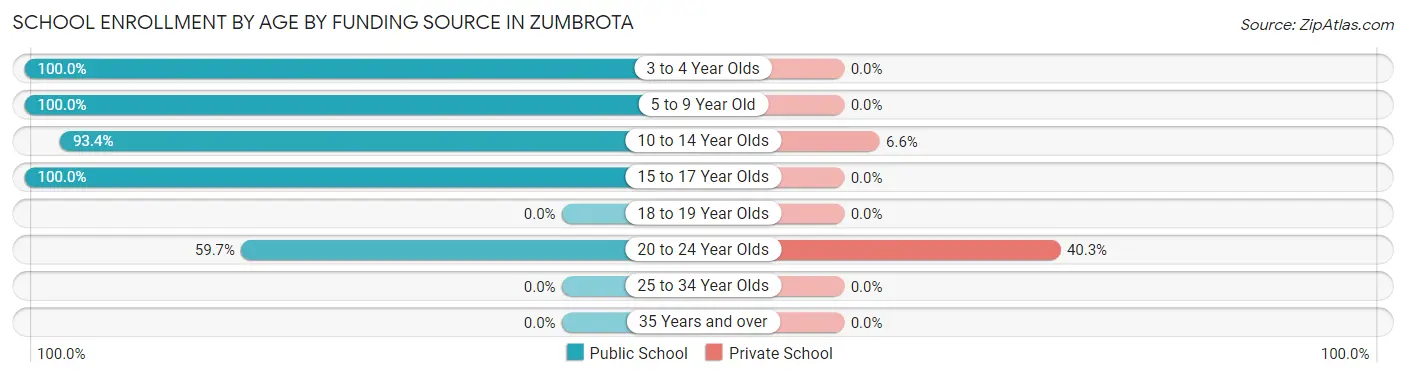
| Age Bracket | Public School | Private School |
| 3 to 4 Year Olds | 45 (100.0%) | 0 (0.0%) |
| 5 to 9 Year Old | 174 (100.0%) | 0 (0.0%) |
| 10 to 14 Year Olds | 283 (93.4%) | 20 (6.6%) |
| 15 to 17 Year Olds | 53 (100.0%) | 0 (0.0%) |
| 18 to 19 Year Olds | 0 (0.0%) | 0 (0.0%) |
| 20 to 24 Year Olds | 43 (59.7%) | 29 (40.3%) |
| 25 to 34 Year Olds | 0 (0.0%) | 0 (0.0%) |
| 35 Years and over | 0 (0.0%) | 0 (0.0%) |
| Total | 598 (92.4%) | 49 (7.6%) |
Educational Attainment by Field of Study in Zumbrota
Science & technology (334 | 30.2%), education (258 | 23.4%), business (103 | 9.3%), arts & humanities (93 | 8.4%), and bio, nature & agricultural (91 | 8.2%) are the most common fields of study among 1,105 individuals in Zumbrota who have obtained a bachelor's degree or higher.
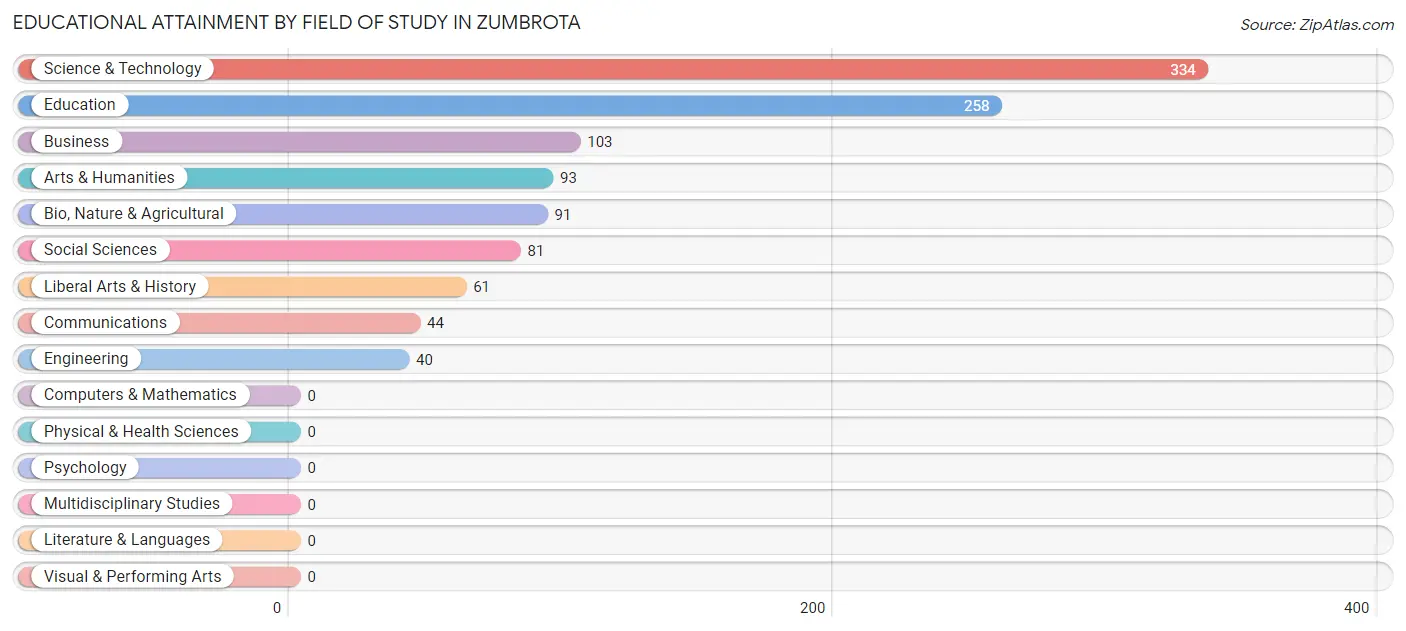
| Field of Study | # Graduates | % Graduates |
| Computers & Mathematics | 0 | 0.0% |
| Bio, Nature & Agricultural | 91 | 8.2% |
| Physical & Health Sciences | 0 | 0.0% |
| Psychology | 0 | 0.0% |
| Social Sciences | 81 | 7.3% |
| Engineering | 40 | 3.6% |
| Multidisciplinary Studies | 0 | 0.0% |
| Science & Technology | 334 | 30.2% |
| Business | 103 | 9.3% |
| Education | 258 | 23.4% |
| Literature & Languages | 0 | 0.0% |
| Liberal Arts & History | 61 | 5.5% |
| Visual & Performing Arts | 0 | 0.0% |
| Communications | 44 | 4.0% |
| Arts & Humanities | 93 | 8.4% |
| Total | 1,105 | 100.0% |
Transportation & Commute in Zumbrota
Vehicle Availability by Sex in Zumbrota
The most prevalent vehicle ownership categories in Zumbrota are males with 2 vehicles (506, accounting for 48.9%) and females with 2 vehicles (533, making up 51.6%).
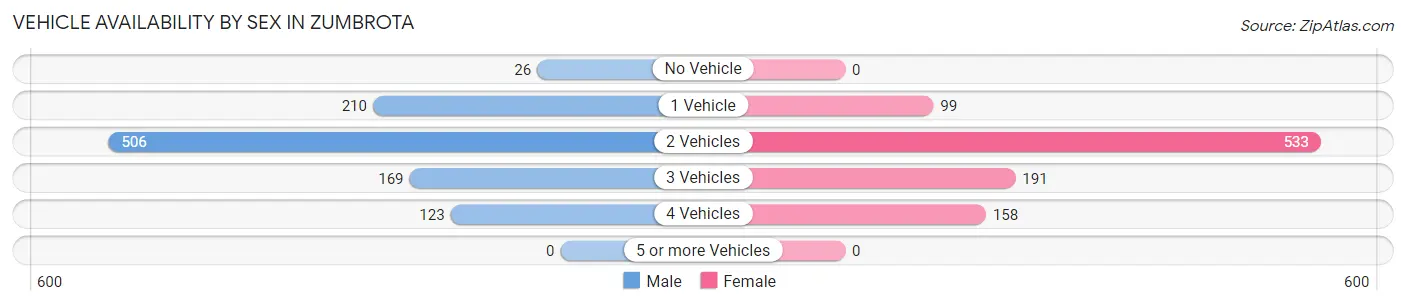
| Vehicles Available | Male | Female |
| No Vehicle | 26 (2.5%) | 0 (0.0%) |
| 1 Vehicle | 210 (20.3%) | 99 (10.1%) |
| 2 Vehicles | 506 (48.9%) | 533 (54.3%) |
| 3 Vehicles | 169 (16.3%) | 191 (19.5%) |
| 4 Vehicles | 123 (11.9%) | 158 (16.1%) |
| 5 or more Vehicles | 0 (0.0%) | 0 (0.0%) |
| Total | 1,034 (100.0%) | 981 (100.0%) |
Commute Time in Zumbrota
The most frequently occuring commute durations in Zumbrota are 30 to 34 minutes (490 commuters, 26.0%), 5 to 9 minutes (300 commuters, 15.9%), and 20 to 24 minutes (231 commuters, 12.3%).
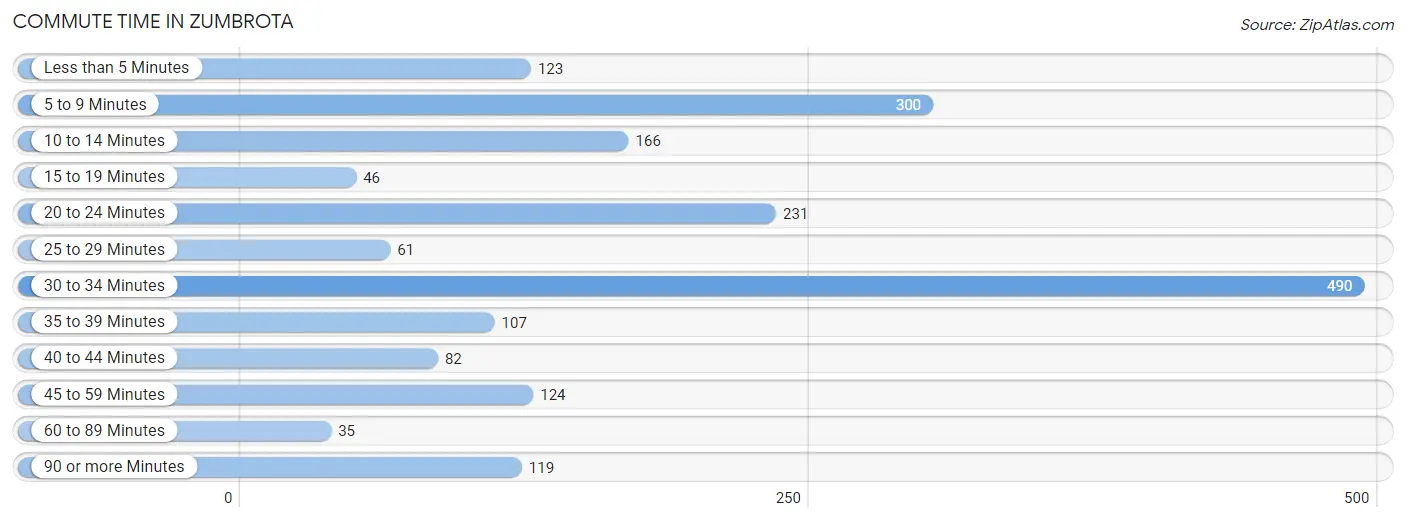
| Commute Time | # Commuters | % Commuters |
| Less than 5 Minutes | 123 | 6.5% |
| 5 to 9 Minutes | 300 | 15.9% |
| 10 to 14 Minutes | 166 | 8.8% |
| 15 to 19 Minutes | 46 | 2.4% |
| 20 to 24 Minutes | 231 | 12.3% |
| 25 to 29 Minutes | 61 | 3.2% |
| 30 to 34 Minutes | 490 | 26.0% |
| 35 to 39 Minutes | 107 | 5.7% |
| 40 to 44 Minutes | 82 | 4.3% |
| 45 to 59 Minutes | 124 | 6.6% |
| 60 to 89 Minutes | 35 | 1.9% |
| 90 or more Minutes | 119 | 6.3% |
Commute Time by Sex in Zumbrota
The most common commute times in Zumbrota are 30 to 34 minutes (264 commuters, 27.2%) for males and 30 to 34 minutes (226 commuters, 24.7%) for females.
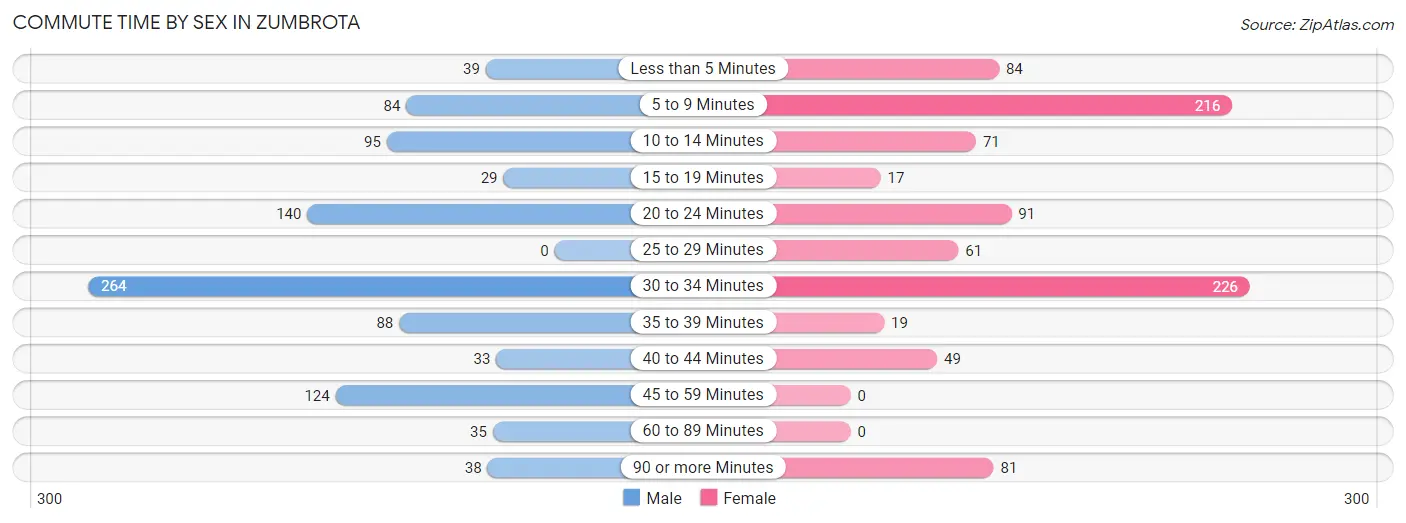
| Commute Time | Male | Female |
| Less than 5 Minutes | 39 (4.0%) | 84 (9.2%) |
| 5 to 9 Minutes | 84 (8.7%) | 216 (23.6%) |
| 10 to 14 Minutes | 95 (9.8%) | 71 (7.8%) |
| 15 to 19 Minutes | 29 (3.0%) | 17 (1.9%) |
| 20 to 24 Minutes | 140 (14.4%) | 91 (10.0%) |
| 25 to 29 Minutes | 0 (0.0%) | 61 (6.7%) |
| 30 to 34 Minutes | 264 (27.2%) | 226 (24.7%) |
| 35 to 39 Minutes | 88 (9.1%) | 19 (2.1%) |
| 40 to 44 Minutes | 33 (3.4%) | 49 (5.4%) |
| 45 to 59 Minutes | 124 (12.8%) | 0 (0.0%) |
| 60 to 89 Minutes | 35 (3.6%) | 0 (0.0%) |
| 90 or more Minutes | 38 (3.9%) | 81 (8.8%) |
Time of Departure to Work by Sex in Zumbrota
The most frequent times of departure to work in Zumbrota are 6:00 AM to 6:29 AM (229, 23.6%) for males and 7:00 AM to 7:29 AM (251, 27.4%) for females.
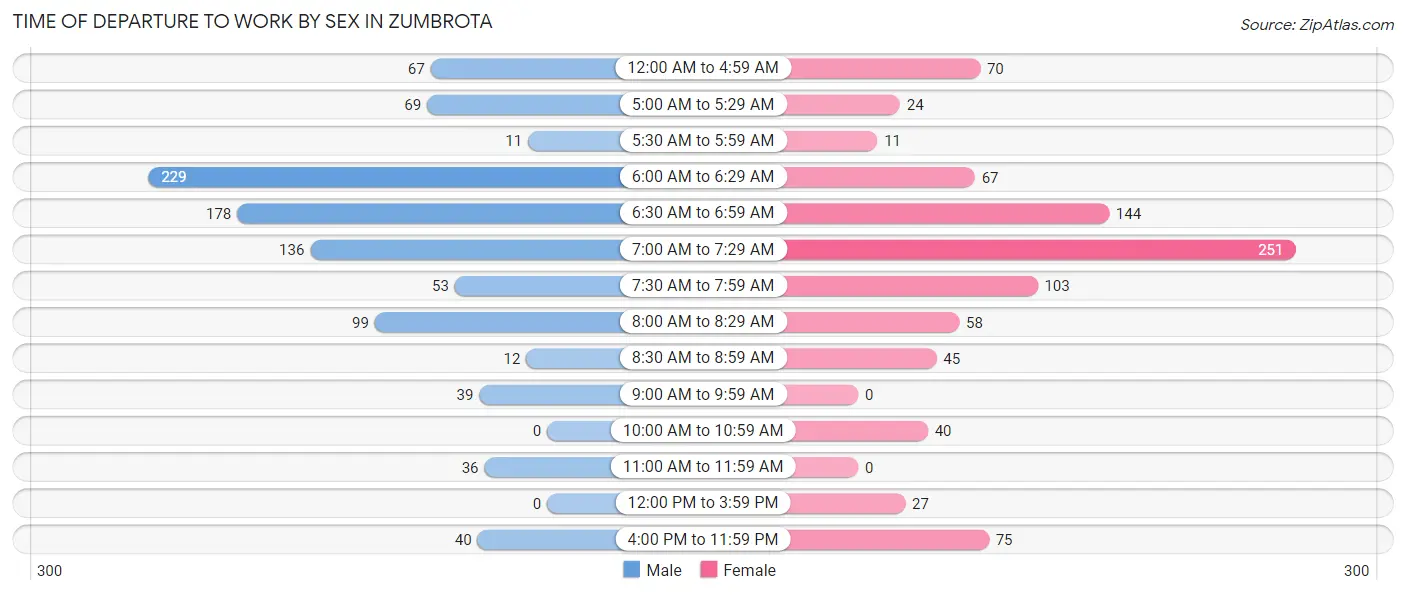
| Time of Departure | Male | Female |
| 12:00 AM to 4:59 AM | 67 (6.9%) | 70 (7.6%) |
| 5:00 AM to 5:29 AM | 69 (7.1%) | 24 (2.6%) |
| 5:30 AM to 5:59 AM | 11 (1.1%) | 11 (1.2%) |
| 6:00 AM to 6:29 AM | 229 (23.6%) | 67 (7.3%) |
| 6:30 AM to 6:59 AM | 178 (18.4%) | 144 (15.7%) |
| 7:00 AM to 7:29 AM | 136 (14.0%) | 251 (27.4%) |
| 7:30 AM to 7:59 AM | 53 (5.5%) | 103 (11.3%) |
| 8:00 AM to 8:29 AM | 99 (10.2%) | 58 (6.3%) |
| 8:30 AM to 8:59 AM | 12 (1.2%) | 45 (4.9%) |
| 9:00 AM to 9:59 AM | 39 (4.0%) | 0 (0.0%) |
| 10:00 AM to 10:59 AM | 0 (0.0%) | 40 (4.4%) |
| 11:00 AM to 11:59 AM | 36 (3.7%) | 0 (0.0%) |
| 12:00 PM to 3:59 PM | 0 (0.0%) | 27 (2.9%) |
| 4:00 PM to 11:59 PM | 40 (4.1%) | 75 (8.2%) |
| Total | 969 (100.0%) | 915 (100.0%) |
Housing Occupancy in Zumbrota
Occupancy by Ownership in Zumbrota
Of the total 1,690 dwellings in Zumbrota, owner-occupied units account for 1,284 (76.0%), while renter-occupied units make up 406 (24.0%).
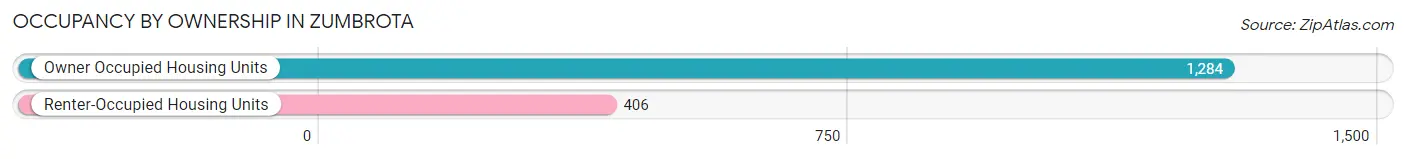
| Occupancy | # Housing Units | % Housing Units |
| Owner Occupied Housing Units | 1,284 | 76.0% |
| Renter-Occupied Housing Units | 406 | 24.0% |
| Total Occupied Housing Units | 1,690 | 100.0% |
Occupancy by Household Size in Zumbrota
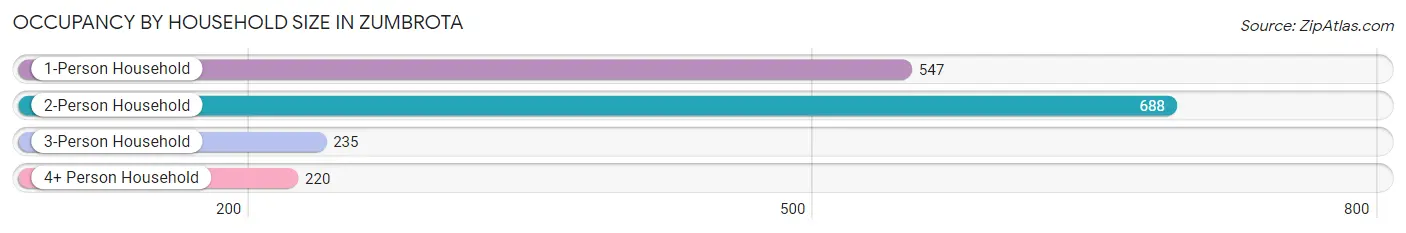
| Household Size | # Housing Units | % Housing Units |
| 1-Person Household | 547 | 32.4% |
| 2-Person Household | 688 | 40.7% |
| 3-Person Household | 235 | 13.9% |
| 4+ Person Household | 220 | 13.0% |
| Total Housing Units | 1,690 | 100.0% |
Occupancy by Ownership by Household Size in Zumbrota
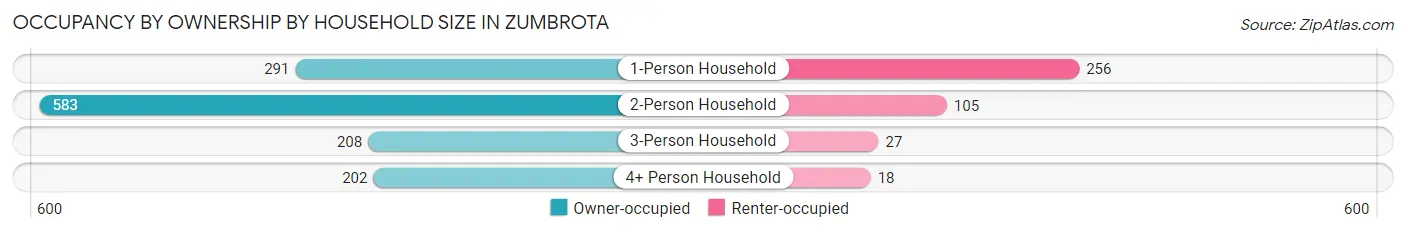
| Household Size | Owner-occupied | Renter-occupied |
| 1-Person Household | 291 (53.2%) | 256 (46.8%) |
| 2-Person Household | 583 (84.7%) | 105 (15.3%) |
| 3-Person Household | 208 (88.5%) | 27 (11.5%) |
| 4+ Person Household | 202 (91.8%) | 18 (8.2%) |
| Total Housing Units | 1,284 (76.0%) | 406 (24.0%) |
Occupancy by Educational Attainment in Zumbrota
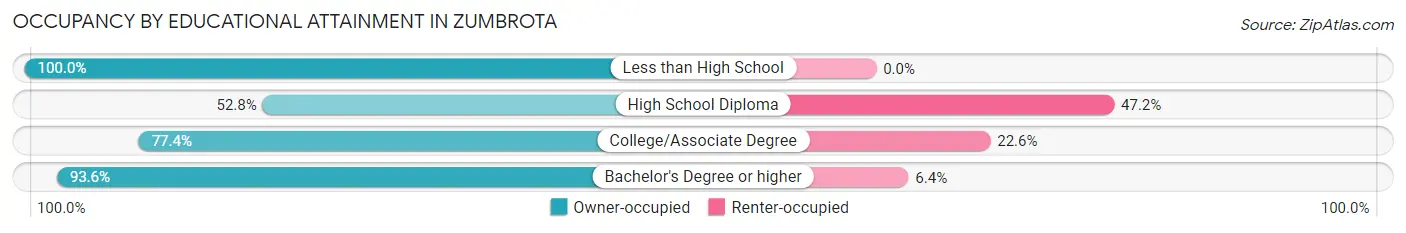
| Household Size | Owner-occupied | Renter-occupied |
| Less than High School | 30 (100.0%) | 0 (0.0%) |
| High School Diploma | 262 (52.8%) | 234 (47.2%) |
| College/Associate Degree | 465 (77.4%) | 136 (22.6%) |
| Bachelor's Degree or higher | 527 (93.6%) | 36 (6.4%) |
Occupancy by Age of Householder in Zumbrota
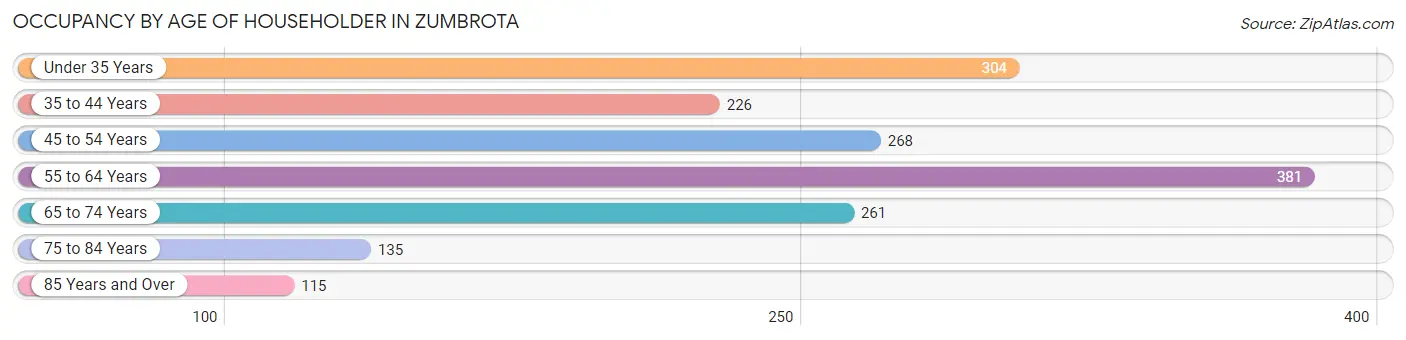
| Age Bracket | # Households | % Households |
| Under 35 Years | 304 | 18.0% |
| 35 to 44 Years | 226 | 13.4% |
| 45 to 54 Years | 268 | 15.9% |
| 55 to 64 Years | 381 | 22.5% |
| 65 to 74 Years | 261 | 15.4% |
| 75 to 84 Years | 135 | 8.0% |
| 85 Years and Over | 115 | 6.8% |
| Total | 1,690 | 100.0% |
Housing Finances in Zumbrota
Median Income by Occupancy in Zumbrota
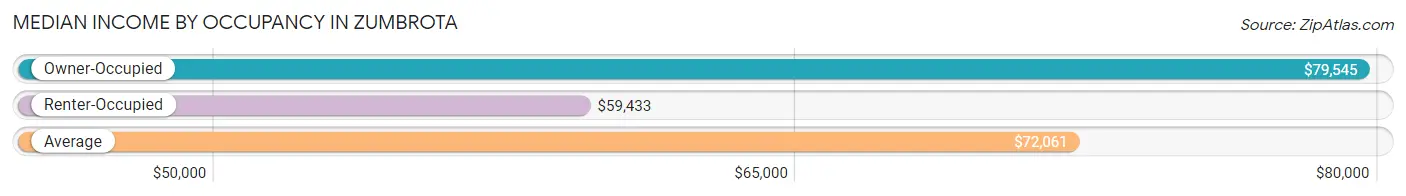
| Occupancy Type | # Households | Median Income |
| Owner-Occupied | 1,284 (76.0%) | $79,545 |
| Renter-Occupied | 406 (24.0%) | $59,433 |
| Average | 1,690 (100.0%) | $72,061 |
Occupancy by Householder Income Bracket in Zumbrota
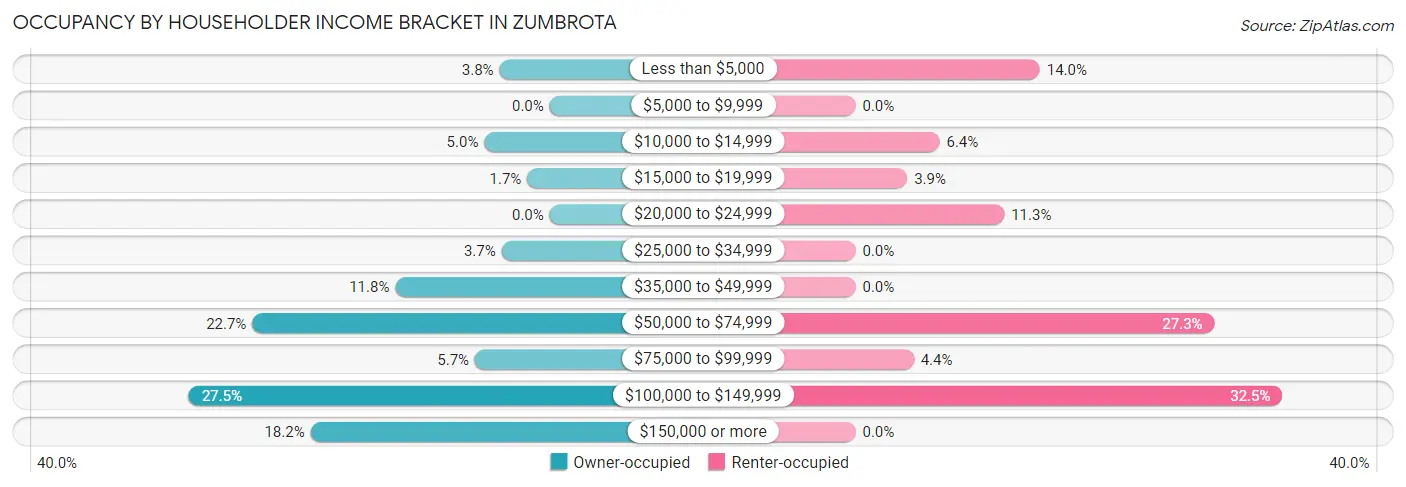
| Income Bracket | Owner-occupied | Renter-occupied |
| Less than $5,000 | 49 (3.8%) | 57 (14.0%) |
| $5,000 to $9,999 | 0 (0.0%) | 0 (0.0%) |
| $10,000 to $14,999 | 64 (5.0%) | 26 (6.4%) |
| $15,000 to $19,999 | 22 (1.7%) | 16 (3.9%) |
| $20,000 to $24,999 | 0 (0.0%) | 46 (11.3%) |
| $25,000 to $34,999 | 47 (3.7%) | 0 (0.0%) |
| $35,000 to $49,999 | 151 (11.8%) | 0 (0.0%) |
| $50,000 to $74,999 | 291 (22.7%) | 111 (27.3%) |
| $75,000 to $99,999 | 73 (5.7%) | 18 (4.4%) |
| $100,000 to $149,999 | 353 (27.5%) | 132 (32.5%) |
| $150,000 or more | 234 (18.2%) | 0 (0.0%) |
| Total | 1,284 (100.0%) | 406 (100.0%) |
Monthly Housing Cost Tiers in Zumbrota
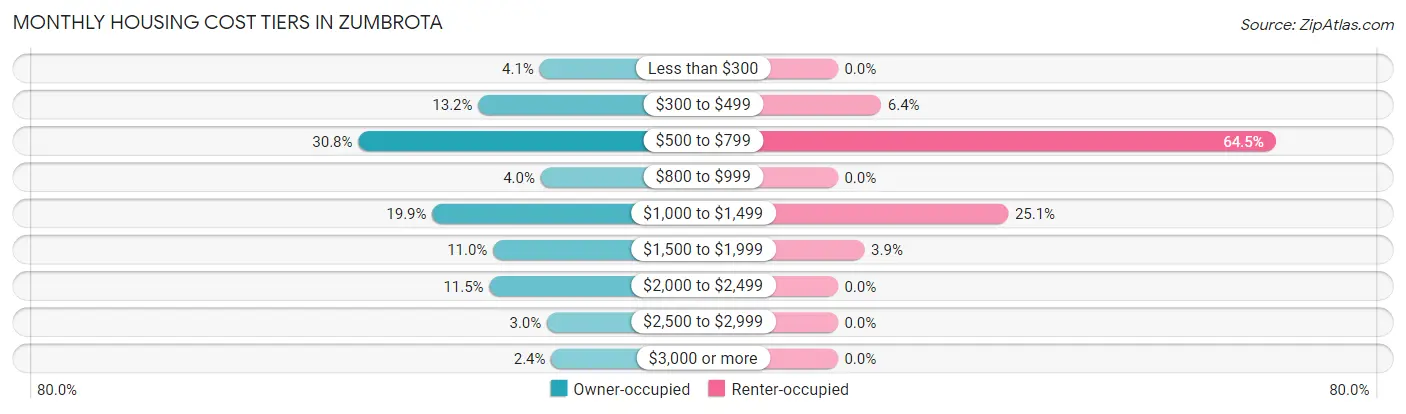
| Monthly Cost | Owner-occupied | Renter-occupied |
| Less than $300 | 53 (4.1%) | 0 (0.0%) |
| $300 to $499 | 169 (13.2%) | 26 (6.4%) |
| $500 to $799 | 396 (30.8%) | 262 (64.5%) |
| $800 to $999 | 51 (4.0%) | 0 (0.0%) |
| $1,000 to $1,499 | 256 (19.9%) | 102 (25.1%) |
| $1,500 to $1,999 | 141 (11.0%) | 16 (3.9%) |
| $2,000 to $2,499 | 148 (11.5%) | 0 (0.0%) |
| $2,500 to $2,999 | 39 (3.0%) | 0 (0.0%) |
| $3,000 or more | 31 (2.4%) | 0 (0.0%) |
| Total | 1,284 (100.0%) | 406 (100.0%) |
Physical Housing Characteristics in Zumbrota
Housing Structures in Zumbrota
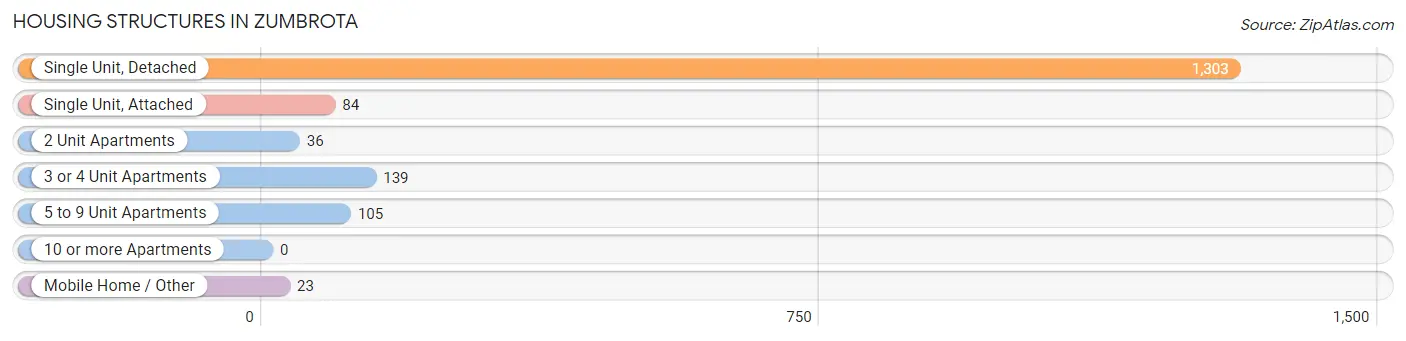
| Structure Type | # Housing Units | % Housing Units |
| Single Unit, Detached | 1,303 | 77.1% |
| Single Unit, Attached | 84 | 5.0% |
| 2 Unit Apartments | 36 | 2.1% |
| 3 or 4 Unit Apartments | 139 | 8.2% |
| 5 to 9 Unit Apartments | 105 | 6.2% |
| 10 or more Apartments | 0 | 0.0% |
| Mobile Home / Other | 23 | 1.4% |
| Total | 1,690 | 100.0% |
Housing Structures by Occupancy in Zumbrota
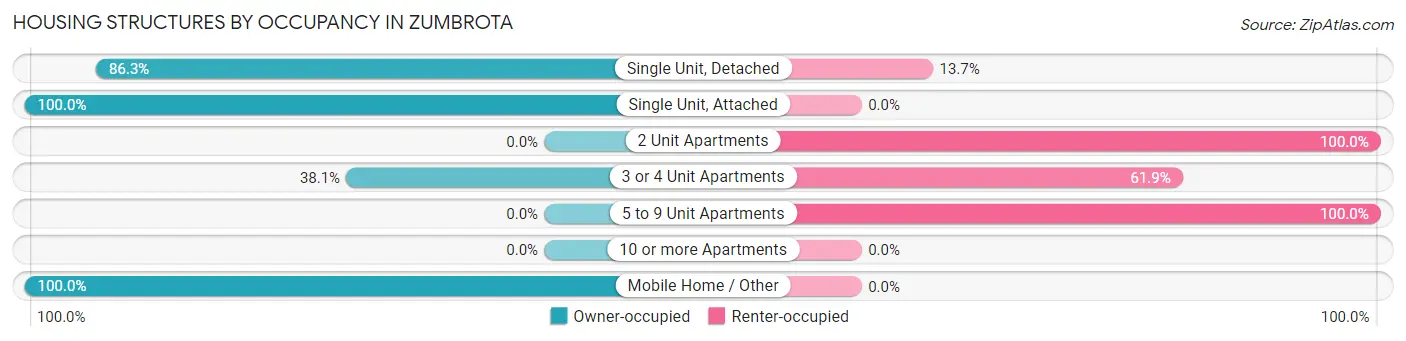
| Structure Type | Owner-occupied | Renter-occupied |
| Single Unit, Detached | 1,124 (86.3%) | 179 (13.7%) |
| Single Unit, Attached | 84 (100.0%) | 0 (0.0%) |
| 2 Unit Apartments | 0 (0.0%) | 36 (100.0%) |
| 3 or 4 Unit Apartments | 53 (38.1%) | 86 (61.9%) |
| 5 to 9 Unit Apartments | 0 (0.0%) | 105 (100.0%) |
| 10 or more Apartments | 0 (0.0%) | 0 (0.0%) |
| Mobile Home / Other | 23 (100.0%) | 0 (0.0%) |
| Total | 1,284 (76.0%) | 406 (24.0%) |
Housing Structures by Number of Rooms in Zumbrota
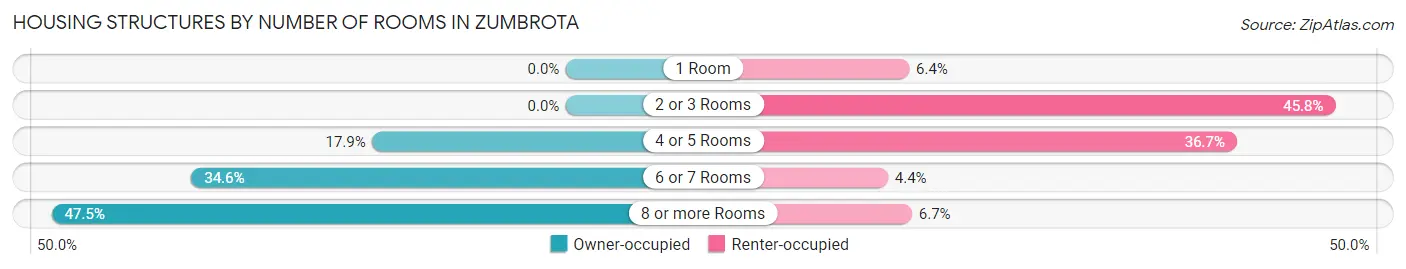
| Number of Rooms | Owner-occupied | Renter-occupied |
| 1 Room | 0 (0.0%) | 26 (6.4%) |
| 2 or 3 Rooms | 0 (0.0%) | 186 (45.8%) |
| 4 or 5 Rooms | 230 (17.9%) | 149 (36.7%) |
| 6 or 7 Rooms | 444 (34.6%) | 18 (4.4%) |
| 8 or more Rooms | 610 (47.5%) | 27 (6.7%) |
| Total | 1,284 (100.0%) | 406 (100.0%) |
Housing Structure by Heating Type in Zumbrota
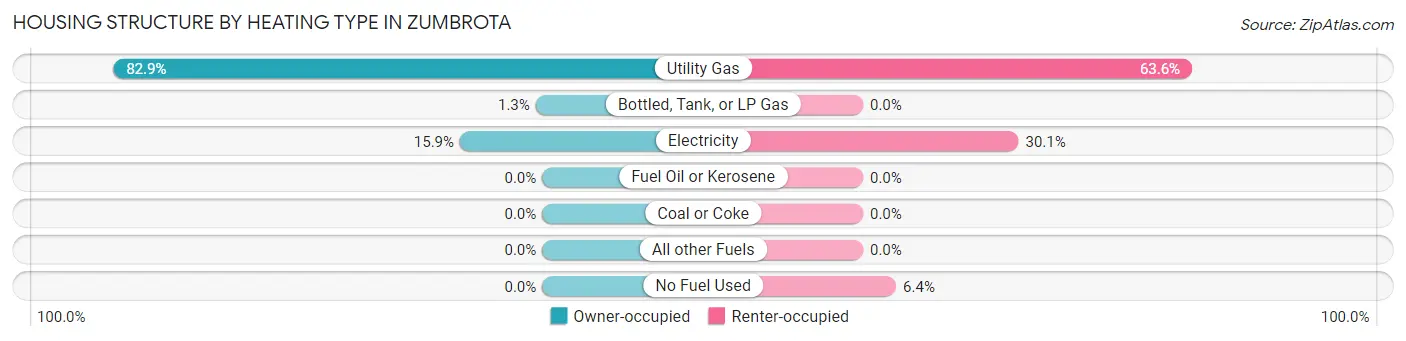
| Heating Type | Owner-occupied | Renter-occupied |
| Utility Gas | 1,064 (82.9%) | 258 (63.5%) |
| Bottled, Tank, or LP Gas | 16 (1.3%) | 0 (0.0%) |
| Electricity | 204 (15.9%) | 122 (30.0%) |
| Fuel Oil or Kerosene | 0 (0.0%) | 0 (0.0%) |
| Coal or Coke | 0 (0.0%) | 0 (0.0%) |
| All other Fuels | 0 (0.0%) | 0 (0.0%) |
| No Fuel Used | 0 (0.0%) | 26 (6.4%) |
| Total | 1,284 (100.0%) | 406 (100.0%) |
Household Vehicle Usage in Zumbrota
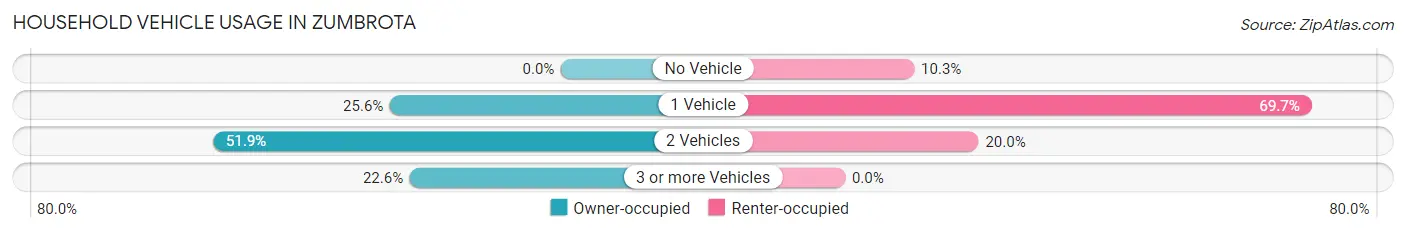
| Vehicles per Household | Owner-occupied | Renter-occupied |
| No Vehicle | 0 (0.0%) | 42 (10.3%) |
| 1 Vehicle | 328 (25.6%) | 283 (69.7%) |
| 2 Vehicles | 666 (51.9%) | 81 (20.0%) |
| 3 or more Vehicles | 290 (22.6%) | 0 (0.0%) |
| Total | 1,284 (100.0%) | 406 (100.0%) |
Real Estate & Mortgages in Zumbrota
Real Estate and Mortgage Overview in Zumbrota
| Characteristic | Without Mortgage | With Mortgage |
| Housing Units | 566 | 718 |
| Median Property Value | $241,100 | $236,800 |
| Median Household Income | $57,012 | $209 |
| Monthly Housing Costs | $614 | $31 |
| Real Estate Taxes | $2,894 | $0 |
Property Value by Mortgage Status in Zumbrota
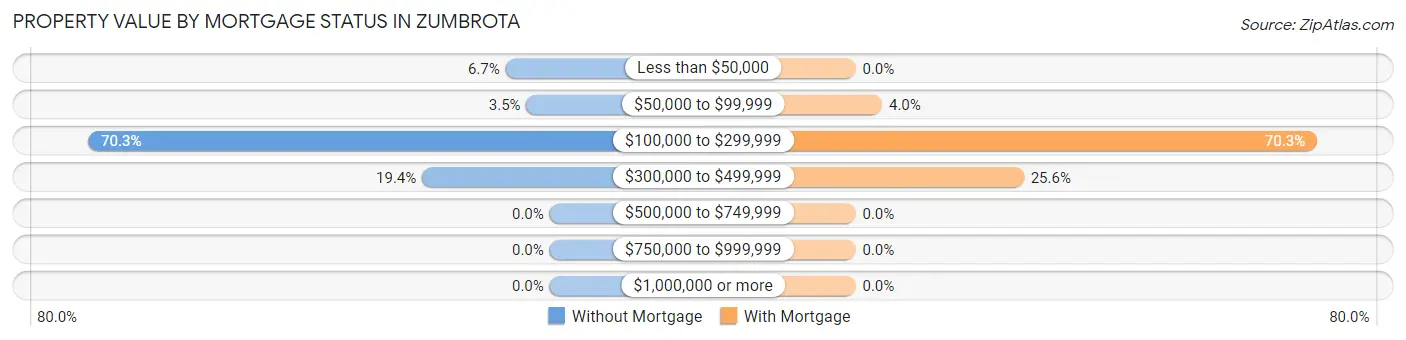
| Property Value | Without Mortgage | With Mortgage |
| Less than $50,000 | 38 (6.7%) | 0 (0.0%) |
| $50,000 to $99,999 | 20 (3.5%) | 29 (4.0%) |
| $100,000 to $299,999 | 398 (70.3%) | 505 (70.3%) |
| $300,000 to $499,999 | 110 (19.4%) | 184 (25.6%) |
| $500,000 to $749,999 | 0 (0.0%) | 0 (0.0%) |
| $750,000 to $999,999 | 0 (0.0%) | 0 (0.0%) |
| $1,000,000 or more | 0 (0.0%) | 0 (0.0%) |
| Total | 566 (100.0%) | 718 (100.0%) |
Household Income by Mortgage Status in Zumbrota
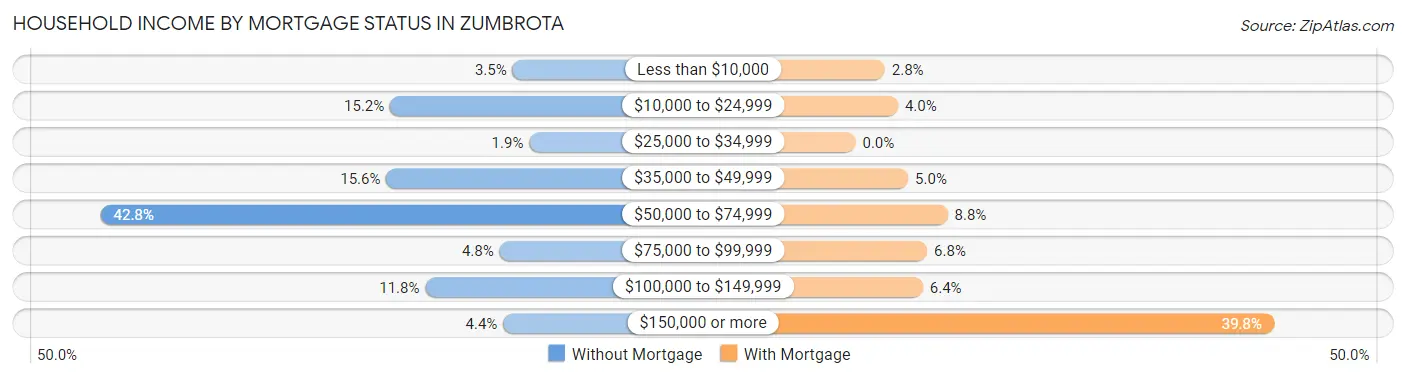
| Household Income | Without Mortgage | With Mortgage |
| Less than $10,000 | 20 (3.5%) | 20 (2.8%) |
| $10,000 to $24,999 | 86 (15.2%) | 29 (4.0%) |
| $25,000 to $34,999 | 11 (1.9%) | 0 (0.0%) |
| $35,000 to $49,999 | 88 (15.5%) | 36 (5.0%) |
| $50,000 to $74,999 | 242 (42.8%) | 63 (8.8%) |
| $75,000 to $99,999 | 27 (4.8%) | 49 (6.8%) |
| $100,000 to $149,999 | 67 (11.8%) | 46 (6.4%) |
| $150,000 or more | 25 (4.4%) | 286 (39.8%) |
| Total | 566 (100.0%) | 718 (100.0%) |
Property Value to Household Income Ratio in Zumbrota
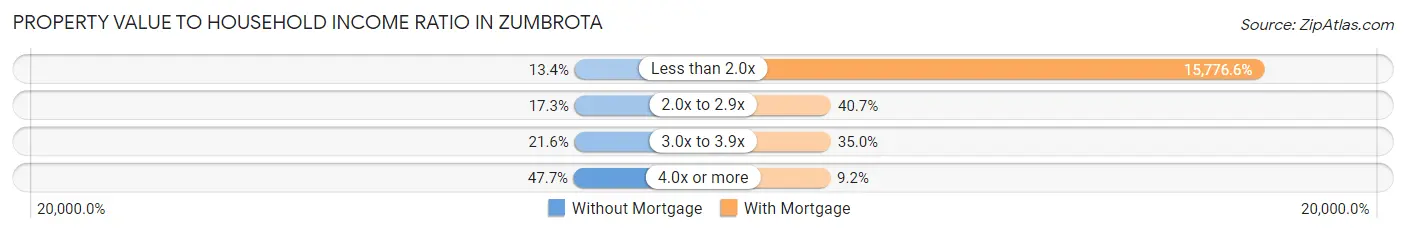
| Value-to-Income Ratio | Without Mortgage | With Mortgage |
| Less than 2.0x | 76 (13.4%) | 113,276 (15,776.6%) |
| 2.0x to 2.9x | 98 (17.3%) | 292 (40.7%) |
| 3.0x to 3.9x | 122 (21.5%) | 251 (35.0%) |
| 4.0x or more | 270 (47.7%) | 66 (9.2%) |
| Total | 566 (100.0%) | 718 (100.0%) |
Real Estate Taxes by Mortgage Status in Zumbrota
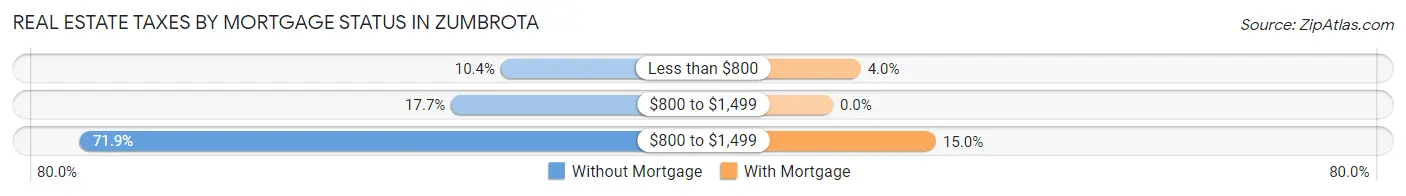
| Property Taxes | Without Mortgage | With Mortgage |
| Less than $800 | 59 (10.4%) | 29 (4.0%) |
| $800 to $1,499 | 100 (17.7%) | 0 (0.0%) |
| $800 to $1,499 | 407 (71.9%) | 108 (15.0%) |
| Total | 566 (100.0%) | 718 (100.0%) |
Health & Disability in Zumbrota
Health Insurance Coverage by Age in Zumbrota
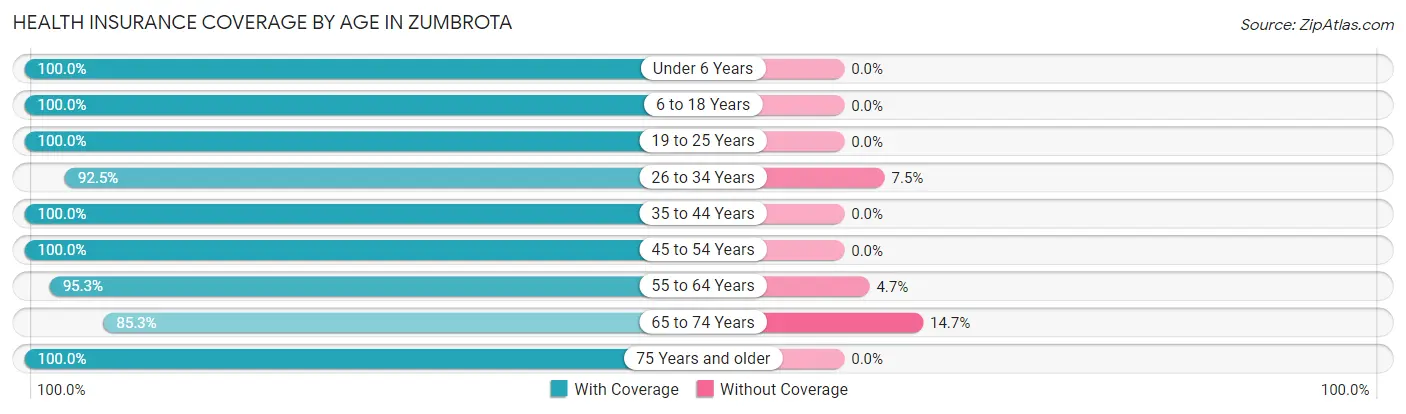
| Age Bracket | With Coverage | Without Coverage |
| Under 6 Years | 240 (100.0%) | 0 (0.0%) |
| 6 to 18 Years | 530 (100.0%) | 0 (0.0%) |
| 19 to 25 Years | 207 (100.0%) | 0 (0.0%) |
| 26 to 34 Years | 406 (92.5%) | 33 (7.5%) |
| 35 to 44 Years | 556 (100.0%) | 0 (0.0%) |
| 45 to 54 Years | 448 (100.0%) | 0 (0.0%) |
| 55 to 64 Years | 528 (95.3%) | 26 (4.7%) |
| 65 to 74 Years | 331 (85.3%) | 57 (14.7%) |
| 75 Years and older | 367 (100.0%) | 0 (0.0%) |
| Total | 3,613 (96.9%) | 116 (3.1%) |
Health Insurance Coverage by Citizenship Status in Zumbrota
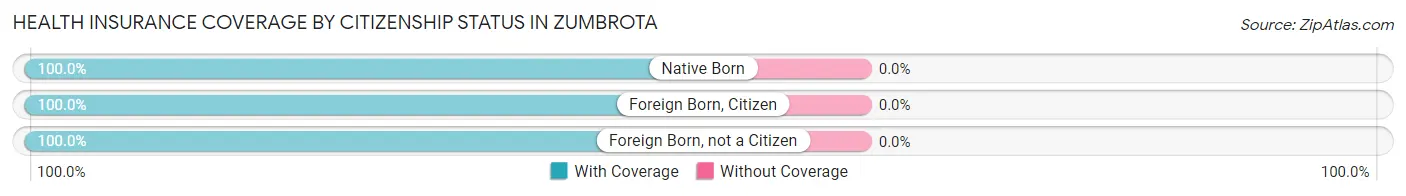
| Citizenship Status | With Coverage | Without Coverage |
| Native Born | 240 (100.0%) | 0 (0.0%) |
| Foreign Born, Citizen | 530 (100.0%) | 0 (0.0%) |
| Foreign Born, not a Citizen | 207 (100.0%) | 0 (0.0%) |
Health Insurance Coverage by Household Income in Zumbrota
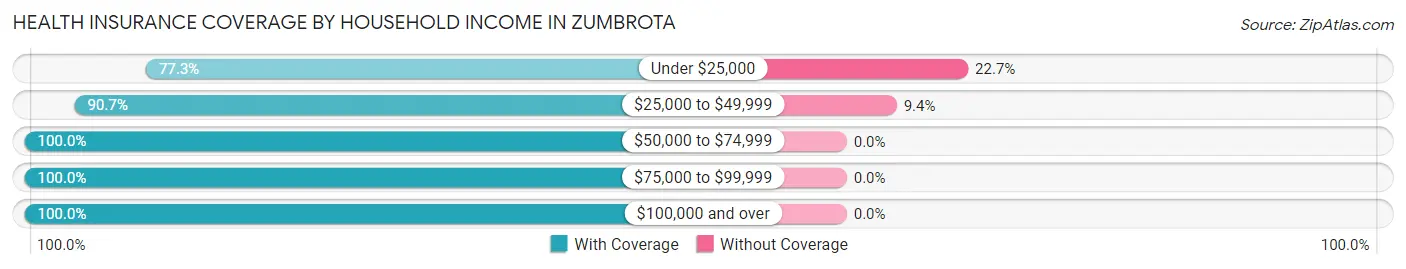
| Household Income | With Coverage | Without Coverage |
| Under $25,000 | 282 (77.3%) | 83 (22.7%) |
| $25,000 to $49,999 | 320 (90.6%) | 33 (9.3%) |
| $50,000 to $74,999 | 687 (100.0%) | 0 (0.0%) |
| $75,000 to $99,999 | 256 (100.0%) | 0 (0.0%) |
| $100,000 and over | 2,068 (100.0%) | 0 (0.0%) |
Public vs Private Health Insurance Coverage by Age in Zumbrota
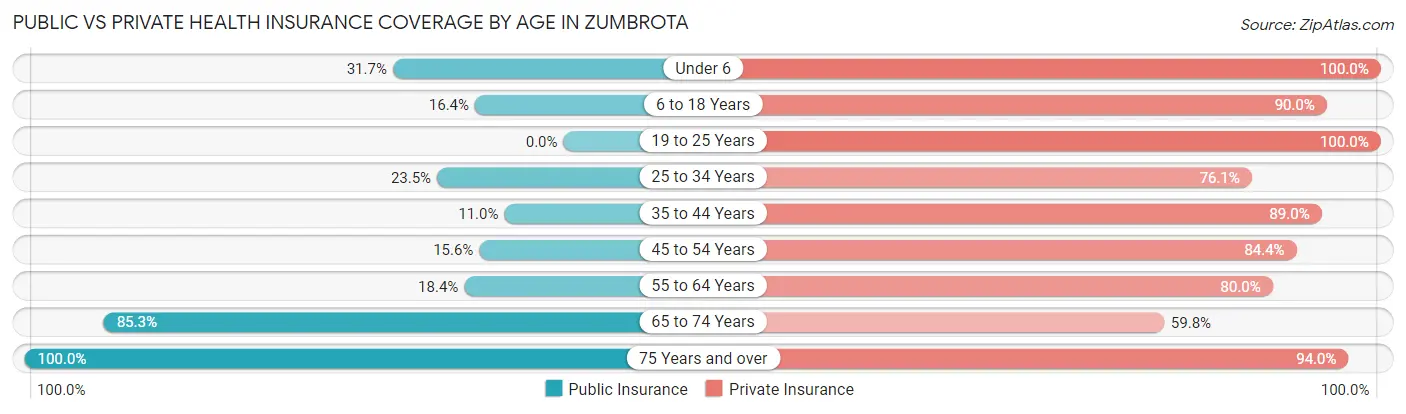
| Age Bracket | Public Insurance | Private Insurance |
| Under 6 | 76 (31.7%) | 240 (100.0%) |
| 6 to 18 Years | 87 (16.4%) | 477 (90.0%) |
| 19 to 25 Years | 0 (0.0%) | 207 (100.0%) |
| 25 to 34 Years | 103 (23.5%) | 334 (76.1%) |
| 35 to 44 Years | 61 (11.0%) | 495 (89.0%) |
| 45 to 54 Years | 70 (15.6%) | 378 (84.4%) |
| 55 to 64 Years | 102 (18.4%) | 443 (80.0%) |
| 65 to 74 Years | 331 (85.3%) | 232 (59.8%) |
| 75 Years and over | 367 (100.0%) | 345 (94.0%) |
| Total | 1,197 (32.1%) | 3,151 (84.5%) |
Disability Status by Sex by Age in Zumbrota
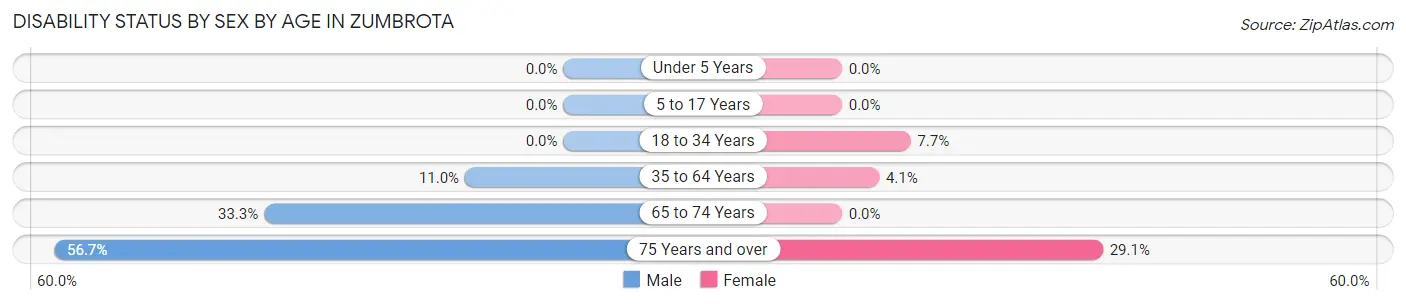
| Age Bracket | Male | Female |
| Under 5 Years | 0 (0.0%) | 0 (0.0%) |
| 5 to 17 Years | 0 (0.0%) | 0 (0.0%) |
| 18 to 34 Years | 0 (0.0%) | 26 (7.6%) |
| 35 to 64 Years | 86 (11.0%) | 32 (4.1%) |
| 65 to 74 Years | 51 (33.3%) | 0 (0.0%) |
| 75 Years and over | 93 (56.7%) | 59 (29.1%) |
Disability Class by Sex by Age in Zumbrota
Disability Class: Hearing Difficulty
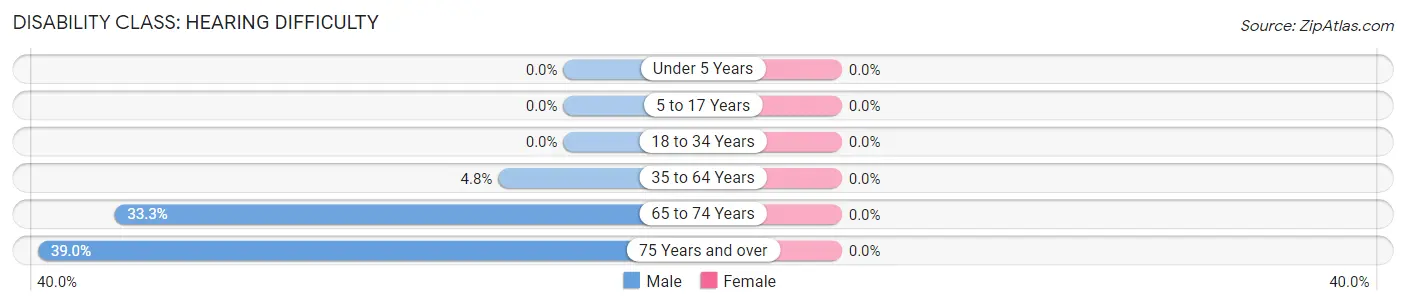
| Age Bracket | Male | Female |
| Under 5 Years | 0 (0.0%) | 0 (0.0%) |
| 5 to 17 Years | 0 (0.0%) | 0 (0.0%) |
| 18 to 34 Years | 0 (0.0%) | 0 (0.0%) |
| 35 to 64 Years | 38 (4.8%) | 0 (0.0%) |
| 65 to 74 Years | 51 (33.3%) | 0 (0.0%) |
| 75 Years and over | 64 (39.0%) | 0 (0.0%) |
Disability Class: Vision Difficulty
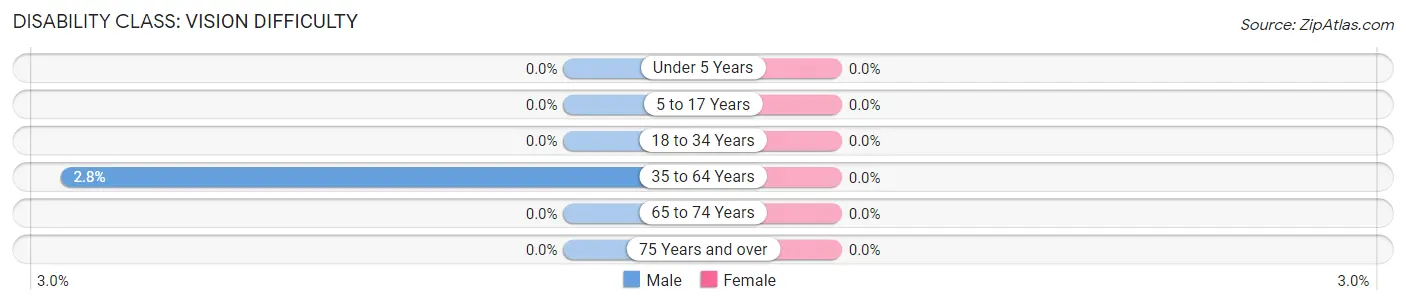
| Age Bracket | Male | Female |
| Under 5 Years | 0 (0.0%) | 0 (0.0%) |
| 5 to 17 Years | 0 (0.0%) | 0 (0.0%) |
| 18 to 34 Years | 0 (0.0%) | 0 (0.0%) |
| 35 to 64 Years | 22 (2.8%) | 0 (0.0%) |
| 65 to 74 Years | 0 (0.0%) | 0 (0.0%) |
| 75 Years and over | 0 (0.0%) | 0 (0.0%) |
Disability Class: Cognitive Difficulty
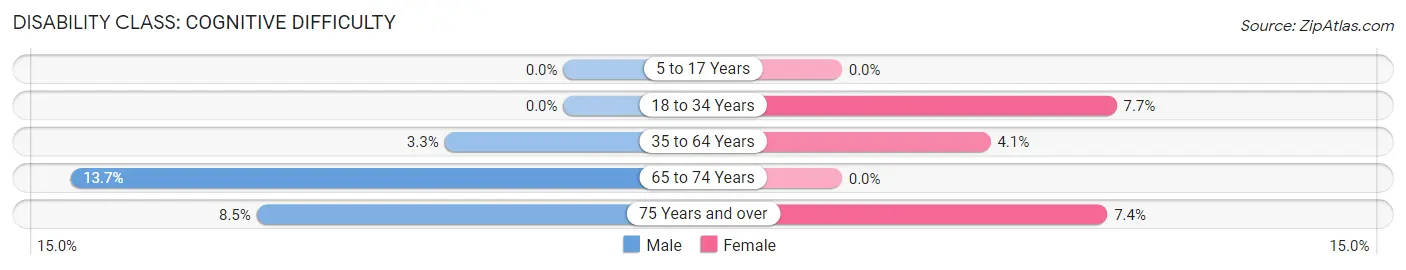
| Age Bracket | Male | Female |
| 5 to 17 Years | 0 (0.0%) | 0 (0.0%) |
| 18 to 34 Years | 0 (0.0%) | 26 (7.6%) |
| 35 to 64 Years | 26 (3.3%) | 32 (4.1%) |
| 65 to 74 Years | 21 (13.7%) | 0 (0.0%) |
| 75 Years and over | 14 (8.5%) | 15 (7.4%) |
Disability Class: Ambulatory Difficulty
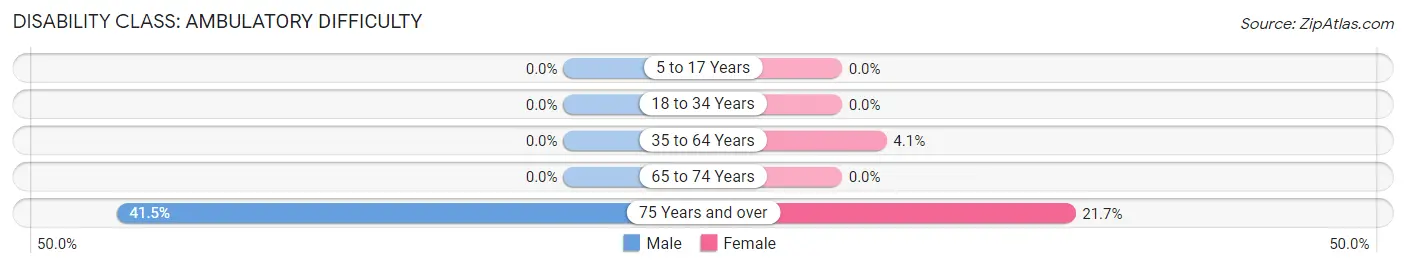
| Age Bracket | Male | Female |
| 5 to 17 Years | 0 (0.0%) | 0 (0.0%) |
| 18 to 34 Years | 0 (0.0%) | 0 (0.0%) |
| 35 to 64 Years | 0 (0.0%) | 32 (4.1%) |
| 65 to 74 Years | 0 (0.0%) | 0 (0.0%) |
| 75 Years and over | 68 (41.5%) | 44 (21.7%) |
Disability Class: Self-Care Difficulty
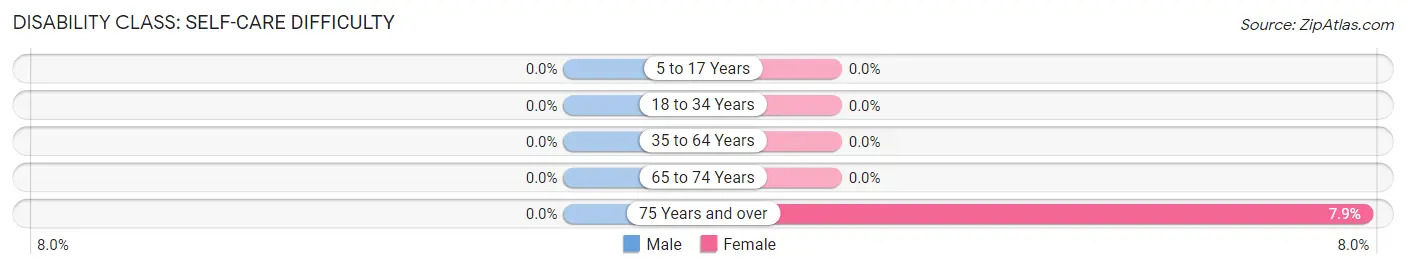
| Age Bracket | Male | Female |
| 5 to 17 Years | 0 (0.0%) | 0 (0.0%) |
| 18 to 34 Years | 0 (0.0%) | 0 (0.0%) |
| 35 to 64 Years | 0 (0.0%) | 0 (0.0%) |
| 65 to 74 Years | 0 (0.0%) | 0 (0.0%) |
| 75 Years and over | 0 (0.0%) | 16 (7.9%) |
Technology Access in Zumbrota
Computing Device Access in Zumbrota
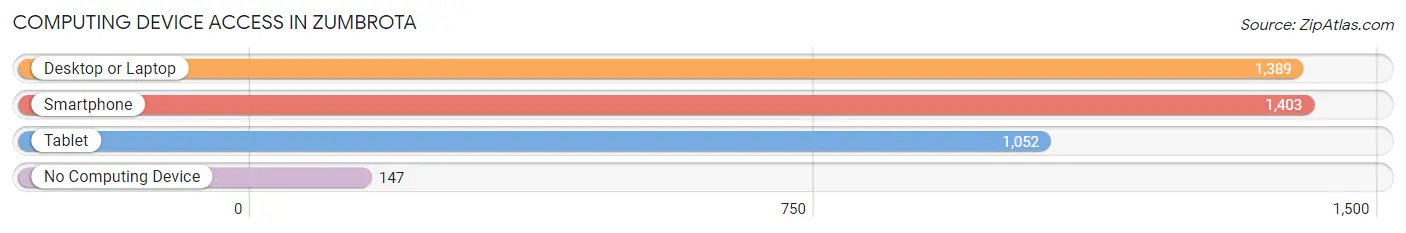
| Device Type | # Households | % Households |
| Desktop or Laptop | 1,389 | 82.2% |
| Smartphone | 1,403 | 83.0% |
| Tablet | 1,052 | 62.3% |
| No Computing Device | 147 | 8.7% |
| Total | 1,690 | 100.0% |
Internet Access in Zumbrota
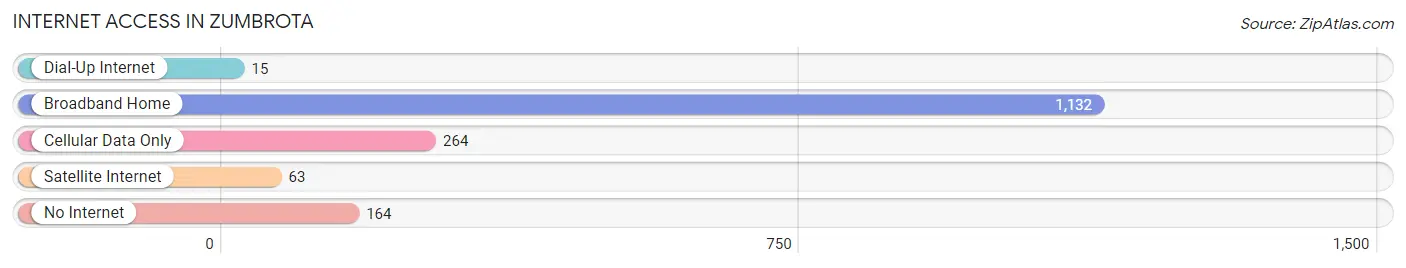
| Internet Type | # Households | % Households |
| Dial-Up Internet | 15 | 0.9% |
| Broadband Home | 1,132 | 67.0% |
| Cellular Data Only | 264 | 15.6% |
| Satellite Internet | 63 | 3.7% |
| No Internet | 164 | 9.7% |
| Total | 1,690 | 100.0% |
Zumbrota Summary
Zumbrota, Minnesota is a small city located in Goodhue County, in the southeastern part of the state. It is situated on the banks of the Zumbro River, and is part of the Twin Cities metropolitan area. The city has a population of approximately 3,000 people, and is known for its historic downtown area, which is listed on the National Register of Historic Places.
Geography
Zumbrota is located in the southeastern part of Minnesota, in Goodhue County. It is situated on the banks of the Zumbro River, and is part of the Twin Cities metropolitan area. The city is located approximately 40 miles southeast of Minneapolis, and is bordered by the cities of Red Wing, Cannon Falls, and Pine Island. The city has a total area of 2.2 square miles, all of which is land.
Climate
Zumbrota has a humid continental climate, with cold winters and warm summers. The average annual temperature is around 40 degrees Fahrenheit, with temperatures ranging from an average low of around 20 degrees in the winter to an average high of around 60 degrees in the summer. The city receives an average of around 30 inches of precipitation per year, with most of it falling in the form of snow in the winter months.
Demographics
As of the 2010 census, there were 3,068 people, 1,213 households, and 790 families residing in the city. The population density was 1,400 people per square mile. The racial makeup of the city was 97.2% White, 0.7% African American, 0.3% Native American, 0.4% Asian, 0.1% Pacific Islander, 0.4% from other races, and 0.9% from two or more races. Hispanic or Latino of any race were 1.3% of the population.
Economy
The economy of Zumbrota is largely based on agriculture and manufacturing. The city is home to several large agricultural businesses, including Zumbro Valley Farms, which produces a variety of fruits and vegetables. The city is also home to several manufacturing companies, including Zumbro Manufacturing, which produces a variety of industrial products. The city also has a thriving retail sector, with several stores and restaurants located in the downtown area.
History
The area that is now Zumbrota was first settled in the early 1800s by settlers from New England. The city was officially incorporated in 1858, and was named after the nearby Zumbro River. The city quickly grew in size and importance, and by the late 1800s it was a major center for agriculture and manufacturing. The city was also home to several large mills, which produced a variety of products, including flour, lumber, and paper.
In the early 1900s, the city began to decline in importance, as the nearby cities of Red Wing and Cannon Falls began to grow in size and importance. However, the city was able to maintain its historic downtown area, which is now listed on the National Register of Historic Places. Today, the city is a popular tourist destination, and is known for its historic downtown area, as well as its many parks and recreational areas.
Common Questions
What is Per Capita Income in Zumbrota?
Per Capita income in Zumbrota is $38,938.
What is the Median Family Income in Zumbrota?
Median Family Income in Zumbrota is $104,393.
What is the Median Household income in Zumbrota?
Median Household Income in Zumbrota is $72,061.
What is Income or Wage Gap in Zumbrota?
Income or Wage Gap in Zumbrota is 18.7%.
Women in Zumbrota earn 81.3 cents for every dollar earned by a man.
What is Inequality or Gini Index in Zumbrota?
Inequality or Gini Index in Zumbrota is 0.39.
What is the Total Population of Zumbrota?
Total Population of Zumbrota is 3,777.
What is the Total Male Population of Zumbrota?
Total Male Population of Zumbrota is 1,835.
What is the Total Female Population of Zumbrota?
Total Female Population of Zumbrota is 1,942.
What is the Ratio of Males per 100 Females in Zumbrota?
There are 94.49 Males per 100 Females in Zumbrota.
What is the Ratio of Females per 100 Males in Zumbrota?
There are 105.83 Females per 100 Males in Zumbrota.
What is the Median Population Age in Zumbrota?
Median Population Age in Zumbrota is 43.5 Years.
What is the Average Family Size in Zumbrota
Average Family Size in Zumbrota is 2.8 People.
What is the Average Household Size in Zumbrota
Average Household Size in Zumbrota is 2.2 People.
How Large is the Labor Force in Zumbrota?
There are 2,072 People in the Labor Forcein in Zumbrota.
What is the Percentage of People in the Labor Force in Zumbrota?
67.7% of People are in the Labor Force in Zumbrota.
What is the Unemployment Rate in Zumbrota?
Unemployment Rate in Zumbrota is 2.8%.