Zip Codes with the Highest Percentage of Population with a Degree in Liberal Arts and History in Burnsville, MN
RELATED REPORTS & OPTIONS
Liberal Arts and History
Burnsville
Compare Zip Codes
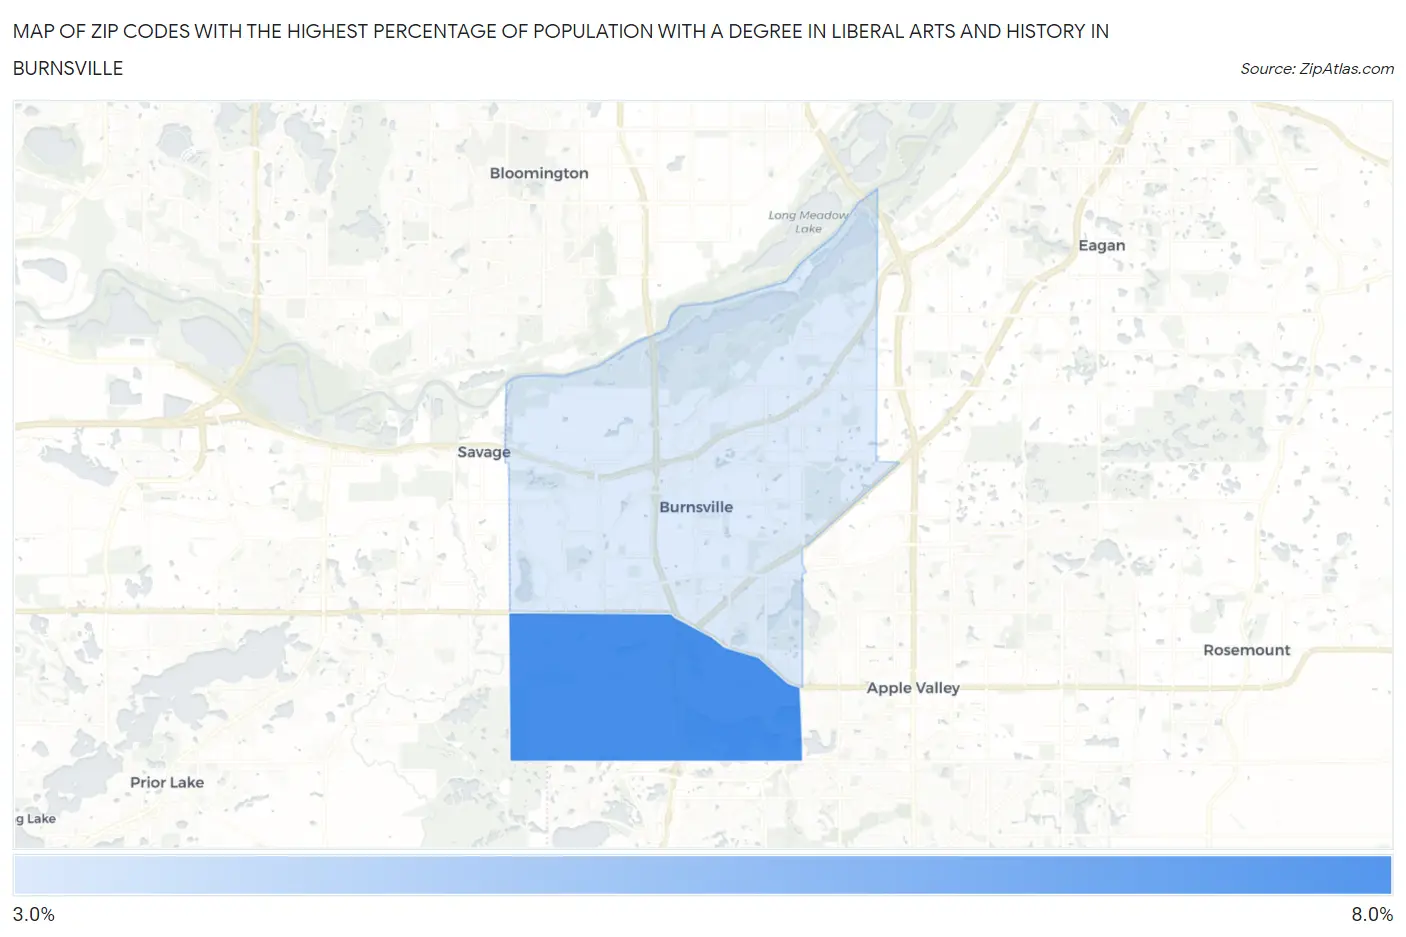
Map of Zip Codes with the Highest Percentage of Population with a Degree in Liberal Arts and History in Burnsville
3.6%
6.1%
Zip Codes with the Highest Percentage of Population with a Degree in Liberal Arts and History in Burnsville, MN
| Zip Code | % Graduates | vs State | vs National | |
| 1. | 55306 | 6.1% | 4.4%(+1.76)#139 | 4.9%(+1.26)#8,170 |
| 2. | 55337 | 3.6% | 4.4%(-0.730)#390 | 4.9%(-1.23)#16,078 |
1
Common Questions
What are the Top Zip Codes with the Highest Percentage of Population with a Degree in Liberal Arts and History in Burnsville, MN?
Top Zip Codes with the Highest Percentage of Population with a Degree in Liberal Arts and History in Burnsville, MN are:
What zip code has the Highest Percentage of Population with a Degree in Liberal Arts and History in Burnsville, MN?
55306 has the Highest Percentage of Population with a Degree in Liberal Arts and History in Burnsville, MN with 6.1%.
What is the Percentage of Population with a Degree in Liberal Arts and History in Burnsville, MN?
Percentage of Population with a Degree in Liberal Arts and History in Burnsville is 4.3%.
What is the Percentage of Population with a Degree in Liberal Arts and History in Minnesota?
Percentage of Population with a Degree in Liberal Arts and History in Minnesota is 4.4%.
What is the Percentage of Population with a Degree in Liberal Arts and History in the United States?
Percentage of Population with a Degree in Liberal Arts and History in the United States is 4.9%.