Florence, MN Map & Demographics
Florence Map
Florence Overview
$20,643
PER CAPITA INCOME
$40,625
AVG HOUSEHOLD INCOME
0.34
INEQUALITY / GINI INDEX
14
TOTAL POPULATION
5
MALE POPULATION
9
FEMALE POPULATION
55.56
MALES / 100 FEMALES
180.00
FEMALES / 100 MALES
37.5
MEDIAN AGE
3.2
AVG FAMILY SIZE
2.8
AVG HOUSEHOLD SIZE
7
LABOR FORCE [ PEOPLE ]
70.0%
PERCENT IN LABOR FORCE
Florence Area Codes
Income in Florence
Income Overview in Florence
| Characteristic | Number | Measure |
| Per Capita Income | 14 | $20,643 |
| Median Family Income | 4 | $0 |
| Mean Family Income | 4 | $54,800 |
| Median Household Income | 5 | $40,625 |
| Mean Household Income | 5 | $48,500 |
| Income Deficit | 4 | $0 |
| Wage / Income Gap (%) | 14 | 0.00% |
| Wage / Income Gap ($) | 14 | 100.00¢ per $1 |
| Gini / Inequality Index | 14 | 0.34 |
Earnings by Sex in Florence
| Sex | Number | Average Earnings |
| Male | 3 (42.9%) | $0 |
| Female | 4 (57.1%) | $0 |
| Total | 7 (100.0%) | $0 |
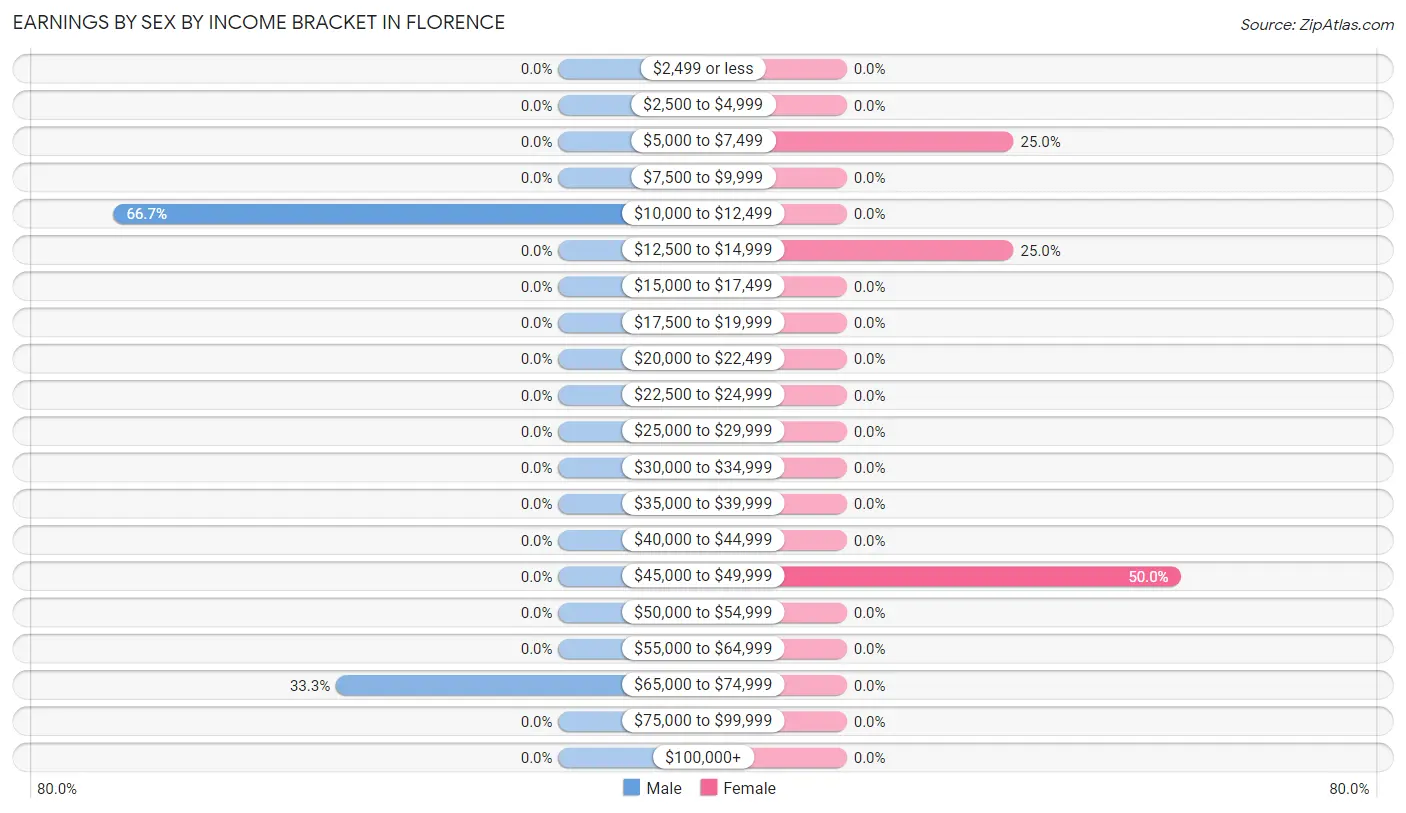
Earnings by Sex by Income Bracket in Florence
The most common earnings brackets in Florence are $10,000 to $12,499 for men (2 | 66.7%) and $45,000 to $49,999 for women (2 | 50.0%).
| Income | Male | Female |
| $2,499 or less | 0 (0.0%) | 0 (0.0%) |
| $2,500 to $4,999 | 0 (0.0%) | 0 (0.0%) |
| $5,000 to $7,499 | 0 (0.0%) | 1 (25.0%) |
| $7,500 to $9,999 | 0 (0.0%) | 0 (0.0%) |
| $10,000 to $12,499 | 2 (66.7%) | 0 (0.0%) |
| $12,500 to $14,999 | 0 (0.0%) | 1 (25.0%) |
| $15,000 to $17,499 | 0 (0.0%) | 0 (0.0%) |
| $17,500 to $19,999 | 0 (0.0%) | 0 (0.0%) |
| $20,000 to $22,499 | 0 (0.0%) | 0 (0.0%) |
| $22,500 to $24,999 | 0 (0.0%) | 0 (0.0%) |
| $25,000 to $29,999 | 0 (0.0%) | 0 (0.0%) |
| $30,000 to $34,999 | 0 (0.0%) | 0 (0.0%) |
| $35,000 to $39,999 | 0 (0.0%) | 0 (0.0%) |
| $40,000 to $44,999 | 0 (0.0%) | 0 (0.0%) |
| $45,000 to $49,999 | 0 (0.0%) | 2 (50.0%) |
| $50,000 to $54,999 | 0 (0.0%) | 0 (0.0%) |
| $55,000 to $64,999 | 0 (0.0%) | 0 (0.0%) |
| $65,000 to $74,999 | 1 (33.3%) | 0 (0.0%) |
| $75,000 to $99,999 | 0 (0.0%) | 0 (0.0%) |
| $100,000+ | 0 (0.0%) | 0 (0.0%) |
| Total | 3 (100.0%) | 4 (100.0%) |
Earnings by Sex by Educational Attainment in Florence
| Educational Attainment | Male Income | Female Income |
| Less than High School | - | - |
| High School Diploma | - | - |
| College or Associate's Degree | - | - |
| Bachelor's Degree | - | - |
| Graduate Degree | - | - |
| Total | - | - |
Family Income in Florence
Family Income Brackets in Florence
According to the Florence family income data, there are 2 families falling into the $35,000 to $49,999 income range, which is the most common income bracket and makes up 50.0% of all families.
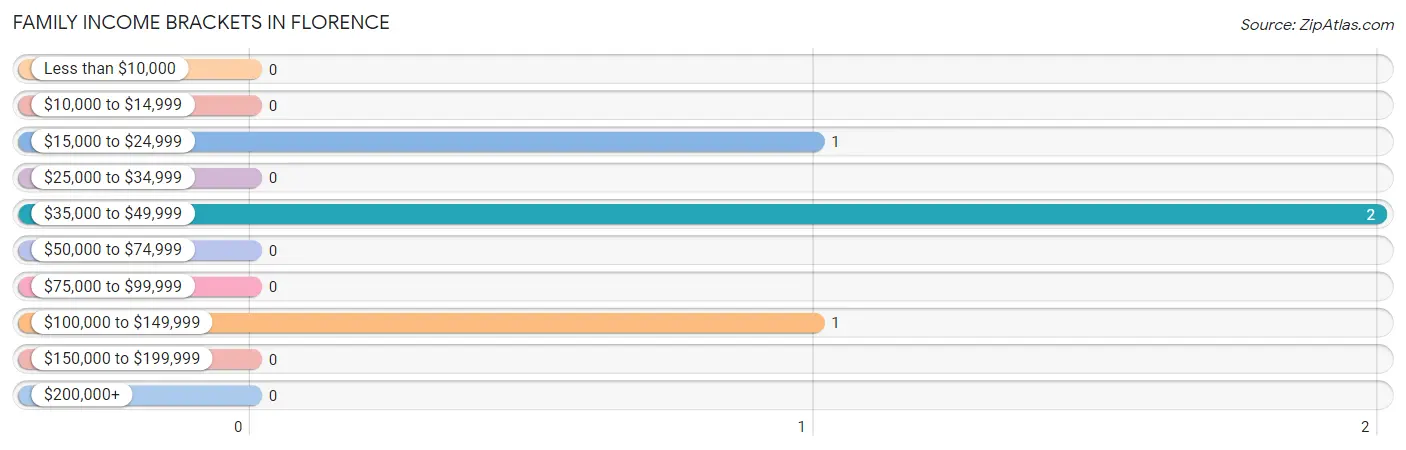
| Income Bracket | # Families | % Families |
| Less than $10,000 | 0 | 0.0% |
| $10,000 to $14,999 | 0 | 0.0% |
| $15,000 to $24,999 | 1 | 25.0% |
| $25,000 to $34,999 | 0 | 0.0% |
| $35,000 to $49,999 | 2 | 50.0% |
| $50,000 to $74,999 | 0 | 0.0% |
| $75,000 to $99,999 | 0 | 0.0% |
| $100,000 to $149,999 | 1 | 25.0% |
| $150,000 to $199,999 | 0 | 0.0% |
| $200,000+ | 0 | 0.0% |
Family Income by Famaliy Size in Florence
| Income Bracket | # Families | Median Income |
| 2-Person Families | 3 (75.0%) | $0 |
| 3-Person Families | 0 (0.0%) | $0 |
| 4-Person Families | 0 (0.0%) | $0 |
| 5-Person Families | 1 (25.0%) | $0 |
| 6-Person Families | 0 (0.0%) | $0 |
| 7+ Person Families | 0 (0.0%) | $0 |
| Total | 4 (100.0%) | $0 |
Family Income by Number of Earners in Florence
| Number of Earners | # Families | Median Income |
| No Earners | 0 (0.0%) | $0 |
| 1 Earner | 2 (50.0%) | $0 |
| 2 Earners | 2 (50.0%) | $0 |
| 3+ Earners | 0 (0.0%) | $0 |
| Total | 4 (100.0%) | $0 |
Household Income in Florence
Household Income Brackets in Florence
With 2 households falling in the category, the $15,000 to $24,999 income range is the most frequent in Florence, accounting for 40.0% of all households.
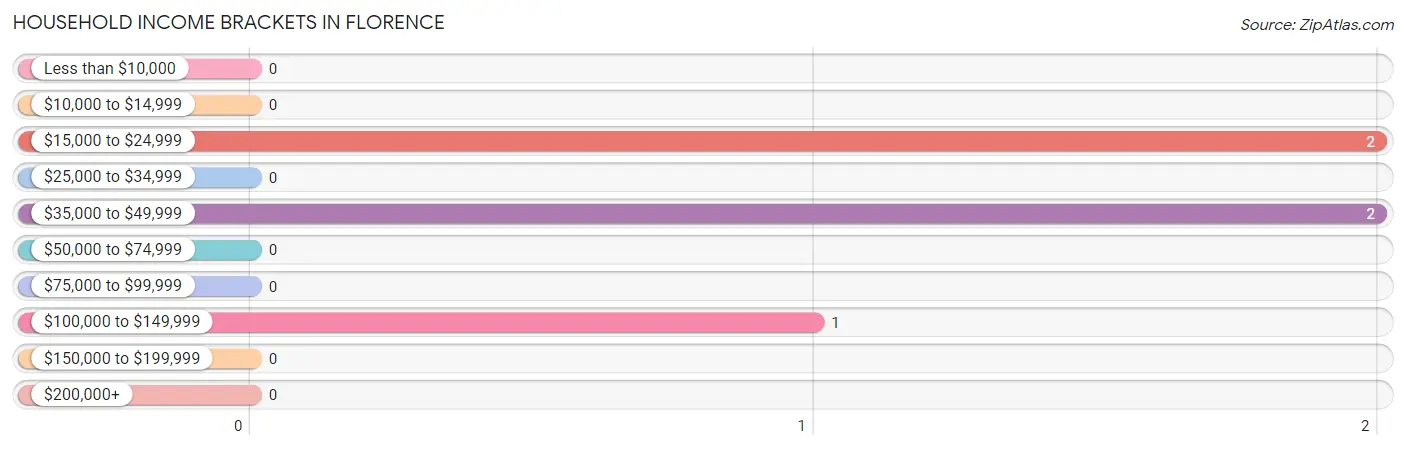
| Income Bracket | # Households | % Households |
| Less than $10,000 | 0 | 0.0% |
| $10,000 to $14,999 | 0 | 0.0% |
| $15,000 to $24,999 | 2 | 40.0% |
| $25,000 to $34,999 | 0 | 0.0% |
| $35,000 to $49,999 | 2 | 40.0% |
| $50,000 to $74,999 | 0 | 0.0% |
| $75,000 to $99,999 | 0 | 0.0% |
| $100,000 to $149,999 | 1 | 20.0% |
| $150,000 to $199,999 | 0 | 0.0% |
| $200,000+ | 0 | 0.0% |
Household Income by Householder Age in Florence
| Income Bracket | # Households | Median Income |
| 15 to 24 Years | 0 (0.0%) | $0 |
| 25 to 44 Years | 1 (20.0%) | $0 |
| 45 to 64 Years | 1 (20.0%) | $0 |
| 65+ Years | 3 (60.0%) | $0 |
| Total | 5 (100.0%) | $40,625 |
Poverty in Florence
Income Below Poverty by Sex and Age in Florence
| Age Bracket | Male | Female |
| Under 5 Years | 0 (0.0%) | 0 (0.0%) |
| 5 Years | 0 (0.0%) | 0 (0.0%) |
| 6 to 11 Years | 0 (0.0%) | 0 (0.0%) |
| 12 to 14 Years | 0 (0.0%) | 0 (0.0%) |
| 15 Years | 0 (0.0%) | 0 (0.0%) |
| 16 and 17 Years | 0 (0.0%) | 0 (0.0%) |
| 18 to 24 Years | 0 (0.0%) | 0 (0.0%) |
| 25 to 34 Years | 0 (0.0%) | 0 (0.0%) |
| 35 to 44 Years | 0 (0.0%) | 0 (0.0%) |
| 45 to 54 Years | 0 (0.0%) | 0 (0.0%) |
| 55 to 64 Years | 0 (0.0%) | 0 (0.0%) |
| 65 to 74 Years | 0 (0.0%) | 0 (0.0%) |
| 75 Years and over | 0 (0.0%) | 0 (0.0%) |
| Total | 0 (0.0%) | 0 (0.0%) |
Income Above Poverty by Sex and Age in Florence
According to the poverty statistics in Florence, males aged 6 to 11 years and females aged under 5 years are the age groups that are most secure financially, with 100.0% of males and 100.0% of females in these age groups living above the poverty line.
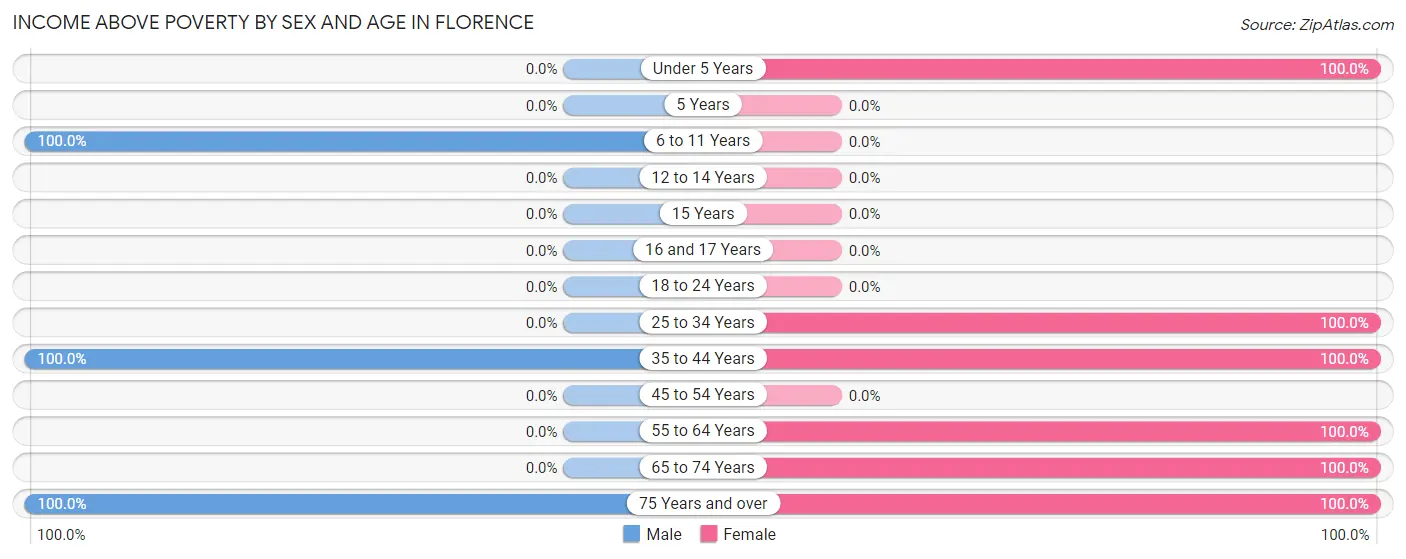
| Age Bracket | Male | Female |
| Under 5 Years | 0 (0.0%) | 2 (100.0%) |
| 5 Years | 0 (0.0%) | 0 (0.0%) |
| 6 to 11 Years | 2 (100.0%) | 0 (0.0%) |
| 12 to 14 Years | 0 (0.0%) | 0 (0.0%) |
| 15 Years | 0 (0.0%) | 0 (0.0%) |
| 16 and 17 Years | 0 (0.0%) | 0 (0.0%) |
| 18 to 24 Years | 0 (0.0%) | 0 (0.0%) |
| 25 to 34 Years | 0 (0.0%) | 1 (100.0%) |
| 35 to 44 Years | 1 (100.0%) | 2 (100.0%) |
| 45 to 54 Years | 0 (0.0%) | 0 (0.0%) |
| 55 to 64 Years | 0 (0.0%) | 1 (100.0%) |
| 65 to 74 Years | 0 (0.0%) | 1 (100.0%) |
| 75 Years and over | 2 (100.0%) | 2 (100.0%) |
| Total | 5 (100.0%) | 9 (100.0%) |
Income Below Poverty Among Married-Couple Families in Florence
| Children | Above Poverty | Below Poverty |
| No Children | 2 (100.0%) | 0 (0.0%) |
| 1 or 2 Children | 0 (0.0%) | 0 (0.0%) |
| 3 or 4 Children | 1 (100.0%) | 0 (0.0%) |
| 5 or more Children | 0 (0.0%) | 0 (0.0%) |
| Total | 3 (100.0%) | 0 (0.0%) |
Income Below Poverty Among Single-Parent Households in Florence
| Children | Single Father | Single Mother |
| No Children | 0 (0.0%) | 0 (0.0%) |
| 1 or 2 Children | 0 (0.0%) | 0 (0.0%) |
| 3 or 4 Children | 0 (0.0%) | 0 (0.0%) |
| 5 or more Children | 0 (0.0%) | 0 (0.0%) |
| Total | 0 (0.0%) | 0 (0.0%) |
Income Below Poverty Among Married-Couple vs Single-Parent Households in Florence
| Children | Married-Couple Families | Single-Parent Households |
| No Children | 0 (0.0%) | 0 (0.0%) |
| 1 or 2 Children | 0 (0.0%) | 0 (0.0%) |
| 3 or 4 Children | 0 (0.0%) | 0 (0.0%) |
| 5 or more Children | 0 (0.0%) | 0 (0.0%) |
| Total | 0 (0.0%) | 0 (0.0%) |
Race in Florence
The most populous races in Florence are , and White / Caucasian (14 | 100.0%).
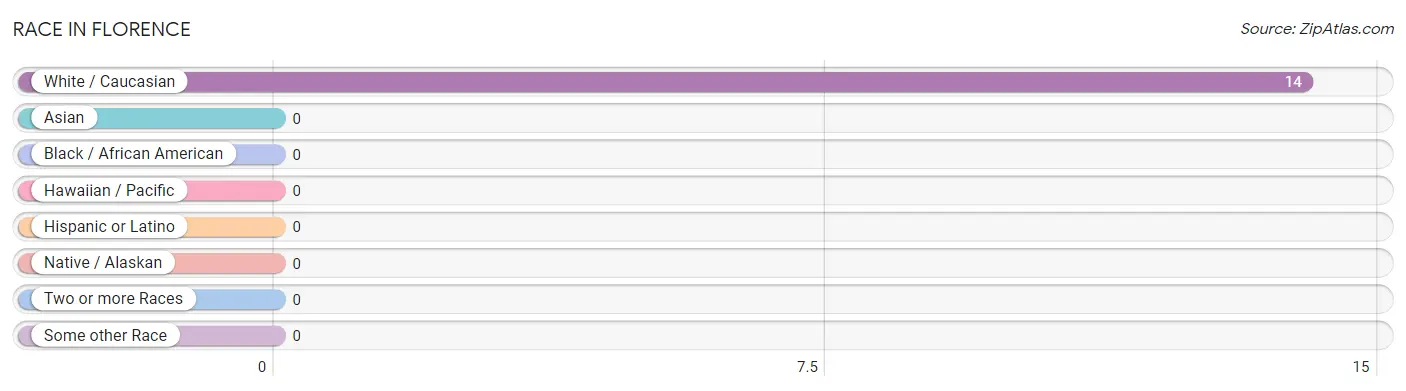
| Race | # Population | % Population |
| Asian | 0 | 0.0% |
| Black / African American | 0 | 0.0% |
| Hawaiian / Pacific | 0 | 0.0% |
| Hispanic or Latino | 0 | 0.0% |
| Native / Alaskan | 0 | 0.0% |
| White / Caucasian | 14 | 100.0% |
| Two or more Races | 0 | 0.0% |
| Some other Race | 0 | 0.0% |
| Total | 14 | 100.0% |
Ancestry in Florence
The most populous ancestries reported in Florence are American (4 | 28.6%), German (4 | 28.6%), Swedish (2 | 14.3%), Dutch (1 | 7.1%), and European (1 | 7.1%), together accounting for 85.7% of all Florence residents.
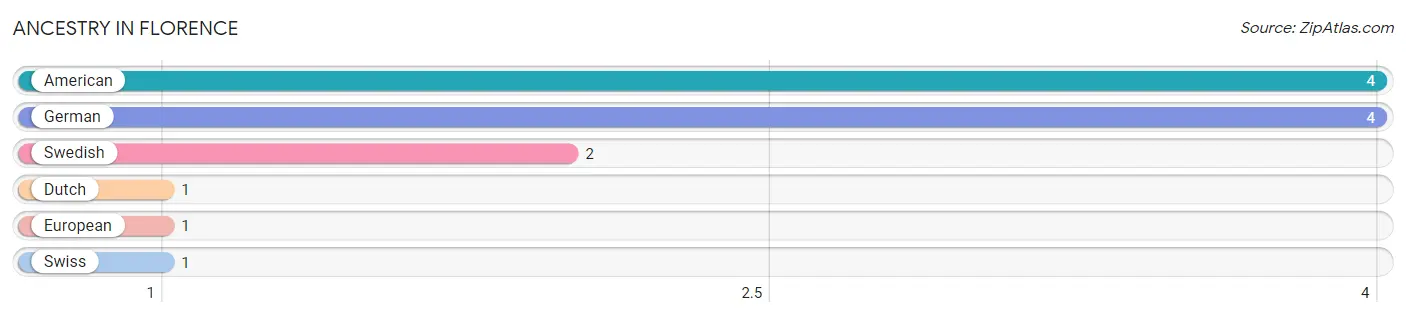
| Ancestry | # Population | % Population |
| American | 4 | 28.6% |
| Dutch | 1 | 7.1% |
| European | 1 | 7.1% |
| German | 4 | 28.6% |
| Swedish | 2 | 14.3% |
| Swiss | 1 | 7.1% | View All 6 Rows |
Immigrants in Florence

| Immigration Origin | # Population | % Population | View All 0 Rows |
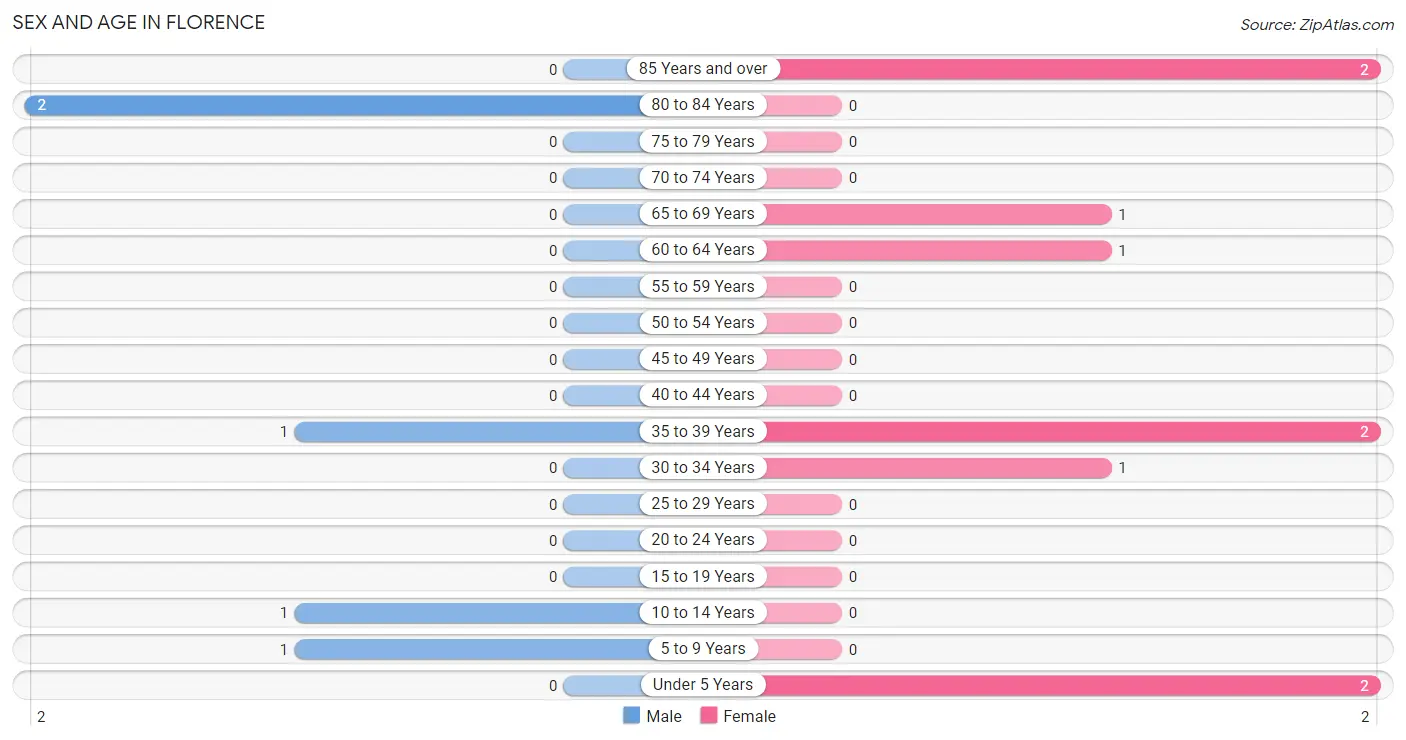
Sex and Age in Florence
Sex and Age in Florence
The most populous age groups in Florence are 80 to 84 Years (2 | 40.0%) for men and Under 5 Years (2 | 22.2%) for women.
| Age Bracket | Male | Female |
| Under 5 Years | 0 (0.0%) | 2 (22.2%) |
| 5 to 9 Years | 1 (20.0%) | 0 (0.0%) |
| 10 to 14 Years | 1 (20.0%) | 0 (0.0%) |
| 15 to 19 Years | 0 (0.0%) | 0 (0.0%) |
| 20 to 24 Years | 0 (0.0%) | 0 (0.0%) |
| 25 to 29 Years | 0 (0.0%) | 0 (0.0%) |
| 30 to 34 Years | 0 (0.0%) | 1 (11.1%) |
| 35 to 39 Years | 1 (20.0%) | 2 (22.2%) |
| 40 to 44 Years | 0 (0.0%) | 0 (0.0%) |
| 45 to 49 Years | 0 (0.0%) | 0 (0.0%) |
| 50 to 54 Years | 0 (0.0%) | 0 (0.0%) |
| 55 to 59 Years | 0 (0.0%) | 0 (0.0%) |
| 60 to 64 Years | 0 (0.0%) | 1 (11.1%) |
| 65 to 69 Years | 0 (0.0%) | 1 (11.1%) |
| 70 to 74 Years | 0 (0.0%) | 0 (0.0%) |
| 75 to 79 Years | 0 (0.0%) | 0 (0.0%) |
| 80 to 84 Years | 2 (40.0%) | 0 (0.0%) |
| 85 Years and over | 0 (0.0%) | 2 (22.2%) |
| Total | 5 (100.0%) | 9 (100.0%) |
Families and Households in Florence
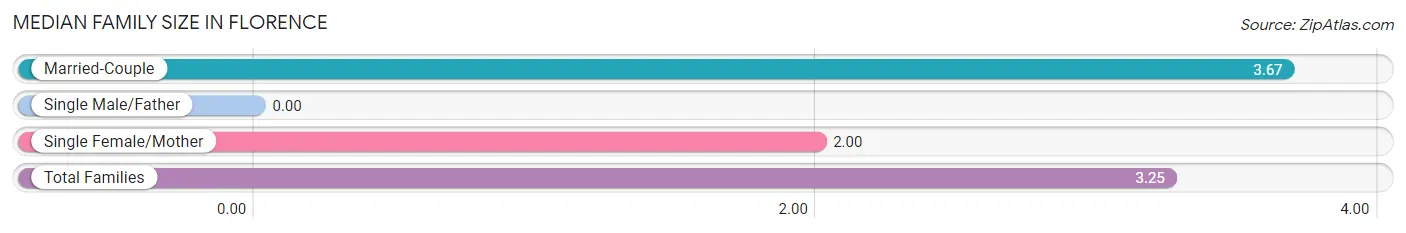
Median Family Size in Florence
| Family Type | # Families | Family Size |
| Married-Couple | 3 (75.0%) | 3.67 |
| Single Male/Father | 0 (0.0%) | - |
| Single Female/Mother | 1 (25.0%) | 2.00 |
| Total Families | 4 (100.0%) | 3.25 |
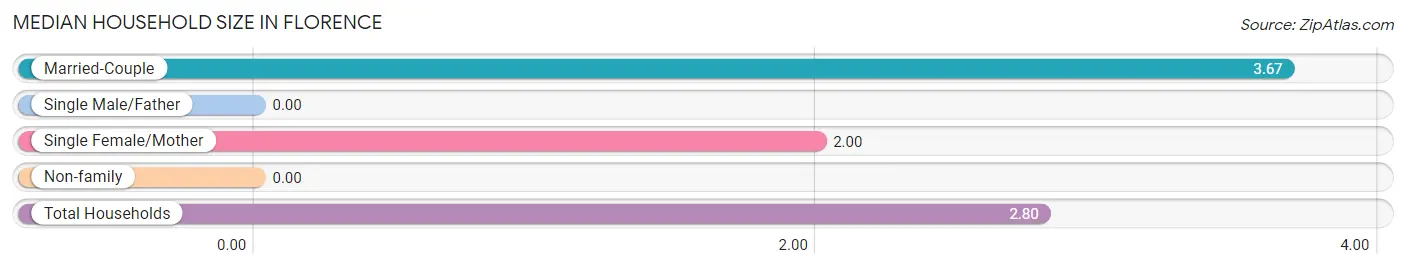
Median Household Size in Florence
| Household Type | # Households | Household Size |
| Married-Couple | 3 (60.0%) | 3.67 |
| Single Male/Father | 0 (0.0%) | - |
| Single Female/Mother | 1 (20.0%) | 2.00 |
| Non-family | 1 (20.0%) | - |
| Total Households | 5 (100.0%) | 2.80 |
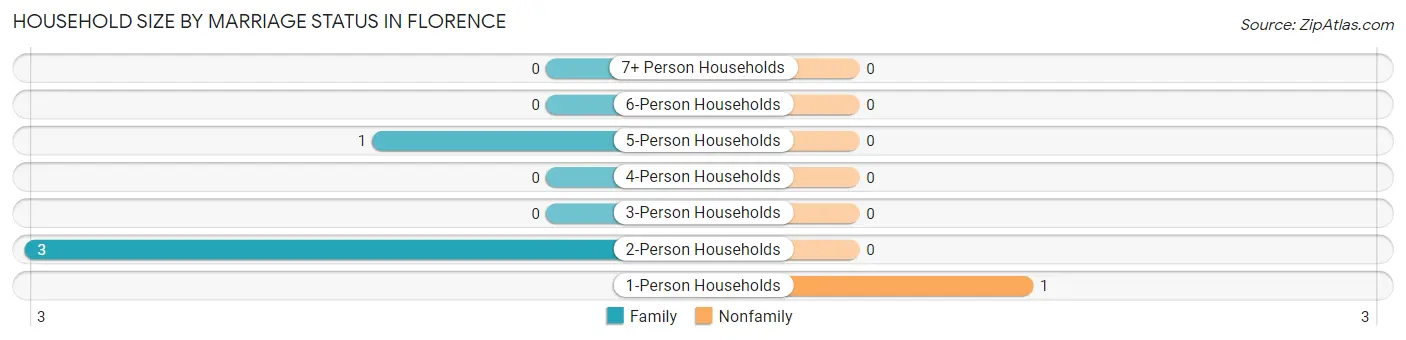
Household Size by Marriage Status in Florence
Out of a total of 5 households in Florence, 4 (80.0%) are family households, while 1 (20.0%) are nonfamily households. The most numerous type of family households are 2-person households, comprising 3, and the most common type of nonfamily households are 1-person households, comprising 1.
| Household Size | Family Households | Nonfamily Households |
| 1-Person Households | - | 1 (20.0%) |
| 2-Person Households | 3 (60.0%) | 0 (0.0%) |
| 3-Person Households | 0 (0.0%) | 0 (0.0%) |
| 4-Person Households | 0 (0.0%) | 0 (0.0%) |
| 5-Person Households | 1 (20.0%) | 0 (0.0%) |
| 6-Person Households | 0 (0.0%) | 0 (0.0%) |
| 7+ Person Households | 0 (0.0%) | 0 (0.0%) |
| Total | 4 (80.0%) | 1 (20.0%) |
Female Fertility in Florence
Fertility by Age in Florence
| Age Bracket | Women with Births | Births / 1,000 Women |
| 15 to 19 years | 0 (0.0%) | 0.0 |
| 20 to 34 years | 0 (0.0%) | 0.0 |
| 35 to 50 years | 0 (0.0%) | 0.0 |
| Total | 0 (0.0%) | 0.0 |
Fertility by Age by Marriage Status in Florence
| Age Bracket | Married | Unmarried |
| 15 to 19 years | 0 (0.0%) | 0 (0.0%) |
| 20 to 34 years | 0 (0.0%) | 0 (0.0%) |
| 35 to 50 years | 0 (0.0%) | 0 (0.0%) |
| Total | 0 (0.0%) | 0 (0.0%) |
Fertility by Education in Florence
| Educational Attainment | Women with Births | Births / 1,000 Women |
| Less than High School | 0 (0.0%) | 0.0 |
| High School Diploma | 0 (0.0%) | 0.0 |
| College or Associate's Degree | 0 (0.0%) | 0.0 |
| Bachelor's Degree | 0 (0.0%) | 0.0 |
| Graduate Degree | 0 (0.0%) | 0.0 |
| Total | 0 (0.0%) | 0.0 |
Fertility by Education by Marriage Status in Florence
| Educational Attainment | Married | Unmarried |
| Less than High School | 0 (0.0%) | 0 (0.0%) |
| High School Diploma | 0 (0.0%) | 0 (0.0%) |
| College or Associate's Degree | 0 (0.0%) | 0 (0.0%) |
| Bachelor's Degree | 0 (0.0%) | 0 (0.0%) |
| Graduate Degree | 0 (0.0%) | 0 (0.0%) |
| Total | 0 (0.0%) | 0 (0.0%) |
Employment Characteristics in Florence
Employment by Class of Employer in Florence
Among the 7 employed individuals in Florence, private company employees (5 | 71.4%), self-employed (not incorporated) (1 | 14.3%), and not-for-profit organizations (1 | 14.3%) make up the most common classes of employment.
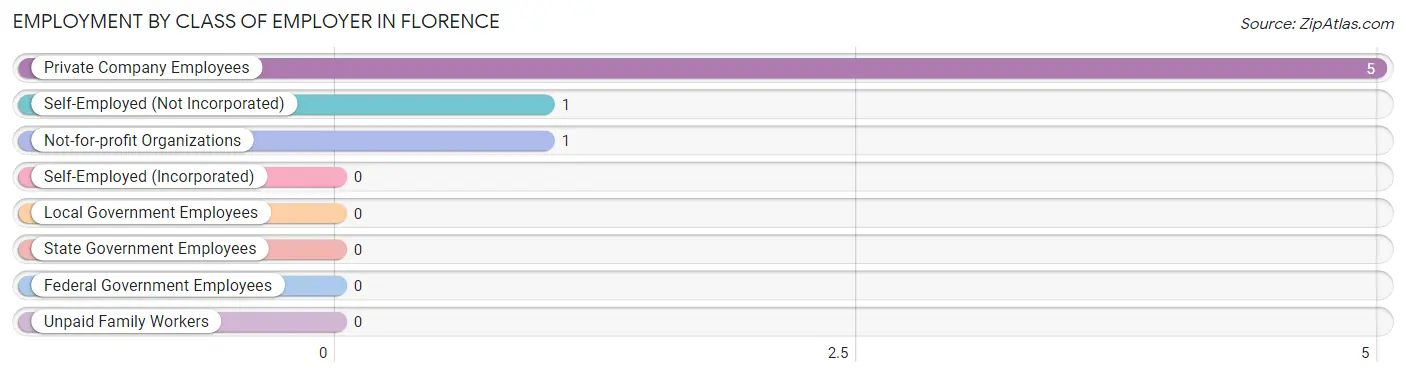
| Employer Class | # Employees | % Employees |
| Private Company Employees | 5 | 71.4% |
| Self-Employed (Incorporated) | 0 | 0.0% |
| Self-Employed (Not Incorporated) | 1 | 14.3% |
| Not-for-profit Organizations | 1 | 14.3% |
| Local Government Employees | 0 | 0.0% |
| State Government Employees | 0 | 0.0% |
| Federal Government Employees | 0 | 0.0% |
| Unpaid Family Workers | 0 | 0.0% |
| Total | 7 | 100.0% |
Employment Status by Age in Florence
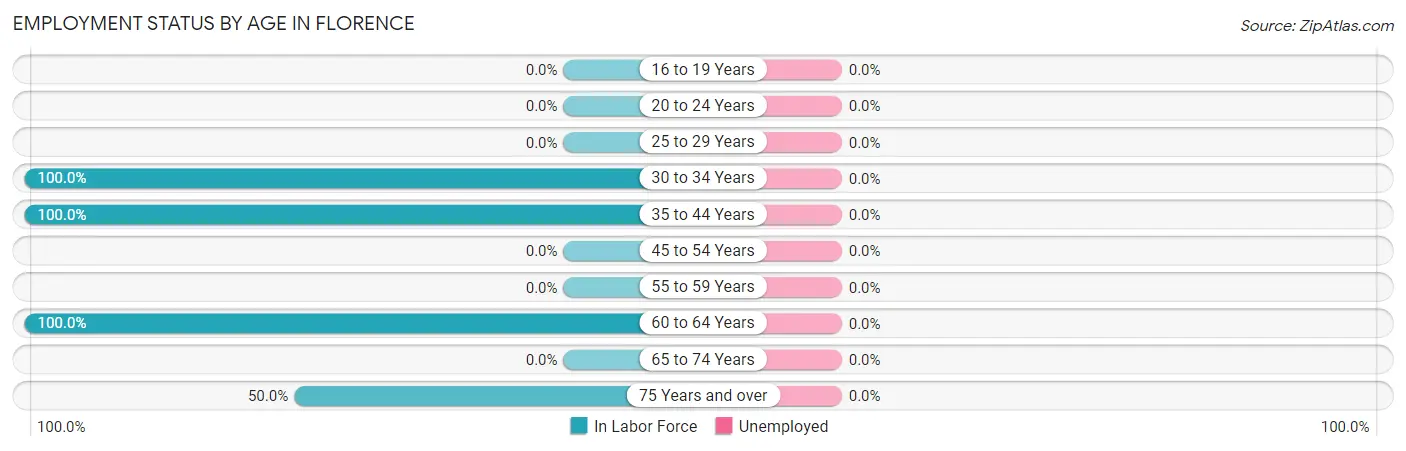
| Age Bracket | In Labor Force | Unemployed |
| 16 to 19 Years | 0 (0.0%) | 0 (0.0%) |
| 20 to 24 Years | 0 (0.0%) | 0 (0.0%) |
| 25 to 29 Years | 0 (0.0%) | 0 (0.0%) |
| 30 to 34 Years | 1 (100.0%) | 0 (0.0%) |
| 35 to 44 Years | 3 (100.0%) | 0 (0.0%) |
| 45 to 54 Years | 0 (0.0%) | 0 (0.0%) |
| 55 to 59 Years | 0 (0.0%) | 0 (0.0%) |
| 60 to 64 Years | 1 (100.0%) | 0 (0.0%) |
| 65 to 74 Years | 0 (0.0%) | 0 (0.0%) |
| 75 Years and over | 2 (50.0%) | 0 (0.0%) |
| Total | 7 (70.0%) | 0 (0.0%) |
Employment Status by Educational Attainment in Florence
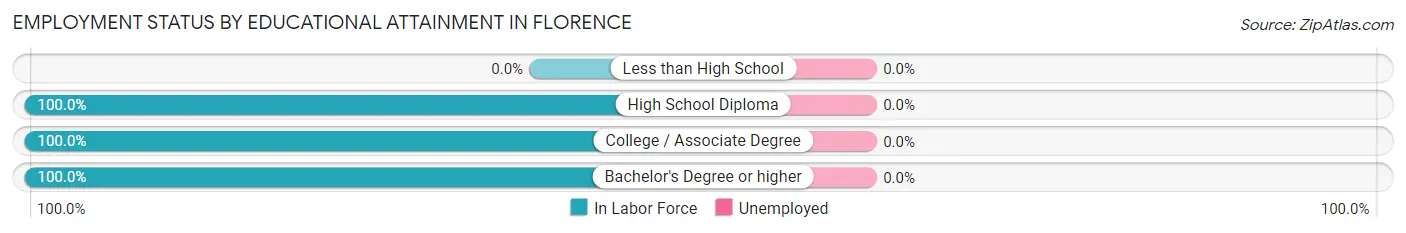
| Educational Attainment | In Labor Force | Unemployed |
| Less than High School | 0 (0.0%) | 0 (0.0%) |
| High School Diploma | 1 (100.0%) | 0 (0.0%) |
| College / Associate Degree | 2 (100.0%) | 0 (0.0%) |
| Bachelor's Degree or higher | 2 (100.0%) | 0 (0.0%) |
| Total | 5 (100.0%) | 0 (0.0%) |
Employment Occupations by Sex in Florence
Management, Business, Science and Arts Occupations
The most common Management, Business, Science and Arts occupations in Florence are Health Diagnosing & Treating (3 | 42.9%), and Health Technologists (3 | 42.9%).
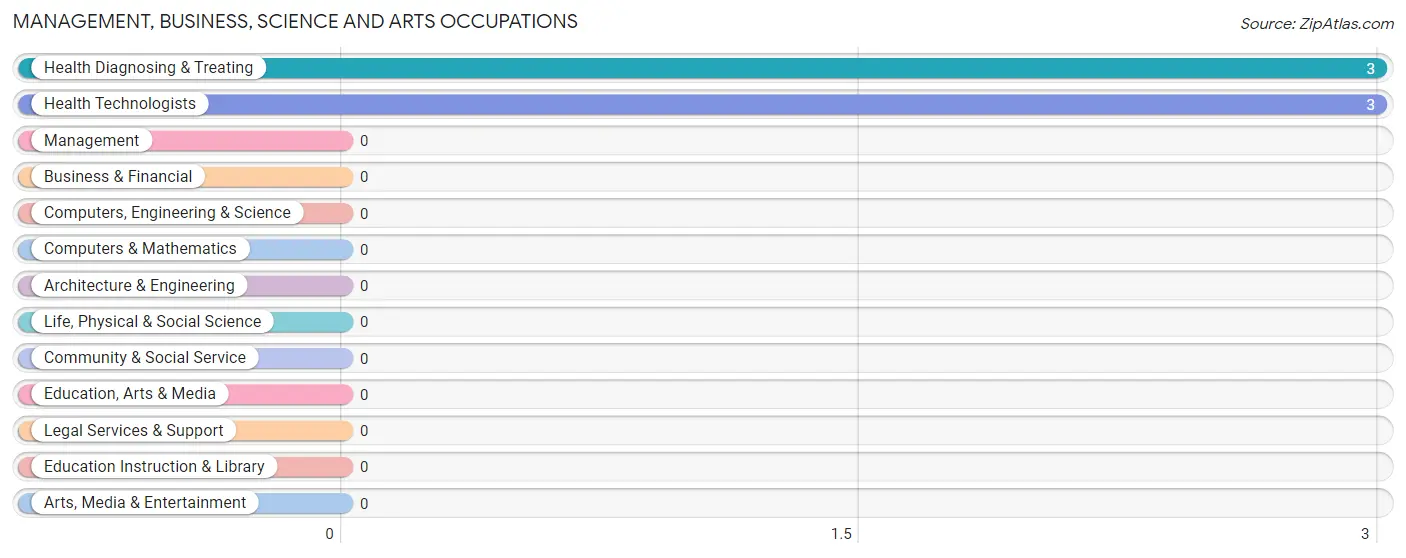
Management, Business, Science and Arts Occupations by Sex
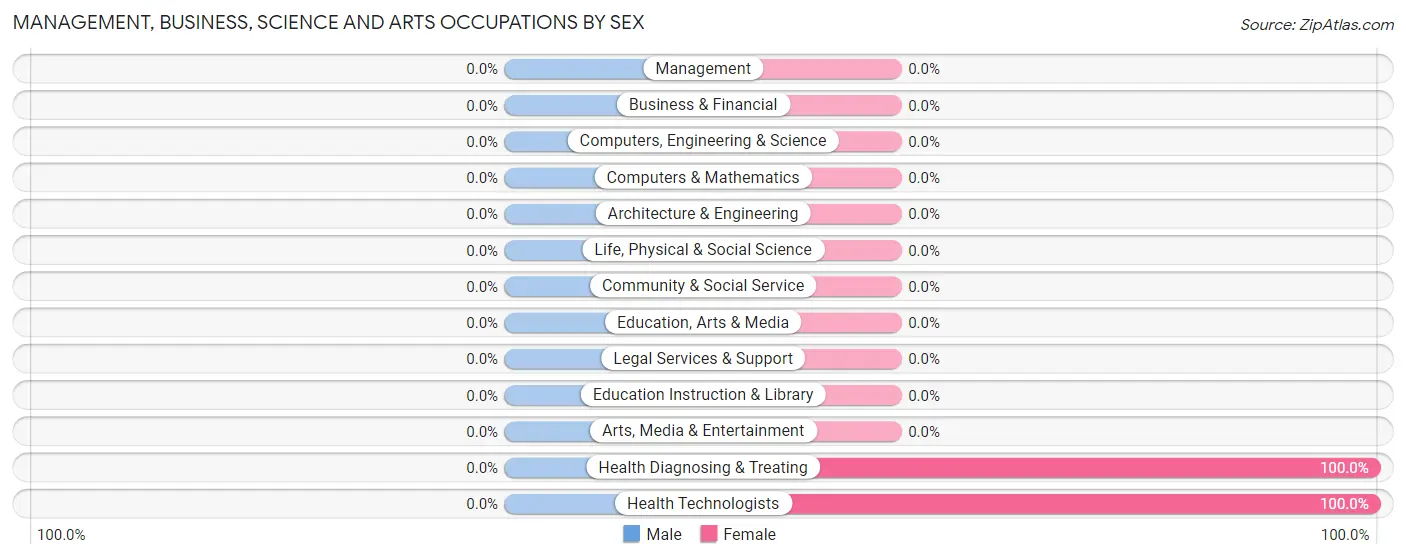
| Occupation | Male | Female |
| Management | 0 (0.0%) | 0 (0.0%) |
| Business & Financial | 0 (0.0%) | 0 (0.0%) |
| Computers, Engineering & Science | 0 (0.0%) | 0 (0.0%) |
| Computers & Mathematics | 0 (0.0%) | 0 (0.0%) |
| Architecture & Engineering | 0 (0.0%) | 0 (0.0%) |
| Life, Physical & Social Science | 0 (0.0%) | 0 (0.0%) |
| Community & Social Service | 0 (0.0%) | 0 (0.0%) |
| Education, Arts & Media | 0 (0.0%) | 0 (0.0%) |
| Legal Services & Support | 0 (0.0%) | 0 (0.0%) |
| Education Instruction & Library | 0 (0.0%) | 0 (0.0%) |
| Arts, Media & Entertainment | 0 (0.0%) | 0 (0.0%) |
| Health Diagnosing & Treating | 0 (0.0%) | 3 (100.0%) |
| Health Technologists | 0 (0.0%) | 3 (100.0%) |
| Total (Category) | 0 (0.0%) | 3 (100.0%) |
| Total (Overall) | 3 (42.9%) | 4 (57.1%) |
Services Occupations
The most common Services occupations in Florence are , and Personal Care & Service (1 | 14.3%).
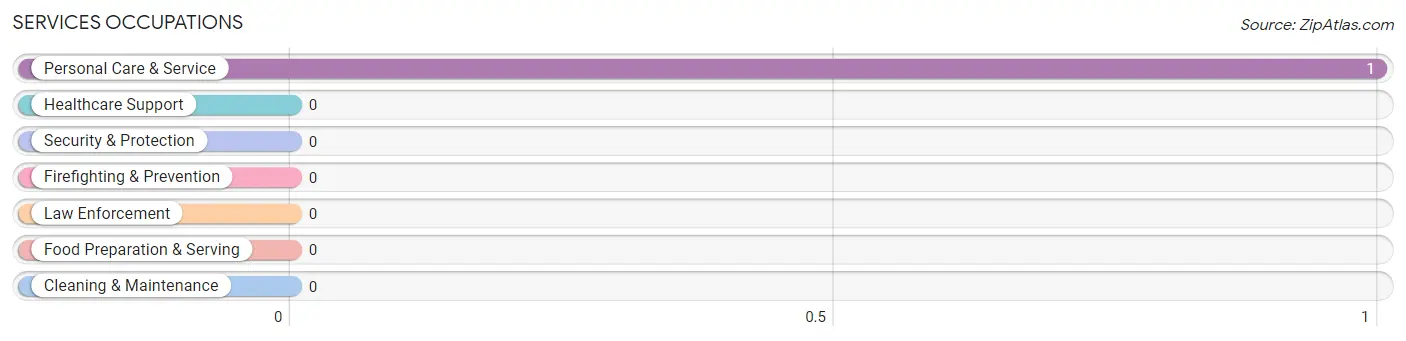
Services Occupations by Sex
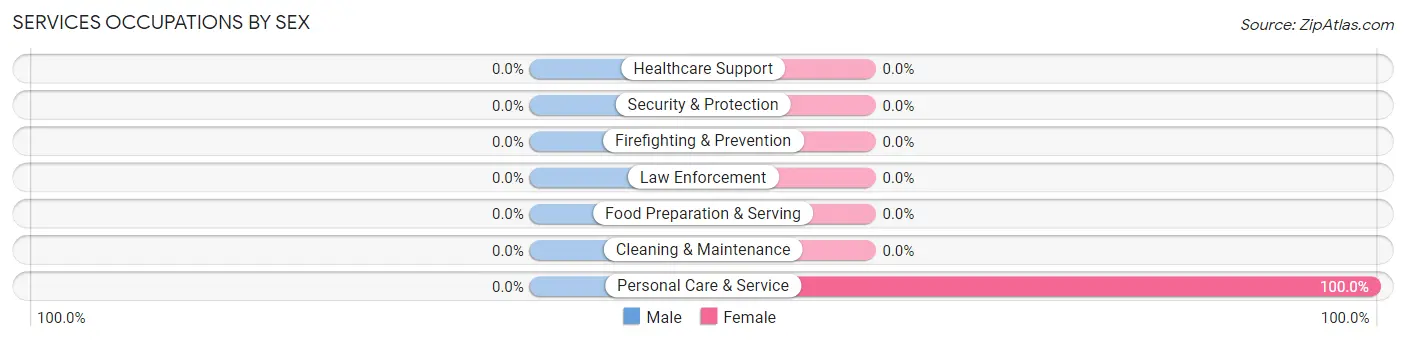
| Occupation | Male | Female |
| Healthcare Support | 0 (0.0%) | 0 (0.0%) |
| Security & Protection | 0 (0.0%) | 0 (0.0%) |
| Firefighting & Prevention | 0 (0.0%) | 0 (0.0%) |
| Law Enforcement | 0 (0.0%) | 0 (0.0%) |
| Food Preparation & Serving | 0 (0.0%) | 0 (0.0%) |
| Cleaning & Maintenance | 0 (0.0%) | 0 (0.0%) |
| Personal Care & Service | 0 (0.0%) | 1 (100.0%) |
| Total (Category) | 0 (0.0%) | 1 (100.0%) |
| Total (Overall) | 3 (42.9%) | 4 (57.1%) |
Sales and Office Occupations

Sales and Office Occupations by Sex

| Occupation | Male | Female |
| Sales & Related | 0 (0.0%) | 0 (0.0%) |
| Office & Administration | 0 (0.0%) | 0 (0.0%) |
| Total (Category) | 0 (0.0%) | 0 (0.0%) |
| Total (Overall) | 3 (42.9%) | 4 (57.1%) |
Natural Resources, Construction and Maintenance Occupations
The most common Natural Resources, Construction and Maintenance occupations in Florence are , and Construction & Extraction (1 | 14.3%).
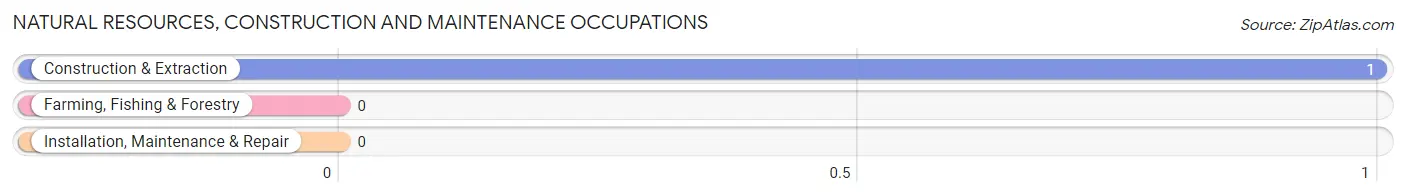
Natural Resources, Construction and Maintenance Occupations by Sex
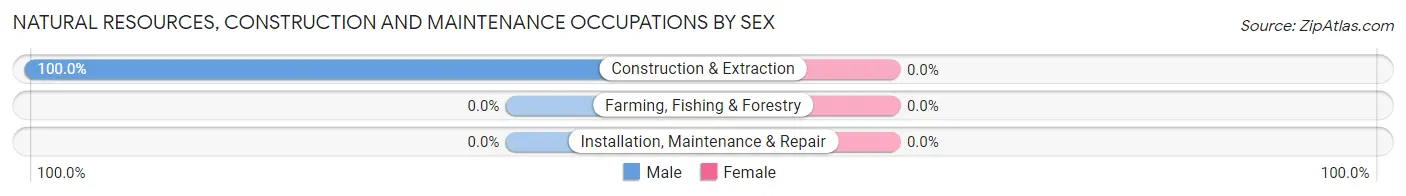
| Occupation | Male | Female |
| Farming, Fishing & Forestry | 0 (0.0%) | 0 (0.0%) |
| Construction & Extraction | 1 (100.0%) | 0 (0.0%) |
| Installation, Maintenance & Repair | 0 (0.0%) | 0 (0.0%) |
| Total (Category) | 1 (100.0%) | 0 (0.0%) |
| Total (Overall) | 3 (42.9%) | 4 (57.1%) |
Production, Transportation and Moving Occupations
The most common Production, Transportation and Moving occupations in Florence are , and Transportation (2 | 28.6%).
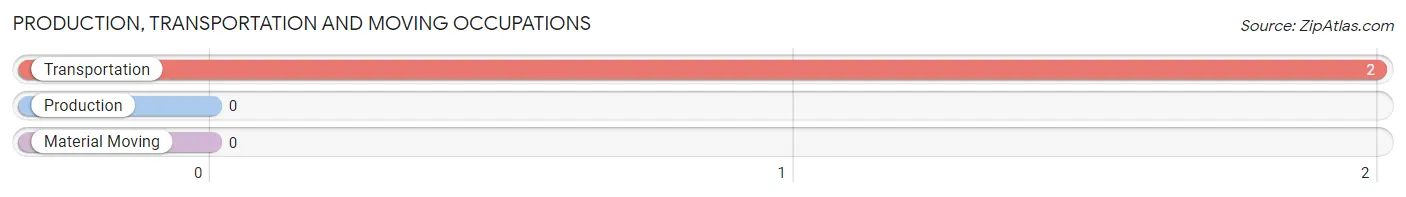
Production, Transportation and Moving Occupations by Sex
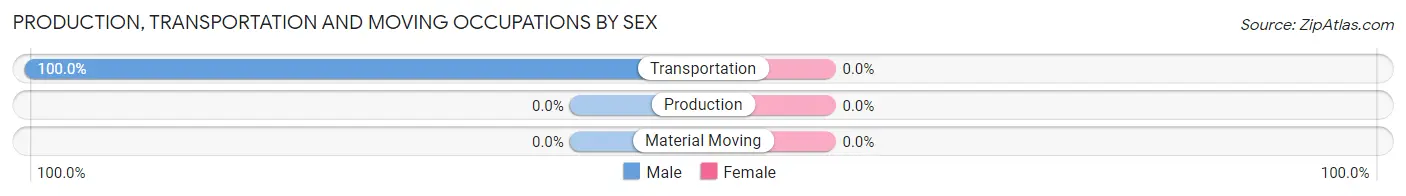
| Occupation | Male | Female |
| Production | 0 (0.0%) | 0 (0.0%) |
| Transportation | 2 (100.0%) | 0 (0.0%) |
| Material Moving | 0 (0.0%) | 0 (0.0%) |
| Total (Category) | 2 (100.0%) | 0 (0.0%) |
| Total (Overall) | 3 (42.9%) | 4 (57.1%) |
Employment Industries by Sex in Florence
Employment Industries in Florence
The major employment industries in Florence include Health Care & Social Assistance (4 | 57.1%), Transportation & Warehousing (2 | 28.6%), and Construction (1 | 14.3%).
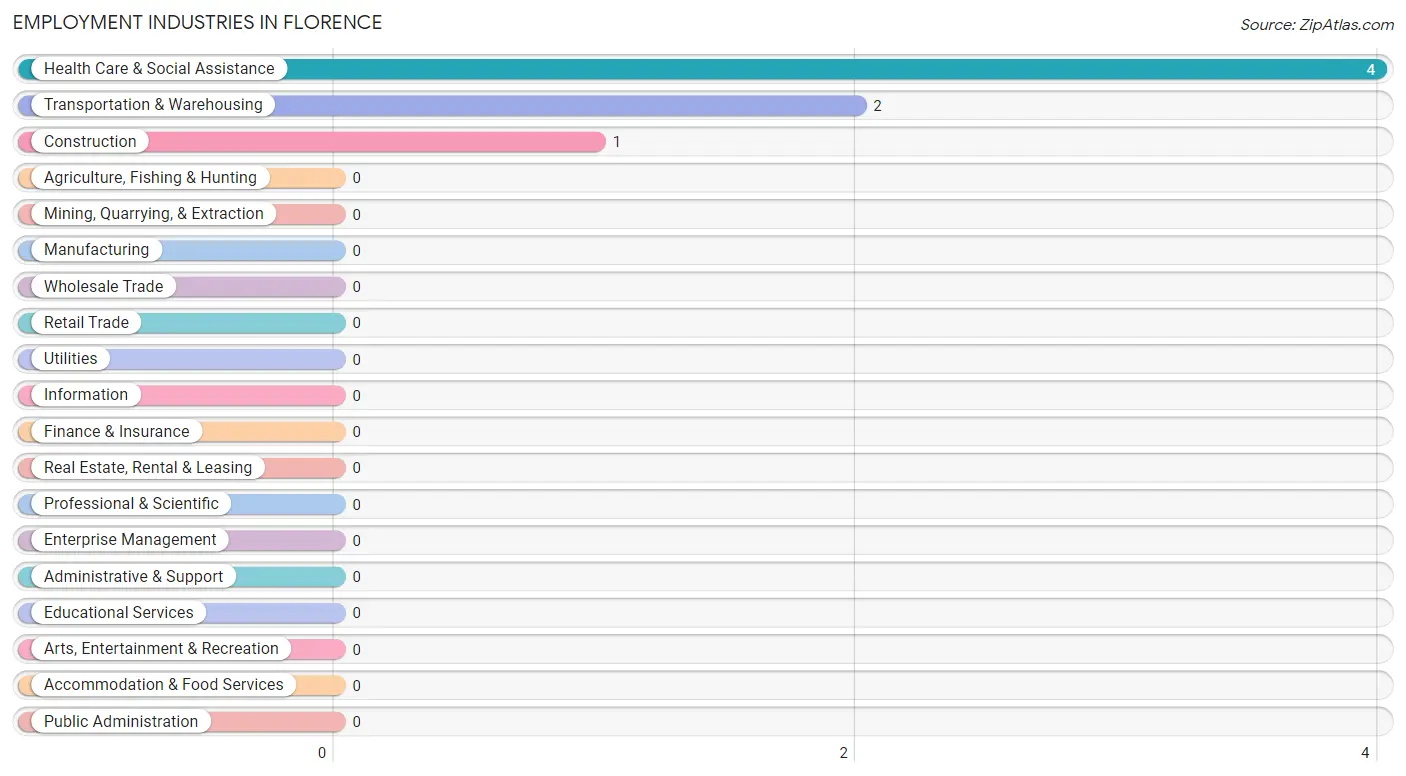
Employment Industries by Sex in Florence
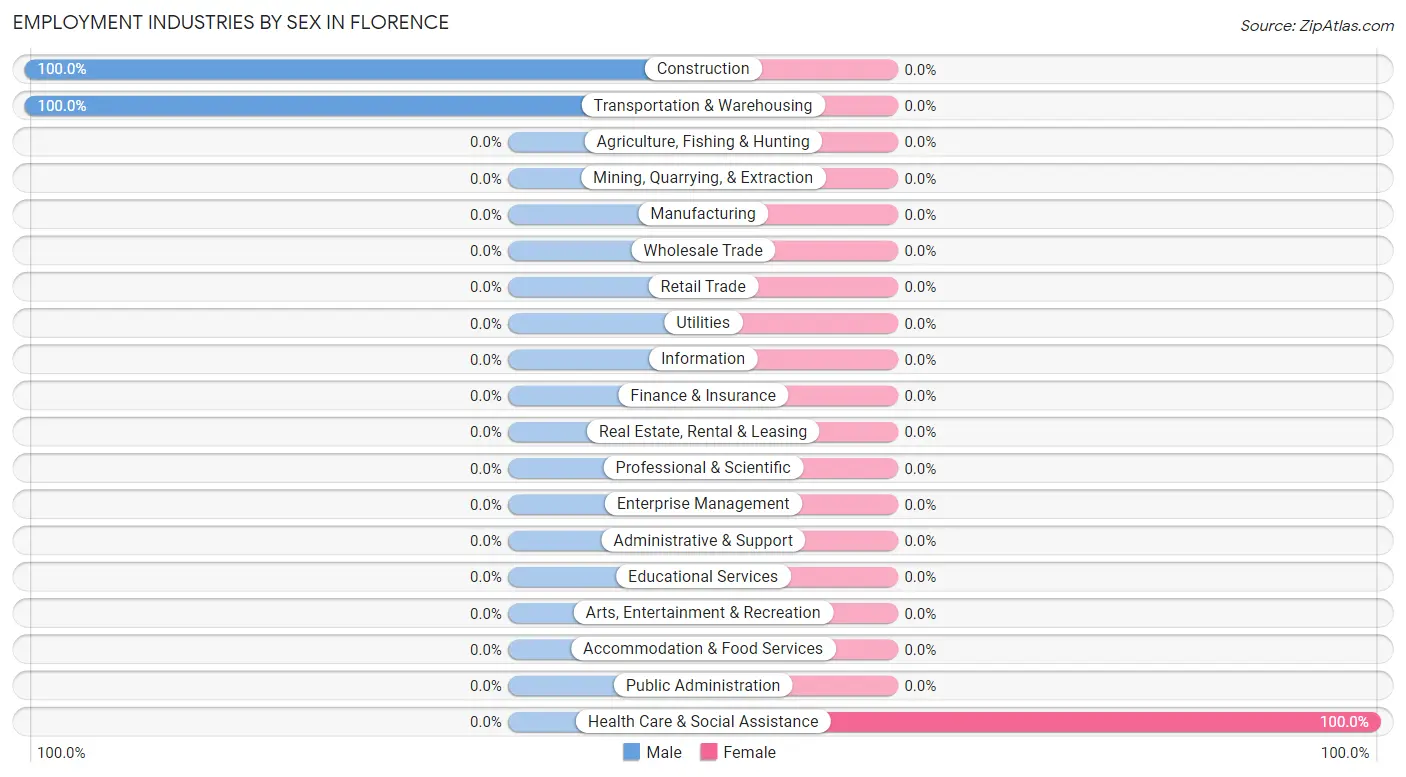
| Industry | Male | Female |
| Agriculture, Fishing & Hunting | 0 (0.0%) | 0 (0.0%) |
| Mining, Quarrying, & Extraction | 0 (0.0%) | 0 (0.0%) |
| Construction | 1 (100.0%) | 0 (0.0%) |
| Manufacturing | 0 (0.0%) | 0 (0.0%) |
| Wholesale Trade | 0 (0.0%) | 0 (0.0%) |
| Retail Trade | 0 (0.0%) | 0 (0.0%) |
| Transportation & Warehousing | 2 (100.0%) | 0 (0.0%) |
| Utilities | 0 (0.0%) | 0 (0.0%) |
| Information | 0 (0.0%) | 0 (0.0%) |
| Finance & Insurance | 0 (0.0%) | 0 (0.0%) |
| Real Estate, Rental & Leasing | 0 (0.0%) | 0 (0.0%) |
| Professional & Scientific | 0 (0.0%) | 0 (0.0%) |
| Enterprise Management | 0 (0.0%) | 0 (0.0%) |
| Administrative & Support | 0 (0.0%) | 0 (0.0%) |
| Educational Services | 0 (0.0%) | 0 (0.0%) |
| Health Care & Social Assistance | 0 (0.0%) | 4 (100.0%) |
| Arts, Entertainment & Recreation | 0 (0.0%) | 0 (0.0%) |
| Accommodation & Food Services | 0 (0.0%) | 0 (0.0%) |
| Public Administration | 0 (0.0%) | 0 (0.0%) |
| Total | 3 (42.9%) | 4 (57.1%) |
Education in Florence
School Enrollment in Florence
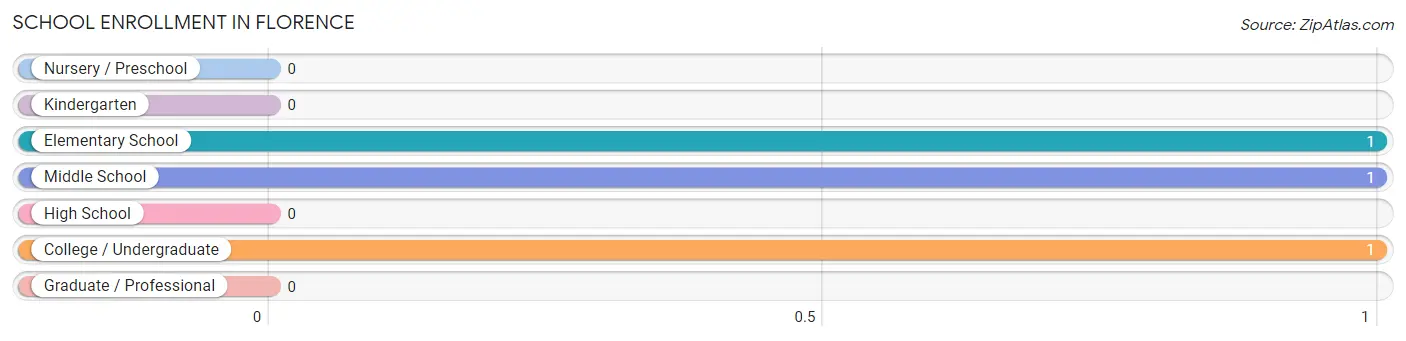
The most common levels of schooling among the 3 students in Florence are elementary school (1 | 33.3%), middle school (1 | 33.3%), and college / undergraduate (1 | 33.3%).
| School Level | # Students | % Students |
| Nursery / Preschool | 0 | 0.0% |
| Kindergarten | 0 | 0.0% |
| Elementary School | 1 | 33.3% |
| Middle School | 1 | 33.3% |
| High School | 0 | 0.0% |
| College / Undergraduate | 1 | 33.3% |
| Graduate / Professional | 0 | 0.0% |
| Total | 3 | 100.0% |
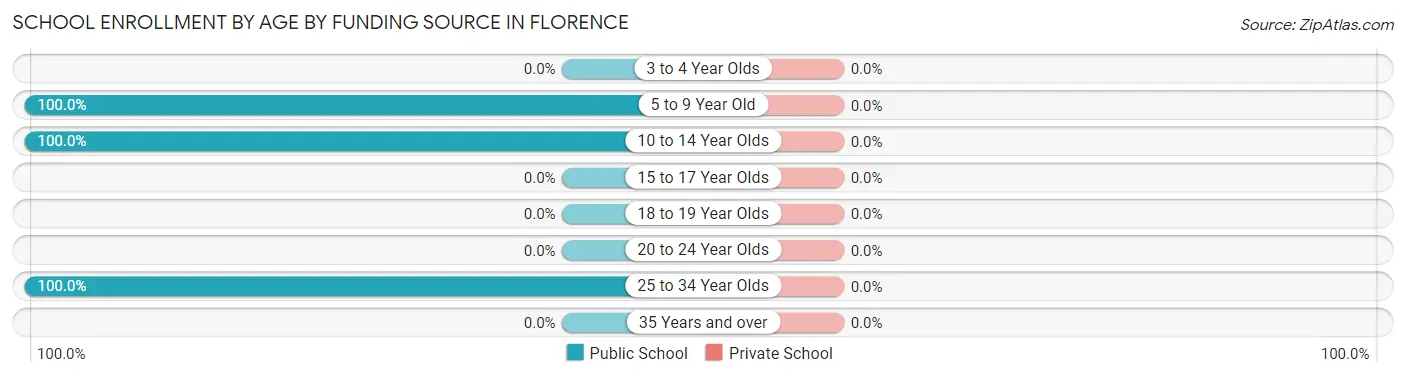
School Enrollment by Age by Funding Source in Florence
| Age Bracket | Public School | Private School |
| 3 to 4 Year Olds | 0 (0.0%) | 0 (0.0%) |
| 5 to 9 Year Old | 1 (100.0%) | 0 (0.0%) |
| 10 to 14 Year Olds | 1 (100.0%) | 0 (0.0%) |
| 15 to 17 Year Olds | 0 (0.0%) | 0 (0.0%) |
| 18 to 19 Year Olds | 0 (0.0%) | 0 (0.0%) |
| 20 to 24 Year Olds | 0 (0.0%) | 0 (0.0%) |
| 25 to 34 Year Olds | 1 (100.0%) | 0 (0.0%) |
| 35 Years and over | 0 (0.0%) | 0 (0.0%) |
| Total | 3 (100.0%) | 0 (0.0%) |
Educational Attainment by Field of Study in Florence
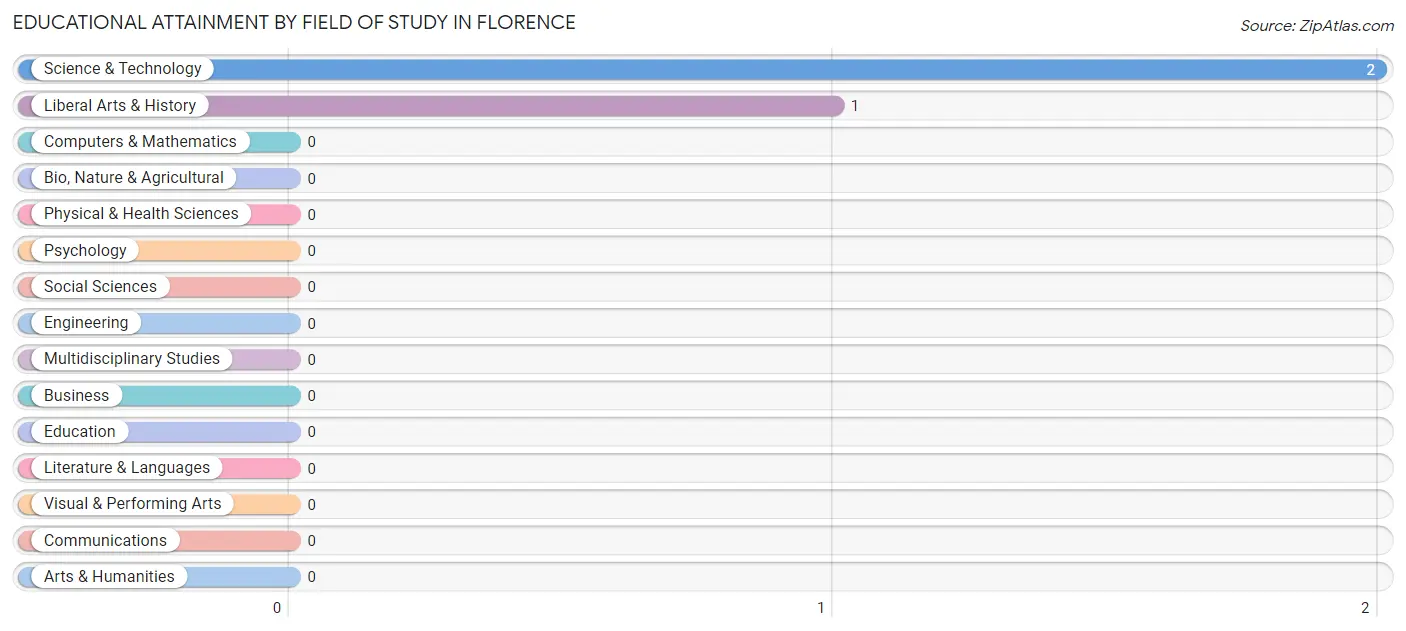
Science & technology (2 | 66.7%), and liberal arts & history (1 | 33.3%) are the most common fields of study among 3 individuals in Florence who have obtained a bachelor's degree or higher.
| Field of Study | # Graduates | % Graduates |
| Computers & Mathematics | 0 | 0.0% |
| Bio, Nature & Agricultural | 0 | 0.0% |
| Physical & Health Sciences | 0 | 0.0% |
| Psychology | 0 | 0.0% |
| Social Sciences | 0 | 0.0% |
| Engineering | 0 | 0.0% |
| Multidisciplinary Studies | 0 | 0.0% |
| Science & Technology | 2 | 66.7% |
| Business | 0 | 0.0% |
| Education | 0 | 0.0% |
| Literature & Languages | 0 | 0.0% |
| Liberal Arts & History | 1 | 33.3% |
| Visual & Performing Arts | 0 | 0.0% |
| Communications | 0 | 0.0% |
| Arts & Humanities | 0 | 0.0% |
| Total | 3 | 100.0% |
Transportation & Commute in Florence
Vehicle Availability by Sex in Florence
The most prevalent vehicle ownership categories in Florence are males with 2 vehicles (3, accounting for 100.0%) and females with 2 vehicles (4, making up 75.0%).
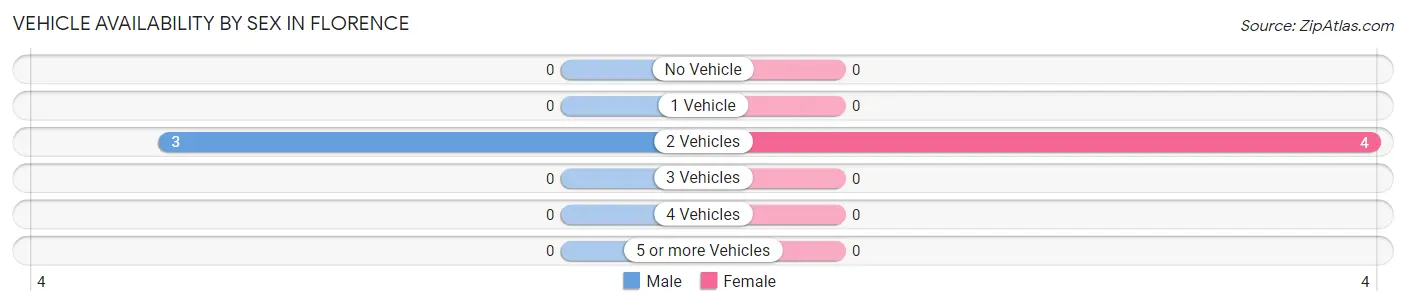
| Vehicles Available | Male | Female |
| No Vehicle | 0 (0.0%) | 0 (0.0%) |
| 1 Vehicle | 0 (0.0%) | 0 (0.0%) |
| 2 Vehicles | 3 (100.0%) | 4 (100.0%) |
| 3 Vehicles | 0 (0.0%) | 0 (0.0%) |
| 4 Vehicles | 0 (0.0%) | 0 (0.0%) |
| 5 or more Vehicles | 0 (0.0%) | 0 (0.0%) |
| Total | 3 (100.0%) | 4 (100.0%) |
Commute Time in Florence
The most frequently occuring commute durations in Florence are 20 to 24 minutes (2 commuters, 28.6%), 30 to 34 minutes (2 commuters, 28.6%), and less than 5 minutes (1 commuters, 14.3%).
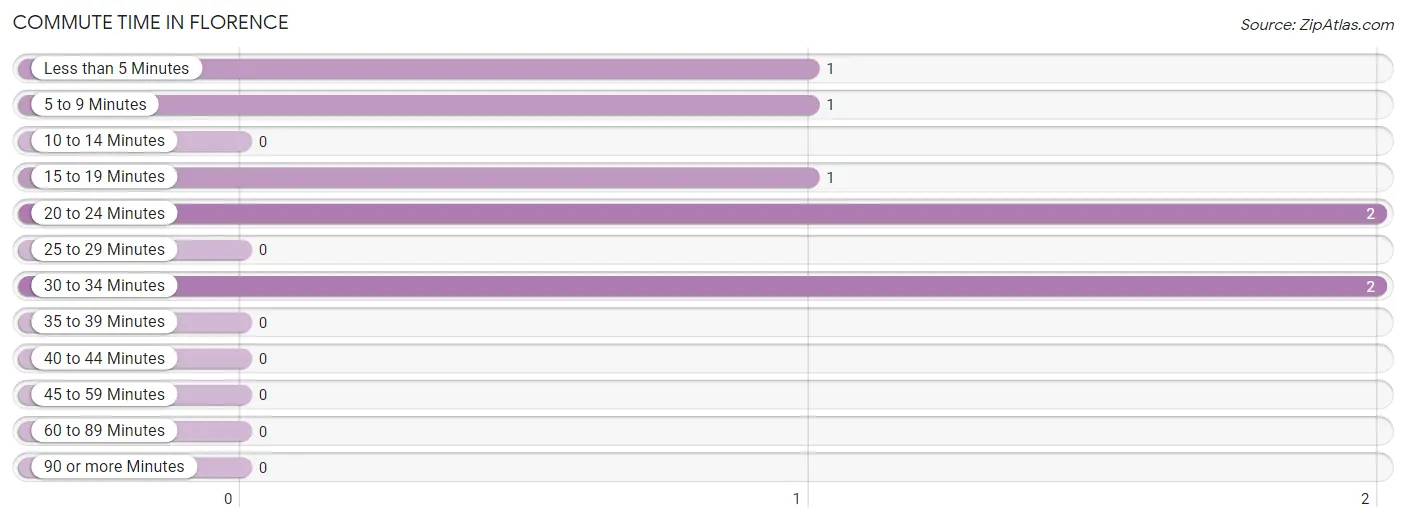
| Commute Time | # Commuters | % Commuters |
| Less than 5 Minutes | 1 | 14.3% |
| 5 to 9 Minutes | 1 | 14.3% |
| 10 to 14 Minutes | 0 | 0.0% |
| 15 to 19 Minutes | 1 | 14.3% |
| 20 to 24 Minutes | 2 | 28.6% |
| 25 to 29 Minutes | 0 | 0.0% |
| 30 to 34 Minutes | 2 | 28.6% |
| 35 to 39 Minutes | 0 | 0.0% |
| 40 to 44 Minutes | 0 | 0.0% |
| 45 to 59 Minutes | 0 | 0.0% |
| 60 to 89 Minutes | 0 | 0.0% |
| 90 or more Minutes | 0 | 0.0% |
Commute Time by Sex in Florence
The most common commute times in Florence are 20 to 24 minutes (2 commuters, 66.7%) for males and 30 to 34 minutes (2 commuters, 50.0%) for females.
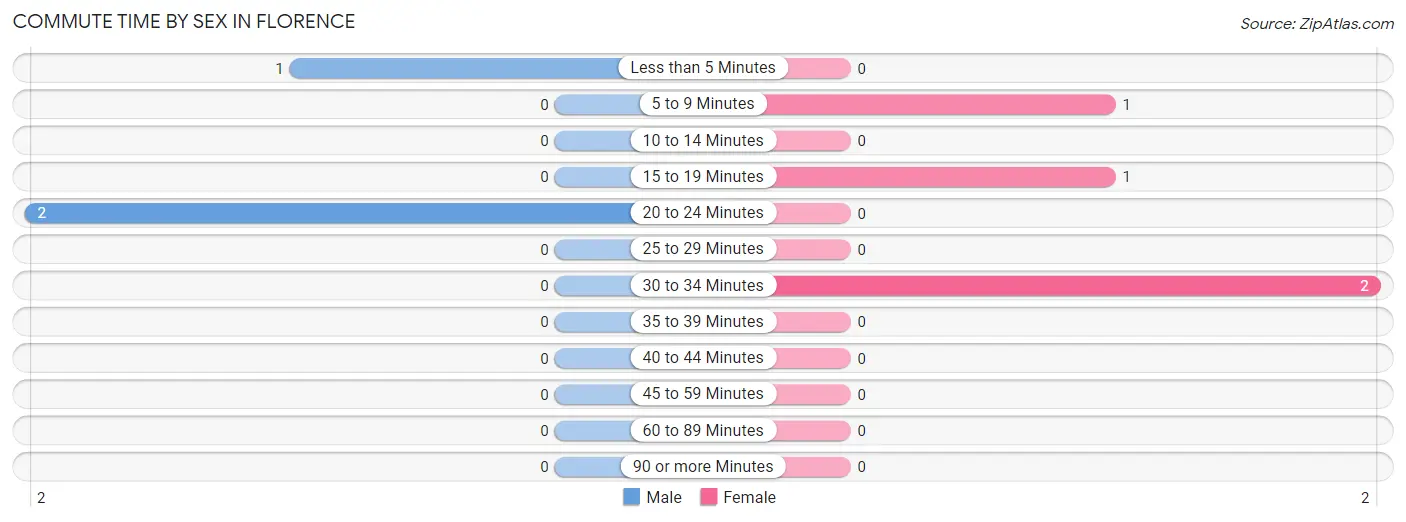
| Commute Time | Male | Female |
| Less than 5 Minutes | 1 (33.3%) | 0 (0.0%) |
| 5 to 9 Minutes | 0 (0.0%) | 1 (25.0%) |
| 10 to 14 Minutes | 0 (0.0%) | 0 (0.0%) |
| 15 to 19 Minutes | 0 (0.0%) | 1 (25.0%) |
| 20 to 24 Minutes | 2 (66.7%) | 0 (0.0%) |
| 25 to 29 Minutes | 0 (0.0%) | 0 (0.0%) |
| 30 to 34 Minutes | 0 (0.0%) | 2 (50.0%) |
| 35 to 39 Minutes | 0 (0.0%) | 0 (0.0%) |
| 40 to 44 Minutes | 0 (0.0%) | 0 (0.0%) |
| 45 to 59 Minutes | 0 (0.0%) | 0 (0.0%) |
| 60 to 89 Minutes | 0 (0.0%) | 0 (0.0%) |
| 90 or more Minutes | 0 (0.0%) | 0 (0.0%) |
Time of Departure to Work by Sex in Florence
The most frequent times of departure to work in Florence are 12:00 PM to 3:59 PM (2, 66.7%) for males and 7:00 AM to 7:29 AM (2, 50.0%) for females.
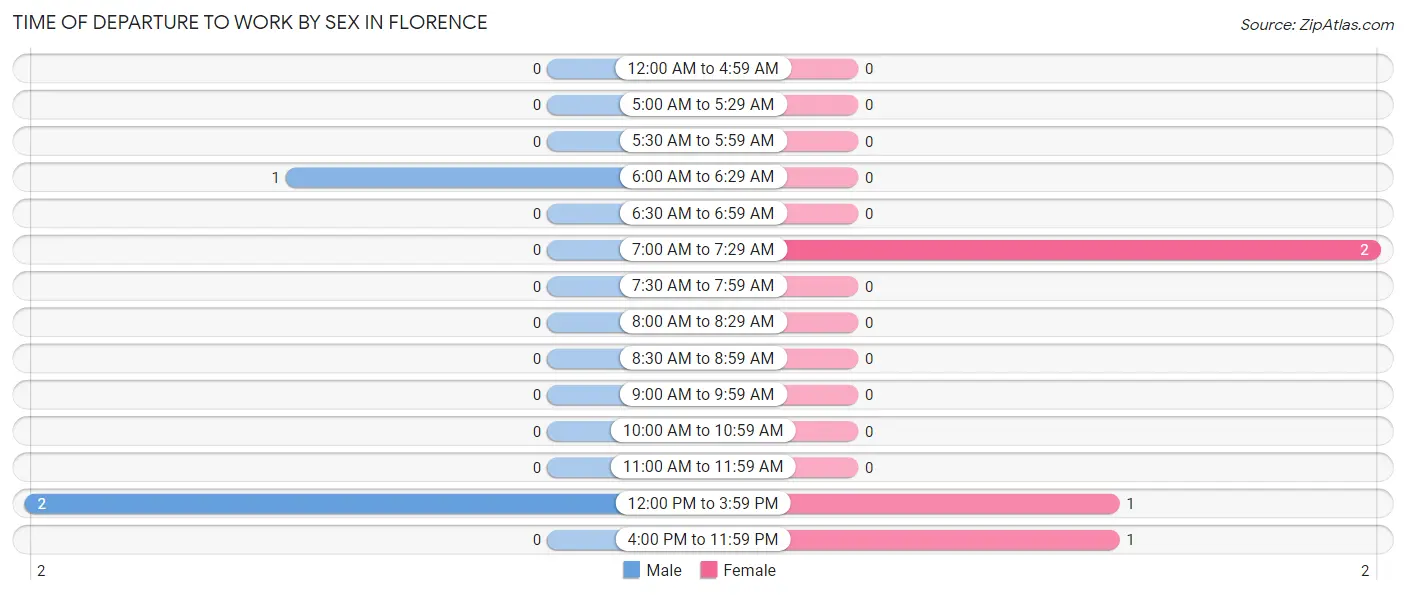
| Time of Departure | Male | Female |
| 12:00 AM to 4:59 AM | 0 (0.0%) | 0 (0.0%) |
| 5:00 AM to 5:29 AM | 0 (0.0%) | 0 (0.0%) |
| 5:30 AM to 5:59 AM | 0 (0.0%) | 0 (0.0%) |
| 6:00 AM to 6:29 AM | 1 (33.3%) | 0 (0.0%) |
| 6:30 AM to 6:59 AM | 0 (0.0%) | 0 (0.0%) |
| 7:00 AM to 7:29 AM | 0 (0.0%) | 2 (50.0%) |
| 7:30 AM to 7:59 AM | 0 (0.0%) | 0 (0.0%) |
| 8:00 AM to 8:29 AM | 0 (0.0%) | 0 (0.0%) |
| 8:30 AM to 8:59 AM | 0 (0.0%) | 0 (0.0%) |
| 9:00 AM to 9:59 AM | 0 (0.0%) | 0 (0.0%) |
| 10:00 AM to 10:59 AM | 0 (0.0%) | 0 (0.0%) |
| 11:00 AM to 11:59 AM | 0 (0.0%) | 0 (0.0%) |
| 12:00 PM to 3:59 PM | 2 (66.7%) | 1 (25.0%) |
| 4:00 PM to 11:59 PM | 0 (0.0%) | 1 (25.0%) |
| Total | 3 (100.0%) | 4 (100.0%) |
Housing Occupancy in Florence
Occupancy by Ownership in Florence
Of the total 5 dwellings in Florence, owner-occupied units account for 5 (100.0%), while renter-occupied units make up 0 (0.0%).
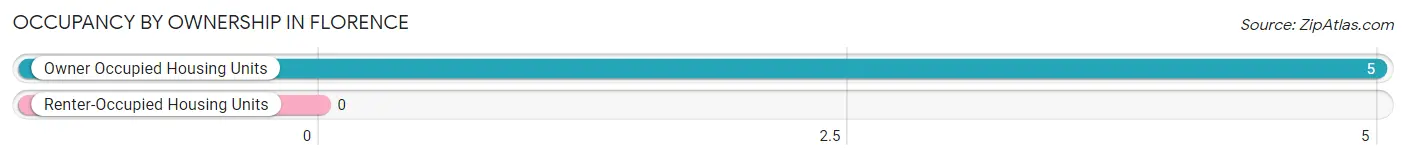
| Occupancy | # Housing Units | % Housing Units |
| Owner Occupied Housing Units | 5 | 100.0% |
| Renter-Occupied Housing Units | 0 | 0.0% |
| Total Occupied Housing Units | 5 | 100.0% |
Occupancy by Household Size in Florence
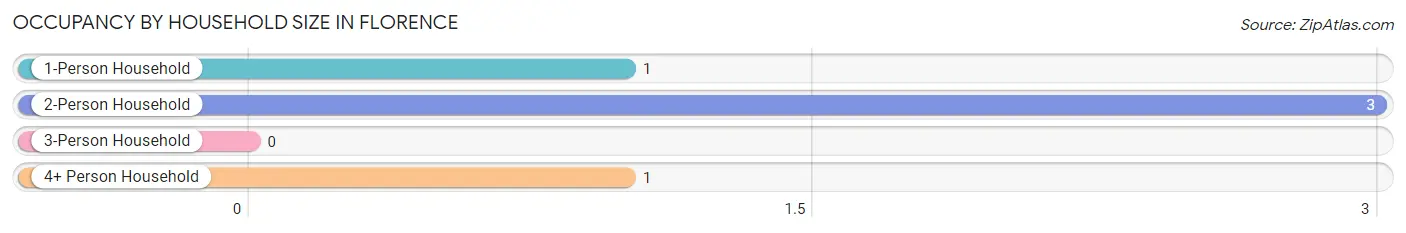
| Household Size | # Housing Units | % Housing Units |
| 1-Person Household | 1 | 20.0% |
| 2-Person Household | 3 | 60.0% |
| 3-Person Household | 0 | 0.0% |
| 4+ Person Household | 1 | 20.0% |
| Total Housing Units | 5 | 100.0% |
Occupancy by Ownership by Household Size in Florence
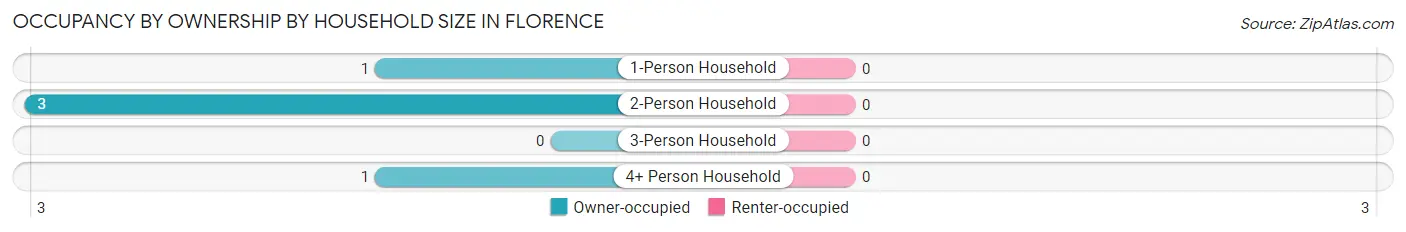
| Household Size | Owner-occupied | Renter-occupied |
| 1-Person Household | 1 (100.0%) | 0 (0.0%) |
| 2-Person Household | 3 (100.0%) | 0 (0.0%) |
| 3-Person Household | 0 (0.0%) | 0 (0.0%) |
| 4+ Person Household | 1 (100.0%) | 0 (0.0%) |
| Total Housing Units | 5 (100.0%) | 0 (0.0%) |
Occupancy by Educational Attainment in Florence
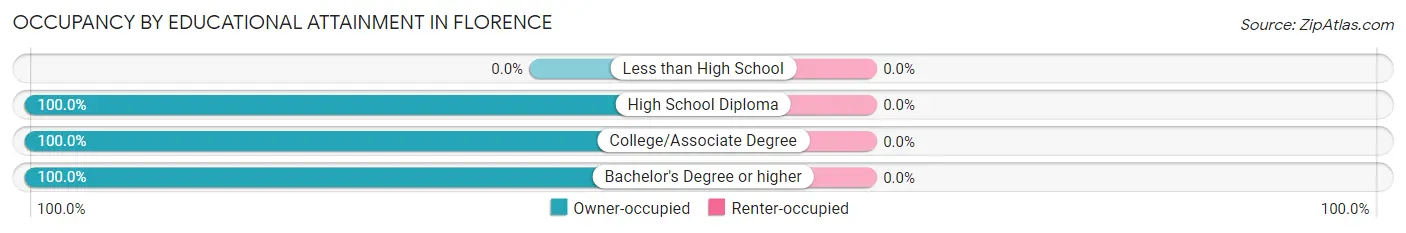
| Household Size | Owner-occupied | Renter-occupied |
| Less than High School | 0 (0.0%) | 0 (0.0%) |
| High School Diploma | 3 (100.0%) | 0 (0.0%) |
| College/Associate Degree | 1 (100.0%) | 0 (0.0%) |
| Bachelor's Degree or higher | 1 (100.0%) | 0 (0.0%) |
Occupancy by Age of Householder in Florence
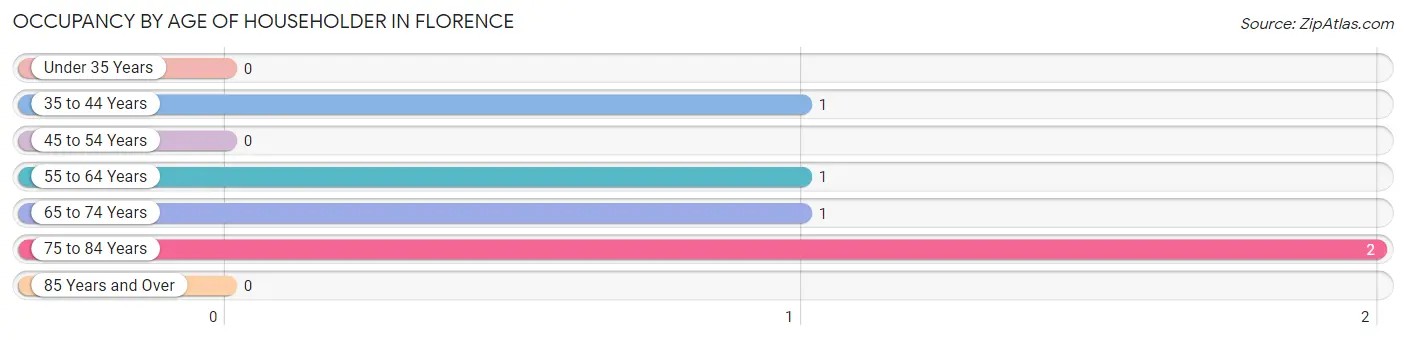
| Age Bracket | # Households | % Households |
| Under 35 Years | 0 | 0.0% |
| 35 to 44 Years | 1 | 20.0% |
| 45 to 54 Years | 0 | 0.0% |
| 55 to 64 Years | 1 | 20.0% |
| 65 to 74 Years | 1 | 20.0% |
| 75 to 84 Years | 2 | 40.0% |
| 85 Years and Over | 0 | 0.0% |
| Total | 5 | 100.0% |
Housing Finances in Florence
Median Income by Occupancy in Florence
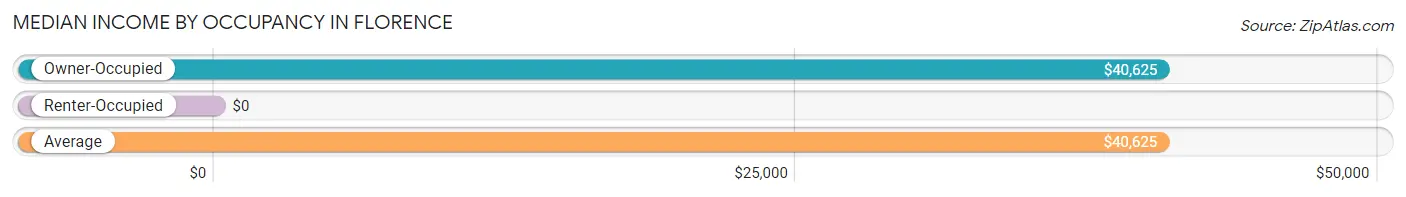
| Occupancy Type | # Households | Median Income |
| Owner-Occupied | 5 (100.0%) | $40,625 |
| Renter-Occupied | 0 (0.0%) | $0 |
| Average | 5 (100.0%) | $40,625 |
Occupancy by Householder Income Bracket in Florence
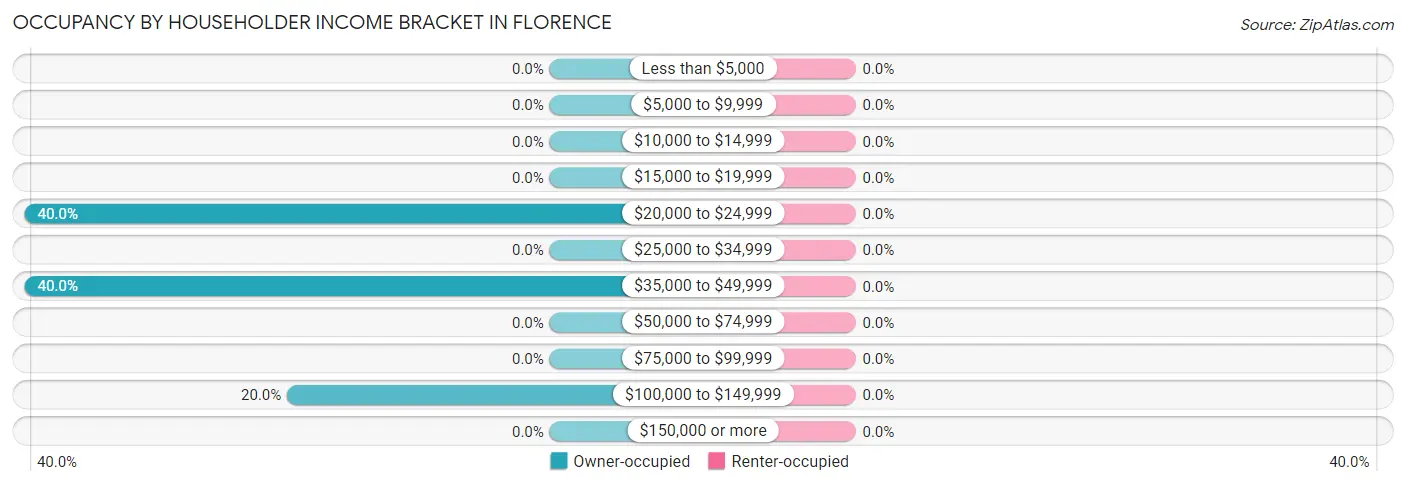
| Income Bracket | Owner-occupied | Renter-occupied |
| Less than $5,000 | 0 (0.0%) | 0 (0.0%) |
| $5,000 to $9,999 | 0 (0.0%) | 0 (0.0%) |
| $10,000 to $14,999 | 0 (0.0%) | 0 (0.0%) |
| $15,000 to $19,999 | 0 (0.0%) | 0 (0.0%) |
| $20,000 to $24,999 | 2 (40.0%) | 0 (0.0%) |
| $25,000 to $34,999 | 0 (0.0%) | 0 (0.0%) |
| $35,000 to $49,999 | 2 (40.0%) | 0 (0.0%) |
| $50,000 to $74,999 | 0 (0.0%) | 0 (0.0%) |
| $75,000 to $99,999 | 0 (0.0%) | 0 (0.0%) |
| $100,000 to $149,999 | 1 (20.0%) | 0 (0.0%) |
| $150,000 or more | 0 (0.0%) | 0 (0.0%) |
| Total | 5 (100.0%) | 0 (0.0%) |
Monthly Housing Cost Tiers in Florence
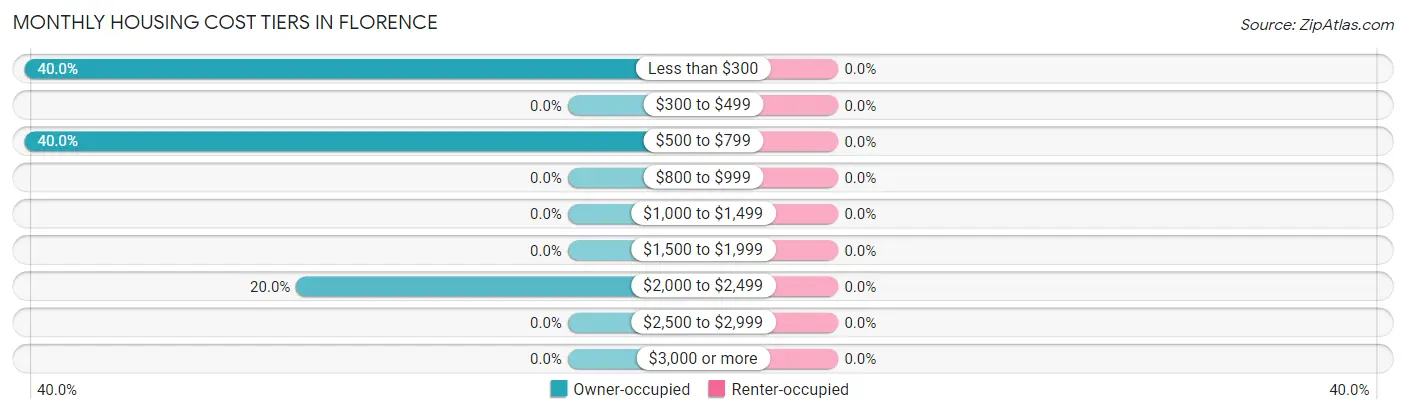
| Monthly Cost | Owner-occupied | Renter-occupied |
| Less than $300 | 2 (40.0%) | 0 (0.0%) |
| $300 to $499 | 0 (0.0%) | 0 (0.0%) |
| $500 to $799 | 2 (40.0%) | 0 (0.0%) |
| $800 to $999 | 0 (0.0%) | 0 (0.0%) |
| $1,000 to $1,499 | 0 (0.0%) | 0 (0.0%) |
| $1,500 to $1,999 | 0 (0.0%) | 0 (0.0%) |
| $2,000 to $2,499 | 1 (20.0%) | 0 (0.0%) |
| $2,500 to $2,999 | 0 (0.0%) | 0 (0.0%) |
| $3,000 or more | 0 (0.0%) | 0 (0.0%) |
| Total | 5 (100.0%) | 0 (0.0%) |
Physical Housing Characteristics in Florence
Housing Structures in Florence
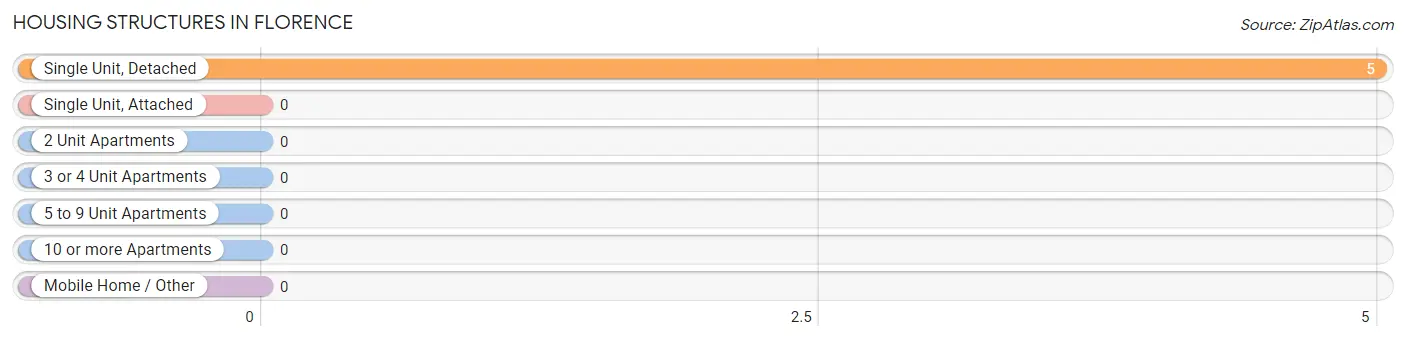
| Structure Type | # Housing Units | % Housing Units |
| Single Unit, Detached | 5 | 100.0% |
| Single Unit, Attached | 0 | 0.0% |
| 2 Unit Apartments | 0 | 0.0% |
| 3 or 4 Unit Apartments | 0 | 0.0% |
| 5 to 9 Unit Apartments | 0 | 0.0% |
| 10 or more Apartments | 0 | 0.0% |
| Mobile Home / Other | 0 | 0.0% |
| Total | 5 | 100.0% |
Housing Structures by Occupancy in Florence
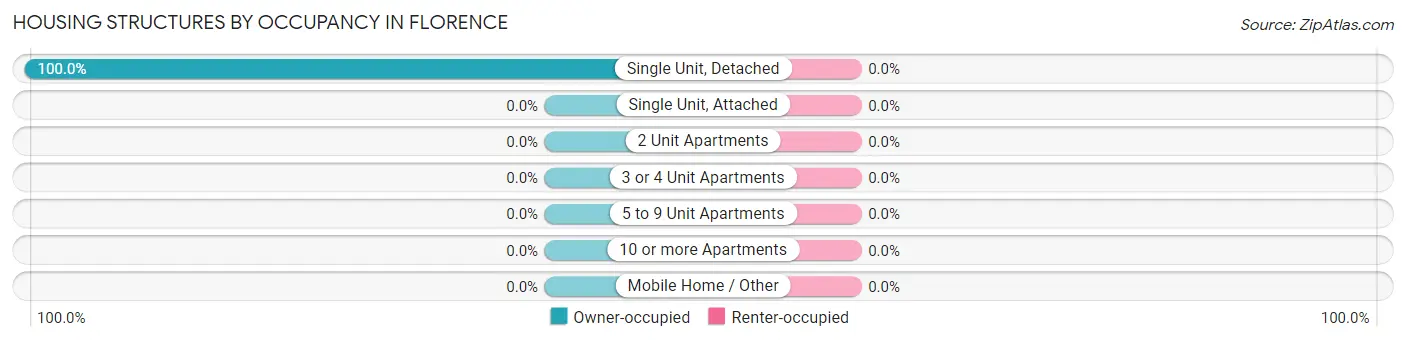
| Structure Type | Owner-occupied | Renter-occupied |
| Single Unit, Detached | 5 (100.0%) | 0 (0.0%) |
| Single Unit, Attached | 0 (0.0%) | 0 (0.0%) |
| 2 Unit Apartments | 0 (0.0%) | 0 (0.0%) |
| 3 or 4 Unit Apartments | 0 (0.0%) | 0 (0.0%) |
| 5 to 9 Unit Apartments | 0 (0.0%) | 0 (0.0%) |
| 10 or more Apartments | 0 (0.0%) | 0 (0.0%) |
| Mobile Home / Other | 0 (0.0%) | 0 (0.0%) |
| Total | 5 (100.0%) | 0 (0.0%) |
Housing Structures by Number of Rooms in Florence
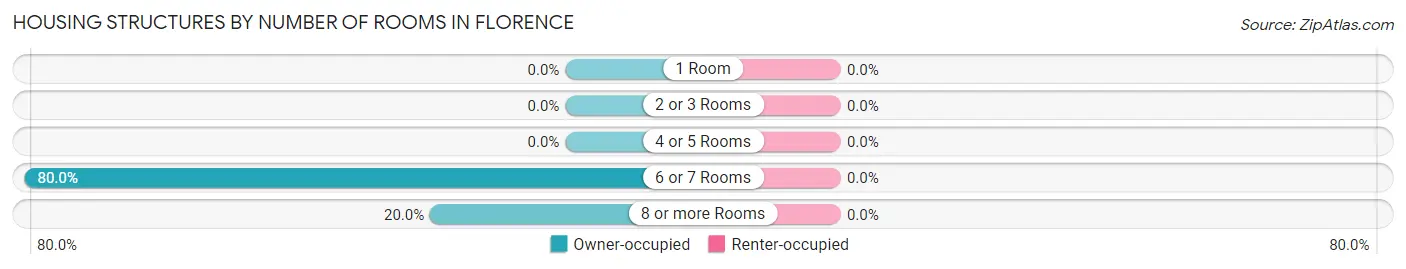
| Number of Rooms | Owner-occupied | Renter-occupied |
| 1 Room | 0 (0.0%) | 0 (0.0%) |
| 2 or 3 Rooms | 0 (0.0%) | 0 (0.0%) |
| 4 or 5 Rooms | 0 (0.0%) | 0 (0.0%) |
| 6 or 7 Rooms | 4 (80.0%) | 0 (0.0%) |
| 8 or more Rooms | 1 (20.0%) | 0 (0.0%) |
| Total | 5 (100.0%) | 0 (0.0%) |
Housing Structure by Heating Type in Florence
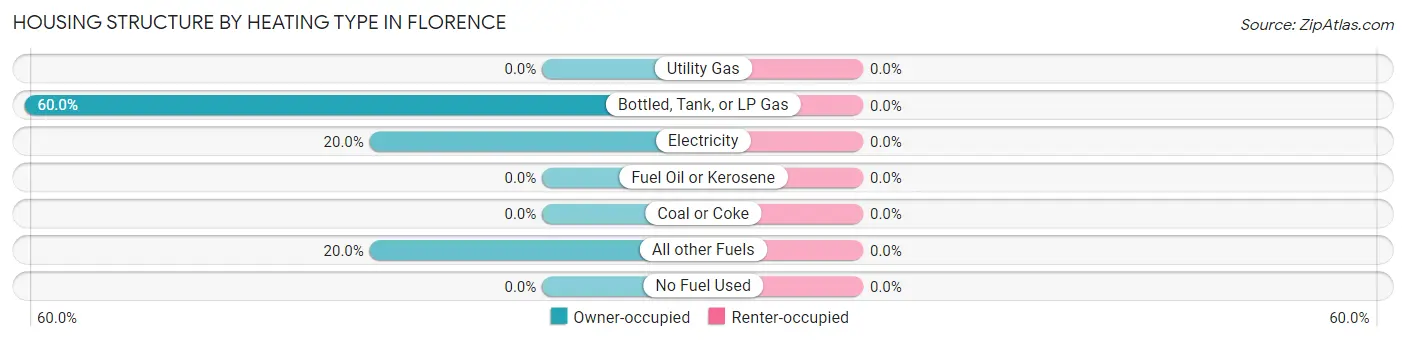
| Heating Type | Owner-occupied | Renter-occupied |
| Utility Gas | 0 (0.0%) | 0 (0.0%) |
| Bottled, Tank, or LP Gas | 3 (60.0%) | 0 (0.0%) |
| Electricity | 1 (20.0%) | 0 (0.0%) |
| Fuel Oil or Kerosene | 0 (0.0%) | 0 (0.0%) |
| Coal or Coke | 0 (0.0%) | 0 (0.0%) |
| All other Fuels | 1 (20.0%) | 0 (0.0%) |
| No Fuel Used | 0 (0.0%) | 0 (0.0%) |
| Total | 5 (100.0%) | 0 (0.0%) |
Household Vehicle Usage in Florence
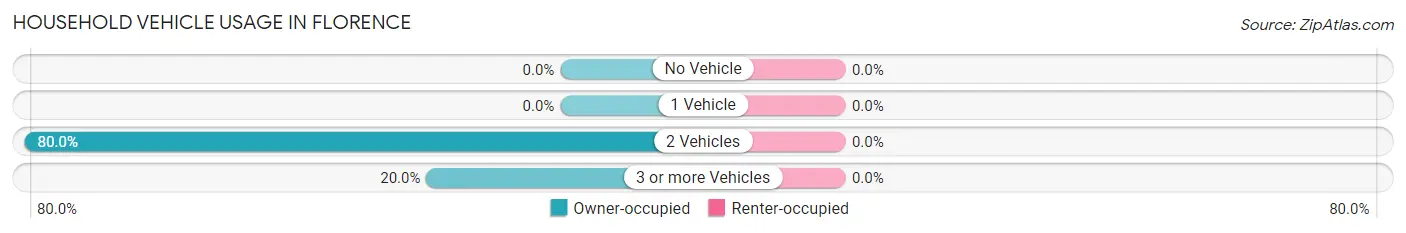
| Vehicles per Household | Owner-occupied | Renter-occupied |
| No Vehicle | 0 (0.0%) | 0 (0.0%) |
| 1 Vehicle | 0 (0.0%) | 0 (0.0%) |
| 2 Vehicles | 4 (80.0%) | 0 (0.0%) |
| 3 or more Vehicles | 1 (20.0%) | 0 (0.0%) |
| Total | 5 (100.0%) | 0 (0.0%) |
Real Estate & Mortgages in Florence
Real Estate and Mortgage Overview in Florence
| Characteristic | Without Mortgage | With Mortgage |
| Housing Units | 4 | 1 |
| Median Property Value | - | - |
| Median Household Income | $32,500 | $0 |
| Monthly Housing Costs | - | - |
| Real Estate Taxes | $1,000 | $0 |
Property Value by Mortgage Status in Florence
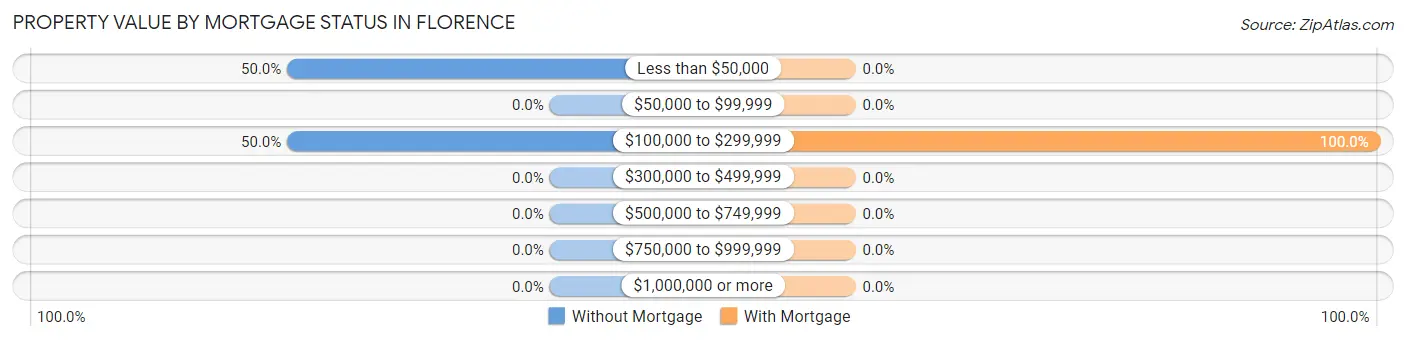
| Property Value | Without Mortgage | With Mortgage |
| Less than $50,000 | 2 (50.0%) | 0 (0.0%) |
| $50,000 to $99,999 | 0 (0.0%) | 0 (0.0%) |
| $100,000 to $299,999 | 2 (50.0%) | 1 (100.0%) |
| $300,000 to $499,999 | 0 (0.0%) | 0 (0.0%) |
| $500,000 to $749,999 | 0 (0.0%) | 0 (0.0%) |
| $750,000 to $999,999 | 0 (0.0%) | 0 (0.0%) |
| $1,000,000 or more | 0 (0.0%) | 0 (0.0%) |
| Total | 4 (100.0%) | 1 (100.0%) |
Household Income by Mortgage Status in Florence
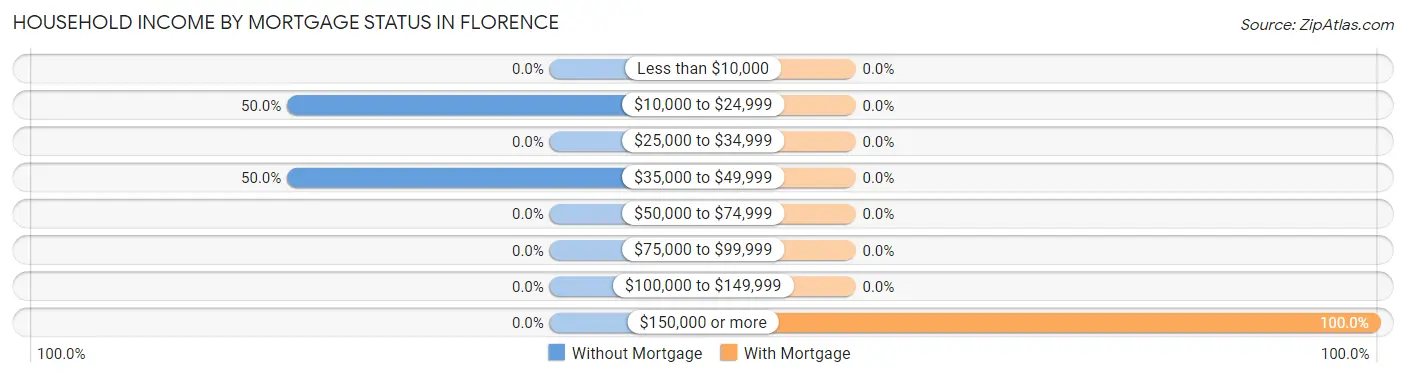
| Household Income | Without Mortgage | With Mortgage |
| Less than $10,000 | 0 (0.0%) | 0 (0.0%) |
| $10,000 to $24,999 | 2 (50.0%) | 0 (0.0%) |
| $25,000 to $34,999 | 0 (0.0%) | 0 (0.0%) |
| $35,000 to $49,999 | 2 (50.0%) | 0 (0.0%) |
| $50,000 to $74,999 | 0 (0.0%) | 0 (0.0%) |
| $75,000 to $99,999 | 0 (0.0%) | 0 (0.0%) |
| $100,000 to $149,999 | 0 (0.0%) | 0 (0.0%) |
| $150,000 or more | 0 (0.0%) | 1 (100.0%) |
| Total | 4 (100.0%) | 1 (100.0%) |
Property Value to Household Income Ratio in Florence
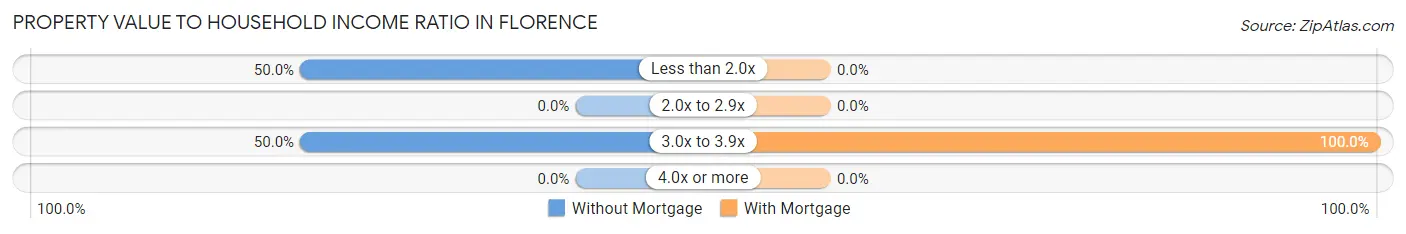
| Value-to-Income Ratio | Without Mortgage | With Mortgage |
| Less than 2.0x | 2 (50.0%) | 0 (0.0%) |
| 2.0x to 2.9x | 0 (0.0%) | 0 (0.0%) |
| 3.0x to 3.9x | 2 (50.0%) | 1 (100.0%) |
| 4.0x or more | 0 (0.0%) | 0 (0.0%) |
| Total | 4 (100.0%) | 1 (100.0%) |
Real Estate Taxes by Mortgage Status in Florence
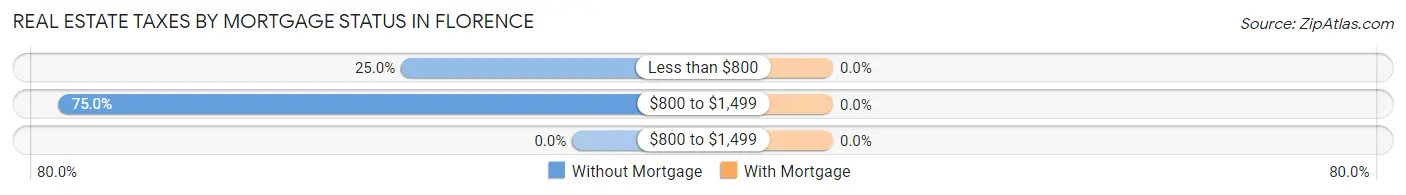
| Property Taxes | Without Mortgage | With Mortgage |
| Less than $800 | 1 (25.0%) | 0 (0.0%) |
| $800 to $1,499 | 3 (75.0%) | 0 (0.0%) |
| $800 to $1,499 | 0 (0.0%) | 0 (0.0%) |
| Total | 4 (100.0%) | 1 (100.0%) |
Health & Disability in Florence
Health Insurance Coverage by Age in Florence
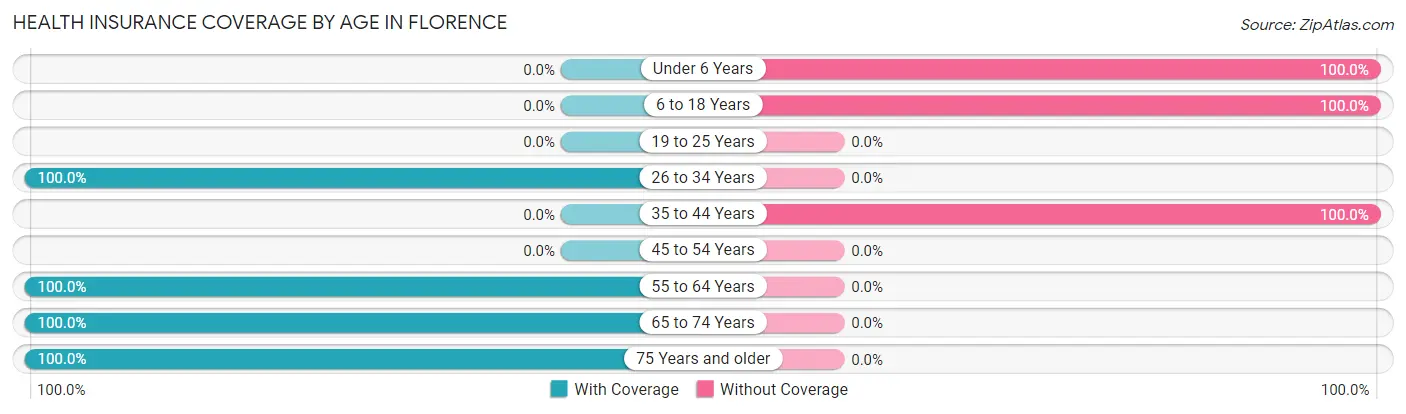
| Age Bracket | With Coverage | Without Coverage |
| Under 6 Years | 0 (0.0%) | 2 (100.0%) |
| 6 to 18 Years | 0 (0.0%) | 2 (100.0%) |
| 19 to 25 Years | 0 (0.0%) | 0 (0.0%) |
| 26 to 34 Years | 1 (100.0%) | 0 (0.0%) |
| 35 to 44 Years | 0 (0.0%) | 3 (100.0%) |
| 45 to 54 Years | 0 (0.0%) | 0 (0.0%) |
| 55 to 64 Years | 1 (100.0%) | 0 (0.0%) |
| 65 to 74 Years | 1 (100.0%) | 0 (0.0%) |
| 75 Years and older | 4 (100.0%) | 0 (0.0%) |
| Total | 7 (50.0%) | 7 (50.0%) |
Health Insurance Coverage by Citizenship Status in Florence
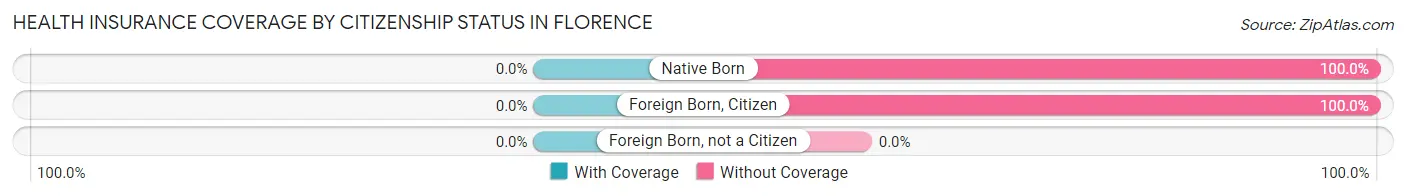
| Citizenship Status | With Coverage | Without Coverage |
| Native Born | 0 (0.0%) | 2 (100.0%) |
| Foreign Born, Citizen | 0 (0.0%) | 2 (100.0%) |
| Foreign Born, not a Citizen | 0 (0.0%) | 0 (0.0%) |
Health Insurance Coverage by Household Income in Florence
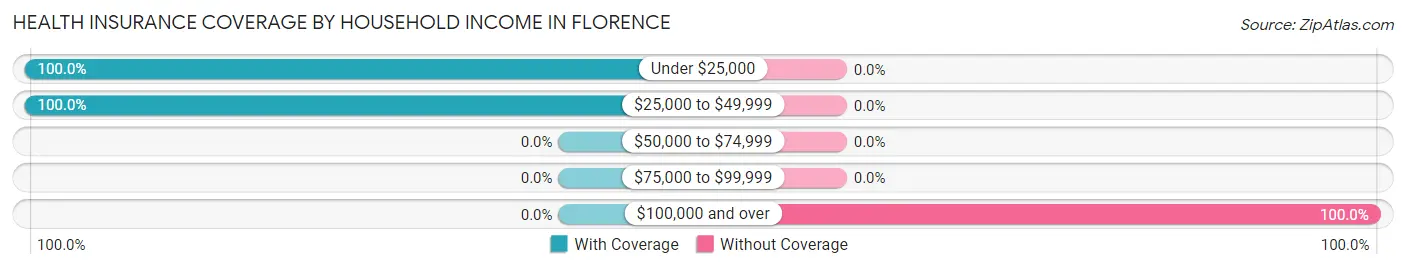
| Household Income | With Coverage | Without Coverage |
| Under $25,000 | 3 (100.0%) | 0 (0.0%) |
| $25,000 to $49,999 | 4 (100.0%) | 0 (0.0%) |
| $50,000 to $74,999 | 0 (0.0%) | 0 (0.0%) |
| $75,000 to $99,999 | 0 (0.0%) | 0 (0.0%) |
| $100,000 and over | 0 (0.0%) | 7 (100.0%) |
Public vs Private Health Insurance Coverage by Age in Florence
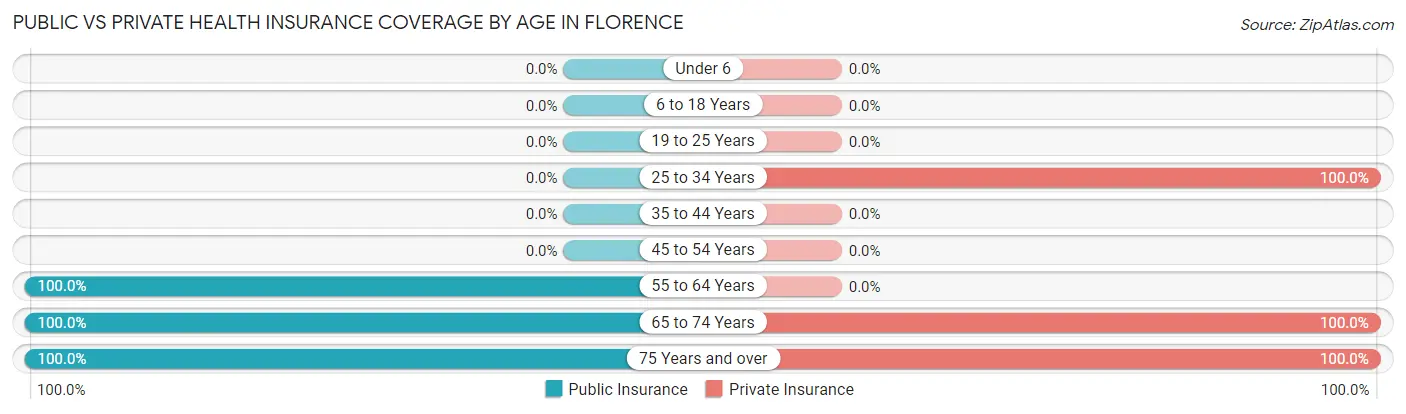
| Age Bracket | Public Insurance | Private Insurance |
| Under 6 | 0 (0.0%) | 0 (0.0%) |
| 6 to 18 Years | 0 (0.0%) | 0 (0.0%) |
| 19 to 25 Years | 0 (0.0%) | 0 (0.0%) |
| 25 to 34 Years | 0 (0.0%) | 1 (100.0%) |
| 35 to 44 Years | 0 (0.0%) | 0 (0.0%) |
| 45 to 54 Years | 0 (0.0%) | 0 (0.0%) |
| 55 to 64 Years | 1 (100.0%) | 0 (0.0%) |
| 65 to 74 Years | 1 (100.0%) | 1 (100.0%) |
| 75 Years and over | 4 (100.0%) | 4 (100.0%) |
| Total | 6 (42.9%) | 6 (42.9%) |
Disability Status by Sex by Age in Florence
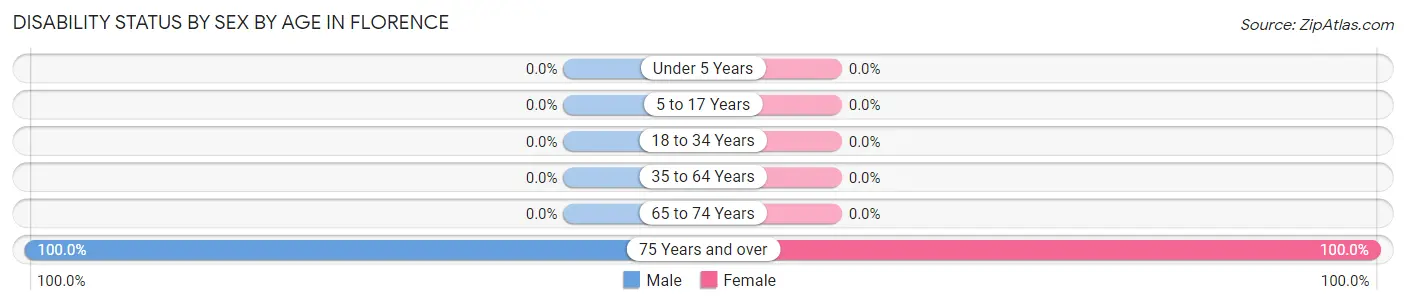
| Age Bracket | Male | Female |
| Under 5 Years | 0 (0.0%) | 0 (0.0%) |
| 5 to 17 Years | 0 (0.0%) | 0 (0.0%) |
| 18 to 34 Years | 0 (0.0%) | 0 (0.0%) |
| 35 to 64 Years | 0 (0.0%) | 0 (0.0%) |
| 65 to 74 Years | 0 (0.0%) | 0 (0.0%) |
| 75 Years and over | 2 (100.0%) | 2 (100.0%) |
Disability Class by Sex by Age in Florence
Disability Class: Hearing Difficulty
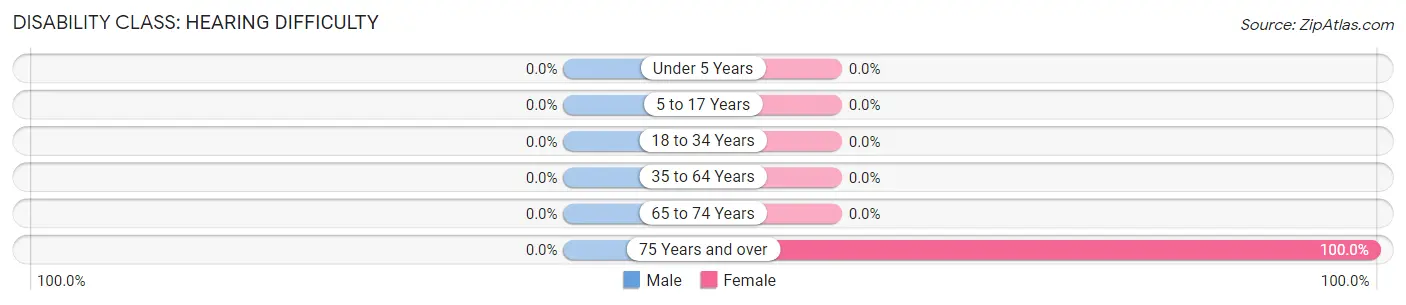
| Age Bracket | Male | Female |
| Under 5 Years | 0 (0.0%) | 0 (0.0%) |
| 5 to 17 Years | 0 (0.0%) | 0 (0.0%) |
| 18 to 34 Years | 0 (0.0%) | 0 (0.0%) |
| 35 to 64 Years | 0 (0.0%) | 0 (0.0%) |
| 65 to 74 Years | 0 (0.0%) | 0 (0.0%) |
| 75 Years and over | 0 (0.0%) | 2 (100.0%) |
Disability Class: Vision Difficulty
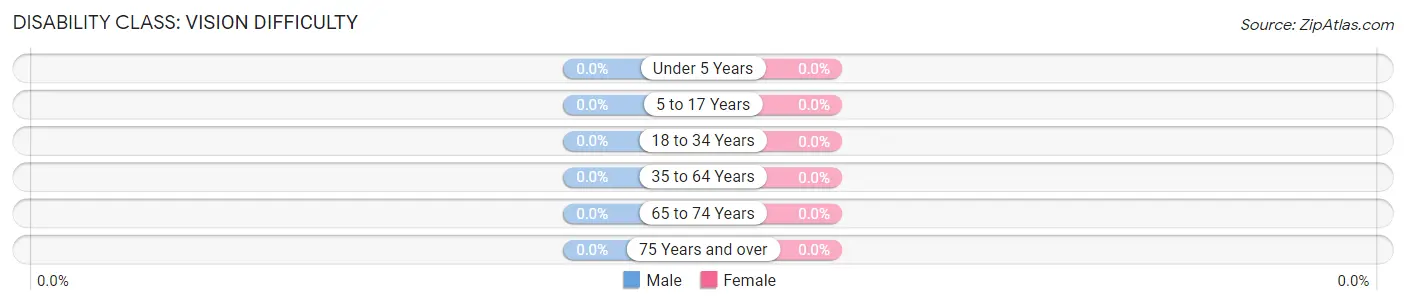
| Age Bracket | Male | Female |
| Under 5 Years | 0 (0.0%) | 0 (0.0%) |
| 5 to 17 Years | 0 (0.0%) | 0 (0.0%) |
| 18 to 34 Years | 0 (0.0%) | 0 (0.0%) |
| 35 to 64 Years | 0 (0.0%) | 0 (0.0%) |
| 65 to 74 Years | 0 (0.0%) | 0 (0.0%) |
| 75 Years and over | 0 (0.0%) | 0 (0.0%) |
Disability Class: Cognitive Difficulty

| Age Bracket | Male | Female |
| 5 to 17 Years | 0 (0.0%) | 0 (0.0%) |
| 18 to 34 Years | 0 (0.0%) | 0 (0.0%) |
| 35 to 64 Years | 0 (0.0%) | 0 (0.0%) |
| 65 to 74 Years | 0 (0.0%) | 0 (0.0%) |
| 75 Years and over | 0 (0.0%) | 0 (0.0%) |
Disability Class: Ambulatory Difficulty
| Age Bracket | Male | Female |
| 5 to 17 Years | 0 (0.0%) | 0 (0.0%) |
| 18 to 34 Years | 0 (0.0%) | 0 (0.0%) |
| 35 to 64 Years | 0 (0.0%) | 0 (0.0%) |
| 65 to 74 Years | 0 (0.0%) | 0 (0.0%) |
| 75 Years and over | 2 (100.0%) | 2 (100.0%) |
Disability Class: Self-Care Difficulty
| Age Bracket | Male | Female |
| 5 to 17 Years | 0 (0.0%) | 0 (0.0%) |
| 18 to 34 Years | 0 (0.0%) | 0 (0.0%) |
| 35 to 64 Years | 0 (0.0%) | 0 (0.0%) |
| 65 to 74 Years | 0 (0.0%) | 0 (0.0%) |
| 75 Years and over | 0 (0.0%) | 0 (0.0%) |
Technology Access in Florence
Computing Device Access in Florence
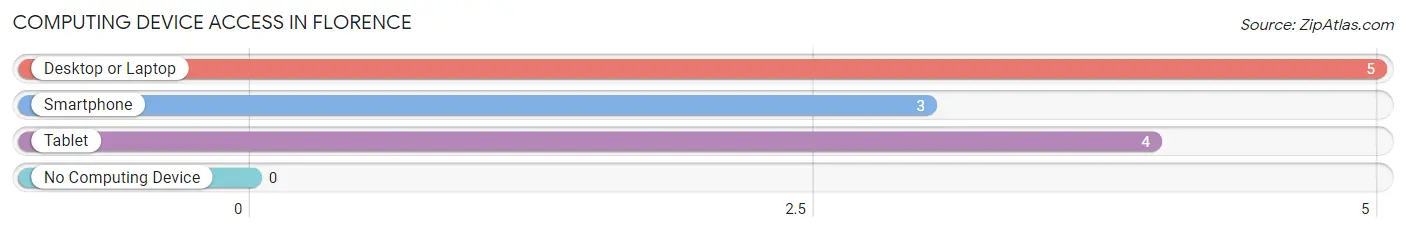
| Device Type | # Households | % Households |
| Desktop or Laptop | 5 | 100.0% |
| Smartphone | 3 | 60.0% |
| Tablet | 4 | 80.0% |
| No Computing Device | 0 | 0.0% |
| Total | 5 | 100.0% |
Internet Access in Florence
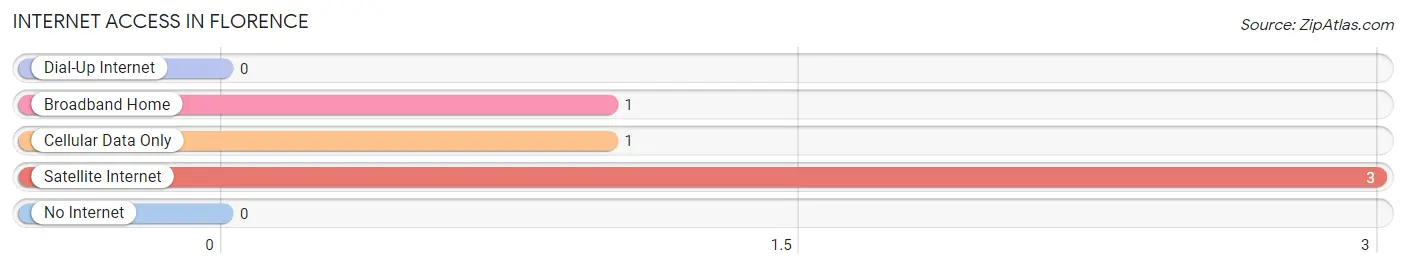
| Internet Type | # Households | % Households |
| Dial-Up Internet | 0 | 0.0% |
| Broadband Home | 1 | 20.0% |
| Cellular Data Only | 1 | 20.0% |
| Satellite Internet | 3 | 60.0% |
| No Internet | 0 | 0.0% |
| Total | 5 | 100.0% |
Florence Summary
Florence, Minnesota is a small city located in St. Louis County, in the northeastern part of the state. It is situated on the banks of the St. Louis River, and is part of the Duluth-Superior Metropolitan Statistical Area. The city has a population of 1,845, according to the 2010 census.
History
Florence was founded in 1887 by a group of settlers from the nearby town of Duluth. The town was named after Florence, Italy, and was originally intended to be a summer resort for wealthy Duluthians. The town was incorporated in 1891, and the first post office was established in 1892.
The town grew slowly, but steadily, and by the early 1900s, it had become a popular tourist destination. The town was home to several resorts, including the Florence Hotel, which was built in 1906. The hotel was a popular destination for wealthy tourists, and it was the site of many social events.
In the 1920s, the town began to experience a decline in tourism, and the population began to decline as well. The Great Depression further exacerbated the decline, and by the 1940s, the town was in a state of decline.
In the 1950s, the town began to experience a resurgence, as the economy began to improve. The town was home to several industries, including a paper mill, a sawmill, and a lumber mill. The town also became a popular destination for outdoor recreation, and it was home to several resorts and campgrounds.
Geography
Florence is located in St. Louis County, in the northeastern part of the state. It is situated on the banks of the St. Louis River, and is part of the Duluth-Superior Metropolitan Statistical Area. The city has a total area of 1.2 square miles, all of which is land.
The city is located in a heavily forested area, and is surrounded by lakes and rivers. The St. Louis River is the main waterway in the area, and it is a popular destination for fishing and boating. The city is also home to several parks, including the Florence City Park, which is located on the banks of the river.
Economy
The economy of Florence is largely based on tourism and outdoor recreation. The city is home to several resorts and campgrounds, and it is a popular destination for fishing, boating, and other outdoor activities. The city is also home to several industries, including a paper mill, a sawmill, and a lumber mill.
The city is also home to several small businesses, including restaurants, retail stores, and other services. The city is also home to several educational institutions, including the University of Minnesota Duluth, which is located just outside of the city.
Demographics
According to the 2010 census, the population of Florence was 1,845. The racial makeup of the city was 94.3% White, 0.7% African American, 0.3% Native American, 0.2% Asian, 0.1% Pacific Islander, 0.2% from other races, and 4.2% from two or more races. Hispanic or Latino of any race were 1.2% of the population.
The median household income in Florence was $37,917, and the median family income was $45,625. The per capita income for the city was $19,945. About 11.2% of families and 14.2% of the population were below the poverty line, including 18.2% of those under age 18 and 8.3% of those age 65 or over.
Common Questions
What is Per Capita Income in Florence?
Per Capita income in Florence is $20,643.
What is the Median Household income in Florence?
Median Household Income in Florence is $40,625.
What is Inequality or Gini Index in Florence?
Inequality or Gini Index in Florence is 0.34.
What is the Total Population of Florence?
Total Population of Florence is 14.
What is the Total Male Population of Florence?
Total Male Population of Florence is 5.
What is the Total Female Population of Florence?
Total Female Population of Florence is 9.
What is the Ratio of Males per 100 Females in Florence?
There are 55.56 Males per 100 Females in Florence.
What is the Ratio of Females per 100 Males in Florence?
There are 180.00 Females per 100 Males in Florence.
What is the Median Population Age in Florence?
Median Population Age in Florence is 37.5 Years.
What is the Average Family Size in Florence
Average Family Size in Florence is 3.2 People.
What is the Average Household Size in Florence
Average Household Size in Florence is 2.8 People.
How Large is the Labor Force in Florence?
There are 7 People in the Labor Forcein in Florence.
What is the Percentage of People in the Labor Force in Florence?
70.0% of People are in the Labor Force in Florence.