Viking, MN Map & Demographics
Viking Map
Viking Overview
$44,973
PER CAPITA INCOME
$88,750
AVG FAMILY INCOME
$72,000
AVG HOUSEHOLD INCOME
46.7%
WAGE / INCOME GAP [ % ]
53.3¢/ $1
WAGE / INCOME GAP [ $ ]
0.33
INEQUALITY / GINI INDEX
100
TOTAL POPULATION
58
MALE POPULATION
42
FEMALE POPULATION
138.10
MALES / 100 FEMALES
72.41
FEMALES / 100 MALES
49.5
MEDIAN AGE
2.3
AVG FAMILY SIZE
2.1
AVG HOUSEHOLD SIZE
47
LABOR FORCE [ PEOPLE ]
52.8%
PERCENT IN LABOR FORCE
Viking Zip Codes
Viking Area Codes
Income in Viking
Income Overview in Viking
Per Capita Income in Viking is $44,973, while median incomes of families and households are $88,750 and $72,000 respectively.
| Characteristic | Number | Measure |
| Per Capita Income | 100 | $44,973 |
| Median Family Income | 33 | $88,750 |
| Mean Family Income | 33 | $91,058 |
| Median Household Income | 48 | $72,000 |
| Mean Household Income | 48 | $91,404 |
| Income Deficit | 33 | $0 |
| Wage / Income Gap (%) | 100 | 46.70% |
| Wage / Income Gap ($) | 100 | 53.30¢ per $1 |
| Gini / Inequality Index | 100 | 0.33 |
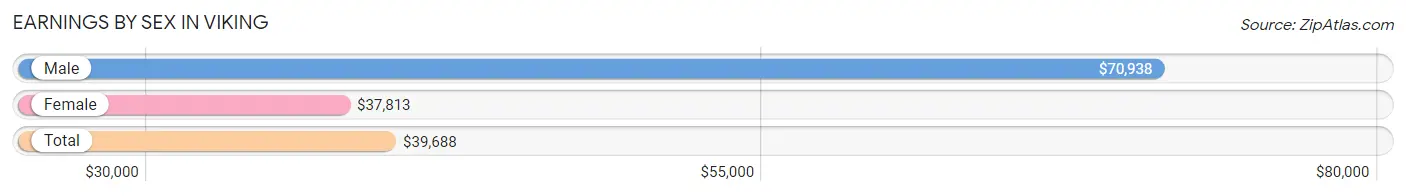
Earnings by Sex in Viking
Average Earnings in Viking are $39,688, $70,938 for men and $37,813 for women, a difference of 46.7%.
| Sex | Number | Average Earnings |
| Male | 32 (59.3%) | $70,938 |
| Female | 22 (40.7%) | $37,813 |
| Total | 54 (100.0%) | $39,688 |
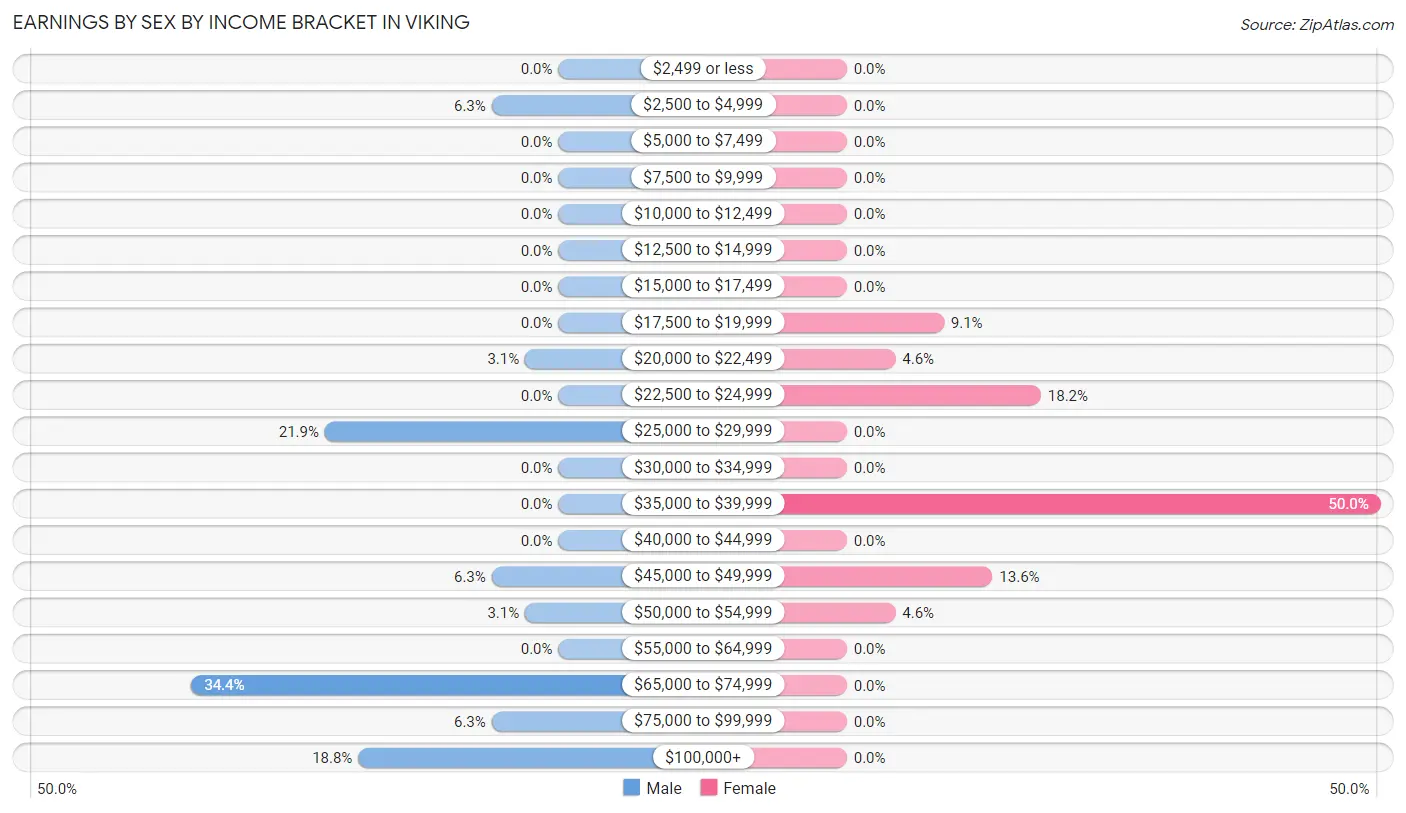
Earnings by Sex by Income Bracket in Viking
The most common earnings brackets in Viking are $65,000 to $74,999 for men (11 | 34.4%) and $35,000 to $39,999 for women (11 | 50.0%).
| Income | Male | Female |
| $2,499 or less | 0 (0.0%) | 0 (0.0%) |
| $2,500 to $4,999 | 2 (6.2%) | 0 (0.0%) |
| $5,000 to $7,499 | 0 (0.0%) | 0 (0.0%) |
| $7,500 to $9,999 | 0 (0.0%) | 0 (0.0%) |
| $10,000 to $12,499 | 0 (0.0%) | 0 (0.0%) |
| $12,500 to $14,999 | 0 (0.0%) | 0 (0.0%) |
| $15,000 to $17,499 | 0 (0.0%) | 0 (0.0%) |
| $17,500 to $19,999 | 0 (0.0%) | 2 (9.1%) |
| $20,000 to $22,499 | 1 (3.1%) | 1 (4.5%) |
| $22,500 to $24,999 | 0 (0.0%) | 4 (18.2%) |
| $25,000 to $29,999 | 7 (21.9%) | 0 (0.0%) |
| $30,000 to $34,999 | 0 (0.0%) | 0 (0.0%) |
| $35,000 to $39,999 | 0 (0.0%) | 11 (50.0%) |
| $40,000 to $44,999 | 0 (0.0%) | 0 (0.0%) |
| $45,000 to $49,999 | 2 (6.2%) | 3 (13.6%) |
| $50,000 to $54,999 | 1 (3.1%) | 1 (4.5%) |
| $55,000 to $64,999 | 0 (0.0%) | 0 (0.0%) |
| $65,000 to $74,999 | 11 (34.4%) | 0 (0.0%) |
| $75,000 to $99,999 | 2 (6.2%) | 0 (0.0%) |
| $100,000+ | 6 (18.8%) | 0 (0.0%) |
| Total | 32 (100.0%) | 22 (100.0%) |
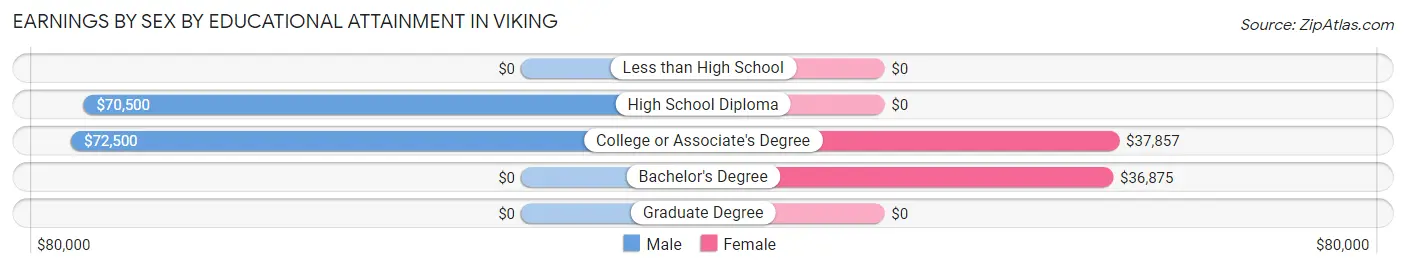
Earnings by Sex by Educational Attainment in Viking
Average earnings in Viking are $71,250 for men and $37,813 for women, a difference of 46.9%. Men with an educational attainment of college or associate's degree enjoy the highest average annual earnings of $72,500, while those with high school diploma education earn the least with $70,500. Women with an educational attainment of college or associate's degree earn the most with the average annual earnings of $37,857, while those with bachelor's degree education have the smallest earnings of $36,875.
| Educational Attainment | Male Income | Female Income |
| Less than High School | - | - |
| High School Diploma | $70,500 | $0 |
| College or Associate's Degree | $72,500 | $37,857 |
| Bachelor's Degree | - | - |
| Graduate Degree | - | - |
| Total | $71,250 | $37,813 |
Family Income in Viking
Family Income Brackets in Viking
According to the Viking family income data, there are 10 families falling into the $50,000 to $74,999 income range, which is the most common income bracket and makes up 30.3% of all families.
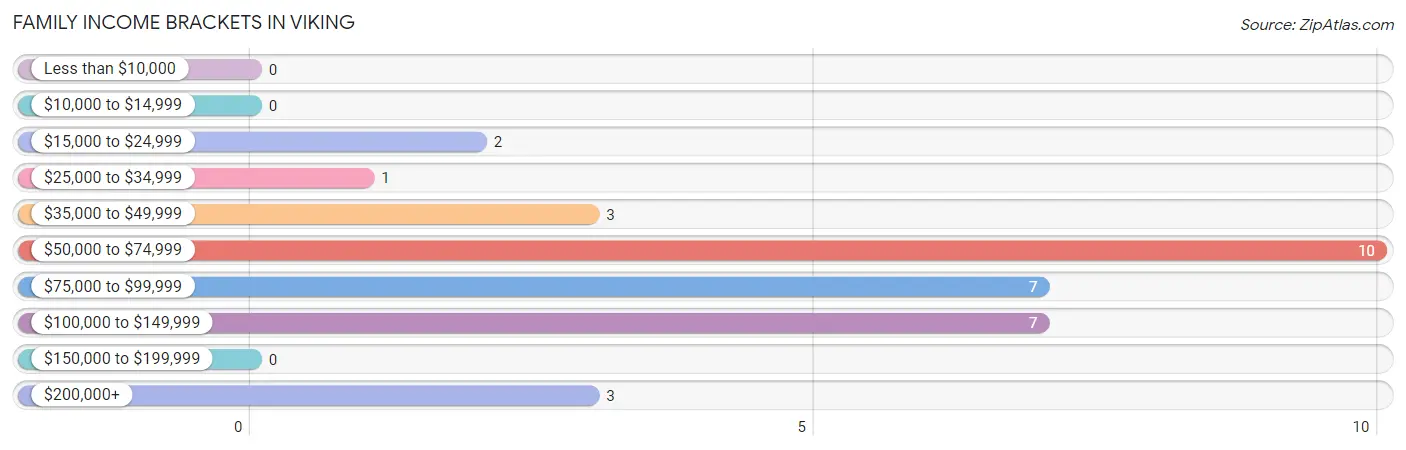
| Income Bracket | # Families | % Families |
| Less than $10,000 | 0 | 0.0% |
| $10,000 to $14,999 | 0 | 0.0% |
| $15,000 to $24,999 | 2 | 6.1% |
| $25,000 to $34,999 | 1 | 3.0% |
| $35,000 to $49,999 | 3 | 9.1% |
| $50,000 to $74,999 | 10 | 30.3% |
| $75,000 to $99,999 | 7 | 21.2% |
| $100,000 to $149,999 | 7 | 21.2% |
| $150,000 to $199,999 | 0 | 0.0% |
| $200,000+ | 3 | 9.1% |
Family Income by Famaliy Size in Viking
2-person families (29 | 87.9%) account for the highest median family income in Viking with $72,250 per family, while 2-person families (29 | 87.9%) have the highest median income of $36,125 per family member.
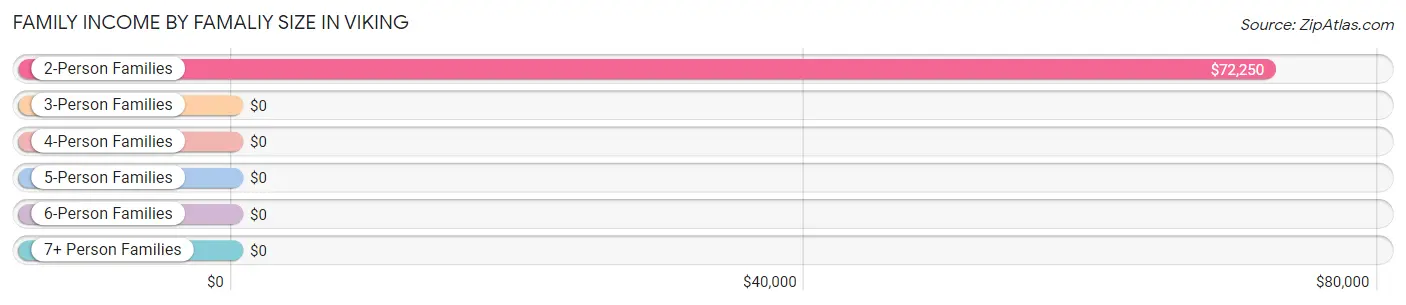
| Income Bracket | # Families | Median Income |
| 2-Person Families | 29 (87.9%) | $72,250 |
| 3-Person Families | 3 (9.1%) | $0 |
| 4-Person Families | 1 (3.0%) | $0 |
| 5-Person Families | 0 (0.0%) | $0 |
| 6-Person Families | 0 (0.0%) | $0 |
| 7+ Person Families | 0 (0.0%) | $0 |
| Total | 33 (100.0%) | $88,750 |
Family Income by Number of Earners in Viking
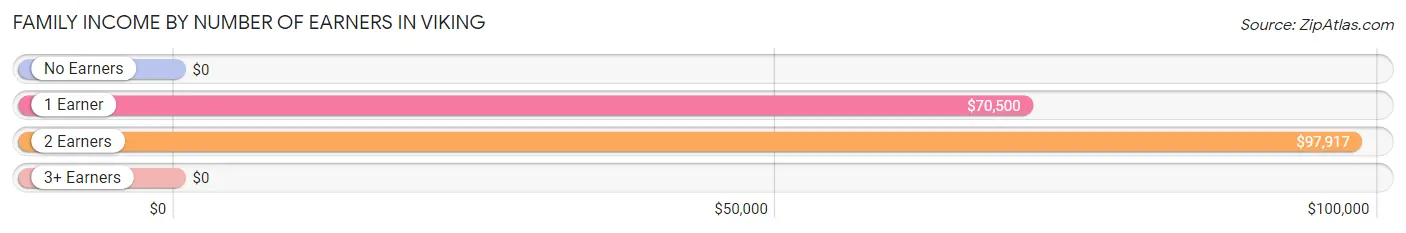
| Number of Earners | # Families | Median Income |
| No Earners | 13 (39.4%) | $0 |
| 1 Earner | 10 (30.3%) | $70,500 |
| 2 Earners | 9 (27.3%) | $97,917 |
| 3+ Earners | 1 (3.0%) | $0 |
| Total | 33 (100.0%) | $88,750 |
Household Income in Viking
Household Income Brackets in Viking
With 14 households falling in the category, the $50,000 to $74,999 income range is the most frequent in Viking, accounting for 29.2% of all households.
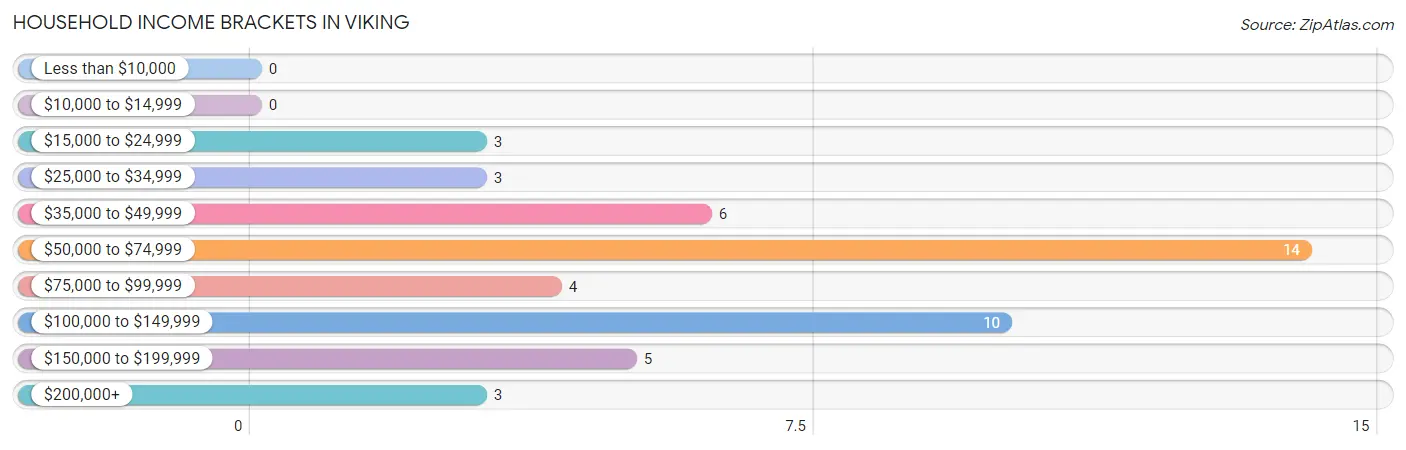
| Income Bracket | # Households | % Households |
| Less than $10,000 | 0 | 0.0% |
| $10,000 to $14,999 | 0 | 0.0% |
| $15,000 to $24,999 | 3 | 6.3% |
| $25,000 to $34,999 | 3 | 6.3% |
| $35,000 to $49,999 | 6 | 12.5% |
| $50,000 to $74,999 | 14 | 29.2% |
| $75,000 to $99,999 | 4 | 8.3% |
| $100,000 to $149,999 | 10 | 20.8% |
| $150,000 to $199,999 | 5 | 10.4% |
| $200,000+ | 3 | 6.3% |
Household Income by Householder Age in Viking
The median household income in Viking is $72,000, with the highest median household income of $92,917 found in the 45 to 64 years age bracket for the primary householder. A total of 13 households (27.1%) fall into this category.
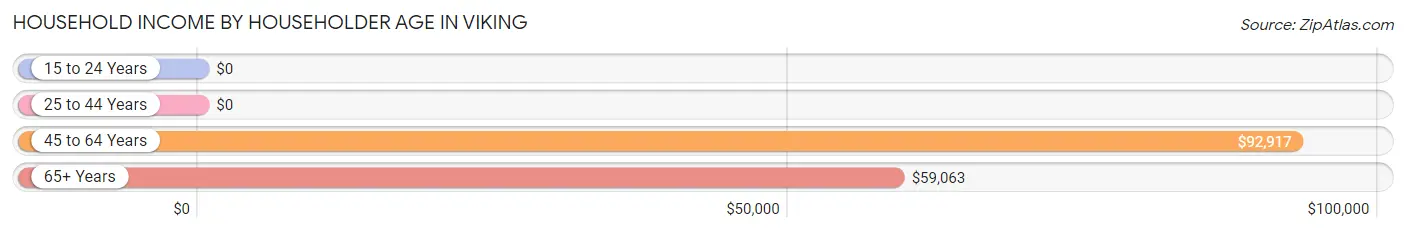
| Income Bracket | # Households | Median Income |
| 15 to 24 Years | 0 (0.0%) | $0 |
| 25 to 44 Years | 16 (33.3%) | $0 |
| 45 to 64 Years | 13 (27.1%) | $92,917 |
| 65+ Years | 19 (39.6%) | $59,063 |
| Total | 48 (100.0%) | $72,000 |
Poverty in Viking
Income Below Poverty by Sex and Age in Viking
With 5.2% poverty level for males and 4.8% for females among the residents of Viking, 5 year old males and 35 to 44 year old females are the most vulnerable to poverty, with 3 males (100.0%) and 2 females (66.7%) in their respective age groups living below the poverty level.
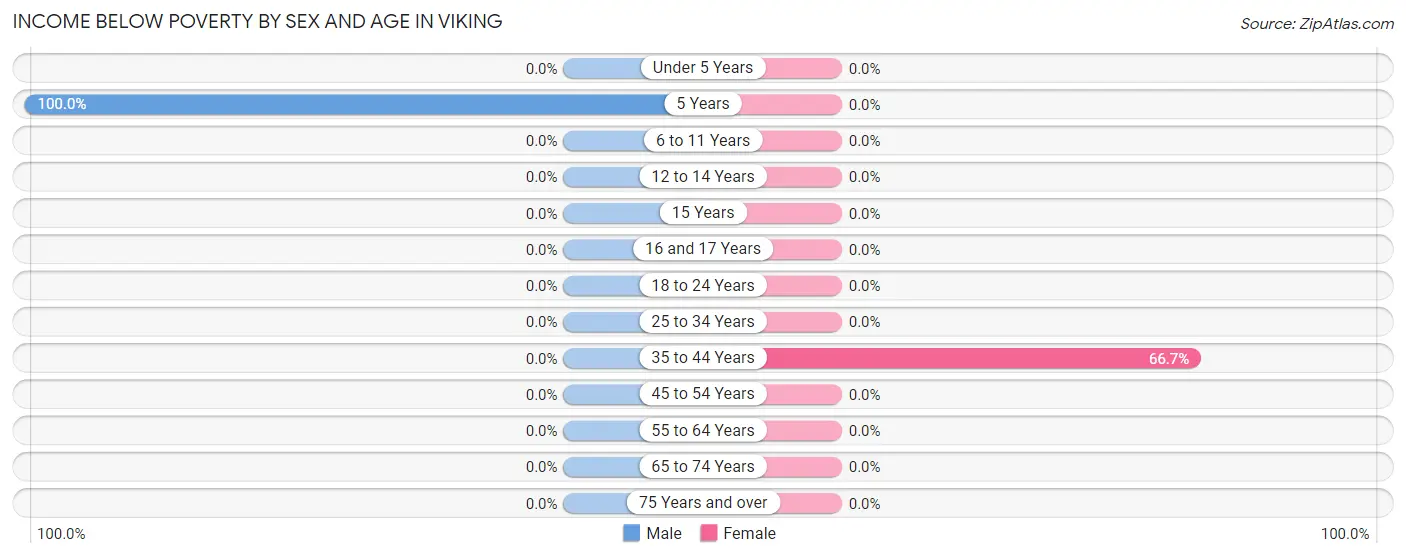
| Age Bracket | Male | Female |
| Under 5 Years | 0 (0.0%) | 0 (0.0%) |
| 5 Years | 3 (100.0%) | 0 (0.0%) |
| 6 to 11 Years | 0 (0.0%) | 0 (0.0%) |
| 12 to 14 Years | 0 (0.0%) | 0 (0.0%) |
| 15 Years | 0 (0.0%) | 0 (0.0%) |
| 16 and 17 Years | 0 (0.0%) | 0 (0.0%) |
| 18 to 24 Years | 0 (0.0%) | 0 (0.0%) |
| 25 to 34 Years | 0 (0.0%) | 0 (0.0%) |
| 35 to 44 Years | 0 (0.0%) | 2 (66.7%) |
| 45 to 54 Years | 0 (0.0%) | 0 (0.0%) |
| 55 to 64 Years | 0 (0.0%) | 0 (0.0%) |
| 65 to 74 Years | 0 (0.0%) | 0 (0.0%) |
| 75 Years and over | 0 (0.0%) | 0 (0.0%) |
| Total | 3 (5.2%) | 2 (4.8%) |
Income Above Poverty by Sex and Age in Viking
According to the poverty statistics in Viking, males aged 6 to 11 years and females aged 12 to 14 years are the age groups that are most secure financially, with 100.0% of males and 100.0% of females in these age groups living above the poverty line.
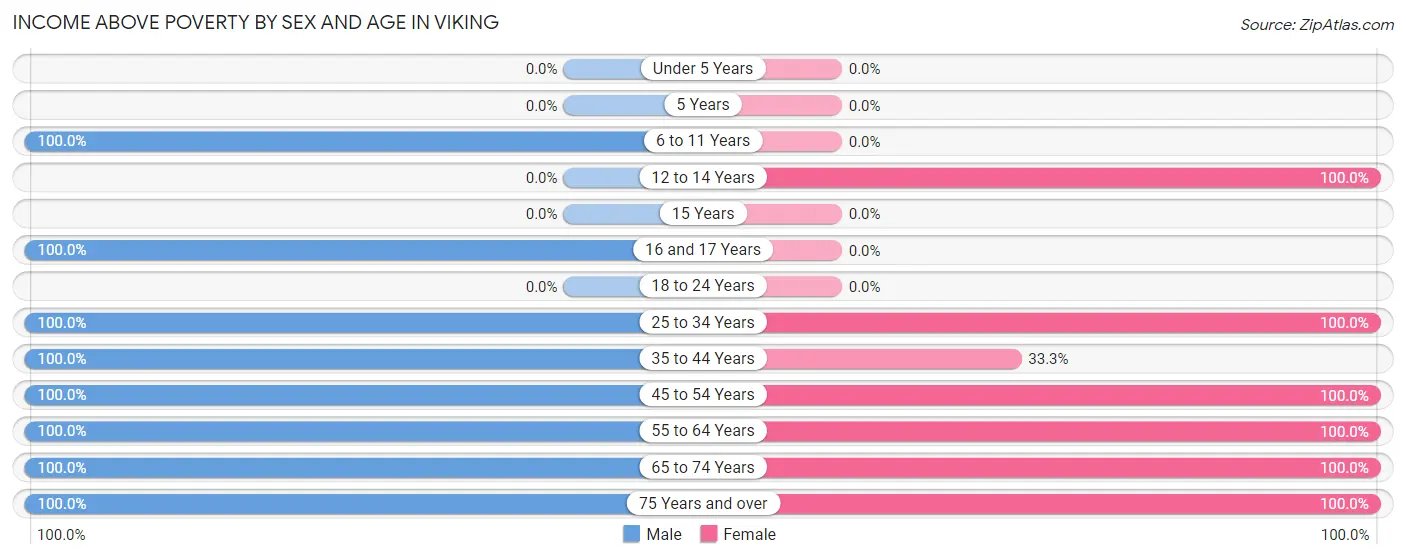
| Age Bracket | Male | Female |
| Under 5 Years | 0 (0.0%) | 0 (0.0%) |
| 5 Years | 0 (0.0%) | 0 (0.0%) |
| 6 to 11 Years | 6 (100.0%) | 0 (0.0%) |
| 12 to 14 Years | 0 (0.0%) | 2 (100.0%) |
| 15 Years | 0 (0.0%) | 0 (0.0%) |
| 16 and 17 Years | 2 (100.0%) | 0 (0.0%) |
| 18 to 24 Years | 0 (0.0%) | 0 (0.0%) |
| 25 to 34 Years | 8 (100.0%) | 8 (100.0%) |
| 35 to 44 Years | 13 (100.0%) | 1 (33.3%) |
| 45 to 54 Years | 6 (100.0%) | 5 (100.0%) |
| 55 to 64 Years | 3 (100.0%) | 8 (100.0%) |
| 65 to 74 Years | 13 (100.0%) | 10 (100.0%) |
| 75 Years and over | 4 (100.0%) | 6 (100.0%) |
| Total | 55 (94.8%) | 40 (95.2%) |
Income Below Poverty Among Married-Couple Families in Viking
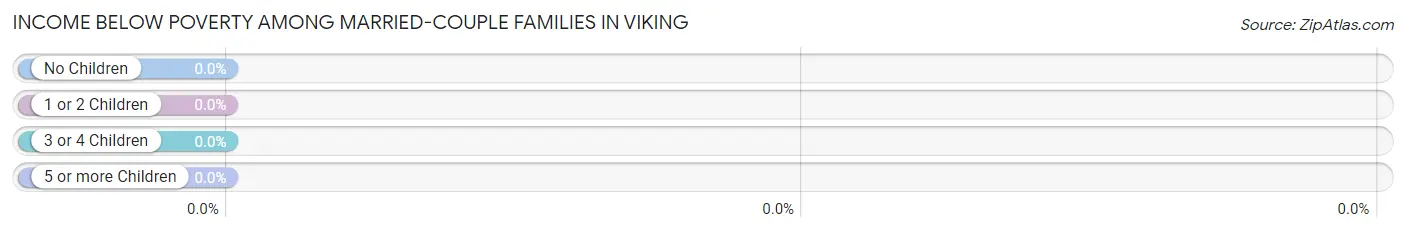
| Children | Above Poverty | Below Poverty |
| No Children | 21 (100.0%) | 0 (0.0%) |
| 1 or 2 Children | 2 (100.0%) | 0 (0.0%) |
| 3 or 4 Children | 0 (0.0%) | 0 (0.0%) |
| 5 or more Children | 0 (0.0%) | 0 (0.0%) |
| Total | 23 (100.0%) | 0 (0.0%) |
Income Below Poverty Among Single-Parent Households in Viking
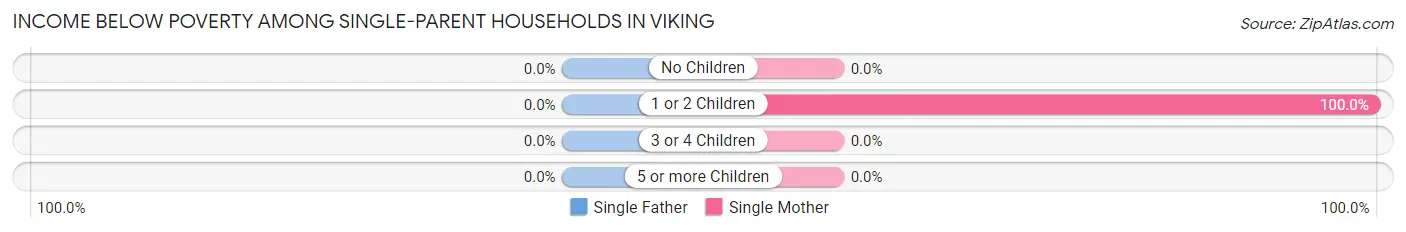
| Children | Single Father | Single Mother |
| No Children | 0 (0.0%) | 0 (0.0%) |
| 1 or 2 Children | 0 (0.0%) | 2 (100.0%) |
| 3 or 4 Children | 0 (0.0%) | 0 (0.0%) |
| 5 or more Children | 0 (0.0%) | 0 (0.0%) |
| Total | 0 (0.0%) | 2 (100.0%) |
Income Below Poverty Among Married-Couple vs Single-Parent Households in Viking
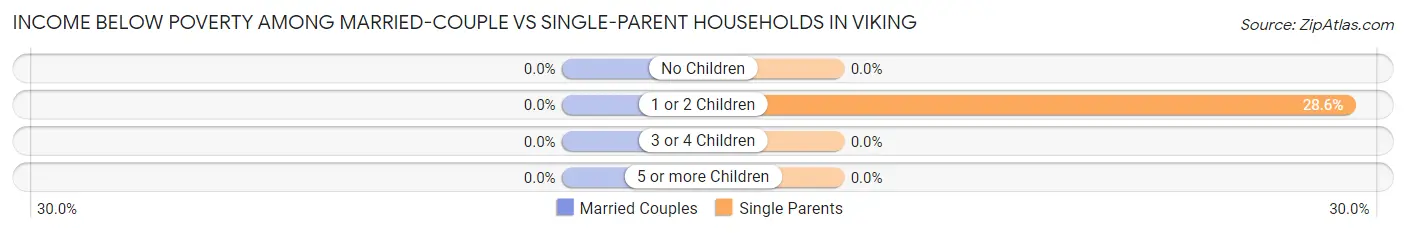
| Children | Married-Couple Families | Single-Parent Households |
| No Children | 0 (0.0%) | 0 (0.0%) |
| 1 or 2 Children | 0 (0.0%) | 2 (28.6%) |
| 3 or 4 Children | 0 (0.0%) | 0 (0.0%) |
| 5 or more Children | 0 (0.0%) | 0 (0.0%) |
| Total | 0 (0.0%) | 2 (20.0%) |
Race in Viking
The most populous races in Viking are White / Caucasian (89 | 89.0%), and Two or more Races (11 | 11.0%).
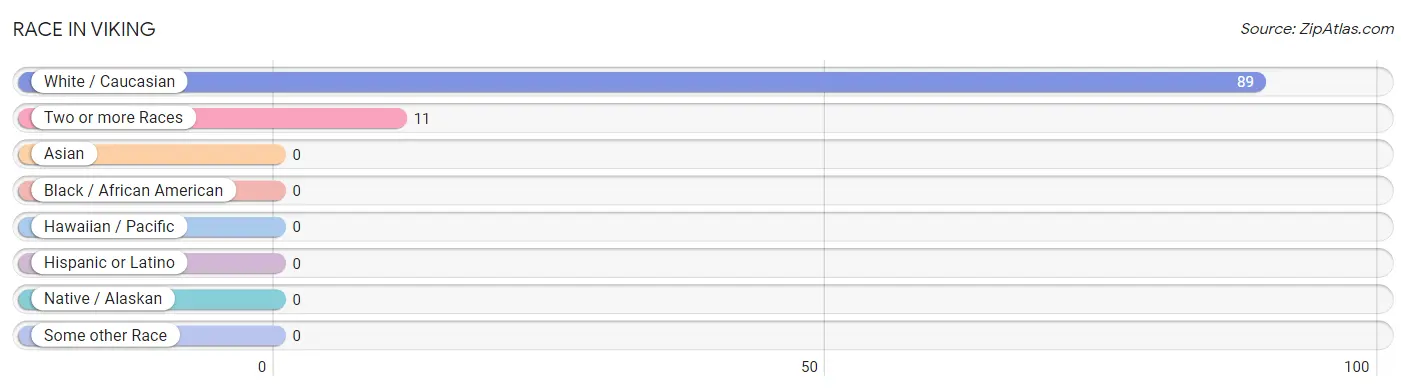
| Race | # Population | % Population |
| Asian | 0 | 0.0% |
| Black / African American | 0 | 0.0% |
| Hawaiian / Pacific | 0 | 0.0% |
| Hispanic or Latino | 0 | 0.0% |
| Native / Alaskan | 0 | 0.0% |
| White / Caucasian | 89 | 89.0% |
| Two or more Races | 11 | 11.0% |
| Some other Race | 0 | 0.0% |
| Total | 100 | 100.0% |
Ancestry in Viking
The most populous ancestries reported in Viking are Norwegian (45 | 45.0%), German (12 | 12.0%), Polish (12 | 12.0%), Swedish (7 | 7.0%), and Irish (6 | 6.0%), together accounting for 82.0% of all Viking residents.
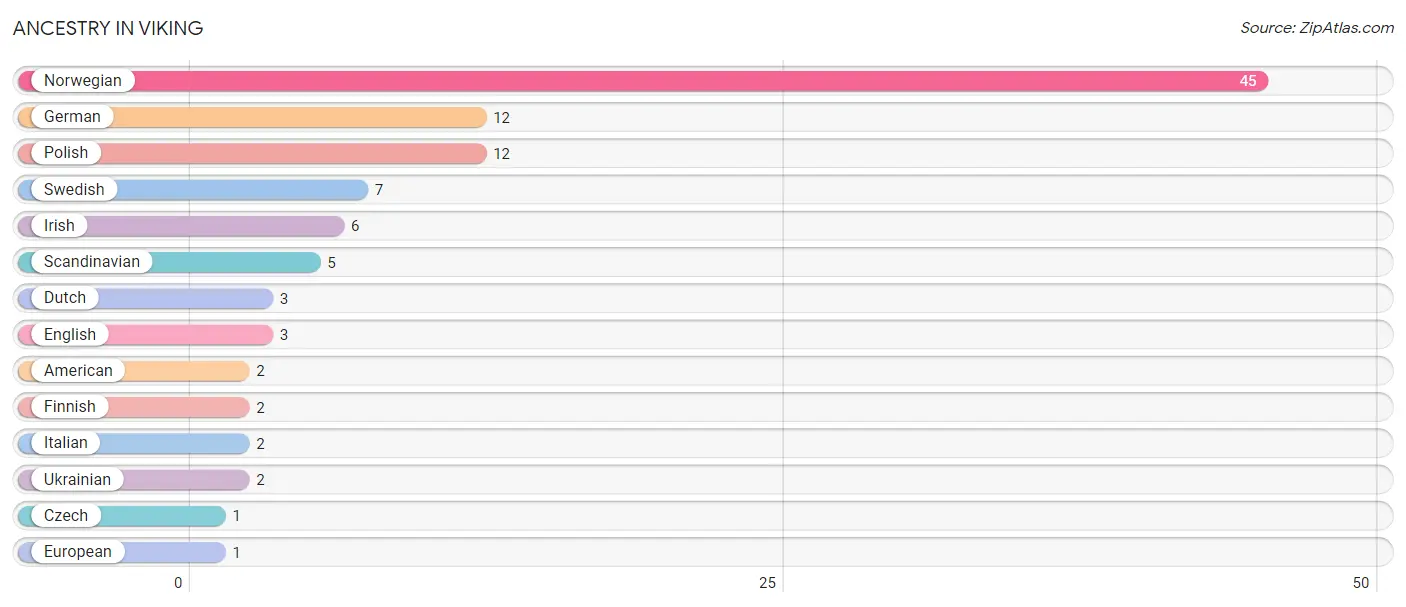
| Ancestry | # Population | % Population |
| American | 2 | 2.0% |
| Czech | 1 | 1.0% |
| Dutch | 3 | 3.0% |
| English | 3 | 3.0% |
| European | 1 | 1.0% |
| Finnish | 2 | 2.0% |
| German | 12 | 12.0% |
| Irish | 6 | 6.0% |
| Italian | 2 | 2.0% |
| Norwegian | 45 | 45.0% |
| Polish | 12 | 12.0% |
| Scandinavian | 5 | 5.0% |
| Swedish | 7 | 7.0% |
| Ukrainian | 2 | 2.0% | View All 14 Rows |
Immigrants in Viking

| Immigration Origin | # Population | % Population | View All 0 Rows |
Sex and Age in Viking
Sex and Age in Viking
The most populous age groups in Viking are 35 to 39 Years (10 | 17.2%) for men and 65 to 69 Years (10 | 23.8%) for women.
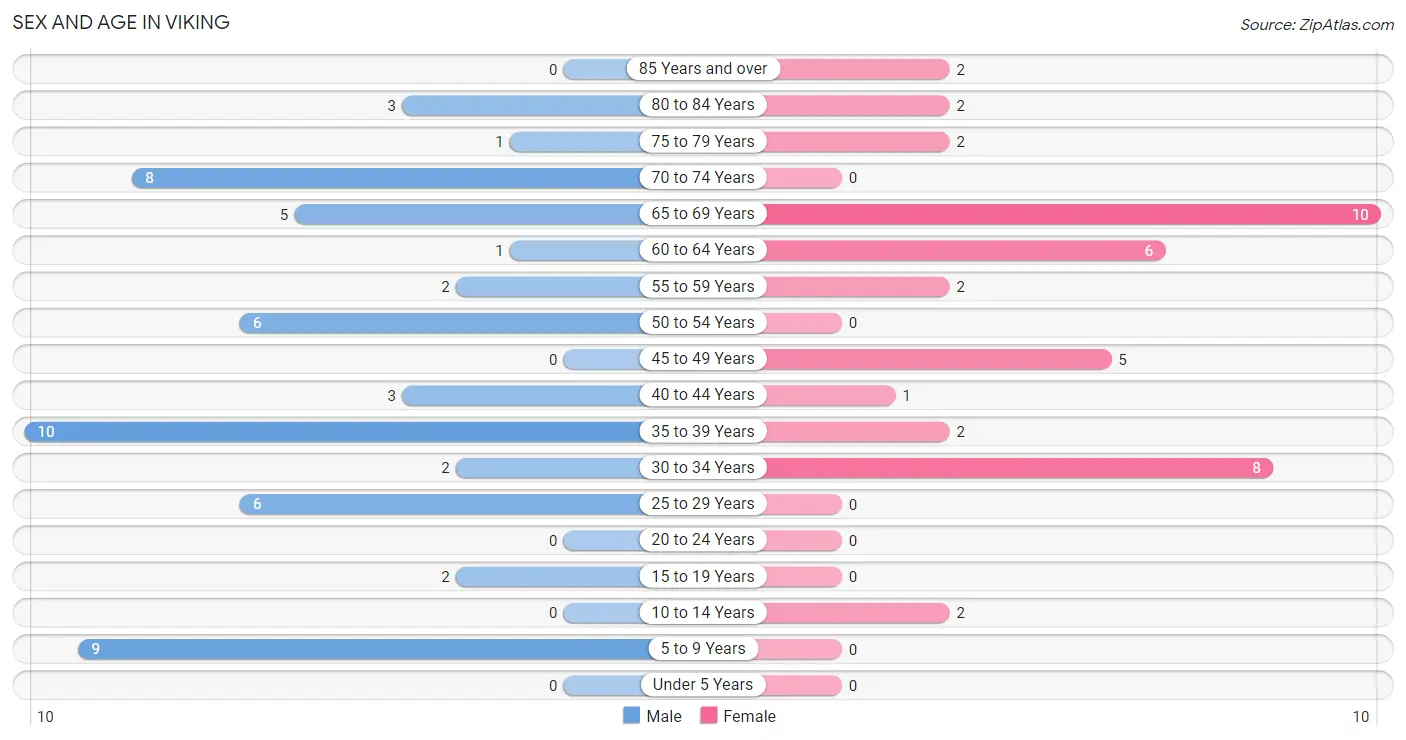
| Age Bracket | Male | Female |
| Under 5 Years | 0 (0.0%) | 0 (0.0%) |
| 5 to 9 Years | 9 (15.5%) | 0 (0.0%) |
| 10 to 14 Years | 0 (0.0%) | 2 (4.8%) |
| 15 to 19 Years | 2 (3.5%) | 0 (0.0%) |
| 20 to 24 Years | 0 (0.0%) | 0 (0.0%) |
| 25 to 29 Years | 6 (10.3%) | 0 (0.0%) |
| 30 to 34 Years | 2 (3.5%) | 8 (19.1%) |
| 35 to 39 Years | 10 (17.2%) | 2 (4.8%) |
| 40 to 44 Years | 3 (5.2%) | 1 (2.4%) |
| 45 to 49 Years | 0 (0.0%) | 5 (11.9%) |
| 50 to 54 Years | 6 (10.3%) | 0 (0.0%) |
| 55 to 59 Years | 2 (3.5%) | 2 (4.8%) |
| 60 to 64 Years | 1 (1.7%) | 6 (14.3%) |
| 65 to 69 Years | 5 (8.6%) | 10 (23.8%) |
| 70 to 74 Years | 8 (13.8%) | 0 (0.0%) |
| 75 to 79 Years | 1 (1.7%) | 2 (4.8%) |
| 80 to 84 Years | 3 (5.2%) | 2 (4.8%) |
| 85 Years and over | 0 (0.0%) | 2 (4.8%) |
| Total | 58 (100.0%) | 42 (100.0%) |
Families and Households in Viking
Median Family Size in Viking
The median family size in Viking is 2.30 persons per family, with single female/mother families (2 | 6.1%) accounting for the largest median family size of 2.5 persons per family. On the other hand, married-couple families (23 | 69.7%) represent the smallest median family size with 2.26 persons per family.
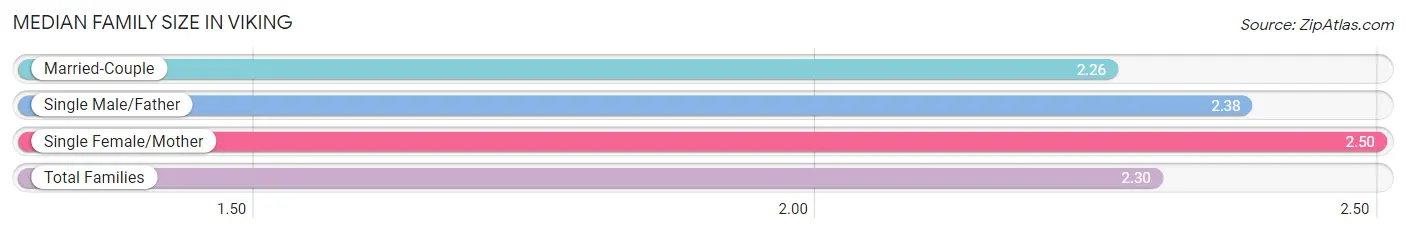
| Family Type | # Families | Family Size |
| Married-Couple | 23 (69.7%) | 2.26 |
| Single Male/Father | 8 (24.2%) | 2.38 |
| Single Female/Mother | 2 (6.1%) | 2.50 |
| Total Families | 33 (100.0%) | 2.30 |
Median Household Size in Viking
The median household size in Viking is 2.08 persons per household, with single male/father households (8 | 16.7%) accounting for the largest median household size of 2.63 persons per household. non-family households (15 | 31.2%) represent the smallest median household size with 1.47 persons per household.
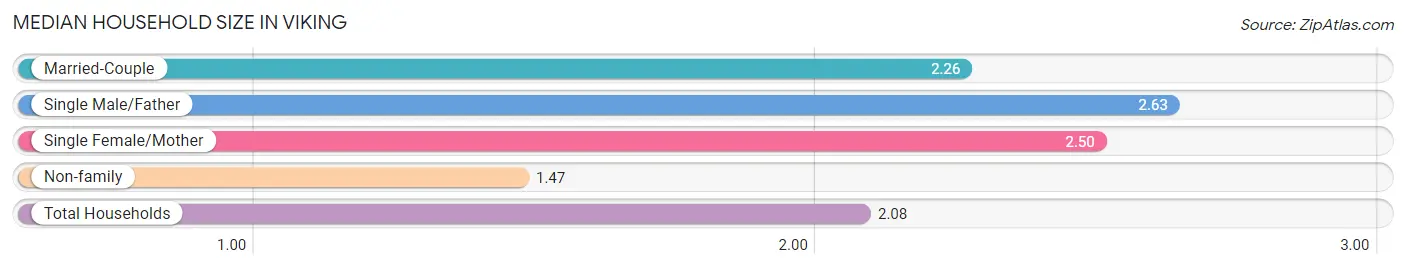
| Household Type | # Households | Household Size |
| Married-Couple | 23 (47.9%) | 2.26 |
| Single Male/Father | 8 (16.7%) | 2.63 |
| Single Female/Mother | 2 (4.2%) | 2.50 |
| Non-family | 15 (31.2%) | 1.47 |
| Total Households | 48 (100.0%) | 2.08 |
Household Size by Marriage Status in Viking
Out of a total of 48 households in Viking, 33 (68.8%) are family households, while 15 (31.2%) are nonfamily households. The most numerous type of family households are 2-person households, comprising 26, and the most common type of nonfamily households are 1-person households, comprising 10.
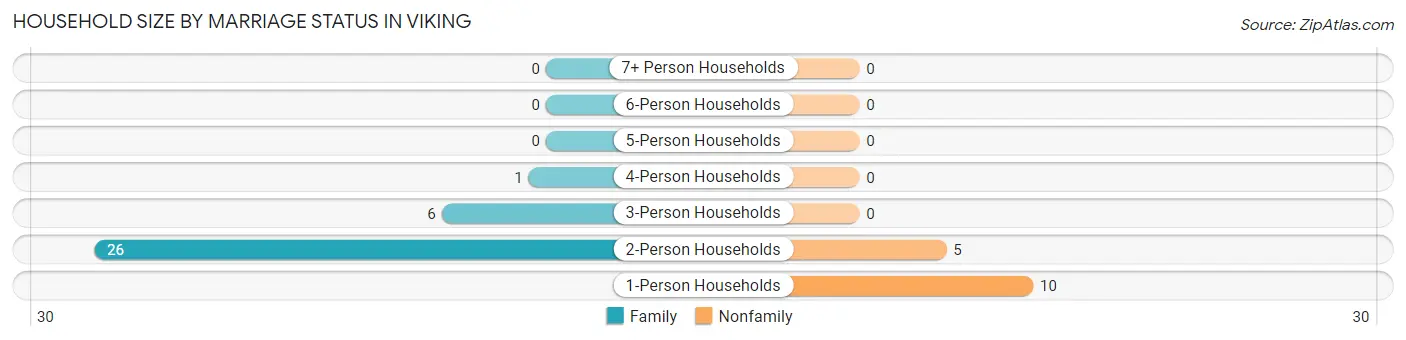
| Household Size | Family Households | Nonfamily Households |
| 1-Person Households | - | 10 (20.8%) |
| 2-Person Households | 26 (54.2%) | 5 (10.4%) |
| 3-Person Households | 6 (12.5%) | 0 (0.0%) |
| 4-Person Households | 1 (2.1%) | 0 (0.0%) |
| 5-Person Households | 0 (0.0%) | 0 (0.0%) |
| 6-Person Households | 0 (0.0%) | 0 (0.0%) |
| 7+ Person Households | 0 (0.0%) | 0 (0.0%) |
| Total | 33 (68.8%) | 15 (31.2%) |
Female Fertility in Viking
Fertility by Age in Viking
| Age Bracket | Women with Births | Births / 1,000 Women |
| 15 to 19 years | 0 (0.0%) | 0.0 |
| 20 to 34 years | 0 (0.0%) | 0.0 |
| 35 to 50 years | 0 (0.0%) | 0.0 |
| Total | 0 (0.0%) | 0.0 |
Fertility by Age by Marriage Status in Viking
| Age Bracket | Married | Unmarried |
| 15 to 19 years | 0 (0.0%) | 0 (0.0%) |
| 20 to 34 years | 0 (0.0%) | 0 (0.0%) |
| 35 to 50 years | 0 (0.0%) | 0 (0.0%) |
| Total | 0 (0.0%) | 0 (0.0%) |
Fertility by Education in Viking
| Educational Attainment | Women with Births | Births / 1,000 Women |
| Less than High School | 0 (0.0%) | 0.0 |
| High School Diploma | 0 (0.0%) | 0.0 |
| College or Associate's Degree | 0 (0.0%) | 0.0 |
| Bachelor's Degree | 0 (0.0%) | 0.0 |
| Graduate Degree | 0 (0.0%) | 0.0 |
| Total | 0 (0.0%) | 0.0 |
Fertility by Education by Marriage Status in Viking
| Educational Attainment | Married | Unmarried |
| Less than High School | 0 (0.0%) | 0 (0.0%) |
| High School Diploma | 0 (0.0%) | 0 (0.0%) |
| College or Associate's Degree | 0 (0.0%) | 0 (0.0%) |
| Bachelor's Degree | 0 (0.0%) | 0 (0.0%) |
| Graduate Degree | 0 (0.0%) | 0 (0.0%) |
| Total | 0 (0.0%) | 0 (0.0%) |
Employment Characteristics in Viking
Employment by Class of Employer in Viking
Among the 47 employed individuals in Viking, private company employees (33 | 70.2%), self-employed (not incorporated) (5 | 10.6%), and not-for-profit organizations (5 | 10.6%) make up the most common classes of employment.
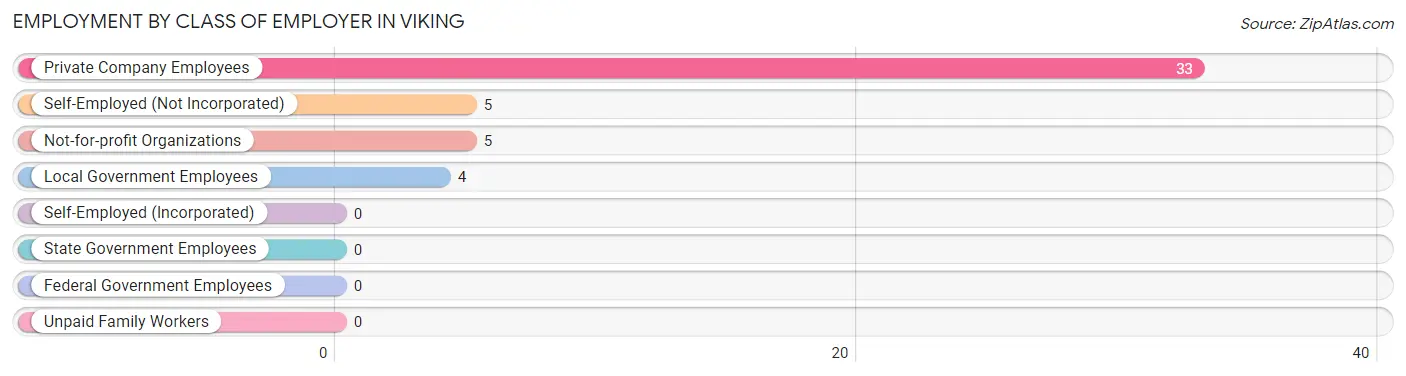
| Employer Class | # Employees | % Employees |
| Private Company Employees | 33 | 70.2% |
| Self-Employed (Incorporated) | 0 | 0.0% |
| Self-Employed (Not Incorporated) | 5 | 10.6% |
| Not-for-profit Organizations | 5 | 10.6% |
| Local Government Employees | 4 | 8.5% |
| State Government Employees | 0 | 0.0% |
| Federal Government Employees | 0 | 0.0% |
| Unpaid Family Workers | 0 | 0.0% |
| Total | 47 | 100.0% |
Employment Status by Age in Viking
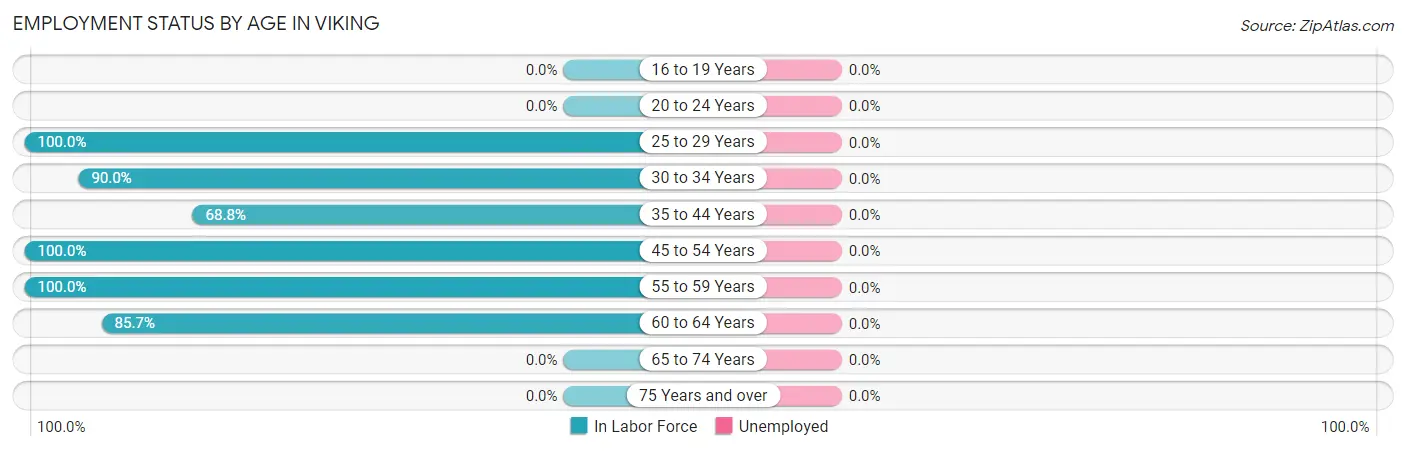
| Age Bracket | In Labor Force | Unemployed |
| 16 to 19 Years | 0 (0.0%) | 0 (0.0%) |
| 20 to 24 Years | 0 (0.0%) | 0 (0.0%) |
| 25 to 29 Years | 6 (100.0%) | 0 (0.0%) |
| 30 to 34 Years | 9 (90.0%) | 0 (0.0%) |
| 35 to 44 Years | 11 (68.8%) | 0 (0.0%) |
| 45 to 54 Years | 11 (100.0%) | 0 (0.0%) |
| 55 to 59 Years | 4 (100.0%) | 0 (0.0%) |
| 60 to 64 Years | 6 (85.7%) | 0 (0.0%) |
| 65 to 74 Years | 0 (0.0%) | 0 (0.0%) |
| 75 Years and over | 0 (0.0%) | 0 (0.0%) |
| Total | 47 (52.8%) | 0 (0.0%) |
Employment Status by Educational Attainment in Viking
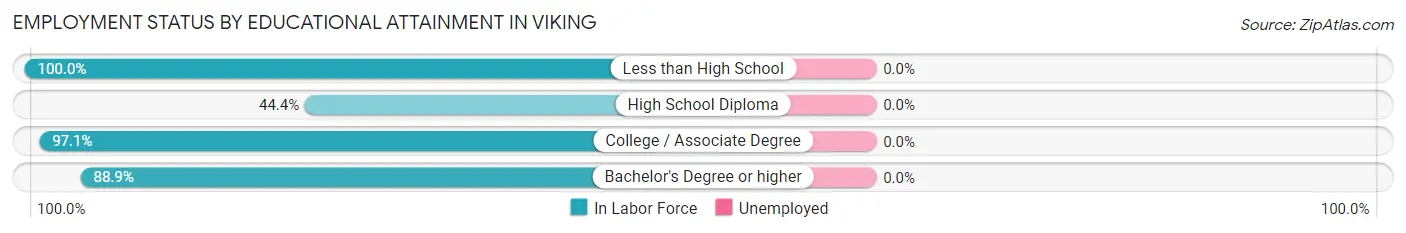
| Educational Attainment | In Labor Force | Unemployed |
| Less than High School | 1 (100.0%) | 0 (0.0%) |
| High School Diploma | 4 (44.4%) | 0 (0.0%) |
| College / Associate Degree | 34 (97.1%) | 0 (0.0%) |
| Bachelor's Degree or higher | 8 (88.9%) | 0 (0.0%) |
| Total | 47 (87.0%) | 0 (0.0%) |
Employment Occupations by Sex in Viking
Management, Business, Science and Arts Occupations
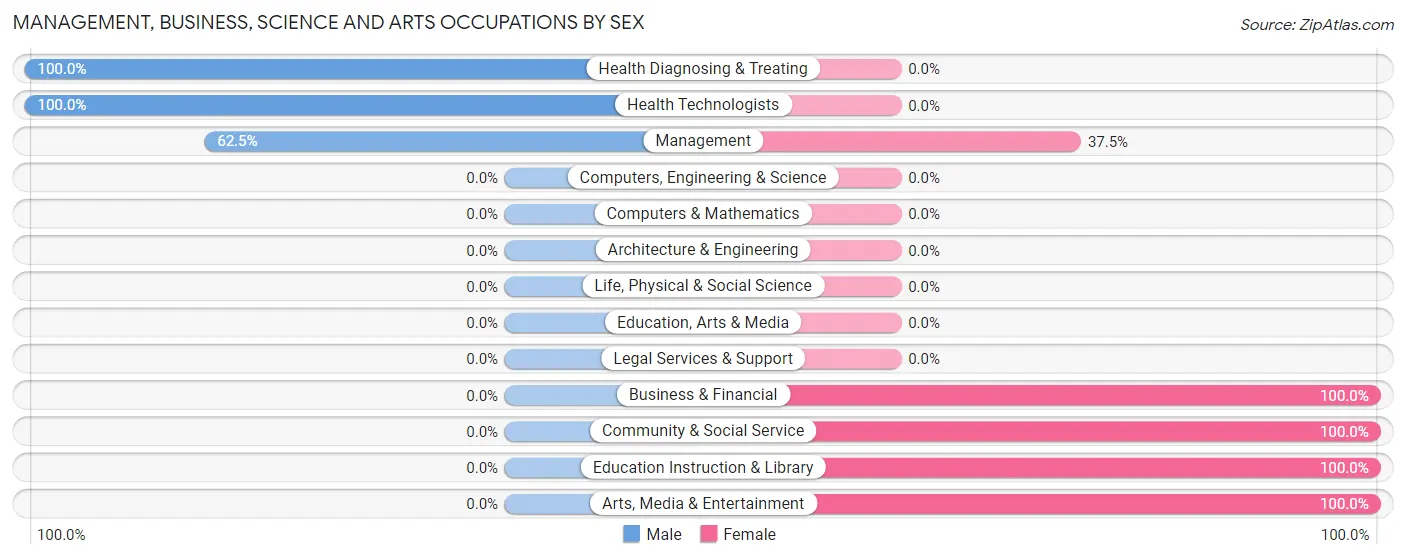
The most common Management, Business, Science and Arts occupations in Viking are Management (8 | 17.0%), Business & Financial (8 | 17.0%), Community & Social Service (4 | 8.5%), Education Instruction & Library (2 | 4.3%), and Arts, Media & Entertainment (2 | 4.3%).
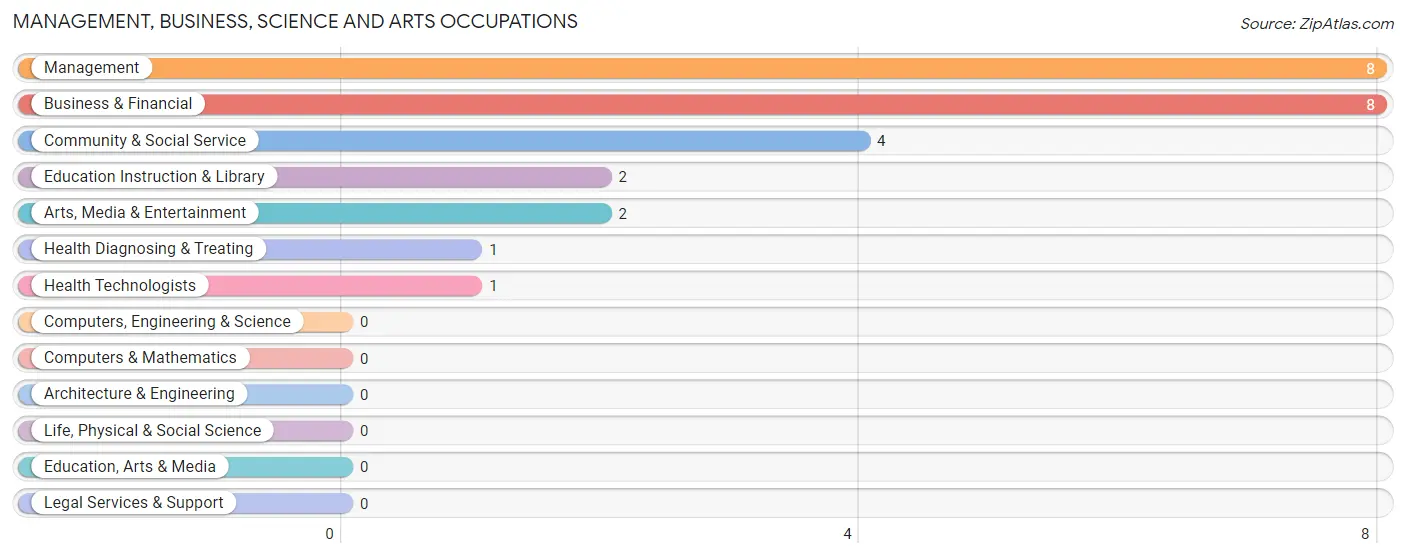
Management, Business, Science and Arts Occupations by Sex
Within the Management, Business, Science and Arts occupations in Viking, the most male-oriented occupations are Health Diagnosing & Treating (100.0%), Health Technologists (100.0%), and Management (62.5%), while the most female-oriented occupations are Business & Financial (100.0%), Community & Social Service (100.0%), and Education Instruction & Library (100.0%).
| Occupation | Male | Female |
| Management | 5 (62.5%) | 3 (37.5%) |
| Business & Financial | 0 (0.0%) | 8 (100.0%) |
| Computers, Engineering & Science | 0 (0.0%) | 0 (0.0%) |
| Computers & Mathematics | 0 (0.0%) | 0 (0.0%) |
| Architecture & Engineering | 0 (0.0%) | 0 (0.0%) |
| Life, Physical & Social Science | 0 (0.0%) | 0 (0.0%) |
| Community & Social Service | 0 (0.0%) | 4 (100.0%) |
| Education, Arts & Media | 0 (0.0%) | 0 (0.0%) |
| Legal Services & Support | 0 (0.0%) | 0 (0.0%) |
| Education Instruction & Library | 0 (0.0%) | 2 (100.0%) |
| Arts, Media & Entertainment | 0 (0.0%) | 2 (100.0%) |
| Health Diagnosing & Treating | 1 (100.0%) | 0 (0.0%) |
| Health Technologists | 1 (100.0%) | 0 (0.0%) |
| Total (Category) | 6 (28.6%) | 15 (71.4%) |
| Total (Overall) | 25 (53.2%) | 22 (46.8%) |
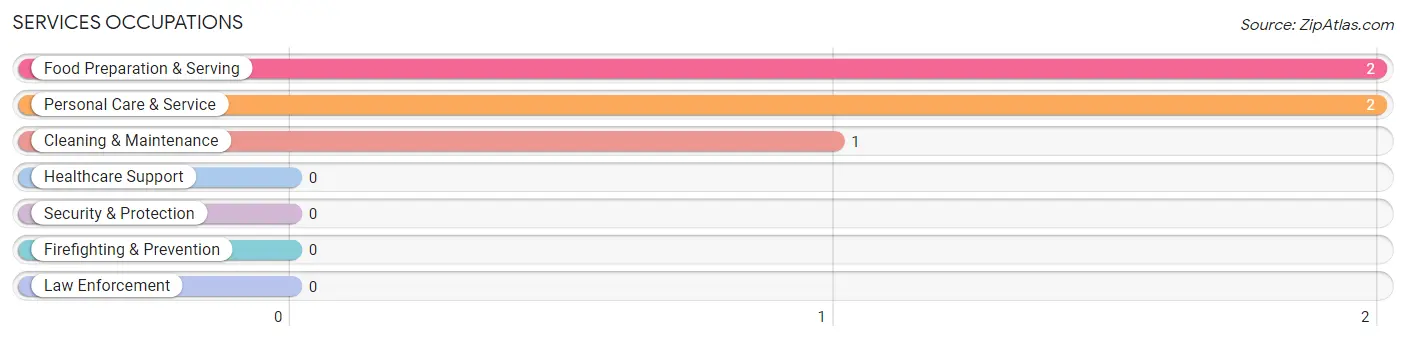
Services Occupations
The most common Services occupations in Viking are Food Preparation & Serving (2 | 4.3%), Personal Care & Service (2 | 4.3%), and Cleaning & Maintenance (1 | 2.1%).
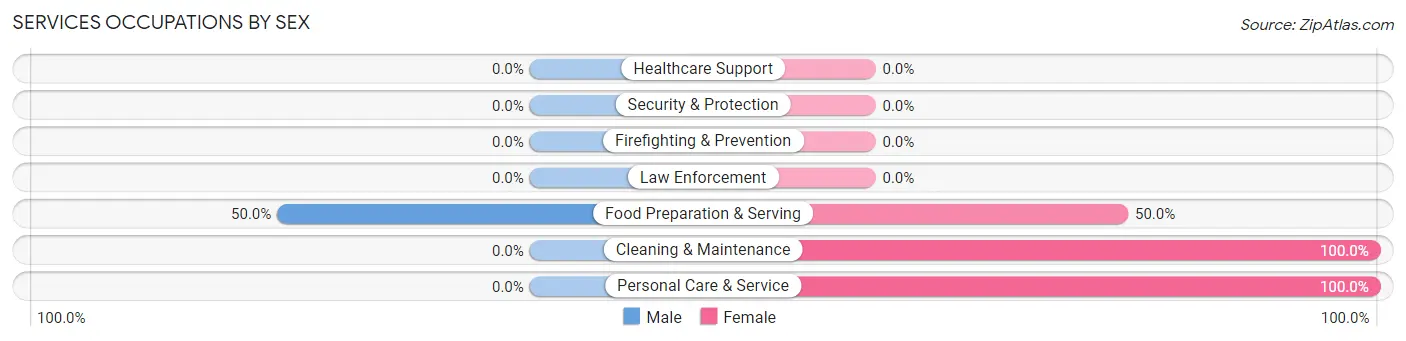
Services Occupations by Sex
| Occupation | Male | Female |
| Healthcare Support | 0 (0.0%) | 0 (0.0%) |
| Security & Protection | 0 (0.0%) | 0 (0.0%) |
| Firefighting & Prevention | 0 (0.0%) | 0 (0.0%) |
| Law Enforcement | 0 (0.0%) | 0 (0.0%) |
| Food Preparation & Serving | 1 (50.0%) | 1 (50.0%) |
| Cleaning & Maintenance | 0 (0.0%) | 1 (100.0%) |
| Personal Care & Service | 0 (0.0%) | 2 (100.0%) |
| Total (Category) | 1 (20.0%) | 4 (80.0%) |
| Total (Overall) | 25 (53.2%) | 22 (46.8%) |
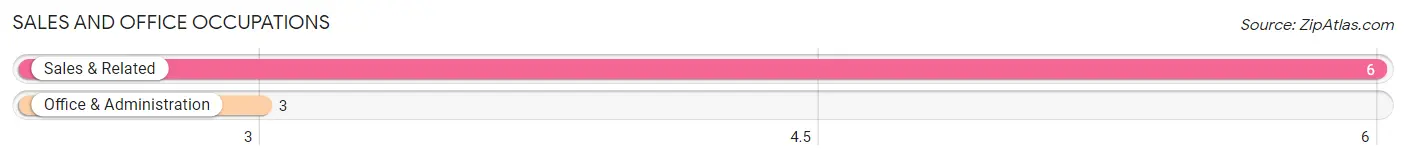
Sales and Office Occupations
The most common Sales and Office occupations in Viking are Sales & Related (6 | 12.8%), and Office & Administration (3 | 6.4%).
Sales and Office Occupations by Sex
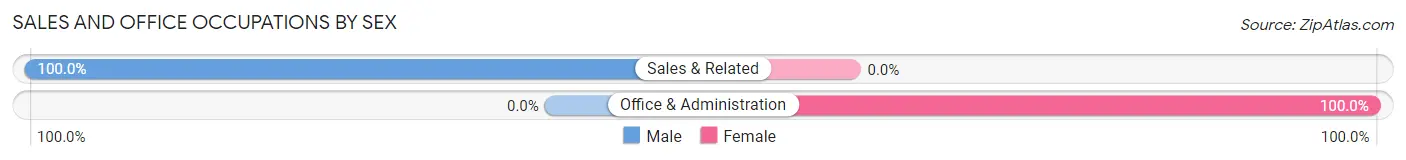
| Occupation | Male | Female |
| Sales & Related | 6 (100.0%) | 0 (0.0%) |
| Office & Administration | 0 (0.0%) | 3 (100.0%) |
| Total (Category) | 6 (66.7%) | 3 (33.3%) |
| Total (Overall) | 25 (53.2%) | 22 (46.8%) |
Natural Resources, Construction and Maintenance Occupations
The most common Natural Resources, Construction and Maintenance occupations in Viking are , and Installation, Maintenance & Repair (6 | 12.8%).
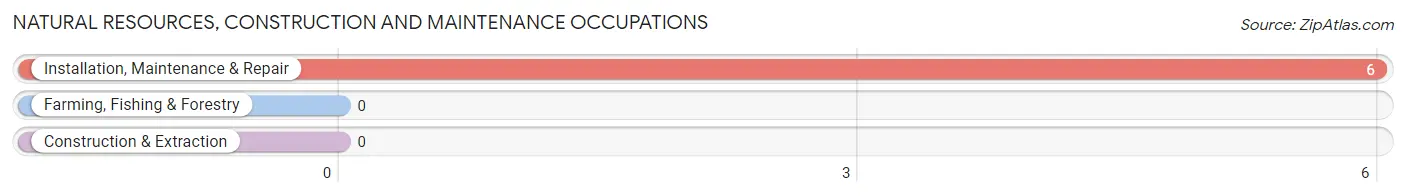
Natural Resources, Construction and Maintenance Occupations by Sex
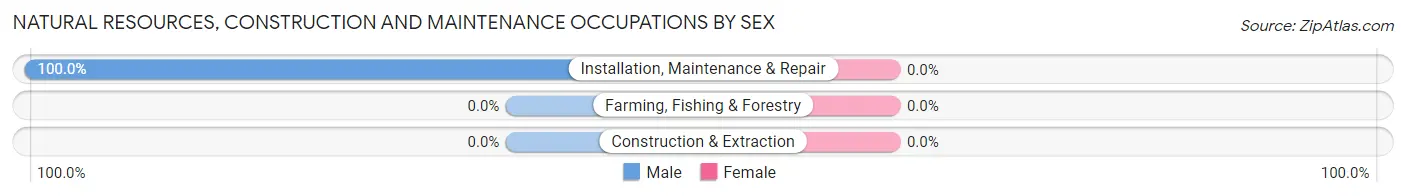
| Occupation | Male | Female |
| Farming, Fishing & Forestry | 0 (0.0%) | 0 (0.0%) |
| Construction & Extraction | 0 (0.0%) | 0 (0.0%) |
| Installation, Maintenance & Repair | 6 (100.0%) | 0 (0.0%) |
| Total (Category) | 6 (100.0%) | 0 (0.0%) |
| Total (Overall) | 25 (53.2%) | 22 (46.8%) |
Production, Transportation and Moving Occupations
The most common Production, Transportation and Moving occupations in Viking are Production (3 | 6.4%), and Transportation (3 | 6.4%).
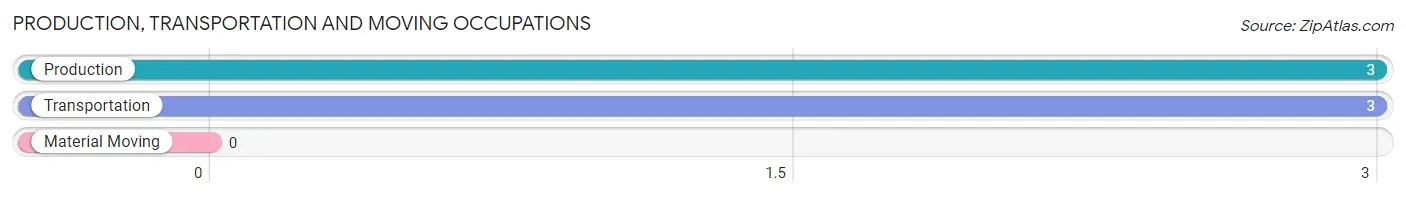
Production, Transportation and Moving Occupations by Sex
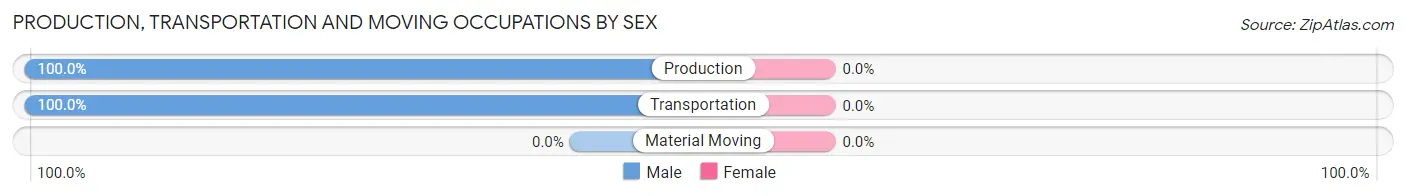
| Occupation | Male | Female |
| Production | 3 (100.0%) | 0 (0.0%) |
| Transportation | 3 (100.0%) | 0 (0.0%) |
| Material Moving | 0 (0.0%) | 0 (0.0%) |
| Total (Category) | 6 (100.0%) | 0 (0.0%) |
| Total (Overall) | 25 (53.2%) | 22 (46.8%) |
Employment Industries by Sex in Viking
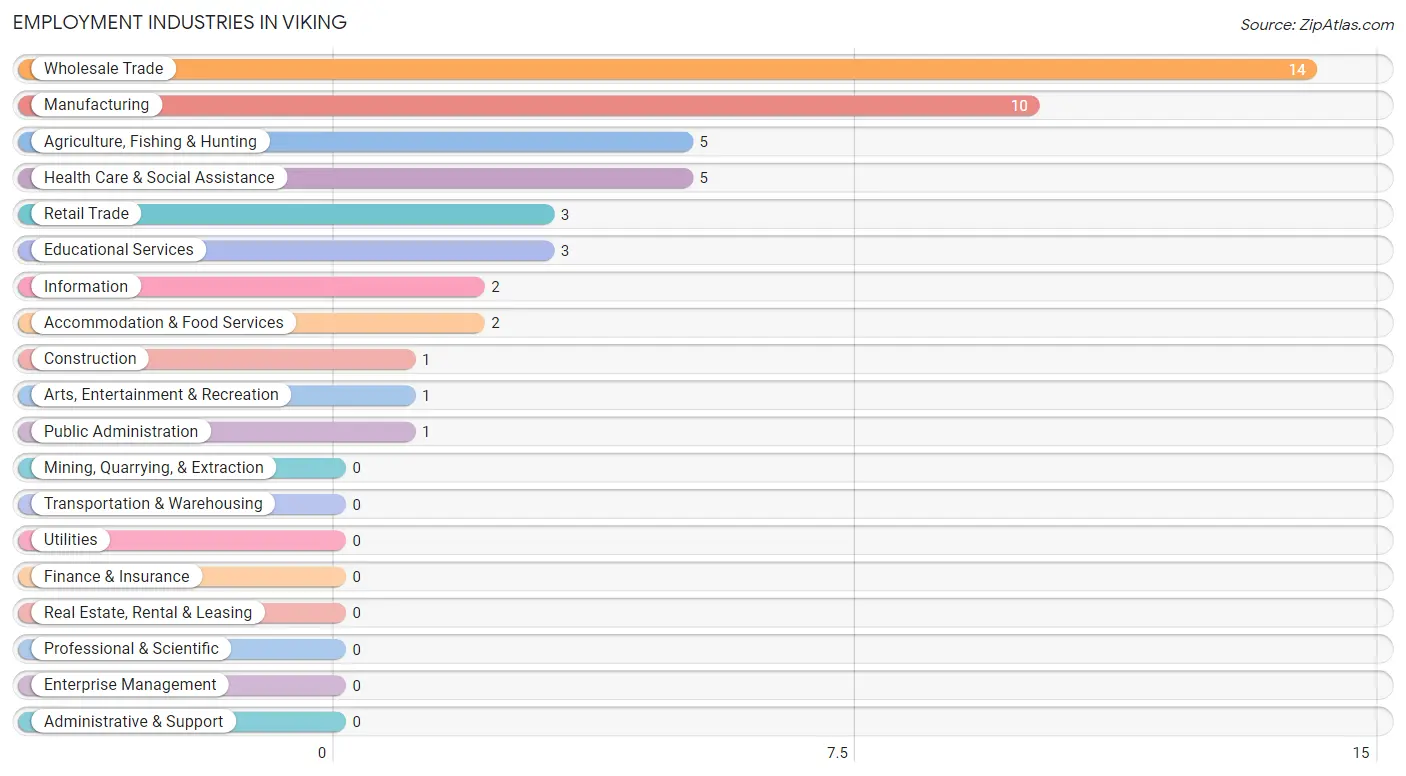
Employment Industries in Viking
The major employment industries in Viking include Wholesale Trade (14 | 29.8%), Manufacturing (10 | 21.3%), Agriculture, Fishing & Hunting (5 | 10.6%), Health Care & Social Assistance (5 | 10.6%), and Retail Trade (3 | 6.4%).
Employment Industries by Sex in Viking
The Viking industries that see more men than women are Agriculture, Fishing & Hunting (100.0%), Construction (100.0%), and Information (100.0%), whereas the industries that tend to have a higher number of women are Educational Services (100.0%), Health Care & Social Assistance (100.0%), and Arts, Entertainment & Recreation (100.0%).
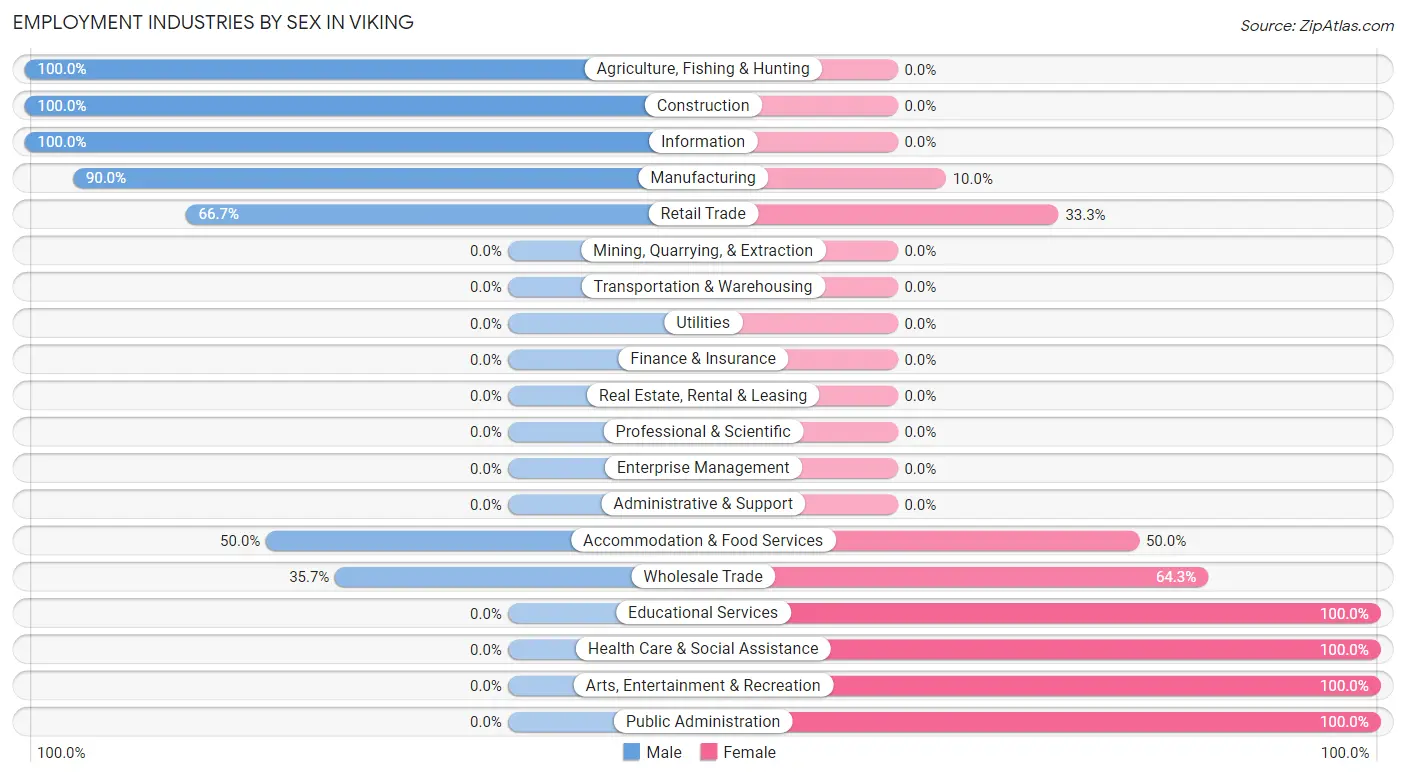
| Industry | Male | Female |
| Agriculture, Fishing & Hunting | 5 (100.0%) | 0 (0.0%) |
| Mining, Quarrying, & Extraction | 0 (0.0%) | 0 (0.0%) |
| Construction | 1 (100.0%) | 0 (0.0%) |
| Manufacturing | 9 (90.0%) | 1 (10.0%) |
| Wholesale Trade | 5 (35.7%) | 9 (64.3%) |
| Retail Trade | 2 (66.7%) | 1 (33.3%) |
| Transportation & Warehousing | 0 (0.0%) | 0 (0.0%) |
| Utilities | 0 (0.0%) | 0 (0.0%) |
| Information | 2 (100.0%) | 0 (0.0%) |
| Finance & Insurance | 0 (0.0%) | 0 (0.0%) |
| Real Estate, Rental & Leasing | 0 (0.0%) | 0 (0.0%) |
| Professional & Scientific | 0 (0.0%) | 0 (0.0%) |
| Enterprise Management | 0 (0.0%) | 0 (0.0%) |
| Administrative & Support | 0 (0.0%) | 0 (0.0%) |
| Educational Services | 0 (0.0%) | 3 (100.0%) |
| Health Care & Social Assistance | 0 (0.0%) | 5 (100.0%) |
| Arts, Entertainment & Recreation | 0 (0.0%) | 1 (100.0%) |
| Accommodation & Food Services | 1 (50.0%) | 1 (50.0%) |
| Public Administration | 0 (0.0%) | 1 (100.0%) |
| Total | 25 (53.2%) | 22 (46.8%) |
Education in Viking
School Enrollment in Viking
The most common levels of schooling among the 13 students in Viking are elementary school (6 | 46.2%), nursery / preschool (3 | 23.1%), and middle school (2 | 15.4%).
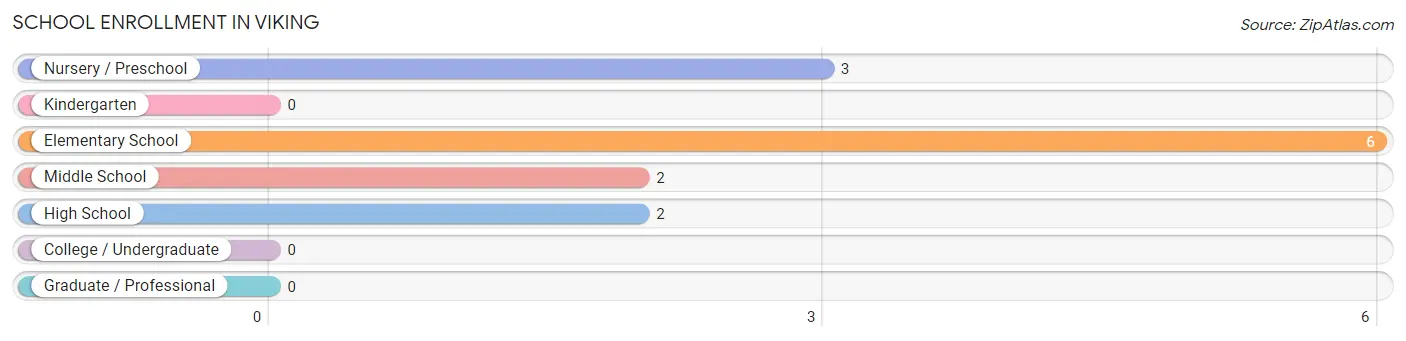
| School Level | # Students | % Students |
| Nursery / Preschool | 3 | 23.1% |
| Kindergarten | 0 | 0.0% |
| Elementary School | 6 | 46.2% |
| Middle School | 2 | 15.4% |
| High School | 2 | 15.4% |
| College / Undergraduate | 0 | 0.0% |
| Graduate / Professional | 0 | 0.0% |
| Total | 13 | 100.0% |
School Enrollment by Age by Funding Source in Viking
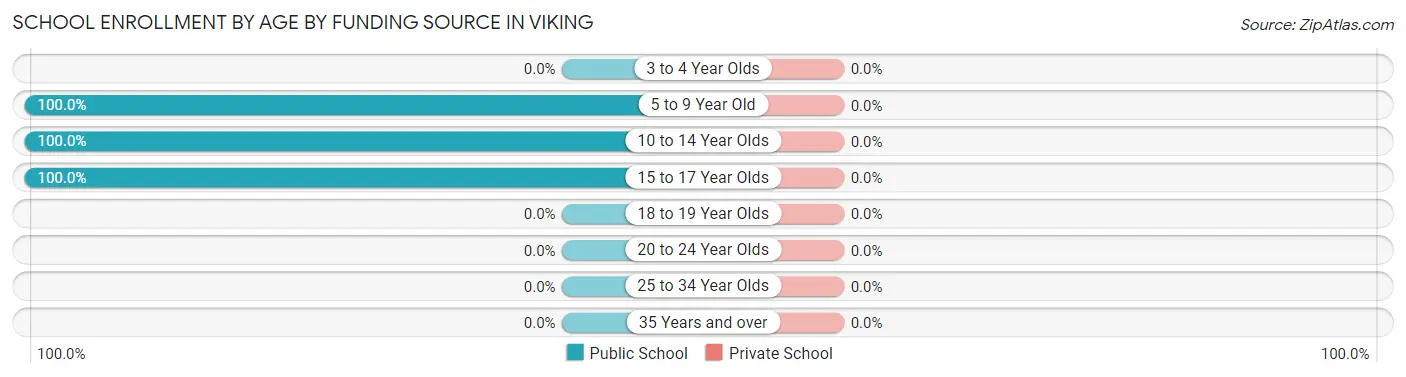
| Age Bracket | Public School | Private School |
| 3 to 4 Year Olds | 0 (0.0%) | 0 (0.0%) |
| 5 to 9 Year Old | 9 (100.0%) | 0 (0.0%) |
| 10 to 14 Year Olds | 2 (100.0%) | 0 (0.0%) |
| 15 to 17 Year Olds | 2 (100.0%) | 0 (0.0%) |
| 18 to 19 Year Olds | 0 (0.0%) | 0 (0.0%) |
| 20 to 24 Year Olds | 0 (0.0%) | 0 (0.0%) |
| 25 to 34 Year Olds | 0 (0.0%) | 0 (0.0%) |
| 35 Years and over | 0 (0.0%) | 0 (0.0%) |
| Total | 13 (100.0%) | 0 (0.0%) |
Educational Attainment by Field of Study in Viking
Education (6 | 46.2%), business (3 | 23.1%), liberal arts & history (2 | 15.4%), science & technology (1 | 7.7%), and arts & humanities (1 | 7.7%) are the most common fields of study among 13 individuals in Viking who have obtained a bachelor's degree or higher.
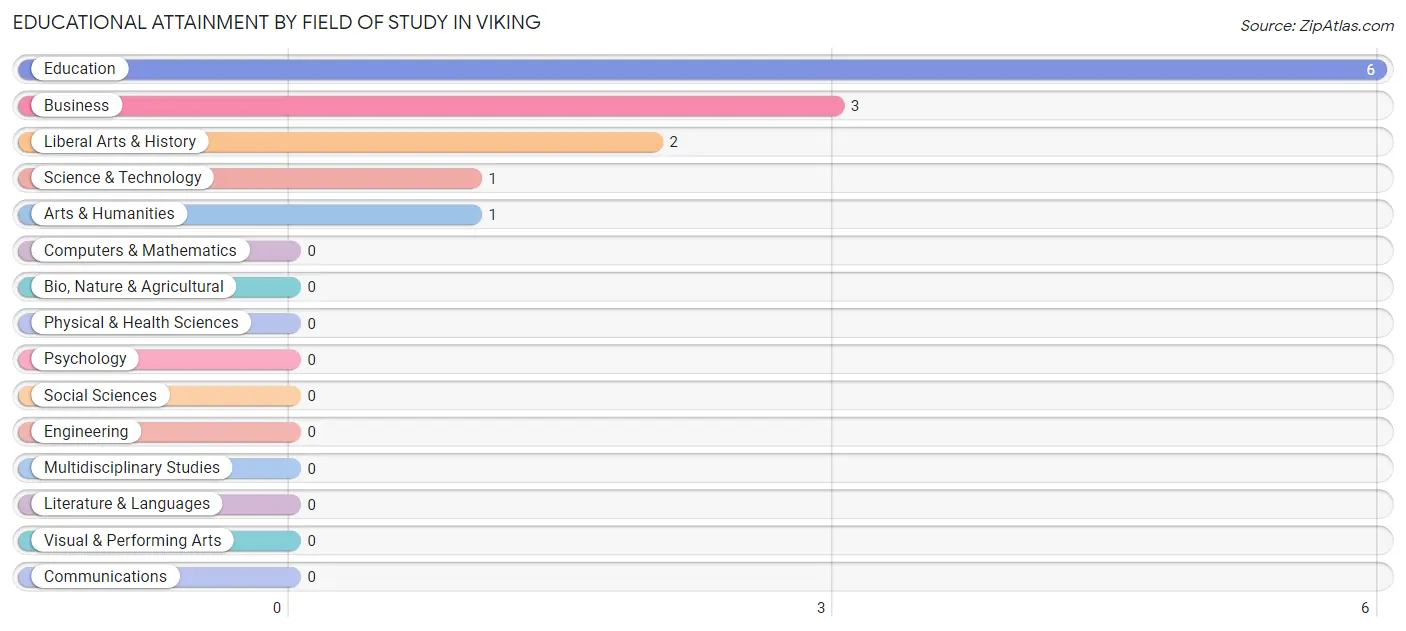
| Field of Study | # Graduates | % Graduates |
| Computers & Mathematics | 0 | 0.0% |
| Bio, Nature & Agricultural | 0 | 0.0% |
| Physical & Health Sciences | 0 | 0.0% |
| Psychology | 0 | 0.0% |
| Social Sciences | 0 | 0.0% |
| Engineering | 0 | 0.0% |
| Multidisciplinary Studies | 0 | 0.0% |
| Science & Technology | 1 | 7.7% |
| Business | 3 | 23.1% |
| Education | 6 | 46.2% |
| Literature & Languages | 0 | 0.0% |
| Liberal Arts & History | 2 | 15.4% |
| Visual & Performing Arts | 0 | 0.0% |
| Communications | 0 | 0.0% |
| Arts & Humanities | 1 | 7.7% |
| Total | 13 | 100.0% |
Transportation & Commute in Viking
Vehicle Availability by Sex in Viking
The most prevalent vehicle ownership categories in Viking are males with 4 vehicles (8, accounting for 32.0%) and females with 4 vehicles (2, making up 36.4%).
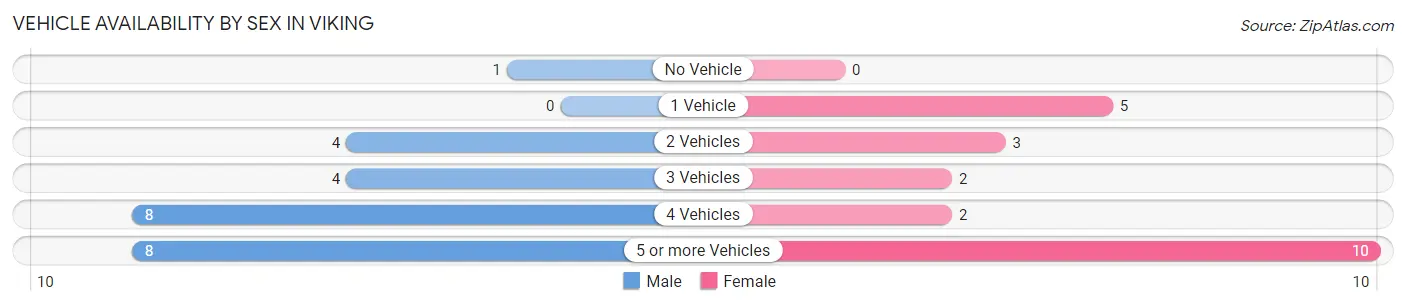
| Vehicles Available | Male | Female |
| No Vehicle | 1 (4.0%) | 0 (0.0%) |
| 1 Vehicle | 0 (0.0%) | 5 (22.7%) |
| 2 Vehicles | 4 (16.0%) | 3 (13.6%) |
| 3 Vehicles | 4 (16.0%) | 2 (9.1%) |
| 4 Vehicles | 8 (32.0%) | 2 (9.1%) |
| 5 or more Vehicles | 8 (32.0%) | 10 (45.5%) |
| Total | 25 (100.0%) | 22 (100.0%) |
Commute Time in Viking
The most frequently occuring commute durations in Viking are 20 to 24 minutes (20 commuters, 58.8%), 25 to 29 minutes (6 commuters, 17.6%), and 30 to 34 minutes (3 commuters, 8.8%).
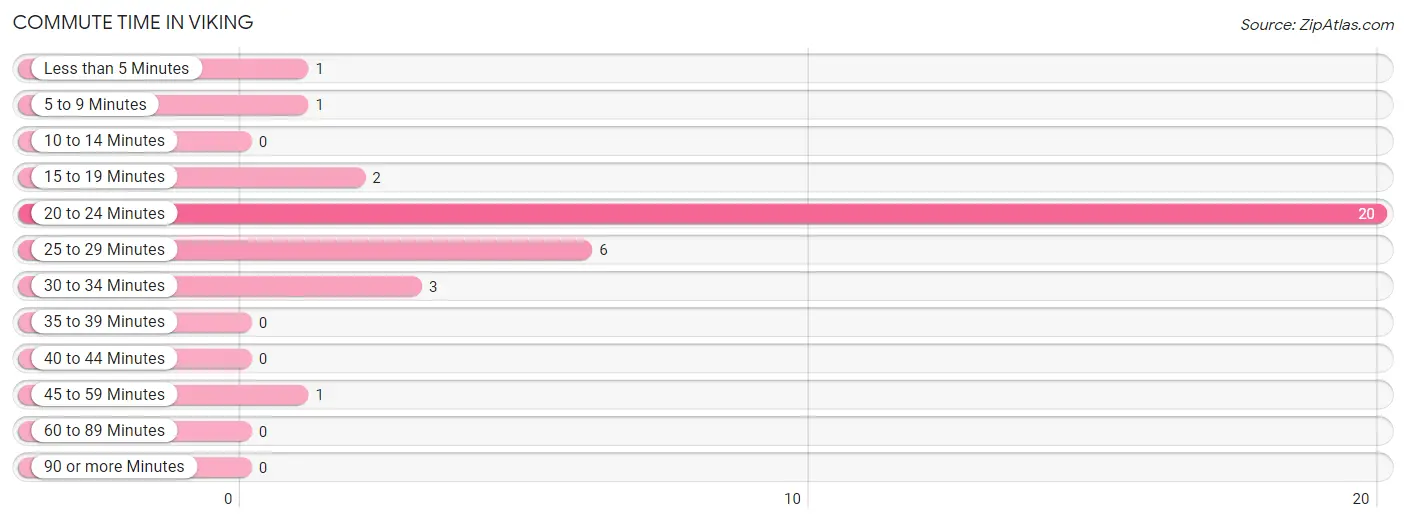
| Commute Time | # Commuters | % Commuters |
| Less than 5 Minutes | 1 | 2.9% |
| 5 to 9 Minutes | 1 | 2.9% |
| 10 to 14 Minutes | 0 | 0.0% |
| 15 to 19 Minutes | 2 | 5.9% |
| 20 to 24 Minutes | 20 | 58.8% |
| 25 to 29 Minutes | 6 | 17.6% |
| 30 to 34 Minutes | 3 | 8.8% |
| 35 to 39 Minutes | 0 | 0.0% |
| 40 to 44 Minutes | 0 | 0.0% |
| 45 to 59 Minutes | 1 | 2.9% |
| 60 to 89 Minutes | 0 | 0.0% |
| 90 or more Minutes | 0 | 0.0% |
Commute Time by Sex in Viking
The most common commute times in Viking are 20 to 24 minutes (10 commuters, 50.0%) for males and 20 to 24 minutes (10 commuters, 71.4%) for females.
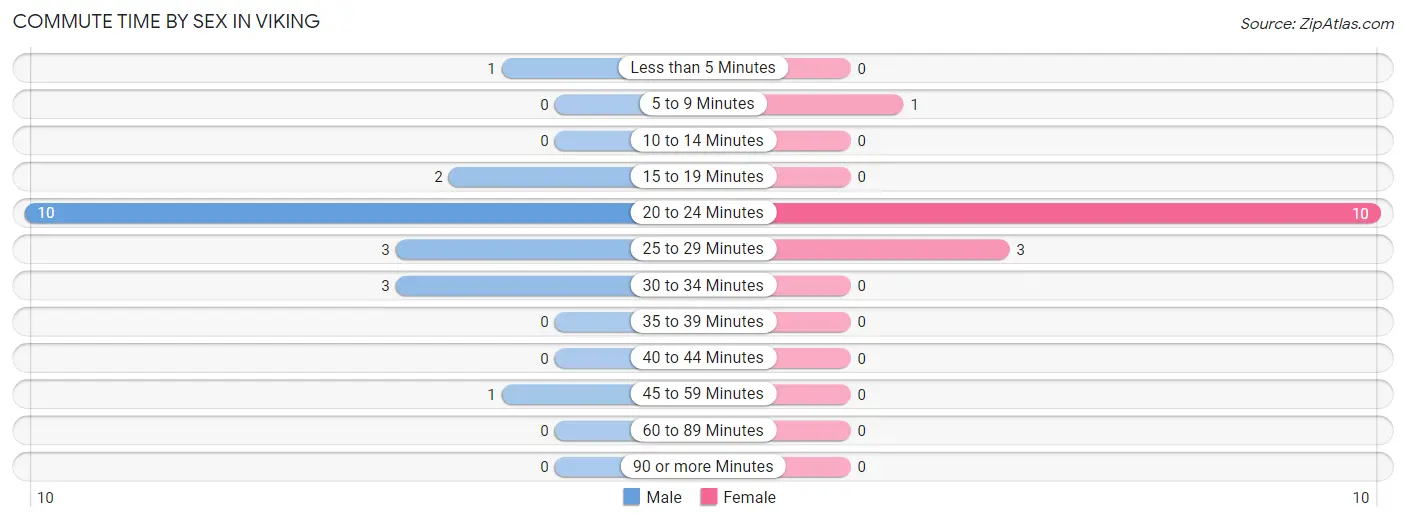
| Commute Time | Male | Female |
| Less than 5 Minutes | 1 (5.0%) | 0 (0.0%) |
| 5 to 9 Minutes | 0 (0.0%) | 1 (7.1%) |
| 10 to 14 Minutes | 0 (0.0%) | 0 (0.0%) |
| 15 to 19 Minutes | 2 (10.0%) | 0 (0.0%) |
| 20 to 24 Minutes | 10 (50.0%) | 10 (71.4%) |
| 25 to 29 Minutes | 3 (15.0%) | 3 (21.4%) |
| 30 to 34 Minutes | 3 (15.0%) | 0 (0.0%) |
| 35 to 39 Minutes | 0 (0.0%) | 0 (0.0%) |
| 40 to 44 Minutes | 0 (0.0%) | 0 (0.0%) |
| 45 to 59 Minutes | 1 (5.0%) | 0 (0.0%) |
| 60 to 89 Minutes | 0 (0.0%) | 0 (0.0%) |
| 90 or more Minutes | 0 (0.0%) | 0 (0.0%) |
Time of Departure to Work by Sex in Viking
The most frequent times of departure to work in Viking are 12:00 AM to 4:59 AM (5, 25.0%) for males and 11:00 AM to 11:59 AM (4, 28.6%) for females.
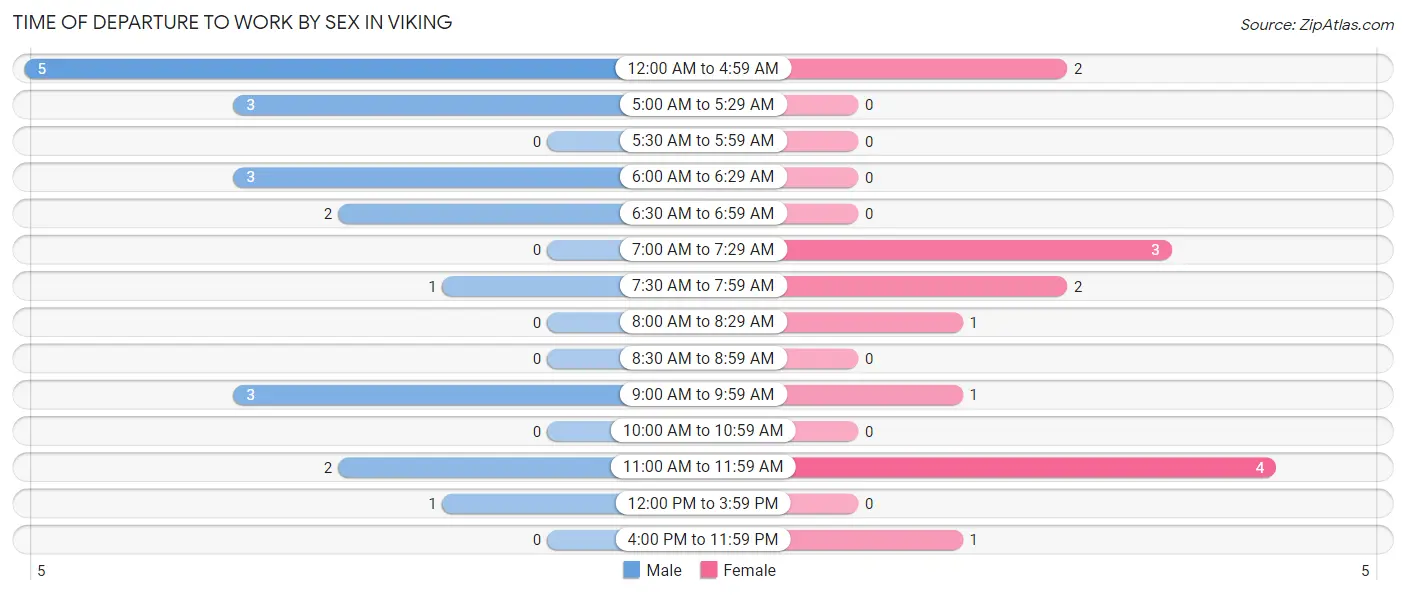
| Time of Departure | Male | Female |
| 12:00 AM to 4:59 AM | 5 (25.0%) | 2 (14.3%) |
| 5:00 AM to 5:29 AM | 3 (15.0%) | 0 (0.0%) |
| 5:30 AM to 5:59 AM | 0 (0.0%) | 0 (0.0%) |
| 6:00 AM to 6:29 AM | 3 (15.0%) | 0 (0.0%) |
| 6:30 AM to 6:59 AM | 2 (10.0%) | 0 (0.0%) |
| 7:00 AM to 7:29 AM | 0 (0.0%) | 3 (21.4%) |
| 7:30 AM to 7:59 AM | 1 (5.0%) | 2 (14.3%) |
| 8:00 AM to 8:29 AM | 0 (0.0%) | 1 (7.1%) |
| 8:30 AM to 8:59 AM | 0 (0.0%) | 0 (0.0%) |
| 9:00 AM to 9:59 AM | 3 (15.0%) | 1 (7.1%) |
| 10:00 AM to 10:59 AM | 0 (0.0%) | 0 (0.0%) |
| 11:00 AM to 11:59 AM | 2 (10.0%) | 4 (28.6%) |
| 12:00 PM to 3:59 PM | 1 (5.0%) | 0 (0.0%) |
| 4:00 PM to 11:59 PM | 0 (0.0%) | 1 (7.1%) |
| Total | 20 (100.0%) | 14 (100.0%) |
Housing Occupancy in Viking
Occupancy by Ownership in Viking
Of the total 48 dwellings in Viking, owner-occupied units account for 48 (100.0%), while renter-occupied units make up 0 (0.0%).
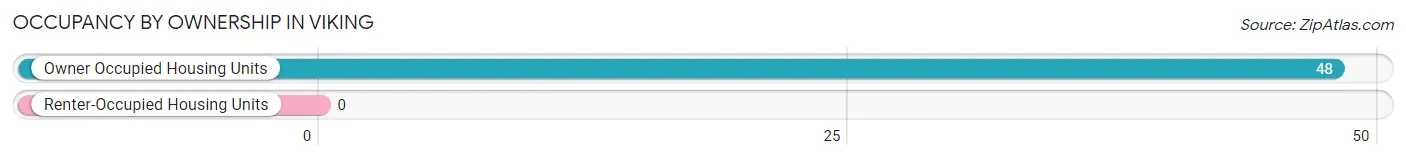
| Occupancy | # Housing Units | % Housing Units |
| Owner Occupied Housing Units | 48 | 100.0% |
| Renter-Occupied Housing Units | 0 | 0.0% |
| Total Occupied Housing Units | 48 | 100.0% |
Occupancy by Household Size in Viking
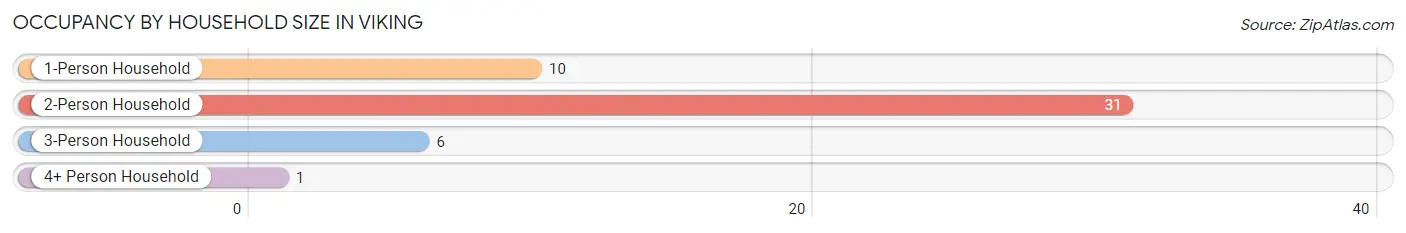
| Household Size | # Housing Units | % Housing Units |
| 1-Person Household | 10 | 20.8% |
| 2-Person Household | 31 | 64.6% |
| 3-Person Household | 6 | 12.5% |
| 4+ Person Household | 1 | 2.1% |
| Total Housing Units | 48 | 100.0% |
Occupancy by Ownership by Household Size in Viking
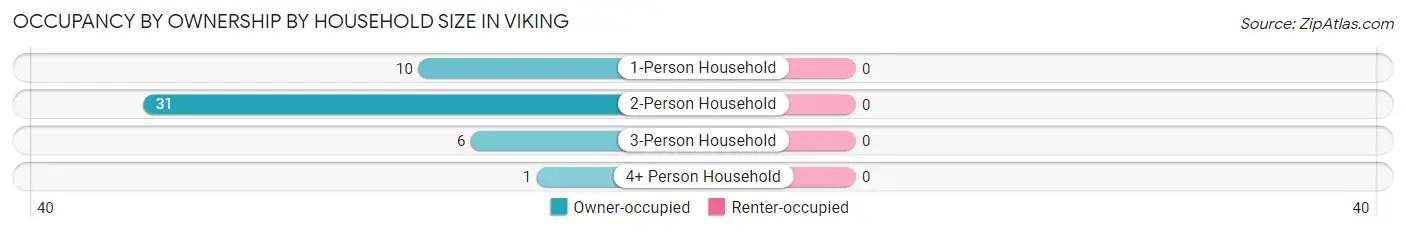
| Household Size | Owner-occupied | Renter-occupied |
| 1-Person Household | 10 (100.0%) | 0 (0.0%) |
| 2-Person Household | 31 (100.0%) | 0 (0.0%) |
| 3-Person Household | 6 (100.0%) | 0 (0.0%) |
| 4+ Person Household | 1 (100.0%) | 0 (0.0%) |
| Total Housing Units | 48 (100.0%) | 0 (0.0%) |
Occupancy by Educational Attainment in Viking
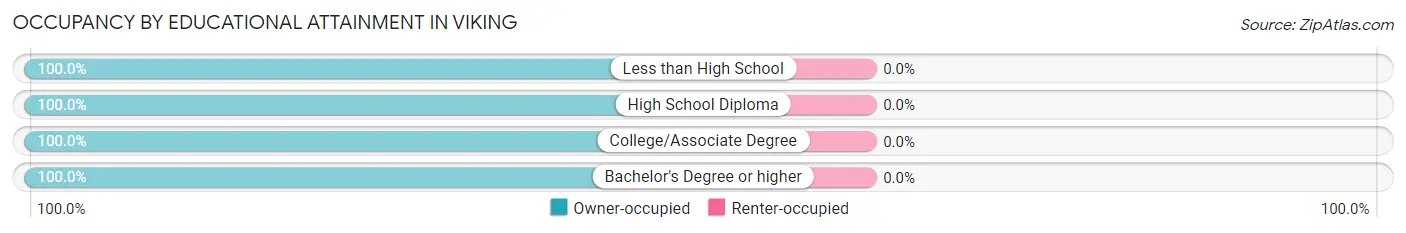
| Household Size | Owner-occupied | Renter-occupied |
| Less than High School | 3 (100.0%) | 0 (0.0%) |
| High School Diploma | 16 (100.0%) | 0 (0.0%) |
| College/Associate Degree | 21 (100.0%) | 0 (0.0%) |
| Bachelor's Degree or higher | 8 (100.0%) | 0 (0.0%) |
Occupancy by Age of Householder in Viking
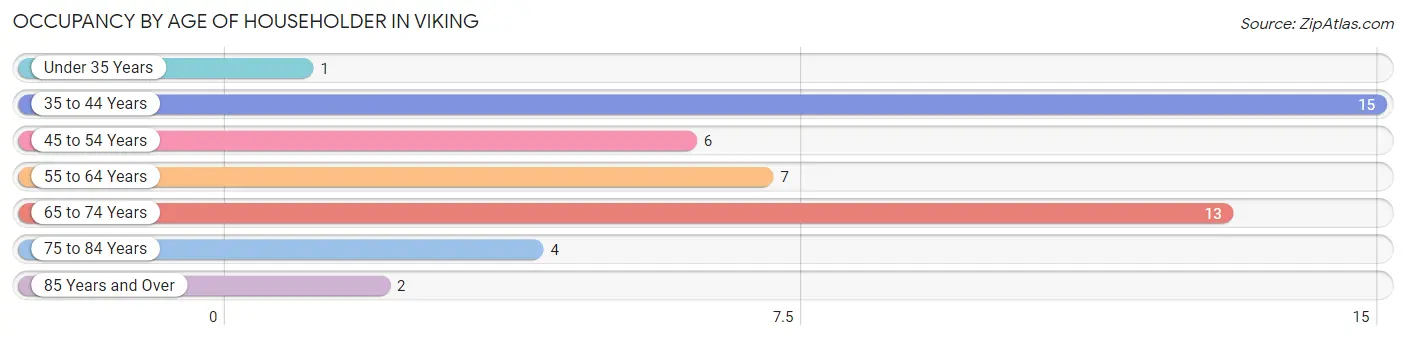
| Age Bracket | # Households | % Households |
| Under 35 Years | 1 | 2.1% |
| 35 to 44 Years | 15 | 31.2% |
| 45 to 54 Years | 6 | 12.5% |
| 55 to 64 Years | 7 | 14.6% |
| 65 to 74 Years | 13 | 27.1% |
| 75 to 84 Years | 4 | 8.3% |
| 85 Years and Over | 2 | 4.2% |
| Total | 48 | 100.0% |
Housing Finances in Viking
Median Income by Occupancy in Viking
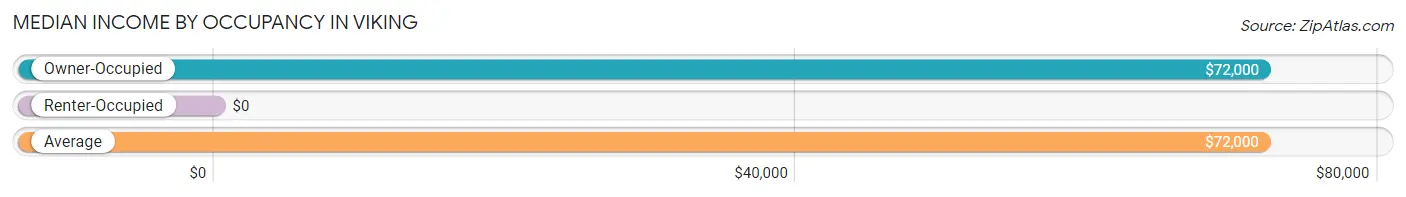
| Occupancy Type | # Households | Median Income |
| Owner-Occupied | 48 (100.0%) | $72,000 |
| Renter-Occupied | 0 (0.0%) | $0 |
| Average | 48 (100.0%) | $72,000 |
Occupancy by Householder Income Bracket in Viking
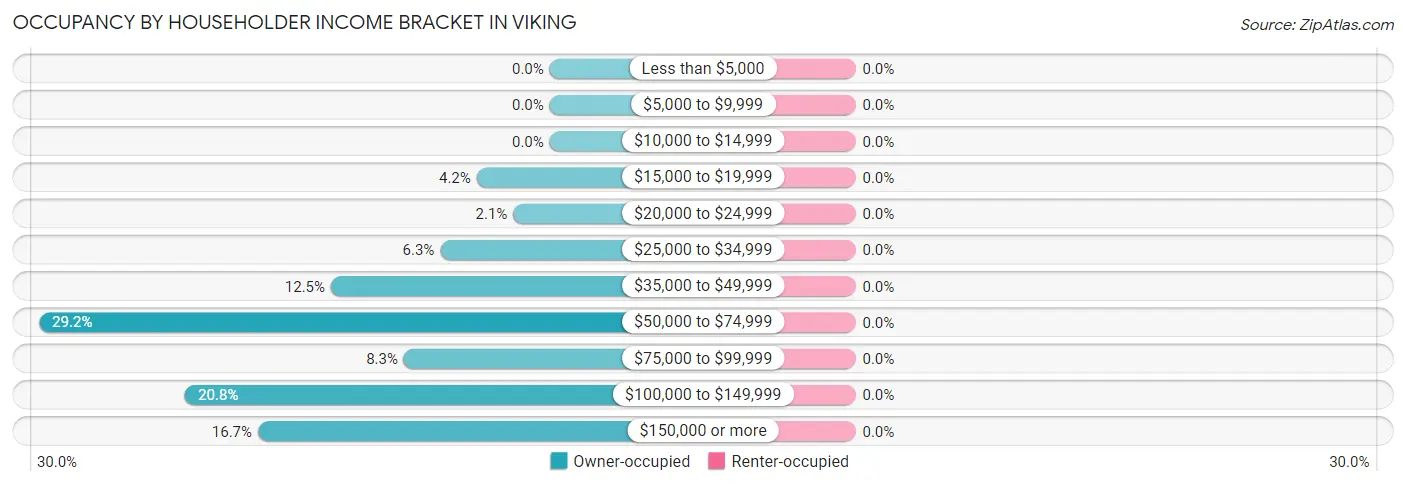
| Income Bracket | Owner-occupied | Renter-occupied |
| Less than $5,000 | 0 (0.0%) | 0 (0.0%) |
| $5,000 to $9,999 | 0 (0.0%) | 0 (0.0%) |
| $10,000 to $14,999 | 0 (0.0%) | 0 (0.0%) |
| $15,000 to $19,999 | 2 (4.2%) | 0 (0.0%) |
| $20,000 to $24,999 | 1 (2.1%) | 0 (0.0%) |
| $25,000 to $34,999 | 3 (6.2%) | 0 (0.0%) |
| $35,000 to $49,999 | 6 (12.5%) | 0 (0.0%) |
| $50,000 to $74,999 | 14 (29.2%) | 0 (0.0%) |
| $75,000 to $99,999 | 4 (8.3%) | 0 (0.0%) |
| $100,000 to $149,999 | 10 (20.8%) | 0 (0.0%) |
| $150,000 or more | 8 (16.7%) | 0 (0.0%) |
| Total | 48 (100.0%) | 0 (0.0%) |
Monthly Housing Cost Tiers in Viking
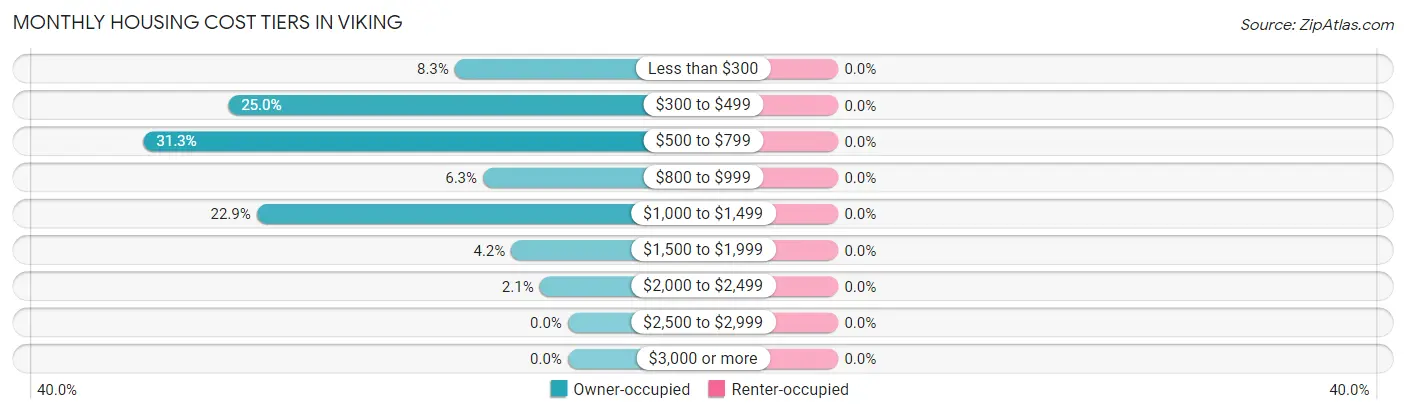
| Monthly Cost | Owner-occupied | Renter-occupied |
| Less than $300 | 4 (8.3%) | 0 (0.0%) |
| $300 to $499 | 12 (25.0%) | 0 (0.0%) |
| $500 to $799 | 15 (31.2%) | 0 (0.0%) |
| $800 to $999 | 3 (6.2%) | 0 (0.0%) |
| $1,000 to $1,499 | 11 (22.9%) | 0 (0.0%) |
| $1,500 to $1,999 | 2 (4.2%) | 0 (0.0%) |
| $2,000 to $2,499 | 1 (2.1%) | 0 (0.0%) |
| $2,500 to $2,999 | 0 (0.0%) | 0 (0.0%) |
| $3,000 or more | 0 (0.0%) | 0 (0.0%) |
| Total | 48 (100.0%) | 0 (0.0%) |
Physical Housing Characteristics in Viking
Housing Structures in Viking
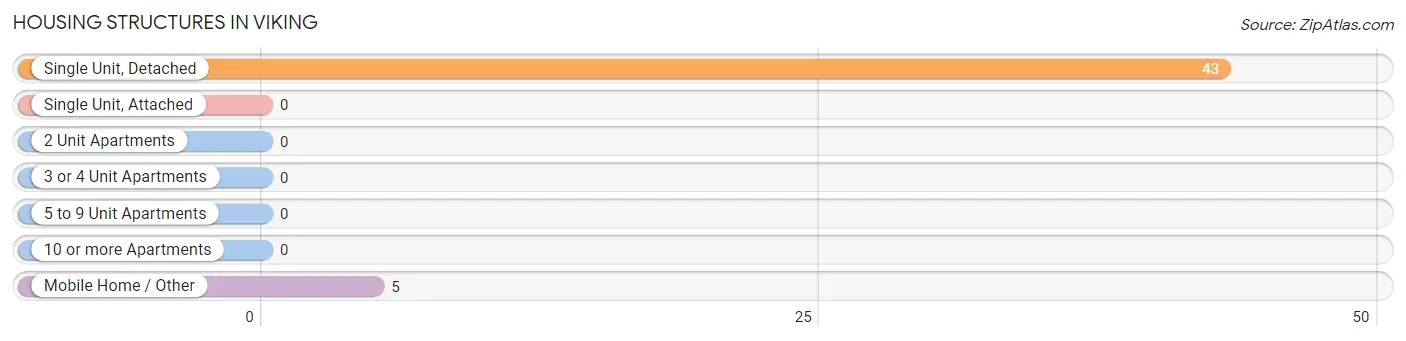
| Structure Type | # Housing Units | % Housing Units |
| Single Unit, Detached | 43 | 89.6% |
| Single Unit, Attached | 0 | 0.0% |
| 2 Unit Apartments | 0 | 0.0% |
| 3 or 4 Unit Apartments | 0 | 0.0% |
| 5 to 9 Unit Apartments | 0 | 0.0% |
| 10 or more Apartments | 0 | 0.0% |
| Mobile Home / Other | 5 | 10.4% |
| Total | 48 | 100.0% |
Housing Structures by Occupancy in Viking
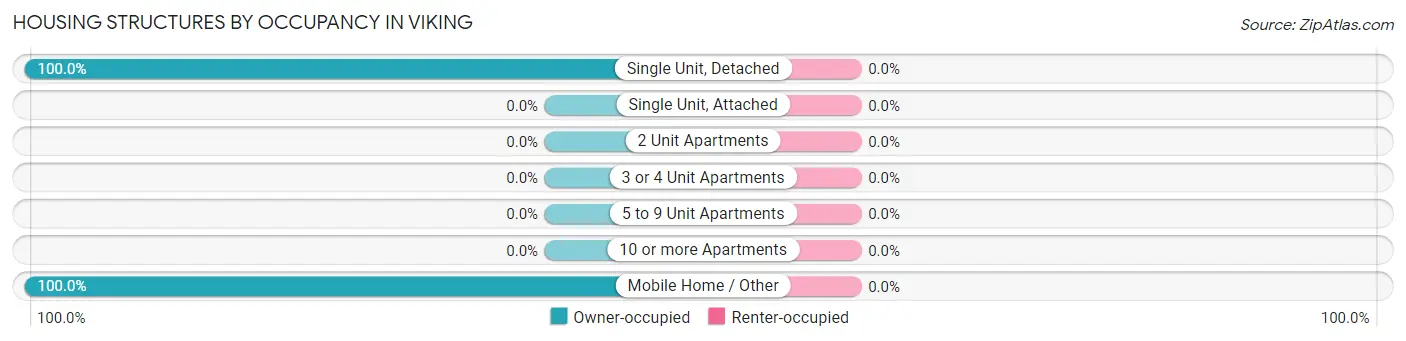
| Structure Type | Owner-occupied | Renter-occupied |
| Single Unit, Detached | 43 (100.0%) | 0 (0.0%) |
| Single Unit, Attached | 0 (0.0%) | 0 (0.0%) |
| 2 Unit Apartments | 0 (0.0%) | 0 (0.0%) |
| 3 or 4 Unit Apartments | 0 (0.0%) | 0 (0.0%) |
| 5 to 9 Unit Apartments | 0 (0.0%) | 0 (0.0%) |
| 10 or more Apartments | 0 (0.0%) | 0 (0.0%) |
| Mobile Home / Other | 5 (100.0%) | 0 (0.0%) |
| Total | 48 (100.0%) | 0 (0.0%) |
Housing Structures by Number of Rooms in Viking
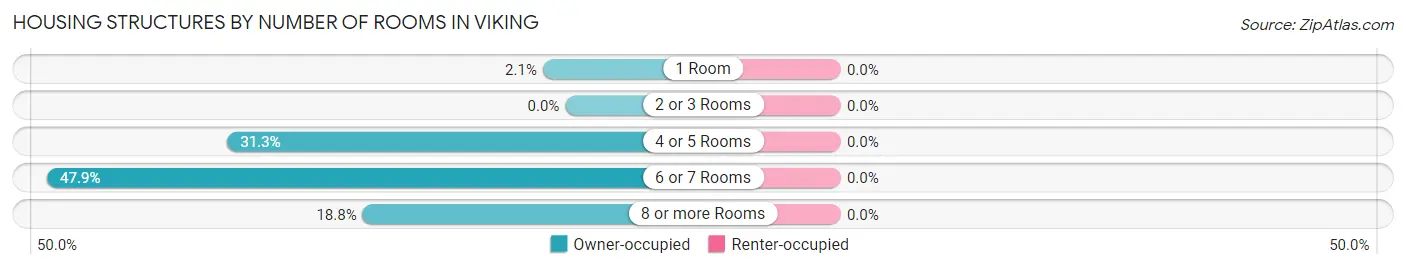
| Number of Rooms | Owner-occupied | Renter-occupied |
| 1 Room | 1 (2.1%) | 0 (0.0%) |
| 2 or 3 Rooms | 0 (0.0%) | 0 (0.0%) |
| 4 or 5 Rooms | 15 (31.2%) | 0 (0.0%) |
| 6 or 7 Rooms | 23 (47.9%) | 0 (0.0%) |
| 8 or more Rooms | 9 (18.8%) | 0 (0.0%) |
| Total | 48 (100.0%) | 0 (0.0%) |
Housing Structure by Heating Type in Viking
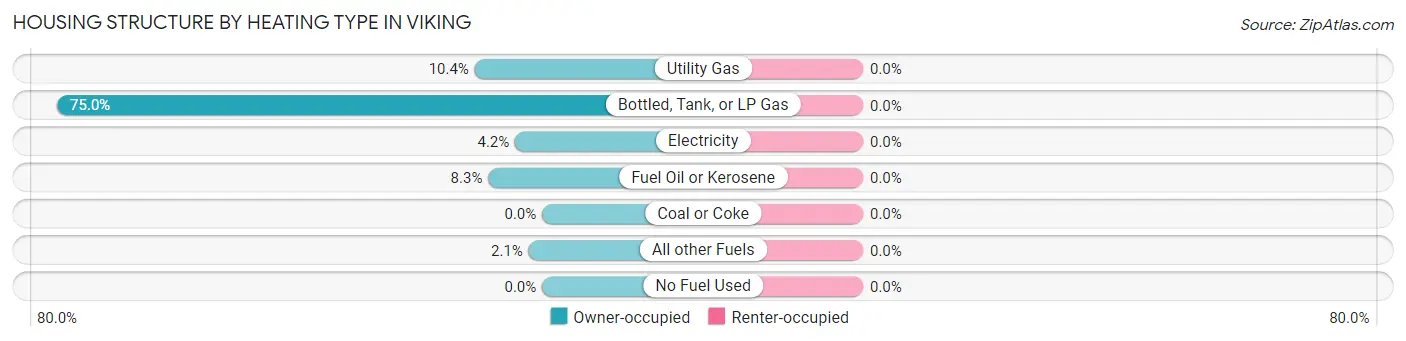
| Heating Type | Owner-occupied | Renter-occupied |
| Utility Gas | 5 (10.4%) | 0 (0.0%) |
| Bottled, Tank, or LP Gas | 36 (75.0%) | 0 (0.0%) |
| Electricity | 2 (4.2%) | 0 (0.0%) |
| Fuel Oil or Kerosene | 4 (8.3%) | 0 (0.0%) |
| Coal or Coke | 0 (0.0%) | 0 (0.0%) |
| All other Fuels | 1 (2.1%) | 0 (0.0%) |
| No Fuel Used | 0 (0.0%) | 0 (0.0%) |
| Total | 48 (100.0%) | 0 (0.0%) |
Household Vehicle Usage in Viking
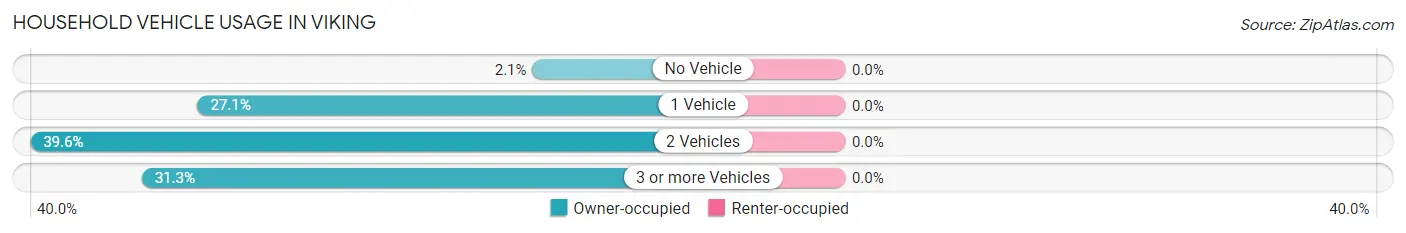
| Vehicles per Household | Owner-occupied | Renter-occupied |
| No Vehicle | 1 (2.1%) | 0 (0.0%) |
| 1 Vehicle | 13 (27.1%) | 0 (0.0%) |
| 2 Vehicles | 19 (39.6%) | 0 (0.0%) |
| 3 or more Vehicles | 15 (31.2%) | 0 (0.0%) |
| Total | 48 (100.0%) | 0 (0.0%) |
Real Estate & Mortgages in Viking
Real Estate and Mortgage Overview in Viking
| Characteristic | Without Mortgage | With Mortgage |
| Housing Units | 30 | 18 |
| Median Property Value | $105,000 | $143,800 |
| Median Household Income | $59,375 | $3 |
| Monthly Housing Costs | $489 | $0 |
| Real Estate Taxes | $700 | $0 |
Property Value by Mortgage Status in Viking
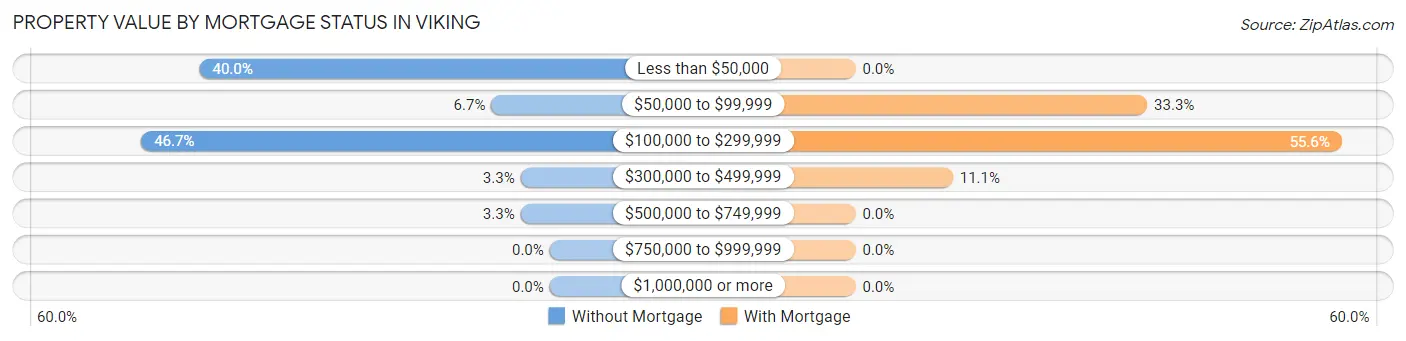
| Property Value | Without Mortgage | With Mortgage |
| Less than $50,000 | 12 (40.0%) | 0 (0.0%) |
| $50,000 to $99,999 | 2 (6.7%) | 6 (33.3%) |
| $100,000 to $299,999 | 14 (46.7%) | 10 (55.6%) |
| $300,000 to $499,999 | 1 (3.3%) | 2 (11.1%) |
| $500,000 to $749,999 | 1 (3.3%) | 0 (0.0%) |
| $750,000 to $999,999 | 0 (0.0%) | 0 (0.0%) |
| $1,000,000 or more | 0 (0.0%) | 0 (0.0%) |
| Total | 30 (100.0%) | 18 (100.0%) |
Household Income by Mortgage Status in Viking
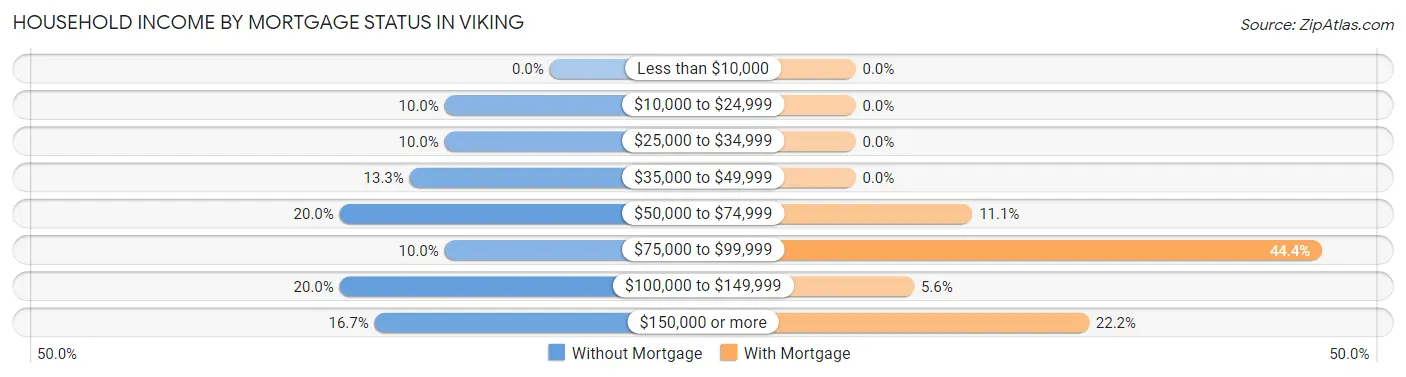
| Household Income | Without Mortgage | With Mortgage |
| Less than $10,000 | 0 (0.0%) | 0 (0.0%) |
| $10,000 to $24,999 | 3 (10.0%) | 0 (0.0%) |
| $25,000 to $34,999 | 3 (10.0%) | 0 (0.0%) |
| $35,000 to $49,999 | 4 (13.3%) | 0 (0.0%) |
| $50,000 to $74,999 | 6 (20.0%) | 2 (11.1%) |
| $75,000 to $99,999 | 3 (10.0%) | 8 (44.4%) |
| $100,000 to $149,999 | 6 (20.0%) | 1 (5.6%) |
| $150,000 or more | 5 (16.7%) | 4 (22.2%) |
| Total | 30 (100.0%) | 18 (100.0%) |
Property Value to Household Income Ratio in Viking
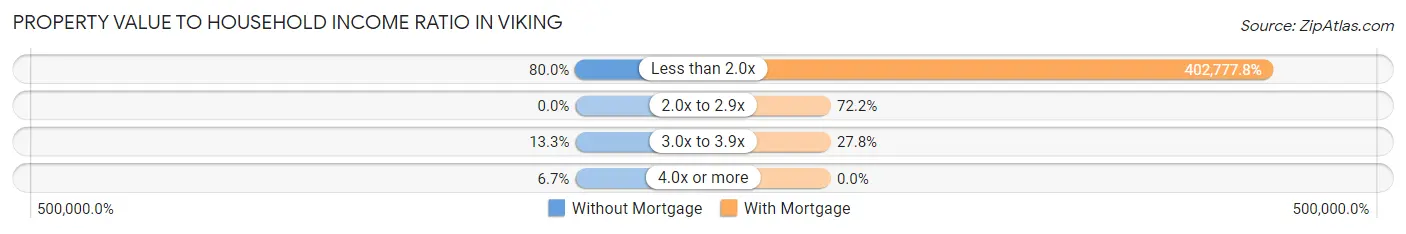
| Value-to-Income Ratio | Without Mortgage | With Mortgage |
| Less than 2.0x | 24 (80.0%) | 72,500 (402,777.8%) |
| 2.0x to 2.9x | 0 (0.0%) | 13 (72.2%) |
| 3.0x to 3.9x | 4 (13.3%) | 5 (27.8%) |
| 4.0x or more | 2 (6.7%) | 0 (0.0%) |
| Total | 30 (100.0%) | 18 (100.0%) |
Real Estate Taxes by Mortgage Status in Viking
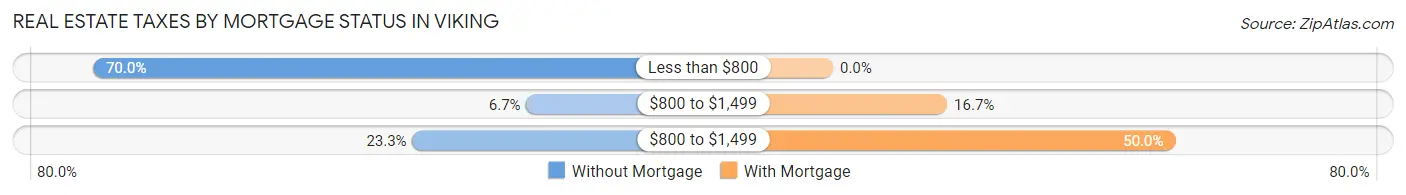
| Property Taxes | Without Mortgage | With Mortgage |
| Less than $800 | 21 (70.0%) | 0 (0.0%) |
| $800 to $1,499 | 2 (6.7%) | 3 (16.7%) |
| $800 to $1,499 | 7 (23.3%) | 9 (50.0%) |
| Total | 30 (100.0%) | 18 (100.0%) |
Health & Disability in Viking
Health Insurance Coverage by Age in Viking
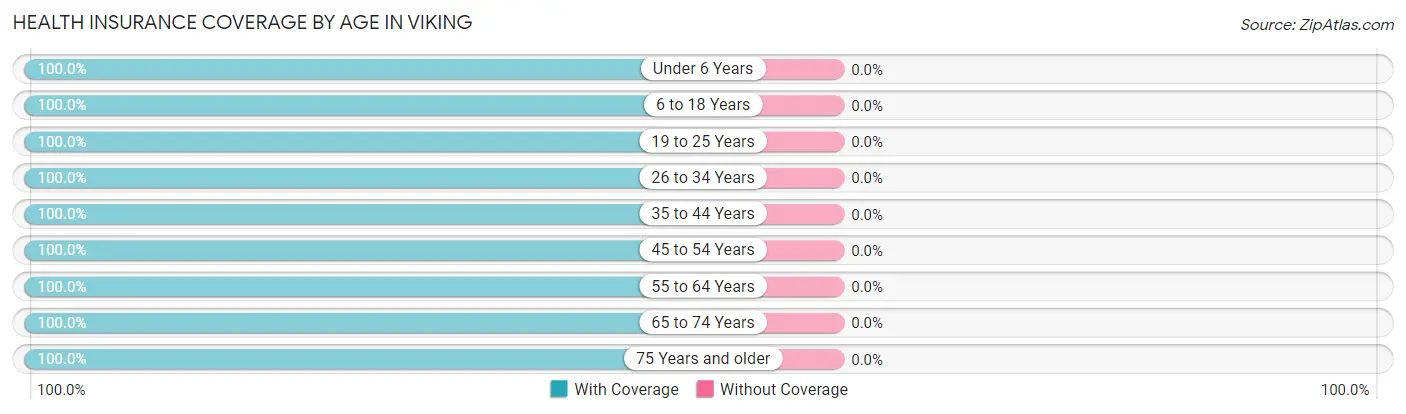
| Age Bracket | With Coverage | Without Coverage |
| Under 6 Years | 3 (100.0%) | 0 (0.0%) |
| 6 to 18 Years | 10 (100.0%) | 0 (0.0%) |
| 19 to 25 Years | 5 (100.0%) | 0 (0.0%) |
| 26 to 34 Years | 11 (100.0%) | 0 (0.0%) |
| 35 to 44 Years | 16 (100.0%) | 0 (0.0%) |
| 45 to 54 Years | 11 (100.0%) | 0 (0.0%) |
| 55 to 64 Years | 11 (100.0%) | 0 (0.0%) |
| 65 to 74 Years | 23 (100.0%) | 0 (0.0%) |
| 75 Years and older | 10 (100.0%) | 0 (0.0%) |
| Total | 100 (100.0%) | 0 (0.0%) |
Health Insurance Coverage by Citizenship Status in Viking
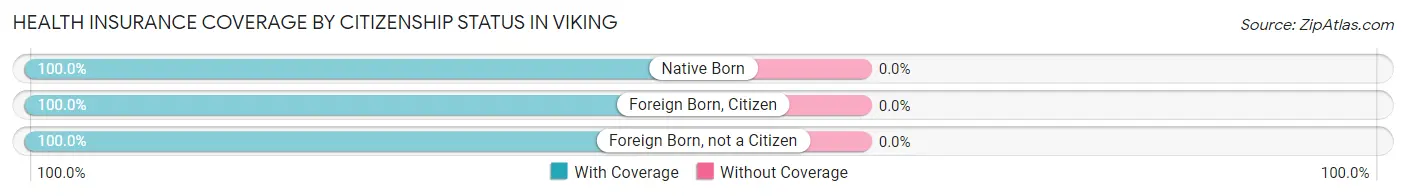
| Citizenship Status | With Coverage | Without Coverage |
| Native Born | 3 (100.0%) | 0 (0.0%) |
| Foreign Born, Citizen | 10 (100.0%) | 0 (0.0%) |
| Foreign Born, not a Citizen | 5 (100.0%) | 0 (0.0%) |
Health Insurance Coverage by Household Income in Viking
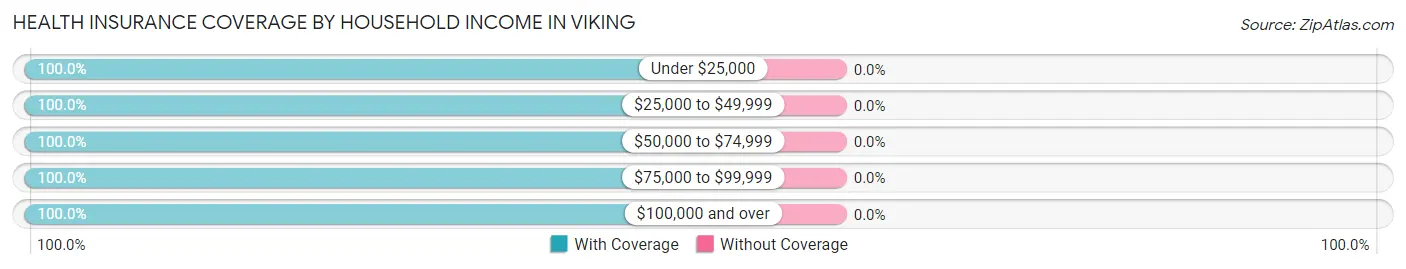
| Household Income | With Coverage | Without Coverage |
| Under $25,000 | 6 (100.0%) | 0 (0.0%) |
| $25,000 to $49,999 | 14 (100.0%) | 0 (0.0%) |
| $50,000 to $74,999 | 25 (100.0%) | 0 (0.0%) |
| $75,000 to $99,999 | 8 (100.0%) | 0 (0.0%) |
| $100,000 and over | 47 (100.0%) | 0 (0.0%) |
Public vs Private Health Insurance Coverage by Age in Viking
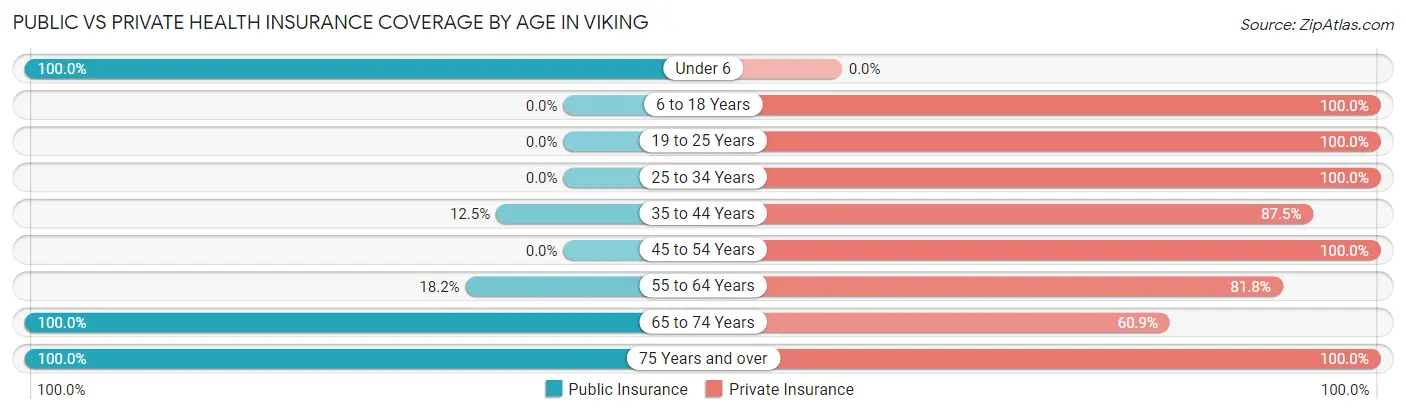
| Age Bracket | Public Insurance | Private Insurance |
| Under 6 | 3 (100.0%) | 0 (0.0%) |
| 6 to 18 Years | 0 (0.0%) | 10 (100.0%) |
| 19 to 25 Years | 0 (0.0%) | 5 (100.0%) |
| 25 to 34 Years | 0 (0.0%) | 11 (100.0%) |
| 35 to 44 Years | 2 (12.5%) | 14 (87.5%) |
| 45 to 54 Years | 0 (0.0%) | 11 (100.0%) |
| 55 to 64 Years | 2 (18.2%) | 9 (81.8%) |
| 65 to 74 Years | 23 (100.0%) | 14 (60.9%) |
| 75 Years and over | 10 (100.0%) | 10 (100.0%) |
| Total | 40 (40.0%) | 84 (84.0%) |
Disability Status by Sex by Age in Viking
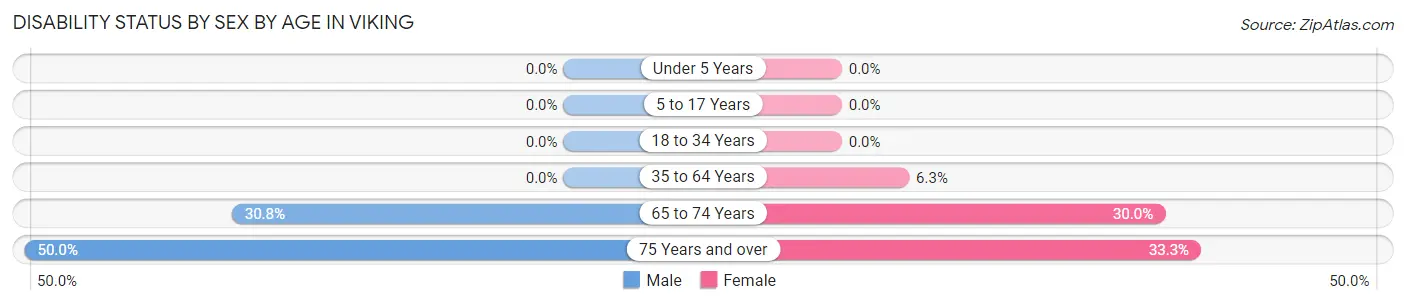
| Age Bracket | Male | Female |
| Under 5 Years | 0 (0.0%) | 0 (0.0%) |
| 5 to 17 Years | 0 (0.0%) | 0 (0.0%) |
| 18 to 34 Years | 0 (0.0%) | 0 (0.0%) |
| 35 to 64 Years | 0 (0.0%) | 1 (6.2%) |
| 65 to 74 Years | 4 (30.8%) | 3 (30.0%) |
| 75 Years and over | 2 (50.0%) | 2 (33.3%) |
Disability Class by Sex by Age in Viking
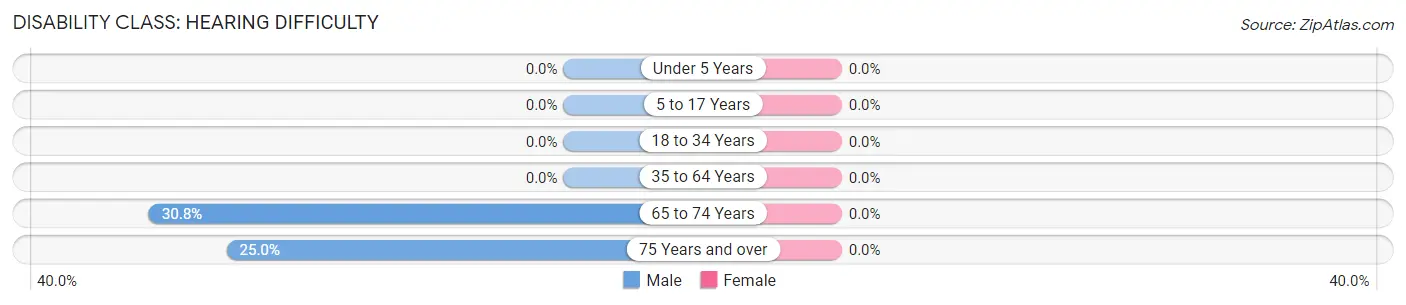
Disability Class: Hearing Difficulty
| Age Bracket | Male | Female |
| Under 5 Years | 0 (0.0%) | 0 (0.0%) |
| 5 to 17 Years | 0 (0.0%) | 0 (0.0%) |
| 18 to 34 Years | 0 (0.0%) | 0 (0.0%) |
| 35 to 64 Years | 0 (0.0%) | 0 (0.0%) |
| 65 to 74 Years | 4 (30.8%) | 0 (0.0%) |
| 75 Years and over | 1 (25.0%) | 0 (0.0%) |
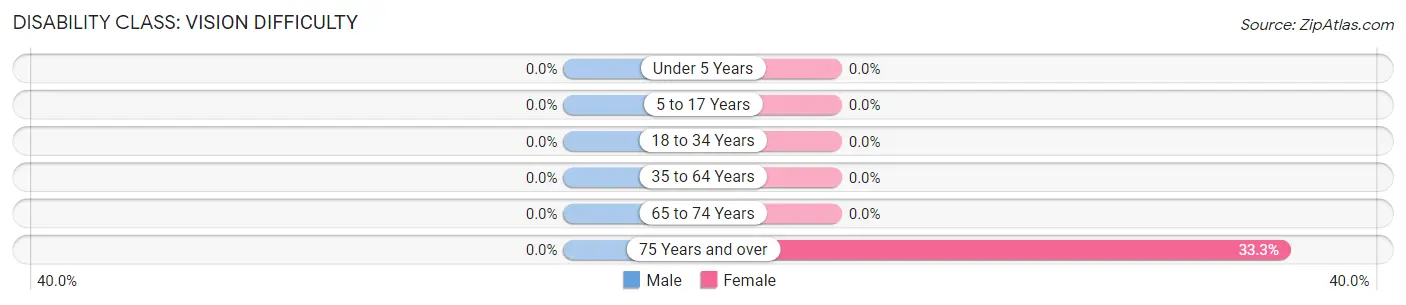
Disability Class: Vision Difficulty
| Age Bracket | Male | Female |
| Under 5 Years | 0 (0.0%) | 0 (0.0%) |
| 5 to 17 Years | 0 (0.0%) | 0 (0.0%) |
| 18 to 34 Years | 0 (0.0%) | 0 (0.0%) |
| 35 to 64 Years | 0 (0.0%) | 0 (0.0%) |
| 65 to 74 Years | 0 (0.0%) | 0 (0.0%) |
| 75 Years and over | 0 (0.0%) | 2 (33.3%) |
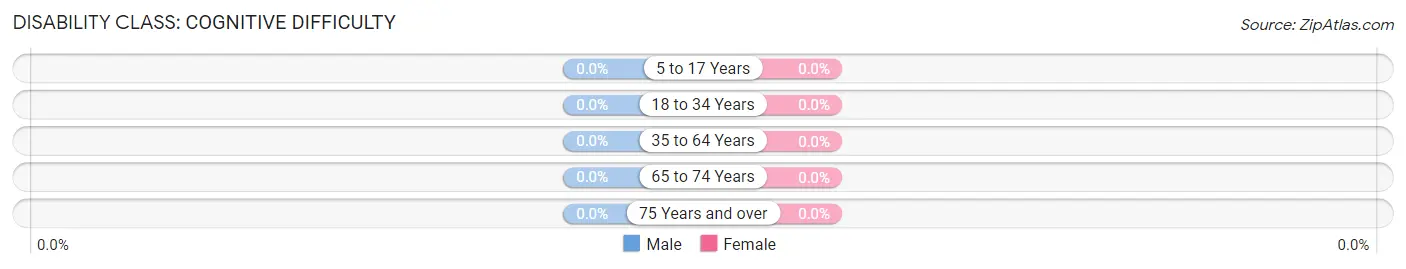
Disability Class: Cognitive Difficulty
| Age Bracket | Male | Female |
| 5 to 17 Years | 0 (0.0%) | 0 (0.0%) |
| 18 to 34 Years | 0 (0.0%) | 0 (0.0%) |
| 35 to 64 Years | 0 (0.0%) | 0 (0.0%) |
| 65 to 74 Years | 0 (0.0%) | 0 (0.0%) |
| 75 Years and over | 0 (0.0%) | 0 (0.0%) |
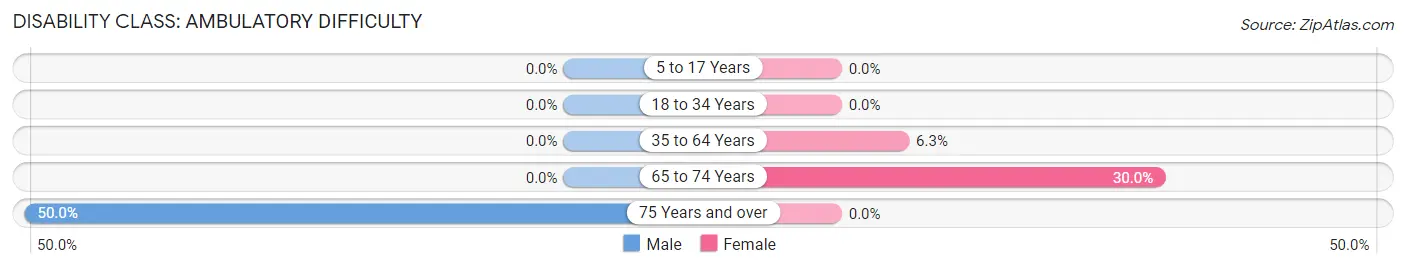
Disability Class: Ambulatory Difficulty
| Age Bracket | Male | Female |
| 5 to 17 Years | 0 (0.0%) | 0 (0.0%) |
| 18 to 34 Years | 0 (0.0%) | 0 (0.0%) |
| 35 to 64 Years | 0 (0.0%) | 1 (6.2%) |
| 65 to 74 Years | 0 (0.0%) | 3 (30.0%) |
| 75 Years and over | 2 (50.0%) | 0 (0.0%) |
Disability Class: Self-Care Difficulty
| Age Bracket | Male | Female |
| 5 to 17 Years | 0 (0.0%) | 0 (0.0%) |
| 18 to 34 Years | 0 (0.0%) | 0 (0.0%) |
| 35 to 64 Years | 0 (0.0%) | 0 (0.0%) |
| 65 to 74 Years | 0 (0.0%) | 0 (0.0%) |
| 75 Years and over | 1 (25.0%) | 0 (0.0%) |
Technology Access in Viking
Computing Device Access in Viking
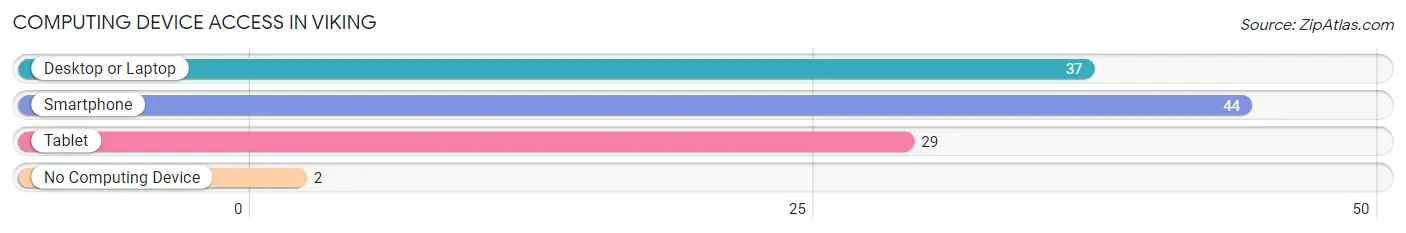
| Device Type | # Households | % Households |
| Desktop or Laptop | 37 | 77.1% |
| Smartphone | 44 | 91.7% |
| Tablet | 29 | 60.4% |
| No Computing Device | 2 | 4.2% |
| Total | 48 | 100.0% |
Internet Access in Viking
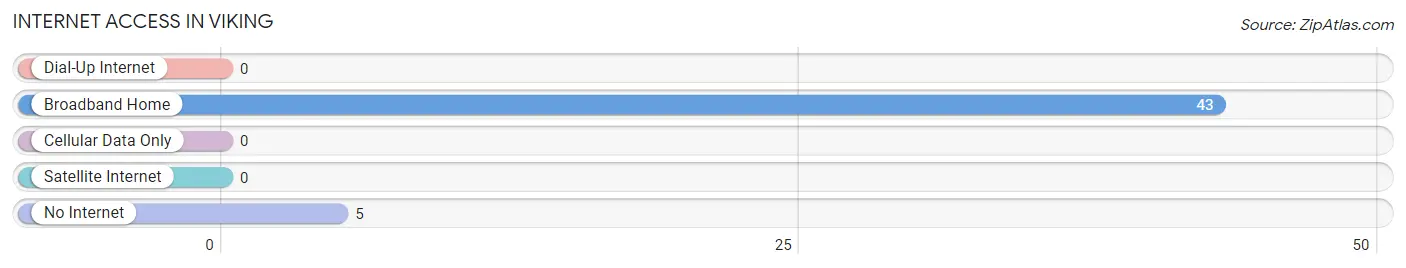
| Internet Type | # Households | % Households |
| Dial-Up Internet | 0 | 0.0% |
| Broadband Home | 43 | 89.6% |
| Cellular Data Only | 0 | 0.0% |
| Satellite Internet | 0 | 0.0% |
| No Internet | 5 | 10.4% |
| Total | 48 | 100.0% |
Viking Summary
Viking, Minnesota is a small city located in the northwestern corner of Minnesota, in Marshall County. It is situated on the Red River of the North, and is part of the Grand Forks, ND-MN Metropolitan Statistical Area. The city has a population of 1,845 people, according to the 2010 census.
History
Viking was founded in 1882 by Norwegian immigrants who were looking for a place to settle and farm. The city was named after the Norse god, Odin, who was known as the “Viking”. The city was incorporated in 1887 and was the first city in Marshall County.
The city was originally a farming community, but in the early 1900s, the city began to diversify its economy. The first industry to come to Viking was a flour mill, which was built in 1906. This was followed by a creamery, a lumber mill, and a brickyard.
In the 1950s, Viking began to experience a population boom, as many people moved to the city from other parts of the state. This growth was largely due to the city’s proximity to the Red River of the North, which provided a convenient transportation route for goods and services.
Geography
Viking is located in the northwestern corner of Minnesota, in Marshall County. It is situated on the Red River of the North, and is part of the Grand Forks, ND-MN Metropolitan Statistical Area. The city has a total area of 1.2 square miles, all of which is land.
The city is located in a flat, open area, with no major hills or mountains. The terrain is mostly flat, with some rolling hills in the area. The city is located in a temperate climate, with cold winters and warm summers.
Economy
Viking’s economy is largely based on agriculture and manufacturing. The city is home to several large agricultural operations, including a dairy farm, a grain elevator, and a feed mill. The city also has several manufacturing companies, including a furniture factory, a plastics factory, and a metal fabrication plant.
The city also has a vibrant retail sector, with several stores and restaurants located in the downtown area. The city is also home to several small businesses, including a hardware store, a grocery store, and a pharmacy.
Demographics
As of the 2010 census, Viking had a population of 1,845 people. The racial makeup of the city was 97.2% White, 0.7% African American, 0.3% Native American, 0.2% Asian, 0.1% Pacific Islander, 0.4% from other races, and 1.1% from two or more races. Hispanic or Latino of any race were 1.2% of the population.
The median income for a household in the city was $37,917, and the median income for a family was $45,938. The per capita income for the city was $18,945. About 8.2% of families and 10.2% of the population were below the poverty line, including 14.2% of those under age 18 and 8.3% of those age 65 or over.
Common Questions
What is Per Capita Income in Viking?
Per Capita income in Viking is $44,973.
What is the Median Family Income in Viking?
Median Family Income in Viking is $88,750.
What is the Median Household income in Viking?
Median Household Income in Viking is $72,000.
What is Income or Wage Gap in Viking?
Income or Wage Gap in Viking is 46.7%.
Women in Viking earn 53.3 cents for every dollar earned by a man.
What is Inequality or Gini Index in Viking?
Inequality or Gini Index in Viking is 0.33.
What is the Total Population of Viking?
Total Population of Viking is 100.
What is the Total Male Population of Viking?
Total Male Population of Viking is 58.
What is the Total Female Population of Viking?
Total Female Population of Viking is 42.
What is the Ratio of Males per 100 Females in Viking?
There are 138.10 Males per 100 Females in Viking.
What is the Ratio of Females per 100 Males in Viking?
There are 72.41 Females per 100 Males in Viking.
What is the Median Population Age in Viking?
Median Population Age in Viking is 49.5 Years.
What is the Average Family Size in Viking
Average Family Size in Viking is 2.3 People.
What is the Average Household Size in Viking
Average Household Size in Viking is 2.1 People.
How Large is the Labor Force in Viking?
There are 47 People in the Labor Forcein in Viking.
What is the Percentage of People in the Labor Force in Viking?
52.8% of People are in the Labor Force in Viking.