Zip Codes with the Highest Percentage of Population with a Degree in Liberal Arts and History in Minnesota
RELATED REPORTS & OPTIONS
Liberal Arts and History
Minnesota
Compare Zip Codes
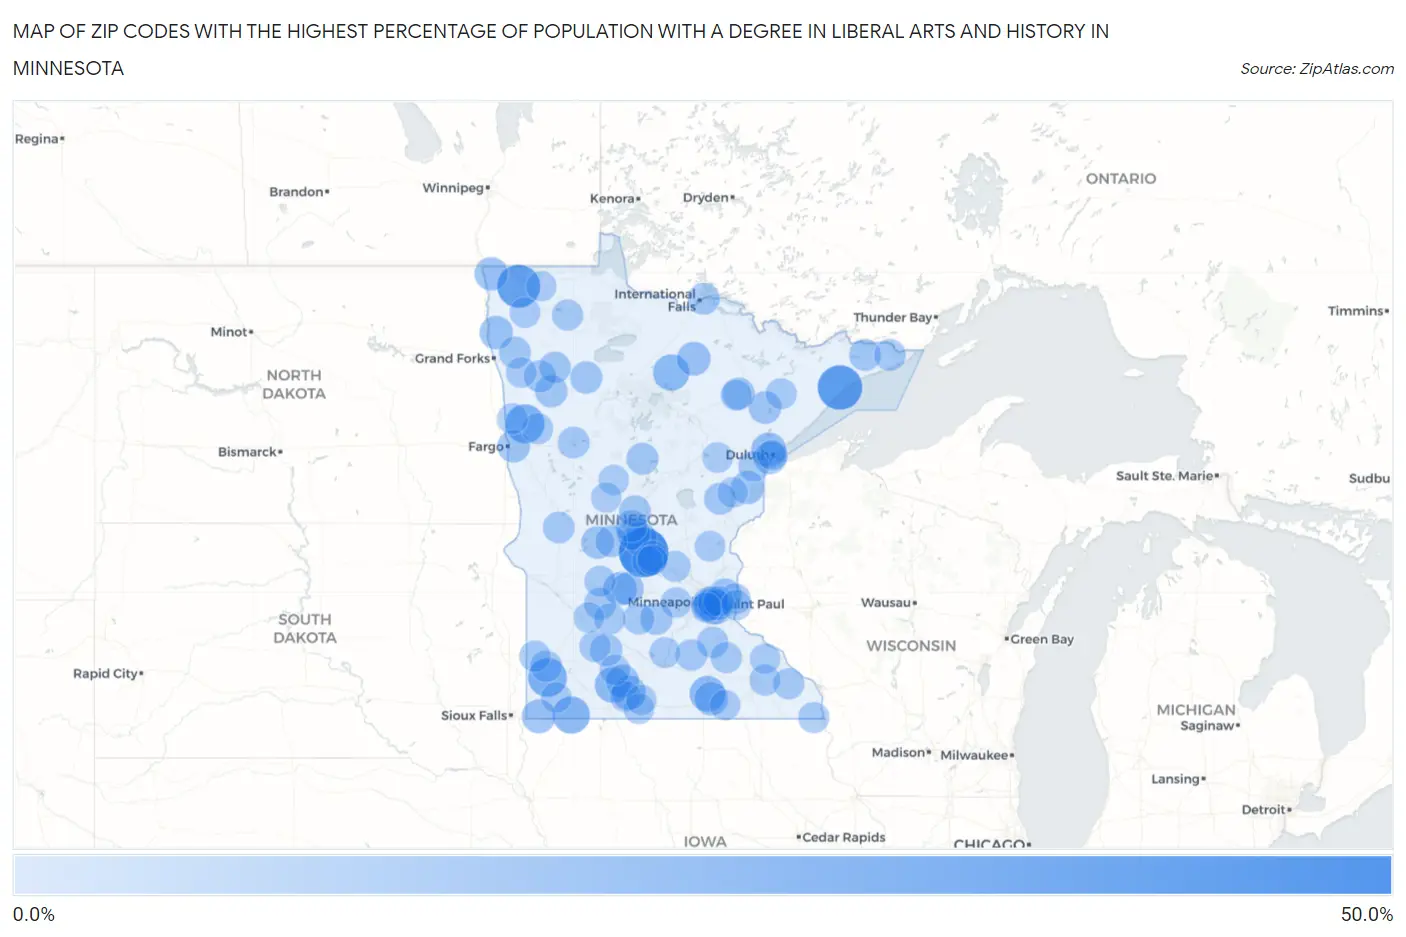
Map of Zip Codes with the Highest Percentage of Population with a Degree in Liberal Arts and History in Minnesota
0.0%
50.0%
Zip Codes with the Highest Percentage of Population with a Degree in Liberal Arts and History in Minnesota
| Zip Code | % Graduates | vs State | vs National | |
| 1. | 56321 | 42.9% | 4.4%(+38.6)#1 | 4.9%(+38.1)#219 |
| 2. | 55613 | 33.3% | 4.4%(+29.0)#2 | 4.9%(+28.5)#352 |
| 3. | 56734 | 30.3% | 4.4%(+26.0)#3 | 4.9%(+25.5)#412 |
| 4. | 56519 | 22.7% | 4.4%(+18.3)#4 | 4.9%(+17.9)#695 |
| 5. | 56186 | 22.5% | 4.4%(+18.1)#5 | 4.9%(+17.6)#709 |
| 6. | 56117 | 19.6% | 4.4%(+15.2)#6 | 4.9%(+14.7)#894 |
| 7. | 56688 | 17.4% | 4.4%(+13.0)#7 | 4.9%(+12.5)#1,093 |
| 8. | 56035 | 16.7% | 4.4%(+12.3)#8 | 4.9%(+11.8)#1,163 |
| 9. | 56159 | 16.1% | 4.4%(+11.7)#9 | 4.9%(+11.2)#1,251 |
| 10. | 55814 | 15.0% | 4.4%(+10.6)#10 | 4.9%(+10.1)#1,423 |
| 11. | 56162 | 13.8% | 4.4%(+9.42)#11 | 4.9%(+8.92)#1,691 |
| 12. | 56173 | 13.3% | 4.4%(+8.96)#12 | 4.9%(+8.46)#1,818 |
| 13. | 56340 | 13.2% | 4.4%(+8.81)#13 | 4.9%(+8.32)#1,852 |
| 14. | 56639 | 13.0% | 4.4%(+8.67)#14 | 4.9%(+8.17)#1,901 |
| 15. | 56045 | 12.8% | 4.4%(+8.39)#15 | 4.9%(+7.89)#1,967 |
| 16. | 56710 | 12.5% | 4.4%(+8.12)#16 | 4.9%(+7.63)#2,048 |
| 17. | 56731 | 12.5% | 4.4%(+8.12)#17 | 4.9%(+7.63)#2,056 |
| 18. | 56209 | 12.4% | 4.4%(+8.03)#18 | 4.9%(+7.54)#2,075 |
| 19. | 56120 | 12.3% | 4.4%(+7.90)#19 | 4.9%(+7.41)#2,111 |
| 20. | 55756 | 12.1% | 4.4%(+7.74)#20 | 4.9%(+7.25)#2,172 |
| 21. | 55807 | 11.9% | 4.4%(+7.54)#21 | 4.9%(+7.05)#2,228 |
| 22. | 55090 | 11.9% | 4.4%(+7.53)#22 | 4.9%(+7.03)#2,237 |
| 23. | 56384 | 11.8% | 4.4%(+7.39)#23 | 4.9%(+6.89)#2,276 |
| 24. | 55763 | 11.2% | 4.4%(+6.83)#24 | 4.9%(+6.33)#2,474 |
| 25. | 56385 | 10.9% | 4.4%(+6.57)#25 | 4.9%(+6.08)#2,587 |
| 26. | 56529 | 10.9% | 4.4%(+6.52)#26 | 4.9%(+6.03)#2,604 |
| 27. | 56243 | 10.8% | 4.4%(+6.42)#27 | 4.9%(+5.93)#2,646 |
| 28. | 55336 | 10.8% | 4.4%(+6.42)#28 | 4.9%(+5.92)#2,648 |
| 29. | 56592 | 10.7% | 4.4%(+6.29)#29 | 4.9%(+5.79)#2,722 |
| 30. | 56224 | 10.5% | 4.4%(+6.15)#30 | 4.9%(+5.65)#2,806 |
| 31. | 55758 | 10.5% | 4.4%(+6.15)#31 | 4.9%(+5.65)#2,809 |
| 32. | 56634 | 10.2% | 4.4%(+5.86)#32 | 4.9%(+5.37)#2,976 |
| 33. | 56736 | 10.2% | 4.4%(+5.78)#33 | 4.9%(+5.28)#3,024 |
| 34. | 56668 | 10.0% | 4.4%(+5.62)#34 | 4.9%(+5.13)#3,122 |
| 35. | 56382 | 9.9% | 4.4%(+5.50)#35 | 4.9%(+5.00)#3,179 |
| 36. | 56474 | 9.8% | 4.4%(+5.46)#36 | 4.9%(+4.96)#3,216 |
| 37. | 55735 | 9.7% | 4.4%(+5.31)#37 | 4.9%(+4.82)#3,309 |
| 38. | 55604 | 9.5% | 4.4%(+5.16)#38 | 4.9%(+4.67)#3,422 |
| 39. | 56722 | 9.5% | 4.4%(+5.15)#39 | 4.9%(+4.65)#3,437 |
| 40. | 56715 | 9.5% | 4.4%(+5.15)#40 | 4.9%(+4.65)#3,438 |
| 41. | 56281 | 9.5% | 4.4%(+5.11)#41 | 4.9%(+4.62)#3,463 |
| 42. | 56378 | 9.5% | 4.4%(+5.09)#42 | 4.9%(+4.59)#3,483 |
| 43. | 56475 | 9.5% | 4.4%(+5.08)#43 | 4.9%(+4.59)#3,486 |
| 44. | 55409 | 9.5% | 4.4%(+5.08)#44 | 4.9%(+4.58)#3,492 |
| 45. | 56578 | 9.3% | 4.4%(+4.96)#45 | 4.9%(+4.47)#3,567 |
| 46. | 55104 | 9.3% | 4.4%(+4.95)#46 | 4.9%(+4.45)#3,581 |
| 47. | 55606 | 9.3% | 4.4%(+4.90)#47 | 4.9%(+4.41)#3,624 |
| 48. | 56311 | 9.2% | 4.4%(+4.83)#48 | 4.9%(+4.34)#3,674 |
| 49. | 56052 | 9.1% | 4.4%(+4.71)#49 | 4.9%(+4.22)#3,768 |
| 50. | 55057 | 9.0% | 4.4%(+4.61)#50 | 4.9%(+4.12)#3,873 |
| 51. | 56170 | 8.9% | 4.4%(+4.55)#51 | 4.9%(+4.06)#3,915 |
| 52. | 55385 | 8.8% | 4.4%(+4.47)#52 | 4.9%(+3.98)#3,983 |
| 53. | 55118 | 8.7% | 4.4%(+4.35)#53 | 4.9%(+3.86)#4,097 |
| 54. | 55150 | 8.7% | 4.4%(+4.32)#54 | 4.9%(+3.82)#4,138 |
| 55. | 56149 | 8.7% | 4.4%(+4.29)#55 | 4.9%(+3.80)#4,150 |
| 56. | 56293 | 8.5% | 4.4%(+4.15)#56 | 4.9%(+3.66)#4,305 |
| 57. | 55946 | 8.5% | 4.4%(+4.09)#57 | 4.9%(+3.59)#4,370 |
| 58. | 56585 | 8.5% | 4.4%(+4.08)#58 | 4.9%(+3.59)#4,373 |
| 59. | 55952 | 8.4% | 4.4%(+4.05)#59 | 4.9%(+3.55)#4,410 |
| 60. | 56277 | 8.4% | 4.4%(+4.04)#60 | 4.9%(+3.54)#4,426 |
| 61. | 56724 | 8.3% | 4.4%(+3.96)#61 | 4.9%(+3.46)#4,529 |
| 62. | 55105 | 8.2% | 4.4%(+3.85)#62 | 4.9%(+3.35)#4,629 |
| 63. | 55713 | 8.2% | 4.4%(+3.83)#63 | 4.9%(+3.34)#4,650 |
| 64. | 55308 | 8.1% | 4.4%(+3.77)#64 | 4.9%(+3.27)#4,728 |
| 65. | 55404 | 8.1% | 4.4%(+3.75)#65 | 4.9%(+3.26)#4,745 |
| 66. | 56279 | 8.1% | 4.4%(+3.75)#66 | 4.9%(+3.25)#4,753 |
| 67. | 55934 | 8.1% | 4.4%(+3.74)#67 | 4.9%(+3.24)#4,761 |
| 68. | 55931 | 8.1% | 4.4%(+3.73)#68 | 4.9%(+3.24)#4,772 |
| 69. | 55003 | 8.0% | 4.4%(+3.61)#69 | 4.9%(+3.12)#4,911 |
| 70. | 55750 | 8.0% | 4.4%(+3.60)#70 | 4.9%(+3.11)#4,918 |
| 71. | 56387 | 7.9% | 4.4%(+3.52)#71 | 4.9%(+3.02)#5,039 |
| 72. | 55407 | 7.8% | 4.4%(+3.44)#72 | 4.9%(+2.95)#5,144 |
| 73. | 56082 | 7.7% | 4.4%(+3.34)#73 | 4.9%(+2.84)#5,279 |
| 74. | 56574 | 7.7% | 4.4%(+3.31)#74 | 4.9%(+2.82)#5,326 |
| 75. | 55718 | 7.5% | 4.4%(+3.17)#75 | 4.9%(+2.68)#5,516 |
| 76. | 56155 | 7.5% | 4.4%(+3.17)#76 | 4.9%(+2.68)#5,522 |
| 77. | 55080 | 7.5% | 4.4%(+3.16)#77 | 4.9%(+2.66)#5,538 |
| 78. | 55388 | 7.5% | 4.4%(+3.14)#78 | 4.9%(+2.64)#5,564 |
| 79. | 56176 | 7.5% | 4.4%(+3.14)#79 | 4.9%(+2.64)#5,565 |
| 80. | 56758 | 7.5% | 4.4%(+3.12)#80 | 4.9%(+2.63)#5,593 |
| 81. | 56031 | 7.5% | 4.4%(+3.10)#81 | 4.9%(+2.61)#5,615 |
| 82. | 56716 | 7.5% | 4.4%(+3.10)#82 | 4.9%(+2.60)#5,620 |
| 83. | 56369 | 7.5% | 4.4%(+3.09)#83 | 4.9%(+2.59)#5,642 |
| 84. | 56019 | 7.4% | 4.4%(+3.03)#84 | 4.9%(+2.54)#5,728 |
| 85. | 55787 | 7.4% | 4.4%(+2.98)#85 | 4.9%(+2.48)#5,796 |
| 86. | 56285 | 7.2% | 4.4%(+2.87)#86 | 4.9%(+2.37)#5,972 |
| 87. | 55107 | 7.2% | 4.4%(+2.85)#87 | 4.9%(+2.36)#6,004 |
| 88. | 55912 | 7.2% | 4.4%(+2.85)#88 | 4.9%(+2.35)#6,007 |
| 89. | 56075 | 7.1% | 4.4%(+2.77)#89 | 4.9%(+2.27)#6,176 |
| 90. | 56481 | 7.1% | 4.4%(+2.74)#90 | 4.9%(+2.25)#6,209 |
| 91. | 55795 | 7.1% | 4.4%(+2.69)#91 | 4.9%(+2.19)#6,284 |
| 92. | 55108 | 7.0% | 4.4%(+2.63)#92 | 4.9%(+2.13)#6,375 |
| 93. | 56726 | 7.0% | 4.4%(+2.59)#93 | 4.9%(+2.09)#6,449 |
| 94. | 55130 | 7.0% | 4.4%(+2.59)#94 | 4.9%(+2.09)#6,452 |
| 95. | 55806 | 6.9% | 4.4%(+2.57)#95 | 4.9%(+2.07)#6,475 |
| 96. | 56301 | 6.9% | 4.4%(+2.57)#96 | 4.9%(+2.07)#6,476 |
| 97. | 55957 | 6.9% | 4.4%(+2.57)#97 | 4.9%(+2.07)#6,485 |
| 98. | 55043 | 6.9% | 4.4%(+2.53)#98 | 4.9%(+2.04)#6,533 |
| 99. | 56437 | 6.8% | 4.4%(+2.45)#99 | 4.9%(+1.96)#6,671 |
| 100. | 55419 | 6.8% | 4.4%(+2.45)#100 | 4.9%(+1.95)#6,685 |
Common Questions
What are the Top 10 Zip Codes with the Highest Percentage of Population with a Degree in Liberal Arts and History in Minnesota?
Top 10 Zip Codes with the Highest Percentage of Population with a Degree in Liberal Arts and History in Minnesota are:
What zip code has the Highest Percentage of Population with a Degree in Liberal Arts and History in Minnesota?
56321 has the Highest Percentage of Population with a Degree in Liberal Arts and History in Minnesota with 42.9%.
What is the Percentage of Population with a Degree in Liberal Arts and History in the State of Minnesota?
Percentage of Population with a Degree in Liberal Arts and History in Minnesota is 4.4%.
What is the Percentage of Population with a Degree in Liberal Arts and History in the United States?
Percentage of Population with a Degree in Liberal Arts and History in the United States is 4.9%.