Dennison, MN Map & Demographics
Dennison Map
Dennison Overview
$28,891
PER CAPITA INCOME
$66,875
AVG FAMILY INCOME
$42,750
AVG HOUSEHOLD INCOME
15.6%
WAGE / INCOME GAP [ % ]
84.4¢/ $1
WAGE / INCOME GAP [ $ ]
0.41
INEQUALITY / GINI INDEX
216
TOTAL POPULATION
115
MALE POPULATION
101
FEMALE POPULATION
113.86
MALES / 100 FEMALES
87.83
FEMALES / 100 MALES
37.0
MEDIAN AGE
3.0
AVG FAMILY SIZE
2.3
AVG HOUSEHOLD SIZE
107
LABOR FORCE [ PEOPLE ]
62.9%
PERCENT IN LABOR FORCE
3.9%
UNEMPLOYMENT RATE
Dennison Zip Codes
Dennison Area Codes
Income in Dennison
Income Overview in Dennison
Per Capita Income in Dennison is $28,891, while median incomes of families and households are $66,875 and $42,750 respectively.
| Characteristic | Number | Measure |
| Per Capita Income | 216 | $28,891 |
| Median Family Income | 53 | $66,875 |
| Mean Family Income | 53 | $82,317 |
| Median Household Income | 95 | $42,750 |
| Mean Household Income | 95 | $64,294 |
| Income Deficit | 53 | $0 |
| Wage / Income Gap (%) | 216 | 15.58% |
| Wage / Income Gap ($) | 216 | 84.42¢ per $1 |
| Gini / Inequality Index | 216 | 0.41 |
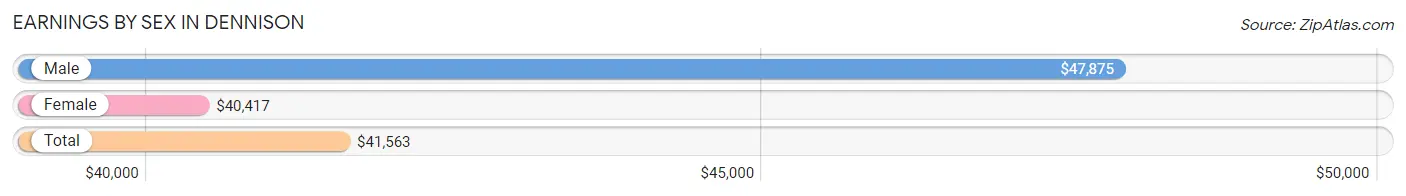
Earnings by Sex in Dennison
Average Earnings in Dennison are $41,563, $47,875 for men and $40,417 for women, a difference of 15.6%.
| Sex | Number | Average Earnings |
| Male | 53 (47.7%) | $47,875 |
| Female | 58 (52.2%) | $40,417 |
| Total | 111 (100.0%) | $41,563 |
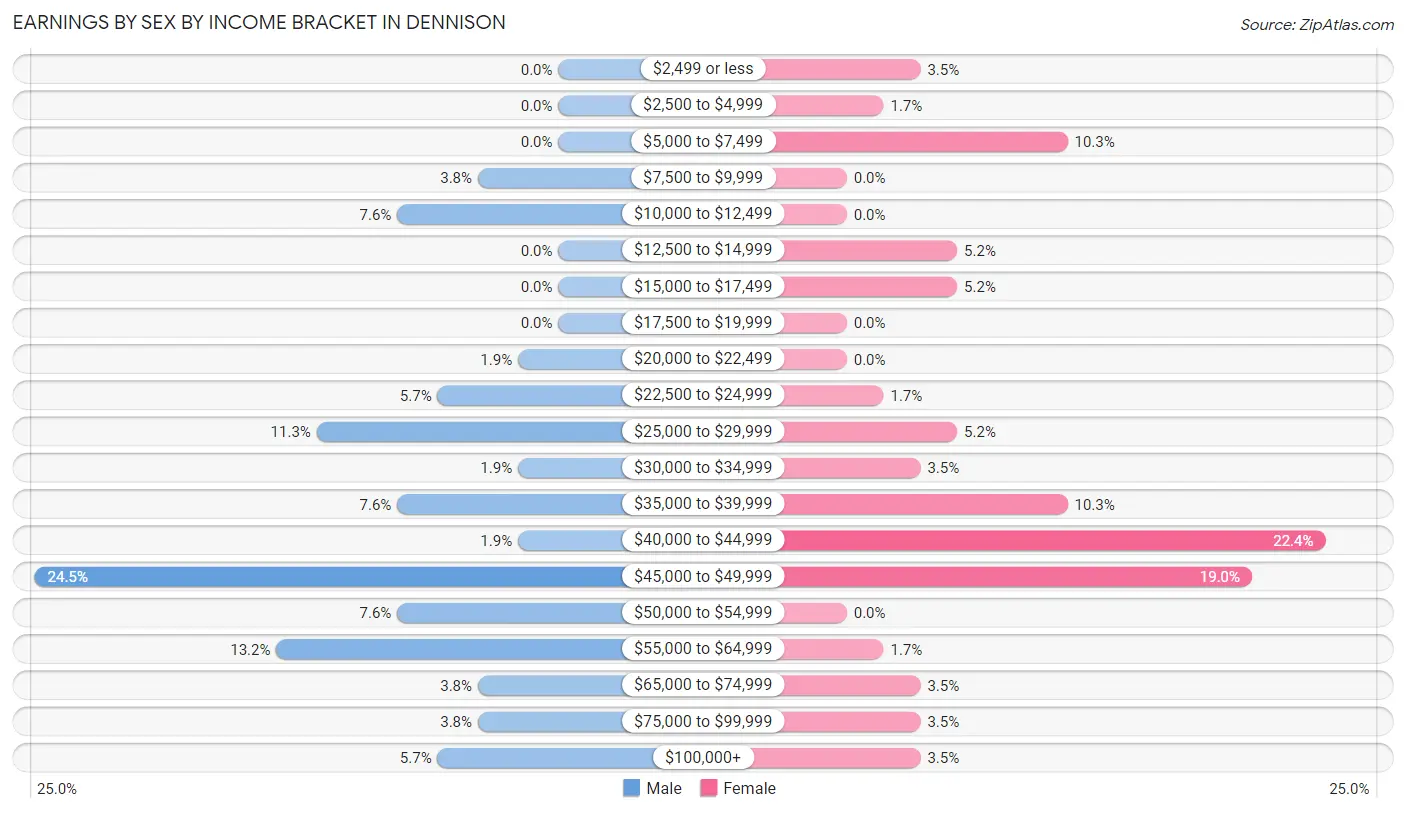
Earnings by Sex by Income Bracket in Dennison
The most common earnings brackets in Dennison are $45,000 to $49,999 for men (13 | 24.5%) and $40,000 to $44,999 for women (13 | 22.4%).
| Income | Male | Female |
| $2,499 or less | 0 (0.0%) | 2 (3.5%) |
| $2,500 to $4,999 | 0 (0.0%) | 1 (1.7%) |
| $5,000 to $7,499 | 0 (0.0%) | 6 (10.3%) |
| $7,500 to $9,999 | 2 (3.8%) | 0 (0.0%) |
| $10,000 to $12,499 | 4 (7.5%) | 0 (0.0%) |
| $12,500 to $14,999 | 0 (0.0%) | 3 (5.2%) |
| $15,000 to $17,499 | 0 (0.0%) | 3 (5.2%) |
| $17,500 to $19,999 | 0 (0.0%) | 0 (0.0%) |
| $20,000 to $22,499 | 1 (1.9%) | 0 (0.0%) |
| $22,500 to $24,999 | 3 (5.7%) | 1 (1.7%) |
| $25,000 to $29,999 | 6 (11.3%) | 3 (5.2%) |
| $30,000 to $34,999 | 1 (1.9%) | 2 (3.5%) |
| $35,000 to $39,999 | 4 (7.5%) | 6 (10.3%) |
| $40,000 to $44,999 | 1 (1.9%) | 13 (22.4%) |
| $45,000 to $49,999 | 13 (24.5%) | 11 (19.0%) |
| $50,000 to $54,999 | 4 (7.5%) | 0 (0.0%) |
| $55,000 to $64,999 | 7 (13.2%) | 1 (1.7%) |
| $65,000 to $74,999 | 2 (3.8%) | 2 (3.5%) |
| $75,000 to $99,999 | 2 (3.8%) | 2 (3.5%) |
| $100,000+ | 3 (5.7%) | 2 (3.5%) |
| Total | 53 (100.0%) | 58 (100.0%) |
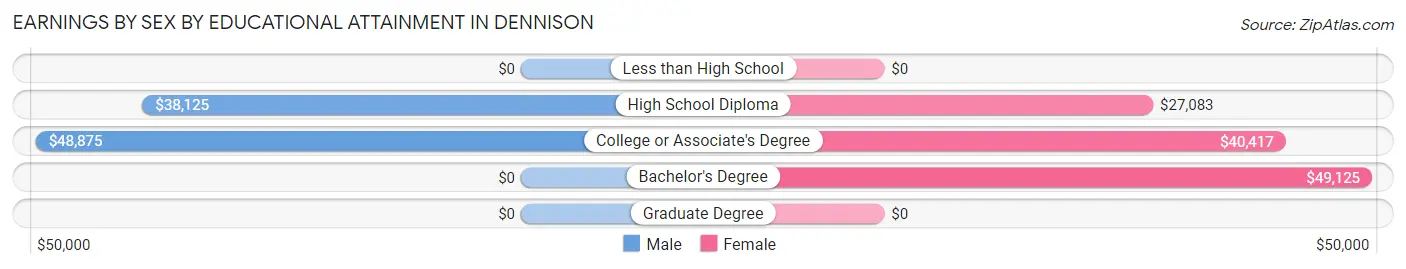
Earnings by Sex by Educational Attainment in Dennison
Average earnings in Dennison are $47,875 for men and $41,354 for women, a difference of 13.6%. Men with an educational attainment of college or associate's degree enjoy the highest average annual earnings of $48,875, while those with high school diploma education earn the least with $38,125. Women with an educational attainment of bachelor's degree earn the most with the average annual earnings of $49,125, while those with high school diploma education have the smallest earnings of $27,083.
| Educational Attainment | Male Income | Female Income |
| Less than High School | - | - |
| High School Diploma | $38,125 | $27,083 |
| College or Associate's Degree | $48,875 | $40,417 |
| Bachelor's Degree | - | - |
| Graduate Degree | - | - |
| Total | $47,875 | $41,354 |
Family Income in Dennison
Family Income Brackets in Dennison
According to the Dennison family income data, there are 17 families falling into the $35,000 to $49,999 income range, which is the most common income bracket and makes up 32.1% of all families.
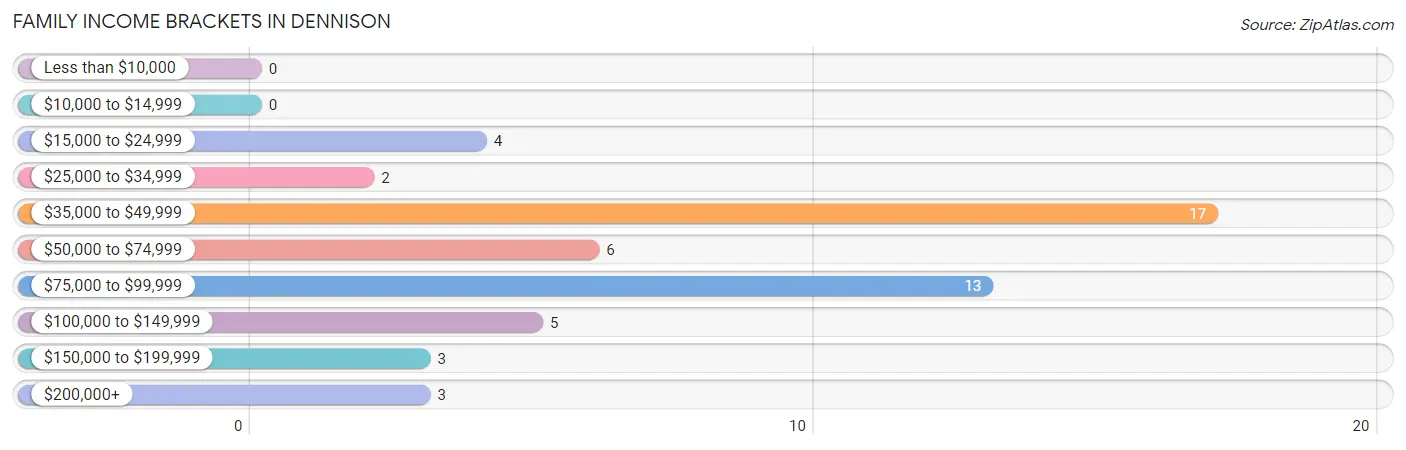
| Income Bracket | # Families | % Families |
| Less than $10,000 | 0 | 0.0% |
| $10,000 to $14,999 | 0 | 0.0% |
| $15,000 to $24,999 | 4 | 7.5% |
| $25,000 to $34,999 | 2 | 3.8% |
| $35,000 to $49,999 | 17 | 32.1% |
| $50,000 to $74,999 | 6 | 11.3% |
| $75,000 to $99,999 | 13 | 24.5% |
| $100,000 to $149,999 | 5 | 9.4% |
| $150,000 to $199,999 | 3 | 5.7% |
| $200,000+ | 3 | 5.7% |
Family Income by Famaliy Size in Dennison
2-person families (32 | 60.4%) account for the highest median family income in Dennison with $95,227 per family, while 2-person families (32 | 60.4%) have the highest median income of $47,614 per family member.
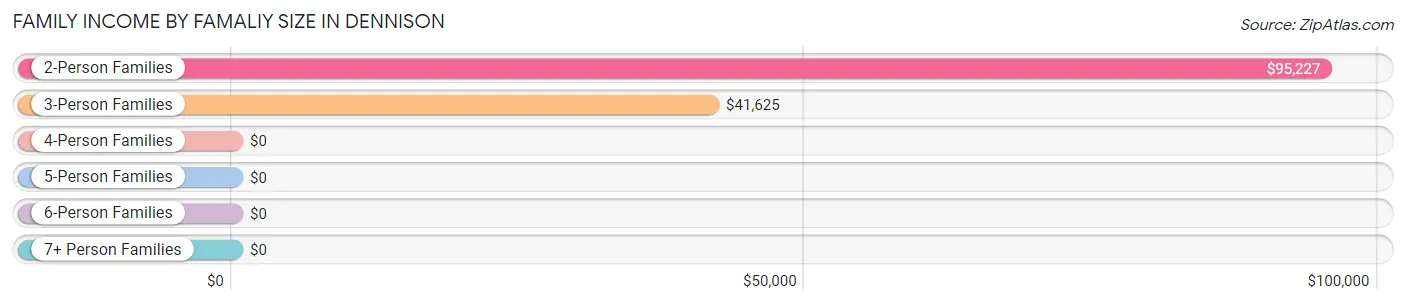
| Income Bracket | # Families | Median Income |
| 2-Person Families | 32 (60.4%) | $95,227 |
| 3-Person Families | 15 (28.3%) | $41,625 |
| 4-Person Families | 0 (0.0%) | $0 |
| 5-Person Families | 4 (7.5%) | $0 |
| 6-Person Families | 0 (0.0%) | $0 |
| 7+ Person Families | 2 (3.8%) | $0 |
| Total | 53 (100.0%) | $66,875 |
Family Income by Number of Earners in Dennison
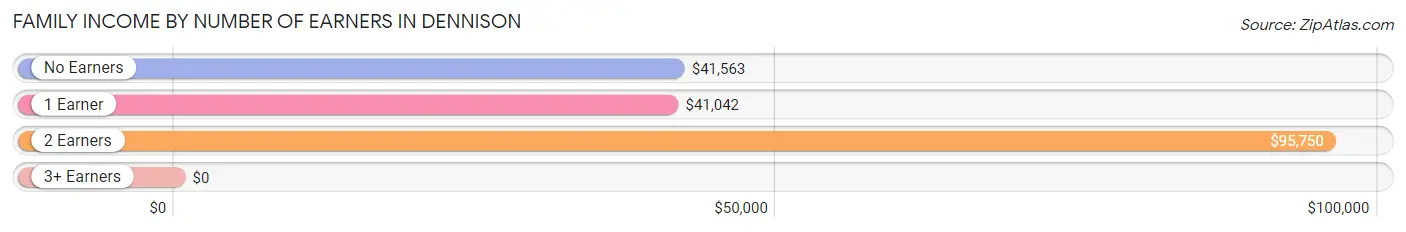
| Number of Earners | # Families | Median Income |
| No Earners | 11 (20.7%) | $41,563 |
| 1 Earner | 13 (24.5%) | $41,042 |
| 2 Earners | 26 (49.1%) | $95,750 |
| 3+ Earners | 3 (5.7%) | $0 |
| Total | 53 (100.0%) | $66,875 |
Household Income in Dennison
Household Income Brackets in Dennison
With 26 households falling in the category, the $35,000 to $49,999 income range is the most frequent in Dennison, accounting for 27.4% of all households.
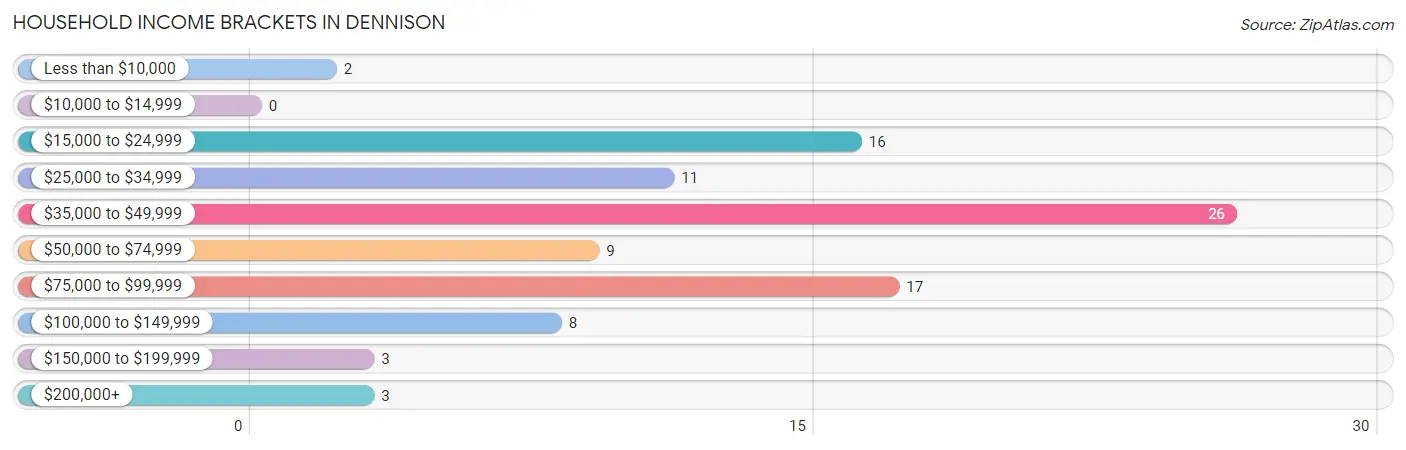
| Income Bracket | # Households | % Households |
| Less than $10,000 | 2 | 2.1% |
| $10,000 to $14,999 | 0 | 0.0% |
| $15,000 to $24,999 | 16 | 16.8% |
| $25,000 to $34,999 | 11 | 11.6% |
| $35,000 to $49,999 | 26 | 27.4% |
| $50,000 to $74,999 | 9 | 9.5% |
| $75,000 to $99,999 | 17 | 17.9% |
| $100,000 to $149,999 | 8 | 8.4% |
| $150,000 to $199,999 | 3 | 3.2% |
| $200,000+ | 3 | 3.2% |
Household Income by Householder Age in Dennison
The median household income in Dennison is $42,750, with the highest median household income of $65,313 found in the 65+ years age bracket for the primary householder. A total of 13 households (13.7%) fall into this category.
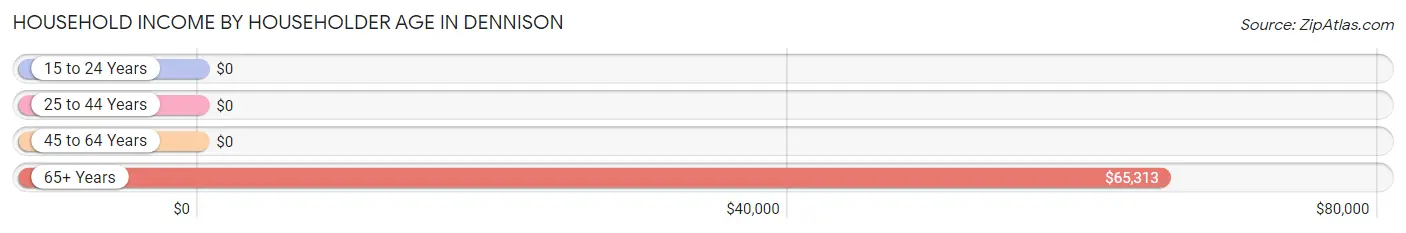
| Income Bracket | # Households | Median Income |
| 15 to 24 Years | 0 (0.0%) | $0 |
| 25 to 44 Years | 39 (41.0%) | $0 |
| 45 to 64 Years | 43 (45.3%) | $0 |
| 65+ Years | 13 (13.7%) | $65,313 |
| Total | 95 (100.0%) | $42,750 |
Poverty in Dennison
Income Below Poverty by Sex and Age in Dennison
With 4.3% poverty level for males and 7.9% for females among the residents of Dennison, 12 to 14 year old males and 45 to 54 year old females are the most vulnerable to poverty, with 2 males (50.0%) and 2 females (28.6%) in their respective age groups living below the poverty level.
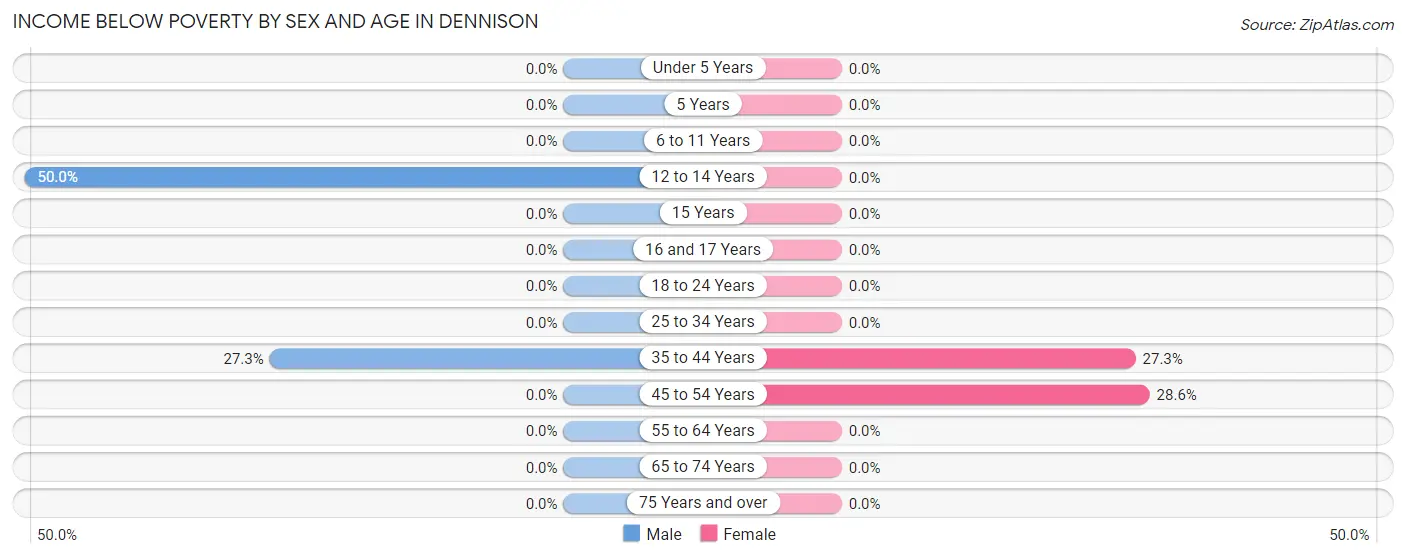
| Age Bracket | Male | Female |
| Under 5 Years | 0 (0.0%) | 0 (0.0%) |
| 5 Years | 0 (0.0%) | 0 (0.0%) |
| 6 to 11 Years | 0 (0.0%) | 0 (0.0%) |
| 12 to 14 Years | 2 (50.0%) | 0 (0.0%) |
| 15 Years | 0 (0.0%) | 0 (0.0%) |
| 16 and 17 Years | 0 (0.0%) | 0 (0.0%) |
| 18 to 24 Years | 0 (0.0%) | 0 (0.0%) |
| 25 to 34 Years | 0 (0.0%) | 0 (0.0%) |
| 35 to 44 Years | 3 (27.3%) | 6 (27.3%) |
| 45 to 54 Years | 0 (0.0%) | 2 (28.6%) |
| 55 to 64 Years | 0 (0.0%) | 0 (0.0%) |
| 65 to 74 Years | 0 (0.0%) | 0 (0.0%) |
| 75 Years and over | 0 (0.0%) | 0 (0.0%) |
| Total | 5 (4.3%) | 8 (7.9%) |
Income Above Poverty by Sex and Age in Dennison
According to the poverty statistics in Dennison, males aged under 5 years and females aged under 5 years are the age groups that are most secure financially, with 100.0% of males and 100.0% of females in these age groups living above the poverty line.
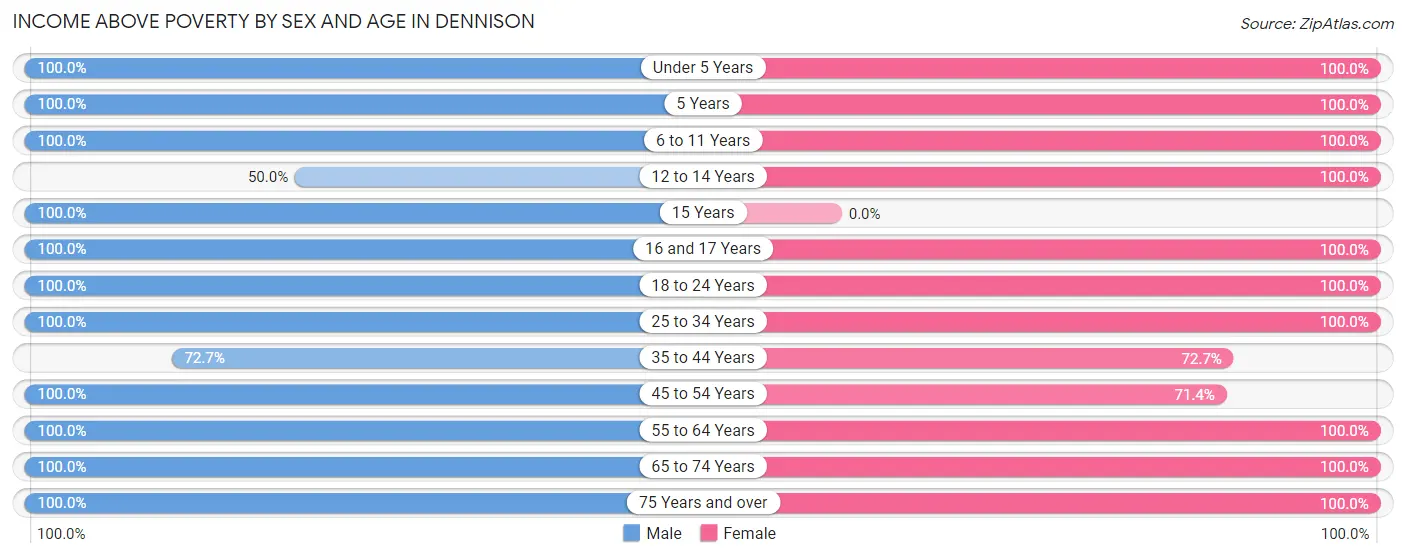
| Age Bracket | Male | Female |
| Under 5 Years | 9 (100.0%) | 3 (100.0%) |
| 5 Years | 6 (100.0%) | 1 (100.0%) |
| 6 to 11 Years | 7 (100.0%) | 11 (100.0%) |
| 12 to 14 Years | 2 (50.0%) | 2 (100.0%) |
| 15 Years | 3 (100.0%) | 0 (0.0%) |
| 16 and 17 Years | 2 (100.0%) | 3 (100.0%) |
| 18 to 24 Years | 7 (100.0%) | 8 (100.0%) |
| 25 to 34 Years | 16 (100.0%) | 20 (100.0%) |
| 35 to 44 Years | 8 (72.7%) | 16 (72.7%) |
| 45 to 54 Years | 15 (100.0%) | 5 (71.4%) |
| 55 to 64 Years | 28 (100.0%) | 12 (100.0%) |
| 65 to 74 Years | 6 (100.0%) | 11 (100.0%) |
| 75 Years and over | 1 (100.0%) | 1 (100.0%) |
| Total | 110 (95.7%) | 93 (92.1%) |
Income Below Poverty Among Married-Couple Families in Dennison
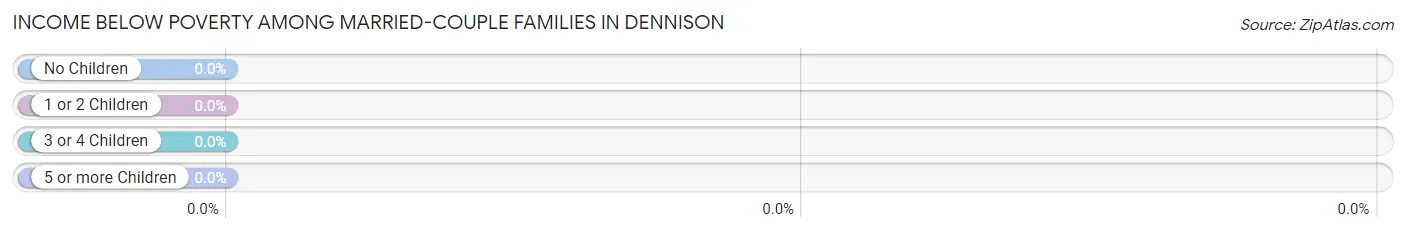
| Children | Above Poverty | Below Poverty |
| No Children | 29 (100.0%) | 0 (0.0%) |
| 1 or 2 Children | 2 (100.0%) | 0 (0.0%) |
| 3 or 4 Children | 3 (100.0%) | 0 (0.0%) |
| 5 or more Children | 1 (100.0%) | 0 (0.0%) |
| Total | 35 (100.0%) | 0 (0.0%) |
Income Below Poverty Among Single-Parent Households in Dennison
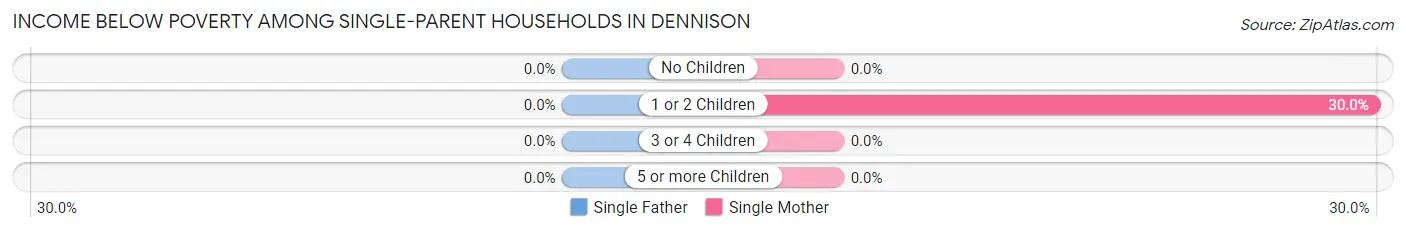
| Children | Single Father | Single Mother |
| No Children | 0 (0.0%) | 0 (0.0%) |
| 1 or 2 Children | 0 (0.0%) | 3 (30.0%) |
| 3 or 4 Children | 0 (0.0%) | 0 (0.0%) |
| 5 or more Children | 0 (0.0%) | 0 (0.0%) |
| Total | 0 (0.0%) | 3 (20.0%) |
Income Below Poverty Among Married-Couple vs Single-Parent Households in Dennison
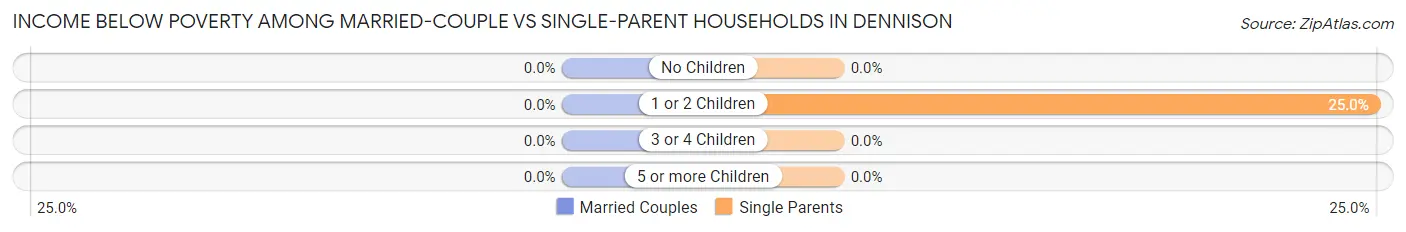
| Children | Married-Couple Families | Single-Parent Households |
| No Children | 0 (0.0%) | 0 (0.0%) |
| 1 or 2 Children | 0 (0.0%) | 3 (25.0%) |
| 3 or 4 Children | 0 (0.0%) | 0 (0.0%) |
| 5 or more Children | 0 (0.0%) | 0 (0.0%) |
| Total | 0 (0.0%) | 3 (16.7%) |
Race in Dennison
The most populous races in Dennison are White / Caucasian (207 | 95.8%), and Two or more Races (9 | 4.2%).
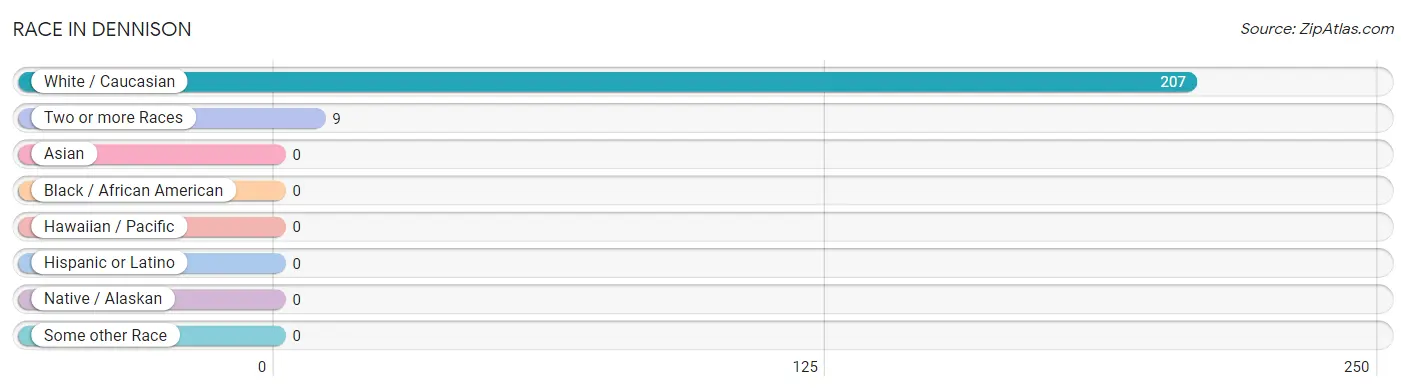
| Race | # Population | % Population |
| Asian | 0 | 0.0% |
| Black / African American | 0 | 0.0% |
| Hawaiian / Pacific | 0 | 0.0% |
| Hispanic or Latino | 0 | 0.0% |
| Native / Alaskan | 0 | 0.0% |
| White / Caucasian | 207 | 95.8% |
| Two or more Races | 9 | 4.2% |
| Some other Race | 0 | 0.0% |
| Total | 216 | 100.0% |
Ancestry in Dennison
The most populous ancestries reported in Dennison are German (81 | 37.5%), Irish (43 | 19.9%), Norwegian (34 | 15.7%), Scottish (26 | 12.0%), and Italian (17 | 7.9%), together accounting for 93.1% of all Dennison residents.
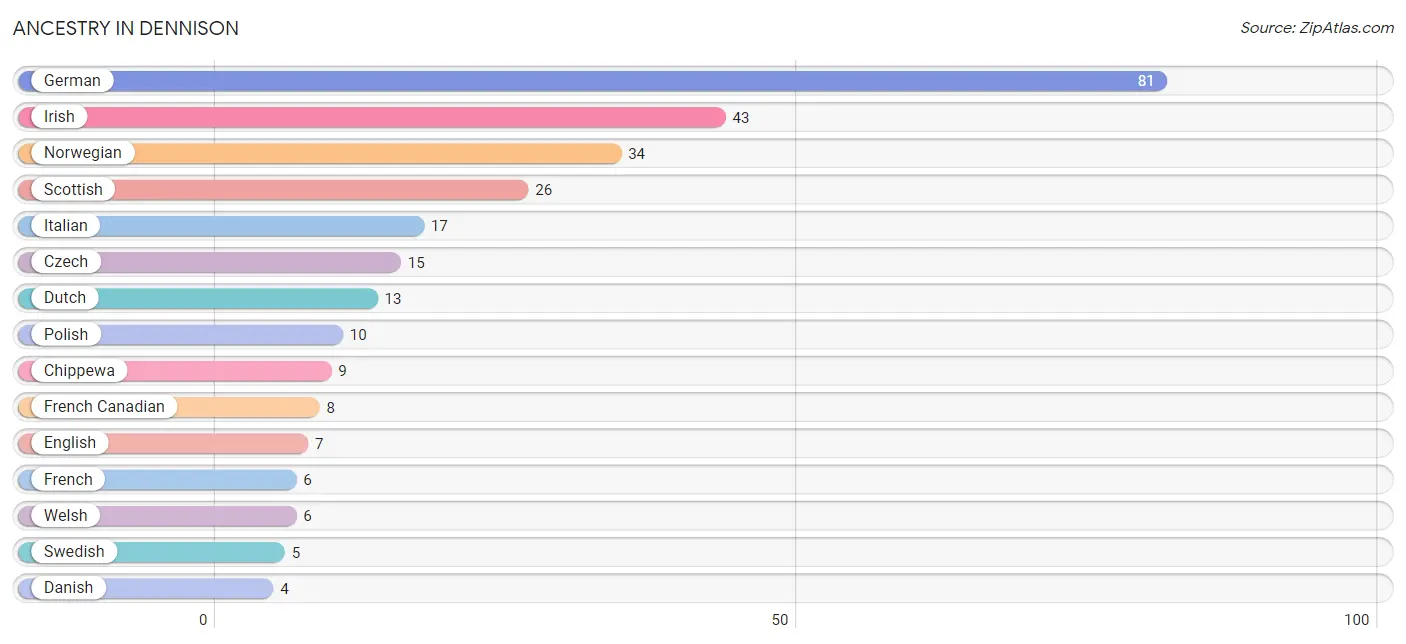
| Ancestry | # Population | % Population |
| American | 2 | 0.9% |
| Chippewa | 9 | 4.2% |
| Czech | 15 | 6.9% |
| Danish | 4 | 1.8% |
| Dutch | 13 | 6.0% |
| English | 7 | 3.2% |
| Finnish | 2 | 0.9% |
| French | 6 | 2.8% |
| French Canadian | 8 | 3.7% |
| German | 81 | 37.5% |
| Irish | 43 | 19.9% |
| Italian | 17 | 7.9% |
| Norwegian | 34 | 15.7% |
| Polish | 10 | 4.6% |
| Russian | 2 | 0.9% |
| Scandinavian | 2 | 0.9% |
| Scotch-Irish | 1 | 0.5% |
| Scottish | 26 | 12.0% |
| Swedish | 5 | 2.3% |
| Welsh | 6 | 2.8% | View All 20 Rows |
Immigrants in Dennison

| Immigration Origin | # Population | % Population | View All 0 Rows |
Sex and Age in Dennison
Sex and Age in Dennison
The most populous age groups in Dennison are 55 to 59 Years (22 | 19.1%) for men and 25 to 29 Years (19 | 18.8%) for women.
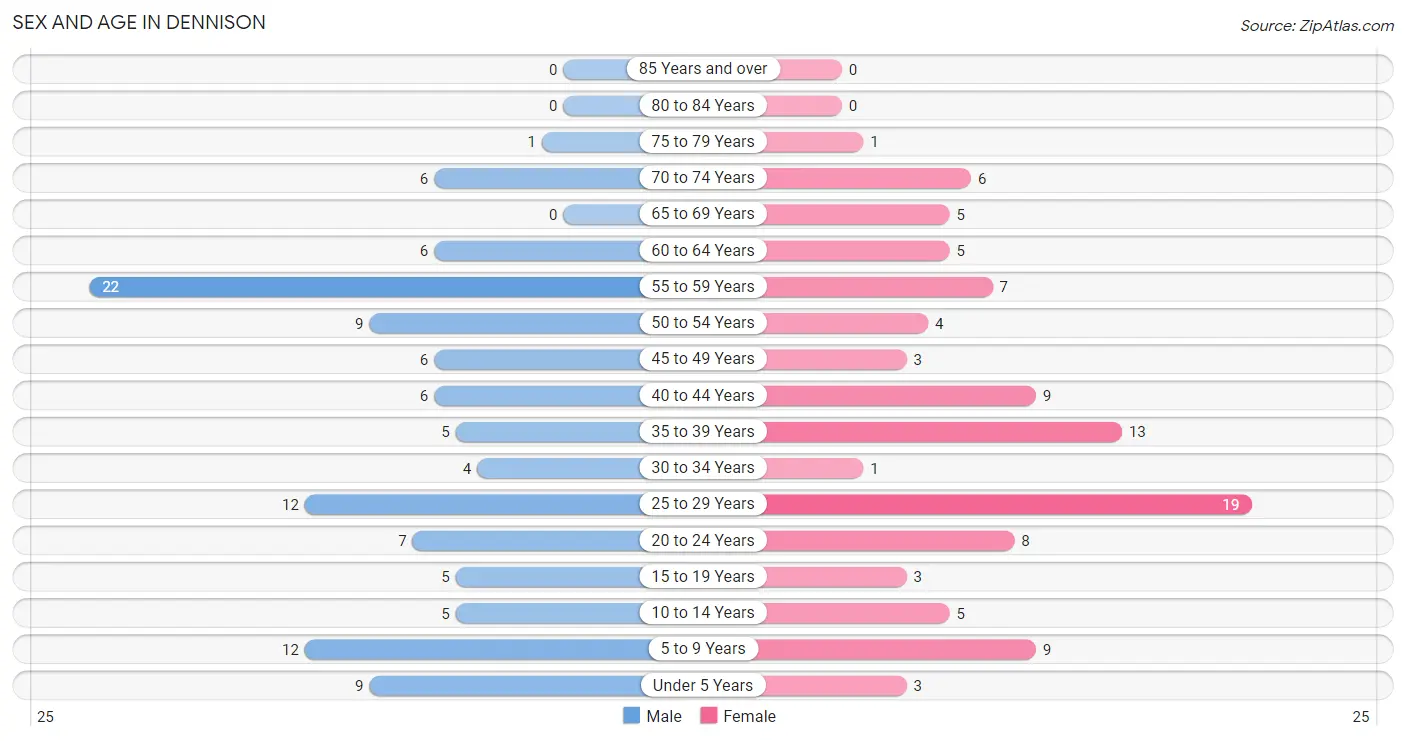
| Age Bracket | Male | Female |
| Under 5 Years | 9 (7.8%) | 3 (3.0%) |
| 5 to 9 Years | 12 (10.4%) | 9 (8.9%) |
| 10 to 14 Years | 5 (4.3%) | 5 (5.0%) |
| 15 to 19 Years | 5 (4.3%) | 3 (3.0%) |
| 20 to 24 Years | 7 (6.1%) | 8 (7.9%) |
| 25 to 29 Years | 12 (10.4%) | 19 (18.8%) |
| 30 to 34 Years | 4 (3.5%) | 1 (1.0%) |
| 35 to 39 Years | 5 (4.3%) | 13 (12.9%) |
| 40 to 44 Years | 6 (5.2%) | 9 (8.9%) |
| 45 to 49 Years | 6 (5.2%) | 3 (3.0%) |
| 50 to 54 Years | 9 (7.8%) | 4 (4.0%) |
| 55 to 59 Years | 22 (19.1%) | 7 (6.9%) |
| 60 to 64 Years | 6 (5.2%) | 5 (5.0%) |
| 65 to 69 Years | 0 (0.0%) | 5 (5.0%) |
| 70 to 74 Years | 6 (5.2%) | 6 (5.9%) |
| 75 to 79 Years | 1 (0.9%) | 1 (1.0%) |
| 80 to 84 Years | 0 (0.0%) | 0 (0.0%) |
| 85 Years and over | 0 (0.0%) | 0 (0.0%) |
| Total | 115 (100.0%) | 101 (100.0%) |
Families and Households in Dennison
Median Family Size in Dennison
The median family size in Dennison is 3.04 persons per family, with single male/father families (3 | 5.7%) accounting for the largest median family size of 4.33 persons per family. On the other hand, single female/mother families (15 | 28.3%) represent the smallest median family size with 2.40 persons per family.
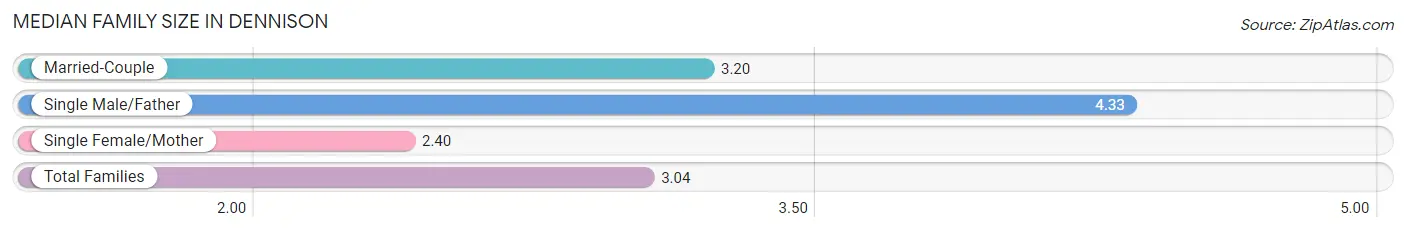
| Family Type | # Families | Family Size |
| Married-Couple | 35 (66.0%) | 3.20 |
| Single Male/Father | 3 (5.7%) | 4.33 |
| Single Female/Mother | 15 (28.3%) | 2.40 |
| Total Families | 53 (100.0%) | 3.04 |
Median Household Size in Dennison
The median household size in Dennison is 2.27 persons per household, with single male/father households (3 | 3.2%) accounting for the largest median household size of 6 persons per household. non-family households (42 | 44.2%) represent the smallest median household size with 1.10 persons per household.
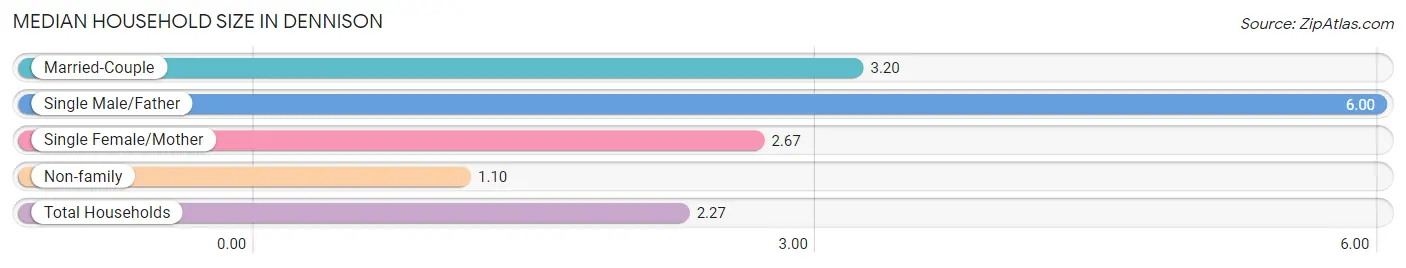
| Household Type | # Households | Household Size |
| Married-Couple | 35 (36.8%) | 3.20 |
| Single Male/Father | 3 (3.2%) | 6.00 |
| Single Female/Mother | 15 (15.8%) | 2.67 |
| Non-family | 42 (44.2%) | 1.10 |
| Total Households | 95 (100.0%) | 2.27 |
Household Size by Marriage Status in Dennison
Out of a total of 95 households in Dennison, 53 (55.8%) are family households, while 42 (44.2%) are nonfamily households. The most numerous type of family households are 2-person households, comprising 29, and the most common type of nonfamily households are 1-person households, comprising 38.
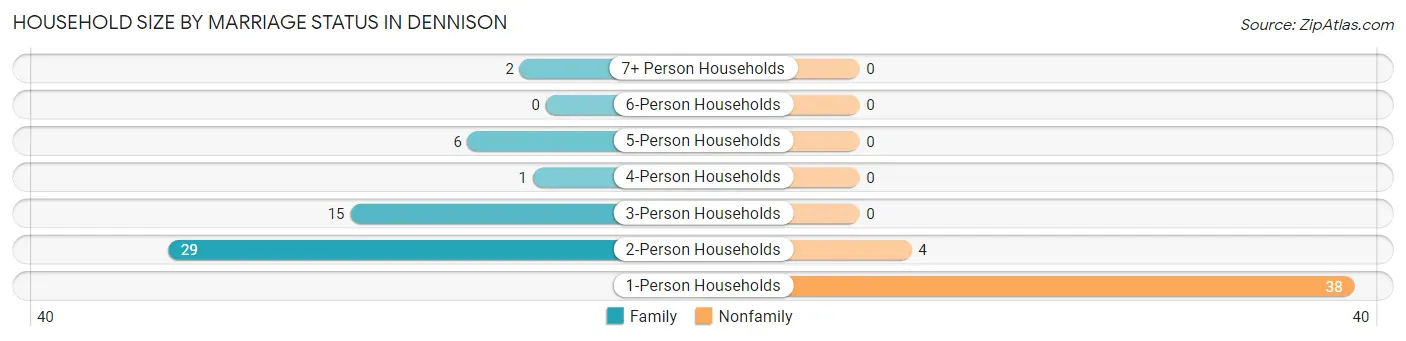
| Household Size | Family Households | Nonfamily Households |
| 1-Person Households | - | 38 (40.0%) |
| 2-Person Households | 29 (30.5%) | 4 (4.2%) |
| 3-Person Households | 15 (15.8%) | 0 (0.0%) |
| 4-Person Households | 1 (1.1%) | 0 (0.0%) |
| 5-Person Households | 6 (6.3%) | 0 (0.0%) |
| 6-Person Households | 0 (0.0%) | 0 (0.0%) |
| 7+ Person Households | 2 (2.1%) | 0 (0.0%) |
| Total | 53 (55.8%) | 42 (44.2%) |
Female Fertility in Dennison
Fertility by Age in Dennison
Average fertility rate in Dennison is 18.0 births per 1,000 women. Women in the age bracket of 20 to 34 years have the highest fertility rate with 36.0 births per 1,000 women. Women in the age bracket of 20 to 34 years acount for 100.0% of all women with births.
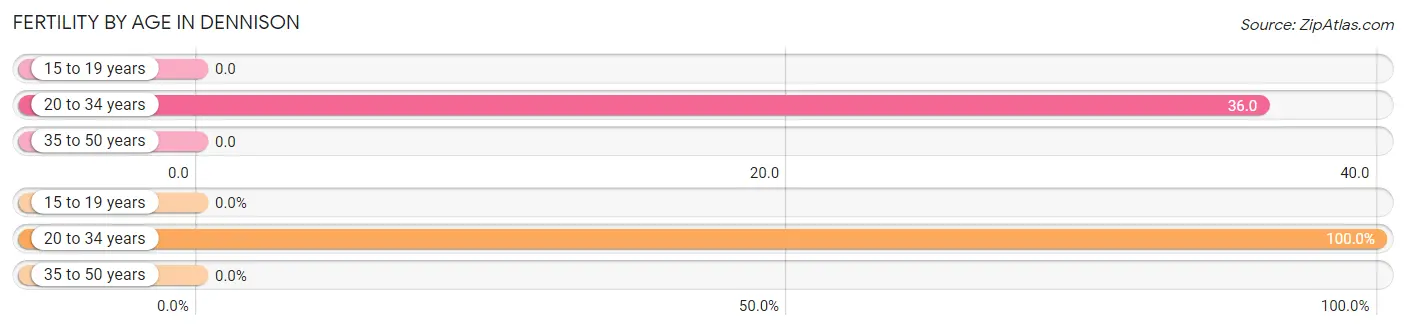
| Age Bracket | Women with Births | Births / 1,000 Women |
| 15 to 19 years | 0 (0.0%) | 0.0 |
| 20 to 34 years | 1 (100.0%) | 36.0 |
| 35 to 50 years | 0 (0.0%) | 0.0 |
| Total | 1 (100.0%) | 18.0 |
Fertility by Age by Marriage Status in Dennison
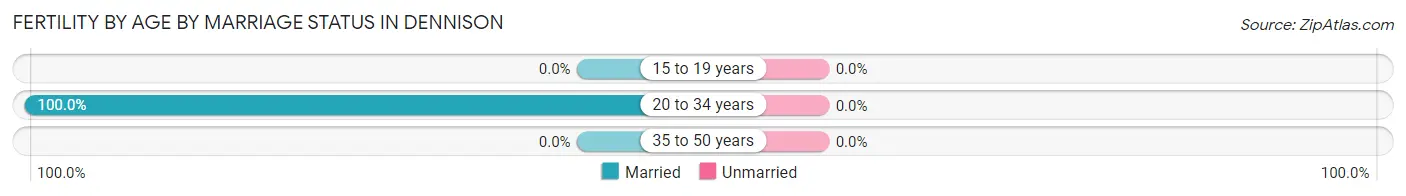
| Age Bracket | Married | Unmarried |
| 15 to 19 years | 0 (0.0%) | 0 (0.0%) |
| 20 to 34 years | 1 (100.0%) | 0 (0.0%) |
| 35 to 50 years | 0 (0.0%) | 0 (0.0%) |
| Total | 1 (100.0%) | 0 (0.0%) |
Fertility by Education in Dennison
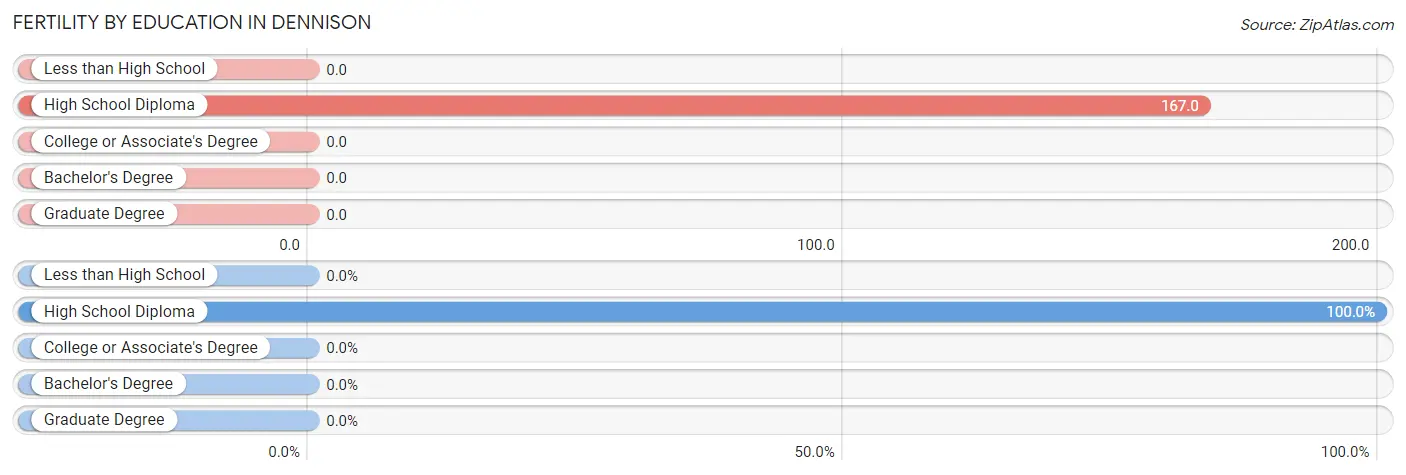
| Educational Attainment | Women with Births | Births / 1,000 Women |
| Less than High School | 0 (0.0%) | 0.0 |
| High School Diploma | 1 (100.0%) | 167.0 |
| College or Associate's Degree | 0 (0.0%) | 0.0 |
| Bachelor's Degree | 0 (0.0%) | 0.0 |
| Graduate Degree | 0 (0.0%) | 0.0 |
| Total | 1 (100.0%) | 18.0 |
Fertility by Education by Marriage Status in Dennison
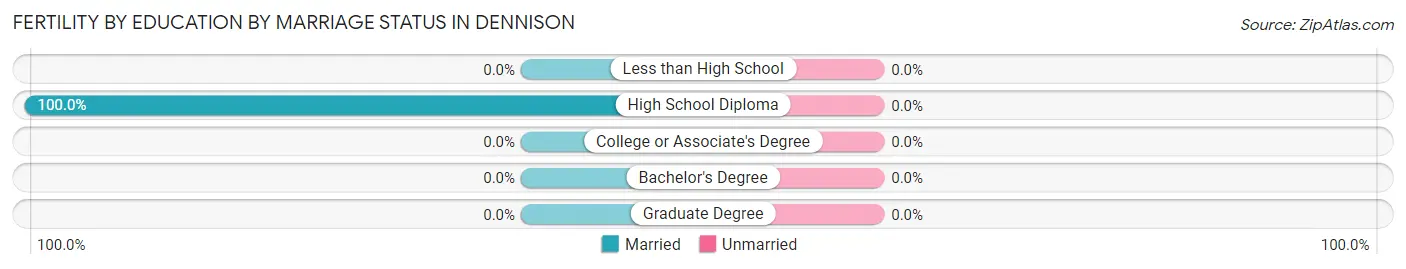
| Educational Attainment | Married | Unmarried |
| Less than High School | 0 (0.0%) | 0 (0.0%) |
| High School Diploma | 1 (100.0%) | 0 (0.0%) |
| College or Associate's Degree | 0 (0.0%) | 0 (0.0%) |
| Bachelor's Degree | 0 (0.0%) | 0 (0.0%) |
| Graduate Degree | 0 (0.0%) | 0 (0.0%) |
| Total | 1 (100.0%) | 0 (0.0%) |
Employment Characteristics in Dennison
Employment by Class of Employer in Dennison
Among the 97 employed individuals in Dennison, private company employees (59 | 60.8%), local government employees (13 | 13.4%), and not-for-profit organizations (10 | 10.3%) make up the most common classes of employment.
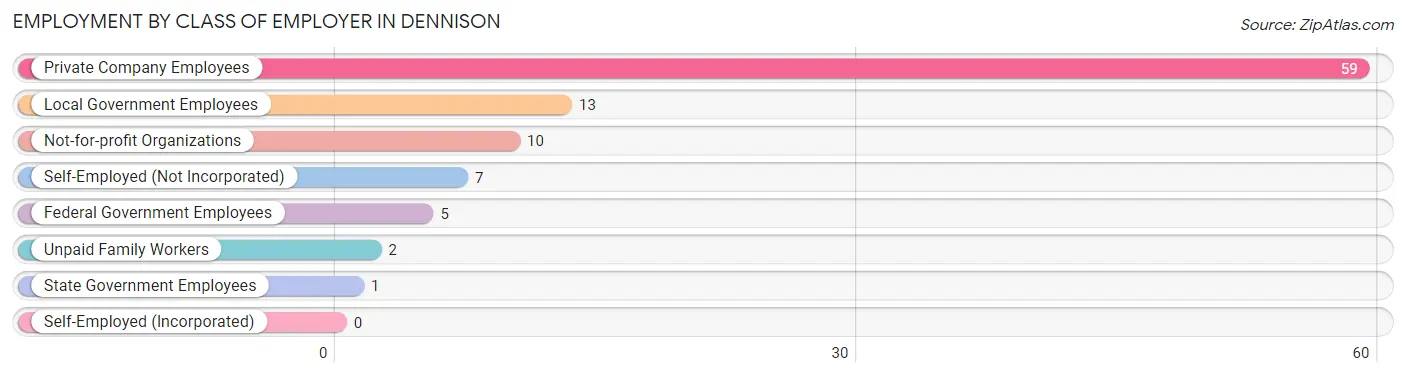
| Employer Class | # Employees | % Employees |
| Private Company Employees | 59 | 60.8% |
| Self-Employed (Incorporated) | 0 | 0.0% |
| Self-Employed (Not Incorporated) | 7 | 7.2% |
| Not-for-profit Organizations | 10 | 10.3% |
| Local Government Employees | 13 | 13.4% |
| State Government Employees | 1 | 1.0% |
| Federal Government Employees | 5 | 5.1% |
| Unpaid Family Workers | 2 | 2.1% |
| Total | 97 | 100.0% |
Employment Status by Age in Dennison
According to the labor force statistics for Dennison, out of the total population over 16 years of age (170), 62.9% or 107 individuals are in the labor force, with 3.9% or 4 of them unemployed. The age group with the highest labor force participation rate is 30 to 34 years, with 100.0% or 5 individuals in the labor force. Within the labor force, the 60 to 64 years age range has the highest percentage of unemployed individuals, with 50.0% or 2 of them being unemployed.
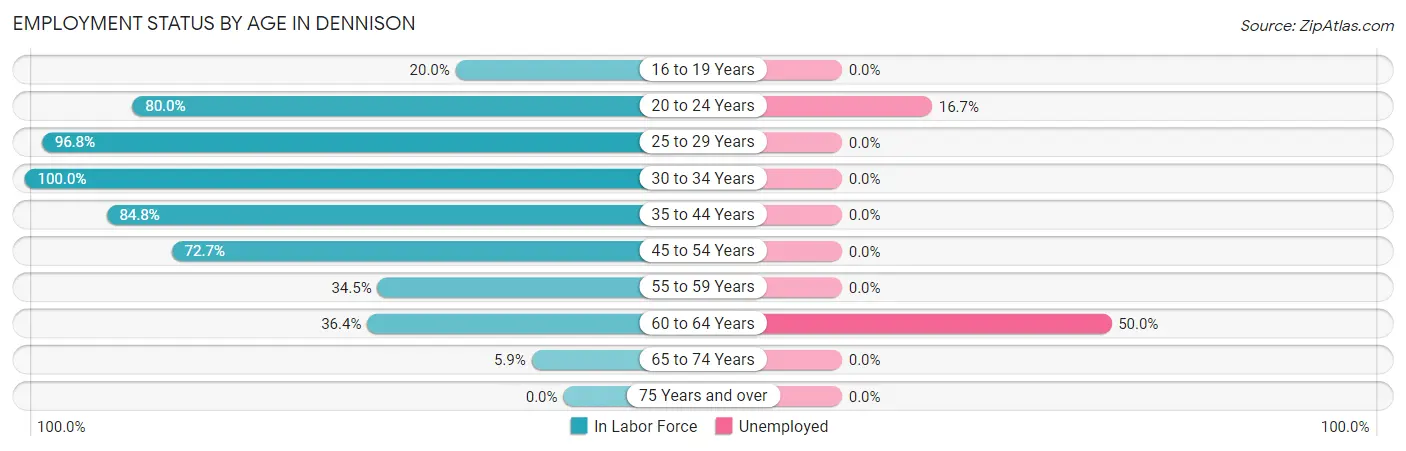
| Age Bracket | In Labor Force | Unemployed |
| 16 to 19 Years | 1 (20.0%) | 0 (0.0%) |
| 20 to 24 Years | 12 (80.0%) | 2 (16.7%) |
| 25 to 29 Years | 30 (96.8%) | 0 (0.0%) |
| 30 to 34 Years | 5 (100.0%) | 0 (0.0%) |
| 35 to 44 Years | 28 (84.8%) | 0 (0.0%) |
| 45 to 54 Years | 16 (72.7%) | 0 (0.0%) |
| 55 to 59 Years | 10 (34.5%) | 0 (0.0%) |
| 60 to 64 Years | 4 (36.4%) | 2 (50.0%) |
| 65 to 74 Years | 1 (5.9%) | 0 (0.0%) |
| 75 Years and over | 0 (0.0%) | 0 (0.0%) |
| Total | 107 (62.9%) | 4 (3.9%) |
Employment Status by Educational Attainment in Dennison
According to labor force statistics for Dennison, 71.0% of individuals (93) out of the total population between 25 and 64 years of age (131) are in the labor force, with 2.3% or 2 of them being unemployed. The group with the highest labor force participation rate are those with the educational attainment of less than high school, with 92.3% or 12 individuals in the labor force. Within the labor force, individuals with less than high school education have the highest percentage of unemployment, with 16.7% or 2 of them being unemployed.

| Educational Attainment | In Labor Force | Unemployed |
| Less than High School | 12 (92.3%) | 2 (16.7%) |
| High School Diploma | 19 (48.7%) | 0 (0.0%) |
| College / Associate Degree | 41 (78.8%) | 0 (0.0%) |
| Bachelor's Degree or higher | 21 (77.8%) | 0 (0.0%) |
| Total | 93 (71.0%) | 3 (2.3%) |
Employment Occupations by Sex in Dennison
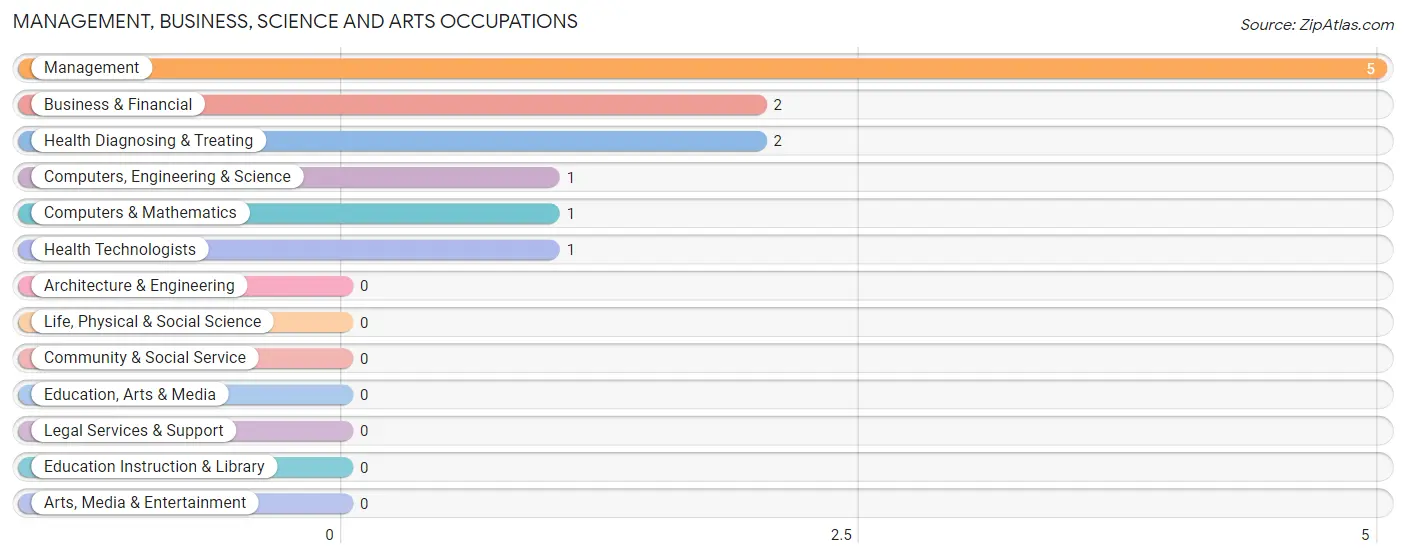
Management, Business, Science and Arts Occupations
The most common Management, Business, Science and Arts occupations in Dennison are Management (5 | 5.1%), Business & Financial (2 | 2.0%), Health Diagnosing & Treating (2 | 2.0%), Computers, Engineering & Science (1 | 1.0%), and Computers & Mathematics (1 | 1.0%).
Management, Business, Science and Arts Occupations by Sex
Within the Management, Business, Science and Arts occupations in Dennison, the most male-oriented occupations are Business & Financial (100.0%), Computers, Engineering & Science (100.0%), and Computers & Mathematics (100.0%), while the most female-oriented occupations are Management (80.0%), and Health Diagnosing & Treating (50.0%).
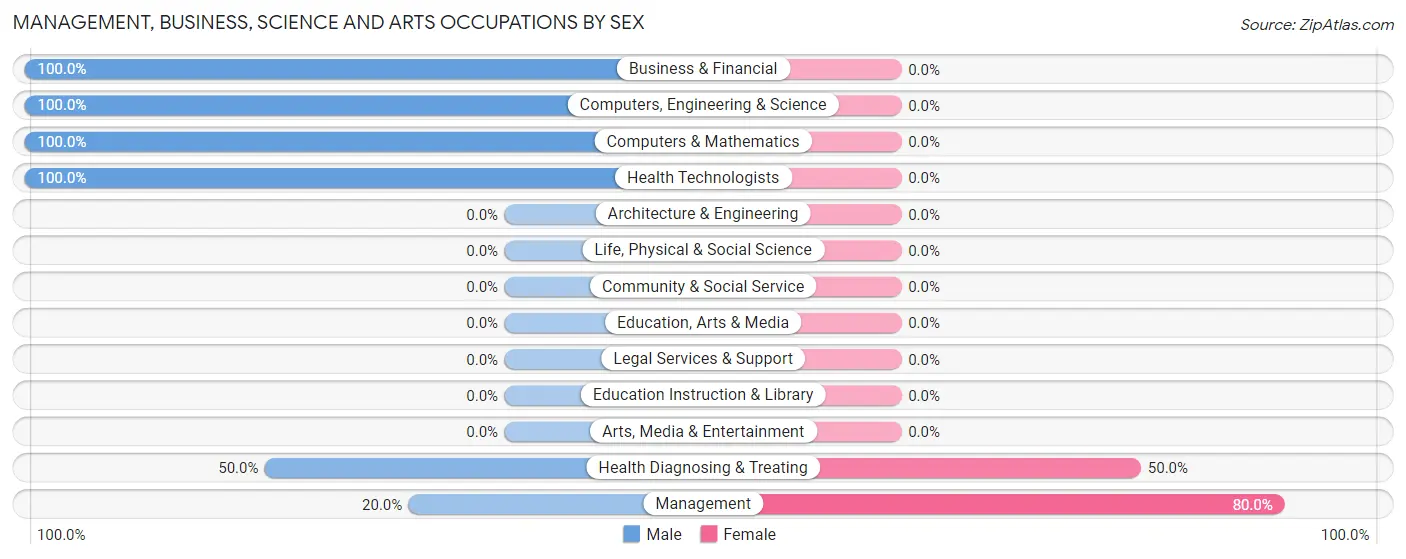
| Occupation | Male | Female |
| Management | 1 (20.0%) | 4 (80.0%) |
| Business & Financial | 2 (100.0%) | 0 (0.0%) |
| Computers, Engineering & Science | 1 (100.0%) | 0 (0.0%) |
| Computers & Mathematics | 1 (100.0%) | 0 (0.0%) |
| Architecture & Engineering | 0 (0.0%) | 0 (0.0%) |
| Life, Physical & Social Science | 0 (0.0%) | 0 (0.0%) |
| Community & Social Service | 0 (0.0%) | 0 (0.0%) |
| Education, Arts & Media | 0 (0.0%) | 0 (0.0%) |
| Legal Services & Support | 0 (0.0%) | 0 (0.0%) |
| Education Instruction & Library | 0 (0.0%) | 0 (0.0%) |
| Arts, Media & Entertainment | 0 (0.0%) | 0 (0.0%) |
| Health Diagnosing & Treating | 1 (50.0%) | 1 (50.0%) |
| Health Technologists | 1 (100.0%) | 0 (0.0%) |
| Total (Category) | 5 (50.0%) | 5 (50.0%) |
| Total (Overall) | 46 (46.9%) | 52 (53.1%) |
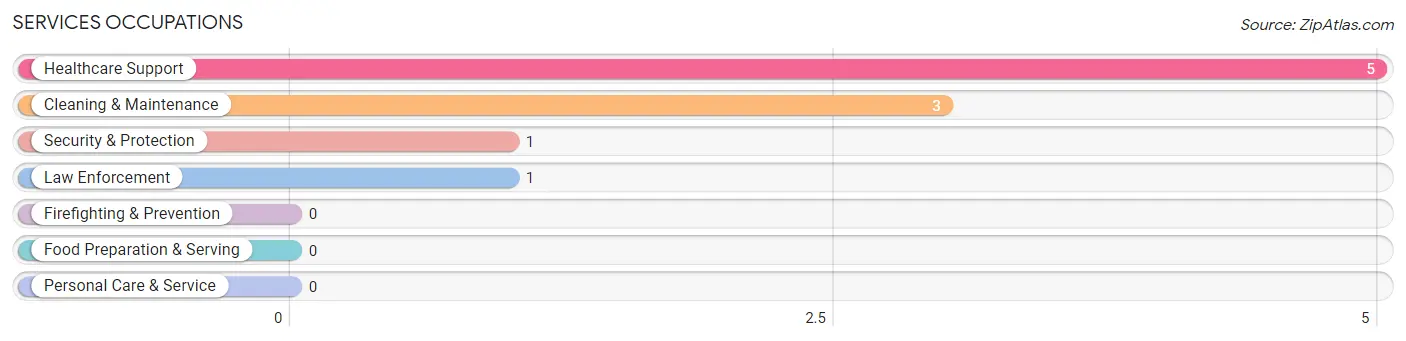
Services Occupations
The most common Services occupations in Dennison are Healthcare Support (5 | 5.1%), Cleaning & Maintenance (3 | 3.1%), Security & Protection (1 | 1.0%), and Law Enforcement (1 | 1.0%).
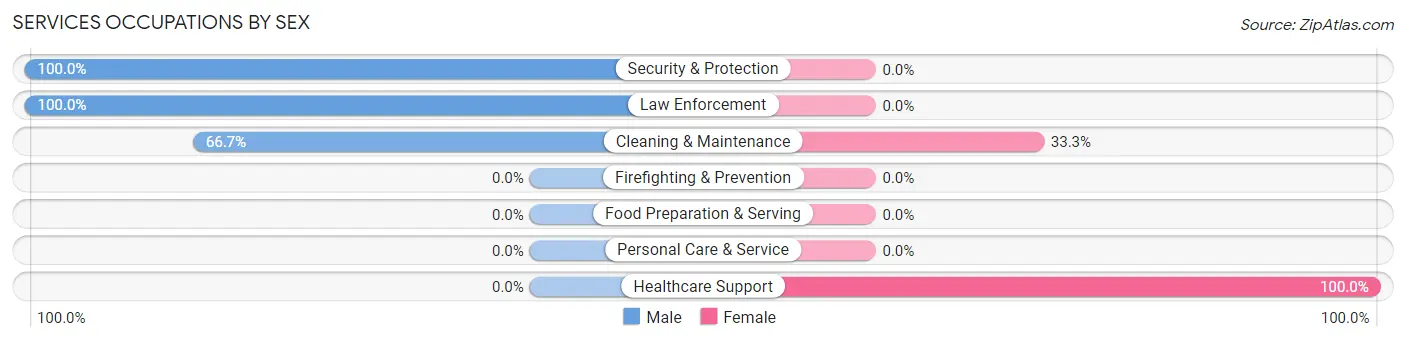
Services Occupations by Sex
Within the Services occupations in Dennison, the most male-oriented occupations are Security & Protection (100.0%), Law Enforcement (100.0%), and Cleaning & Maintenance (66.7%), while the most female-oriented occupations are Healthcare Support (100.0%), and Cleaning & Maintenance (33.3%).
| Occupation | Male | Female |
| Healthcare Support | 0 (0.0%) | 5 (100.0%) |
| Security & Protection | 1 (100.0%) | 0 (0.0%) |
| Firefighting & Prevention | 0 (0.0%) | 0 (0.0%) |
| Law Enforcement | 1 (100.0%) | 0 (0.0%) |
| Food Preparation & Serving | 0 (0.0%) | 0 (0.0%) |
| Cleaning & Maintenance | 2 (66.7%) | 1 (33.3%) |
| Personal Care & Service | 0 (0.0%) | 0 (0.0%) |
| Total (Category) | 3 (33.3%) | 6 (66.7%) |
| Total (Overall) | 46 (46.9%) | 52 (53.1%) |
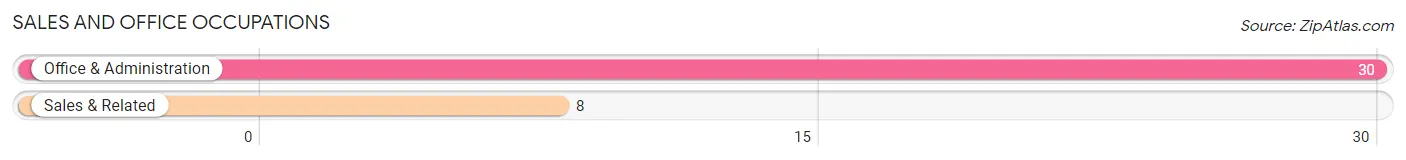
Sales and Office Occupations
The most common Sales and Office occupations in Dennison are Office & Administration (30 | 30.6%), and Sales & Related (8 | 8.2%).
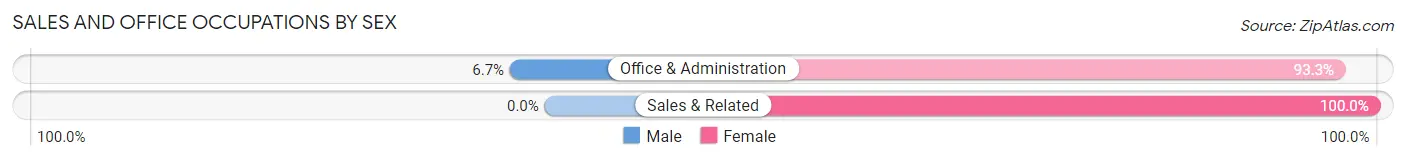
Sales and Office Occupations by Sex
| Occupation | Male | Female |
| Sales & Related | 0 (0.0%) | 8 (100.0%) |
| Office & Administration | 2 (6.7%) | 28 (93.3%) |
| Total (Category) | 2 (5.3%) | 36 (94.7%) |
| Total (Overall) | 46 (46.9%) | 52 (53.1%) |
Natural Resources, Construction and Maintenance Occupations
The most common Natural Resources, Construction and Maintenance occupations in Dennison are Construction & Extraction (4 | 4.1%), Installation, Maintenance & Repair (3 | 3.1%), and Farming, Fishing & Forestry (2 | 2.0%).
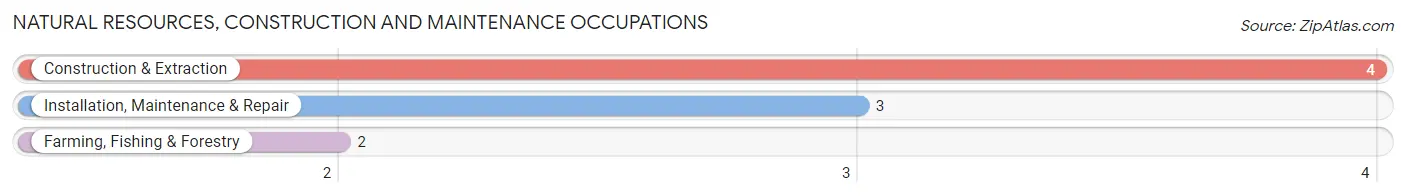
Natural Resources, Construction and Maintenance Occupations by Sex
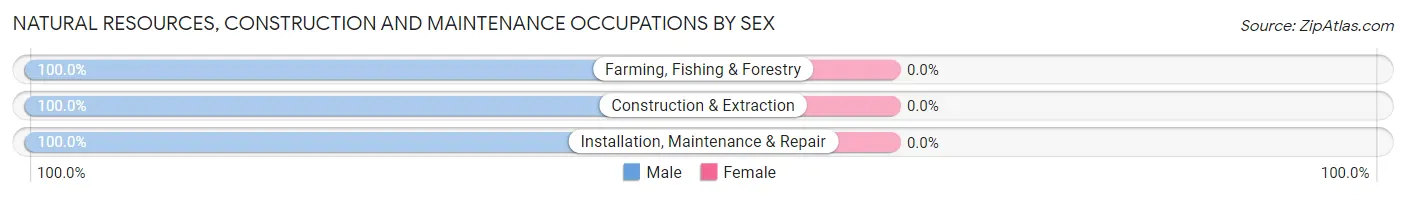
| Occupation | Male | Female |
| Farming, Fishing & Forestry | 2 (100.0%) | 0 (0.0%) |
| Construction & Extraction | 4 (100.0%) | 0 (0.0%) |
| Installation, Maintenance & Repair | 3 (100.0%) | 0 (0.0%) |
| Total (Category) | 9 (100.0%) | 0 (0.0%) |
| Total (Overall) | 46 (46.9%) | 52 (53.1%) |
Production, Transportation and Moving Occupations
The most common Production, Transportation and Moving occupations in Dennison are Production (20 | 20.4%), Material Moving (7 | 7.1%), and Transportation (5 | 5.1%).
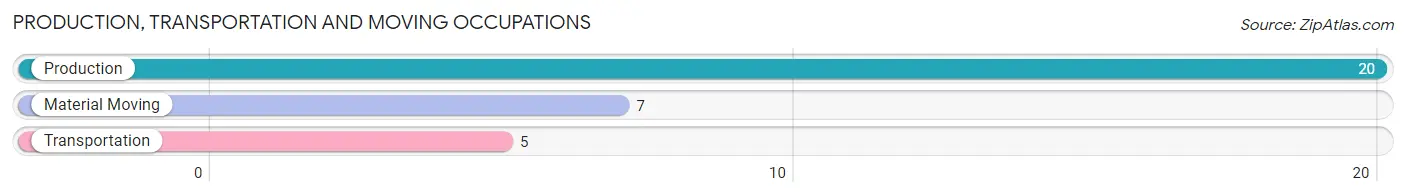
Production, Transportation and Moving Occupations by Sex
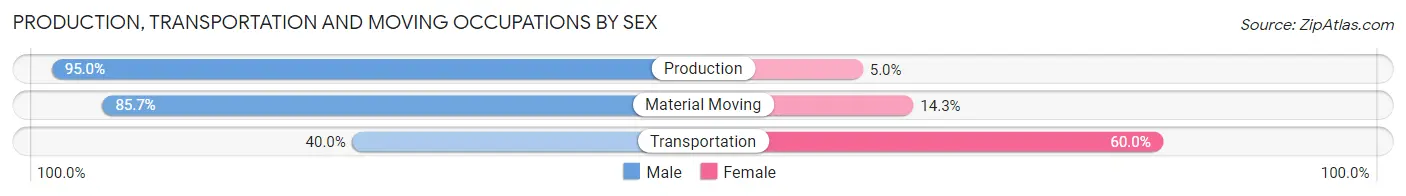
| Occupation | Male | Female |
| Production | 19 (95.0%) | 1 (5.0%) |
| Transportation | 2 (40.0%) | 3 (60.0%) |
| Material Moving | 6 (85.7%) | 1 (14.3%) |
| Total (Category) | 27 (84.4%) | 5 (15.6%) |
| Total (Overall) | 46 (46.9%) | 52 (53.1%) |
Employment Industries by Sex in Dennison
Employment Industries in Dennison
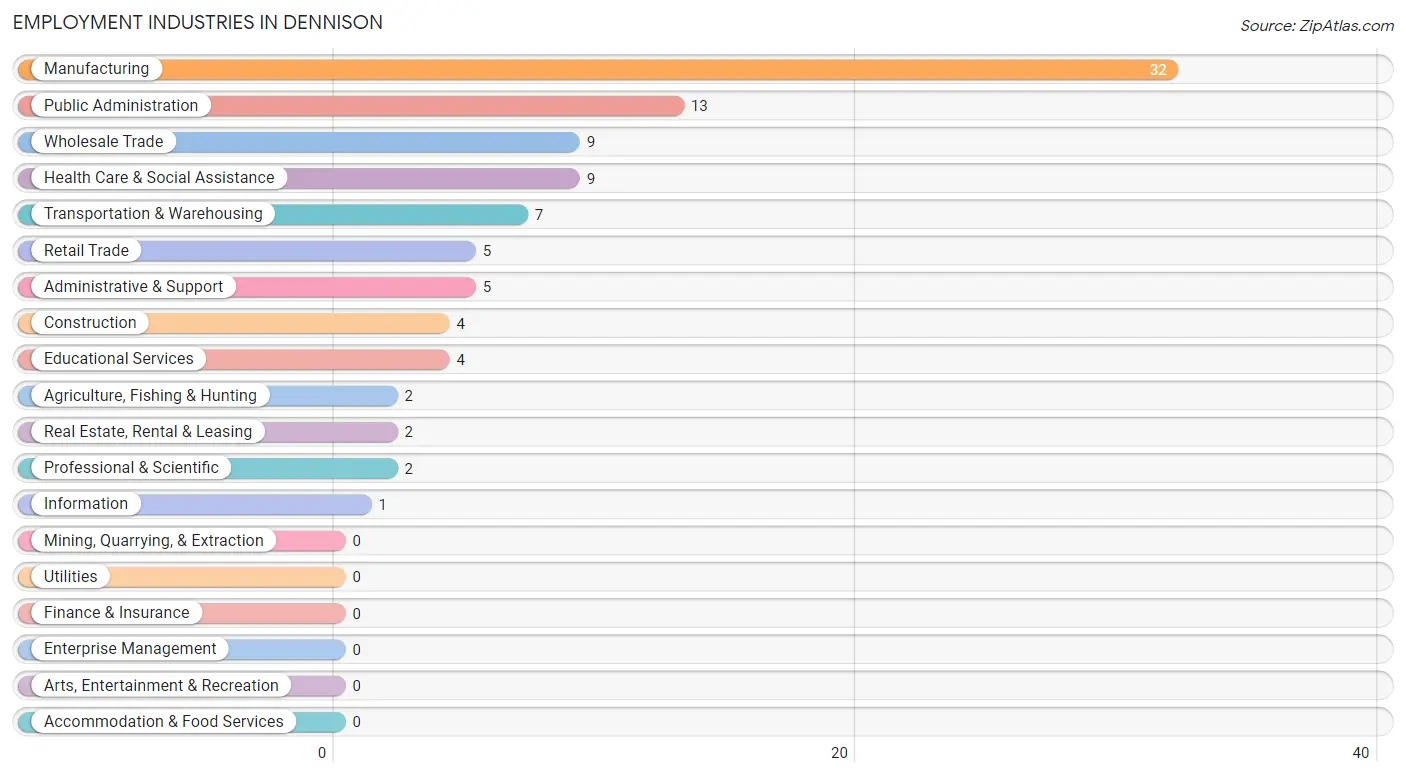
The major employment industries in Dennison include Manufacturing (32 | 32.7%), Public Administration (13 | 13.3%), Wholesale Trade (9 | 9.2%), Health Care & Social Assistance (9 | 9.2%), and Transportation & Warehousing (7 | 7.1%).
Employment Industries by Sex in Dennison
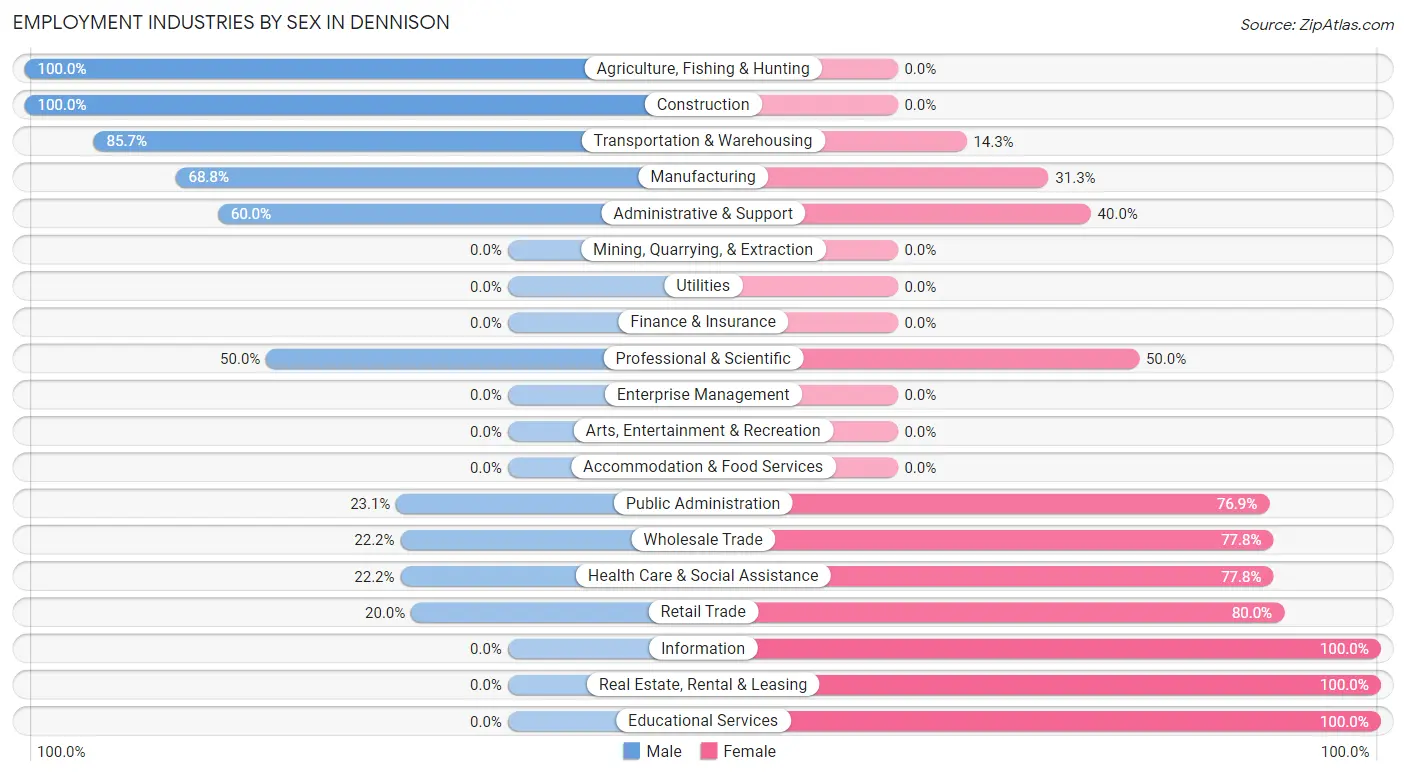
The Dennison industries that see more men than women are Agriculture, Fishing & Hunting (100.0%), Construction (100.0%), and Transportation & Warehousing (85.7%), whereas the industries that tend to have a higher number of women are Information (100.0%), Real Estate, Rental & Leasing (100.0%), and Educational Services (100.0%).
| Industry | Male | Female |
| Agriculture, Fishing & Hunting | 2 (100.0%) | 0 (0.0%) |
| Mining, Quarrying, & Extraction | 0 (0.0%) | 0 (0.0%) |
| Construction | 4 (100.0%) | 0 (0.0%) |
| Manufacturing | 22 (68.8%) | 10 (31.2%) |
| Wholesale Trade | 2 (22.2%) | 7 (77.8%) |
| Retail Trade | 1 (20.0%) | 4 (80.0%) |
| Transportation & Warehousing | 6 (85.7%) | 1 (14.3%) |
| Utilities | 0 (0.0%) | 0 (0.0%) |
| Information | 0 (0.0%) | 1 (100.0%) |
| Finance & Insurance | 0 (0.0%) | 0 (0.0%) |
| Real Estate, Rental & Leasing | 0 (0.0%) | 2 (100.0%) |
| Professional & Scientific | 1 (50.0%) | 1 (50.0%) |
| Enterprise Management | 0 (0.0%) | 0 (0.0%) |
| Administrative & Support | 3 (60.0%) | 2 (40.0%) |
| Educational Services | 0 (0.0%) | 4 (100.0%) |
| Health Care & Social Assistance | 2 (22.2%) | 7 (77.8%) |
| Arts, Entertainment & Recreation | 0 (0.0%) | 0 (0.0%) |
| Accommodation & Food Services | 0 (0.0%) | 0 (0.0%) |
| Public Administration | 3 (23.1%) | 10 (76.9%) |
| Total | 46 (46.9%) | 52 (53.1%) |
Education in Dennison
School Enrollment in Dennison
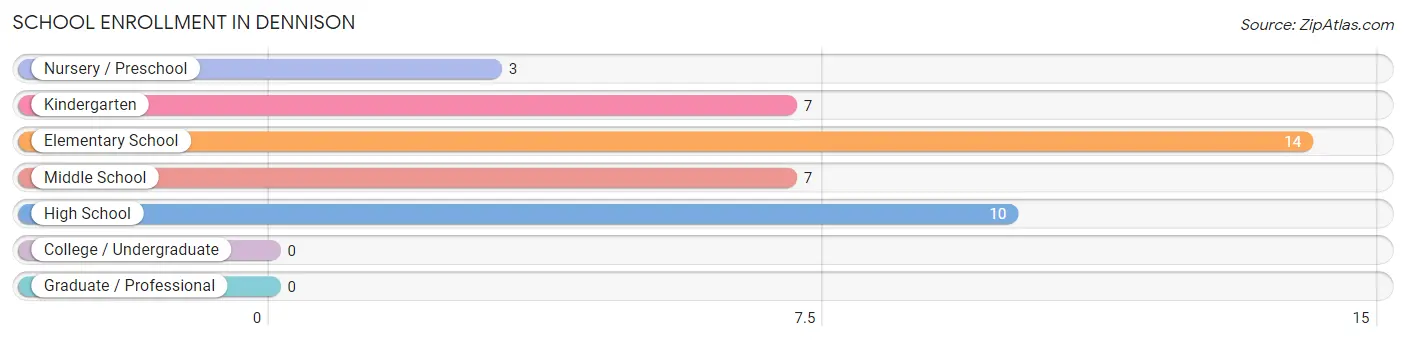
The most common levels of schooling among the 41 students in Dennison are elementary school (14 | 34.2%), high school (10 | 24.4%), and kindergarten (7 | 17.1%).
| School Level | # Students | % Students |
| Nursery / Preschool | 3 | 7.3% |
| Kindergarten | 7 | 17.1% |
| Elementary School | 14 | 34.2% |
| Middle School | 7 | 17.1% |
| High School | 10 | 24.4% |
| College / Undergraduate | 0 | 0.0% |
| Graduate / Professional | 0 | 0.0% |
| Total | 41 | 100.0% |
School Enrollment by Age by Funding Source in Dennison
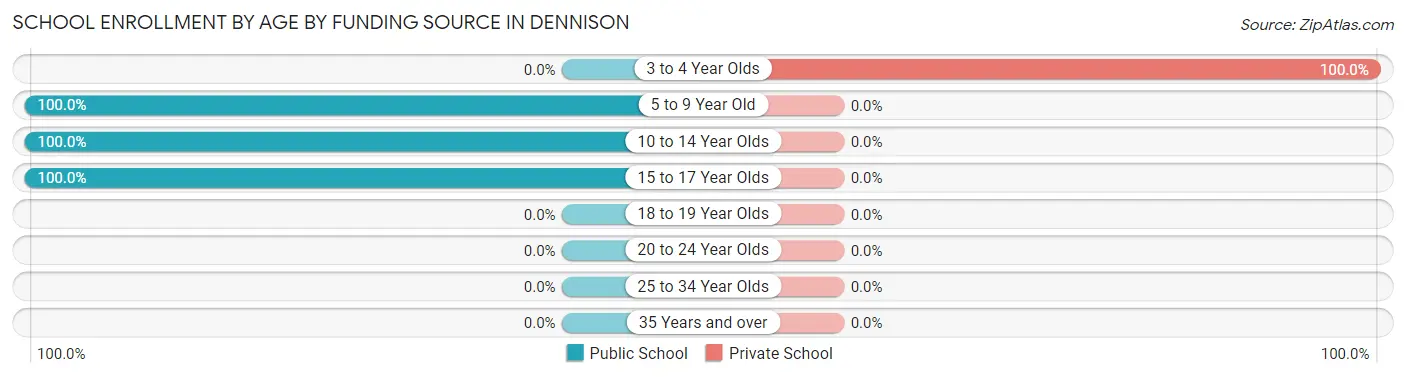
Out of a total of 41 students who are enrolled in schools in Dennison, 2 (4.9%) attend a private institution, while the remaining 39 (95.1%) are enrolled in public schools. The age group of 3 to 4 year olds has the highest likelihood of being enrolled in private schools, with 2 (100.0% in the age bracket) enrolled. Conversely, the age group of 5 to 9 year old has the lowest likelihood of being enrolled in a private school, with 21 (100.0% in the age bracket) attending a public institution.
| Age Bracket | Public School | Private School |
| 3 to 4 Year Olds | 0 (0.0%) | 2 (100.0%) |
| 5 to 9 Year Old | 21 (100.0%) | 0 (0.0%) |
| 10 to 14 Year Olds | 10 (100.0%) | 0 (0.0%) |
| 15 to 17 Year Olds | 8 (100.0%) | 0 (0.0%) |
| 18 to 19 Year Olds | 0 (0.0%) | 0 (0.0%) |
| 20 to 24 Year Olds | 0 (0.0%) | 0 (0.0%) |
| 25 to 34 Year Olds | 0 (0.0%) | 0 (0.0%) |
| 35 Years and over | 0 (0.0%) | 0 (0.0%) |
| Total | 39 (95.1%) | 2 (4.9%) |
Educational Attainment by Field of Study in Dennison
Arts & humanities (12 | 33.3%), bio, nature & agricultural (8 | 22.2%), business (6 | 16.7%), physical & health sciences (2 | 5.6%), and science & technology (2 | 5.6%) are the most common fields of study among 36 individuals in Dennison who have obtained a bachelor's degree or higher.
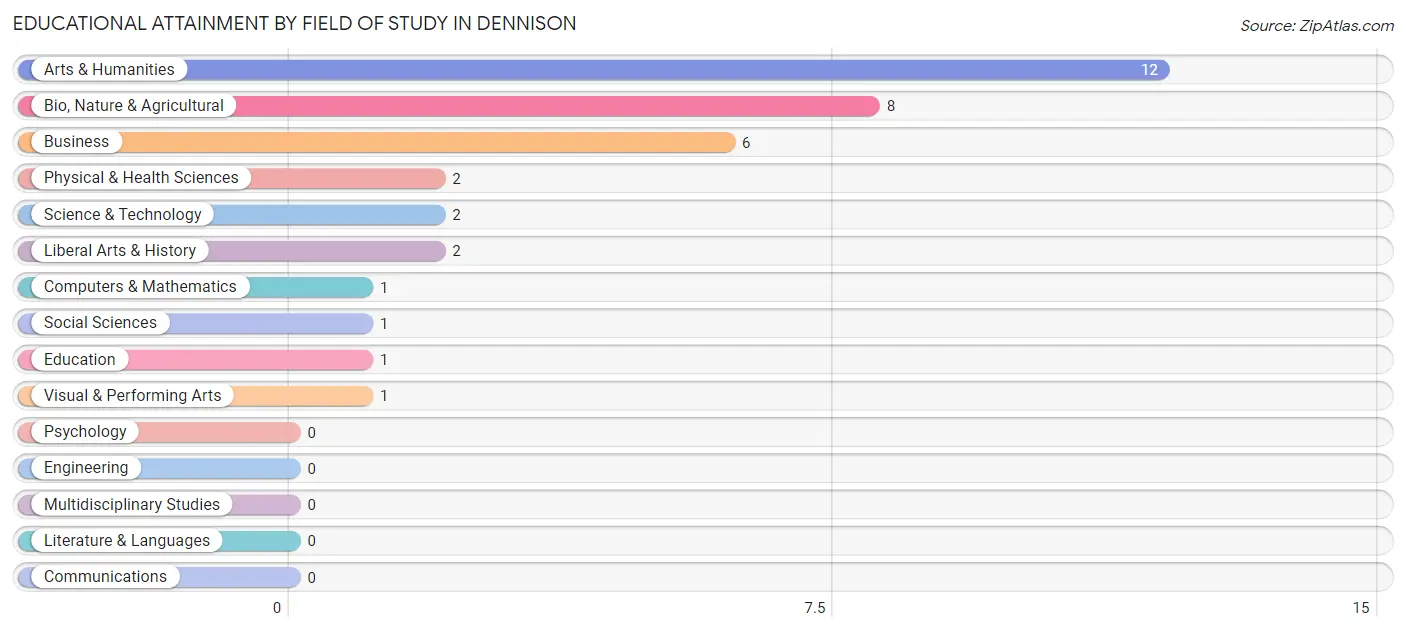
| Field of Study | # Graduates | % Graduates |
| Computers & Mathematics | 1 | 2.8% |
| Bio, Nature & Agricultural | 8 | 22.2% |
| Physical & Health Sciences | 2 | 5.6% |
| Psychology | 0 | 0.0% |
| Social Sciences | 1 | 2.8% |
| Engineering | 0 | 0.0% |
| Multidisciplinary Studies | 0 | 0.0% |
| Science & Technology | 2 | 5.6% |
| Business | 6 | 16.7% |
| Education | 1 | 2.8% |
| Literature & Languages | 0 | 0.0% |
| Liberal Arts & History | 2 | 5.6% |
| Visual & Performing Arts | 1 | 2.8% |
| Communications | 0 | 0.0% |
| Arts & Humanities | 12 | 33.3% |
| Total | 36 | 100.0% |
Transportation & Commute in Dennison
Vehicle Availability by Sex in Dennison
The most prevalent vehicle ownership categories in Dennison are males with 2 vehicles (27, accounting for 67.5%) and females with 2 vehicles (33, making up 47.4%).
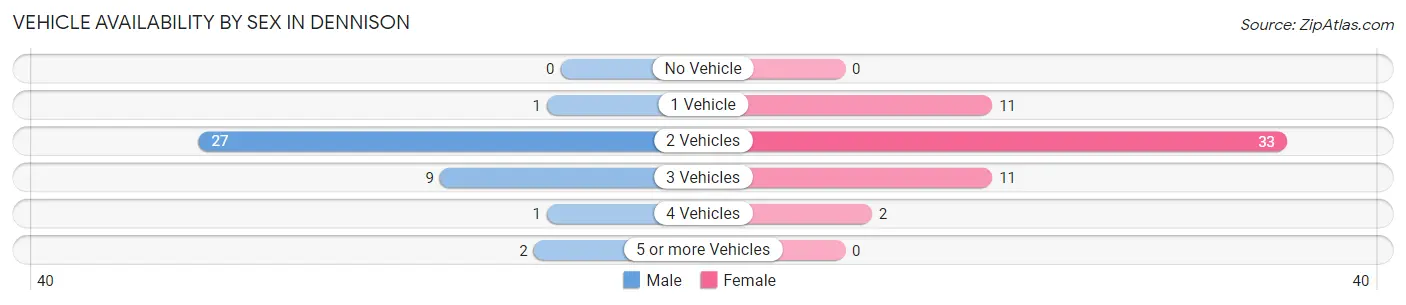
| Vehicles Available | Male | Female |
| No Vehicle | 0 (0.0%) | 0 (0.0%) |
| 1 Vehicle | 1 (2.5%) | 11 (19.3%) |
| 2 Vehicles | 27 (67.5%) | 33 (57.9%) |
| 3 Vehicles | 9 (22.5%) | 11 (19.3%) |
| 4 Vehicles | 1 (2.5%) | 2 (3.5%) |
| 5 or more Vehicles | 2 (5.0%) | 0 (0.0%) |
| Total | 40 (100.0%) | 57 (100.0%) |
Commute Time in Dennison
The most frequently occuring commute durations in Dennison are 15 to 19 minutes (26 commuters, 27.4%), 10 to 14 minutes (19 commuters, 20.0%), and 25 to 29 minutes (18 commuters, 19.0%).
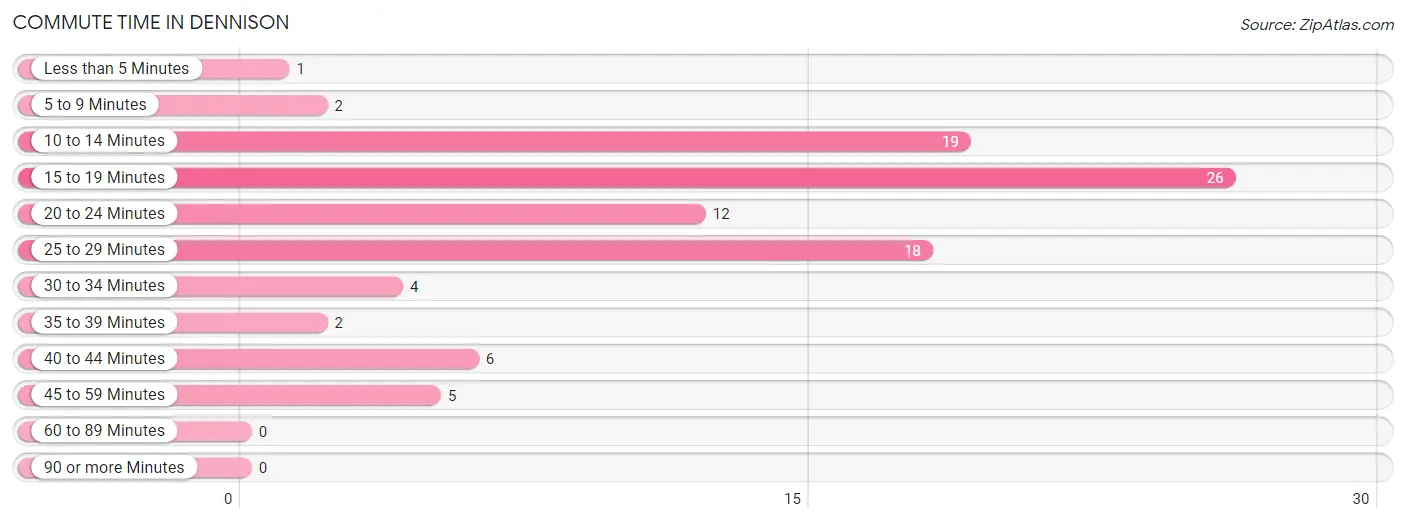
| Commute Time | # Commuters | % Commuters |
| Less than 5 Minutes | 1 | 1.1% |
| 5 to 9 Minutes | 2 | 2.1% |
| 10 to 14 Minutes | 19 | 20.0% |
| 15 to 19 Minutes | 26 | 27.4% |
| 20 to 24 Minutes | 12 | 12.6% |
| 25 to 29 Minutes | 18 | 19.0% |
| 30 to 34 Minutes | 4 | 4.2% |
| 35 to 39 Minutes | 2 | 2.1% |
| 40 to 44 Minutes | 6 | 6.3% |
| 45 to 59 Minutes | 5 | 5.3% |
| 60 to 89 Minutes | 0 | 0.0% |
| 90 or more Minutes | 0 | 0.0% |
Commute Time by Sex in Dennison
The most common commute times in Dennison are 15 to 19 minutes (18 commuters, 45.0%) for males and 10 to 14 minutes (15 commuters, 27.3%) for females.
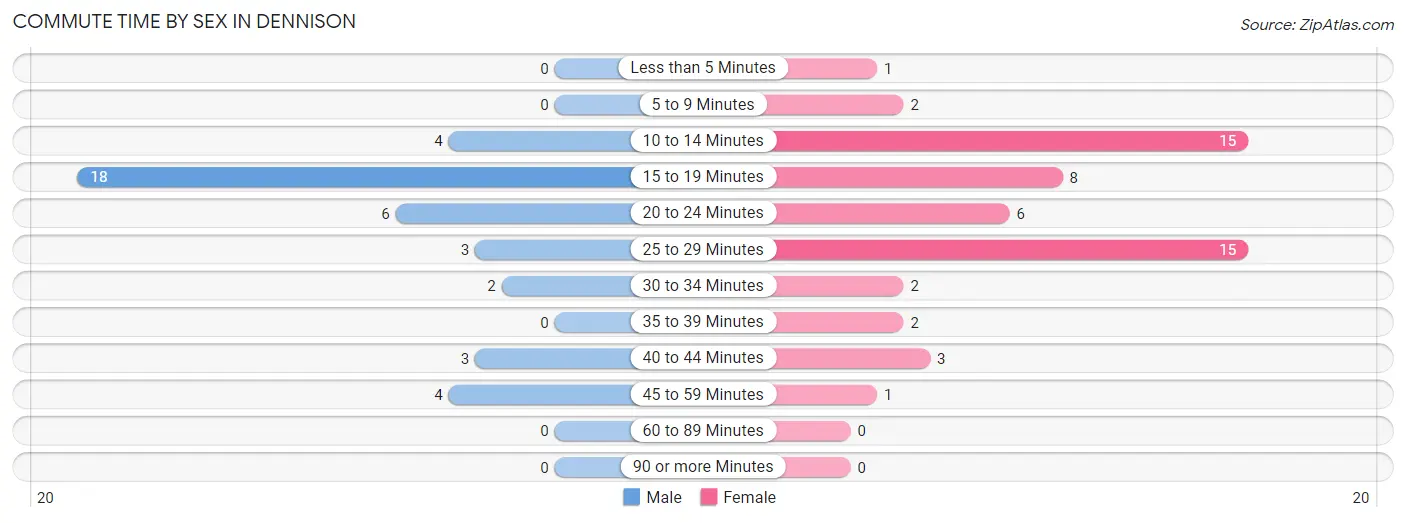
| Commute Time | Male | Female |
| Less than 5 Minutes | 0 (0.0%) | 1 (1.8%) |
| 5 to 9 Minutes | 0 (0.0%) | 2 (3.6%) |
| 10 to 14 Minutes | 4 (10.0%) | 15 (27.3%) |
| 15 to 19 Minutes | 18 (45.0%) | 8 (14.5%) |
| 20 to 24 Minutes | 6 (15.0%) | 6 (10.9%) |
| 25 to 29 Minutes | 3 (7.5%) | 15 (27.3%) |
| 30 to 34 Minutes | 2 (5.0%) | 2 (3.6%) |
| 35 to 39 Minutes | 0 (0.0%) | 2 (3.6%) |
| 40 to 44 Minutes | 3 (7.5%) | 3 (5.4%) |
| 45 to 59 Minutes | 4 (10.0%) | 1 (1.8%) |
| 60 to 89 Minutes | 0 (0.0%) | 0 (0.0%) |
| 90 or more Minutes | 0 (0.0%) | 0 (0.0%) |
Time of Departure to Work by Sex in Dennison
The most frequent times of departure to work in Dennison are 5:30 AM to 5:59 AM (12, 30.0%) for males and 7:30 AM to 7:59 AM (22, 40.0%) for females.
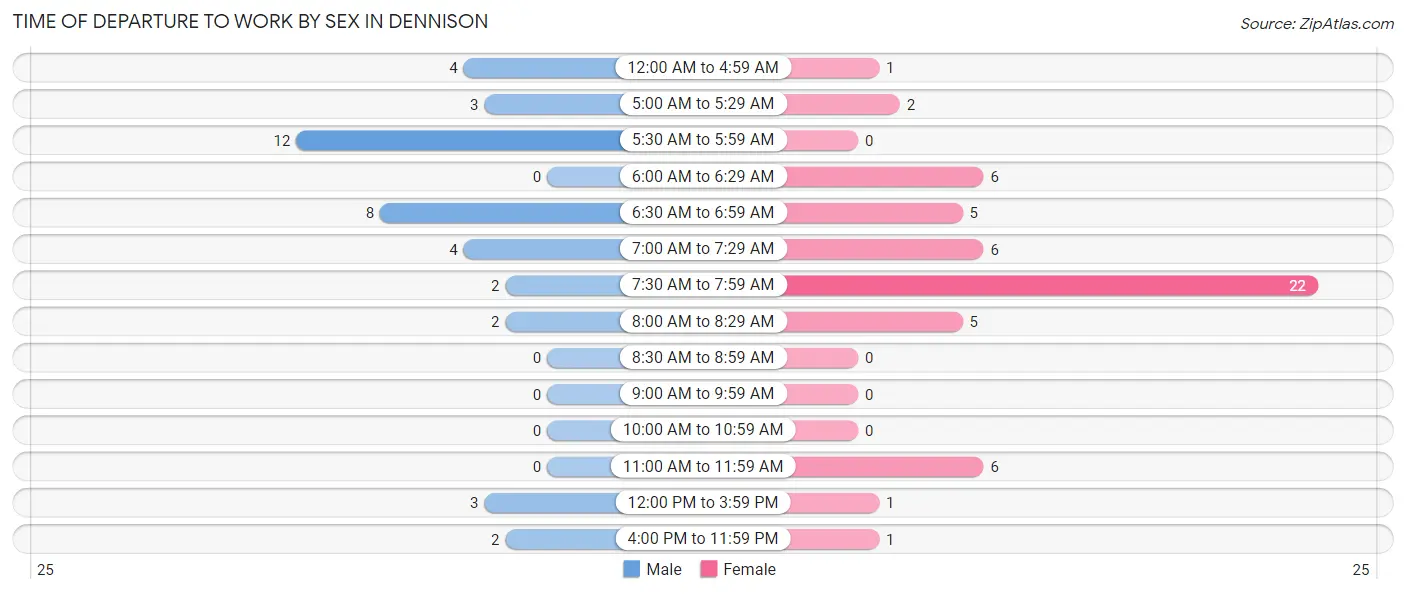
| Time of Departure | Male | Female |
| 12:00 AM to 4:59 AM | 4 (10.0%) | 1 (1.8%) |
| 5:00 AM to 5:29 AM | 3 (7.5%) | 2 (3.6%) |
| 5:30 AM to 5:59 AM | 12 (30.0%) | 0 (0.0%) |
| 6:00 AM to 6:29 AM | 0 (0.0%) | 6 (10.9%) |
| 6:30 AM to 6:59 AM | 8 (20.0%) | 5 (9.1%) |
| 7:00 AM to 7:29 AM | 4 (10.0%) | 6 (10.9%) |
| 7:30 AM to 7:59 AM | 2 (5.0%) | 22 (40.0%) |
| 8:00 AM to 8:29 AM | 2 (5.0%) | 5 (9.1%) |
| 8:30 AM to 8:59 AM | 0 (0.0%) | 0 (0.0%) |
| 9:00 AM to 9:59 AM | 0 (0.0%) | 0 (0.0%) |
| 10:00 AM to 10:59 AM | 0 (0.0%) | 0 (0.0%) |
| 11:00 AM to 11:59 AM | 0 (0.0%) | 6 (10.9%) |
| 12:00 PM to 3:59 PM | 3 (7.5%) | 1 (1.8%) |
| 4:00 PM to 11:59 PM | 2 (5.0%) | 1 (1.8%) |
| Total | 40 (100.0%) | 55 (100.0%) |
Housing Occupancy in Dennison
Occupancy by Ownership in Dennison
Of the total 95 dwellings in Dennison, owner-occupied units account for 69 (72.6%), while renter-occupied units make up 26 (27.4%).
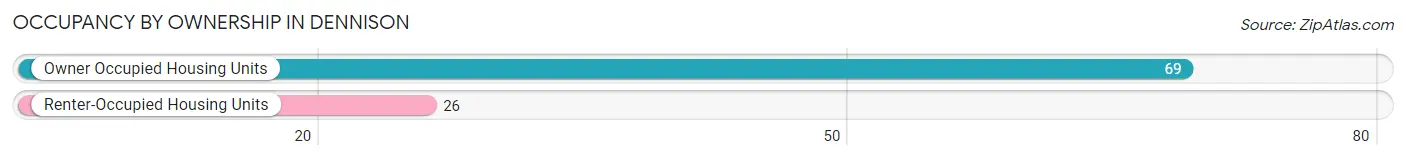
| Occupancy | # Housing Units | % Housing Units |
| Owner Occupied Housing Units | 69 | 72.6% |
| Renter-Occupied Housing Units | 26 | 27.4% |
| Total Occupied Housing Units | 95 | 100.0% |
Occupancy by Household Size in Dennison
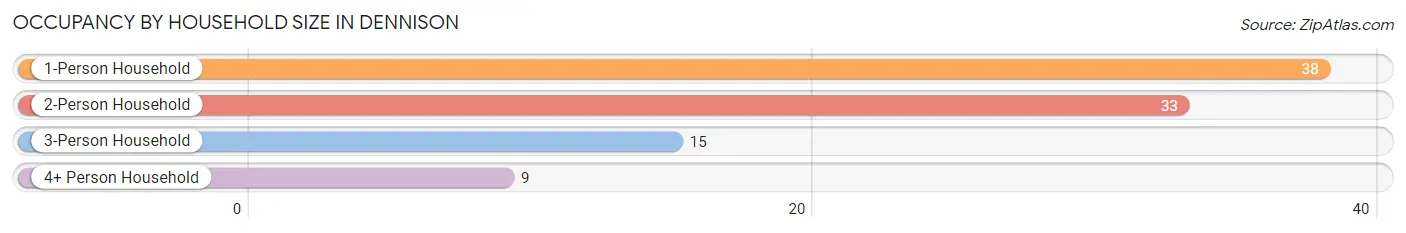
| Household Size | # Housing Units | % Housing Units |
| 1-Person Household | 38 | 40.0% |
| 2-Person Household | 33 | 34.7% |
| 3-Person Household | 15 | 15.8% |
| 4+ Person Household | 9 | 9.5% |
| Total Housing Units | 95 | 100.0% |
Occupancy by Ownership by Household Size in Dennison
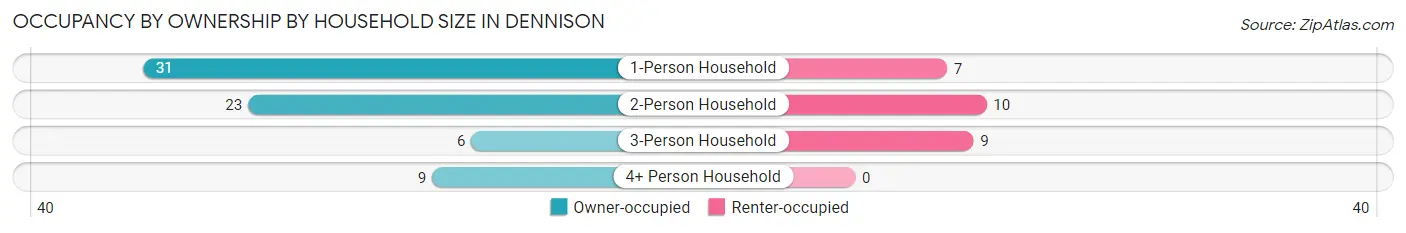
| Household Size | Owner-occupied | Renter-occupied |
| 1-Person Household | 31 (81.6%) | 7 (18.4%) |
| 2-Person Household | 23 (69.7%) | 10 (30.3%) |
| 3-Person Household | 6 (40.0%) | 9 (60.0%) |
| 4+ Person Household | 9 (100.0%) | 0 (0.0%) |
| Total Housing Units | 69 (72.6%) | 26 (27.4%) |
Occupancy by Educational Attainment in Dennison
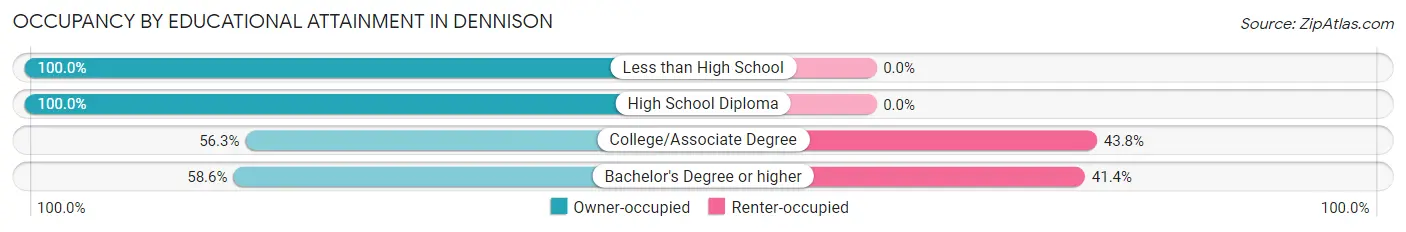
| Household Size | Owner-occupied | Renter-occupied |
| Less than High School | 12 (100.0%) | 0 (0.0%) |
| High School Diploma | 22 (100.0%) | 0 (0.0%) |
| College/Associate Degree | 18 (56.2%) | 14 (43.8%) |
| Bachelor's Degree or higher | 17 (58.6%) | 12 (41.4%) |
Occupancy by Age of Householder in Dennison
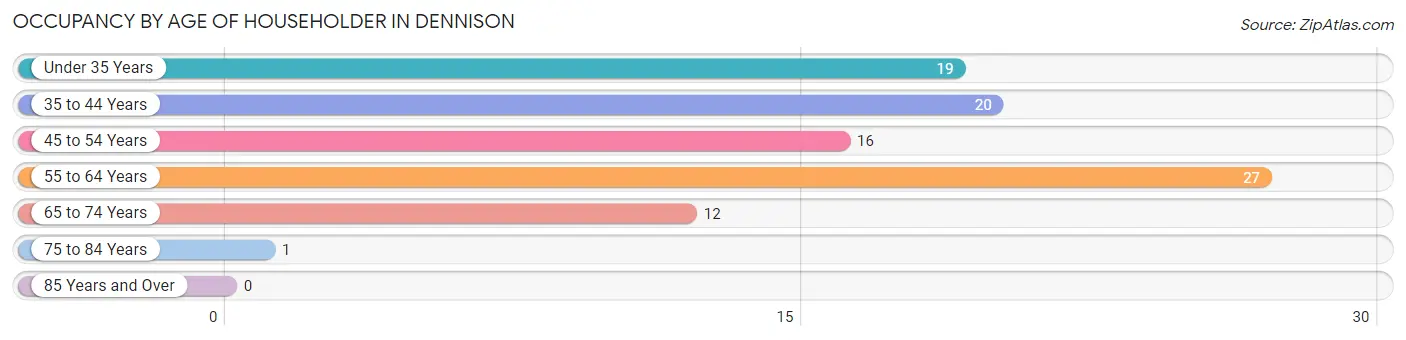
| Age Bracket | # Households | % Households |
| Under 35 Years | 19 | 20.0% |
| 35 to 44 Years | 20 | 21.0% |
| 45 to 54 Years | 16 | 16.8% |
| 55 to 64 Years | 27 | 28.4% |
| 65 to 74 Years | 12 | 12.6% |
| 75 to 84 Years | 1 | 1.1% |
| 85 Years and Over | 0 | 0.0% |
| Total | 95 | 100.0% |
Housing Finances in Dennison
Median Income by Occupancy in Dennison
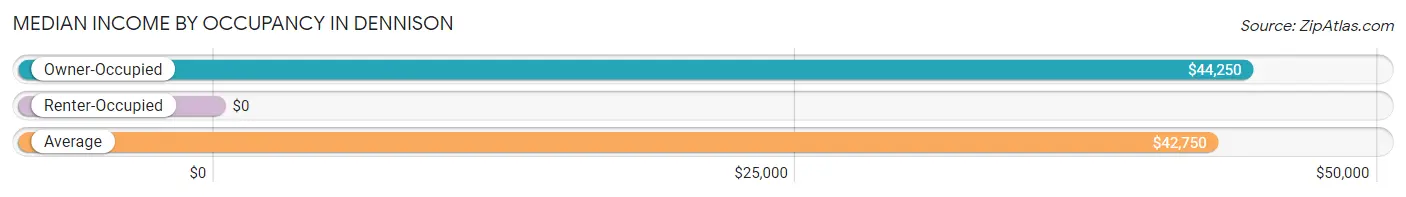
| Occupancy Type | # Households | Median Income |
| Owner-Occupied | 69 (72.6%) | $44,250 |
| Renter-Occupied | 26 (27.4%) | $0 |
| Average | 95 (100.0%) | $42,750 |
Occupancy by Householder Income Bracket in Dennison
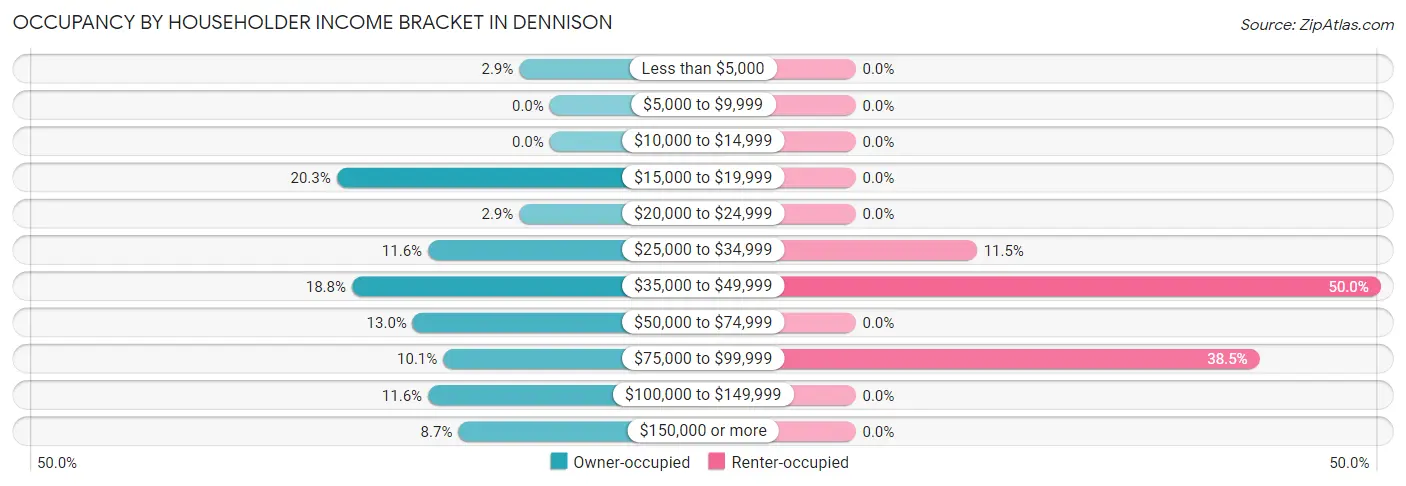
| Income Bracket | Owner-occupied | Renter-occupied |
| Less than $5,000 | 2 (2.9%) | 0 (0.0%) |
| $5,000 to $9,999 | 0 (0.0%) | 0 (0.0%) |
| $10,000 to $14,999 | 0 (0.0%) | 0 (0.0%) |
| $15,000 to $19,999 | 14 (20.3%) | 0 (0.0%) |
| $20,000 to $24,999 | 2 (2.9%) | 0 (0.0%) |
| $25,000 to $34,999 | 8 (11.6%) | 3 (11.5%) |
| $35,000 to $49,999 | 13 (18.8%) | 13 (50.0%) |
| $50,000 to $74,999 | 9 (13.0%) | 0 (0.0%) |
| $75,000 to $99,999 | 7 (10.1%) | 10 (38.5%) |
| $100,000 to $149,999 | 8 (11.6%) | 0 (0.0%) |
| $150,000 or more | 6 (8.7%) | 0 (0.0%) |
| Total | 69 (100.0%) | 26 (100.0%) |
Monthly Housing Cost Tiers in Dennison
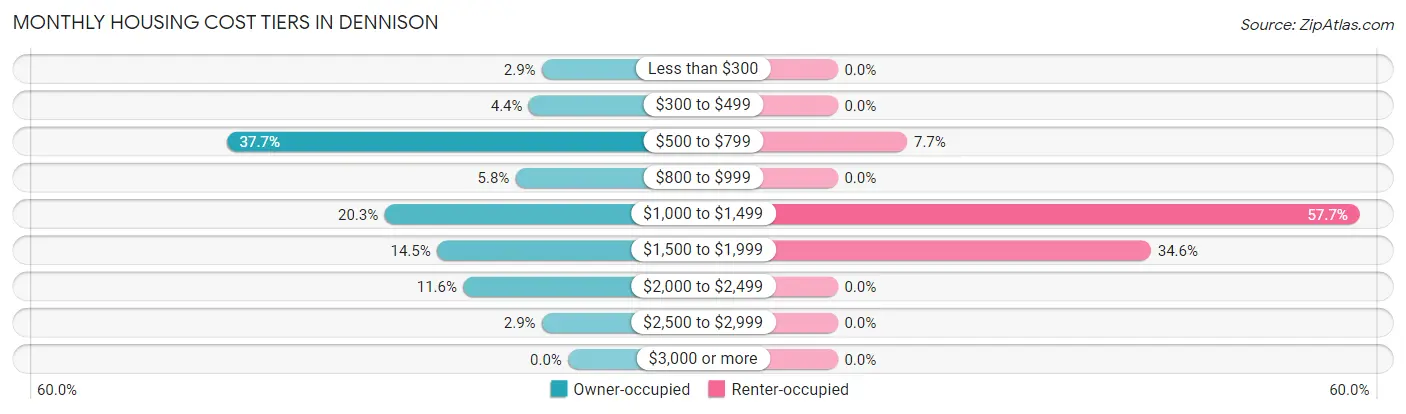
| Monthly Cost | Owner-occupied | Renter-occupied |
| Less than $300 | 2 (2.9%) | 0 (0.0%) |
| $300 to $499 | 3 (4.3%) | 0 (0.0%) |
| $500 to $799 | 26 (37.7%) | 2 (7.7%) |
| $800 to $999 | 4 (5.8%) | 0 (0.0%) |
| $1,000 to $1,499 | 14 (20.3%) | 15 (57.7%) |
| $1,500 to $1,999 | 10 (14.5%) | 9 (34.6%) |
| $2,000 to $2,499 | 8 (11.6%) | 0 (0.0%) |
| $2,500 to $2,999 | 2 (2.9%) | 0 (0.0%) |
| $3,000 or more | 0 (0.0%) | 0 (0.0%) |
| Total | 69 (100.0%) | 26 (100.0%) |
Physical Housing Characteristics in Dennison
Housing Structures in Dennison
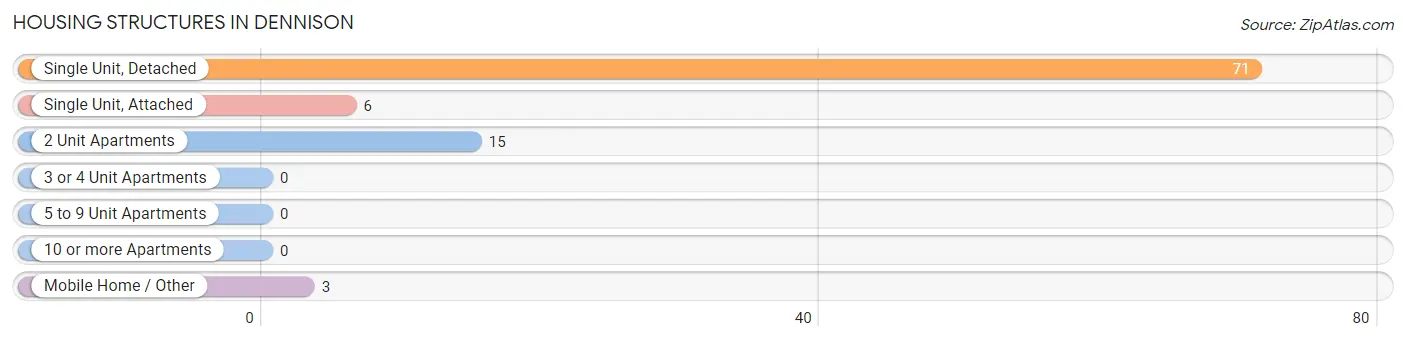
| Structure Type | # Housing Units | % Housing Units |
| Single Unit, Detached | 71 | 74.7% |
| Single Unit, Attached | 6 | 6.3% |
| 2 Unit Apartments | 15 | 15.8% |
| 3 or 4 Unit Apartments | 0 | 0.0% |
| 5 to 9 Unit Apartments | 0 | 0.0% |
| 10 or more Apartments | 0 | 0.0% |
| Mobile Home / Other | 3 | 3.2% |
| Total | 95 | 100.0% |
Housing Structures by Occupancy in Dennison
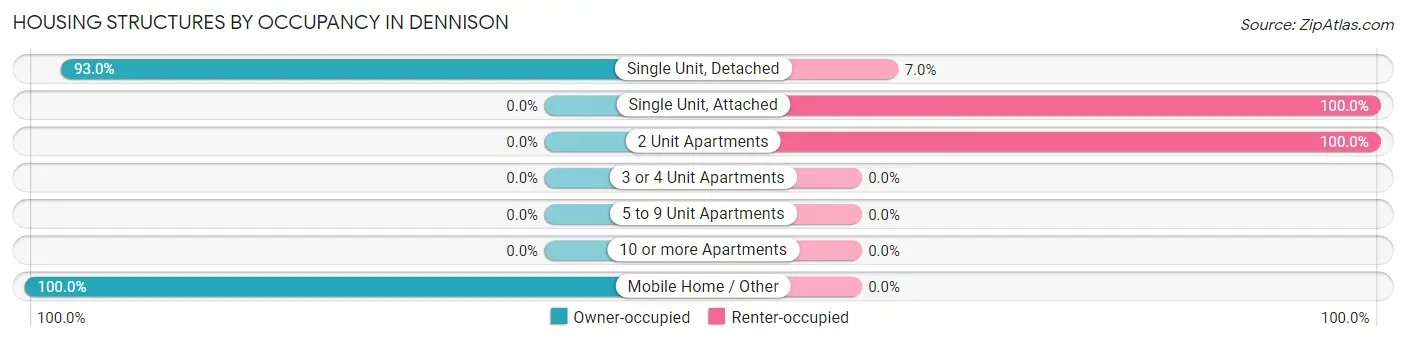
| Structure Type | Owner-occupied | Renter-occupied |
| Single Unit, Detached | 66 (93.0%) | 5 (7.0%) |
| Single Unit, Attached | 0 (0.0%) | 6 (100.0%) |
| 2 Unit Apartments | 0 (0.0%) | 15 (100.0%) |
| 3 or 4 Unit Apartments | 0 (0.0%) | 0 (0.0%) |
| 5 to 9 Unit Apartments | 0 (0.0%) | 0 (0.0%) |
| 10 or more Apartments | 0 (0.0%) | 0 (0.0%) |
| Mobile Home / Other | 3 (100.0%) | 0 (0.0%) |
| Total | 69 (72.6%) | 26 (27.4%) |
Housing Structures by Number of Rooms in Dennison
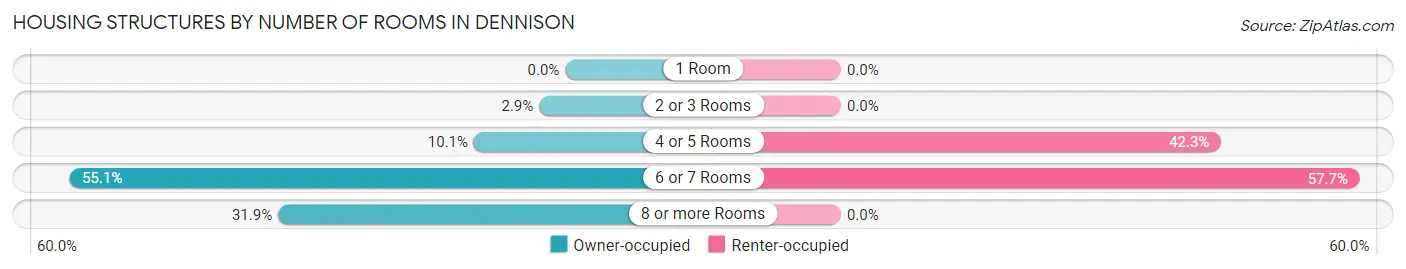
| Number of Rooms | Owner-occupied | Renter-occupied |
| 1 Room | 0 (0.0%) | 0 (0.0%) |
| 2 or 3 Rooms | 2 (2.9%) | 0 (0.0%) |
| 4 or 5 Rooms | 7 (10.1%) | 11 (42.3%) |
| 6 or 7 Rooms | 38 (55.1%) | 15 (57.7%) |
| 8 or more Rooms | 22 (31.9%) | 0 (0.0%) |
| Total | 69 (100.0%) | 26 (100.0%) |
Housing Structure by Heating Type in Dennison
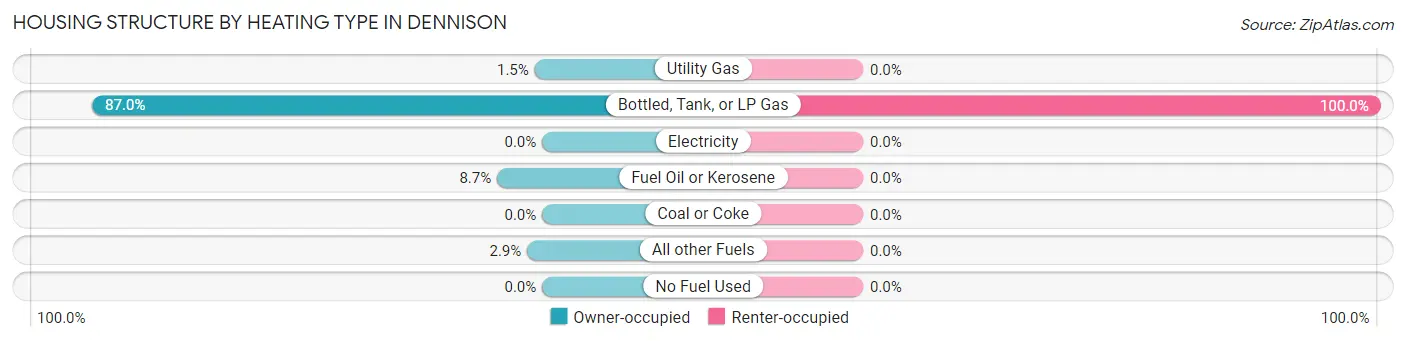
| Heating Type | Owner-occupied | Renter-occupied |
| Utility Gas | 1 (1.5%) | 0 (0.0%) |
| Bottled, Tank, or LP Gas | 60 (87.0%) | 26 (100.0%) |
| Electricity | 0 (0.0%) | 0 (0.0%) |
| Fuel Oil or Kerosene | 6 (8.7%) | 0 (0.0%) |
| Coal or Coke | 0 (0.0%) | 0 (0.0%) |
| All other Fuels | 2 (2.9%) | 0 (0.0%) |
| No Fuel Used | 0 (0.0%) | 0 (0.0%) |
| Total | 69 (100.0%) | 26 (100.0%) |
Household Vehicle Usage in Dennison
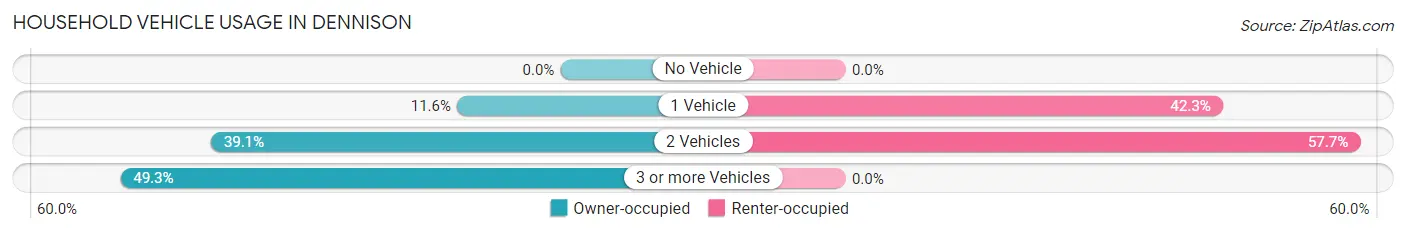
| Vehicles per Household | Owner-occupied | Renter-occupied |
| No Vehicle | 0 (0.0%) | 0 (0.0%) |
| 1 Vehicle | 8 (11.6%) | 11 (42.3%) |
| 2 Vehicles | 27 (39.1%) | 15 (57.7%) |
| 3 or more Vehicles | 34 (49.3%) | 0 (0.0%) |
| Total | 69 (100.0%) | 26 (100.0%) |
Real Estate & Mortgages in Dennison
Real Estate and Mortgage Overview in Dennison
| Characteristic | Without Mortgage | With Mortgage |
| Housing Units | 31 | 38 |
| Median Property Value | $201,800 | $215,600 |
| Median Household Income | - | - |
| Monthly Housing Costs | $555 | $0 |
| Real Estate Taxes | $2,432 | $0 |
Property Value by Mortgage Status in Dennison
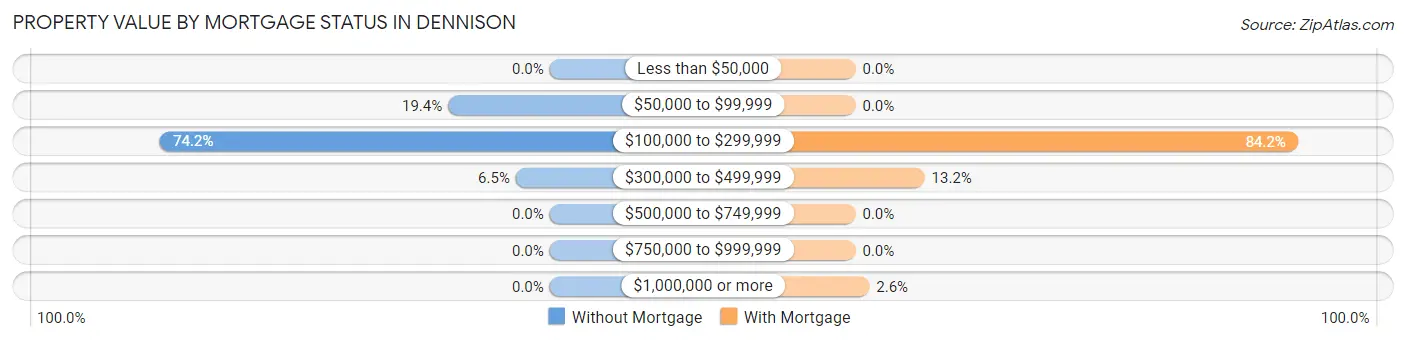
| Property Value | Without Mortgage | With Mortgage |
| Less than $50,000 | 0 (0.0%) | 0 (0.0%) |
| $50,000 to $99,999 | 6 (19.4%) | 0 (0.0%) |
| $100,000 to $299,999 | 23 (74.2%) | 32 (84.2%) |
| $300,000 to $499,999 | 2 (6.5%) | 5 (13.2%) |
| $500,000 to $749,999 | 0 (0.0%) | 0 (0.0%) |
| $750,000 to $999,999 | 0 (0.0%) | 0 (0.0%) |
| $1,000,000 or more | 0 (0.0%) | 1 (2.6%) |
| Total | 31 (100.0%) | 38 (100.0%) |
Household Income by Mortgage Status in Dennison
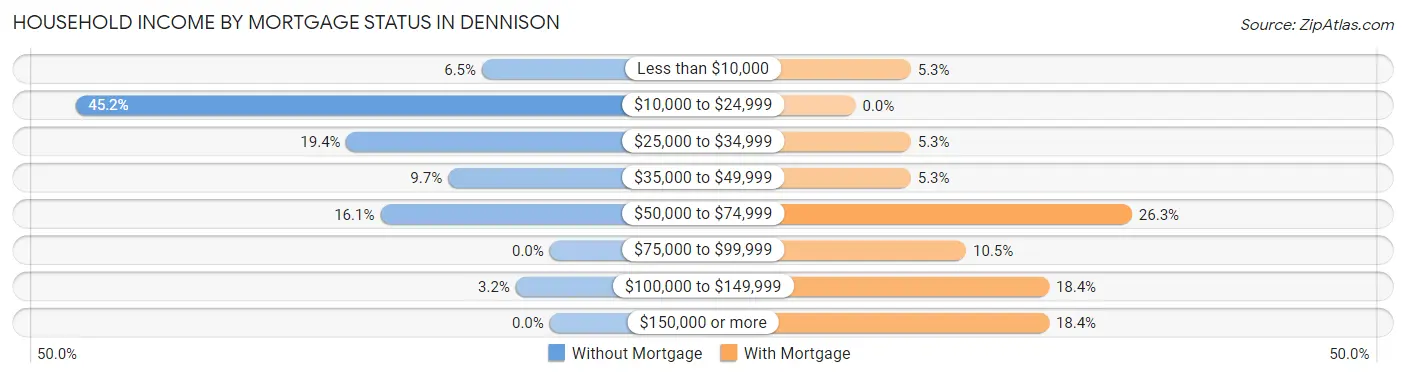
| Household Income | Without Mortgage | With Mortgage |
| Less than $10,000 | 2 (6.5%) | 2 (5.3%) |
| $10,000 to $24,999 | 14 (45.2%) | 0 (0.0%) |
| $25,000 to $34,999 | 6 (19.4%) | 2 (5.3%) |
| $35,000 to $49,999 | 3 (9.7%) | 2 (5.3%) |
| $50,000 to $74,999 | 5 (16.1%) | 10 (26.3%) |
| $75,000 to $99,999 | 0 (0.0%) | 4 (10.5%) |
| $100,000 to $149,999 | 1 (3.2%) | 7 (18.4%) |
| $150,000 or more | 0 (0.0%) | 7 (18.4%) |
| Total | 31 (100.0%) | 38 (100.0%) |
Property Value to Household Income Ratio in Dennison
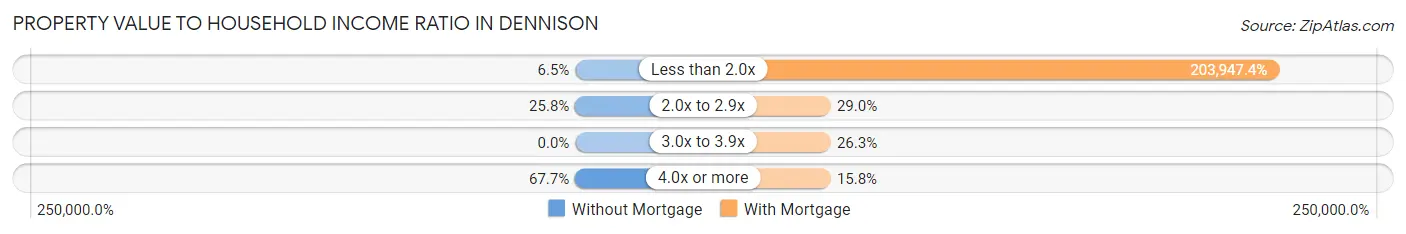
| Value-to-Income Ratio | Without Mortgage | With Mortgage |
| Less than 2.0x | 2 (6.5%) | 77,500 (203,947.4%) |
| 2.0x to 2.9x | 8 (25.8%) | 11 (28.9%) |
| 3.0x to 3.9x | 0 (0.0%) | 10 (26.3%) |
| 4.0x or more | 21 (67.7%) | 6 (15.8%) |
| Total | 31 (100.0%) | 38 (100.0%) |
Real Estate Taxes by Mortgage Status in Dennison
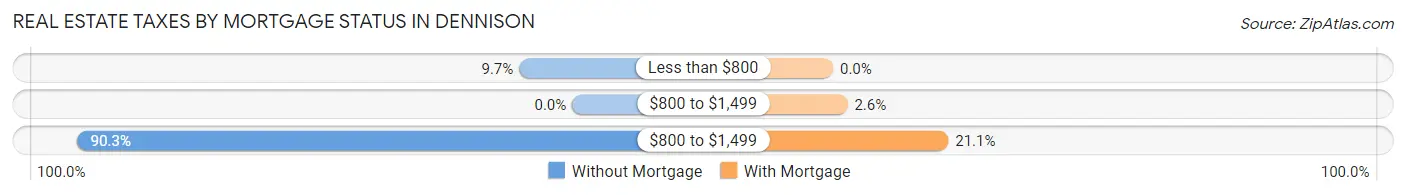
| Property Taxes | Without Mortgage | With Mortgage |
| Less than $800 | 3 (9.7%) | 0 (0.0%) |
| $800 to $1,499 | 0 (0.0%) | 1 (2.6%) |
| $800 to $1,499 | 28 (90.3%) | 8 (21.0%) |
| Total | 31 (100.0%) | 38 (100.0%) |
Health & Disability in Dennison
Health Insurance Coverage by Age in Dennison
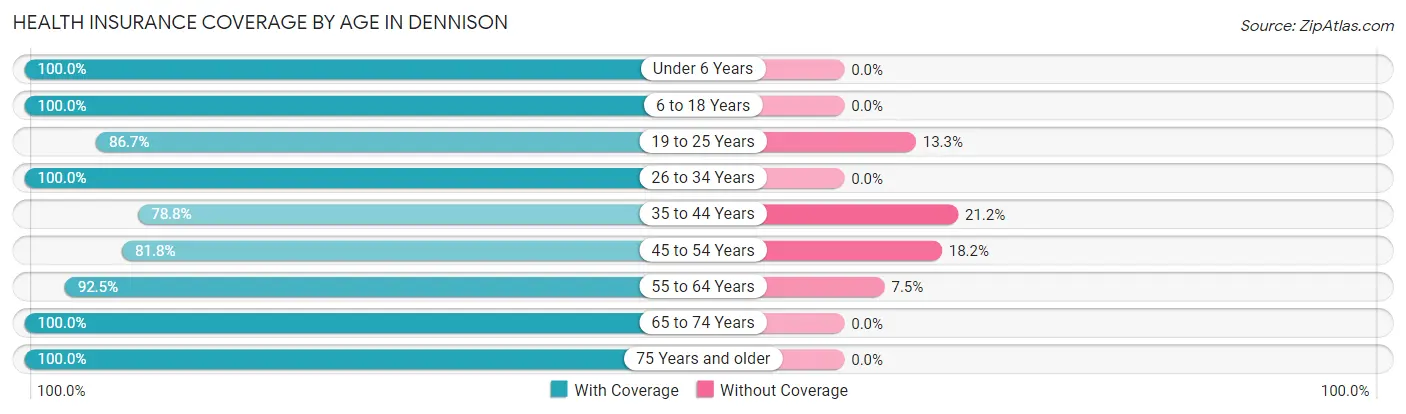
| Age Bracket | With Coverage | Without Coverage |
| Under 6 Years | 19 (100.0%) | 0 (0.0%) |
| 6 to 18 Years | 32 (100.0%) | 0 (0.0%) |
| 19 to 25 Years | 13 (86.7%) | 2 (13.3%) |
| 26 to 34 Years | 31 (100.0%) | 0 (0.0%) |
| 35 to 44 Years | 26 (78.8%) | 7 (21.2%) |
| 45 to 54 Years | 18 (81.8%) | 4 (18.2%) |
| 55 to 64 Years | 37 (92.5%) | 3 (7.5%) |
| 65 to 74 Years | 17 (100.0%) | 0 (0.0%) |
| 75 Years and older | 2 (100.0%) | 0 (0.0%) |
| Total | 195 (92.4%) | 16 (7.6%) |
Health Insurance Coverage by Citizenship Status in Dennison
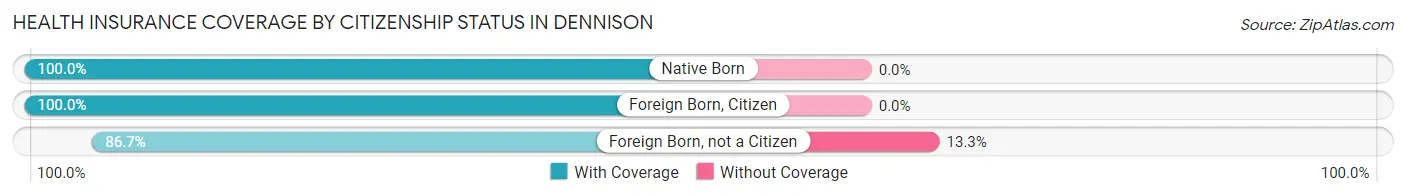
| Citizenship Status | With Coverage | Without Coverage |
| Native Born | 19 (100.0%) | 0 (0.0%) |
| Foreign Born, Citizen | 32 (100.0%) | 0 (0.0%) |
| Foreign Born, not a Citizen | 13 (86.7%) | 2 (13.3%) |
Health Insurance Coverage by Household Income in Dennison
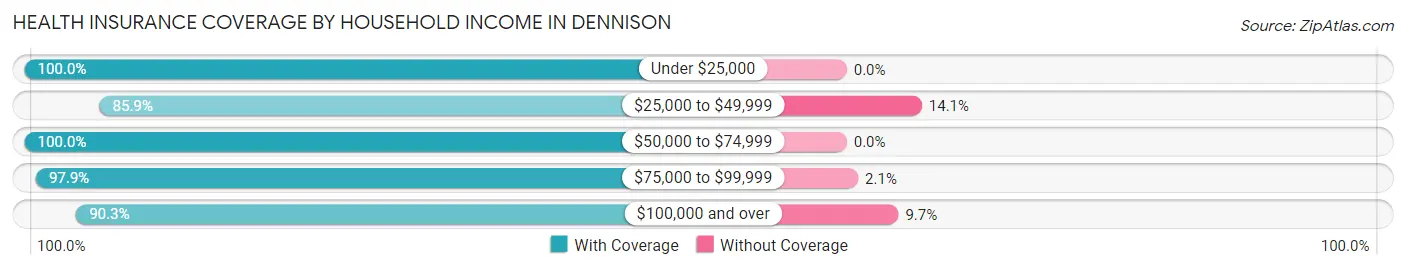
| Household Income | With Coverage | Without Coverage |
| Under $25,000 | 19 (100.0%) | 0 (0.0%) |
| $25,000 to $49,999 | 55 (85.9%) | 9 (14.1%) |
| $50,000 to $74,999 | 19 (100.0%) | 0 (0.0%) |
| $75,000 to $99,999 | 46 (97.9%) | 1 (2.1%) |
| $100,000 and over | 56 (90.3%) | 6 (9.7%) |
Public vs Private Health Insurance Coverage by Age in Dennison
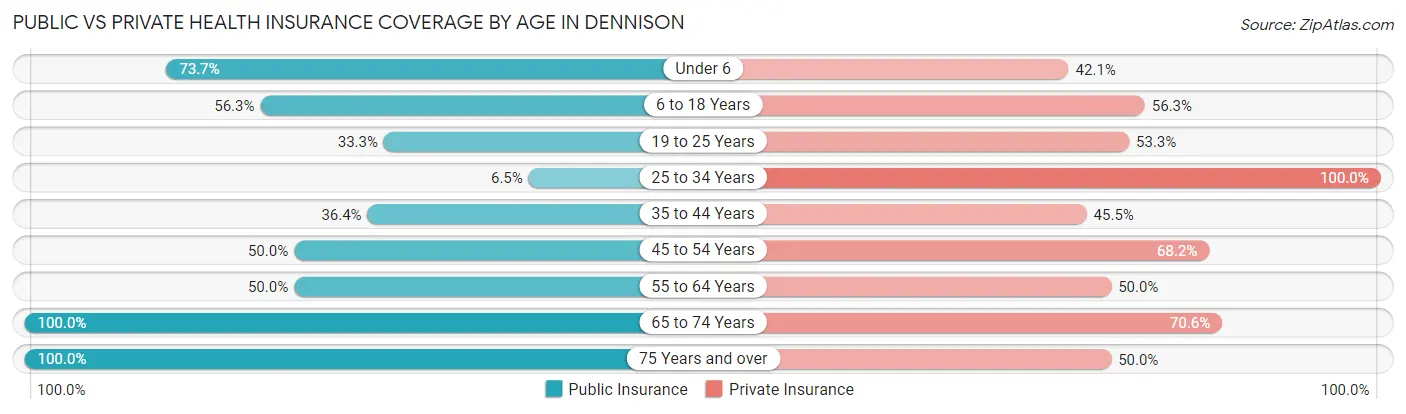
| Age Bracket | Public Insurance | Private Insurance |
| Under 6 | 14 (73.7%) | 8 (42.1%) |
| 6 to 18 Years | 18 (56.2%) | 18 (56.2%) |
| 19 to 25 Years | 5 (33.3%) | 8 (53.3%) |
| 25 to 34 Years | 2 (6.5%) | 31 (100.0%) |
| 35 to 44 Years | 12 (36.4%) | 15 (45.5%) |
| 45 to 54 Years | 11 (50.0%) | 15 (68.2%) |
| 55 to 64 Years | 20 (50.0%) | 20 (50.0%) |
| 65 to 74 Years | 17 (100.0%) | 12 (70.6%) |
| 75 Years and over | 2 (100.0%) | 1 (50.0%) |
| Total | 101 (47.9%) | 128 (60.7%) |
Disability Status by Sex by Age in Dennison
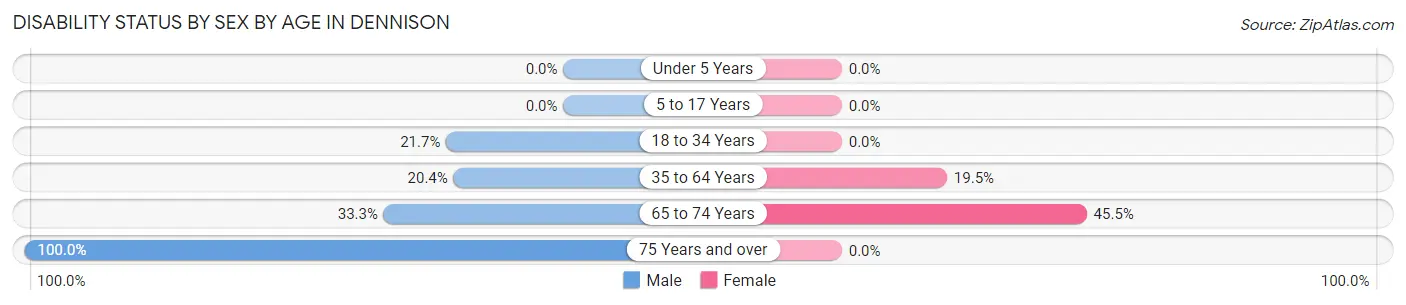
| Age Bracket | Male | Female |
| Under 5 Years | 0 (0.0%) | 0 (0.0%) |
| 5 to 17 Years | 0 (0.0%) | 0 (0.0%) |
| 18 to 34 Years | 5 (21.7%) | 0 (0.0%) |
| 35 to 64 Years | 11 (20.4%) | 8 (19.5%) |
| 65 to 74 Years | 2 (33.3%) | 5 (45.5%) |
| 75 Years and over | 1 (100.0%) | 0 (0.0%) |
Disability Class by Sex by Age in Dennison
Disability Class: Hearing Difficulty
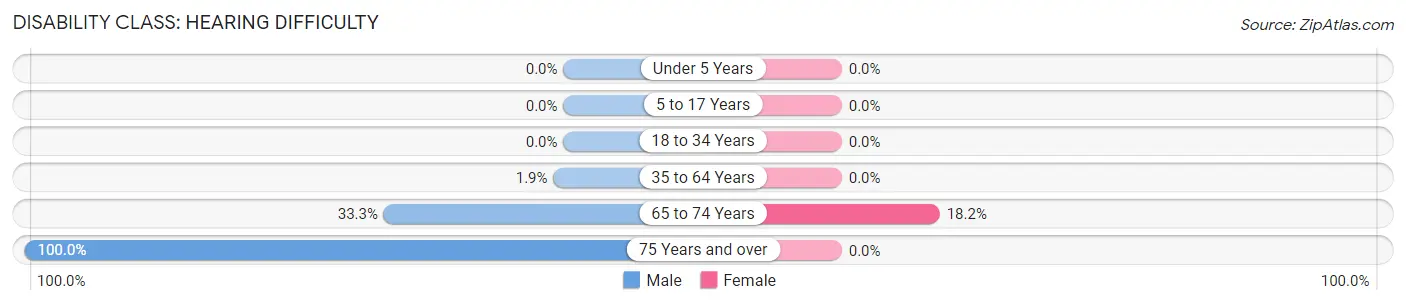
| Age Bracket | Male | Female |
| Under 5 Years | 0 (0.0%) | 0 (0.0%) |
| 5 to 17 Years | 0 (0.0%) | 0 (0.0%) |
| 18 to 34 Years | 0 (0.0%) | 0 (0.0%) |
| 35 to 64 Years | 1 (1.8%) | 0 (0.0%) |
| 65 to 74 Years | 2 (33.3%) | 2 (18.2%) |
| 75 Years and over | 1 (100.0%) | 0 (0.0%) |
Disability Class: Vision Difficulty
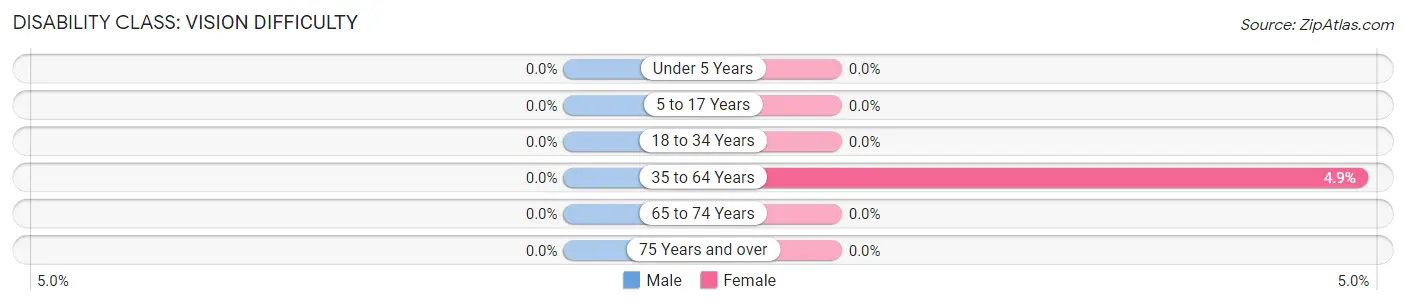
| Age Bracket | Male | Female |
| Under 5 Years | 0 (0.0%) | 0 (0.0%) |
| 5 to 17 Years | 0 (0.0%) | 0 (0.0%) |
| 18 to 34 Years | 0 (0.0%) | 0 (0.0%) |
| 35 to 64 Years | 0 (0.0%) | 2 (4.9%) |
| 65 to 74 Years | 0 (0.0%) | 0 (0.0%) |
| 75 Years and over | 0 (0.0%) | 0 (0.0%) |
Disability Class: Cognitive Difficulty
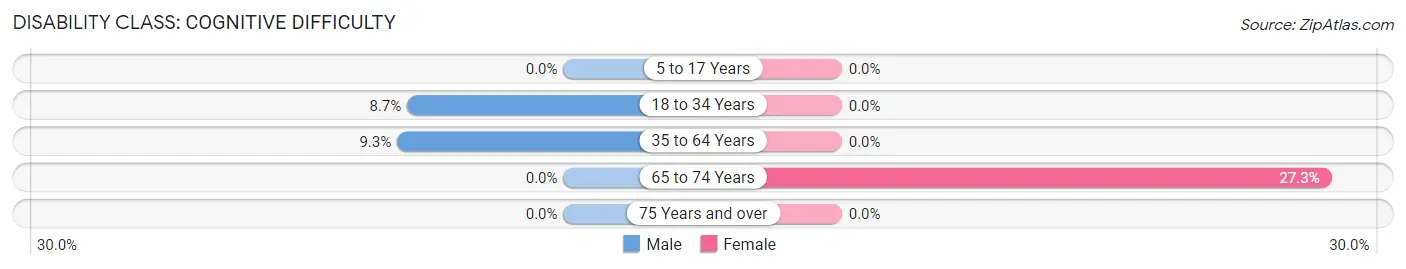
| Age Bracket | Male | Female |
| 5 to 17 Years | 0 (0.0%) | 0 (0.0%) |
| 18 to 34 Years | 2 (8.7%) | 0 (0.0%) |
| 35 to 64 Years | 5 (9.3%) | 0 (0.0%) |
| 65 to 74 Years | 0 (0.0%) | 3 (27.3%) |
| 75 Years and over | 0 (0.0%) | 0 (0.0%) |
Disability Class: Ambulatory Difficulty
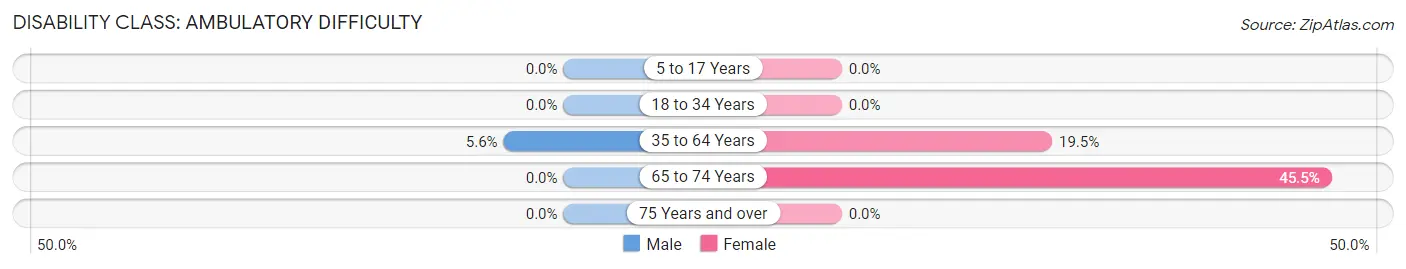
| Age Bracket | Male | Female |
| 5 to 17 Years | 0 (0.0%) | 0 (0.0%) |
| 18 to 34 Years | 0 (0.0%) | 0 (0.0%) |
| 35 to 64 Years | 3 (5.6%) | 8 (19.5%) |
| 65 to 74 Years | 0 (0.0%) | 5 (45.5%) |
| 75 Years and over | 0 (0.0%) | 0 (0.0%) |
Disability Class: Self-Care Difficulty
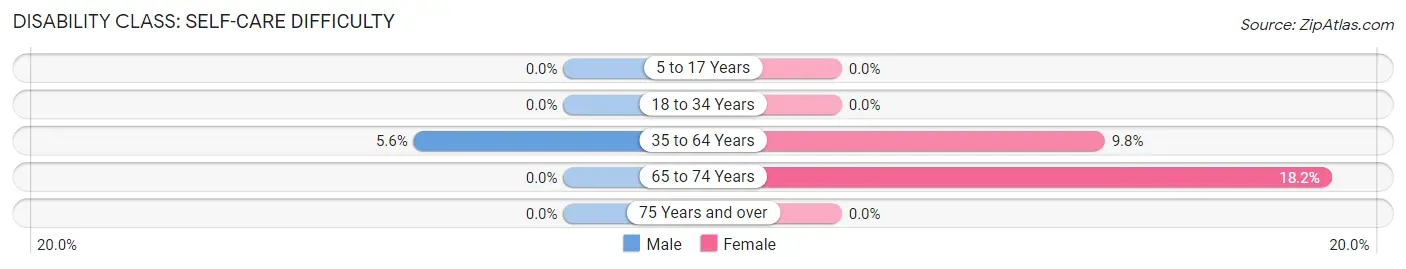
| Age Bracket | Male | Female |
| 5 to 17 Years | 0 (0.0%) | 0 (0.0%) |
| 18 to 34 Years | 0 (0.0%) | 0 (0.0%) |
| 35 to 64 Years | 3 (5.6%) | 4 (9.8%) |
| 65 to 74 Years | 0 (0.0%) | 2 (18.2%) |
| 75 Years and over | 0 (0.0%) | 0 (0.0%) |
Technology Access in Dennison
Computing Device Access in Dennison
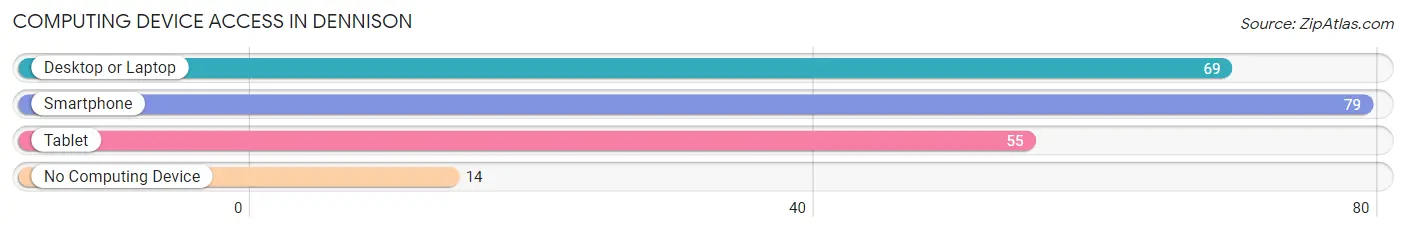
| Device Type | # Households | % Households |
| Desktop or Laptop | 69 | 72.6% |
| Smartphone | 79 | 83.2% |
| Tablet | 55 | 57.9% |
| No Computing Device | 14 | 14.7% |
| Total | 95 | 100.0% |
Internet Access in Dennison
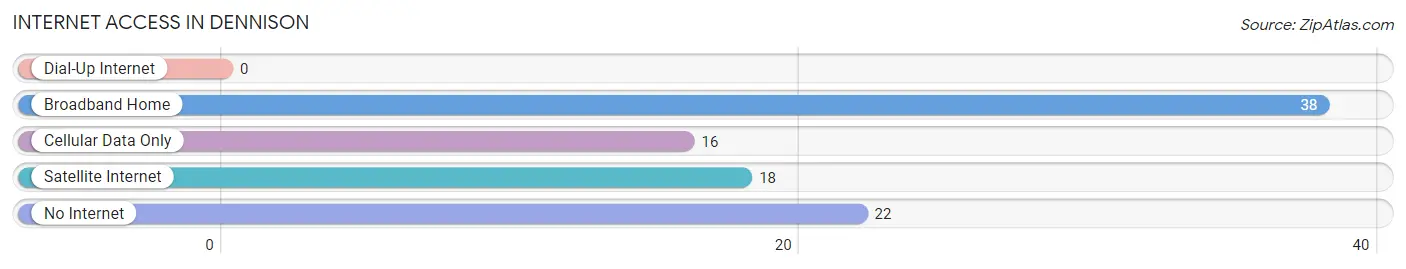
| Internet Type | # Households | % Households |
| Dial-Up Internet | 0 | 0.0% |
| Broadband Home | 38 | 40.0% |
| Cellular Data Only | 16 | 16.8% |
| Satellite Internet | 18 | 19.0% |
| No Internet | 22 | 23.2% |
| Total | 95 | 100.0% |
Dennison Summary
Dennison is a small city located in Goodhue County, Minnesota. It is situated on the banks of the Mississippi River, about 25 miles south of the Twin Cities. The city has a population of approximately 1,500 people and is part of the Red Wing Metropolitan Statistical Area.
History
Dennison was founded in 1854 by William Dennison, a settler from Ohio. He purchased the land from the government and began to build a small settlement. The town was originally called Dennison’s Landing, but the name was changed to Dennison in 1856.
The city was incorporated in 1872 and quickly grew to become a thriving community. The railroad arrived in 1873, bringing with it new businesses and industry. The city was also home to a number of mills, including a flour mill, a sawmill, and a woolen mill.
In the late 19th century, Dennison was a popular destination for tourists. The city was known for its beautiful scenery and its many attractions, including a zoo, a casino, and a racetrack.
Geography
Dennison is located in the southeastern corner of Goodhue County, Minnesota. It is situated on the banks of the Mississippi River, about 25 miles south of the Twin Cities. The city has a total area of 1.2 square miles, all of which is land.
The city is located in a hilly region, with the highest point being the summit of Dennison Hill, which is located just south of the city. The city is also home to several small lakes, including Lake Dennison and Lake Goodhue.
Economy
The economy of Dennison is largely based on agriculture and tourism. The city is home to several farms, which produce a variety of crops, including corn, soybeans, and wheat. The city is also home to several wineries, which produce a variety of wines.
The city is also home to several small businesses, including restaurants, retail stores, and service providers. The city is also home to a number of manufacturing companies, which produce a variety of products, including furniture, clothing, and electronics.
Demographics
As of the 2010 census, the population of Dennison was 1,500 people. The racial makeup of the city was 97.3% White, 0.7% African American, 0.3% Native American, 0.3% Asian, and 1.3% from other races. The median household income was $45,000, and the median family income was $50,000.
The city is home to a number of churches, including the First Presbyterian Church, the First Baptist Church, and the Church of the Nazarene. The city is also home to a number of schools, including Dennison Elementary School, Dennison Middle School, and Dennison High School.
Conclusion
Dennison is a small city located in Goodhue County, Minnesota. It is situated on the banks of the Mississippi River, about 25 miles south of the Twin Cities. The city has a population of approximately 1,500 people and is part of the Red Wing Metropolitan Statistical Area. The economy of Dennison is largely based on agriculture and tourism, and the city is home to several small businesses, churches, and schools. The racial makeup of the city is predominantly White, with a small percentage of African American, Native American, and Asian residents.
Common Questions
What is Per Capita Income in Dennison?
Per Capita income in Dennison is $28,891.
What is the Median Family Income in Dennison?
Median Family Income in Dennison is $66,875.
What is the Median Household income in Dennison?
Median Household Income in Dennison is $42,750.
What is Income or Wage Gap in Dennison?
Income or Wage Gap in Dennison is 15.6%.
Women in Dennison earn 84.4 cents for every dollar earned by a man.
What is Inequality or Gini Index in Dennison?
Inequality or Gini Index in Dennison is 0.41.
What is the Total Population of Dennison?
Total Population of Dennison is 216.
What is the Total Male Population of Dennison?
Total Male Population of Dennison is 115.
What is the Total Female Population of Dennison?
Total Female Population of Dennison is 101.
What is the Ratio of Males per 100 Females in Dennison?
There are 113.86 Males per 100 Females in Dennison.
What is the Ratio of Females per 100 Males in Dennison?
There are 87.83 Females per 100 Males in Dennison.
What is the Median Population Age in Dennison?
Median Population Age in Dennison is 37.0 Years.
What is the Average Family Size in Dennison
Average Family Size in Dennison is 3.0 People.
What is the Average Household Size in Dennison
Average Household Size in Dennison is 2.3 People.
How Large is the Labor Force in Dennison?
There are 107 People in the Labor Forcein in Dennison.
What is the Percentage of People in the Labor Force in Dennison?
62.9% of People are in the Labor Force in Dennison.
What is the Unemployment Rate in Dennison?
Unemployment Rate in Dennison is 3.9%.